
Changes in the Urban Hydrological Cycle of the Future Using Low-Impact Development Based on Shared Socioeconomic Pathway Scenarios
 , , , and
Abstract
:1. Introduction
2. Study Area and Methodology
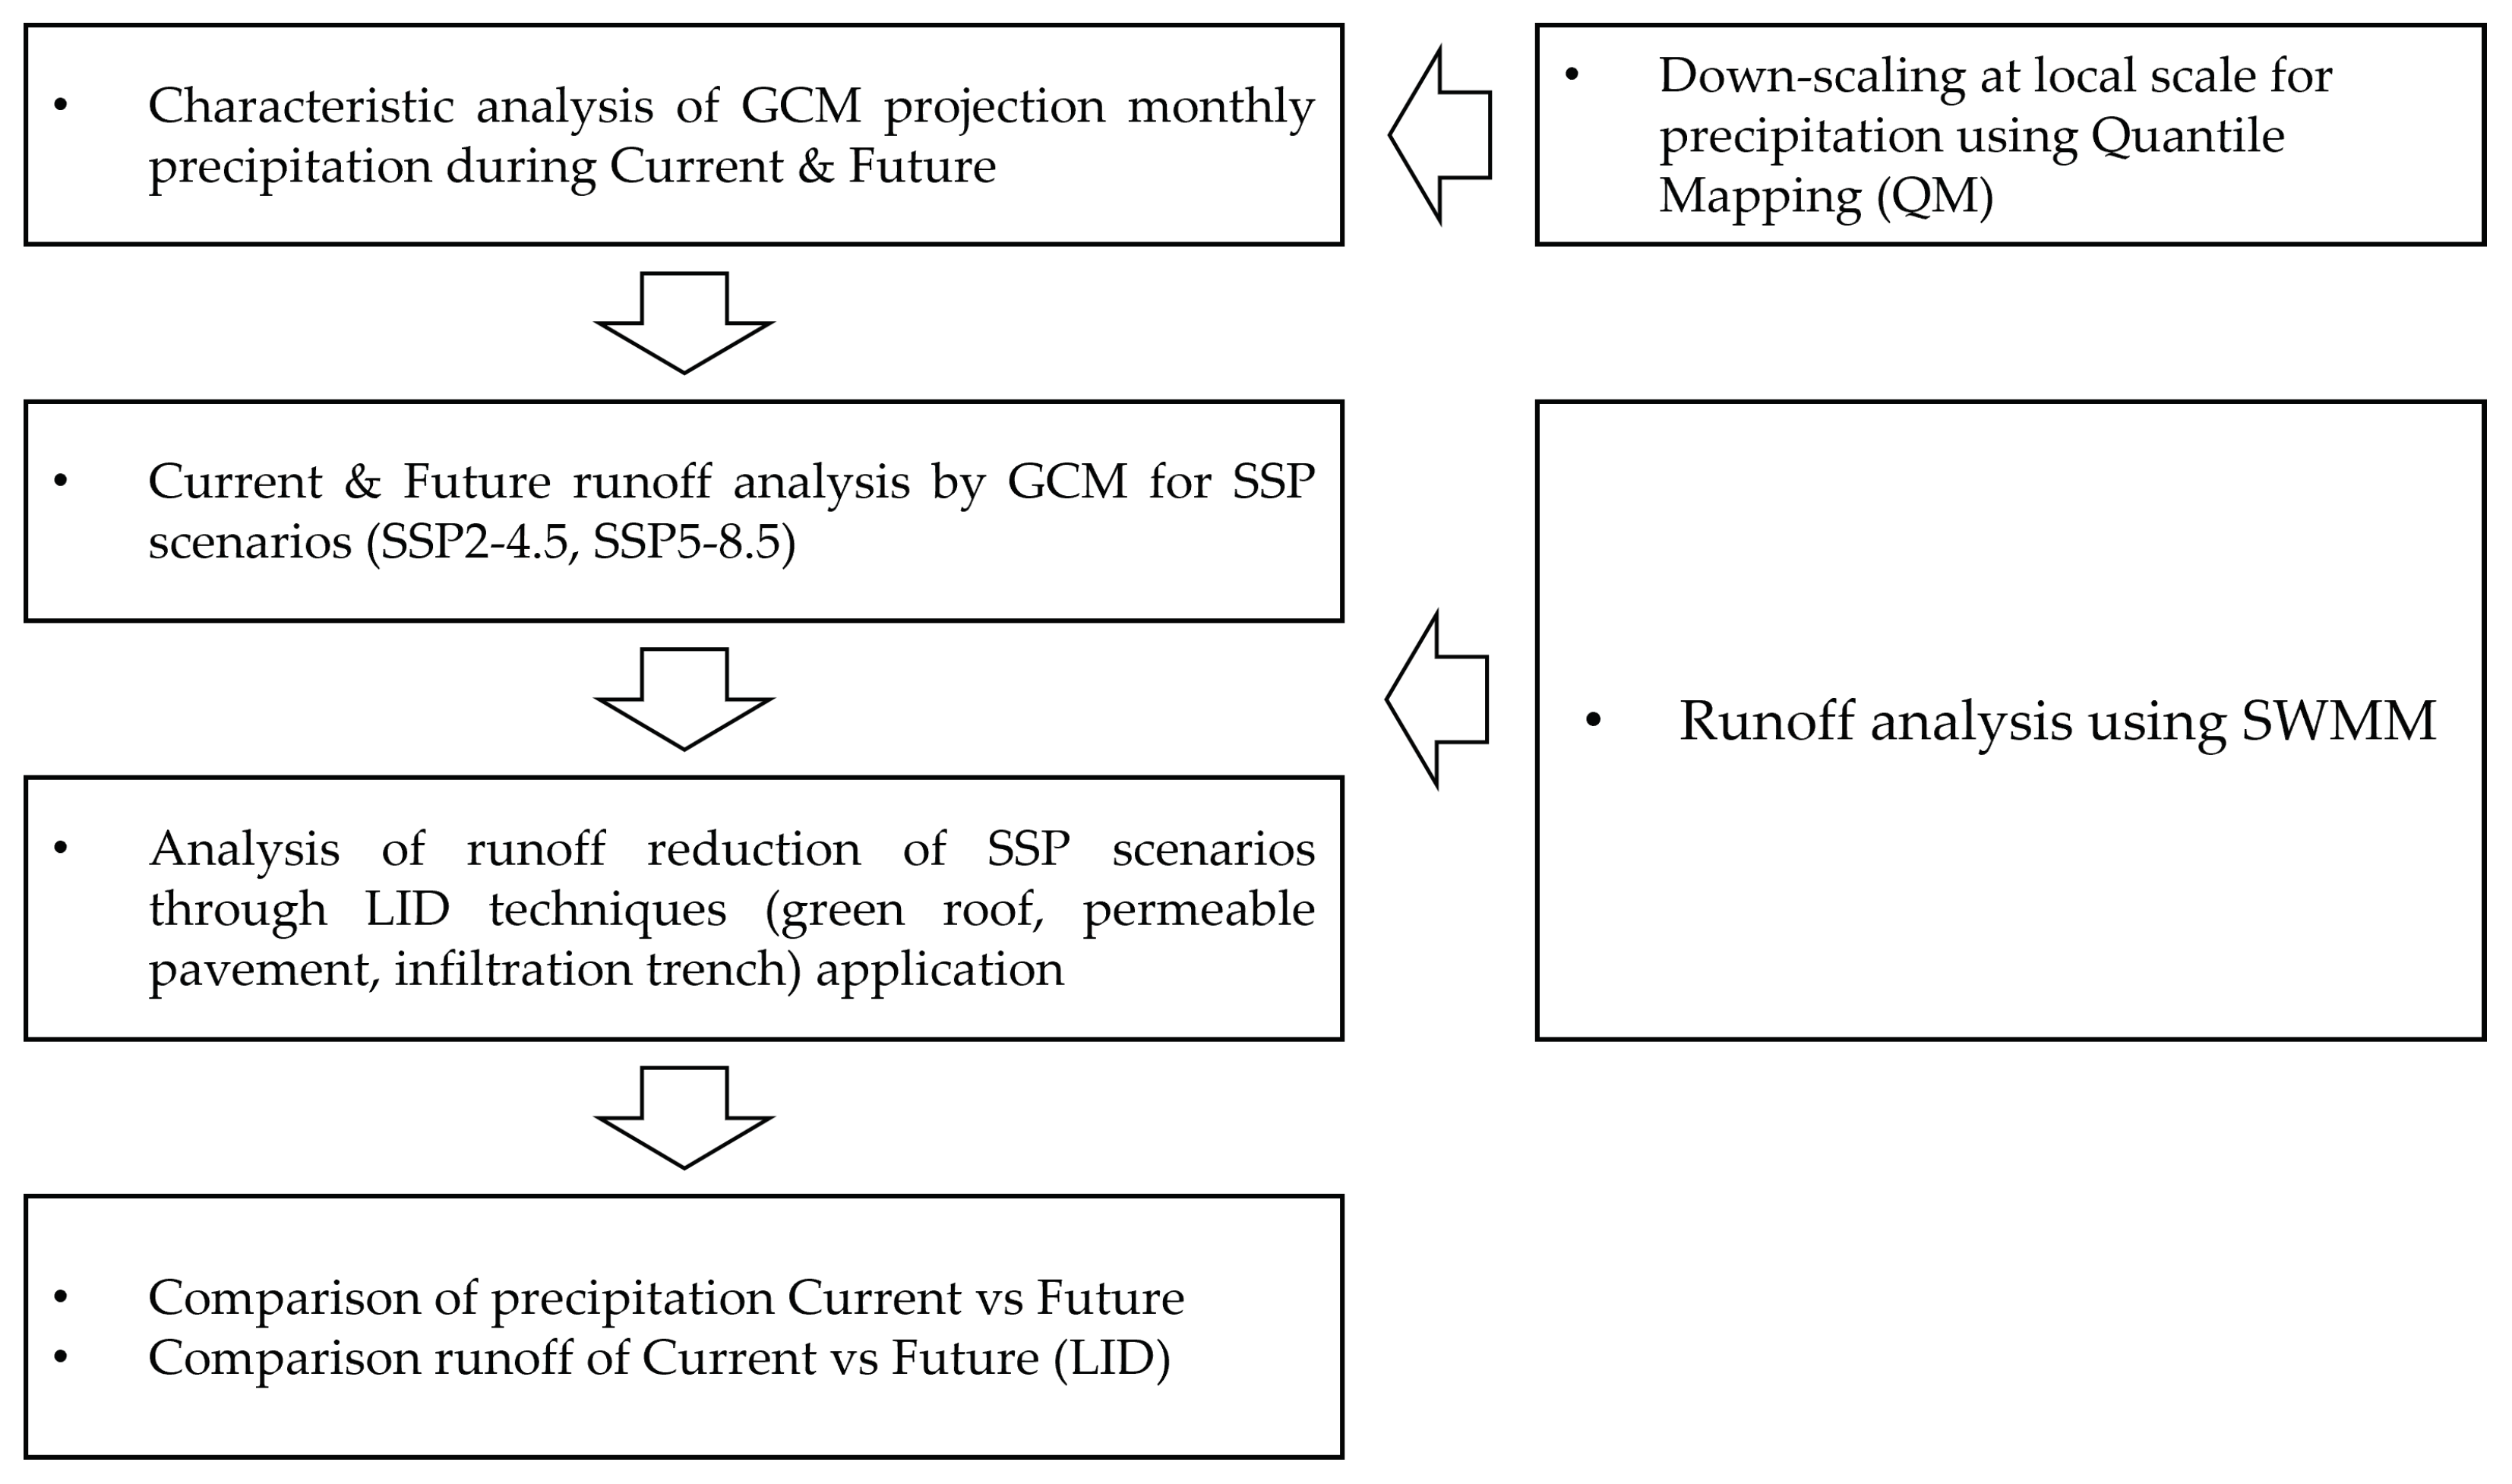
2.1. Procedure
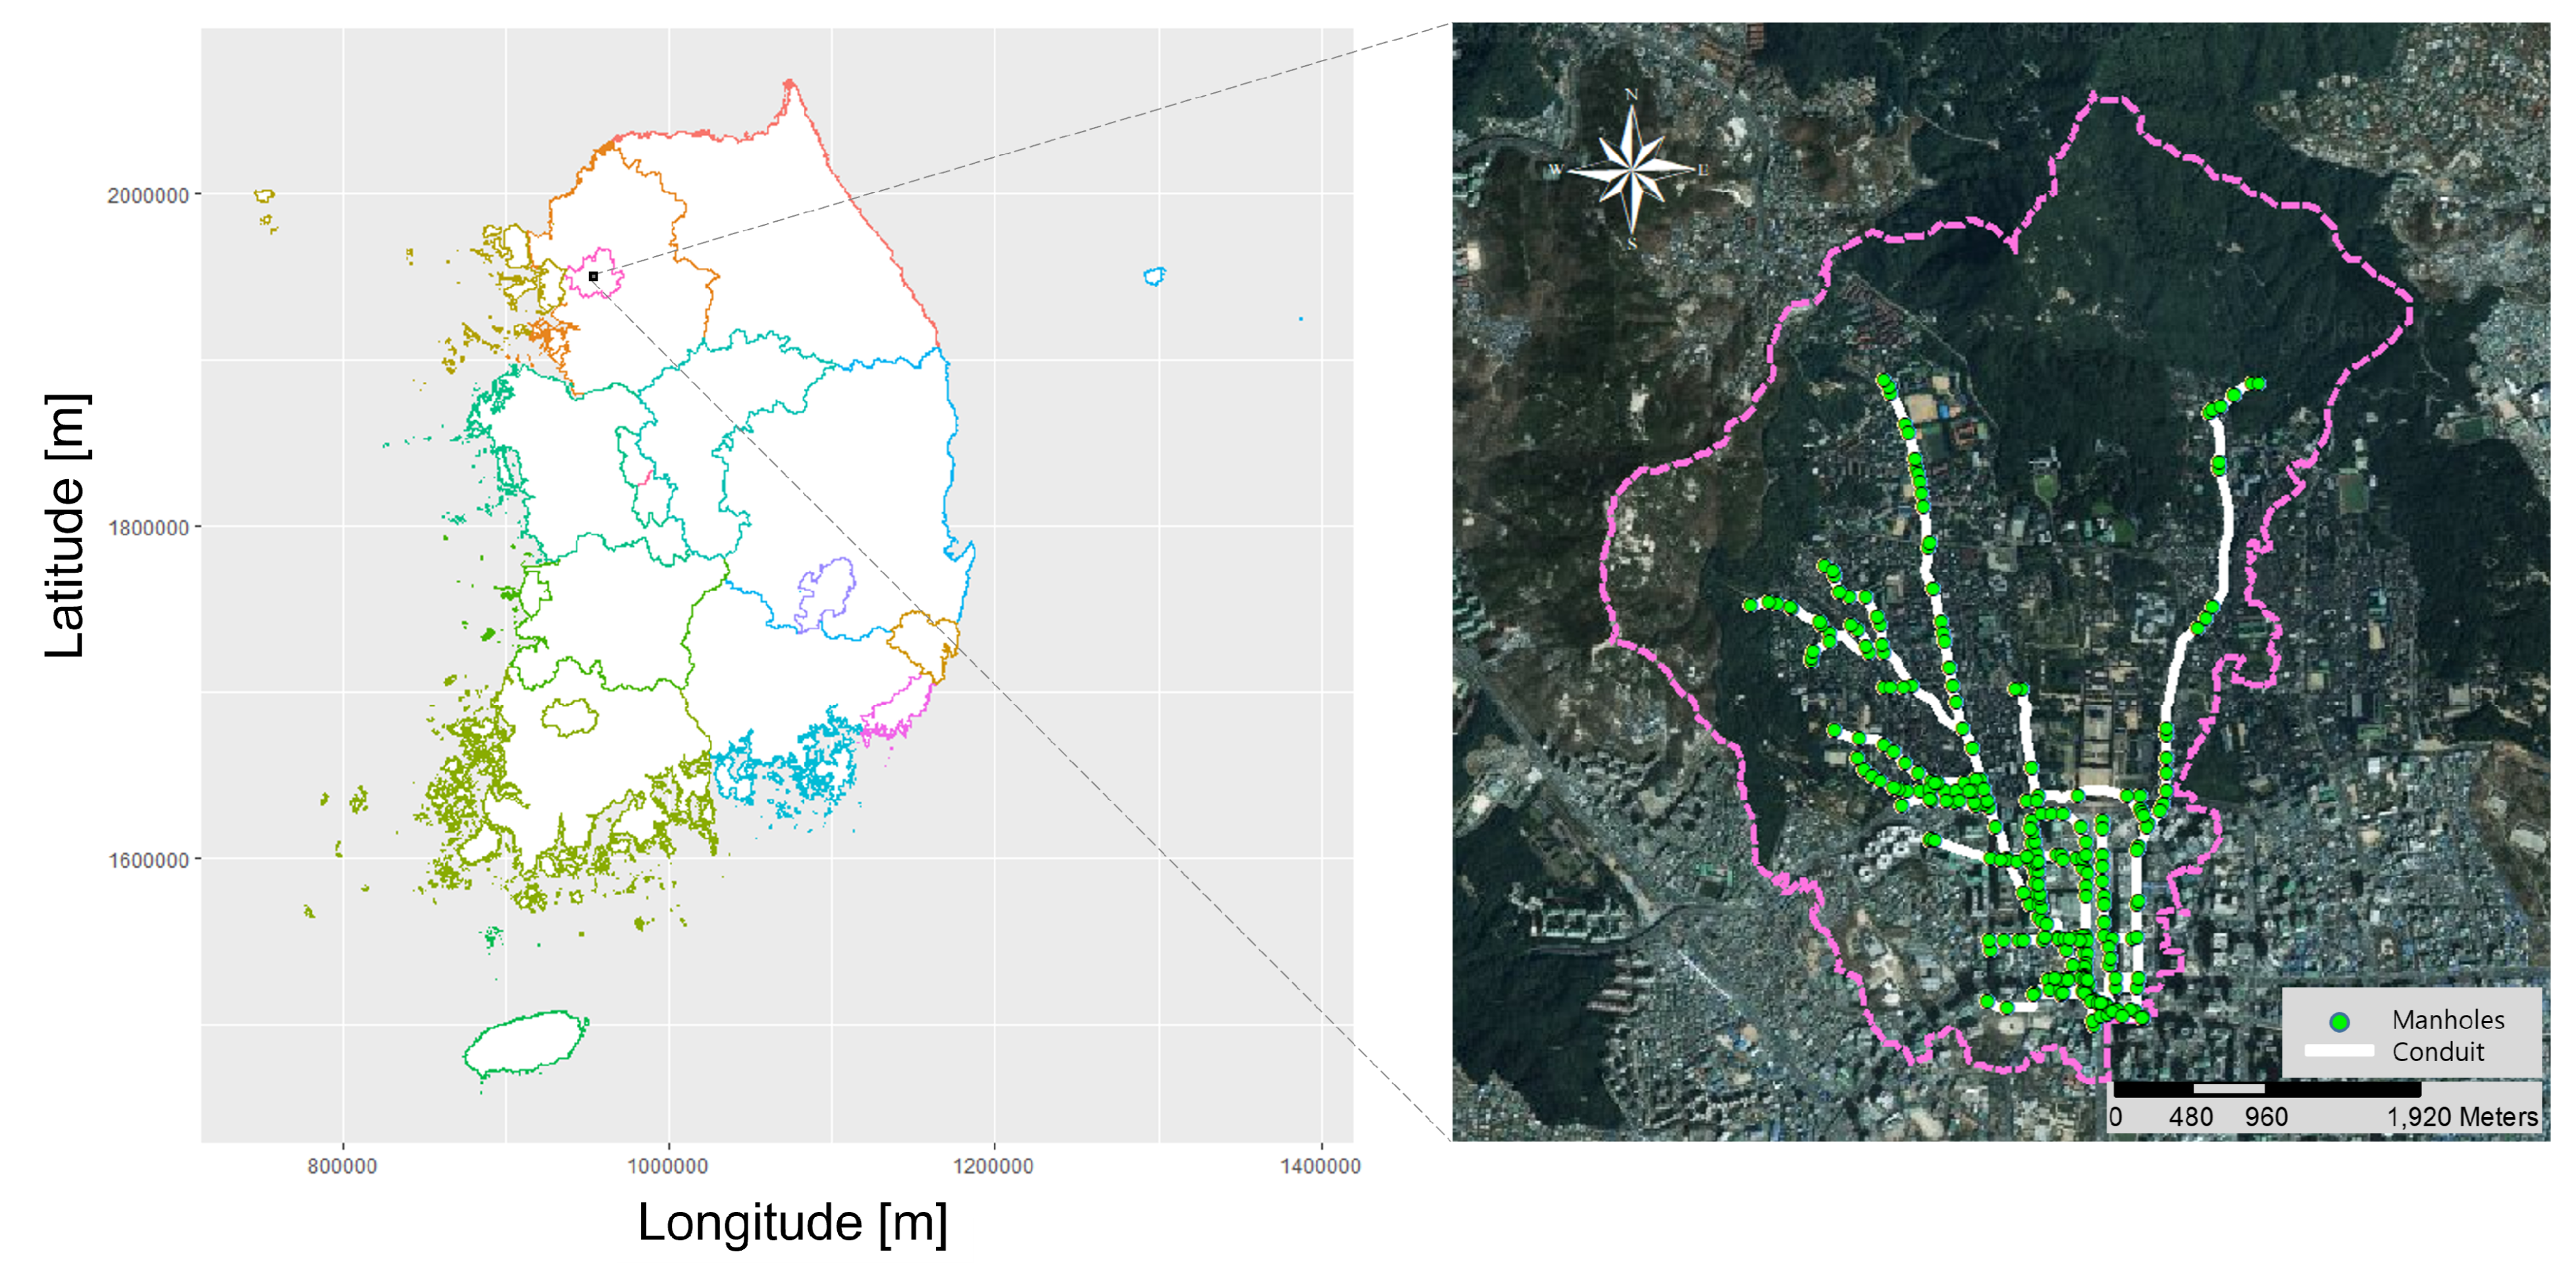
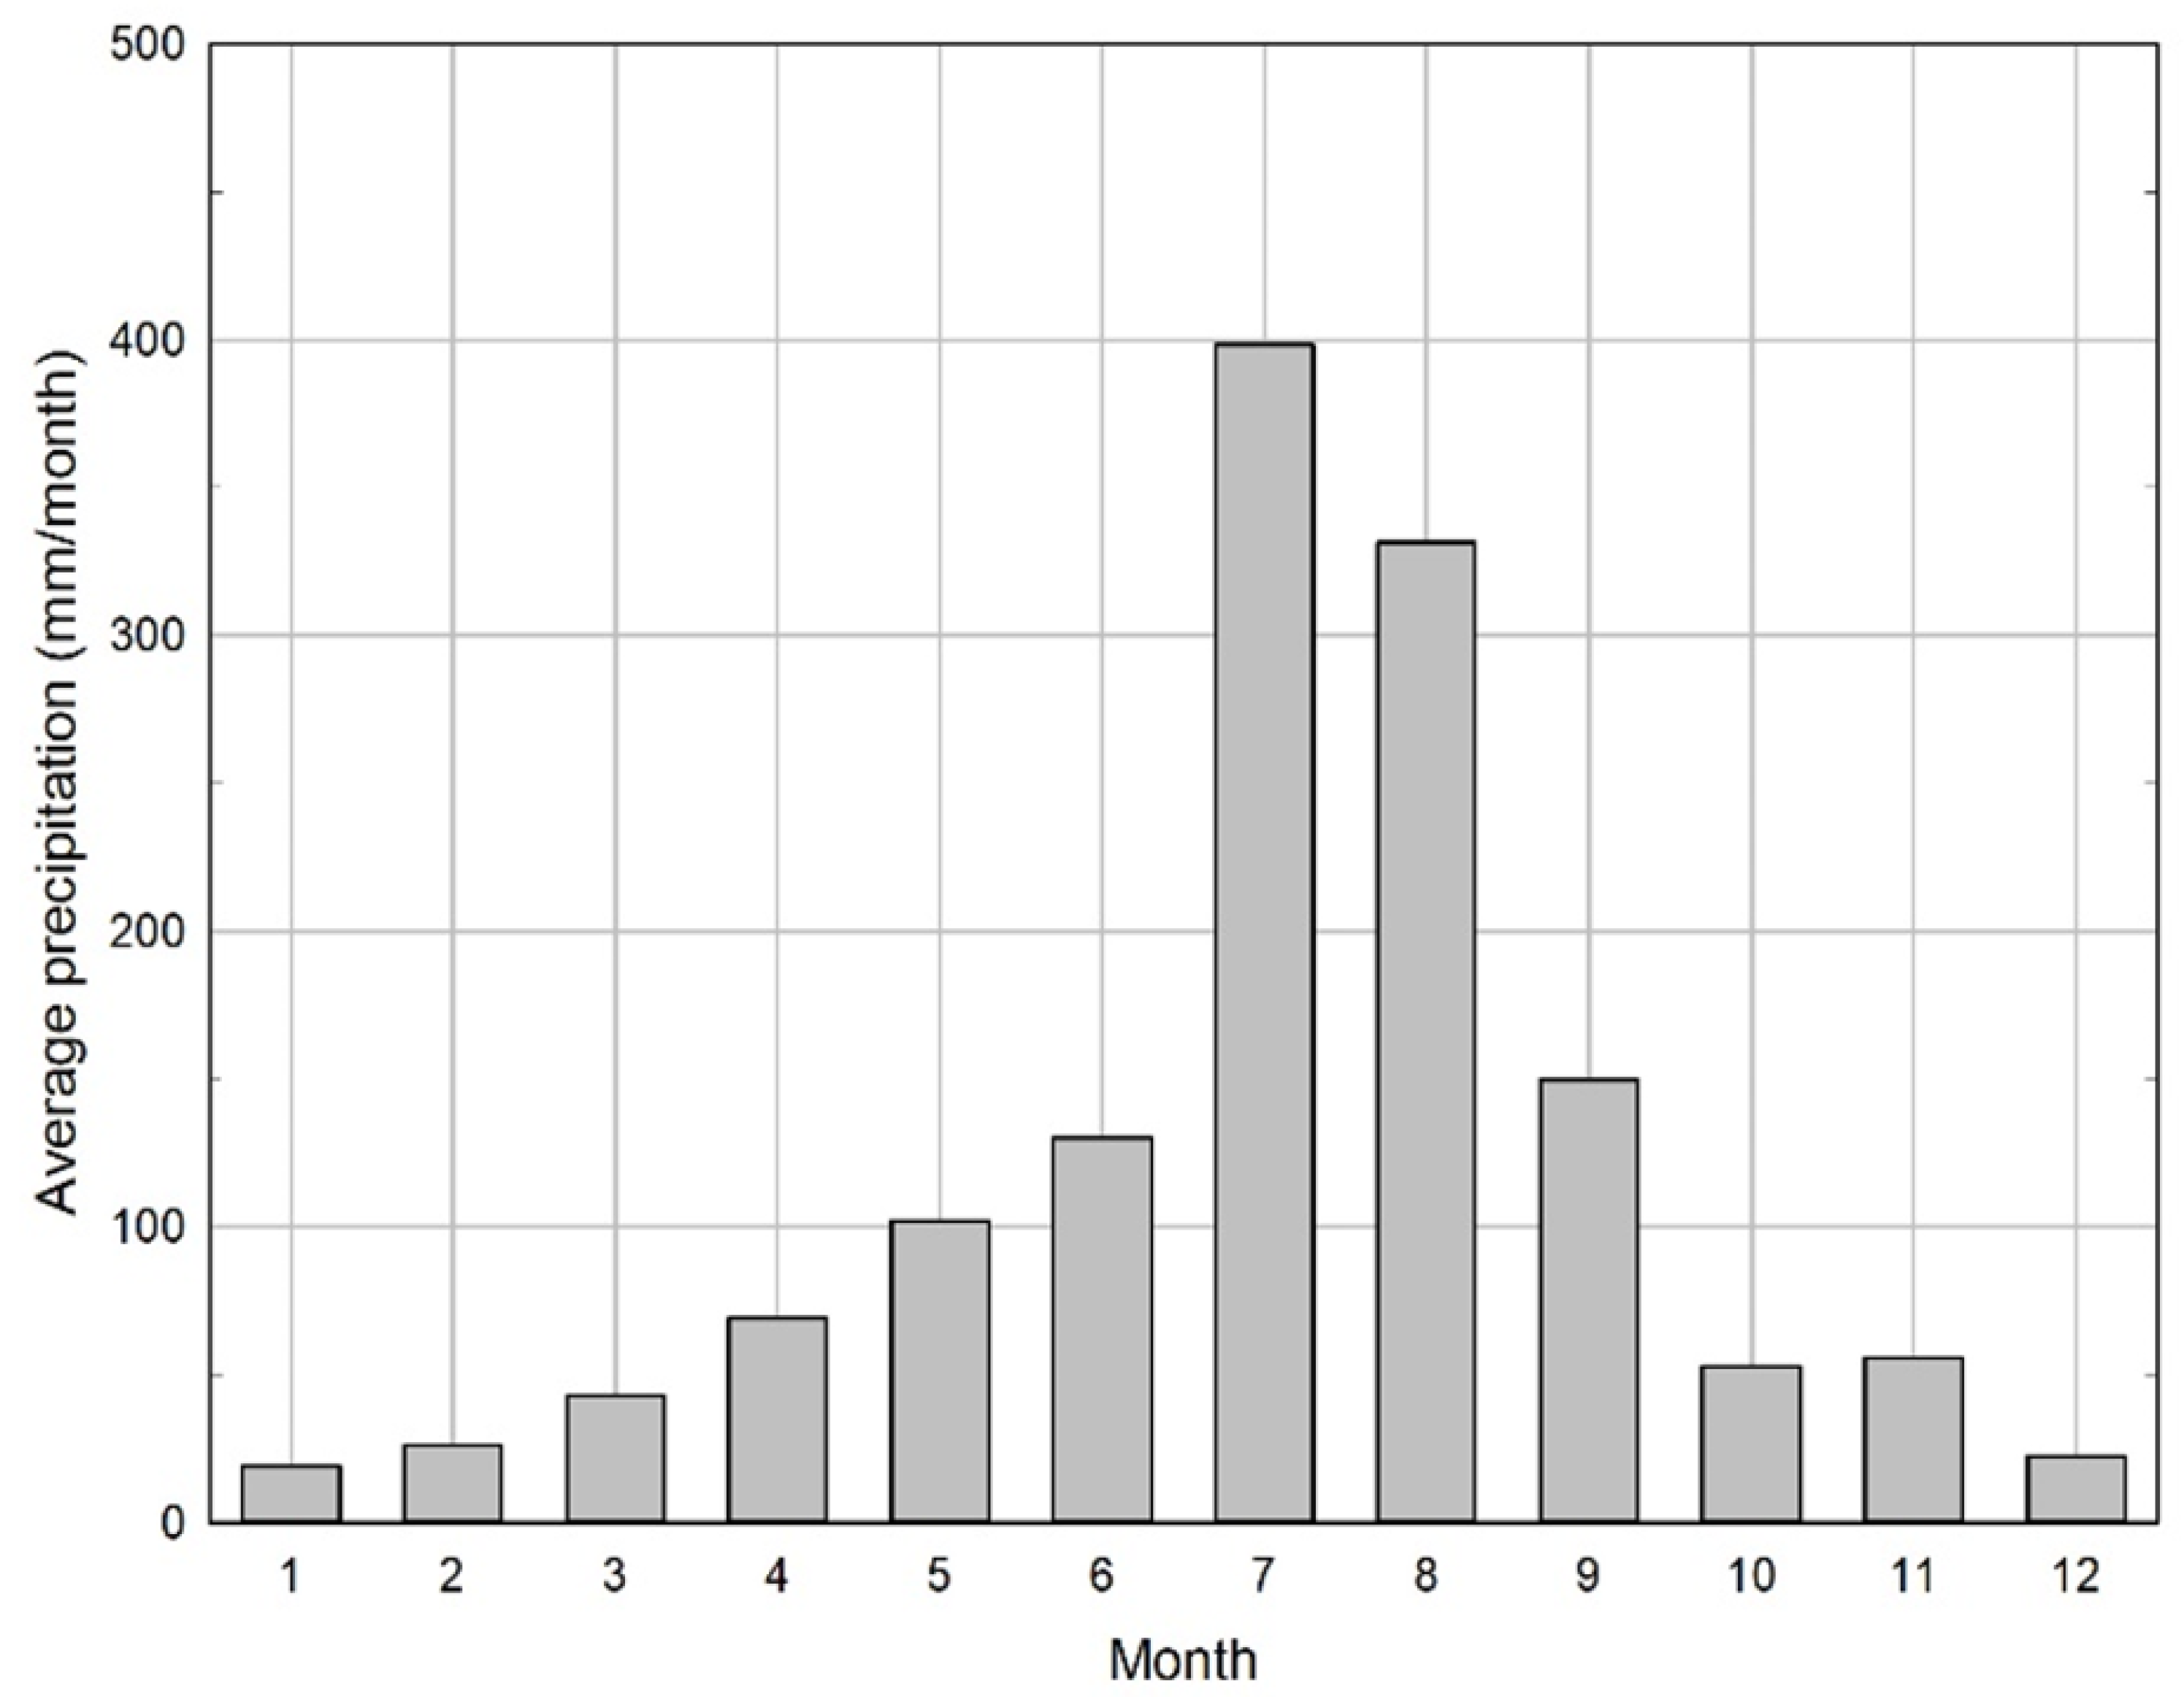
2.2. Study Area
2.3. Methodology
Bias Correction of Global Climate Models (GCM)
3. Results
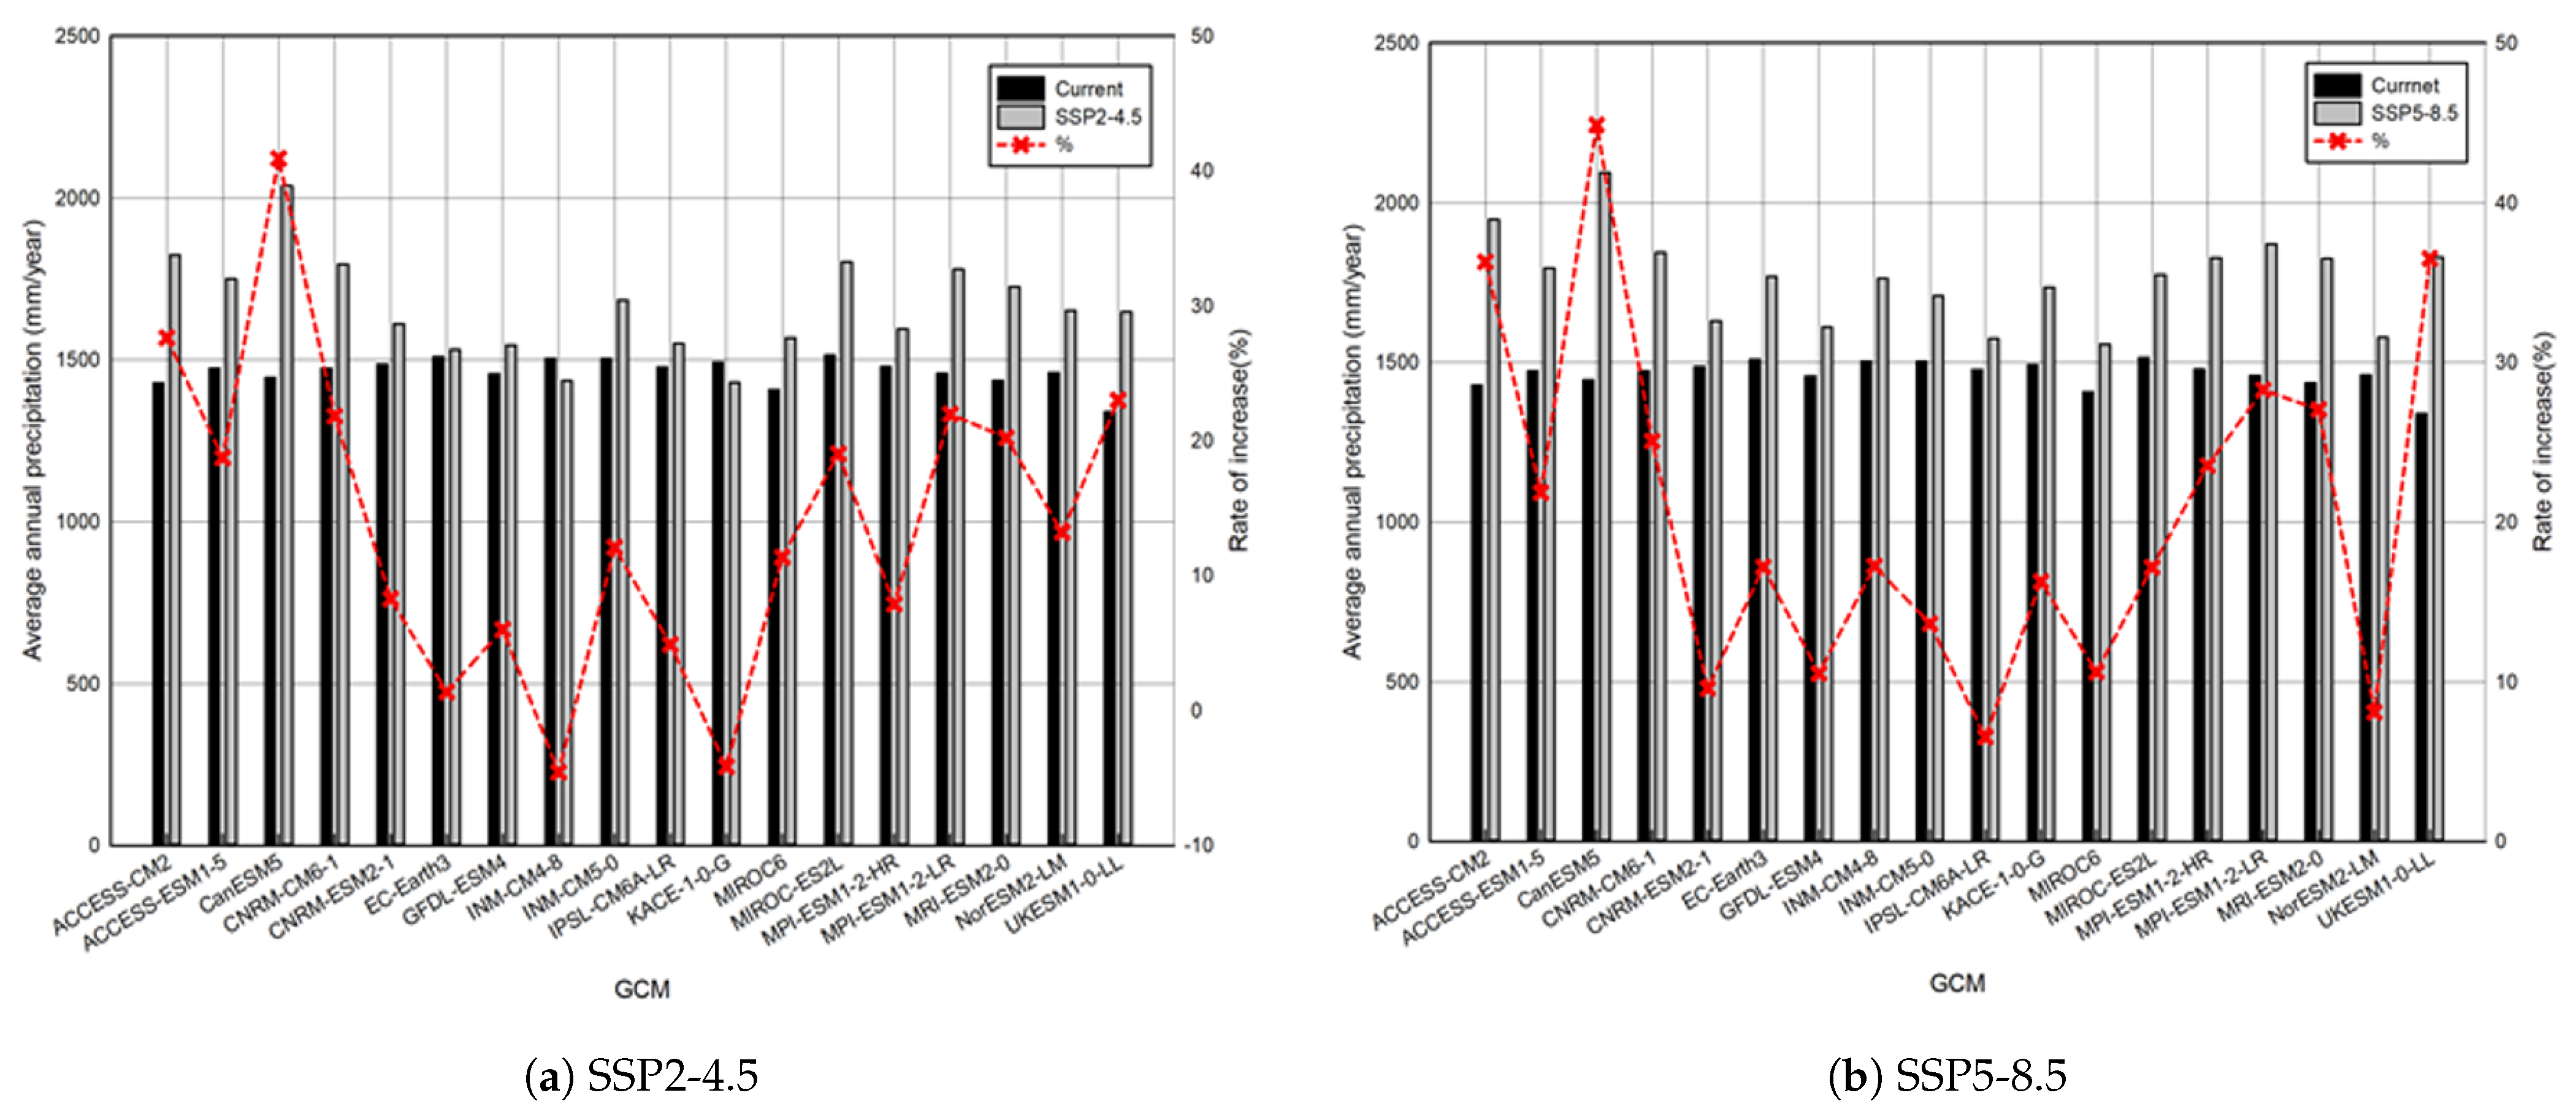
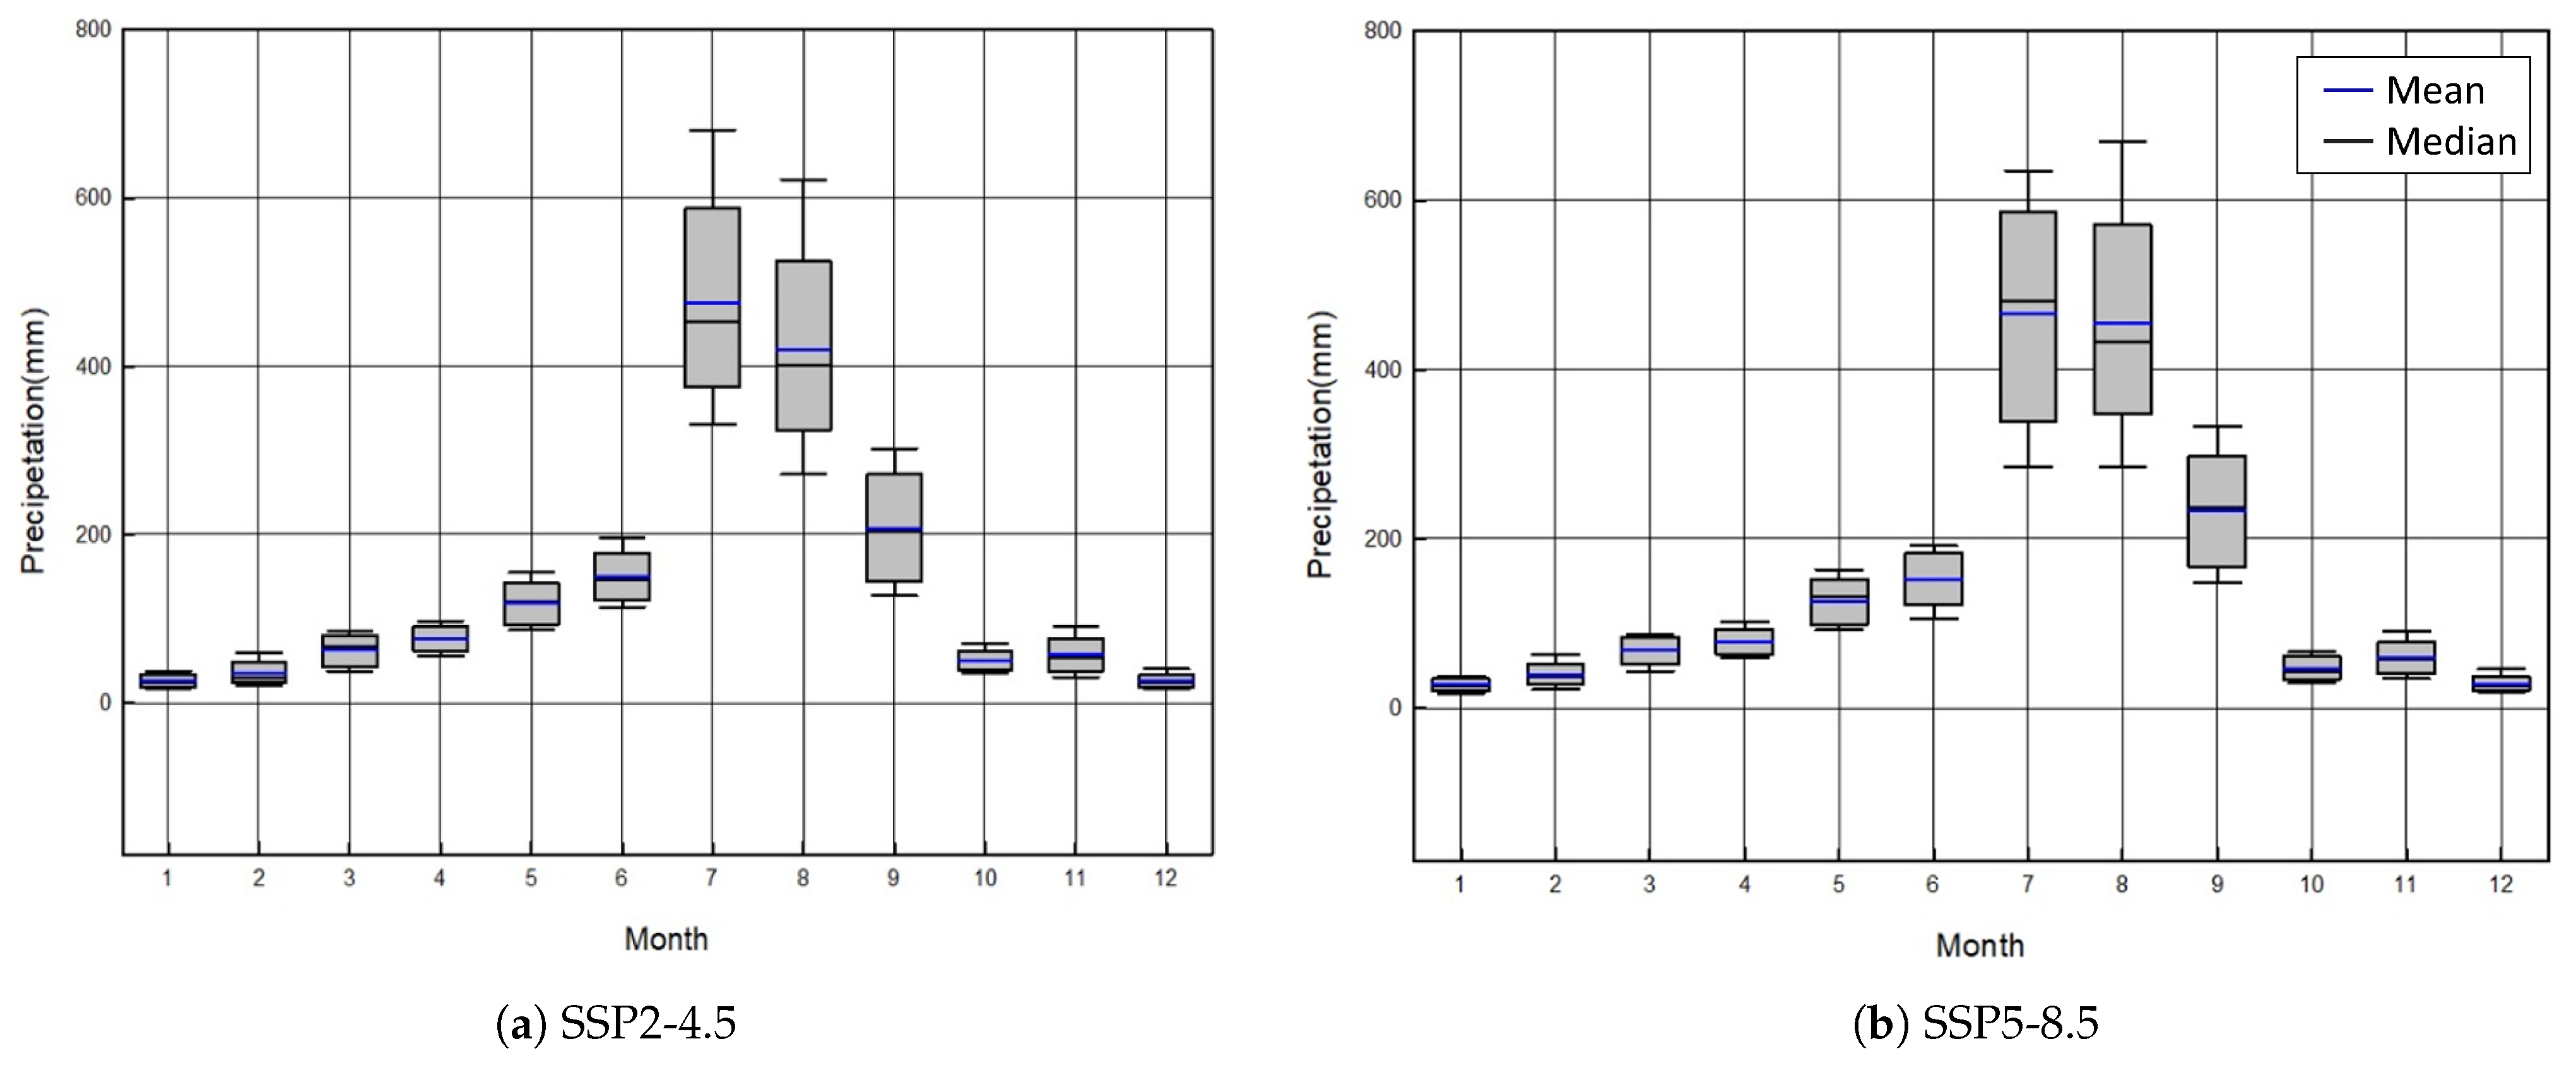
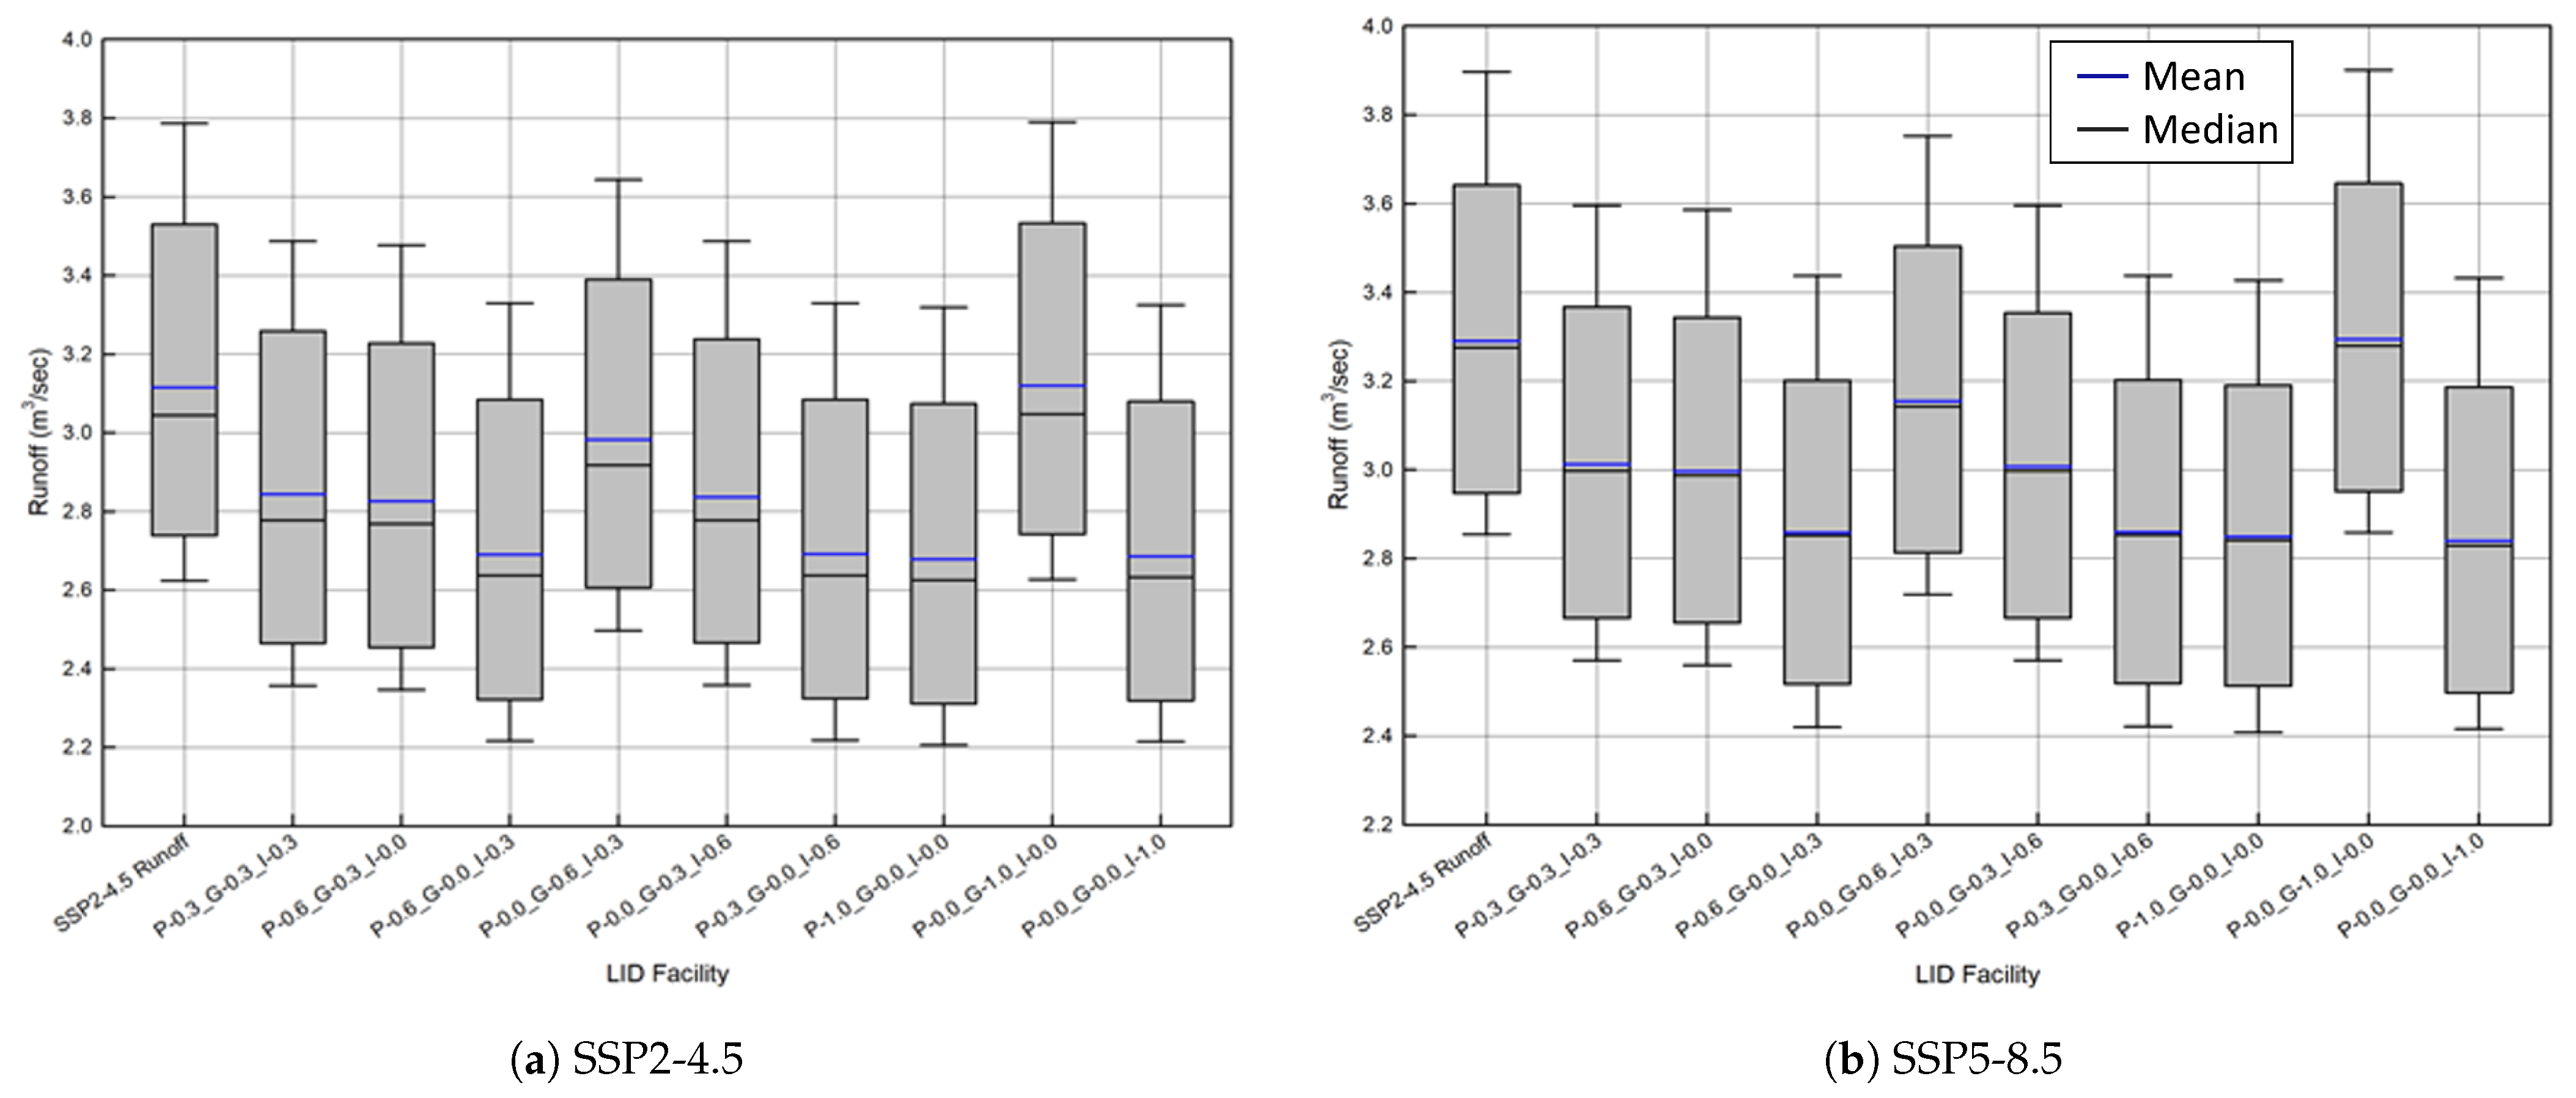
3.1. Projection of Change in Precipitation and Runoff of Future
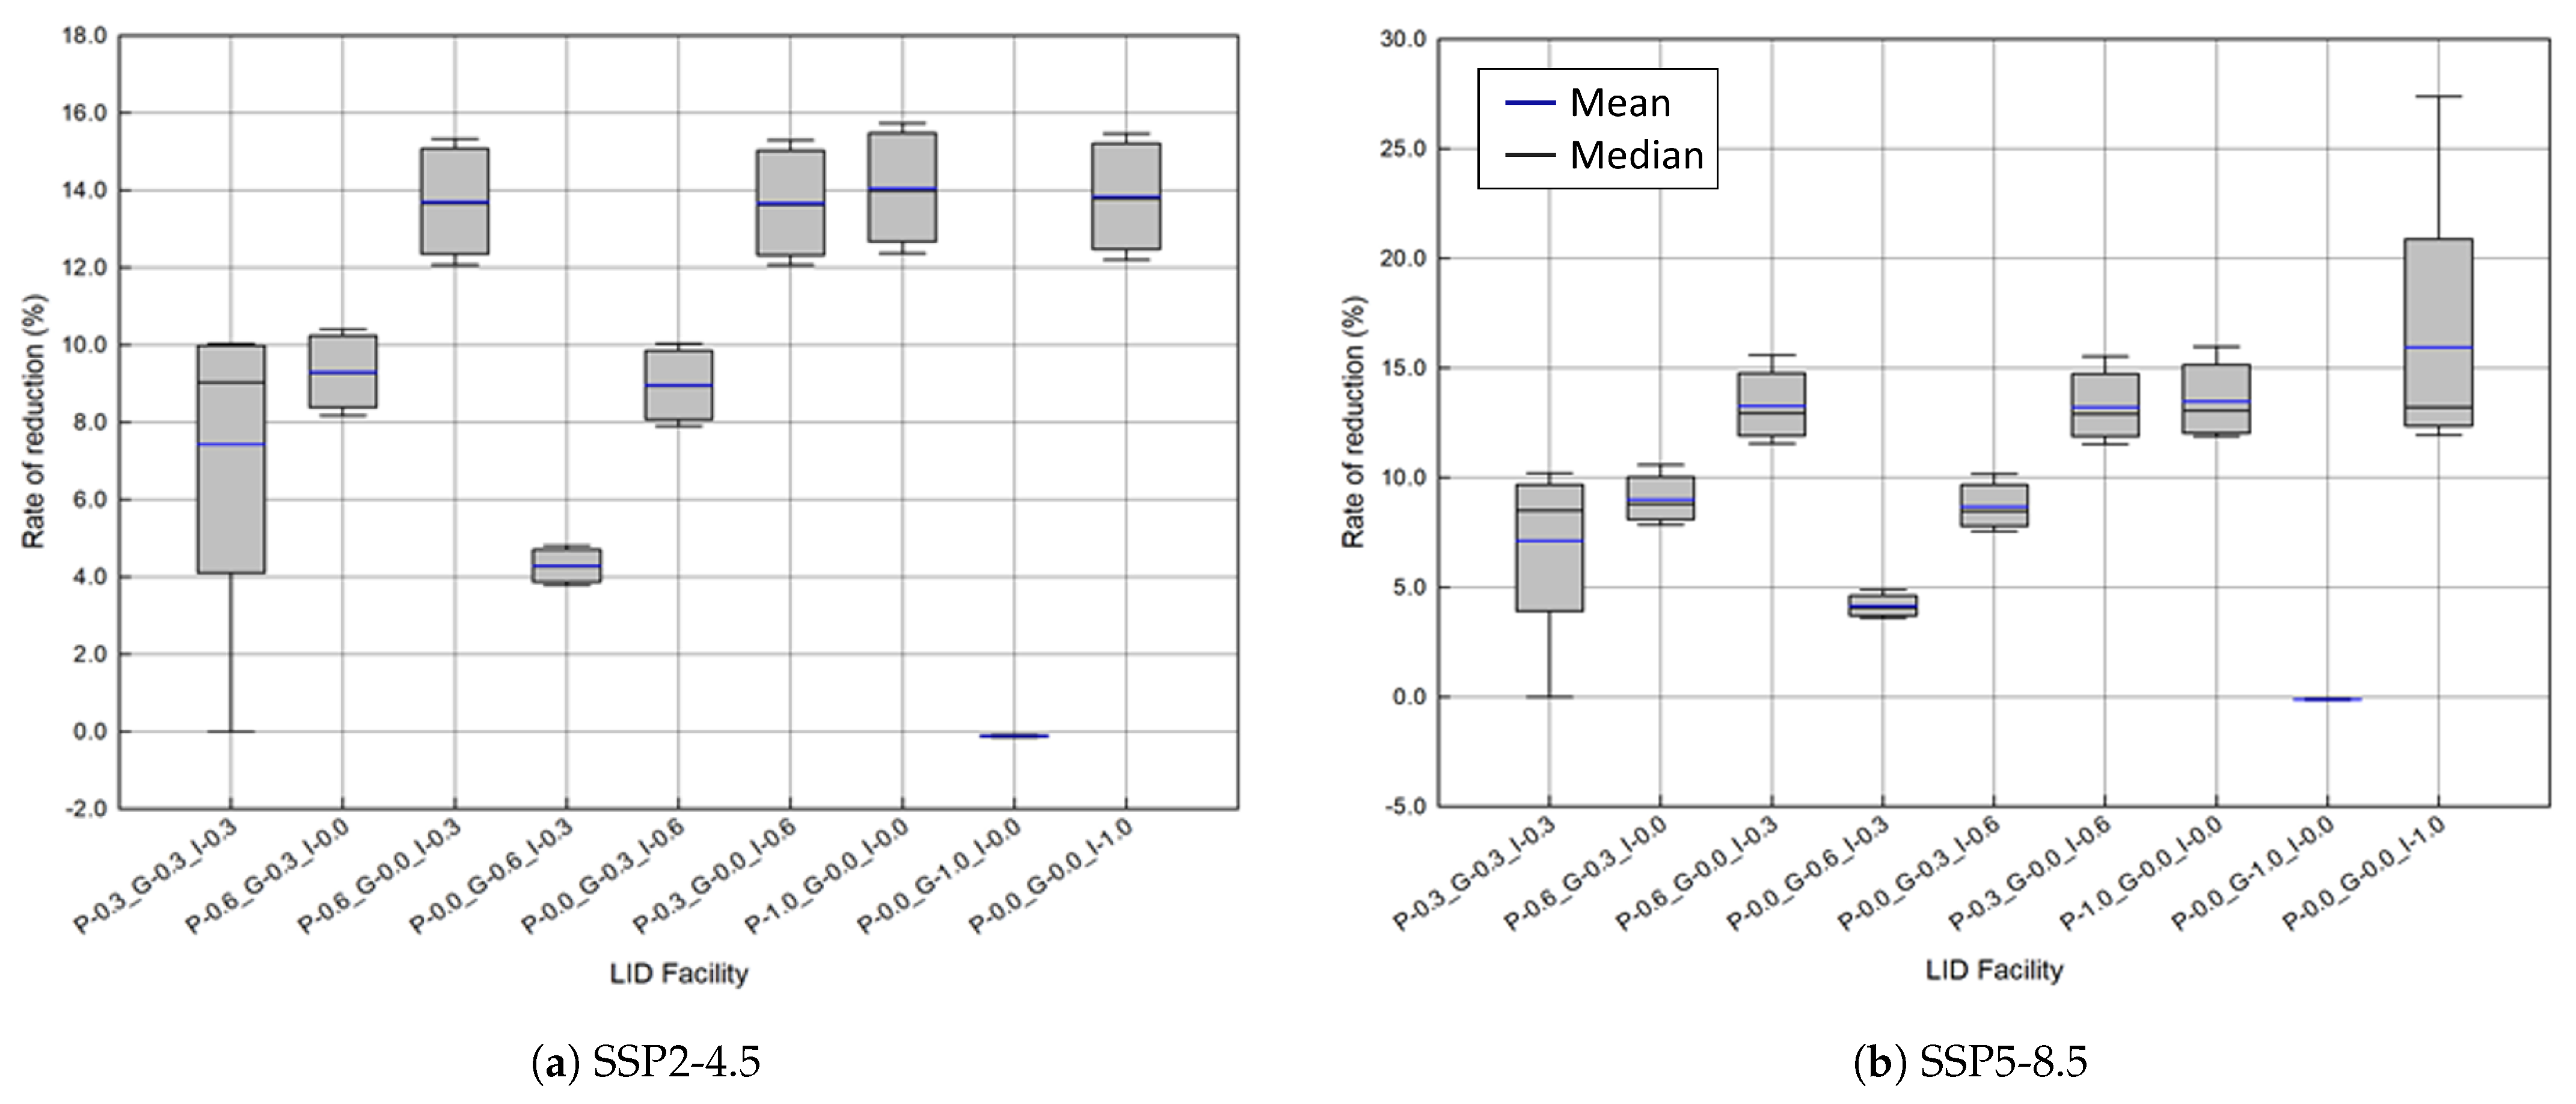
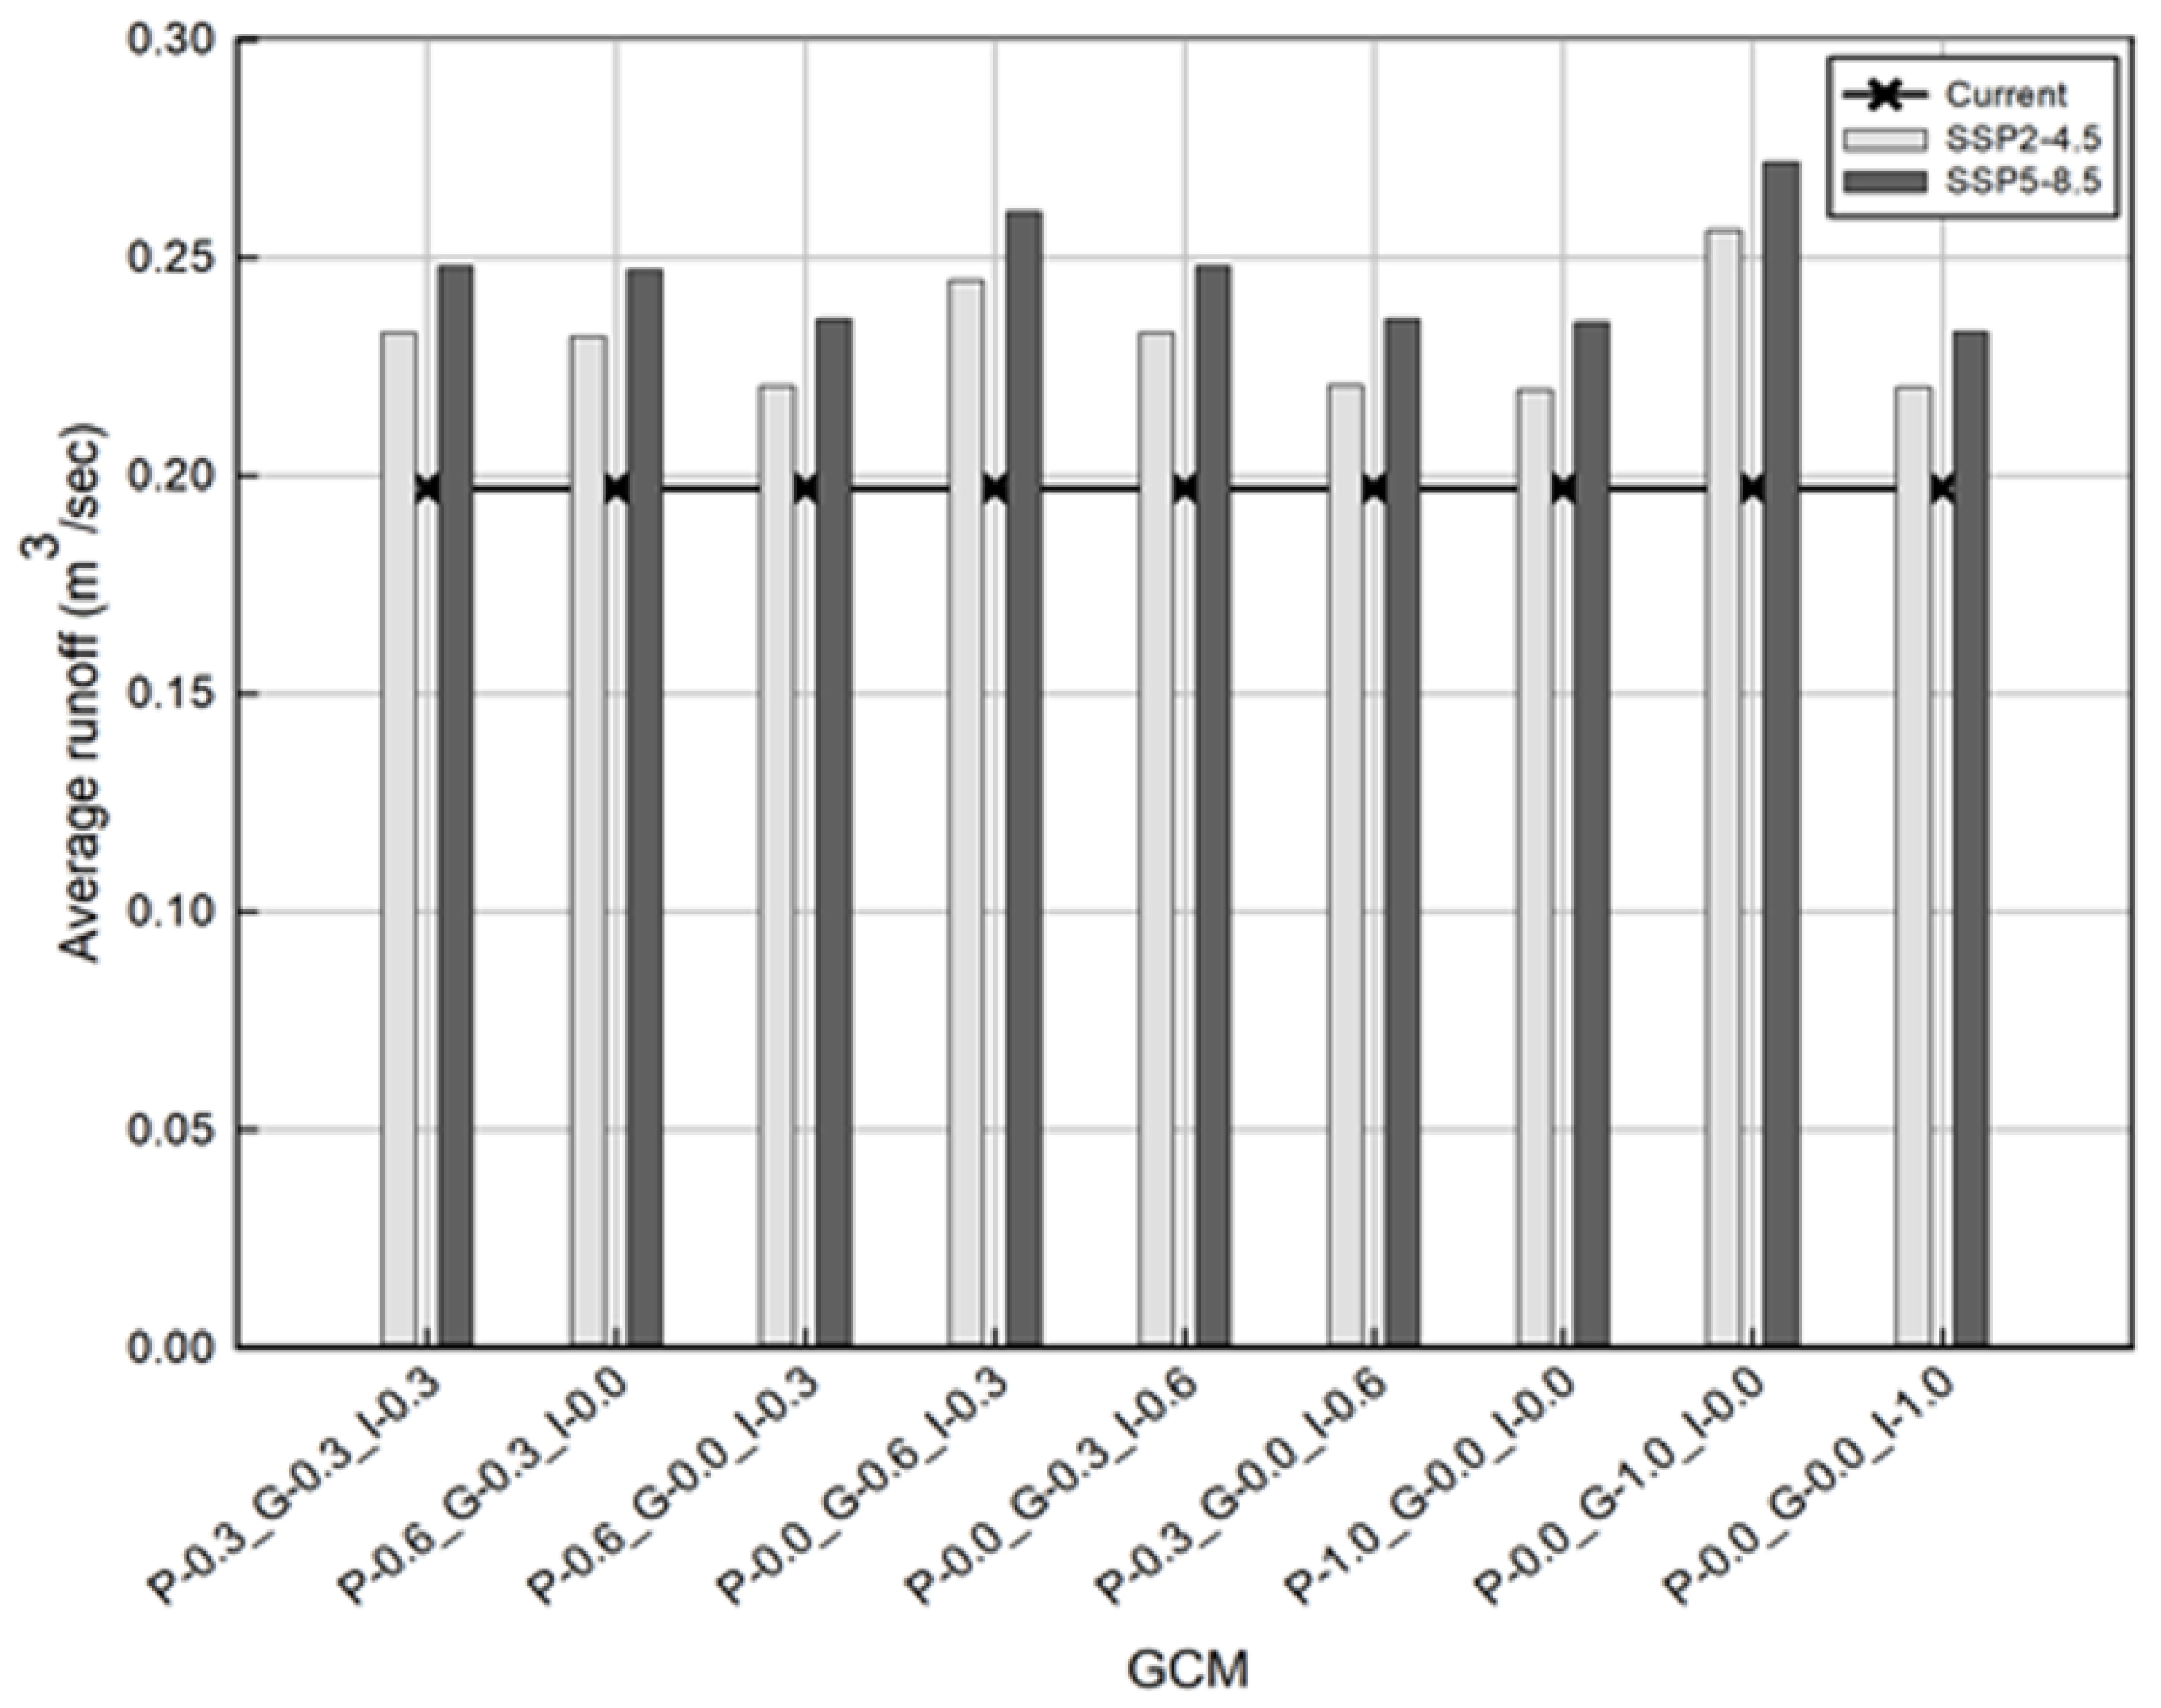
3.2. Urban Hydrological Cycle Considering LID
4. Discussion
5. Conclusions
Author Contributions
Funding
Data Availability Statement
Conflicts of Interest
References
- Wood, E.F.; Roundy, J.K.; Troy, T.J.; Van Beek, L.; Bierkens, M.F.; Blyth, E.; de Roo, A.; Döll, P.; Ek, M.; Famiglietti, J.; et al. Hyperresolution global land surface modeling: Meeting a grand challenge for monitoring Earth’s terrestrial water. Water Resour. Res. 2011, 47, W05301. [Google Scholar] [CrossRef]
- Sillmann, J.; Kharin, V.V.; Zwiers, F.W.; Zhang, X.; Bronaugh, D. Climate extremes indices in the CMIP5 multimodel ensemble: Part 2. Future climate projections. J. Geophys. Res. Atmos. 2013, 118, 2473–2493. [Google Scholar]
- Sung, J.H.; Kim, Y.O.; Jeon, J.J. Application of distribution-free nonstationary regional frequency analysis based on L-moments. Theor. Appl. Climatol. 2018, 133, 1219–1233. [Google Scholar]
- Kingston, D.G.; Todd, M.C.; Taylor, R.G.; Thompson, J.R.; Arnell, N.W. Uncertainty in the estimation of potential evapotranspiration under climate change. Geophys. Res. Lett. 2009, 36, L20403. [Google Scholar] [CrossRef]
- Wilby, R.L.; Dessai, S. Robust adaptation to climate change. Weather 2010, 65, 180–185. [Google Scholar]
- Yang, Y.; Zhuang, Q.; Tian, G.; Wei, S. A management and environmental performance evaluation of China’s family farms using an ultimate comprehensive cross-efficiency model (UCCE). Sustainability 2018, 11, 6. [Google Scholar] [CrossRef]
- Hajiaghaei-Keshteli, M.; Fathollahi Fard, A.M. Sustainable closed-loop supply chain network design with discount supposition. Neural Comput. Appl. 2019, 31, 5343–5377. [Google Scholar]
- Ghadami, N.; Gheibi, M.; Kian, Z.; Faramarz, M.G.; Naghedi, R.; Eftekhari, M.; Fathollahi-Fard, A.M.; Dulebenets, M.A.; Tian, G. Implementation of solar energy in smart cities using an integration of artificial neural network, photovoltaic system and classical Delphi methods. Sustain. Cities Soc. 2021, 74, 103149. [Google Scholar]
- Sung, J.H.; Chung, E.S.; Shahid, S. Reliability–Resiliency–Vulnerability approach for drought analysis in South Korea using 28 GCMs. Sustainability 2018, 10, 3043. [Google Scholar] [CrossRef]
- Räisänen, J.; Palmer, T. A probability and decision-model analysis of a multimodel ensemble of climate change simulations. J. Clim. 2001, 14, 3212–3226. [Google Scholar] [CrossRef]
- Rajagopalan, B.; Lall, U.; Zebiak, S.E. Categorical climate forecasts through regularization and optimal combination of multiple GCM ensembles. Mon. Weather Rev. 2002, 130, 1792–1811. [Google Scholar] [CrossRef]
- Raftery, A.E.; Gneiting, T.; Balabdaoui, F.; Polakowski, M. Using Bayesian model averaging to calibrate forecast ensembles. Mon. Weather Rev. 2005, 133, 1155–1174. [Google Scholar] [CrossRef]
- Sung, J.H.; Eum, H.I.; Park, J.; Cho, J. Assessment of climate change impacts on extreme precipitation events: Applications of CMIP5 climate projections statistically downscaled over South Korea. Adv. Meteorol. 2018, 2018, 1–12. [Google Scholar] [CrossRef]
- Sung, J.H.; Kwon, M.; Jeon, J.J.; Seo, S.B. A projection of extreme precipitation based on a selection of CMIP5 GCMs over North Korea. Sustainability 2019, 11, 1976. [Google Scholar] [CrossRef]
- Doblas-Reyes, F.J.; Hagedorn, R.; Palmer, T. The rationale behind the success of multi-model ensembles in seasonal forecasting—II. Calibration and combination. Tellus A Dyn. Meteorol. Oceanogr. 2005, 57, 234–252. [Google Scholar]
- Giorgi, F.; Mearns, L.O. Calculation of average, uncertainty range, and reliability of regional climate changes from AOGCM simulations via the “reliability ensemble averaging”(REA) method. J. Clim. 2002, 15, 1141–1158. [Google Scholar] [CrossRef]
- O’Neill, B.C.; Tebaldi, C.; Van Vuuren, D.P.; Eyring, V.; Friedlingstein, P.; Hurtt, G.; Knutti, R.; Kriegler, E.; Lamarque, J.F.; Lowe, J.; et al. The scenario model intercomparison project (ScenarioMIP) for CMIP6. Geosci. Model Dev. 2016, 9, 3461–3482. [Google Scholar] [CrossRef]
- Xin, X.; Wu, T.; Zhang, J.; Yao, J.; Fang, Y. Comparison of CMIP6 and CMIP5 simulations of precipitation in China and the East Asian summer monsoon. Int. J. Climatol. 2020, 40, 6423–6440. [Google Scholar] [CrossRef]
- Song, Y.H.; Nashwan, M.S.; Chung, E.S.; Shahid, S. Advances in CMIP6 INM-CM5 over CMIP5 INM-CM4 for precipitation simulation in South Korea. Atmos. Res. 2021, 247, 105261. [Google Scholar] [CrossRef]
- Bao, Z.; Yang, H.; Li, W.; Xu, Y.; Huang, G. A Low-Impact Development–Based Multi-Objective Optimization Model for Regional Water Resource Management under Impacts of Climate Change. Front. Earth Sci. 2020, 8, 527388. [Google Scholar] [CrossRef]
- Zahmatkesh, Z.; Burian, S.J.; Karamouz, M.; Tavakol-Davani, H.; Goharian, E. Low-impact development practices to mitigate climate change effects on urban stormwater runoff: Case study of New York City. J. Irrig. Drain. Eng. 2015, 141, 04014043. [Google Scholar] [CrossRef]
- Pour, S.H.; Abd Wahab, A.K.; Shahid, S.; Asaduzzaman, M.; Dewan, A. Low impact development techniques to mitigate the impacts of climate-change-induced urban floods: Current trends, issues and challenges. Sustain. Cities Soc. 2020, 62, 102373. [Google Scholar] [CrossRef]
- Barbu, I.A.; Ballestero, T.P.; Roseen, R.M. LID-SWM practices as a means of resilience to climate change and its effects on groundwater recharge. In Proceedings of the World Environmental and Water Resources Congress 2009: Great Rivers, Kansas City, MS, USA, 17–21 May 2009; pp. 1–10. [Google Scholar]
- Rossman, L.A. Storm Water Management Model user’s Manual, Version 5.0; National Risk Management Research Laboratory, Office of Research and Development, U.S. Environmental Protection Agency: Washington, DC, USA, 2010.
- Battiata, J.; Collins, K.; Hirschman, D.; Hoffmann, G. The runoff reduction method. J. Contemp. Water Res. Educ. 2010, 146, 11–21. [Google Scholar] [CrossRef]
- Chen, B.; Liu, J.; She, N.; Xu, K. Optimization of Low-Impact Development Facilities in the Beijing CITIC Complex. In Proceedings of the International Low Impact Development Conference 2015: LID: It Works in All Climates and Soils, Houston, TX, USA, 19–21 January 2015; pp. 342–351. [Google Scholar]
- O’Neill, B.C.; Kriegler, E.; Ebi, K.L.; Kemp-Benedict, E.; Riahi, K.; Rothman, D.S.; Van Ruijven, B.J.; Van Vuuren, D.P.; Birkmann, J.; Kok, K.; et al. The roads ahead: Narratives for shared socioeconomic pathways describing world futures in the 21st century. Glob. Environ. Chang. 2017, 42, 169–180. [Google Scholar] [CrossRef]
- Song, Y.H.; Chung, E.S.; Shiru, M.S. Uncertainty analysis of monthly precipitation in GCMs using multiple bias correction methods under different RCPs. Sustainability 2020, 12, 7508. [Google Scholar] [CrossRef]
- Homsi, R.; Shiru, M.S.; Shahid, S.; Ismail, T.; Harun, S.B.; Al-Ansari, N.; Chau, K.W.; Yaseen, Z.M. Precipitation projection using a CMIP5 GCM ensemble model: A regional investigation of Syria. Eng. Appl. Comput. Fluid Mech. 2020, 14, 90–106. [Google Scholar] [CrossRef]
- Pierce, D.W.; Cayan, D.R.; Maurer, E.P.; Abatzoglou, J.T.; Hegewisch, K.C. Improved bias correction techniques for hydrological simulations of climate change. J. Hydrometeorol. 2015, 16, 2421–2442. [Google Scholar] [CrossRef]
- Maraun, D. Bias correction, quantile mapping, and downscaling: Revisiting the inflation issue. J. Clim. 2013, 26, 2137–2143. [Google Scholar] [CrossRef]
- Iqbal, Z.; Shahid, S.; Ahmed, K.; Ismail, T.; Ziarh, G.F.; Chung, E.S.; Wang, X. Evaluation of CMIP6 GCM rainfall in mainland Southeast Asia. Atmos. Res. 2021, 254, 105525. [Google Scholar] [CrossRef]
- Supharatid, S.; Nafung, J. Projected drought conditions by CMIP6 multimodel ensemble over Southeast Asia. J. Water Clim. Chang. 2021, 12, 3330–3354. [Google Scholar] [CrossRef]
- Zarrin, A.; Dadashi-Roudbari, A. Projection of future extreme precipitation in Iran based on CMIP6 multi-model ensemble. Theor. Appl. Climatol. 2021, 144, 643–660. [Google Scholar] [CrossRef]
- Li, S.Y.; Miao, L.J.; Jiang, Z.H.; Wang, G.J.; Gnyawali, K.R.; Zhang, J.; Zhang, H.; Fang, K.; He, Y.; Li, C. Projected drought conditions in Northwest China with CMIP6 models under combined SSPs and RCPs for 2015–2099. Adv. Clim. Chang. Res. 2020, 11, 210–217. [Google Scholar] [CrossRef]
- Brient, F.; Roehrig, R.; Voldoire, A. Evaluating marine stratocumulus clouds in the CNRM-CM6-1 model using short-term hindcasts. J. Adv. Model. Earth Syst. 2019, 11, 127–148. [Google Scholar] [CrossRef]
- Rossman, L.A.; Huber, W.C. Storm Water Management Model Reference Manual. Volume III—Water Quality; U.S. EPA Office of Research and Development: Washington, DC, USA, 2016.
- Chung, E.S.; Abdulai, P.J.; Park, H.; Kim, Y.; Ahn, S.R.; Kim, S.J. Multi-criteria assessment of spatial robust water resource vulnerability using the TOPSIS method coupled with objective and subjective weights in the Han River basin. Sustainability 2016, 9, 29. [Google Scholar] [CrossRef]
- Palermo, S.A.; Turco, M.; Principato, F.; Piro, P. Hydrological effectiveness of an extensive green roof in Mediterranean climate. Water 2019, 11, 1378. [Google Scholar] [CrossRef]
- Lee, J.H.; Choi, S.; Kim, T.; Ju, Y.; Chae, E. LID (Low Impct Development) Implementation Scheme for Environmental Impact Assessment; Korea Environment Insititute: Seoul, Republic of Korea, 2014. [Google Scholar]


| Type | Assumptions |
|---|---|
| SSP1 | Sustainability—low mitigation and adaptation challenges |
| SSP2 | Middle of the road—intermediate mitigation and adaptation challenges |
| SSP3 | Fragmentation/regional rivalry—high mitigation and adaptation challenges |
| SSP4 | Inequality—low mitigation and high adaptation challenges |
| SSP5 | Conventional/fossil-fueled development—high mitigation and low adaptation challenges |
| No. | GCM | Resolution (Degrees) | Institution |
|---|---|---|---|
| 1 | ACCESS-CM2 | 1.25° × 1.875° | Commonwealth Scientific and Industrial Research Organisation |
| 2 | ACCESS-ESM1-5 | in collaboration with the Queensland Climate Change Centre of Excellence | |
| 3 | CanESM5 | 2.81° × 2.81° | Canadian Centre for Climate Modelling and Analysis |
| 4 | CNRM-CM6-1 [33] | 1.4° × 1.4° | Centre National de Recherches Meteorologiques |
| 5 | CNRM-ESM2-1 [33] | 1.4° × 1.4° | |
| 6 | EC-Earth3 | 0.35° × 0.35° | EC-Earth Consortium |
| 7 | GFDL-ESM4 [34] | 0.5° × 0.5° | Geophysical Fluid Dynamics Laboratory |
| 8 | INM-CM4-8 | 2° × 1.5° | Institute for Numerical Mathematics |
| 9 | INM-CM5-0 | ||
| 10 | IPSL-CM6A-LR | 2.5° × 1.27° | Institute Pierre-Simon Laplace |
| 11 | KACE-1-0-G | 1.875° × 1.25° | National Institute of Meteorological |
| Sciences (NIMS) and Korea | |||
| Meteorological Administration | |||
| (KMA) | |||
| 12 | MIROC6 | 1.4° × 1.4° | Japan Agency for Marine-Earth Science and Technology, Atmosphere and Ocean Research Institute and National Institute for Environmental Studies |
| 13 | MIROC-ES2L [35] | 2.81° × 2.81° | Japan Agency for Marine-Earth Science and Technology |
| 14 | MPI-ESM1-2-HR | 0.94° × 0.94° | Max Planck Institute for Meteorology (MPI-M) |
| 15 | MPI-ESM1-2-LR | 1.875° × 1.86° | |
| 16 | MRI-ESM2-0 | 1.125° × 1.125° | Meteorological Research Institute |
| 17 | NorESM2-LM | 2.5° × 1.89° | Norwegian Climate Centre |
| 18 | UKESM1-0-LL [36] | 0.5° × 0.5° | Met Office Hadley Centre |
| Index | Porous Pavement | Green Roof | Infiltration Trench | Scenario # |
|---|---|---|---|---|
| Weighted value | 1/3 | 1/3 | 1/3 | ➀ |
| 2/3 | 1/3 | 0 | ➁ | |
| 2/3 | 0 | 1/3 | ➂ | |
| 0 | 2/3 | 1/3 | ➃ | |
| 0 | 1/3 | 2/3 | ➄ | |
| 1/3 | 0 | 2/3 | ➅ | |
| 1 | 0 | 0 | ➆ | |
| 0 | 1 | 0 | ➇ | |
| 0 | 0 | 1 | ➈ |
| GCM | ➀ | ➁ | ➂ | ➃ | ➄ | ➅ | ➆ | ➇ | ➈ |
|---|---|---|---|---|---|---|---|---|---|
| ACCESS-CM2 | 8.2 | 8.5 | 12.5 | 3.9 | 8.2 | 12.5 | 12.8 | −0.2 | 12.7 |
| ACCESS-ESM1-5 | 0.0 | 8.9 | 13.0 | 4.1 | 8.5 | 13.0 | 13.4 | −0.1 | 13.1 |
| CanESM5 | 7.9 | 8.2 | 12.1 | 3.8 | 7.9 | 12.1 | 12.4 | −0.1 | 12.2 |
| CNRM-CM6-1 | 8.2 | 8.6 | 12.6 | 3.9 | 8.2 | 12.6 | 13.0 | −0.1 | 12.7 |
| CNRM-ESM2-1 | 9.1 | 9.4 | 13.9 | 4.3 | 9.1 | 13.8 | 14.3 | −0.1 | 14.0 |
| EC-Earth3 | 10.0 | 10.4 | 15.3 | 4.8 | 10.0 | 15.3 | 15.7 | −0.1 | 15.5 |
| GFDL-ESM4 | 9.7 | 10.1 | 14.8 | 4.6 | 9.7 | 14.8 | 15.2 | −0.1 | 14.9 |
| INM-CM4-8 | 10.0 | 10.4 | 15.3 | 4.8 | 10.0 | 15.2 | 15.7 | −0.1 | 15.4 |
| INM-CM5-0 | 9.0 | 9.3 | 13.7 | 4.3 | 8.9 | 13.6 | 14.0 | −0.1 | 13.8 |
| IPSL-CM6A-LR | 0.0 | 8.9 | 13.0 | 4.1 | 8.5 | 13.0 | 13.4 | −0.1 | 13.1 |
| KACE-1-0-G | 7.9 | 8.2 | 12.1 | 3.8 | 7.9 | 12.1 | 12.4 | −0.1 | 12.2 |
| MIROC6 | 8.2 | 8.6 | 12.6 | 3.9 | 8.2 | 12.6 | 13.0 | −0.1 | 12.7 |
| MIROC-ES2L | 9.1 | 9.4 | 13.9 | 4.3 | 9.1 | 13.8 | 14.3 | −0.1 | 14.0 |
| MPI-ESM1-2-HR | 10.0 | 10.4 | 15.3 | 4.8 | 10.0 | 15.3 | 15.7 | −0.1 | 15.5 |
| MPI-ESM1-2-LR | 9.7 | 10.1 | 14.8 | 4.6 | 9.7 | 14.8 | 15.2 | −0.1 | 14.9 |
| MRI-ESM2-0 | 10.0 | 10.4 | 15.3 | 4.8 | 10.0 | 15.2 | 15.7 | −0.1 | 15.4 |
| NorESM2-LM | 9.0 | 9.3 | 13.7 | 4.3 | 8.9 | 13.6 | 14.0 | −0.1 | 13.8 |
| UKESM1-0-LL | 10.0 | 10.4 | 15.3 | 4.8 | 10.0 | 15.2 | 15.7 | −0.1 | 15.4 |
| GCM | ➀ | ➁ | ➂ | ➃ | ➄ | ➅ | ➆ | ➇ | ➈ |
|---|---|---|---|---|---|---|---|---|---|
| ACCESS-CM2 | 7.6 | 7.9 | 11.6 | 3.6 | 7.6 | 11.5 | 11.9 | −0.1 | 27.4 |
| ACCESS-ESM1-5 | 0.0 | 8.6 | 12.7 | 3.9 | 8.3 | 12.6 | 13.0 | −0.1 | 12.8 |
| CanESM5 | 7.7 | 8.0 | 11.8 | 3.7 | 7.8 | 11.8 | 12.1 | −0.1 | 11.9 |
| CNRM-CM6-1 | 7.9 | 8.2 | 12.1 | 3.8 | 7.9 | 12.1 | 12.4 | −0.1 | 12.2 |
| CNRM-ESM2-1 | 9.3 | 9.7 | 14.2 | 4.4 | 9.3 | 14.2 | 14.6 | −0.1 | 14.4 |
| EC-Earth3 | 8.6 | 8.9 | 13.1 | 4.1 | 8.6 | 13.0 | 13.4 | −0.1 | 13.2 |
| GFDL-ESM4 | 9.5 | 9.8 | 14.5 | 4.5 | 9.5 | 14.4 | 14.9 | −0.1 | 14.6 |
| INM-CM4-8 | 8.4 | 8.7 | 12.8 | 4.0 | 8.4 | 12.8 | 13.1 | −0.1 | 12.9 |
| INM-CM5-0 | 8.7 | 8.9 | 13.2 | 4.1 | 8.6 | 13.1 | 12.0 | −0.1 | 13.3 |
| IPSL-CM6A-LR | 0.0 | 8.6 | 12.7 | 3.9 | 8.3 | 12.6 | 13.0 | −0.1 | 12.8 |
| KACE-1-0-G | 7.7 | 8.0 | 11.8 | 3.7 | 7.8 | 11.8 | 12.1 | −0.1 | 11.9 |
| MIROC6 | 7.9 | 8.2 | 12.1 | 3.8 | 7.9 | 12.1 | 12.4 | −0.1 | 12.2 |
| MIROC-ES2L | 9.3 | 9.7 | 14.2 | 4.4 | 9.3 | 14.2 | 14.6 | −0.1 | 14.4 |
| MPI-ESM1-2-HR | 8.6 | 8.9 | 13.1 | 4.1 | 8.6 | 13.0 | 13.4 | −0.1 | 13.2 |
| MPI-ESM1-2-LR | 9.5 | 9.8 | 14.5 | 4.5 | 9.5 | 14.4 | 14.9 | −0.1 | 14.6 |
| MRI-ESM2-0 | 8.4 | 8.7 | 12.8 | 4.0 | 8.4 | 12.8 | 13.1 | −0.1 | 12.9 |
| NorESM2-LM | 8.7 | 8.9 | 13.2 | 4.1 | 8.6 | 13.1 | 12.0 | −0.1 | 13.3 |
| UKESM1-0-LL | 10.2 | 10.6 | 15.6 | 4.9 | 10.2 | 15.5 | 16.0 | −0.1 | 15.7 |
Disclaimer/Publisher’s Note: The statements, opinions and data contained in all publications are solely those of the individual author(s) and contributor(s) and not of MDPI and/or the editor(s). MDPI and/or the editor(s) disclaim responsibility for any injury to people or property resulting from any ideas, methods, instructions or products referred to in the content. |
© 2023 by the authors. Licensee MDPI, Basel, Switzerland. This article is an open access article distributed under the terms and conditions of the Creative Commons Attribution (CC BY) license (https://creativecommons.org/licenses/by/4.0/).
Share and Cite
Yoon, E.H.; Sung, J.H.; Kim, B.-S.; Seong, K.-W.; Choi, J.-R.; Seo, Y.-H. Changes in the Urban Hydrological Cycle of the Future Using Low-Impact Development Based on Shared Socioeconomic Pathway Scenarios. Water 2023, 15, 4002. https://doi.org/10.3390/w15224002
Yoon EH, Sung JH, Kim B-S, Seong K-W, Choi J-R, Seo Y-H. Changes in the Urban Hydrological Cycle of the Future Using Low-Impact Development Based on Shared Socioeconomic Pathway Scenarios. Water. 2023; 15(22):4002. https://doi.org/10.3390/w15224002
Chicago/Turabian StyleYoon, Eui Hyeok, Jang Hyun Sung, Byung-Sik Kim, Kee-Won Seong, Jung-Ryel Choi, and Young-Ho Seo. 2023. "Changes in the Urban Hydrological Cycle of the Future Using Low-Impact Development Based on Shared Socioeconomic Pathway Scenarios" Water 15, no. 22: 4002. https://doi.org/10.3390/w15224002