
A Systems Approach to Identifying Hazards in the Management of Stream Buffers for the Protection of Drinking Water Quality
1
Center for Environmental Sustainability and Human Health, Ming Chi University of Technology, Taishan District, New Taipei City 243, Taiwan
2
Centre for Emergency Response Information, National Yunlin University of Science and Technology, Douliu 640, Taiwan
*
Author to whom correspondence should be addressed.
Water 2023, 15(21), 3848; https://doi.org/10.3390/w15213848
Submission received: 18 September 2023
/
Revised: 27 October 2023
/
Accepted: 31 October 2023
/
Published: 3 November 2023
(This article belongs to the Special Issue Adaptive Water Resources Management in an Era of Changing Climatic, Environmental and Social Conditions)
Abstract
:In drinking water catchments, exploiting ecosystem services provided by stream buffers has the potential to complement conventional engineering solutions such as water treatment and reduce the overall public health risks to consumers. These stream buffers interrupt the movement of contaminants and sediments from non-point source sources, such as agricultural land, to surface waters. Effectively managing stream buffers can be challenging due to the complexity and diversity of factors that can directly and indirectly impact efficacy. This study uses System Theoretic Process Analysis (STPA) and Early Warning Signal Analysis based on STPA (EWaSAP) methodology to systematically examine the sociotechnical structures for managing stream buffers in surface water catchments using a theoretical scenario representative of typical surface water supplies. The combination of STPA and EWaSAP provides a practical approach for developing requirements for stream buffers in drinking water catchments, focusing on hazard assessment and management measures. The evaluation considers the complex management arrangements for land uses within catchment areas. The performance and effectiveness of these actions can be tracked through the selected sensors and early warning measures. As a practical matter, this approach would help specify requirements for catchment management and drinking water source protection that can be systematically integrated into relevant management strategies.
1. Introduction
Water Service Providers (WSPs) have an absolute obligation to prioritize the safety and quality of the drinking water they provide. They must take all possible measures to safeguard public health and consistently deliver a valuable product to the communities they supply. To ensure the safety of drinking water, the WSPs must have a thorough understanding of all potential hazards that exist in the supply system, starting from the catchment area to the consumer’s tap [1]. The first step in most drinking water supplies is the catchment area, where, when appropriately managed, the ecosystem services provided can complement conventional engineering solutions such as water treatment and reduce inherent public health risks to consumers [2]. There are many features of catchment management and ecosystem services that can be used to protect drinking water quality.
This study takes a specific look at a systematic approach from the WSPs’ perspective to identifying the management requirements of stream buffers in drinking water catchments. Stream buffers are a common strategy employed that uses ecosystem services to manage and control water quality. The water quality benefits of stream buffers appear to be well understood in the water industry, and many examples exist where stream buffers have been used to improve water quality outcomes [3,4]. However, more research has yet to investigate the systematic management of ecosystem services like those provided by buffers.
Stream buffers provide a multitude of services as natural water treatment infrastructure through the protection and enhancement of natural ecosystem services [5]. Thus, as a drinking water source protection strategy, stream buffers can be a practical and cost-effective risk management solution [6]. The services provided by stream buffers include soil erosion control through slope stability and water purification by reducing sediments, nutrients, pollutants, and pathogens entering feed streams and storages [7]. As a result, stream buffers in catchments are often critical zones for targeted mitigation measures to control the movement of contaminants and sediments from non-point source sources such as agricultural land to surface waters [8].
For WSPs, common investment drivers are protecting water quality and ensuring continued availability [9]. As an investment, effective use of buffers can complement or replace constructed assets, including a wide range of complex water treatment, dam construction, and slope engineering [10]. In practice, through natural purification processes, buffers can reduce operational costs for existing water treatment infrastructure and operations. A comparison of catchment land cover in agricultural catchments and chemical costs for water treatment by [11] showed that in scenarios with stream buffers between diffuse pollution sources and streams, there is a negative correlation between the presence of stream buffers and treatment costs due to reduced sediment and contaminant loads. As for stream buffers in urban catchments, there is also a demonstrated reduction in contaminants and nutrients [12,13]. The reduction in nutrients can also lead to a reduction in water treatment costs and other water quality benefits [14].
Due to the benefits of drinking water source protection, the water industry is moving towards greater recognition of the role of catchments as water treatment assets. For example, the microbial safety of drinking water guidance in the Australian Drinking Water Guidelines [15] identifies stream buffers as one of the defining features of the source risk level for pathogens in a drinking water catchment. A robust management framework can assist a WSP in optimizing the source risk level and corresponding water treatment requirements by establishing stream buffers.
Studies have shown that the public is willing to support catchment interventions to improve and protect drinking water sources. For example, in the water industry in England and Wales, customers have shown acceptance of paying for catchment management initiatives for drinking water quality improvement [16]. However, for WSPs balancing investments between conventional water treatment infrastructure and catchment interventions like stream buffers, there has long been an inherent bias toward investing in engineered solutions like water treatment. A review of the capital expenditure (CAPEX) bias in the water and sewerage sectors in England and Wales found that for many water service providers, there is a belief that CAPEX solutions are preferred over solutions that rely on operational expenditure (OPEX) [17]. Water service providers often have concerns or perceptions that OPEX solutions for environmental and water quality outcomes are uncertain and carry a higher level of risk. A solution that provides greater management certainty may help to overcome such limitations, making stream buffers a more attractive alternative in the mix of available options.
While the potential value of stream buffers for water quality is well understood [18], when it comes to implementing stream buffers, further research is required to establish practical guidance for management assurance for natural assets [8,19]. Successfully implementing catchment interventions such as stream buffers requires a structured set of management requirements with commensurate performance monitoring to ensure management objectives are met.
This study uses a comprehensive hazard analysis method to identify management requirements for stream buffers in drinking water catchments. The conventional approach to assessing drinking water risk related to catchment areas is to first evaluate the inherent risk before control measures and the residual risk once the control measures have been put in place [6]. Such assessments are frequently completed using semiquantitative risk matrixes, which assess risk based on the consequences and likelihood of hazardous events. However, for natural assets, such an approach is complicated by the unique complex mix of stakeholders and management regimes not in place for other water supply assets. However, for risk matrices, there are significant limitations for assessing the residual risk in relation to the vulnerability and efficacy of the control measures in being able to constantly deliver the expected level of service [20].
With conventional water treatment assets, a range of hazard analysis methods can be applied to identify potential risks and guide control measures for the safety of drinking water. Typical hazard analysis methods for drinking water assets include FMEA, HAZOP, and fault trees, amongst many others [21]. By viewing assets as an assembly of components and parts with a focus on reliability, these hazard analysis methods can potentially miss the broader component interactions within a sociotechnical system [22]. The nature of these hazard analysis methods is that they can miss the broader component interactions within a sociotechnical system [23]. By contrast, systemic hazard analysis methods consider complex and non-linear functional relationships within sociotechnical systems and differ from traditional linear analysis approaches that primarily consider the linear failure of components [24]. Furthermore, when considering aspects such as government policy controls, and landholder interactions, conventional hazard analysis methods are limited by focusing on each individually and often missing the interactions of the separate groups.
Further to understanding the process risks, the hazard analysis process can be used in developing leading indicators and measures to communicate the performance of process control measures and indicate when key safety-critical processes are not operating as expected. According to Leveson [25], leading indicators can be used to detect when safety-related assumptions for a process required to prevent an accident are violated. By identifying the leading indicators, the management agencies of drinking water catchments can better understand when water quality is at risk due to stream buffer management processes failing to enforce safety requirements. This level of information allows WSP to understand the operational risks with greater clarity and, therefore, have greater certainty of outcomes.
This novel approach to hazard analysis from stream buffer management uses System Theoretic Process Analysis (STPA) to systematically examine the hazards inherent to sociotechnical structures involved in managing buffers in drinking water catchments. STPA is a unique hazard analysis method based on System Theoretic Accident Modeling Processes (STAMP), which views safety as the emergent property of the system [26,27]. This method has been used in a wide range of applications, from aerospace design to drinking water chlorination systems, due to its adaptability in assessing nonlinear sociotechnical hazards early in the design process [28,29].
In the study of drinking water source protection programs by Merrett et al. [30] STPA was used to analyze the hazards associated with catchment-level ecosystem services. However, the study only considered ecosystem services in general without inspecting the different processes individually. In this study, the sociotechnical system of interest includes technical, social, economic, and agency interaction factors that control the water quality outcomes from stream buffers. The use of conventional hazard analysis techniques in this type of system or process is limited as they tend to focus on the reliability of individual components and miss the interaction of the various components in the system. However, STPA considers “emergent properties” revealed through interaction between system components [31].
Building on the hazard analysis using STPA, this study investigates the leading indicators of safety throughout the system based on the Early Warning Signal Analysis based on the STPA (EWaSAP) methodology proposed by [29]. The EWaSAP methodology presented in [26] builds on the STPA methodology for hazard analysis to identify possible early warning signals that control actions may be failing to enforce the safety objectives of the system. These early warning signs are used as early warning, where a violation indicates the process management structure for stream buffers, which could result in the buffer failing to control water quality as intended by the WSP.
2. Materials and Methods
2.1. Management Scenario
The theoretical scenario constructed is a surface water catchment used for the public supply of drinking water. The catchment area is assumed to be comprised of a mix of land uses, from natural forest to livestock farming, all with the potential to impact water quality, which in turn can degrade the treatment efficacy for drinking water supplies.
To represent common conditions faced in drinking water catchment management, the scenario considers land ownership, which is a mix of private ownership and management as well as publicly owned land managed by different government agencies. Water source management and land ownership can be an intricate relationship. In the scenario developed for this example, the WSP has limited direct management control over catchment land use. The regulation of activities within the catchment areas is the responsibility of a separate government agency. As a result, a WSP has a nominal amount of direct management authority over the total land in the catchment area or to control water quality. This management authority is distributed across private land use and government natural resource management agencies. When dealing with situations involving multiple landowners and government departments, it is crucial to carefully evaluate and address the mitigation measures needed to manage diffuse and small-point sources of contamination. These measures should be targeted to the specific pressures involved while also ensuring that all parties involved are fully engaged, cooperative, and share ownership of any water-related issues [32]. This is achieved using strategies such as direct payments and leasing of land to compensate for the loss of the land; however, for such strategies to be effective, they require correctly structured contracts, education, and efficient implementation [3].
In this study, the EWaSP methodology is used to complete the analysis of the hazards inherent in the processes involved in the design, implementation, restoration, and ongoing management of stream buffers for drinking water catchments. To consider the implications and interactions with the downstream processes, the high-level hazards relevant to the downstream water quality controls were also considered in the hazard assessment of the system. The downstream water quality processes considered include water treatment, disinfection, and distribution, as the efficiency and effectiveness of these downstream processes are highly influenced by the quality of the raw water produced by the catchment.
2.2. STPA and EWaSAP Method
The STPA methodology consists of four key steps: define the purpose of analysis, model of control structure, identify unsafe control actions, and identify loss scenarios [33]. The STPA steps with the parallel EWaSAP steps [29] are described in the following sections.
2.2.1. Step 1—Define the Purpose of the Analysis
In the definition of the purpose of the analysis, the unacceptable losses to the key stakeholders are identified, as well as the associated system-level hazards and the corresponding safety constraints. Identifying the losses requires identifying the key stakeholders involved in the system and understanding what values and objectives they have for the system. Following the identification of the losses or accidents of concern is the identification of the system-level hazards. System-level hazards are the state or set of conditions that could lead to one or more of the losses of concern, given the worst-case environmental conditions. At the system level for drinking water supplies, the key priority is placed on the hazard that could impact public health and trust in the safety of water supplies. The next stage in this step is to generate the system-level safety constraints that need to be enforced by the system. The safety constraints stipulate the conditions or states that need to be fulfilled to prevent system-level hazards and ensure stream buffers are always providing the expected water quality outcomes.
In this STPA step, the EWaSAP tasks include the following:
- Identifying agents outside the system scope who need to be informed about the potential realization of a system-level hazard.
- Establish a synergy with sensory services both within and outside of the system scope and identify when the high-level safety constraints have been violated. These sensory inputs can include human observation, remote monitoring, sampling, etc.
- Identify the signs that indicate when the high-level safety constraints have been violated. This step also captures the process of working with surrounding systems to transmit early warning signals to appropriate recipients.
2.2.2. Step 2—Model of the Control Structure
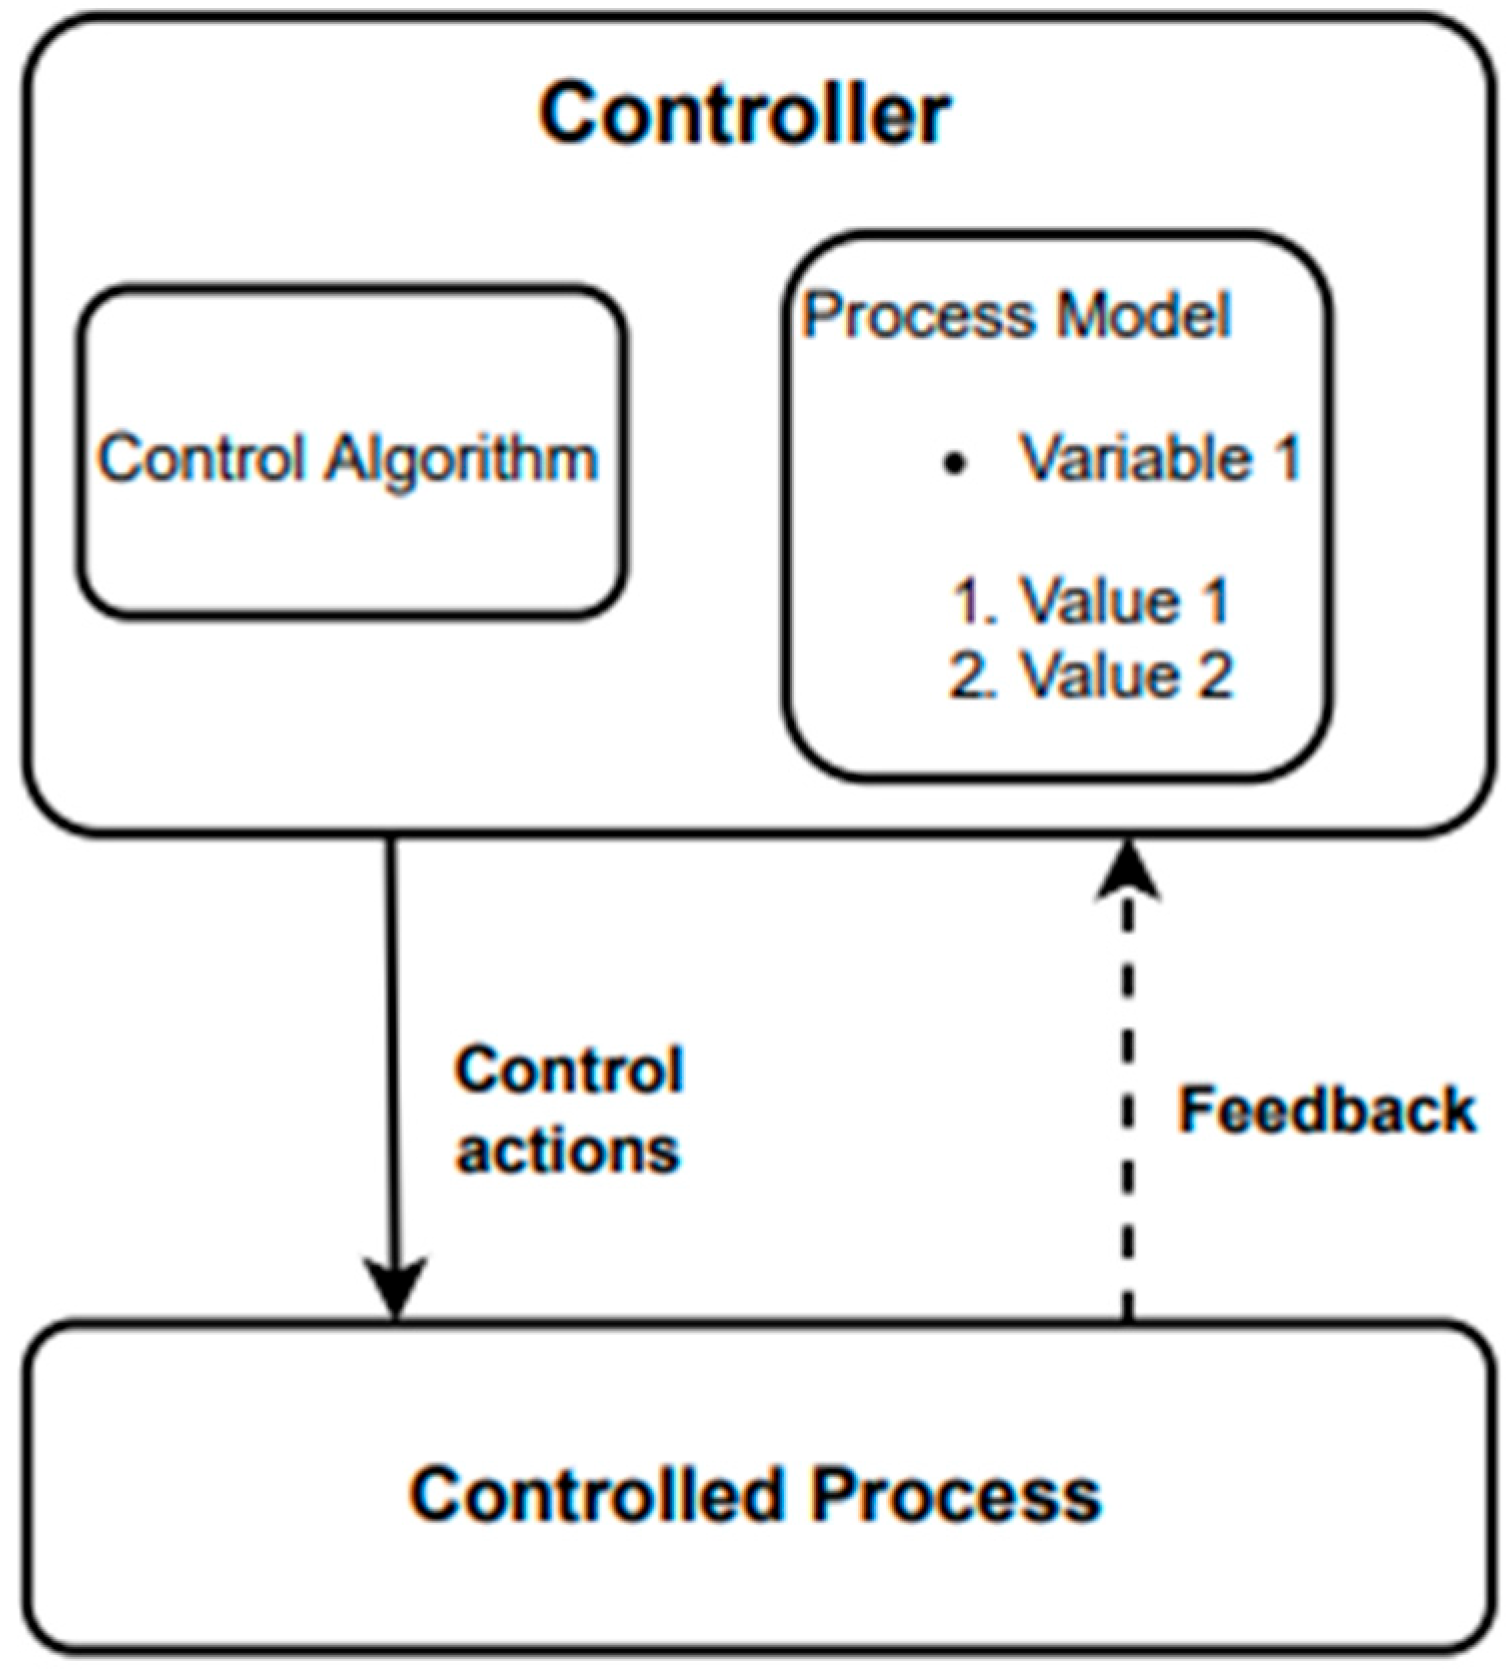
In this step, a control model of the system is developed, including stream buffers and the water supply system. The model is not a physical model of the system but rather a model of hierarchal control of the system components included in the scope of the analysis. The control model is created using a series of feedback and control loops, as shown in Figure 1. In the control loops, the controller provides control actions to a process to control actions and enforces safety constraints over the controller’s behavior. The controlled process also sends feedback to the controller. Within the controller is the control algorithm, which governs the controller’s action based on higher-level control actions and the feedback received from processes controlled [33].
In the case of stream buffers, the controller could include any number of processes, from human decision-making and planning involved in control processes such as maintenance planning or sampling to technological aspects such as computer control of remote monitoring systems and feedback on water quality data.
2.2.3. Step 3—Identify Unsafe Control Actions
Following the identification of the control loops and control actions in step 2, the next part of the analysis is to identify ways in which the control actions can be unsafe. In this context, control actions are unsafe when in a worst-case environment, and operating in a particular context will lead to one or more of the hazards identified in step one. Leveson and Thomas [33] outline four prompts for identifying potential unsafe control actions (UCAs). The UCA prompts include the following: not providing the control action when required; providing the control action causes a hazard; providing the control action too soon or too late; and stopping the control action too soon or applying it too long.
In conjunction with the STPA step of identifying UCAs, the concurrent EWaSAP tasks relate to enforcing internal awareness actions. In this step, the focus is on monitoring for signs that a flaw has occurred or the violation of assumptions made in the design of the safety systems. After defining the signs that need to be monitored, the next step is to identify the sensors capable of perceiving the data required to monitor the signs. Following the identification of the monitoring requirements, the process models need to be updated to process and understand the data and indicate the potential of a safety constraint being violated or a flaw in the assumptions made in the design process. For this study, the analysis is completed from the perspective of the WSP, with the objective of protecting and improving raw water quality and the overall safety of the drinking water system. To ensure completeness, the analysis assumes that some stream buffers are already established and that further buffers are strategically planned to improve water quality outcomes.
2.2.4. Step 4—Identify Loss Scenarios
The loss scenarios are the combination of causal factors that can lead to the identified UCAs being realized. Loss scenarios considered involve considering why UCAs may occur and why control actions fail to be executed or are executed in a way that results in a hazard. The EWaSAP methodology focuses on using the pool of data available to indicate the existence of factors that could result in a UCA and, ultimately, the violation of the high-level safety constraints related to the water supply system.
3. Results and Discussion
The following sections describe the results obtained from the STPA hazard analysis and the complimentary EWaSAP method for identifying early warning signals in the STPA control structure. The results are presented based on each stage of the STPA method and the parallel EWaSAP stage.
3.1. Definition of Purpose
In the scenario presented, the key stakeholders are the consumers of the water supplied by the drinking water catchment. Failure to implement effective source protection measures has been the cause of illness in the community on several occasions [34]. Therefore, the key losses or accidents selected are illnesses or deaths resulting from pathogens or contaminants transported from the catchment area into the drinking water supply. The causes studied that could lead to such losses are contaminants or pathogens in concentrations too significant to be removed effectively or that could compromise the performance of downstream water quality barriers. These downstream barriers typically include water treatment and disinfection processes for typical drinking water supplies. Additional consideration was given to the relative costs; however, for the purpose of this assessment, potential cost savings were considered more of an additional benefit to highlight steam buffers as a possible alternative to conventional treatment infrastructure.
For EWaSAP step one, the focus is on identifying the agents outside of the system that must be informed in case of a system-level hazard. In this case, the main agent would be the position with direct control of the drinking water system, which for a typical WSP may be a position such as a ‘Water Quality Operations Manager’. In this situation, the indication of degraded water quality would come from violating the water quality limits set that reflect the verified capability of downstream water treatment and disinfection processes.
The two main system-level hazards considered are related to the levels of contaminants that could compromise the performance of downstream water treatment and disinfection processes, as well as contaminants with the potential to impact public health that are not removed through treatment. These contaminant levels would vary temporally and spatially throughout the catchment. In this context, the key contaminants could include factors such as elevated dissolved organic carbon and increased turbidity, which impact treatment, as well as chemicals that can impact human health in sufficient concentrations, such as pesticides. The other critical public health factor considered is the presence of pathogens. These contaminants are commonly associated with anthropogenic activities, including agricultural land uses, residential developments, recreational access, etc. The high-level hazards related to the physiochemical and the pathogen were considered separately as the characteristics and processes of microbiological pathogens are unique and set them apart from other contaminants in catchment areas [35]. The high-level hazards, based on the scenario presented, the subsequent safety constraints identified, and the associated indicators are provided in Table 1. The inclusion of “at all times” informs the need for management strategies to account for spatial and temporal variations in water quality.
3.2. Safety Control Structure
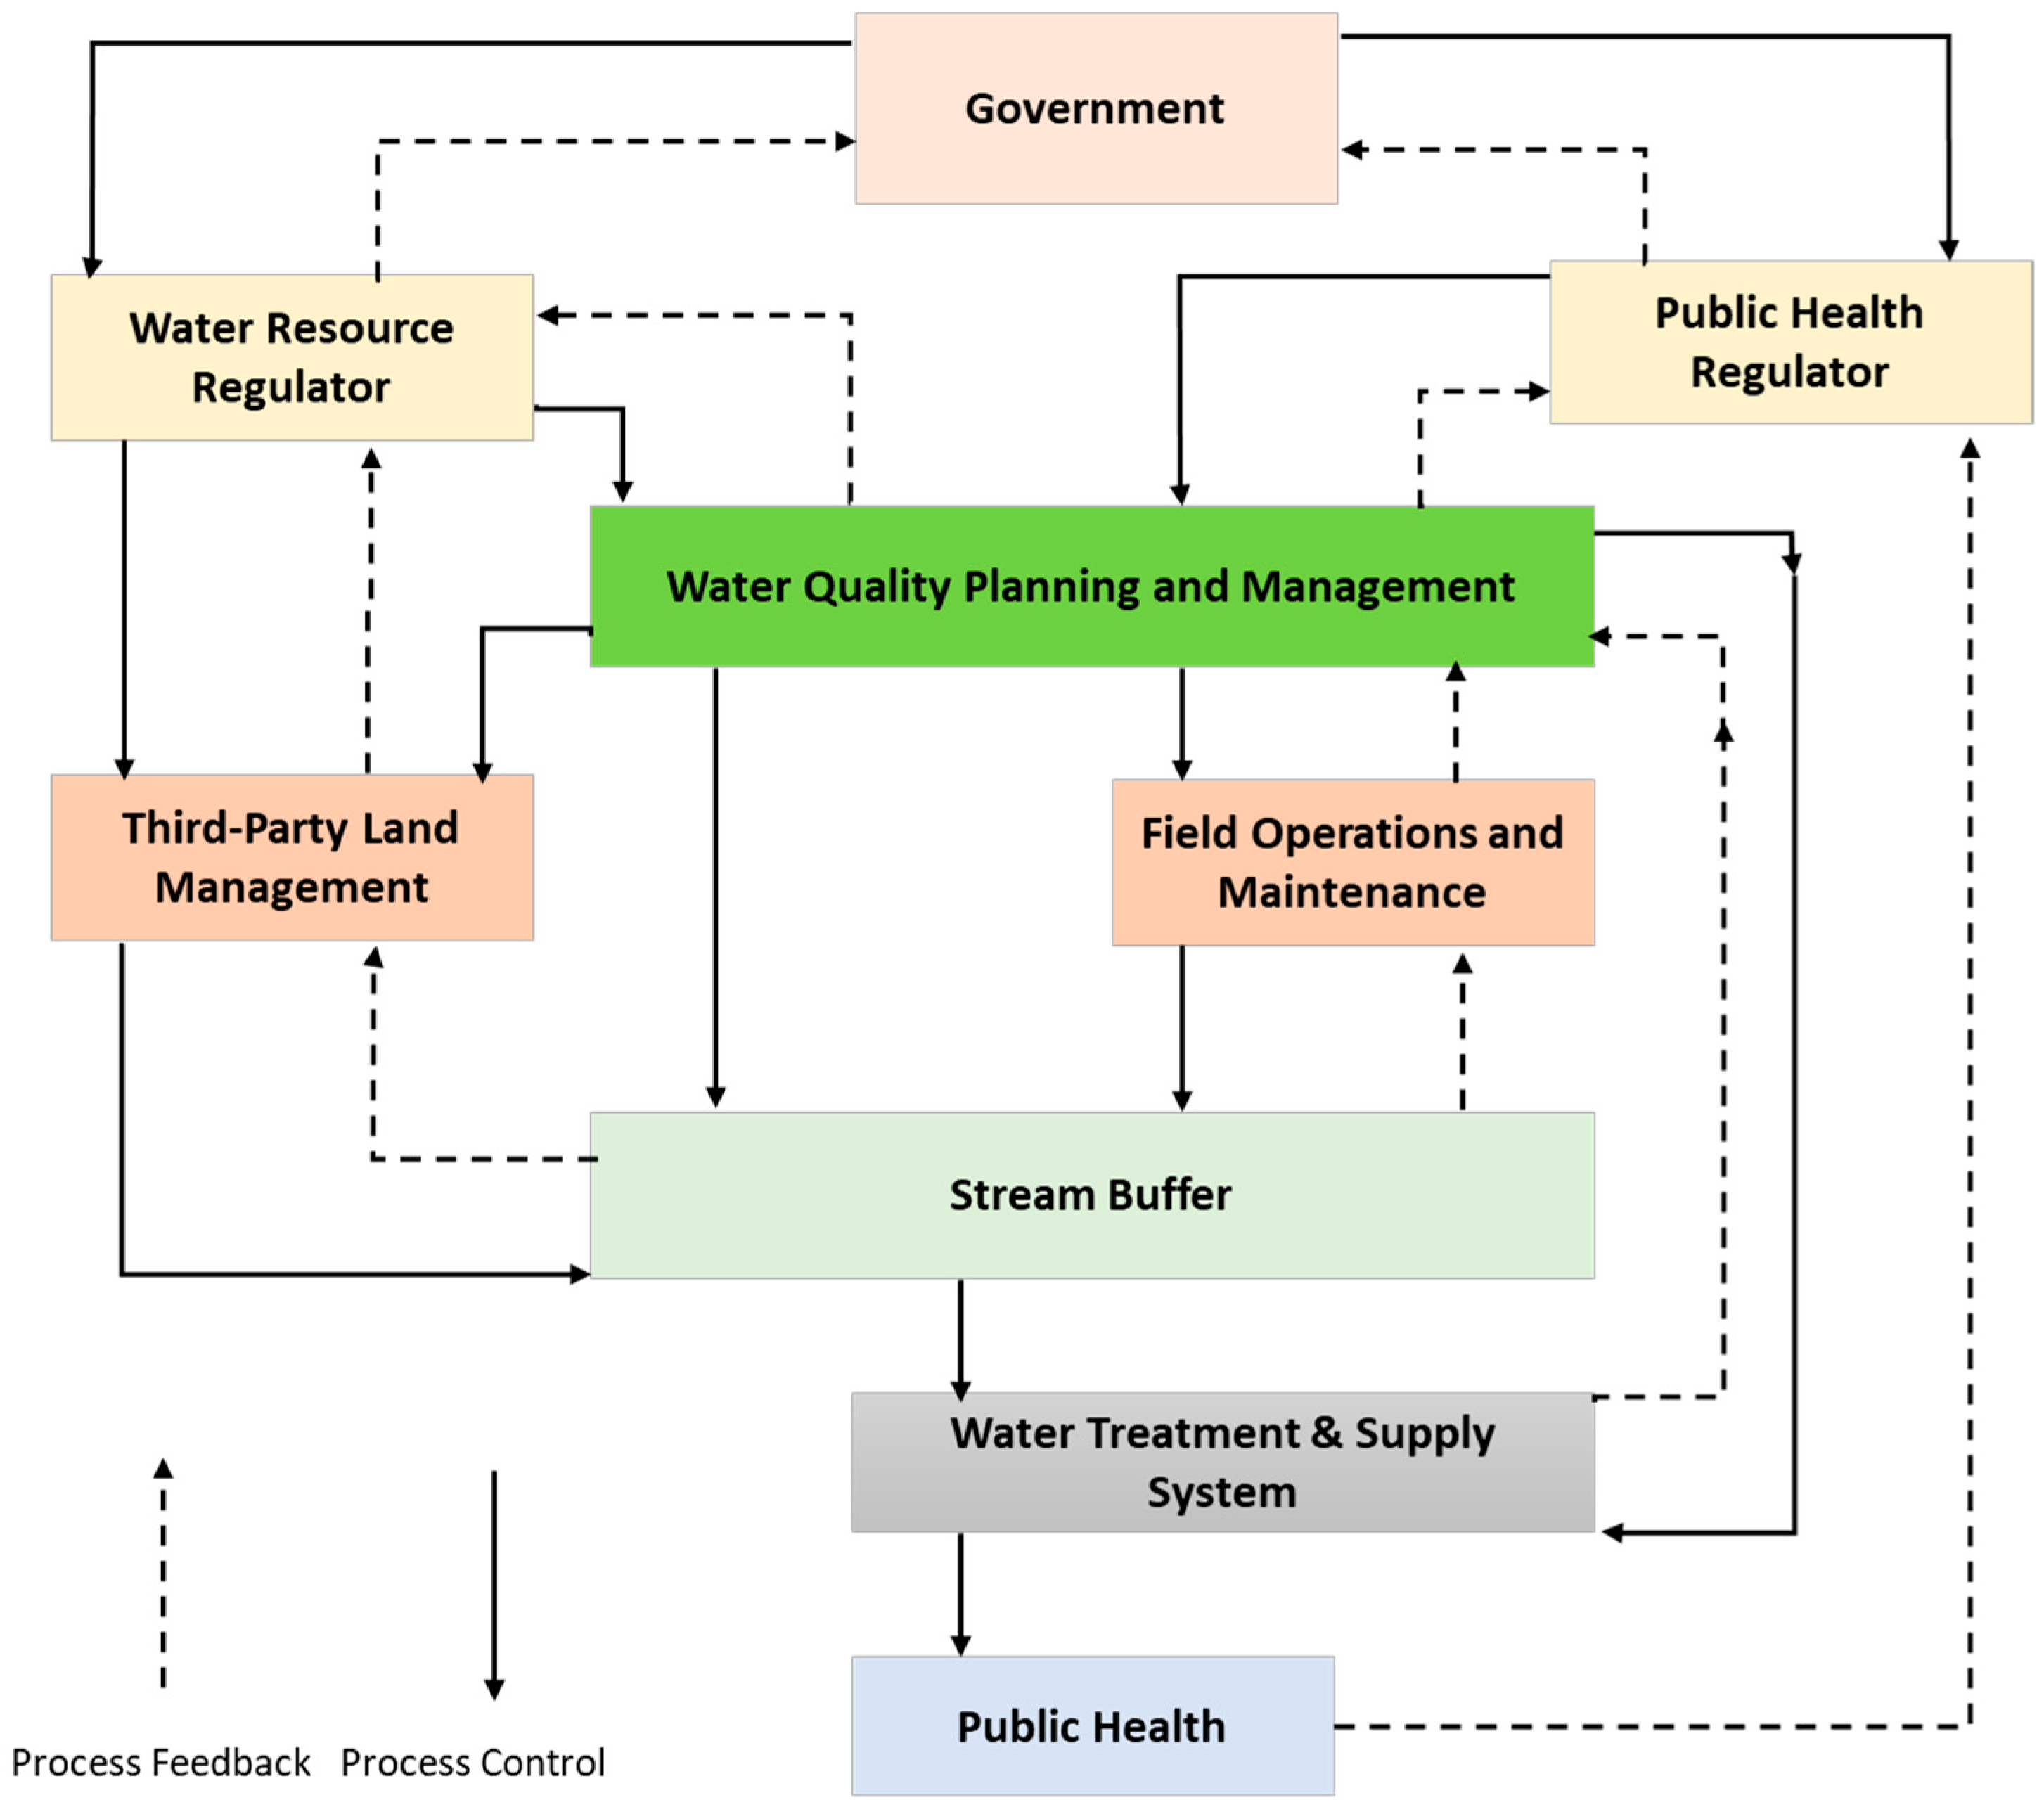
In the drinking water supply system scenario created for this study, the water quality is under the control of the WSP, which is accountable for the final supply to the customer. Included in the safety structure is the role of the government agencies responsible for the management of water resources. Also considered in the safety structure is the role of the public health authority, which has statutory responsibility for regulating drinking water supplies. While, as a regulator, there is no direct responsibility for managing stream buffers, there is indirect influence through regulatory actions. Including enabling actors in the safety control structure provides a detailed view of the broader sociotechnical structure that influences the successful management of ecosystem services in drinking water catchments.
For the WSP, there are several vital internal functions included in the safety control structure, as the control of these functions has considerable influence on drinking water quality outcomes. The WSP functions relate to maintenance and operations as well as planning actions related to water quality control processes. For the study scenario used, the description of all the key actors involved in managing stream buffers in drinking water catchments, associated control actions, and information are listed in Table 2. The corresponding control structure generated from the information generated for the scenario is shown in Figure 2.
3.3. Identification of Unsafe Control Actions
In this step of the analysis, each of the 18 control actions included in the high-level control structure was reviewed to establish the scenarios in which the control actions can be unsafe and potentially violate the system safety constraints. The identification scenarios in which the control actions could be unsafe were helped using the following standard STPA guidewords: not providing control actions, providing control action causes a hazard, control action provided too early or late (out of sequence), and the control action lasts too long or is ceased too early.
As a theoretical example, the identification of UCAs was based on the authors’ knowledge in conjunction with industry practice and guidance, including [36] and the WHO guidance document on protecting surface water for public health [6]. The actions considered multiple aspects ranging from normal planning and operations to strategic management and policy at higher levels within the control structure. The UCAs will vary depending on individual scenarios. However, in this study, the focus was on key aspects of stream buffer management common to most management scenarios. The full set of UCAs covers a wide range of management aspects, including operational management, policy, stakeholder management, etc. At this stage of the study, a total of 46 UCAs were identified for the high-level control actions related to the management of stream buffers.
A sample of the UCAs for operational and strategic control actions is provided in Table 3. To illustrate the practical application of this approach, a sample of control actions is used. This sample considers the control actions of ‘land management’ by third-party land managers in the catchment area, such as private landholders, and ‘set performance requirements’ by the water quality planning role within the WSP in this scenario. In the scenario considered, the WSP would not have an influence on a landholder’s actions; this would be the role of the water resource regulator. In this case, the WSP would interact with the water resource regulator to have control over the management of stream buffers and ensure that requirements for drinking water are met. For unsafe control action (UCA1-P-1) in Table 3, the management actions of the landholder can conflict with the drinking water requirements. That is, while the landholder is aware of the need to manage the buffer, the approach taken, if not compatible with buffer requirements, could result in contaminants passing through and potentially compromising drinking water quality. According to the EWaSAP method, a safety constraint violation in this scenario would be indicated by runoff not meeting set specifications as indicated by water sampling data, in situ water quality monitoring, or via inspections of the stream buffer (Table 1). In the case of inspections, any violation may be identified well before a decline in water quality can be observed [37].
3.4. Causal Factors, Countermeasures, and Early Warning Signs
The causal factors are the scenarios that result in potentially unsafe control actions and the eventual potential resulting in the violation of the high-level safety constraints previously provided in Table 1. In addition to the identification of loss scenarios, the EWaSAP third step is to enforce internal awareness actions to indicate the occurrence of a flaw and the violation of assumptions made in the design of the system. The next step was to consider what countermeasures could be put in place to prevent the identified scenarios from leading to the final UCAs. Following this process, a total of 73 causal factors were identified from the UCAs; each causal factor had a corresponding countermeasure assigned. As some of the causal factors had similar failure mechanisms, a similar countermeasure was assigned, resulting in a total of 61 countermeasures.
The sensor element is derived from the control feedback in the safety control structure. The sensor collects the data, which is supplied to the controller with information to control the actions of the actuator. Given the nature of the sociotechnical structure responsible for management, sensors can take a variety of different forms. The actual sensor will depend on the specifics of a given situation and, in this application, may include visual observations, water quality data, etc. The timing of information from the sensor will depend on the rate at which conditions can change and data can be captured. The timing of sensor readings is essential for informing the early warning signs, which confirm if the countermeasure is effective, and enforcing the required safety constraints in the management structure. This process was completed for all 61 countermeasures identified in Step 3.
As shown in Table 4, in the scenario of the control action ‘land management’ by third-party landholders, the causal factor identified for ‘Land management actions conflict with the drinking water quality objectives’ was ‘landholders’ operations are not compatible with buffer management’. The countermeasure proposed in this instance is to engage with landholders to educate and instruct on the requirements for protecting stream buffers. In many applications, this may include the importance of watering livestock from troughs away from the stream buffer to reduce trampling and preserve the integrity of understory vegetation [38]. For the application of EWaSAP, the early warning sign identified targets the actions of landholders near stream buffers, which may be incompatible with drinking water requirements. The sensor requirements for the warning sign would need to identify incompatible land management operations. In practice, sensors can take a range of forms. In this scenario, the sensor may be regular visual inspections by a suitable authority that can potentially identify management conflicts before impacts to water quality are identified.
The selected example illustrates the management requirements that stem directly from the hazards and safety constraints established in step one of STPA and sets out the requirements to identify early warning signs when the constraints may not be met. Such traceability and monitoring can provide greater certainty that management actions target the hazards identified systematically and considered over conventional approaches.
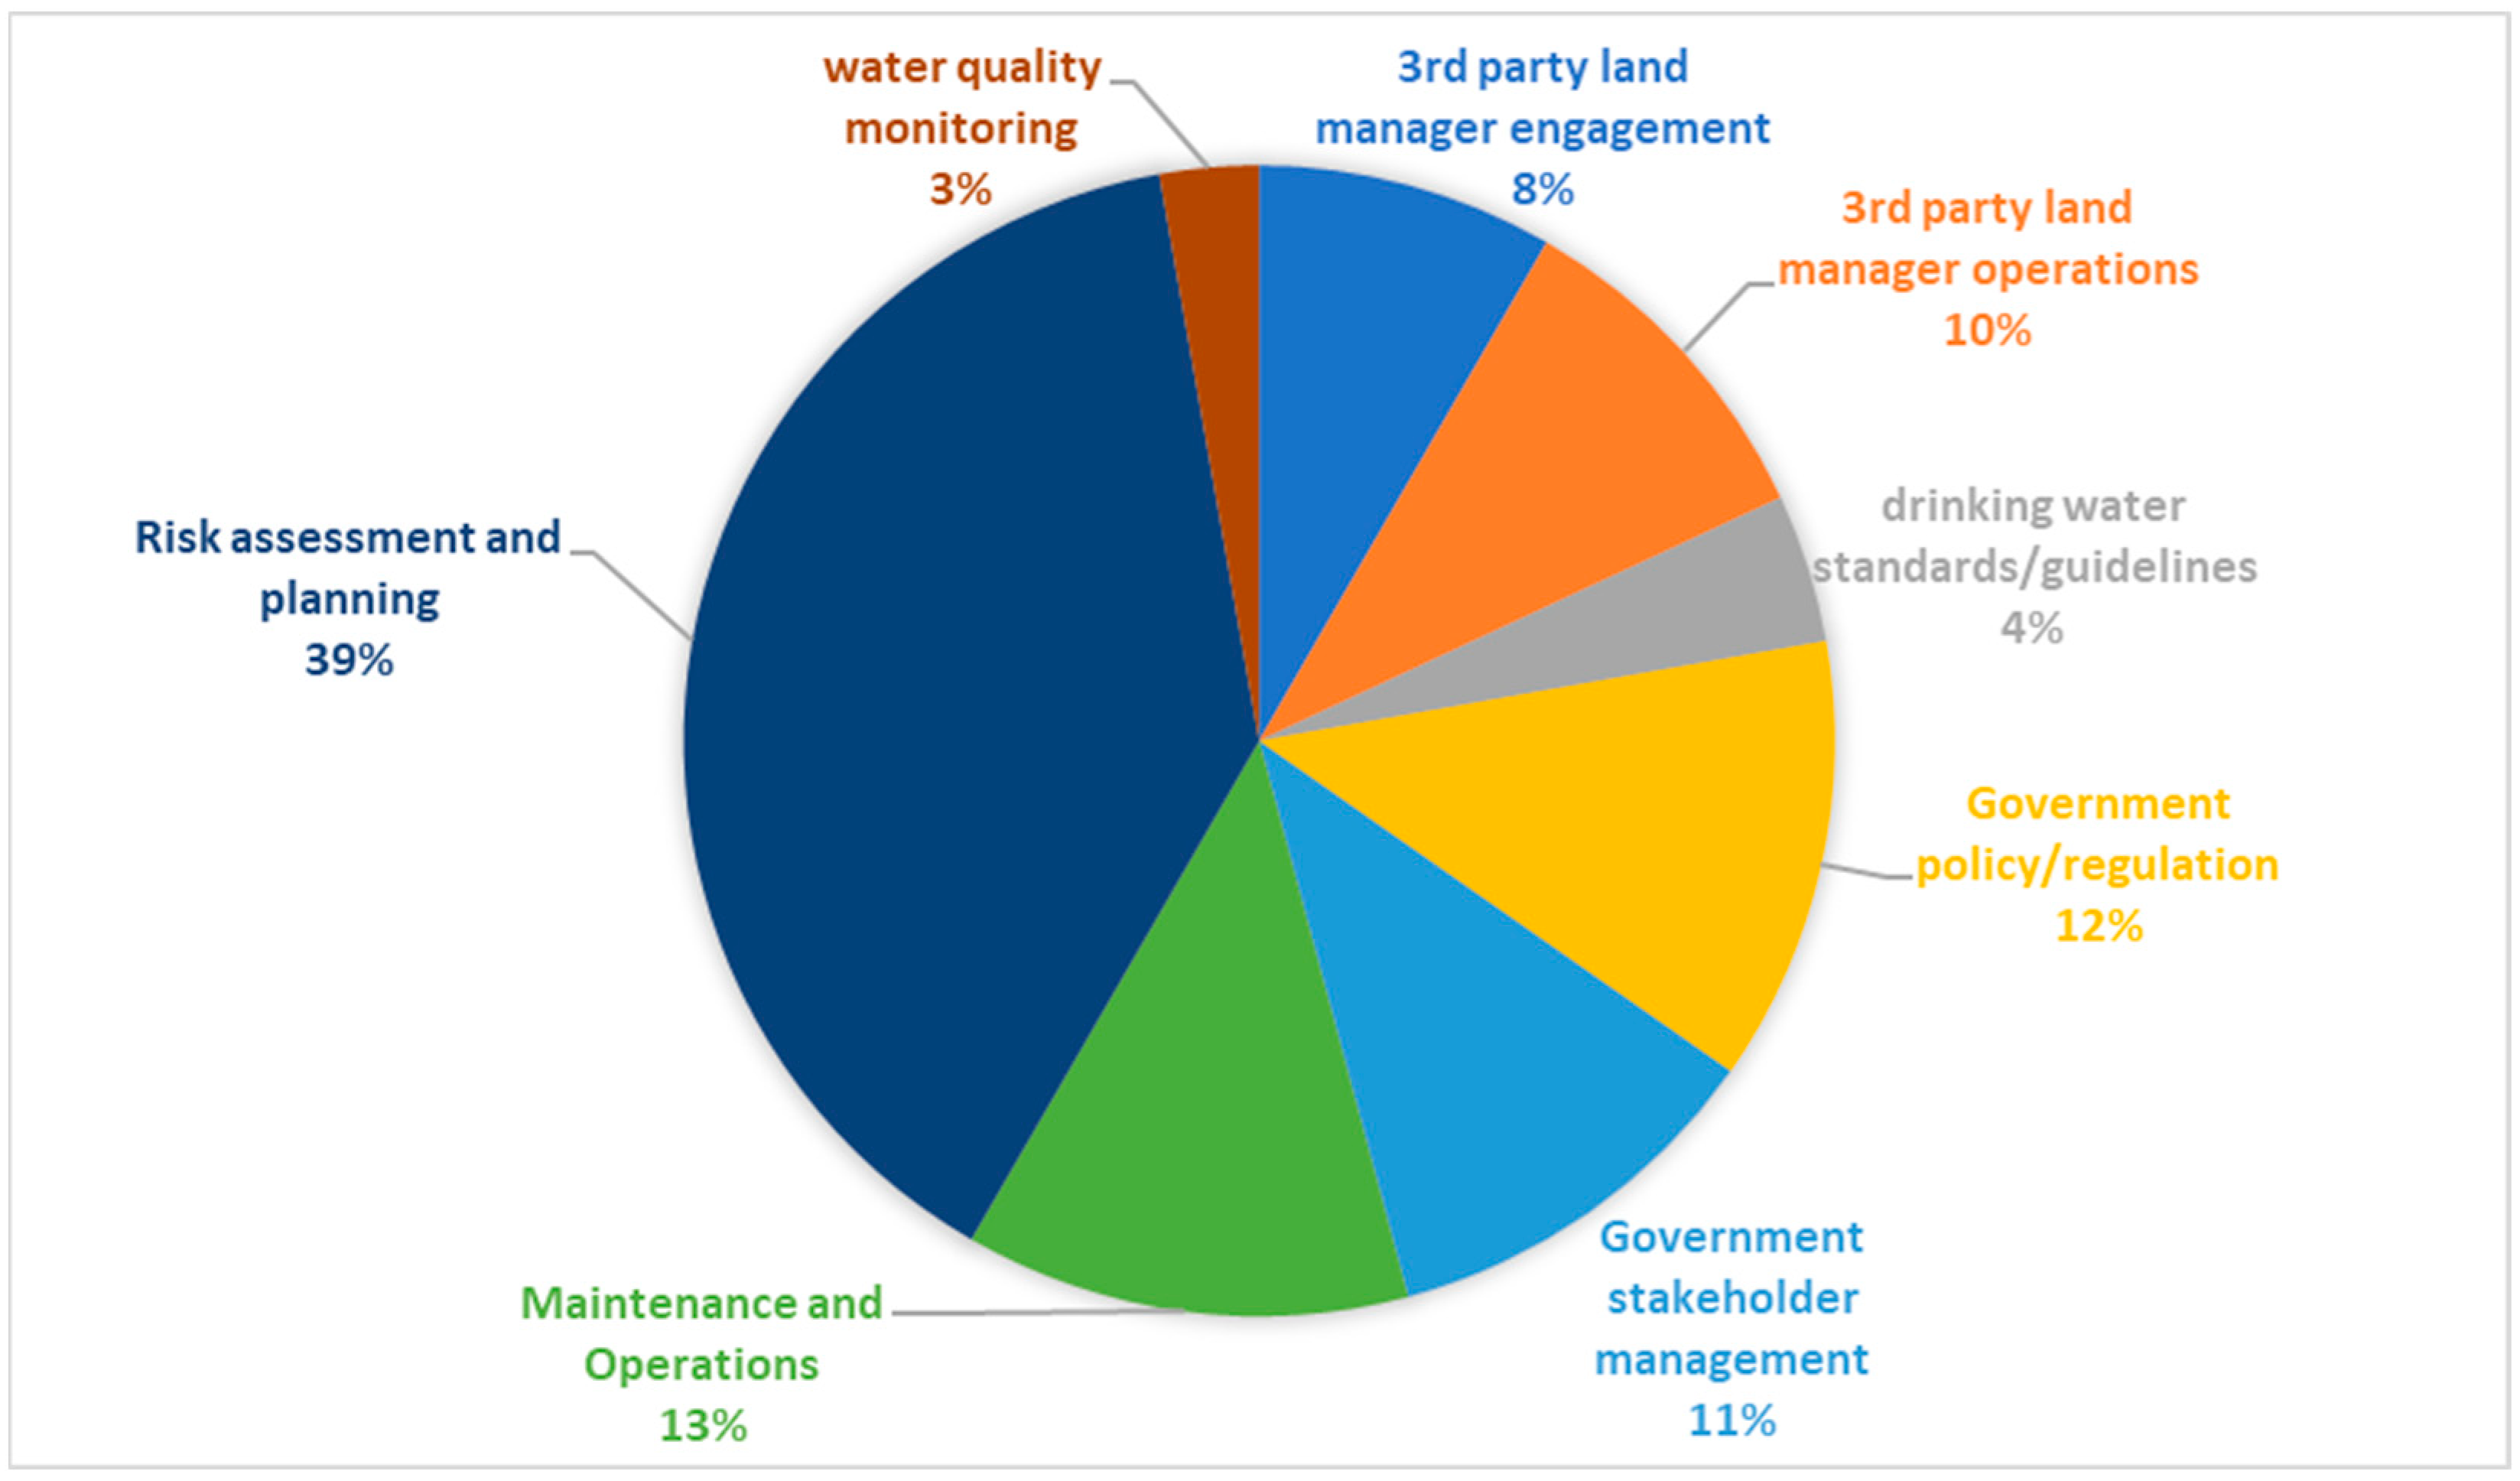
Given the substantial number of early warning signs identified, the results were grouped according to similarities in their functions. The eight functional groups that were created to classify the early warning signs are as follows:
- Water quality monitoring—the warning signals obtained from the direct monitoring of water quality.
- Third-party land manager engagement—the warning signs associated with activities of the WSP engaging with third-party land managers.
- Third-party land manager operations—the warning signs related to the actions of third-party land managers.
- Drinking water standards/guidelines—the early warning signs associated with developing and implementing relevant drinking water industry standards and guidelines.
- Government Policy and Regulation—the early warning signs related to the government’s actions in developing and implementing policy and regulation that impact stream buffers and the wider catchment area.
- Government stakeholder management—the early warning signs of the process of the government’s engagement with relevant stakeholders in the drinking water catchment area
- Maintenance and operations—the early warning signs associated with relevant operations and maintenance activities of the WSP. The scope includes stream buffers and related factors in the wider drinking water catchment area.
- Risk assessment and planning—the early warning signs associated with the WSP risk assessment and planning functions related to stream buffer management in the context of wider catchment management.
The distribution of percentages of the early warning signs allocated to the eight functional groups listed is shown in Figure 3.
Of all the early warning signs identified, the majority related to the risk assessment and planning process, accounting for 39% of all indicators. These processes may be specific to stream buffers as well as catchment management in general. The risk review and planning processes set the foundations for the overall management system [39]. Issues are identified and found, and this stage can prevent possible degradation due to management actions. The next highest number of early warning signs can be found with maintenance and operation functions (13%) and government policy and regulation (12%). Like any other asset in the water supply system, stream buffers require ongoing, careful maintenance and operations to support the expected performance requirements [40]. In this instance, monitoring the early warning signals related to operations and maintenance functions provides greater certainty in meeting the water quality objectives. As for government policy and regulation, while not directly influenced by a WSP, it is important to be able to navigate the aspects of policy and regulation that influence stream buffer management. The smallest group of early signs related to water quality sampling accounted for only 3% of all indicators. Water quality sampling is often used as the principal indicator for the effectiveness of water quality interventions [41]. While adequate for characterizing water quality, monitoring is a lag indicator in this instance, as stream buffers may become seriously degraded before any change in water quality results is observed.
4. Conclusions
A greater reliance on ecosystem services provided by stream buffers has significant potential to offset the dependence on conventionally engineered assets in many drinking water supply applications. This study shows that by identifying the operational hazards associated with establishing and managing stream buffers, targeted countermeasures can be put in place to mitigate or reduce the management hazards that could impact drinking water quality. Furthermore, having a comprehensive assessment of the catchment management processes and effectiveness can help guide the planning for future water quality infrastructure needs and balance future investments in water quality protection.
Like other assets used in the supply of safe drinking water, stream buffers are a deceptively complex system, and ensuring the protection of drinking water outcomes means understanding the sociotechnical hazards involved in their management. The scenario applied provides an example of how taking a highly systematic approach to identifying hazards using STPA can help to better understand management requirements for natural assets by incorporating a diverse range of sociotechnical aspects into the risk assessment process. Furthermore, developing a set of early warning signals and sensors using EWaSAP provides warning signals and sensors for the effective management of natural assets. The uncertainty of outcomes can be a limiting factor when deciding between investing in catchment interventions and conventional water treatment infrastructure. However, the approach of using STPA and EWaSAP in combination provides a basis for systematically designing management regimes for greater assurance of meeting the requirements for a safe, reliable supply of drinking water.
The uncertainty of outcomes can be a limiting factor when deciding between investing in catchment interventions and conventional water treatment infrastructure. However, the approach of using STPA and EWaSAP in combination provides a basis for systematically designing management regimes to achieve greater certainty in meeting the requirements for a safe, reliable supply of drinking water. While the scenario presented in this research focuses on stream buffers in drinking water catchments, the flexibility of the methods used can be extended to other water resource management objectives associated with catchment areas. This is due to the ability to incorporate a diverse range of sociotechnical facets of catchment management and corresponding management objectives.
This study highlights the potential benefits of systematic approaches to drinking water catchment management and the complex sociotechnical systems involved. Further research is required to assess the approach under different practical applications with varying water quality hazards, management approaches, and arrangements. Furthermore, the substantial number of early warning signs identified would require significant resources to implement and assess.
The methods used are beneficial in identifying the hazards in stream buffer management; however, they do not provide a means to assess the relative importance of the warning signs in the overall system. The validation, ranking, and selection of the final early warning signs warrant further research and investigation to assist WSPs in balancing resources and safely managing ecosystem services.
Author Contributions
Conceptualization, H.C.M. and J.-J.H.; methodology, H.C.M. and J.-J.H.; formal analysis, H.C.M.; investigation, H.C.M.; resources, J.-J.H.; writing—original draft preparation, H.C.M.; writing—review and editing, H.C.M. and J.-J.H.; visualization, H.C.M.; project administration, H.C.M. All authors have read and agreed to the published version of the manuscript.
Funding
The contributions from H.C.M. were in part funded through the Taiwan Fellowship program.
Data Availability Statement
Data sharing not applicable.
Conflicts of Interest
The authors declare no conflict of interest.
References
- World Health Organization. Guidelines for Drinking-Water Quality: Fourth Edition Incorporating the First Addendum; WHO: Geneva, Switzerland, 2017. [Google Scholar]
- Vincent, J.R.; Ahmand, I.; Adnan, N.; Burwell, W.B., III; Pattanayak, S.K.; Tan-Soo, J.-S.; Thomas, K. Valuing Water Purification by Forests: An Analysis of Malaysian Panel Data. Environ. Resour. Econ. 2016, 64, 59–80. [Google Scholar] [CrossRef]
- Yeboah, F.K.; Lupi, F.; Kaplowitz, M.D. Agricultural landowners’ willingness to participate in afilter strip program for watershed protection. Land Use Policy 2015, 49, 75–85. [Google Scholar] [CrossRef]
- Buckley, C.; Hynes, S.; Mechan, S. Supply of an ecosystem service—Farmers’ willingness to adopt riparian buffer zones in agricultural catchments. Environ. Sci. Policy 2012, 24, 101–109. [Google Scholar] [CrossRef]
- Wu, S.; Bashir, M.A.; Raza, Q.U.A.; Rehim, A.; Geng, Y.; Cao, L. Application of riparian buffer zone in agricultural non-point source pollution control A review. Front. Sustain. Food Syst. 2023, 7, 985870. [Google Scholar] [CrossRef]
- Rickert, B.; Chorus, I.; Schmoll, O. Protecting Surface Water for Health: Identifying, Assessing and Managing Drinking-Water Quality Risks in Surface-Water Catchments; World Health Organization: Geneva, Switzerland, 2016. [Google Scholar]
- WSAA. Source Catchments as Water Quality Treatment Assets: Industry Best Practices and Triple Bottom Line Cost Evaluation of Catchment Management Practices; Water Services Association of Australia Limited: Melbourne, Australia, 2016. [Google Scholar]
- Stutter, M.L.; Chardon, W.J.; Kronvang, B. Riparian buffer strips as a multifunctional management tool in agricultural landscapes. J. Environ. Qual. 2012, 41, 297–303. [Google Scholar] [CrossRef] [PubMed]
- Bennet, G.; Carroll, N. Gaining Depth: State of Watershed Investment 2104. Forest Trends Ecosystem Marketplace. 2014. Available online: https://www.forest-trends.org/publications/gaining-depth-2/ (accessed on 20 October 2022).
- Sadoff, C.; Muller, M. Water Management, Water Security and Climate Change Adaptation: Early Impacts and Essential Responses; Global Water Partnership: Stockholm, Sweden, 2009. [Google Scholar]
- Freeman, J.; Madsen, R.; Hart, K. Statistical Analysis of Drinking Water Treatment Plant Costs, Source Water Quality and Land Cover Characteristics; United States Trust for Public Land: Washington, DC, USA, 2007. [Google Scholar]
- Tromboni, F.; Dodds, W.K. Relationships Between Land Use and Stream Nutrient concentrations in a highly urbanized tropical region of brazil: Thresholds and riparian zones. Environ. Manag. 2017, 60, 30–40. [Google Scholar] [CrossRef]
- Li, S.; Gu, S.; Tan, X.; Xhang, Q. Water quality in the upper Han River basin, China: The impacts of land use/land cover in riparian buffer zone. J. Hazard. Mater. 2009, 165, 317–324. [Google Scholar] [CrossRef]
- Heberling, M.T.; Nietch, C.T.; Thurston, H.W.; Elovitz, M.; Birkenhaur, K.H.; Panguluri, S.; Ramakrishnan, B.; Heiser, E.; Neyer, T. Comparing drinking water treatment costs to source water protection costs using time series analysis. Water Resour. Res. 2015, 51, 8741–8756. [Google Scholar] [CrossRef]
- NHMRC; NRMMC. Australian Drinking Water Guidelines Paper 6, National Water Quality Management Strategy. National Health and Medical Research Council, National Resource Management Ministerial Council, Commonwealth of Australia, Canberra. 2011. Available online: https://www.nhmrc.gov.au/about-us/publications/australian-drinking-water-guidelines (accessed on 20 October 2022).
- Mathieu, L.; Tinch, R.; Provins, A. Catchment management in England and Wales: The role of arguments for ecosystems and their services. Biodivers. Conserv. 2018, 27, 1639–1658. [Google Scholar] [CrossRef]
- OFWAT. Capex Bias in the Water and Sewerage Sectors in England and Wales-Substance, Perception or Myth; A Discussion Paper; OFWAT: Birmingham, UK, 2012.
- Mahesh, S.; Gu, R.R. Modeling the effects of riparian buffer zone and contour strips on stream water quality. Ecol. Eng. 2009, 35, 1167–1177. [Google Scholar]
- Sutton, A.J.; Fisher, T.R.; Gustafson, A.B. Effects of restored stream buffers on water quality in non-tidal streams in the Choptank River Basin. Water Air Soil Pollut. 2009, 208, 101–118. [Google Scholar] [CrossRef]
- Cox, A.L. What’s wrong with risk matrices. Risk Anal. 2008, 28, 497–512. [Google Scholar] [PubMed]
- Hokstad, P.; Røstum, J.; Sklet, S.; Rosén, L.; Pettersson, T.J.; Linde, A.; Sturm, S.; Beuken, R.; Kirchner, D.; Niewersch, C. Methods for Risk Analysis of Drinking Water Systems from Source to Tap-Guidance Report on Risk Analysis, TECHNEAU Report. 2009. Available online: http://citeseerx.ist.psu.edu/viewdoc/download?doi=10.1.1.367.4044&rep=rep1&type=pdf (accessed on 1 January 2019).
- Sulaman, S.M.; Beer, A.; Felder, M.; Host, M. Comparison of FMEA and STPA safety analysis methods: A case study. Softw. Qual. J. 2017, 27, 349–387. [Google Scholar] [CrossRef]
- El-Arkam, M.; Riad, B.; Aya, A.; Youcef, Z. Risk assessment in a petrochemical plant using socio-technical approaches (STAMP-STPA). In Proceedings of the 2nd International Conference on Computational Engineering and Intelligent Systems, Online, 18–20 November 2022. [Google Scholar]
- Hill, C.B.; Yadav, O.P.; Khan, E. Systemic risk analyses for potential impacts of onshore unconventional oil and gas development on public health and the environment: A critical review. Sci. Total Environ. 2021, 786, 147512. [Google Scholar] [CrossRef]
- Leveson, N. A systems approach to risk management through leading safety indicators. Reliab. Eng. Syst. Saf. 2015, 136, 7–34. [Google Scholar] [CrossRef]
- Leveson, N. A new accident model for engineering safer systems. Saf. Sci. 2004, 42, 237–270. [Google Scholar] [CrossRef]
- Cameron, I.; Mannan, S.; Németh, E.; Park, S.; Pasman, H.; Rogers, W.; Seligmann, B. Process Hazard Analysis, Hazard Identification and Scenario Definition: Are the conventional tools sufficient, or should and can we do much better? Process Saf. Environ. Prot. 2017, 110, 55–70. [Google Scholar] [CrossRef]
- Alvarenga, M.; Frutuoso e Melo, P.; Fonscea, R. A critical review of methods and models for evaluating organizational factors in Human Reliability Analysis. Prog. Nucl. Energy 2014, 75, 25–41. [Google Scholar] [CrossRef]
- Dokas, I.M.; Freehan, J.; Imran, S. EWaSAP: An early warning sign identification approach based on a systemic hazard analysis. Saf. Sci. 2013, 58, 11–26. [Google Scholar] [CrossRef]
- Merrett, H.C.; Chen, W.T.; Horng, J.J. A Systems analysis approach to identify critical success factors in drinking water source protection programs. Sustainability 2019, 11, 2606. [Google Scholar] [CrossRef]
- Shin, S.M.; Lee, H.S.; Shin, S.K.; Jang, I.; Park, J. STPA-Based hazard and importance analysis on NPP safety I&C systems Focusing on human–system interactions. Reliab. Eng. Syst. Saf. 2021, 213, 107698. [Google Scholar]
- Daly, D.; Archbold, M.; Deakin, J. Progress and challenges in managing our catchments effectively. Biol. Environ. Proc. R. Ir. Acad. 2016, 116, 157–166. [Google Scholar] [CrossRef]
- Leveson, N.; Thomas, J. STPA Handbook. 2018. Available online: http://psas.scripts.mit.edu/home/get_file.php?name=STPA_handbook.pdf (accessed on 1 April 2018).
- Hrudey, S.E.; Hrudey, E.J.; Pollard, S.J. Risk management for assuring safe drinking water. Environ. Int. 2006, 32, 948–957. [Google Scholar] [CrossRef] [PubMed]
- Pachepsky, Y.A.; Sadeghi, A.M.; Bradford, S.A.; Shelton, D.R.; Guber, A.K.; Dao, T. Transport and fate of manure-borne pathogens: Modeling perspective. Agric. Water Manag. 2006, 86, 81–92. [Google Scholar] [CrossRef]
- Lee, P.; Smyth, C.; Boutin, S. Quantitative review of riparian buffer width guidelines from Canada and the United States. J. Environ. Manag. 2004, 70, 165–180. [Google Scholar] [CrossRef]
- Lynch, J.A.; Corbett, E.S. Evaluation of best management practices for controlling nonpoint pollution from silviculture operations. J. Am. Water Resour. Assoc. 1990, 26, 41–52. [Google Scholar] [CrossRef]
- Quinn, J.M.; Croker, G.F.; Smith, B.J.; Bellingham, M.A. Integrated catchment management effects on flow, habitat, instream vegetation and macroinvertebrates in Waikato. N. Z. J. Mar. Freshw. Res. 2009, 43, 775–802. [Google Scholar] [CrossRef]
- Wang, G.; Mang, S.; Cai, H.; Liu, S.; Zhang, Z.; Wang, L.; Innes, J.L. Integrated watershed management: Evolution, development and emerging trends. J. For. Res. 2016, 27, 967–994. [Google Scholar] [CrossRef]
- Sharma, S.; Bhattacharya, A. Drinking water contamination and treatment techniques. Appl. Water Sci. 2017, 7, 1043–1067. [Google Scholar] [CrossRef]
- National Research Council. Assessing the TMDL Approach to Water Quality Management; The National Academies Press: Washington, DC, USA, 2001. [CrossRef]
Figure 1.
The generic control loop used to develop the model of the control structure adapted with permission from Ref. [25]. 2015, Elsevier.
Figure 1.
The generic control loop used to develop the model of the control structure adapted with permission from Ref. [25]. 2015, Elsevier.

Figure 2.
STPA safety control structure for the management of stream buffers for drinking water quality outcomes. Process control is represented with solid lines, and dashed lines represent feedback. Individual control actions are outlined in Table 2.
Figure 2.
STPA safety control structure for the management of stream buffers for drinking water quality outcomes. Process control is represented with solid lines, and dashed lines represent feedback. Individual control actions are outlined in Table 2.

Figure 3.
Distribution of selected early warning signs in each category (n = 61).


Table 1.
High-level hazards and safety requirements for the management of stream buffers.
| Accident | Hazard ID | Hazard | Safety Constraint ID | Safety Constraint | Indicators of Safety Constraint Violation |
|---|---|---|---|---|---|
| Supply of unsafe drinking water | H1 | Stream buffer is not effective in removing Pathogens | SC1 | Buffer must ensure the removal of pathogens to the expected level at all times | Indicated by: levels of pathogens exceed the capability of downstream treatment Sensors: water sampling data |
| H2 | Stream buffer is not correctly managed and maintained | SC2 | Stream buffers must be maintained to ensure they function as expected at all times | Indicated by: condition assessment Sensors: visual inspections/condition assessments, land manager feedback | |
| Degradation of water quality | H3 | Stream buffer is not effective in removing contaminants from the expected level | SC3 | Stream buffer must be able to remove contaminants at all times as per the intended purpose | Indicated by: runoff meeting set specifications Sensors: water sampling data, in situ monitoring |
Table 2.
The critical actors involved in the scope of the study on the management of stream buffers in drinking water catchments, associated control actions, and information.
Table 2.
The critical actors involved in the scope of the study on the management of stream buffers in drinking water catchments, associated control actions, and information.
| Controller | Responsibility | Control Action | Feedback/Measurements to the Controller |
|---|---|---|---|
| Raw Water Quality | Meet the quality requirements to be safely treated by downstream processes. | Control Raw Water Quality | Water Sampling in situ water quality monitoring |
| Stream Buffer | Control contaminants of concern about catchment runoff | Control Water chemistry/Microbiology | Condition assessment against the required standard |
| Public Health | the health outcomes for the general population due to drinking water quality | N/A | Public health surveillance |
| Field Operations and Maintenance | Monitoring of buffer condition, performing maintenance as required | Inspection and condition assessment | Field observations |
| Water Quality Planning | Managing the catchment to tap water quality programs to set regulatory standards, which include risk assessments, water quality management plans and identifying process improvements. (Note: this function may be a single WSP or divided across multiple organizations.) | Set performance requirements. Set monitoring requirements. Communicate drinking water management requirements. Set treatment performance requirements | Auditing and reporting of program implementation. Input into guidelines needs for drinking water quality |
| Third-party Land Management | Management of land not owned or under the control of the drinking water catchment management agency | land management | Stakeholder feedback |
| Public Health Regulator | Government agency with statutory authority to set requirements for the WSP to ensure safe drinking water requirements | Set agreed stipulations for safe drinking water | Auditing and Reporting |
| Water Treatment and Distribution | Treat raw water from the catchment and supply it to the customer | Control Water Safety | Water quality monitoring Asset performance |
| Water Resource Regulator | Government agency with statutory authority for the management of water resources | Policy Requirements for Catchment Management Technical advice Engagement with land managers in Catchment areas | Audit and Reporting |
| Government | For the provision of legislation and the funding of government agencies | Provide Legislation Provide Policy Provide budget | N/A |
Table 3.
The Unsafe Control Actions associated with the management of stream buffers for drinking water outcomes. The corresponding safety constraints are included in brackets [..] which refer to the fourth column in Table 1.
Table 3.
The Unsafe Control Actions associated with the management of stream buffers for drinking water outcomes. The corresponding safety constraints are included in brackets [..] which refer to the fourth column in Table 1.
| Control Action | From | To | Not Providing Control Action | Providing Causes Hazard | Too Early/Too Late |
|---|---|---|---|---|---|
| Land management | Third-party Land Management | Stream Buffer | (UCA1-N-1) Land manager does not manage the condition of the stream buffer [SC2] | (UCA1-P-1) Land management actions conflict with the drinking water quality objectives [SC2] [SC3] | (UCA1-T-1) the land manager is delayed in responding to conditions that degrade the effectiveness of buffers [SC3] |
| Set performance requirements | Water Quality Planning | Field Operations and Maintenance | (UCA3-N-1) there are no performance requirements set during the planning process [SC1] [SC3] | (UCA3-P-1) The performance requirements set do not meet the needs of the application [SC1] [SC3] (UCA3-P-2) the performance requirements do not enforce safe water [SC1] [SC3] (UCA3-P-3) Performance requirements cannot be met by the buffer in a given location [SC1] | (UCA3-T-1) The performance requirements have changed and no longer meet the buffer’s performance [SC3] |
| Control Water Safety | Water Treatment and Distribution | Public Health | (UCA11-P-1) The water quality provided does not ensure public health [SC4] |
Table 4.
Selected examples of unsafe control actions and associated causal factors, countermeasures, signs, and required sensor functions.
Table 4.
Selected examples of unsafe control actions and associated causal factors, countermeasures, signs, and required sensor functions.
| Causal Factor | Countermeasure | Unsafe Control Action (UCA) | Early Warning Signs | Sensor Requirements |
|---|---|---|---|---|
| Landholders’ operations are not compatible with buffer management | Engage and educate 3rd party landholders to ensure their management actions are compatible with drinking water quality objectives | (UCA1-P-1) Land management actions conflict with the drinking water quality objectives [SC3] | Land management activities/actions are incompatible with the specified stream buffer requirements | Able to indicate compliance with specified land management practices |
| The challenge of the raw water is greater than the ability of the treatment process | Set service level requirements for the performance of the buffer | (UCA11-P-1) The water quality provided does not ensure public health [SC4] | Noncompliance of raw water quality with service level agreement | Should measure water quality against the relevant parameters |
| There is a change in the characteristics of diffuse pollution sources | Implement a whole of catchment management program to monitor and control potential water pollution | (UCA3-T-1) The performance requirements are changed and no longer meet the buffer’s performance [SC3] | Catchment inspection results do not match the expected results | Should measure current catchment condition against expected catchment condition |
Disclaimer/Publisher’s Note: The statements, opinions and data contained in all publications are solely those of the individual author(s) and contributor(s) and not of MDPI and/or the editor(s). MDPI and/or the editor(s) disclaim responsibility for any injury to people or property resulting from any ideas, methods, instructions or products referred to in the content. |
© 2023 by the authors. Licensee MDPI, Basel, Switzerland. This article is an open access article distributed under the terms and conditions of the Creative Commons Attribution (CC BY) license (https://creativecommons.org/licenses/by/4.0/).
Share and Cite
MDPI and ACS Style
Merrett, H.C.; Horng, J.-J. A Systems Approach to Identifying Hazards in the Management of Stream Buffers for the Protection of Drinking Water Quality. Water 2023, 15, 3848. https://doi.org/10.3390/w15213848
AMA Style
Merrett HC, Horng J-J. A Systems Approach to Identifying Hazards in the Management of Stream Buffers for the Protection of Drinking Water Quality. Water. 2023; 15(21):3848. https://doi.org/10.3390/w15213848
Chicago/Turabian StyleMerrett, Hew Cameron, and Jao-Jia Horng. 2023. "A Systems Approach to Identifying Hazards in the Management of Stream Buffers for the Protection of Drinking Water Quality" Water 15, no. 21: 3848. https://doi.org/10.3390/w15213848
Note that from the first issue of 2016, this journal uses article numbers instead of page numbers. See further details here.