
Flood and Landslide Damage in a Mediterranean Region: Identification of Descriptive Rainfall Indices Using a 40-Year Historical Series


CNR-IRPI Research Institute for Geo-Hydrological Protection, Via Cavour 4–6, 87036 Rende, Cosenza, Italy
*
Author to whom correspondence should be addressed.
Water 2023, 15(21), 3826; https://doi.org/10.3390/w15213826
Submission received: 19 September 2023
/
Revised: 26 October 2023
/
Accepted: 27 October 2023
/
Published: 1 November 2023
(This article belongs to the Special Issue Geological Hazards: Landslides Induced by Rainfall and Infiltration)
Abstract
:In the future, as a result of global warming, it is possible that rainfall could become more intense and frequent. This could lead to more frequent triggering of damaging phenomena such as floods and landslides (named as a whole damaging hydrogeological events, DHE), and, consequently, to the increase of their impacts on territories, especially in regions where uncontrolled urban sprawl represents a factor that can exacerbate the problem. The analysis of a large quantity of information about both triggering rainfall and triggered phenomena can help to comprehend relationships between triggering precipitation and its related impacts. In this paper, to facilitate the investigation of the relationships between large and complex datasets concerning both rainfall and rainfall-related damage, we propose an index-based approach, illustrated by its application to the Calabria region (Southern Italy). In particular, this manuscript presents some results from a preliminary investigation aimed at assessing the “better” index to describe DHE. Five rainfall indices (RIs) were tested and five composite rainfall indices (CRIs), combinations of two or more RIs, are proposed. We calculated the RIs and the CRIs by means of 1,300,000 daily data registered in the observation period 1980–2020. The CRIs showed the best relationships with the data of damaging hydrogeological events (DHEs). Particularly, better results were obtained with landslides data than with floods data, perhaps due to the hydraulic characteristics of the Calabria rivers, affected by flash floods mainly influenced by very intense hourly rainfall events.
1. Introduction
Floods and landslides are dangerous natural hazards which often occur simultaneously, as a consequence of intense rain events, during damaging hydrogeological events (DHEs). DHEs can be defined as the occurrence of phenomena triggered by rainfall, such as landslides and floods [1,2], significantly affecting society, properties, and the human environment [3], damaging people [4,5], causing economic losses in agriculture, and huge damage to transport assets [6]. In the Emergency Events Database (https://www.emdat.be/, accessed on 11 July 2023), increases of about 150% and 50% in floods and landslides, respectively, have been detected between the periods 1980–1999 and 2000–2019. In the past 20 years, DHEs have cause damages of more than USD 650 billion, affecting millions of people around the world (https://reliefweb.int/report/world/human-cost-disasters-overview-last-20-years-2000-2019, accessed on 12 July 2023).
In addition to the feared effects of climate change, in terms of supposed extreme exacerbation confirming the so-called “wet-gets-wetter and dry-gets-drier” paradigm, in which most regions which are expected to be wetter, and dry regions drier [7], the urbanization of areas prone to either landslides or floods can play an important role in worsening the situation. Concerning landslides, rapid urbanization, especially in developing nations, will put more people in the path of landslides, and informal housing practices such as uncontrolled slope cutting can increase the chances of landslide occurrences [8]. Regarding floods, fertile soils, proximity to surface and groundwater sources, and higher land value make some regions more appealing for human settlements, while the nature of their frequent flooding is often overlooked. This has led to the current situation in which large parts of the world’s floodplains have disappeared due to chaotic urbanization developments, especially in developing countries [9].
Because of their extremely different mechanisms, destructive power, and possibilities of forecasting and prevention, floods and landslides are analyzed separately in the scientific literature. Articles that focus on a single type of phenomena—floods or landslides—are the majority, while papers analyzing their simultaneous occurrence during DHEs are quite rare [7,10]. Actually, to plan effective defensive strategies from DHEs, it cannot be ignored that rainfall events simultaneously trigger landslides and floods, and frequently flood impact is even amplified by simultaneous storm surges [11].
To understand relationships between triggering rainfall and DHEs’ impact, extensive datasets concerning both triggering rainfall and triggered phenomena must be created and analyzed. At the regional scale, we must process data about hundreds of either small or large landslides and floods that each year cause damage of different severity levels within the regional territory. Similarly, the volume of rainfall data to be analyzed depends on the number of gauges within the regional network and the scanning time of rain measurements.
It has been several years since indicators and indices were introduced in scientific disciplines to summarize complex and voluminous amounts of data in a practical and illustrative way, as a user-friendly interface between natural hazards and societal responses. In Italy, for example, maps of landslide susceptibility and soil–land consumption were combined to derive the “landslide risk index” at the municipal scale. This allowed researchers to assess the “averaged landslide risk” and the “total landslide risk”, roughly representing how prudent each municipality has been in planning sustainable urban growth to cope with landslide risk [12].
Indicators and indices represent successful tools for decision making and are often utilized to reduce the communication gap between the scientific community, decision makers, and the population at risk [7]. Indicators and indices are frequently used as synonyms, although they have different meanings.
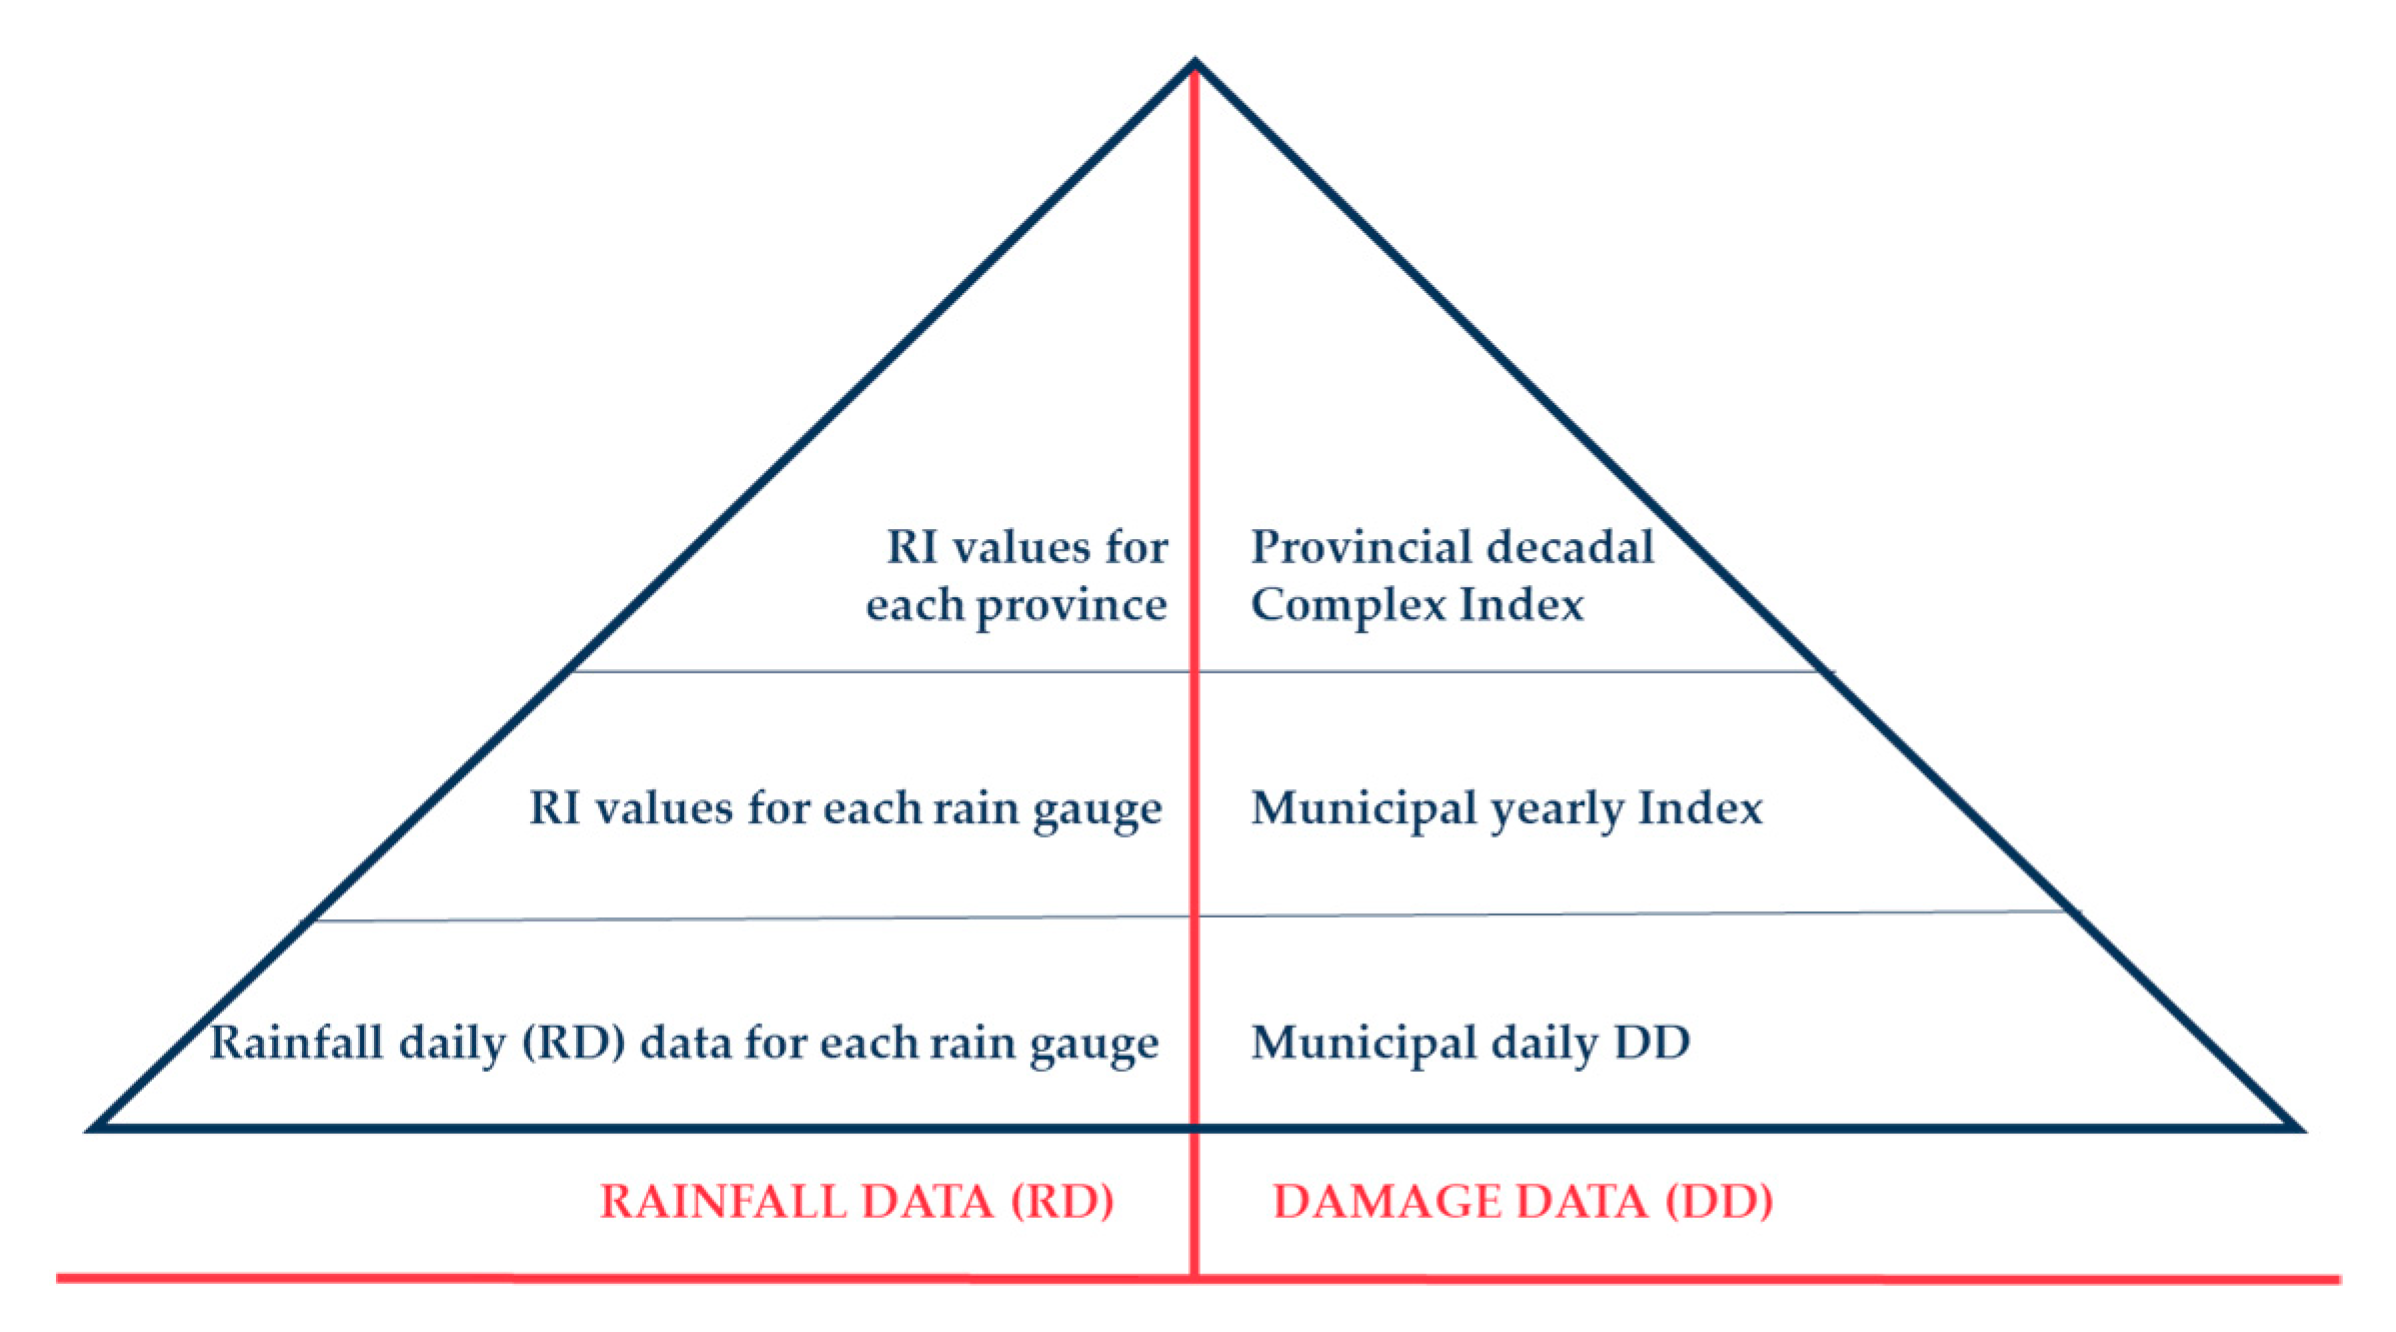
The indicator supplies a measure of a selected phenomenon (indicandum) [13], summarizing primary data to translate a concept/phenomenon into a quantitative/qualitative form, making the information simpler and accessible even to a non-specialist audience [14]. Similarly, an index has the same measurement function, but, instead of being obtained from primary data, it is obtained from the combination of different indicators [15], according to the hierarchical flow described by the pyramid of information [16], where primary data are at the base of the pyramid and the index at the vertex.
The main merit of the indicators is to summarize large amounts of detailed local-scale territorial data into a synoptic view that is more easily comparable to data about other features characterizing the same territory. In the natural-hazard literature, indicators and indices are used as tools to assess and summarize risk, vulnerability, exposure, and other aspects related to disaster management [7,16,17]. In the literature, several studies are present regarding rainfall indices, particularly about extreme events and their eventual trends in the Mediterranean basin, which is considered a hotspot of climate change. For Montenegro, which is the wettest region in the Mediterranean, Burić et al. [18] analyzed trends of some extreme ETCCDI (Expert Team on Climate Change Detection and Indices) rainfall indices and their relationship with the North Atlantic Oscillation. Kutiel and Trigo [19] studied the inter-annual and the intra-annual precipitation variability in Lisbon (Portugal), also by means of rainfall indices. Similar analyses were carried out for other Mediterranean areas, but those about the relationships with the impacts on the territory, such as floods and landslides, often regard only the research of thresholds triggering the disaster events (i.e., [20]).
In Italy, the Institute for Environmental Protection and Research (ISPRA, www.isprambiente.gov.it) realised IdroGEO, an open-source open data platform containing the national inventory of landslides, which has been designed to support decision makers and technicians. Moreover, in order to provide useful tools supporting national risk-mitigation policies, ISPRA elaborated sets of indicators which summarize at the national scale the landslide and flood risk mapped at municipal scale in the Piano di Assetto Idrogeologico (PAI, River Basin Plans, www.isprambiente.gov.it, accessed on 21 July 2023). Similarly, Donnini et al. [7] introduced indicators at the municipal level to differentiate Italian territories based on the spatial distribution of landslides, thus supplying a picture of slope-instability severity that can be used to support decision makers to evaluate and manage landslide-mitigation activities. Moreover, concerning DHEs, several indices have been introduced to assess and compare their severity [1,13], such as the index of damaged area, which is the sum of the area of damaged municipalities divided by the area of the region and the number of victims [1,21,22]. Regarding climatic data, the use of indices allows researchers to address the limitations of in situ observations and remotely sensed data in terms of consistency, data quality, and accessibility [23].
In the framework of the EC project INDECIS (Integrated approach for the development across Europe of user-oriented climate indicators for GFCS high-priority sectors: agriculture, disaster risk reduction, energy, health, water and tourism), based on a 29-year observation period, we performed studies in Calabria on the response in terms of the frequency of landslides, floods, and forest fires to a set of climate indices [24]. To go further, for the present paper we extended the observation period from 29 (1990–2018) to 40 years (1981–2020), and tried, as main aim of the study, to better exploit the large amount of coupled DHE/rainfall data, downscaling observations to a provincial scale and proposing new indices that can be proficiently used to describe the ex post relationships between triggering rainfall and resulting damaging phenomena.
With this aim, some composite rainfall indices, combinations of two or more RIs, are also proposed, matching well with data concerning the impacts on the territory caused by phenomena such as landslides and floods. For reaching this scope, in Section 2 we describe the methodological approach to synthetize complex spatial–temporal series of damage and rainfall data through indices, presenting its application to the Calabria region. Section 3 shows the results obtained, and the consequent discussion is presented in Section 4, highlighting limits and criticisms that must be taken into account to obtain affordable results, and introducing future steps to improve both method and results. Primary conclusions are summarized in Section 5.
2. Methodological Approach
The methodological approach proposed in this study aims to manage an extensive dataset of rainfall data and damage data to obtain synthetic indices that can be easily compared, temporally and spatially, to investigate the relationships between rainfall and the development of DHEs, including the long-term frequencies of these events, as well as to compare DHEs affecting a study area in different periods, aiming to detect possible trends in their severity, if any. In fact, working at the regional scale, difficulties arise when it is necessary to process data about numerous local phenomena (floods and landslides) grouped at the regional scale, in order to be comparable with the scale that generally characterizes rainfall distribution over long periods. In addition, due to the high spatial and temporal variability characterizing DHEs, significant results can be obtained only when a sufficiently long data series is analyzed, and this increases the amount of data which must be treated. To face the problems of large dataset management and obtain significant indices that can be used at regional scale, we can imagine our rainfall and damage records structured in the so-called pyramid of information [16], where primary data are aggregated throughout a hierarchical approach to summarize the information that they contain (Figure 1). As reference territorial units, we used the administrative boundaries of named provinces in Italy, or NUT3 in the Nomenclature of Territorial Units for Statistics defined by Eurostat (https://ec.europa.eu/eurostat/web/nuts/national-structures, accessed on 25 July 2023), and representing the units used for management of civil protection emergencies.
2.1. The Study Area
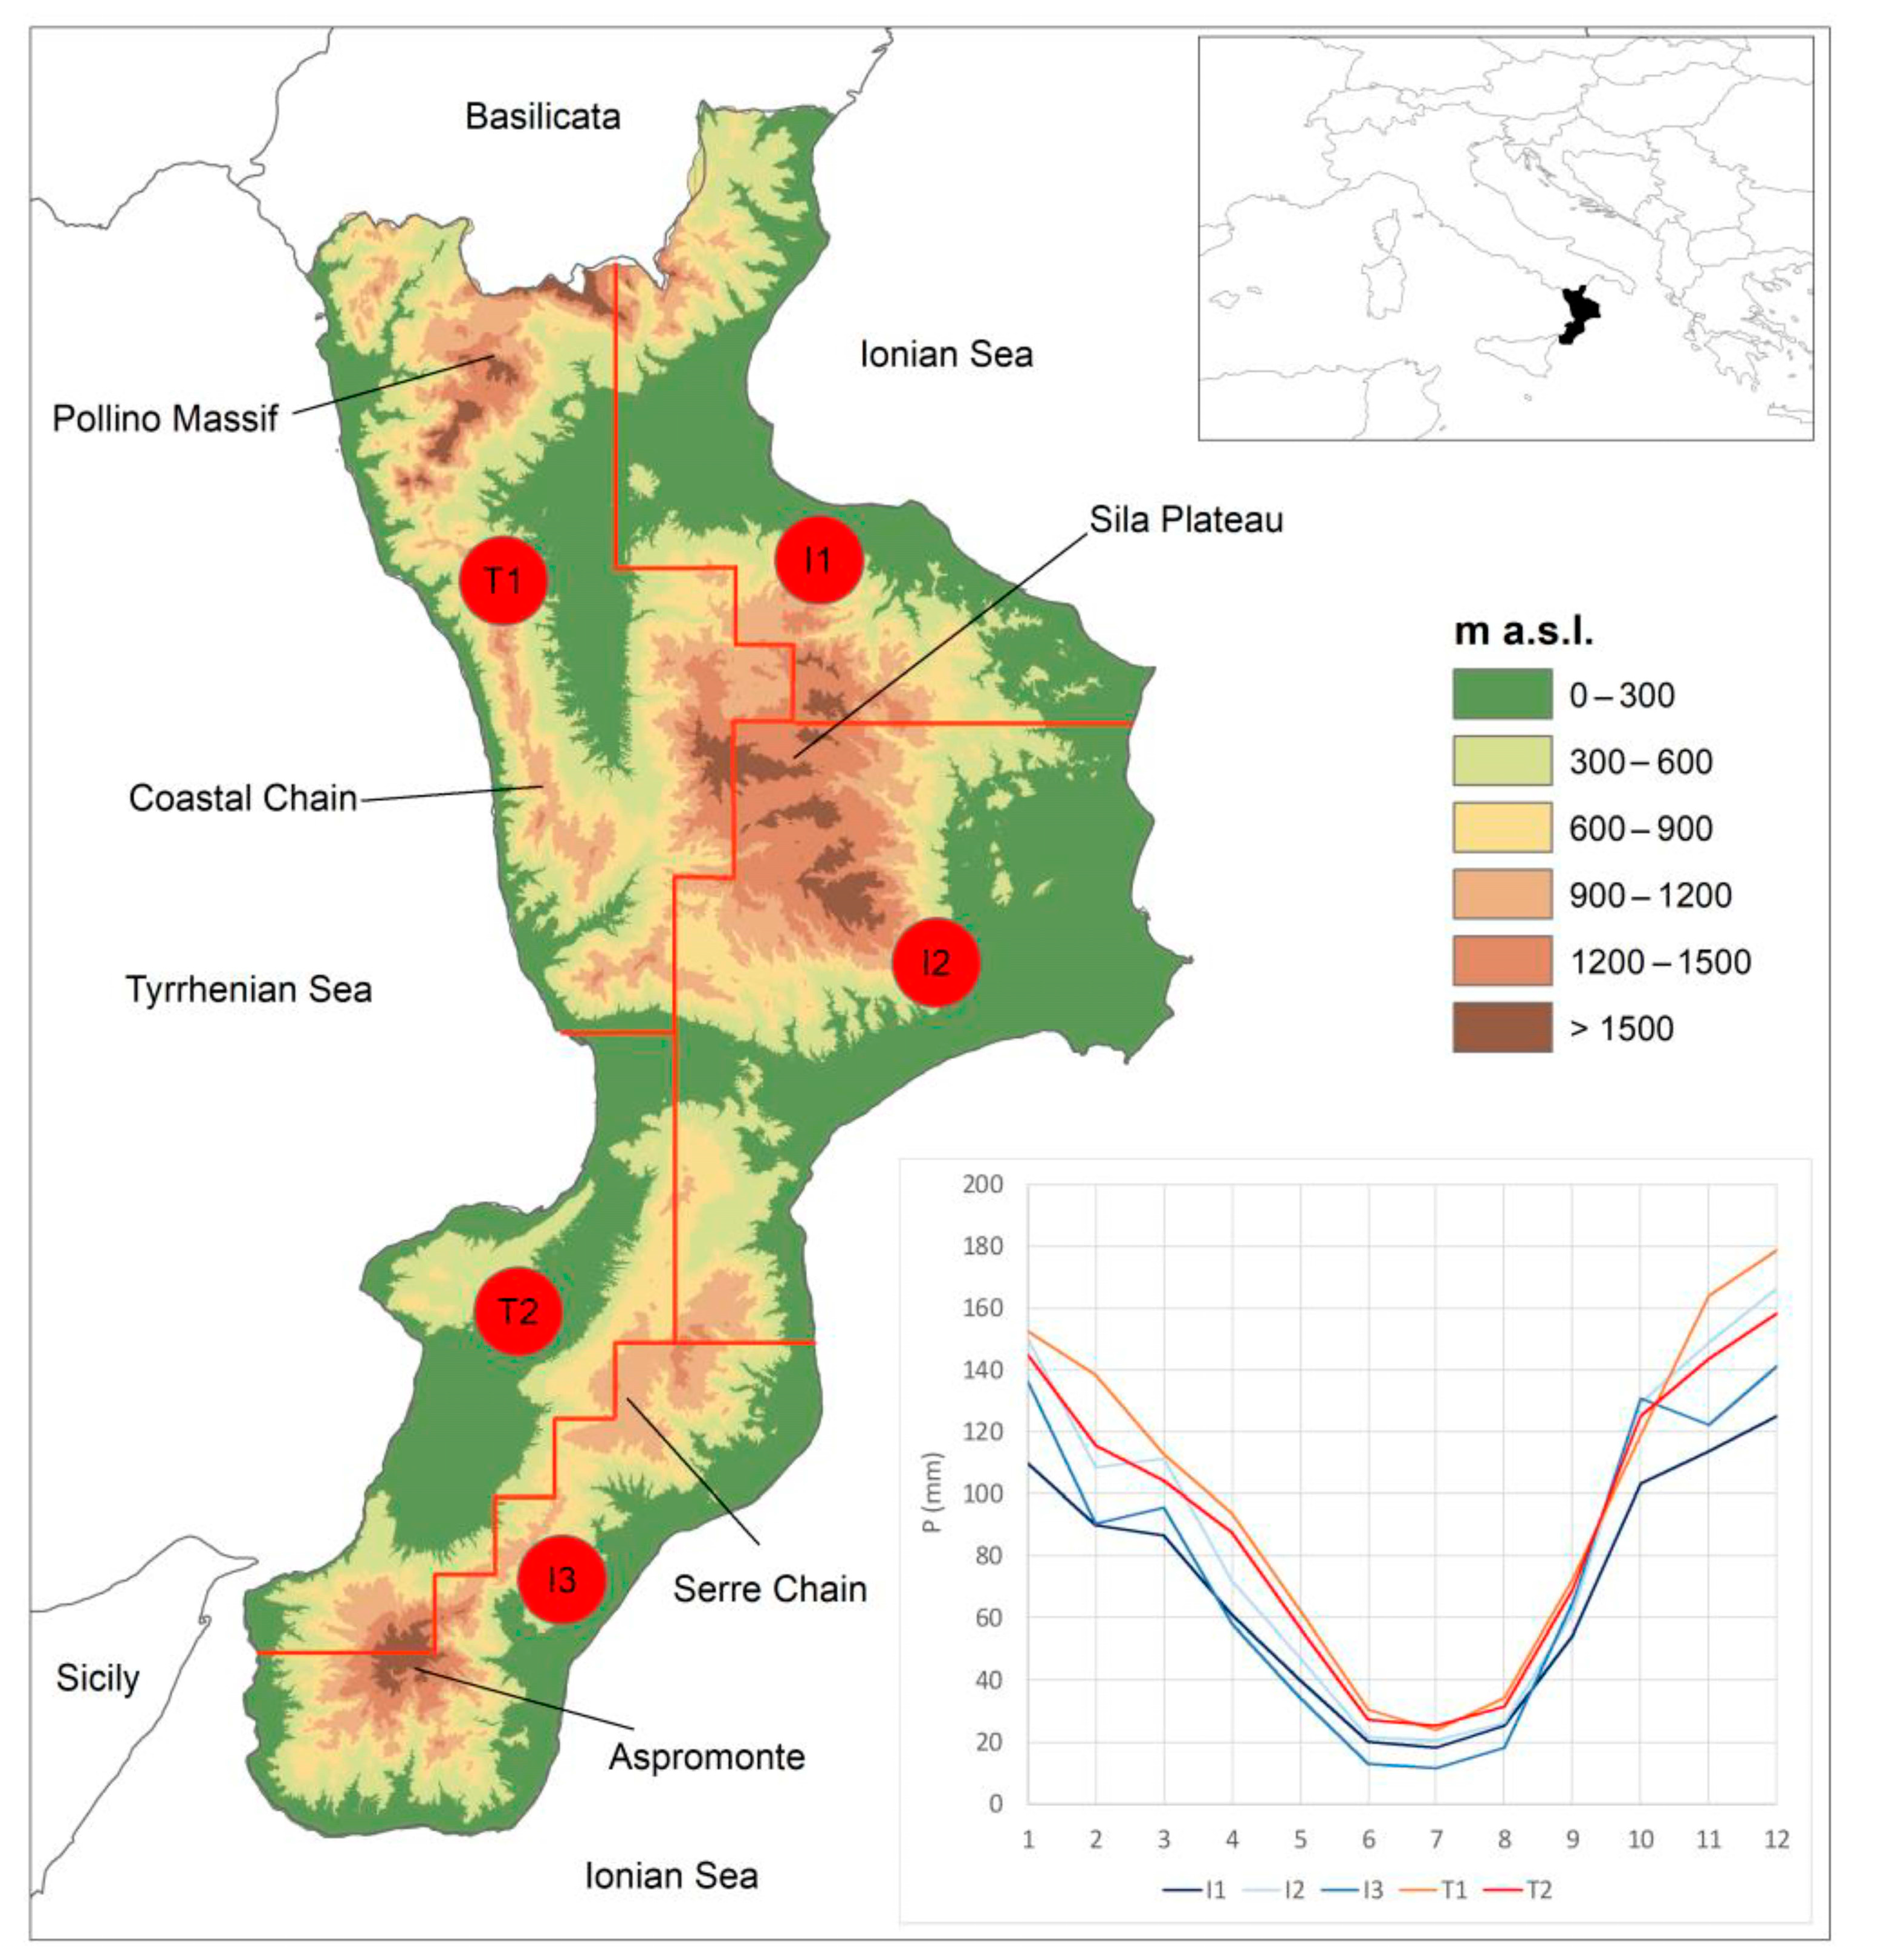
Calabria is the southernmost Italian peninsular region, located at the center of the Mediterranean Sea, with a 738 km long coastline in between the Tyrrhenian Sea (on the west side) and the Ionian Sea (on the east side) (Figure 2). Calabria’s surface area is about 15,080 km2; the mean altitude of the region is 597 m a.s.l., and the maximum is 2267 m a.s.l. The active tectonic uplift and the rugged morphology featuring the North–South Apennine chain give to this region a territory that is mainly hilly (49% of the total surface) and mountainous (41%), with small flat areas (9%) along the coastal plains, at the mouths of a few main rivers. Actually, the fluvial system is mainly made of ephemeral streams characterised by step paths that originated because of the rapid regional uplift which started in the Quaternary and is still active.
These streams, dry during summer, are sources of damaging flash floods in the autumn–winter rainy season [25,26,27]. Concerning slopes, climatic conditions and tectonic stresses have worsened the rocks’ characteristics, predisposing slopes to instabilities that in the rainy season originate new landslide phenomena or re-mobilise quiescent landslide bodies.
From a climatic point of view, the region belongs to the mesothermic climate, with most of the region in the Csa type (Mediterranean with dry and hot summers), while the Csb variety (Mediterranean with dry and warm summers) characterizes high Apennine sectors and peaks [28]. Due to the combined effect of geographical position and orographic system, the region is affected by several types of meteorological conditions with high spatial variability of rainfall characteristics. In general, the Tyrrhenian side and inland areas are mainly exposed to western currents, causing abundant annual rainfall with peaks of up to 2000 mm/year. Opposite, the Ionian side of the region shows lower annual rainfall (with a minimum of 500 mm/year) and is frequently hit by short and intense rains generated by warm humid southern air masses with high inter-annual variability. Figure 2 shows the five homogeneous rainfall zones into which the whole region can be divided: two on the Tyrrhenian side (T1 and T2) and three on the Ionian side (I1, I2, and I3). The graph contained in Figure 2 indicates the behaviour of the average monthly rainfall for each rainfall zone of Calabria, ranging from a minimum in July (about 12 mm in the I3 zone) to a maximum in December (about 180 mm in the T2 zone [29]).
Figure 2.
Study areas and behavior of the mean monthly rainfall for each rainfall zone of Calabria (from [29]).
Figure 2.
Study areas and behavior of the mean monthly rainfall for each rainfall zone of Calabria (from [29]).

From an administrative point of view, the territory of Calabria is subdivided into five provinces, made up of 404 municipalities: Cosenza (CS), Catanzaro (CZ), Reggio Calabria (RC), Crotone (KR), and Vibo Valentia (VV). For brevity, from now on, the names Cosenza-P., Catanzaro P., Reggio Calabria P., Crotone P., and Vibo Valentia P. are used to refer to the Provinces bearing those names. Starting from data collected every 10 years in the national censuses by ISTAT (Italian acronym of the Italian National Institute of Statistics), it appears that population density in each of the provinces is lower than the Italian average, which is around 189 inhabitants per square kilometer (Table 1). Moreover, population density showed a general decrease in all the provinces during the study period, reaching the strongest decrease (around 15%) in the southernmost Reggio Calabria P.
According to the national law 991/1952, concerning benefits and tax reliefs for mountainous areas scarcely connected to the major cities, Italian municipalities have been classified as “mountainous” based on geomorphological criteria, i.e., 80% of the territory lying up to 600 m a.s.l. and/or difference in altitude within the municipal territory up to 600 m a.s.l. According to this classification, 59% of Calabrian territory is classified as mountainous: Cosenza P. and Reggio Calabria P. have the widest percentage of mountainous areas (70% and 65%, respectively) (Table 1).
2.2. Rainfall Indices
Regarding rainfall data (RD), the methodology is based on figures having a level of reliability certified by official agencies maintaining the local rainfall network made of an adequate number of gauges distributed within the study area.
The present analysis began by collecting records of one of the most frequently available parameters, that is, daily rainfall. Then, the second step was the selection of the most adequate rainfall indices (RIs) for comparison with the damage records. Table 2 shows the chosen indices, listing their acronyms and descriptions.
The indices were calculated for each gauge and for each year of the observation period. Given that the following evaluations were made on a district basis, for each district and for each year, a value of each RI indicated in Table 2 was calculated as the maximum value among the indices’ values estimated for each gauge within the district.
Then, the maximum value of the specific RI for each decade of the observation period was considered for the successive comparisons with the damage indices (Figure 1).
In this paper, in addition to the RI in Table 2, calculated as previously described, we propose some composite rainfall indices (CRIs), evaluated as the geometric mean of two or more than two RIs. Usually, in fact, the geometric mean is useful in order to compare parameters with very different properties, and it is used in several fields (i.e., the ESAI method in the evaluation of the desertification phenomena, the average growth rate in finance, faecal concentrations in water-quality identification, etc.).
The composite rainfall index is calculated by means of the following Formula (1):
where is the kth rainfall index normalized, that is, the ratio between the rainfall index evaluated for the district, as described above, and the average value of the same rainfall index and district (average for the decade of the yearly values averaged for all the gauges in the district). In this way, the values of the obtained normalized rainfall indices have similar magnitudes.
In Table 3, the CRIs proposed in this work are listed with the RIs used for calculating each of them. For each CRI, we have aggregated information about the total yearly rainfall (RTa) with one or more other items of information linked to the other RIs. In this way, in addition to the yearly precipitation, the CRI1 and the CRI2 also furnish information on the major daily rainfall data, the CRI3 gives us information on the more prolonged rainfall events, the CRI4 provides data about the more intense and prolonged rainfall events, and, finally, the CRI5 aggregates all the information related to the RIs used in this study.
2.3. Damage Indices
Concerning Damage Data (DD), we focus on the direct damage caused by landslides and floods triggered by rain, which includes physical effects such as the destruction and modifications that reduce the functionality of structures, roads, and services, in addition to damage to people (death/injury), buildings, their contents, and vehicles, regardless of the severity level of the damage. As “damage gauges”, we assumed the municipalities of the study region corresponding to LAU level 1 (local administrative units), formerly NUTS level 4 in the Nomenclature of Territorial Units for Statistics defined by Eurostat. Then, for each day of the study period, we are interested only in the cases in which one or more municipalities were “damaged”.
We detected the occurrence of damaging floods and landslides by referring to published news reports, because sources such as technical–scientific reports and surveys focus only on either the most destructive phenomena or those presenting particular scientific interest. In contrast, the present methodology is based on the occurrence of all the landslides and floods that caused damage in the study region, regardless of the damage severity level. Generally, there are no agencies officially collecting damage data, and the literature widely recognizes that documentary sources—particularly daily newspapers—remain the foundation for the construction of damage catalogues, as they are the only sources reporting information with a good level of reliability, even if with the limitations widely reported in the literature [30,30,32].
Our Damage Database (DDb) is structured using damage records at municipal scale with a time resolution of one day and chronologically ordered.
At the end of data gathering, for each municipality, the DDb contained the historical series of damage that occurred because of either landslides or floods. At this step, the daily series of DD for each municipality was aggregated to yearly scale, and finally to decadal and provincial scale, thus consistently bringing together the information contained (Figure 1).
For each year, the municipal yearly index (MYI) is the total number of days in which the municipality was damaged. Moving to the vertex of the pyramid, the final result is then the provincial decadal complex index (PDCI), reassuming DD in one complex index per each province and decade analyzed.
After these steps, it is possible to compare the provincial damage indices (assessed with different time scales) with the indices derived from either rainfall data or demographic data processing, for example, as long as they are aggregated at the same geographical and temporal scales.
2.4. Crosschecking Analysis of Rainfall and Damage Data
Once both rainfall indices and damage indices were rescaled at the provincial and decadal scale, their comparison was performed using a statistical approach.
The comparisons between the rainfall indices (RI and CRI) and the damage records were carried out by means of the Pearson correlation index [33], where X and Y are the two variables (the damage index and the RI or CRI). The Pearson correlation is defined as the ratio between the covariance of the two variables and the product of the standard deviation of each variable:
If the absolute value of is lower than 0.3, the correlation is weak; if it is between 0.3 and 0.7, the correlation is moderate; if it is higher than 0.7, the correlation is strong.
2.5. Damage Database
The DDb comes from a Calabrian database resulting from the constant monitoring of flood and landslide impacts on the region, which has been conducted since 1970 by researchers at the CNR-IRPI of Cosenza (Research Institute for Geo-Hydrological Protection) and updated by the systematic survey of data sources on a daily basis. Data were mined from both local and national newspapers, web sites, reports from both national and regional agencies, and public offices, as well as post-event field surveys. For the 40-year temporal window going from 1980 to 2020, for the 404 municipalities of the region, the DDb contains 16,670 damage records, almost equally caused by floods (47%) and landslides (53%) (Figure 3). It is worth mentioning that a damage record can be related to the occurrence of one or more landslide or flood in a selected municipality, or even to the occurrence of both types of damaging phenomena. Then, damage data were clustered by province and decade by means of the complex damage indices.
2.6. Rainfall Database
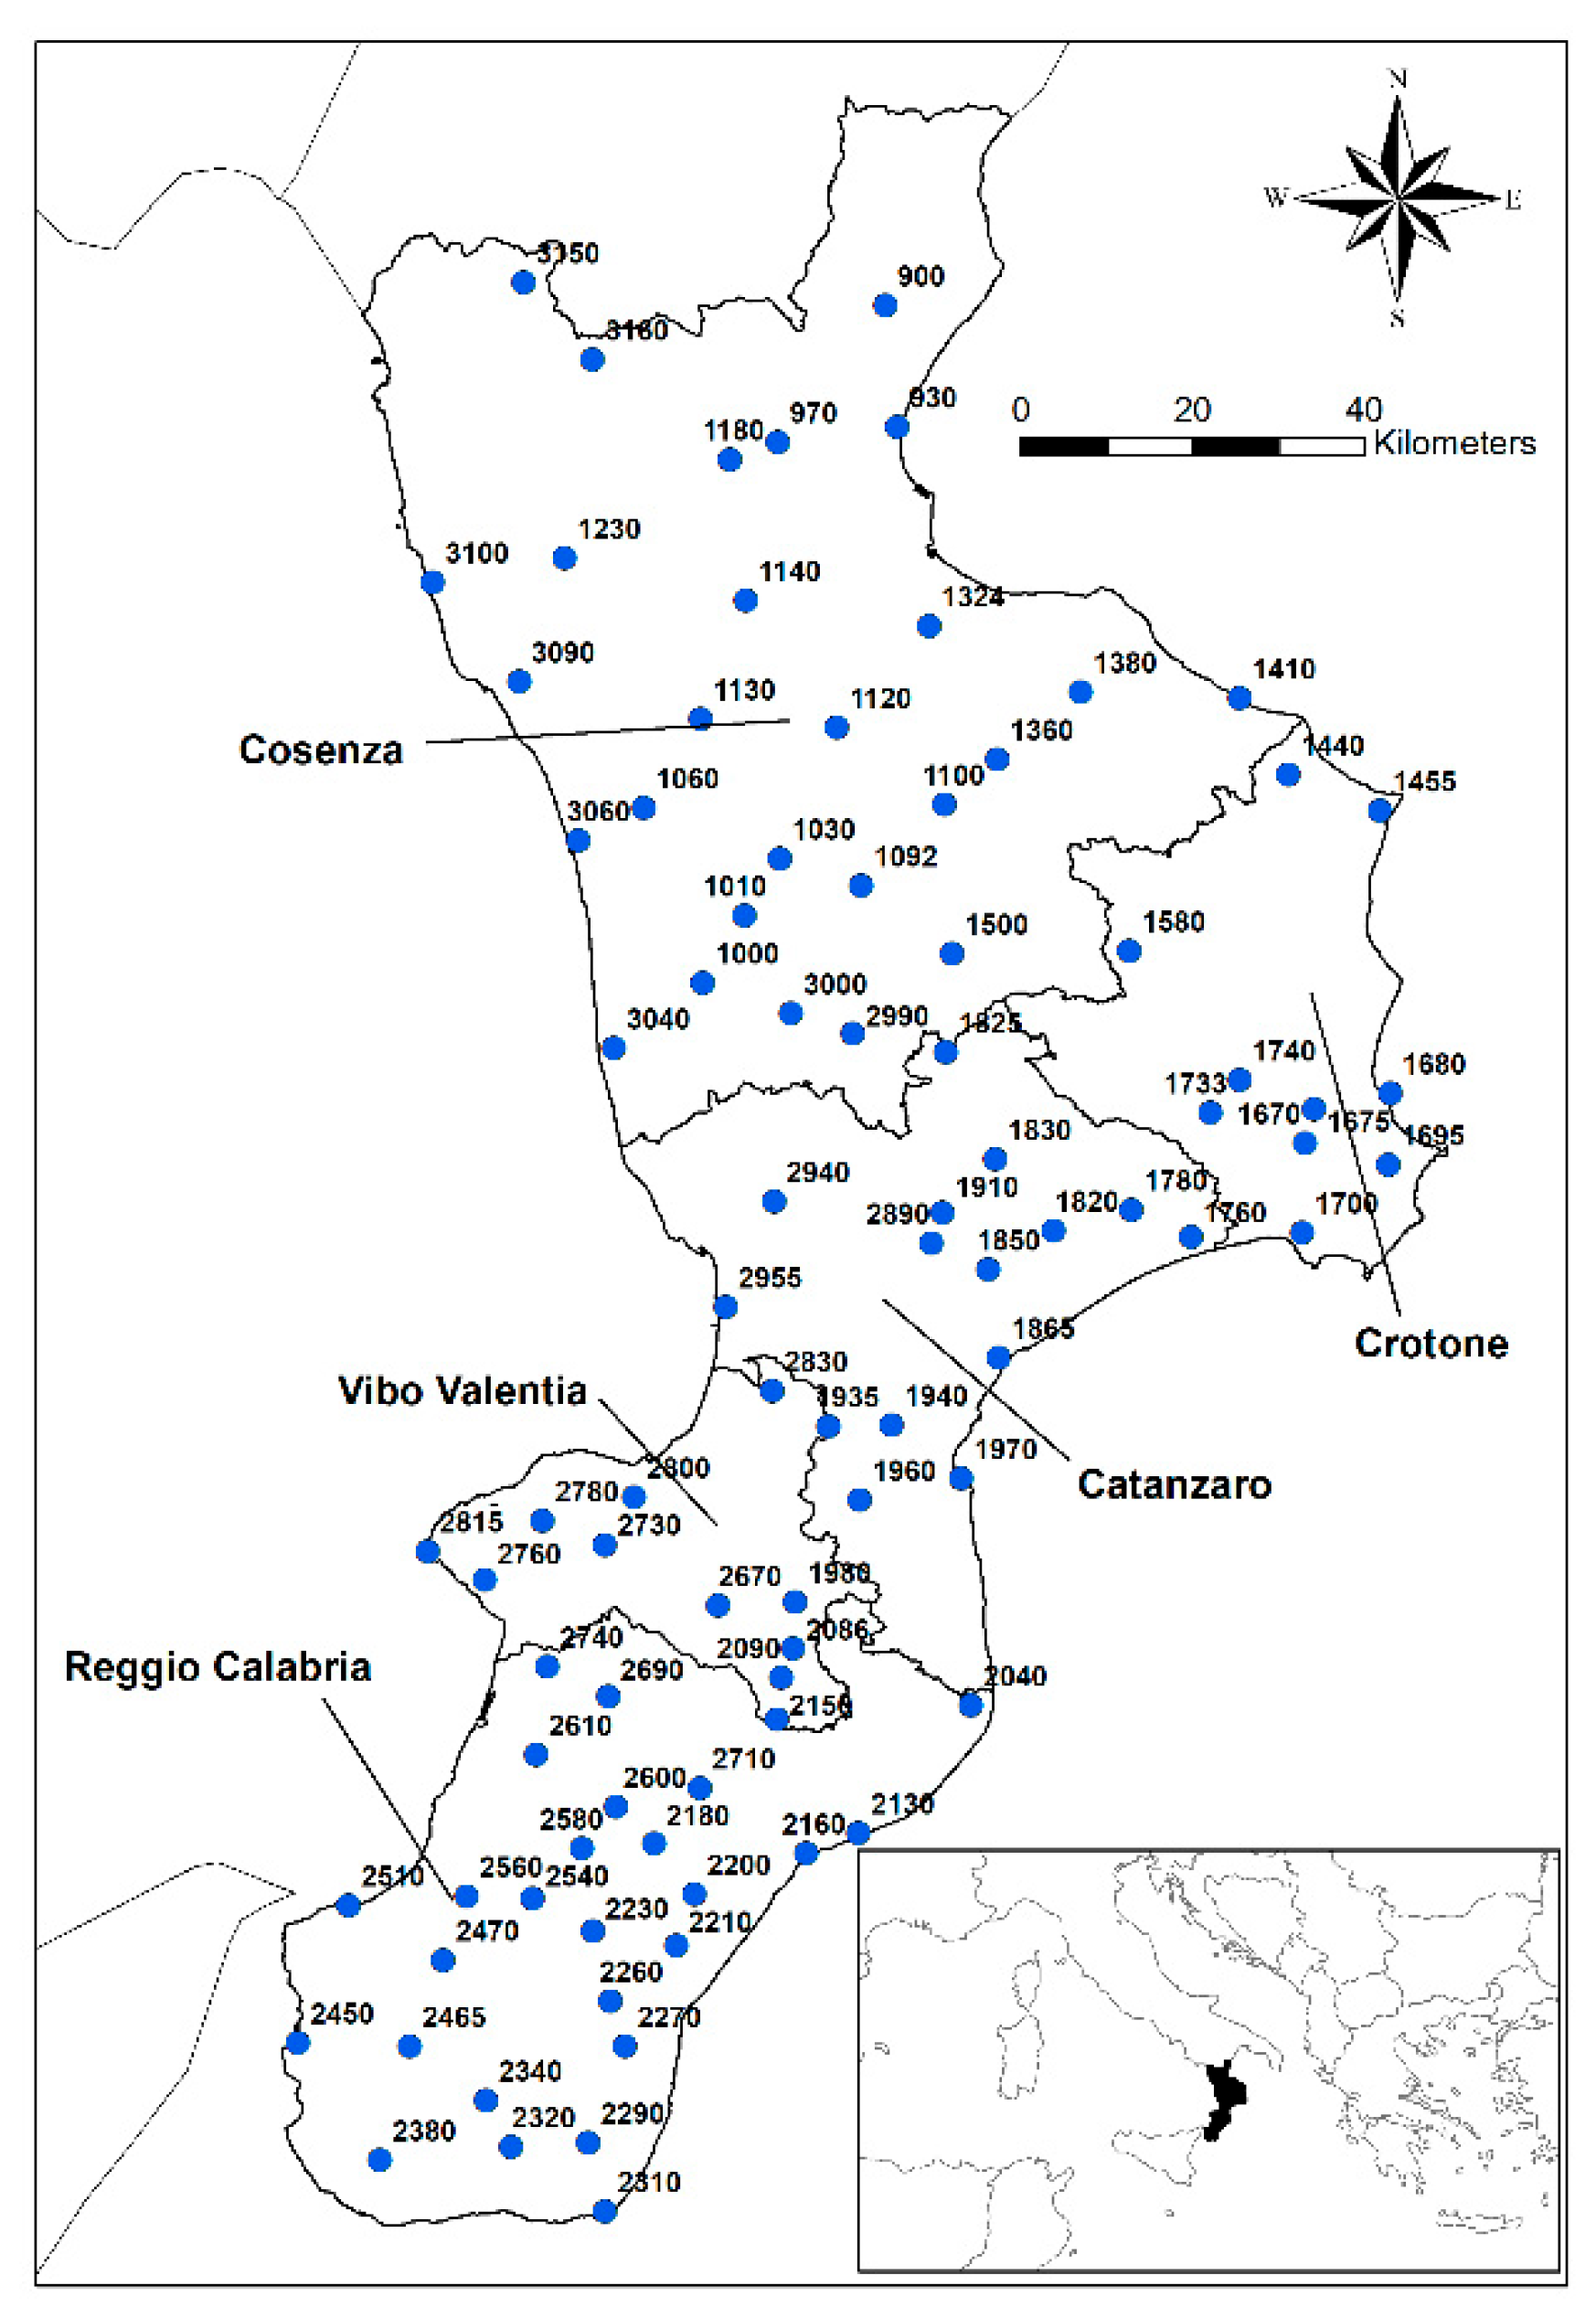
The RDb includes the climatic data registered in on-site stations located in the study area. The Hydrographic and Mareographic Centre of Catanzaro previously maintained the data recorded in all the climatic stations (running from 1916 with various start years), and the ARPACAL Multi-Risk Functional Center is presently in charge of such data (Figure 4 and Table 4). The series, already processed in earlier research (e.g., [24]), were checked regarding homogeneity. For the aims of this study, we chose the observation period from 1981–2020 and, given the characteristics of the RIs, we used daily data. For these reasons, the datasets used in previous works were updated with new data from the ARPACAL Center, checked regarding their quality and uploaded into the RDb.
Regarding missing data, the year was deleted when a station was missing at least one day’s data. However, there were not many missing data; therefore, each station has a higher-than-average proportion of useable years for calculating the RI. Finally, 89 gauges were selected for the study region. This means that about 32,500 daily records were available for each year, contributing to a total of about 1,300,000 records covering the entire observation period.
3. Results
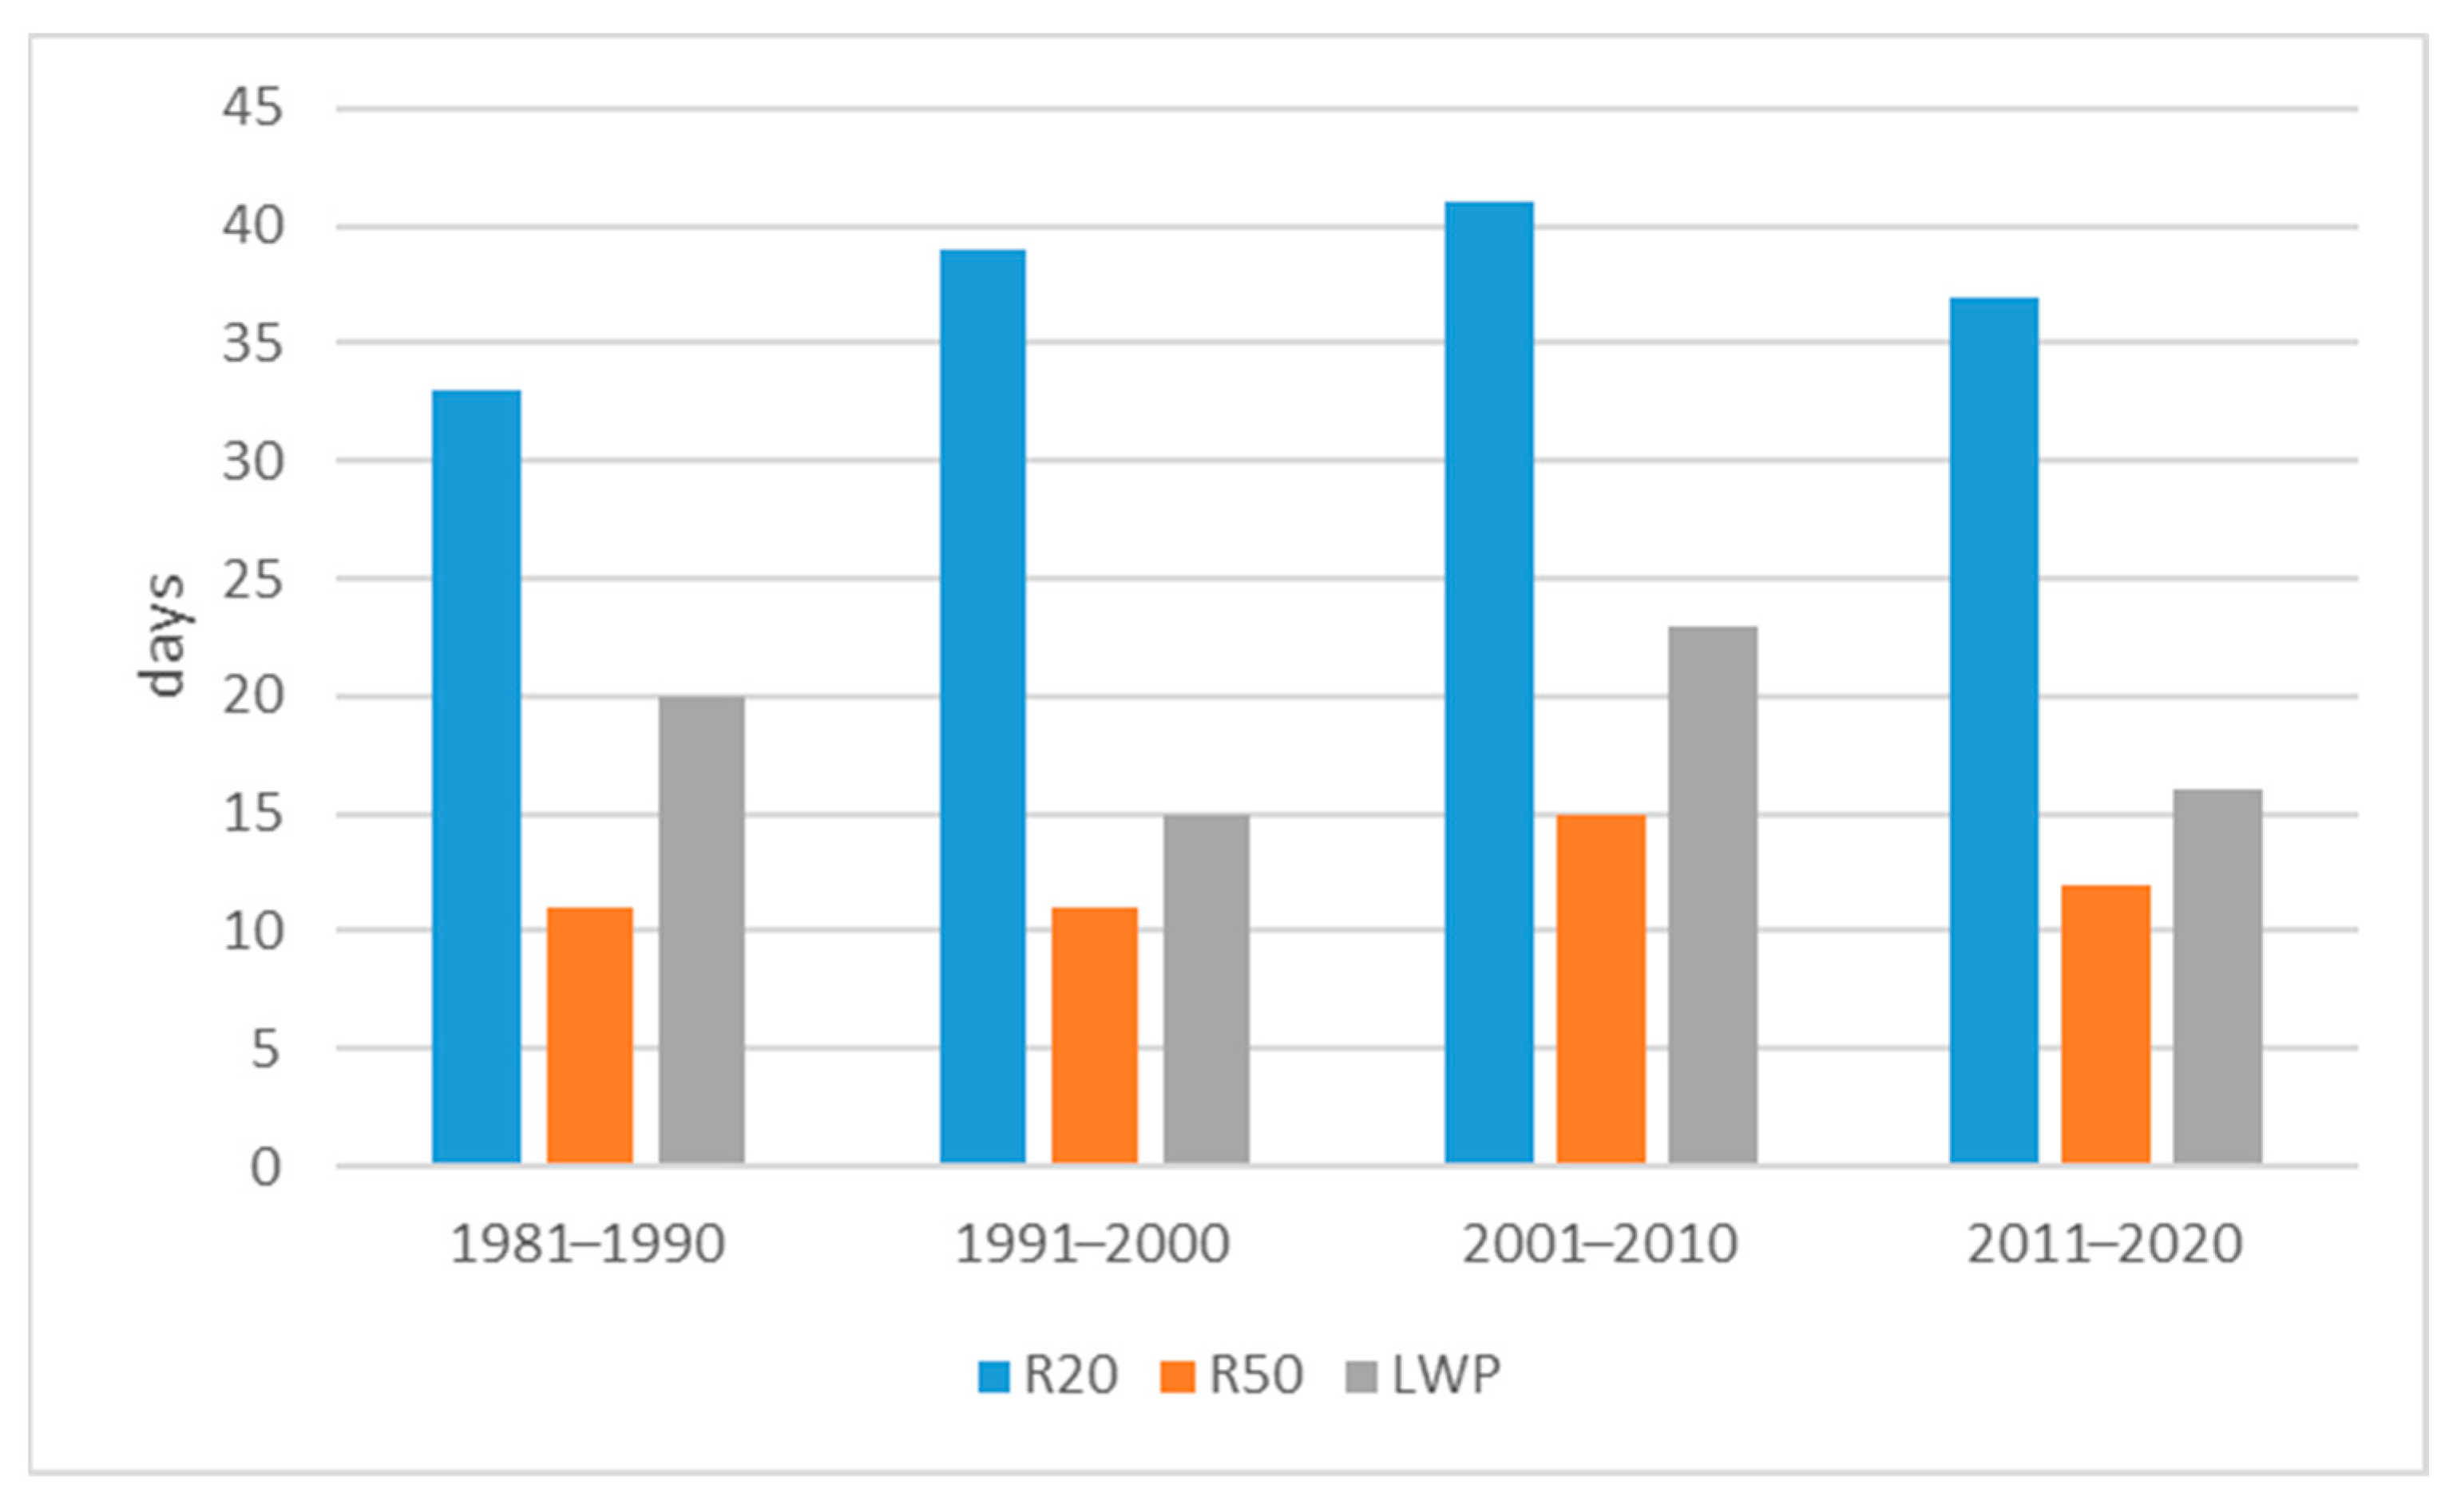
Table 5 shows the results obtained regarding the RIs chosen for each decade and for each province; in the last column, the mean value of each RI over the observation year is also indicated. The results evidence that the RIs related to the most extreme events (R20 and R50) showed the highest values in Reggio Calabria P. Conversely, the RTa index, representing the amount of precipitation in the year, shows different results: Vibo Valentia P. and Cosenza P. showed average values of yearly rainfall higher than the other provinces (2423 mm and 2303 mm, respectively). Regarding the duration of rainfall events, indicated by the LWP index, Reggio Calabria P. showed the highest mean value (20 days), with peaks of 25 days in the periods 1981–1990 and 1991–2000. Conversely, Catanzaro P. registered the lowest mean value (13.25 days), even though this district showed the highest value of RX5d (522.3 mm), with a peak of 621.80 mm in the period 2001–2010. Observing the values for each decade, a clear tendency does not appear for any RI. As an example, Figure 5 shows data of R20, R50, and LWP for each decade for Cosenza P.
Table 6 shows the CRIs for each decade and for each province, and the mean values for the whole observation period: the lowest value (1.61) pertains to Vibo Valentia P. for the first decade. The highest value (4.66) was calculated for CRI2 and for Cosenza P. in the decade 2001–2010. Regarding the mean CRI values, the lowest value (1.81) was obtained for CRI3 calculated for Crotone P., and the highest (3.94) for CRI2 calculated by means of the Cosenza P. data. Always referring to the average values, Cosenza P. showed the highest values for almost all the CRIs, with only the exception of CRI3 (the highest value was calculated for Reggio Calabria P. and for CRI3). For each province, CRI2 is the composite index with the highest mean values compared with the other CRIs, except for Catanzaro P. where the highest mean value (2.56) was obtained for both CRI2 and CRI4. Regarding the CRI2 data, Reggio Calabria P. also showed relevant data (an average of 3.67 days with a peak of 4.17 in the decade 1991–2000). Conversely, for the other provinces, the mean data are much lower (2.92 for Vibo Valentia P., 2.56 for both Catanzaro P. and Crotone P.); among these three provinces, the peak, equal to 3.66, was calculated for Crotone P. in the decade 1991–2000. CRI5 also presents high values, especially for Cosenza P. and Reggio Calabria P., for both the mean values (3.17 and 2.97, respectively) and the values per decade (3.83 for Cosenza P. in the decade 2001–2010, 3.40 for Reggio Calabria P. in the decade 1991–2000). The lowest value (2.05) was calculated for Crotone P. (2001–2010). Regarding CRI3, also containing information about long rainfall events, as mentioned above, Reggio Calabria P. presents the highest mean value (2.57), with a peak of 3.11 for the decade 1991–2000. For the other provinces, the average and the peak values are much lower, especially for Crotone P. and Catanzaro P. Regarding CRI4, which also provides information about extreme prolonged rainfall events by means of the index RX5d contained within it, the highest average value was calculated for Cosenza P. (2.72), with a peak of 3.35 (2001–2010 decade), but Catanzaro P. and Reggio Calabria P. also present similar average values (2.56 and 2.60, respectively). The lowest value was calculated for Vibo Valentia P. (1.91 for the 1981–1990 decade).
4. Discussion
Table 7 and Table 8 show the values of the Pearson correlation index obtained comparing all the data of DHEs, landslides, and floods, with RIs and CRIs, respectively, calculated considering the whole region.
Regarding the comparisons with the RIs, the highest values of the Pearson correlation index were obtained using the R20 index. The peak was calculated for the match of floods vs. R20 (0.604955), but the comparisons with DHEs and landslides also presented similar values of the Pearson index (0.574028 and 0.589547, respectively), indicating a moderate correlation. Conversely, the values of the Pearson index obtained in the comparisons with RX5d were very low; even the values in the matches of RX5d with DHEs and landslides were negative. With only the exception of the cited match with the R20 index, the comparisons of floods data with the other RIs presented very low values of the Pearson index (the lowest, equal to 0.028983, concerns the match of floods vs. RX5d), indicating weak correlations.
The Pearson index values obtained in the comparisons of DHEs, floods, and landslides with the CRIs were higher than those provided by the matches with RIs for almost all the combinations, with a clear improvement for the comparisons with floods, even though for these comparisons the values of the Pearson index remain lower than those obtained with DHEs and landslides. As Table 8 shows, the highest value was obtained in the comparison between landslides and CRI5 (0.79570, indicating a strong correlation), but the match of the same CRI with DHEs and the comparison CRI2 vs. landslides also present values indicating strong correlations (0.73527 and 0.73099, respectively).
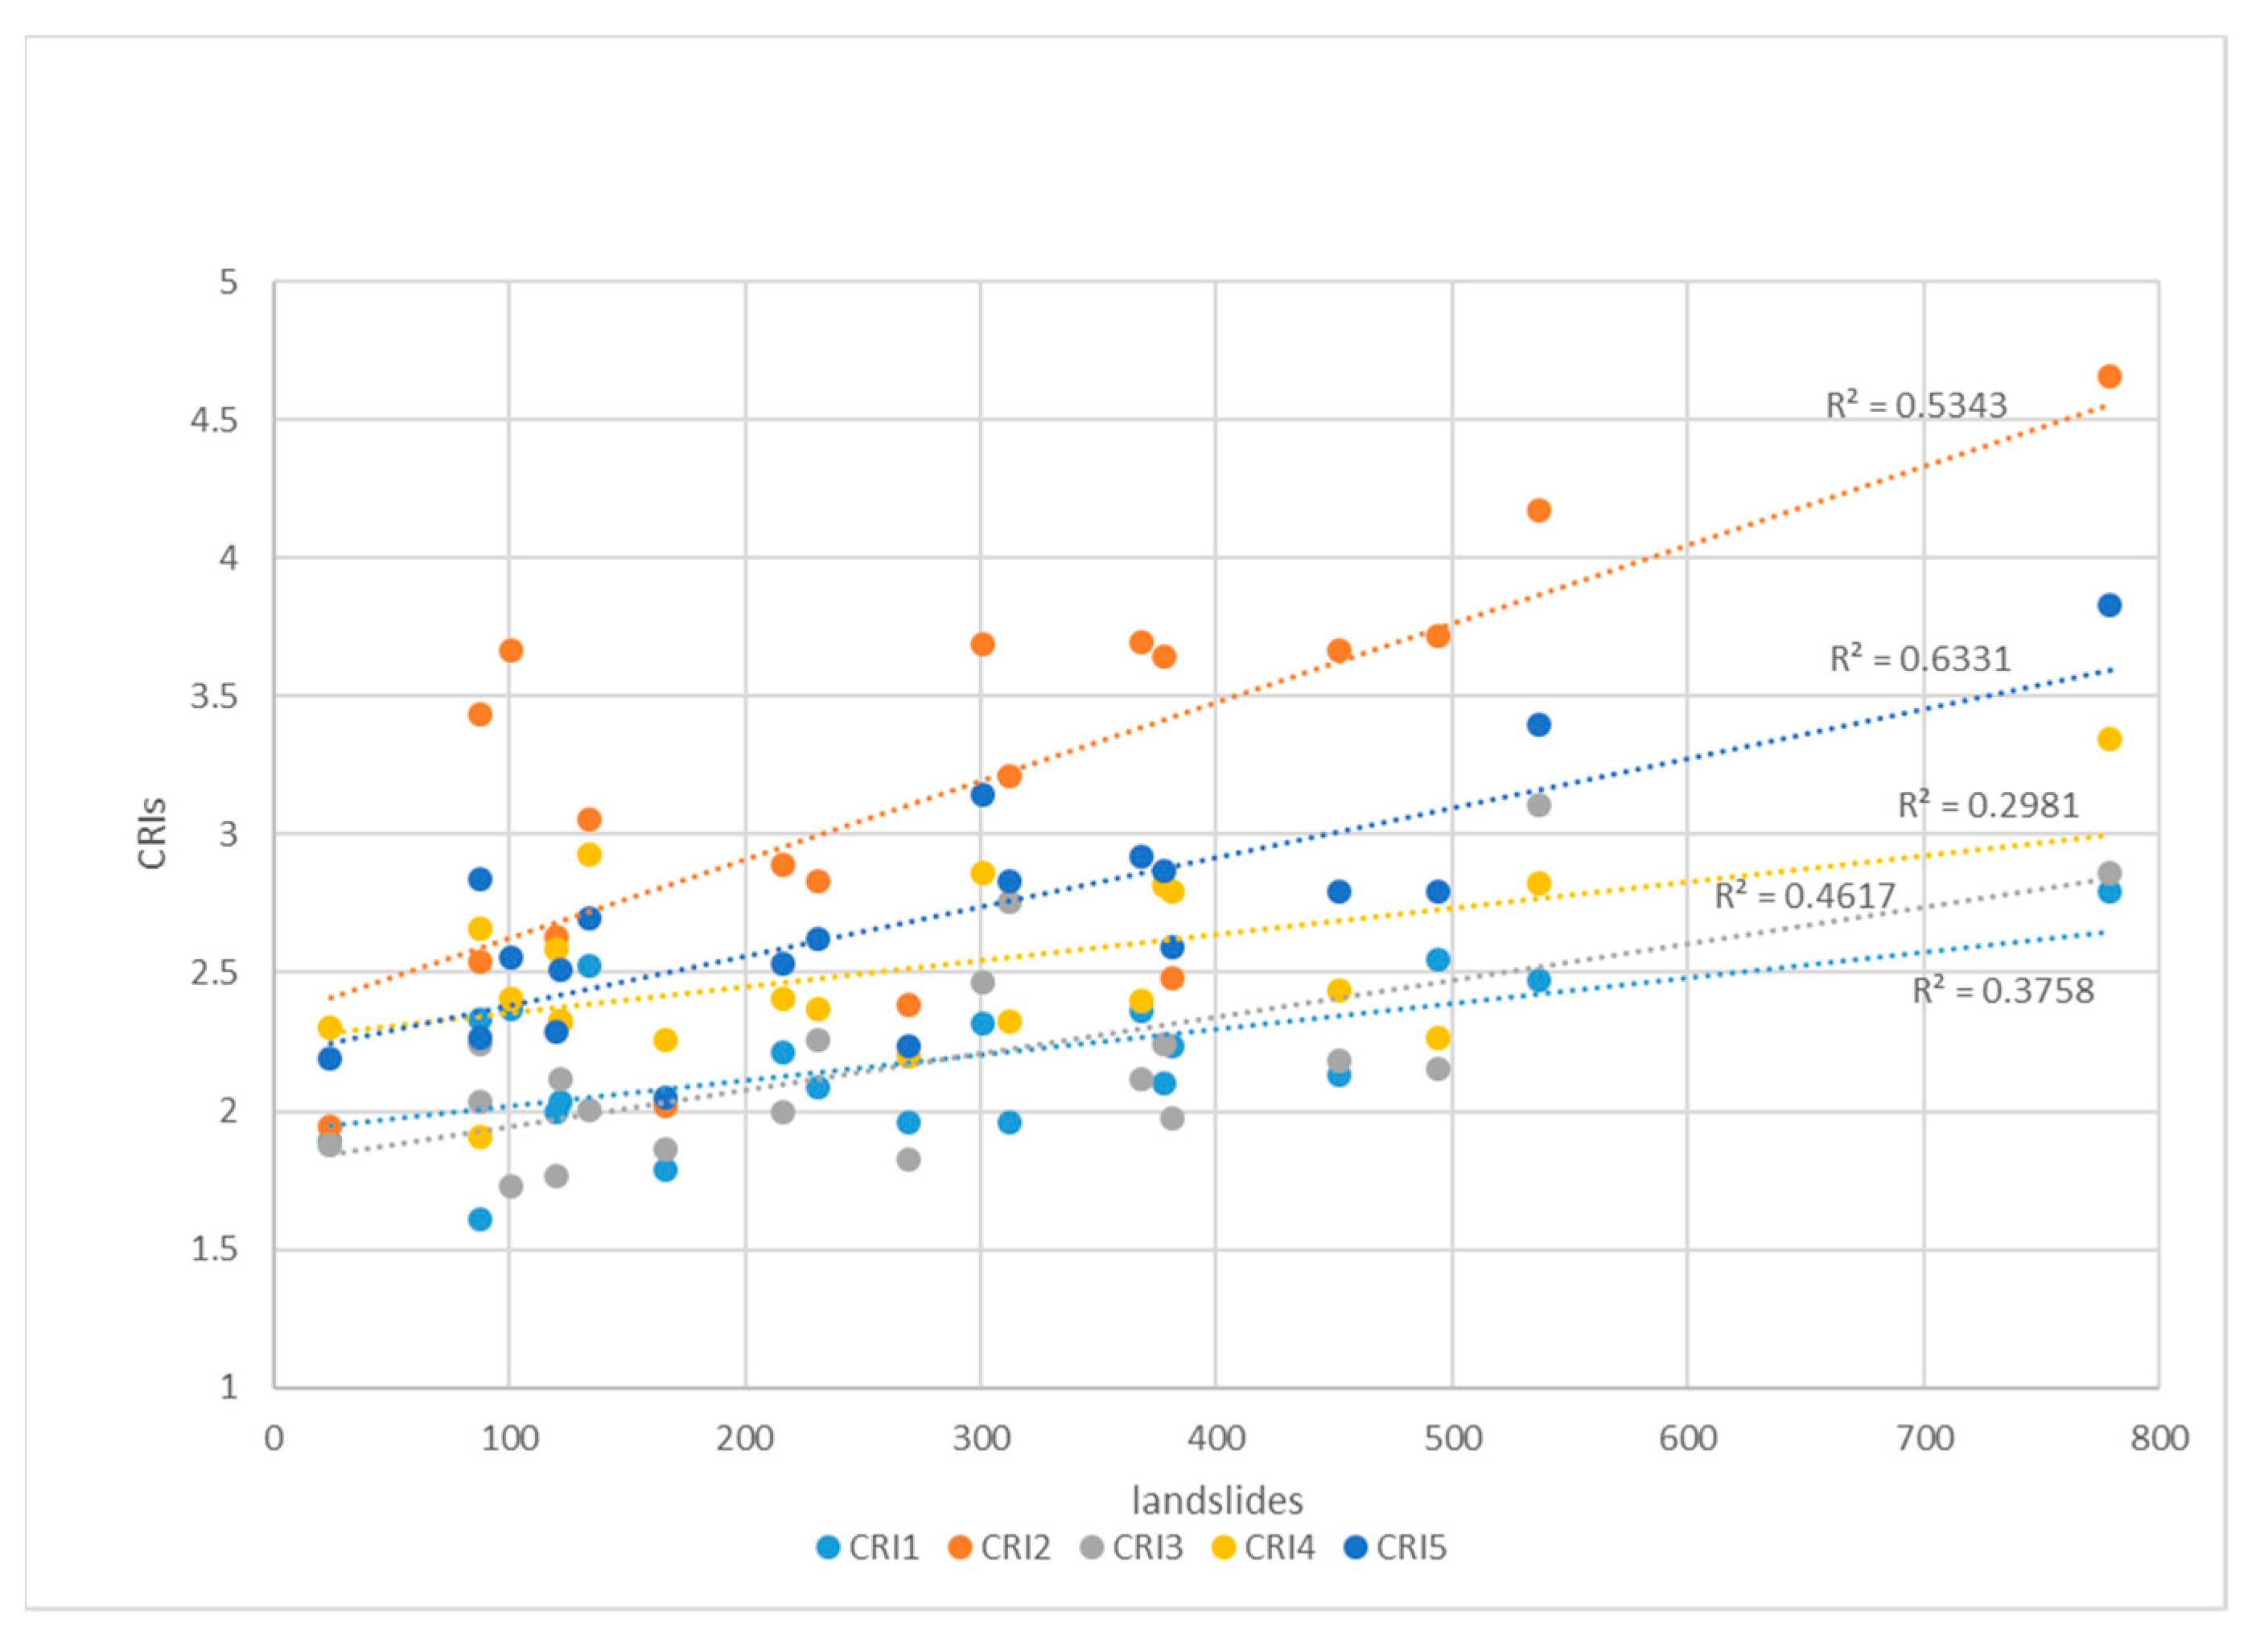
Figure 6 shows the sample points and the interpolation lines with indication of R2 for all the comparisons with landslides. The weakest correlations are for the matches of floods with CRI1 and with CRI4, for which the Pearson indices are equal to 0.34612 and 0.37014, respectively.
All the results of these comparisons put in evidence that the matches of RIs and CRIs with landslides showed the highest values of the Pearson index; conversely, the comparisons with floods presented the lowest values, with only the exception of the comparison of floods with R20. This may be due to the particularity of the rivers of the region that present a torrential regime, mainly influenced by heavy and short sub-daily rainfall events, as also highlighted by Coscarelli et al. [24]. The impacts of these pluviometric events could be better analyzed by means of an hourly rainfall database, which represents a possible future perspective. Globally, the better results obtained with CRIs than those with RIs can be explained by the more complete informative contents present in the CRIs, including information about both prolonged rainfall events and relevant daily events. In this way, the comparison with landslides is improved, given that some landslides are triggered by long rainfall events and other ones by events concentrated in a few days, depending on geological, geomorphological, and geometric features of the affected slopes.
5. Conclusions
This study investigates relationships between rainfall and rainfall-related damaging phenomena in the form of landslides and floods, including in their simultaneous occurrence, named damaging hydrogeological events (DHEs), using an index-based methodological approach.
As a case study, we present the application of the methodology to Calabria (Southern Italy). We used (a) an extensive database of landslide and flood damage that occurred in Calabria throughout 40 years (1981–2020), containing 16,670 records, and (b) a daily rainfall database for the same region in the same period, containing about 1,300,000 data. To assess both damage and rainfall indices, we applied a three-step procedure by (a) collecting data, (b) aggregate data to municipal level, and (c) obtaining indices at the provincial level. With the aim of assessing the “better” index to describe DHE, five rainfall indices (RIs) were tested and five composite rainfall indices (CRIs), combinations of two or more RIs containing information regarding both intense daily rainfall and prolonged rainfall events, are proposed. Results showed better results for the comparisons between landslides and those CRIs containing more information regarding rainfall events, because the triggering of landslides can be due to prolonged rainfall events or heavy daily events. This manuscript can be considered a preliminary investigation that could continue, from future perspectives, by applying different temporal aggregations, moving averages, or other techniques and also trying to detect eventual temporal trends. Moreover, given that the worst results were obtained in the comparison of RIs and CRIs with floods for the torrential regime characterizing the rivers of the region, a future development of the study could be an analogous procedure based on sub-daily rainfall data that could influence the flash flood events of the study area.
Author Contributions
Conceptualization, O.P. and R.C.; methodology, O.P. and R.C.; software, R.C.; validation, O.P. and R.C.; formal analysis, O.P.; investigation, R.C.; resources, O.P. and R.C.; data curation, O.P. and R.C.; writing—original draft preparation, O.P. and R.C.; writing—review and editing, O.P.; visualization, R.C. All authors have read and agreed to the published version of the manuscript.
Funding
The paper has been funded by means of the following internal Projects: “IPER—Increase People Resilience to Damaging Hydrogeological Events in Calabria” and “OTOMARI—Outputs of Tool and Methodology Applications on Rainfall distribution and trends and consequent Impacts”—project Area of the CNR Department of Earth System Sciences and Environmental Technologies—AP3, Environmental, Natural and Anthropic Risks.
Data Availability Statement
The data presented in this study are available upon request.
Conflicts of Interest
The authors declare no conflict of interest.
References
- Caloiero, T.; Pasqua, A.A.; Petrucci, O. Damaging Hydrogeological Events: A Procedure for the Assessment of Severity Levels and an Application to Calabria (Southern Italy). Water 2014, 6, 3652–3670. [Google Scholar] [CrossRef]
- Petrucci, O.; Pasqua, A.A. The Study of Past Damaging Hydrogeological Events for Damage Susceptibility Zonation. Nat. Hazards Earth Syst. Sci. 2008, 8, 881–892. [Google Scholar] [CrossRef]
- Tesselaar, M.; Botzen, W.J.W.; Aerts, J.C.J.H. Impacts of Climate Change and Remote Natural Catastrophes on EU Flood Insurance Markets: An Analysis of Soft and Hard Reinsurance Markets for Flood Coverage. Atmosphere 2020, 11, 146. [Google Scholar] [CrossRef]
- Pollock, W.; Wartman, J. Human Vulnerability to Landslides. GeoHealth 2020, 4, e2020GH000287. [Google Scholar] [CrossRef]
- Papagiannaki, K.; Petrucci, O.; Diakakis, M.; Kotroni, V.; Aceto, L.; Bianchi, C.; Brázdil, R.; Gelabert, M.G.; Inbar, M.; Kahraman, A. Developing a Large-Scale Dataset of Flood Fatalities for Territories in the Euro-Mediterranean Region, FFEM-DB. Sci. Data 2022, 9, 166. [Google Scholar] [CrossRef] [PubMed]
- Argyroudis, S.A.; Mitoulis, S.; Winter, M.G.; Kaynia, A.M. Fragility of Transport Assets Exposed to Multiple Hazards: State-of-the-Art Review toward Infrastructural Resilience. Reliab. Eng. Syst. Saf. 2019, 191, 106567. [Google Scholar] [CrossRef]
- Diodato, N.; Borrelli, P.; Panagos, P.; Bellocchi, G. Global Assessment of Storm Disaster-Prone Areas. PLoS ONE 2022, 17, e0272161. [Google Scholar] [CrossRef]
- Ozturk, U.; Bozzolan, E.; Holcombe, E.A.; Shukla, R.; Pianosi, F.; Wagener, T. How Climate Change and Unplanned Urban Sprawl Bring More Landslides. Nature 2022, 608, 262–265. [Google Scholar] [CrossRef]
- Reshma, R.; Kuiry, S.N. Impact of Encroachment of Floodplains of Adyar River on Chennai Floods. In Proceedings of the International Conference on Hydraulics, Water Resources and Coastal Engineering; Springer: Singapore, 2021; pp. 1–12. [Google Scholar]
- Gatto, A.; Clò, S.; Martellozzo, F.; Segoni, S. Tracking a Decade of Hydrogeological Emergencies in Italian Municipalities. Data 2023, 8, 151. [Google Scholar] [CrossRef]
- Barbaro, G.; Petrucci, O.; Canale, C.; Foti, G.; Mancuso, P.; Puntorieri, P. Contemporaneity of Floods and Storms. A Case Study of Metropolitan Area of Reggio Calabria in Southern Italy. In Proceedings of the Smart Innovation, Systems and Technologies; Springer: Berlin/Heidelberg, Germany, 2019; Volume 101, pp. 614–620. [Google Scholar]
- Segoni, S.; Caleca, F. Definition of Environmental Indicators for a Fast Estimation of Landslide Risk at National Scale. Land 2021, 10, 621. [Google Scholar] [CrossRef]
- Heink, U.; Kowarik, I. What Are Indicators? On the Definition of Indicators in Ecology and Environmental Planning. Ecol. Indic. 2010, 10, 584–593. [Google Scholar] [CrossRef]
- Ivčević, A.; Mazurek, H.; Siame, L.; Moussa, A.B.; Bellier, O. Indicators in Risk Management: Are They a User-Friendly Interface between Natural Hazards and Societal Responses? Challenges and Opportunities after UN Sendai Conference in 2015. Int. J. Disaster Risk Reduct. 2019, 41, 101301. [Google Scholar] [CrossRef]
- Cutter, S.L. The Landscape of Disaster Resilience Indicators in the USA. Nat. Hazards 2016, 80, 741–758. [Google Scholar] [CrossRef]
- Hammond, A.L.; World Resources Institute. Environmental Indicators: A Systematic Approach to Measuring and Reporting on Environmental Policy Performance in the Context of Sustainable Development; World Resources Institute: Washington, DC, USA, 1995; Volume 36. [Google Scholar]
- Wong, H.T.; Chau, C.W.; Guo, Y.; Chiou, S.M.J. Disaster Risk and Elderly in the Asia-Pacific Region. Int. J. Disaster Risk Reduct. 2019, 41, 101278. [Google Scholar] [CrossRef]
- Burić, D.; Luković, J.; Bajat, B.; Kilibarda, M.; Živković, N. Recent Trends in Daily Rainfall Extremes over Montenegro (1951–2010). Nat. Hazards Earth Syst. Sci. 2015, 15, 2069–2077. [Google Scholar] [CrossRef]
- Kutiel, H.; Trigo, R.M. The Rainfall Regime in Lisbon in the Last 150 Years. Theor. Appl. Climatol. 2014, 118, 387–403. [Google Scholar] [CrossRef]
- Anđelković, G.; Jovanović, S.; Manojlović, S.; Samardžić, I.; Živković, L.; Šabić, D.; Gatarić, D.; Džinović, M. Extreme Precipitation Events in Serbia: Defining the Threshold Criteria for Emergency Preparedness. Atmosphere 2018, 9, 188. [Google Scholar] [CrossRef]
- Aceto, L.; Caloiero, T.; Pasqua, A.A.A.; Petrucci, O. Analysis of Damaging Hydrogeological Events in a Mediterranean Region (Calabria). J. Hydrol. 2016, 541, 510–522. [Google Scholar] [CrossRef]
- Petrucci, O.; Gulla, G. A Simplified Method for Assessing Landslide Damage Indices. Nat. Hazards 2010, 52, 539–560. [Google Scholar] [CrossRef]
- Alexander, L.V.; Fowler, H.J.; Bador, M.; Behrangi, A.; Donat, M.G.; Dunn, R.; Funk, C.; Goldie, J.; Lewis, E.; Rogé, M.; et al. On the Use of Indices to Study Extreme Precipitation on Sub-Daily and Daily Timescales. Environ. Res. Lett. 2019, 14, 125008. [Google Scholar] [CrossRef]
- Coscarelli, R.; Aguilar, E.; Petrucci, O.; Vicente-Serrano, S.M.; Zimbo, F. The Potential Role of Climate Indices to Explain Floods, Mass-Movement Events and Wildfires in Southern Italy. Climate 2021, 9, 156. [Google Scholar] [CrossRef]
- Polemio, M.; Petrucci, O. The Occurrence of Floods and the Role of Climate Variations from 1880 in Calabria (Southern Italy). Nat. Hazards Earth Syst. Sci. 2012, 12, 129–142. [Google Scholar] [CrossRef]
- Petrucci, O.; Polemio, M.; Pasqua, A.A. Flash Floods Risk Variation of Steep Drainage Basins in Calabria (Italy) and the Role of Rainfall and Anthropogenic Modifications since 1800. In Global Change: Facing Risks and Threats to Water Resources; International Association of Hydrological Sciences (IAHS): Wallingford, Oxfordshire, UK, 2010; Volume 340, pp. 103–110. ISBN 978-1-907161-13-1. [Google Scholar]
- Petrucci, O.; Pasqua, A.A.; Polemio, M. Flash Flood Occurrences since the 17th Century in Steep Drainage Basins in Southern Italy. Environ. Manag. 2012, 50, 807–818. [Google Scholar] [CrossRef]
- Koppen, W. Das geographische system der klimate. In Handbuch der Klimatologie; Teil, I.C., Ed.; Gebrüder Borntraeger: Berlin, Germany, 1936. [Google Scholar]
- Caroletti, G.N.; Coscarelli, R.; Caloiero, T. A Sub-regional Approach to the Influence Analysis of Teleconnection Patterns on Precipitation in Calabria (Southern Italy). Int. J. Climatol. 2021, 41, 4574–4586. [Google Scholar]
- Gullà, G.; Caloiero, T.; Coscarelli, R.; Petrucci, O. A Proposal for a Methodological Approach to the Characterisation of Widespread Landslide Events: An Application to Southern Italy. Nat. Hazards Earth Syst. Sci. 2012, 12, 165–173. [Google Scholar] [CrossRef]
- Zêzere, J.L.; Pereira, S.; Tavares, A.O.; Bateira, C.; Trigo, R.M.; Quaresma, I.; Santos, P.P.; Santos, M.; Verde, J. DISASTER: A GIS Database on Hydro-Geomorphologic Disasters in Portugal. Nat. Hazards 2014, 72, 503–532. [Google Scholar] [CrossRef]
- Santos, M.; Fragoso, M.; Santos, J.A. Damaging Flood Severity Assessment in Northern Portugal over More than 150 Years (1865–2016). Nat. Hazards 2018, 91, 983–1002. [Google Scholar] [CrossRef]
- Pearson, K., VII. Note on Regression and Inheritance in the Case of Two Parents. Proc. R. Soc. London 1895, 58, 240–242. [Google Scholar]
Figure 1.
Methodological approach to aggregate rainfall and damage data.

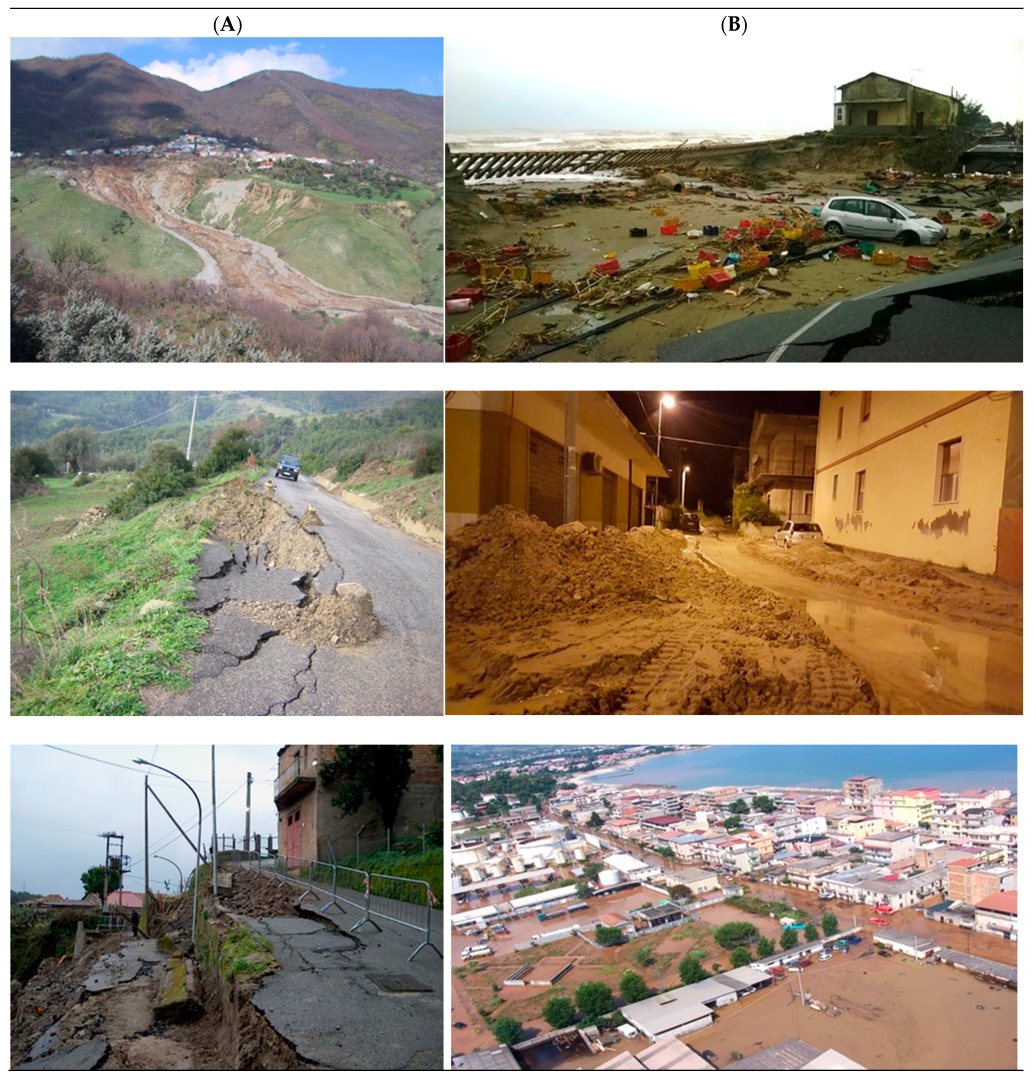
Figure 3.
Typical examples of damage caused during the study period in Calabria by landslides (column (A)) and floods (column (B)).
Figure 3.
Typical examples of damage caused during the study period in Calabria by landslides (column (A)) and floods (column (B)).

Figure 4.
Locations of the rain gauges listed in Table 4.
Figure 4.
Locations of the rain gauges listed in Table 4.

Figure 5.
Values of R20, R50, LWP indices (days) for each decade, referring to the province of Cosenza.
Figure 5.
Values of R20, R50, LWP indices (days) for each decade, referring to the province of Cosenza.

Figure 6.
Comparisons between landslides and CRI values considering all the decades and provinces with indication of the values of R2 for each interpolation line.
Figure 6.
Comparisons between landslides and CRI values considering all the decades and provinces with indication of the values of R2 for each interpolation line.


Table 1.
Main geographical and administrative features of Calabria and provinces (https://www.istat.it/it/, accessed on 3 July 2023).
Table 1.
Main geographical and administrative features of Calabria and provinces (https://www.istat.it/it/, accessed on 3 July 2023).
| Provinces | Area (km2) | Municipalities (Number) | Mountainous Area (%) | Population Density (inh/km2) | |||
|---|---|---|---|---|---|---|---|
| 1991 | 2011 | 2011 | 2021 | ||||
| Cosenza | 6710 | 150 | 70 | 111.91 | 109.36 | 106.41 | 102.05 |
| Catanzaro | 2415 | 80 | 49 | 158.41 | 153.03 | 148.97 | 143.48 |
| Crotone | 1736 | 27 | 49 | 103.92 | 99.72 | 98.39 | 95.98 |
| Reggio Calabria | 3183 | 97 | 65 | 181.18 | 177.26 | 173.10 | 165.44 |
| Vibo Valentia | 1151 | 50 | 19 | 156.07 | 148.35 | 141.97 | 133.12 |
| Total | |||||||
| Calabria | 15,080 | 404 | 42.5 | 2,072,194 | 2,013,467 | 1,960,934 | 1,877,728 |
Table 2.
Rainfall indices (RIs) acronyms and descriptions.
| RI Acronym | Description |
|---|---|
| R20 | Annual count of days when precipitation was ≥20 mm (days) |
| R50 | Annual count of days when precipitation was ≥50 mm (days) |
| LWP | Maximum number of consecutive wet days * in a year (days) |
| RTa | Annual total rainfall value (mm) |
| RX5d | Maximum annual 5-daily precipitation value (mm) |
Note(s): * We define a wet day as a day with precipitation > 1 mm.
Table 3.
Composite rainfall indices (CRIs) and rainfall indices (RIs) used for their calculation by means of Formula (1).
Table 3.
Composite rainfall indices (CRIs) and rainfall indices (RIs) used for their calculation by means of Formula (1).
| CRI# | RIs |
|---|---|
| CRI1 | RTa–R20 |
| CRI2 | RTa–R50 |
| CRI3 | RTa–LWP |
| CRI4 | RTa–RX5d |
| CRI5 | RTa–R20–R50–LWP–RX5d |
Table 4.
Calabrian rain gauges, their ID numbers, and the abbreviation of the province where they are located (CS: Cosenza; CZ: Catanzaro; KR: Crotone; VV: Vibo Valentia; RC: Reggio Calabria).
Table 4.
Calabrian rain gauges, their ID numbers, and the abbreviation of the province where they are located (CS: Cosenza; CZ: Catanzaro; KR: Crotone; VV: Vibo Valentia; RC: Reggio Calabria).
| ID | Station Name | Province | ID | Station Name | Province |
|---|---|---|---|---|---|
| 900 | Albidona | CS | 2130 | Roccella Ionica | RC |
| 930 | Villapiana Scalo | CS | 2150 | Fabrizia–Cassari | VV |
| 970 | Cassano allo Ionio | CS | 2160 | Gioiosa Ionica | RC |
| 1000 | Domanico | CS | 2180 | Antonimina–Canolo N. | RC |
| 1010 | Cosenza | CS | 2200 | Antonimina | RC |
| 1030 | S. Pietro in Guarano | CS | 2210 | Ardore Superiore | RC |
| 1060 | Montalto Uffugo | CS | 2230 | Plati’ | RC |
| 1092 | Camigliatello–Mt Curcio | CS | 2260 | San Luca | RC |
| 1100 | Cecita | CS | 2270 | S.gata del Bianco | RC |
| 1120 | Acri | CS | 2290 | Staiti | RC |
| 1130 | Torano Scalo | CS | 2310 | Capo Spartivento | RC |
| 1140 | Tarsia | CS | 2320 | Bova Superiore | RC |
| 1180 | Castrovillari | CS | 2340 | Roccaforte del Greco | RC |
| 1230 | San Sosti | CS | 2380 | Montebello Ionico | RC |
| 1324 | Corigliano Calabro | CS | 2450 | Reggio Calabria | RC |
| 1360 | Longobucco | CS | 2465 | Cardeto | RC |
| 1380 | Cropalati | CS | 2470 | Gambarie d’Aspromonte | RC |
| 1410 | Cariati Marina | CS | 2510 | Scilla | RC |
| 1440 | Crucoli | KR | 2540 | S. Cristina d’Aspromonte | RC |
| 1455 | Ciro’ Marina–Punta Alice | KR | 2560 | Sinopoli | RC |
| 1500 | Nocelle–Arvo | CS | 2580 | Molochio | RC |
| 1580 | Cerenzia | KR | 2600 | Cittanova | RC |
| 1670 | Cutro | KR | 2610 | Rizziconi | RC |
| 1675 | Crotone–Papanice | KR | 2670 | Arena | VV |
| 1680 | Crotone | KR | 2690 | Feroleto della Chiesa | RC |
| 1695 | Crotone–Salica | KR | 2710 | Mammola–Limina C.C. | RC |
| 1700 | Isola C.R.–Campolongo | KR | 2730 | Mileto | VV |
| 1733 | Roccabernarda -Serrarossa | KR | 2740 | Rosarno | VV |
| 1740 | San Mauro Marchesato | KR | 2760 | Joppolo | VV |
| 1760 | Botricello | KR | 2780 | Zungri | VV |
| 1780 | Cropani | CZ | 2800 | Vibo Valentia | VV |
| 1820 | Soveria Simeri | CZ | 2815 | Capo Vaticano | VV |
| 1825 | Taverna–Ciricilla | CZ | 2830 | Filadelfia | VV |
| 1830 | Albi | CZ | 2890 | Tiriolo | CZ |
| 1850 | Catanzaro | CZ | 2940 | Nicastro–Bella | CZ |
| 1865 | Borgia–Roccelletta | CZ | 2955 | Lamezia Terme-Palazzo | CZ |
| 1910 | Gimigliano | CZ | 2990 | Parenti | CS |
| 1935 | Cenadi–Serralta | CZ | 3000 | Rogliano | CS |
| 1940 | Palermiti | CZ | 3040 | Amantea | CS |
| 1960 | Chiaravalle Centrale | CZ | 3060 | Paola | CS |
| 1970 | Soverato Marina | CZ | 3090 | Cetraro Superiore | CS |
| 1980 | Serra San Bruno | VV | 3100 | Belvedere Marittimo | CS |
| 2040 | Monasterace–Punta Stilo | RC | 3150 | Laino Borgo | CS |
| 2086 | Mongiana | VV | 3160 | Campotenese | CS |
| 2090 | Fabrizia | VV |
Table 5.
Rainfall indices (RIs) calculated for each decade and for each province and calculation of the mean values in the whole observation period.
Table 5.
Rainfall indices (RIs) calculated for each decade and for each province and calculation of the mean values in the whole observation period.
| RIs | 1981–1990 | 1991–2000 | 2001–2010 | 2011–2020 | Mean |
|---|---|---|---|---|---|
| Province of Cosenza | |||||
| R20 | 33.00 | 39.00 | 41.00 | 37.00 | 37.50 |
| R50 | 11.00 | 11.00 | 15.00 | 12.00 | 12.25 |
| LWP | 20.00 | 15.00 | 23.00 | 16.00 | 18.50 |
| RTa | 2241.90 | 2280.60 | 2621.20 | 2068.80 | 2303.13 |
| RX5d | 451.90 | 278.80 | 529.00 | 344.80 | 401.13 |
| Province of Catanzaro | |||||
| R20 | 33.00 | 37.00 | 35.00 | 29.00 | 33.50 |
| R50 | 8.00 | 10.00 | 8.00 | 8.00 | 8.50 |
| LWP | 17.00 | 11.00 | 13.00 | 12.00 | 13.25 |
| RTa | 1749.90 | 2416.40 | 1993.20 | 1846.80 | 2001.58 |
| RX5d | 490.00 | 562.20 | 621.80 | 415.20 | 522.30 |
| Province of Reggio Calabria | |||||
| R20 | 55.00 | 69.00 | 62.00 | 57.00 | 60.75 |
| R50 | 12.00 | 16.00 | 15.00 | 14.00 | 14.25 |
| LWP | 25.00 | 25.00 | 15.00 | 15.00 | 20.00 |
| RTa | 2042.40 | 2593.60 | 2134.60 | 2255.00 | 2256.40 |
| RX5d | 382.10 | 443.70 | 400.40 | 507.20 | 433.35 |
| Province of Crotone | |||||
| R20 | 23.00 | 27.00 | 19.00 | 21.00 | 22.50 |
| R50 | 6.00 | 16.00 | 6.00 | 9.00 | 9.25 |
| LWP | 11.00 | 7.00 | 10.00 | 8.00 | 9.00 |
| RTa | 1333.30 | 1772.00 | 1435.80 | 1618.20 | 1539.83 |
| RX5d | 487.40 | 402.00 | 437.60 | 508.20 | 458.80 |
| Province of Vibo Valentia | |||||
| R20 | 28.00 | 41.00 | 41.00 | 38.00 | 37.00 |
| R50 | 11.00 | 14.00 | 11.00 | 11.00 | 11.75 |
| LWP | 20.00 | 17.00 | 15.00 | 20.00 | 18.00 |
| RTa | 1952.70 | 2801.60 | 2523.20 | 2416.00 | 2423.38 |
| RX5d | 344.50 | 467.60 | 426.00 | 431.00 | 417.28 |
Table 6.
Composite rainfall indices (CRIs) assessed for each decade and for each province, and their mean values calculated for the whole observation period.
Table 6.
Composite rainfall indices (CRIs) assessed for each decade and for each province, and their mean values calculated for the whole observation period.
| CRIs | 1981–1990 | 1991–2000 | 2001–2010 | 2011–2020 | Mean |
|---|---|---|---|---|---|
| Province of Cosenza | |||||
| CRI1 | 2.32 | 2.54 | 2.80 | 2.36 | 2.51 |
| CRI2 | 3.69 | 3.72 | 4.66 | 3.70 | 3.94 |
| CRI3 | 2.47 | 2.15 | 2.86 | 2.12 | 2.40 |
| CRI4 | 2.86 | 2.27 | 3.35 | 2.40 | 2.72 |
| CRI5 | 3.15 | 2.80 | 3.83 | 2.92 | 3.17 |
| Province of Catanzaro | |||||
| CRI1 | 2.03 | 2.53 | 2.23 | 1.96 | 2.19 |
| CRI2 | 2.32 | 3.05 | 2.48 | 2.39 | 2.56 |
| CRI3 | 2.12 | 2.00 | 1.98 | 1.83 | 1.98 |
| CRI4 | 2.33 | 2.93 | 2.80 | 2.20 | 2.56 |
| CRI5 | 2.51 | 2.70 | 2.59 | 2.23 | 2.51 |
| Province of Reggio Calabria | |||||
| CRI1 | 1.96 | 2.48 | 2.13 | 2.10 | 2.17 |
| CRI2 | 3.21 | 4.17 | 3.67 | 3.64 | 3.67 |
| CRI3 | 2.76 | 3.11 | 2.18 | 2.25 | 2.57 |
| CRI4 | 2.33 | 2.83 | 2.44 | 2.82 | 2.60 |
| CRI5 | 2.83 | 3.40 | 2.79 | 2.87 | 2.97 |
| Province of Crotone | |||||
| CRI1 | 1.90 | 2.37 | 1.79 | 2.00 | 2.01 |
| CRI2 | 1.95 | 3.66 | 2.02 | 2.63 | 2.56 |
| CRI3 | 1.88 | 1.73 | 1.86 | 1.77 | 1.81 |
| CRI4 | 2.30 | 2.41 | 2.26 | 2.59 | 2.39 |
| CRI5 | 2.19 | 2.56 | 2.05 | 2.29 | 2.27 |
| Province of Vibo Valentia | |||||
| CRI1 | 1.61 | 2.33 | 2.21 | 2.08 | 2.06 |
| CRI2 | 2.54 | 3.44 | 2.89 | 2.83 | 2.92 |
| CRI3 | 2.03 | 2.24 | 2.00 | 2.26 | 2.13 |
| CRI4 | 1.91 | 2.66 | 2.41 | 2.37 | 2.34 |
| CRI5 | 2.26 | 2.84 | 2.53 | 2.63 | 2.56 |
Table 7.
Results of the Pearson correlation index with the series of DHEs/floods/landslides and the RIs.
Table 7.
Results of the Pearson correlation index with the series of DHEs/floods/landslides and the RIs.
| RIs | DHEs | Floods | Landslides |
|---|---|---|---|
| R20 | 0.574028 | 0.604955 | 0.589547 |
| R50 | 0.442449 | 0.358793 | 0.486603 |
| LWP | 0.487598 | 0.344451 | 0.518344 |
| RTa | 0.437472 | 0.309766 | 0.488363 |
| RX5d | −0.06033 | 0.028983 | −0.02707 |
Table 8.
Results of the Pearson correlation index with the series of DHEs/floods/landslides and the CRIs.
Table 8.
Results of the Pearson correlation index with the series of DHEs/floods/landslides and the CRIs.
| CRIs | DHEs | Floods | Landslides |
|---|---|---|---|
| CRI1 | 0.55238 | 0.34612 | 0.61300 |
| CRI2 | 0.68565 | 0.49935 | 0.73099 |
| CRI3 | 0.62272 | 0.47948 | 0.67950 |
| CRI4 | 0.47915 | 0.37014 | 0.54595 |
| CRI5 | 0.73527 | 0.52305 | 0.79570 |
Disclaimer/Publisher’s Note: The statements, opinions and data contained in all publications are solely those of the individual author(s) and contributor(s) and not of MDPI and/or the editor(s). MDPI and/or the editor(s) disclaim responsibility for any injury to people or property resulting from any ideas, methods, instructions or products referred to in the content. |
© 2023 by the authors. Licensee MDPI, Basel, Switzerland. This article is an open access article distributed under the terms and conditions of the Creative Commons Attribution (CC BY) license (https://creativecommons.org/licenses/by/4.0/).
Share and Cite
MDPI and ACS Style
Petrucci, O.; Coscarelli, R. Flood and Landslide Damage in a Mediterranean Region: Identification of Descriptive Rainfall Indices Using a 40-Year Historical Series. Water 2023, 15, 3826. https://doi.org/10.3390/w15213826
AMA Style
Petrucci O, Coscarelli R. Flood and Landslide Damage in a Mediterranean Region: Identification of Descriptive Rainfall Indices Using a 40-Year Historical Series. Water. 2023; 15(21):3826. https://doi.org/10.3390/w15213826
Chicago/Turabian StylePetrucci, Olga, and Roberto Coscarelli. 2023. "Flood and Landslide Damage in a Mediterranean Region: Identification of Descriptive Rainfall Indices Using a 40-Year Historical Series" Water 15, no. 21: 3826. https://doi.org/10.3390/w15213826
Note that from the first issue of 2016, this journal uses article numbers instead of page numbers. See further details here.