
Century-Scale Environmental Evolution of a Typical Subtropical Reservoir in the Guangdong–Hong Kong–Macao Greater Bay Area

1
School of Geography and Remote Sensing, Guangzhou University, Guangzhou 510006, China
2
Centre for Climate and Environmental Changes, Guangzhou University, Guangzhou 510006, China
3
Department of Infrastructure Engineering, University of Melbourne, Melbourne 3010, Australia
4
Department of Hydraulic Engineering, Tsinghua University, Beijing 100084, China
5
School of Geographical Sciences, Nanjing University of Information Science and Technology, Nanjing 210044, China
*
Authors to whom correspondence should be addressed.
Water 2023, 15(20), 3639; https://doi.org/10.3390/w15203639
Submission received: 28 July 2023
/
Revised: 27 September 2023
/
Accepted: 13 October 2023
/
Published: 17 October 2023
Abstract
:As one of the world’s four Greater Bay Areas, the Guangdong–Hong Kong–Macao Greater Bay Area (GBA) faces many environmental challenges along with rapid economic development, causing significant degradation of aquatic ecosystems. However, there is limited knowledge on long-term environmental changes (i.e., >50 years), and restoration of the degraded aquatic ecosystems in the GBA has become increasingly difficult. This study selects a typical inland water body, the Miaotan Reservoir, from Huizhou City in the GBA, to explore long-term changes in water and the eco-environment over the past 70 years and to provide some restoration and management strategies for degrading aquatic ecosystems in the region. We collected a sediment core from the reservoir center and established an age–depth profile by integrating 210Pb and 137Cs dating. We then set up high-resolution diatom community succession stratigraphy and multiple indicators (grain size, element, geochemical and social indicators) as responses to environmental changes in the reservoir. Our results show that significant changes have occurred in the ecosystem and environment of the Miaotan Reservoir and its catchment over the past 70 years. The diatom community underwent a gradual transition from absolute dominance of the mesotrophic species Aulacoseira granulata to dominance of the eutrophic species Nicizschia gracilis, Nicizschia palea and Achanathes sp., indicating the onset of water quality degradation and ecosystem changes in the 1990s due to eutrophication. The RDA (Redundancy analysis) results demonstrate that exogenous pollutant inputs into the Miaotan Reservoir resulting from agricultural activities over the period led to serious environmental changes, e.g., toxic algal bloom and heavy metal pollution. This study enriches our understanding of long-term environmental changes in inland lakes and reservoirs in South China and provides insights into the restoration and management of aquatic ecosystems in the GBA.
1. Introduction
The Guangdong–Hong Kong–Macao Greater Bay Area (GBA) is one of the four major bay areas in the world, with a total population of over 86 million [1]. The proximity of the GBA to a subtropical coastal monsoon climatic zone in South China not only influences strong bio-geochemical cycling (i.e., soil erosion) but also triggers the occurrence of exacerbating hydrological cycles (i.e., flood), often leading to a fragile eco-water environment [2]. Since the Reforming and Opening-up policy in China, the establishment of many manufacturing enterprises in the region have transformed this region into one of the most highly developed areas in the country, with large-scale multi-source pollutant deposition into reservoirs [3]. For example, due to the intensified pollution in lake and river systems over the years, many water bodies in the GBA have become greyish black with foul smells [2]. The provincial government of Guangdong has made persistent efforts to control water pollution in the GBA since 2015 [4]. Although some positive outcomes have been achieved in improving the water quality, no such fundamental solutions are being perceived in overall water quality and ecosystem management in the region to date. Due to the lack of long-term monitoring data on water quality and aquatic ecosystem changes, it has been increasingly difficult to set realistic goals for the restoration and management decisions of degraded water bodies in the GBA [5,6,7], as well as to project future impacts and remediation of the aquatic environment in the region [8,9].
Lake and reservoir sediments contain a wealth of biological and physicochemical information [10]. Reservoirs have relatively high sedimentary depositional rates (i.e., 0.01–0.1 m per year), and these sediments are of great importance to obtaining high-resolution records to assess past environmental changes and catchment disturbances [11]. Sedimentary profiles and characteristics often reveal invaluable information on a range of biogeochemical species and micro- and macro-fossil assemblages, providing basic and complementary knowledge when contemporary observed data are scarcely available over time and space [12]. Diatoms, strong bioindicators of aquatic systems, are highly sensitive to ecosystem and water resource changes, and they have been widely used for river and lake basin management worldwide [13,14]. Furthermore, diatom subfossil remains are well preserved in lake sediments and are widely used to track historical environmental changes in different types of lakes [15], including acidic and alkaline [16,17], eutrophic and hypertrophic [6,8,18] and saline and mineral-enriched lakes [19,20]. In the past decade, therefore, diatoms have attracted extensive attention throughout the global scientific community in indicating ecological responses to various limnological stressors in anthropogenically disturbed aquatic environments in lakes, wetlands and reservoirs worldwide [21,22,23].
Many reservoirs in the world have been found to play a significant role in water storage, flood control and irrigation facilities [22]. Being adjacent to human settlements, these reservoirs are not only sensitive to natural environmental changes. such as rainfall, floods and soil erosion, but they are also vulnerable to anthropogenic disturbances, e.g., large-scale urban development [24] and agriculture-induced environmental pollution [25,26]. A large number of reservoirs were built in South China in 1950–1980s for various purposes for agricultural irrigation [27]. Hence, sedimentary records of many of these reservoirs in South China, including the GBA, allow the historical reconstruction of environmental changes occurring in the region during the last century. As the GBA contains fewer natural water bodies, the significance of the small number of reservoirs in the GBA is very high, providing invaluable historical eco-environmental information [28]. This study selects a typical inland reservoir located in Huizhou City within the GBA to explore long-term changes in the GBA landscape environment over the past 70 years. This study aims to improve the degraded aquatic ecosystem and water quality in the region. Hence, our study specifically aims to (1) establish a high-resolution record of diatom succession and dynamics in the subtropical reservoir, Miaotan; (2) distinguish the impacts of various stressors (hydrological, climatic and anthropogenic forces) on ecosystems through assessing subfossil diatoms, determining their relative contributions over time; and (3) provide some useful recommendations that can help to restore and manage the degrading wetlands and reservoirs in the GBA. This case study is expected to benefit sustainable water resource management in subtropical water bodies in South China.
2. Materials and Methods
2.1. Study Area
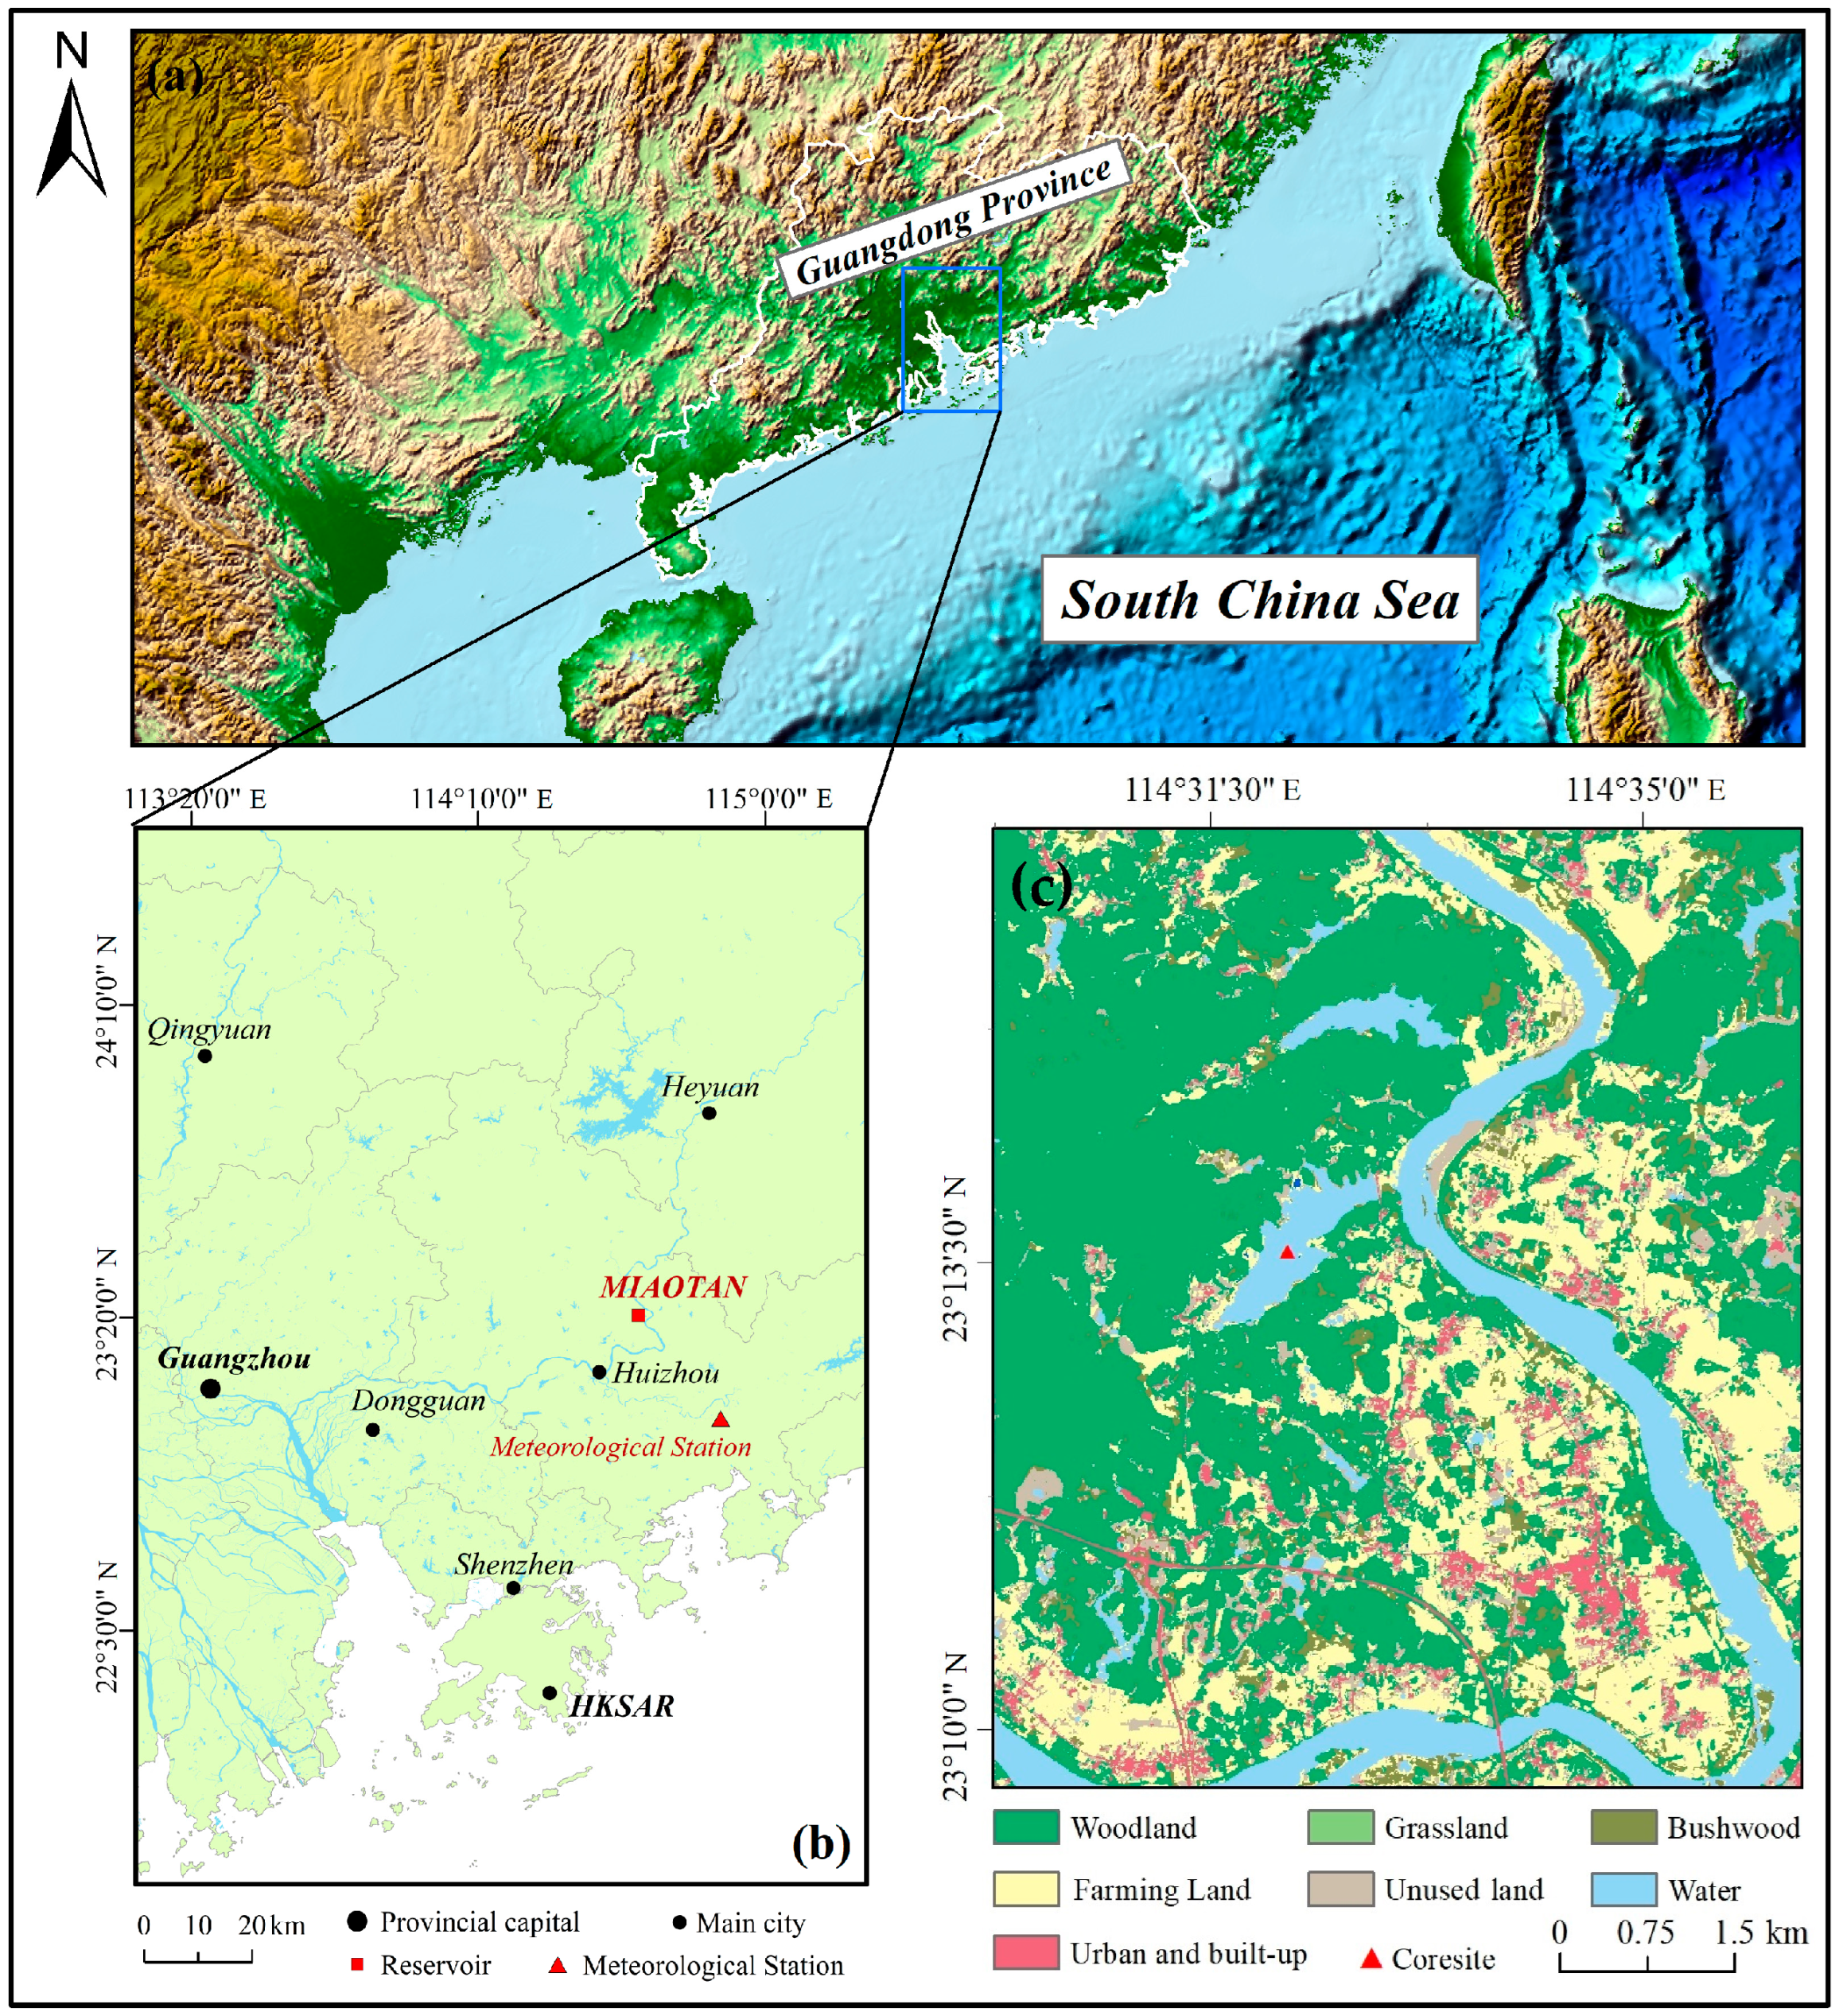
The Miaotan Reservoir is in Rvhu Town, Huicheng District, Huizhou City, Guangdong Province (Figure 1). It has a catchment area of 12.5 km2, with a normal storage capacity of 1.109 × 10⁷ m3. The reservoir was built in 1956 and is mainly used for farm irrigation, and it was further reinforced in the 1990s for the safety of people and for the environment downstream [29]. The Miaotan Reservoir is in the mid-lower reaches of the East River plain area, and the adjacent areas were insensitively cultivated with the scattered settlement of people. Being upstream of Huizhou City, the reservoir has been used as a water storage tank for drinking, irrigation and industrial use. It is located in the south subtropical maritime monsoon climatic zone, with an average temperature of 19.5–22.5 °C and an average annual rainfall of 1802 mm [30]. At present, the reservoir is fed mainly by atmospheric precipitation and the confluence of the Dongjiang Rivers. The exchange of water, dissolved substances, suspended solids and pollutants between the Miaotan Reservoir and the Dongjiang River is an important and dynamic eco-hydro system, and this exchange is often termed “the material and energy interchange” through the river–lake connection within the water system and hydraulic framework [31]. Since the construction of the Miaotan Reservoir, pollutants entering the ecosystem have gradually increased, and the water quality has been degrading due to local agricultural development [32]. A field survey from 2020 showed that the reservoir water body has been at the mesotrophic level with a total phosphorus (TP) concentration of 90 µg/L and a chlorophyll a concentration of 60 µg/L (Table 1).
The historical climatic data were obtained from the China Meteorological Data Network (http://data.cma.cn, accessed on 4 October 2023) and were selected from the records of the nearest meteorological stations in Huidong County. The annual average meteorological data include temperature, wind speed, sunshine hours and the number of days with daily precipitation >0.1 mm. The historical data of the resident population and annual average yield of Huizhou City were obtained from the Huizhou Statistical Yearbook [33,34].
2.2. Geographic Background and Historical Changes in Lake Morphology
The area and perimeter of the reservoir’s water surface were obtained from five scenes from historical Landsat ETM/OLI images of the United States Geological Survey (USGS: https://www.usgs.gov/, accessed on 4 October 2023) [35], including Landsat-1 MSS images (1973), Landsat-5 TM images (2000) and Landsat-8 OLI images (2010 and 2020), with resolutions of 60 m, 30 m and 30 m, respectively, which have been radiometrically and geometrically corrected. Further processing, including image rectification, defining projections, etc., of the image data, was carried out subsequently. The landscape information of the 5 phases was extracted using supervised classification together with visual interpretation, and the values of the area and lake shore length were obtained using the ArcGIS geometric calculator. Water body morphology and area data of the Miaotan Reservoir before 1950 were obtained by rasterizing the 1:250,000 topographic map drawn in the 1940s (http://www.lib.utexas.edu/maps/ams/china/, accessed on 4 October 2023) after projection and map alignment in ArcGIS 10.2 software.
2.3. Sampling and Laboratory Analysis
A field survey of the Miaotan Reservoir was conducted in August 2020 after a relatively dry summer. Sediment core MT1 was retrieved using a gravity corer (UWITEC GmbH, Mondsee, Austria, https://www.uwitec.at/en/product_cats/surface-corer/, accessed on 4 October 2023) in the reservoir center (23°8′ N, 114°40′ E). The temperature, pH and conductivity of the water body were measured at the sampling site using a YSI Water Quality Meter. Moreover, water samples were collected in situ and kept sealed for further laboratory testing of chlorophyll, TN and TP.
The sediment core was sliced at 1 cm intervals and was immediately stored at 4 °C for further analysis. Based on the sedimentary chronology, only the upper 70 cm of the sediment column was used for the experiment for this study. Laboratory analyses included radionuclide activity (210Pb and 137Cs), grain size, loss on ignition (LOI), chemical elements (i.e., sedimentary phosphorus, Al, Fe, Ca, Li, Na, K, Mg, Cr, Cu, Zn, Sr, Pb and Mn) and diatoms.
The 210Pb and 137Cs activity was measured with the direct gamma spectrometry method using the Ortec HPGe GWL series of well-type, coaxial, low-background and intrinsic germanium detectors (HPGe GWL-120-15). 137Cs was used to identify the 1963 nuclear weapons peak. 210Pb chronologies were calculated using a constant rate of supply (CRS) model and were verified using the highest 137Cs activity in 1963 [36].
Furthermore, we conducted SAR and TP flux measurements on the segmented sediment samples to examine historical variations in sediment deposition. The sediment accumulation rate (SAR) was calculated using the weight of sediment samples as well as the dating results, as shown in Equation (1). The TP flux was calculated following Equation (2).
Herein, Mx denotes the weight of a 1 g sediment sample after dehydration, corresponding to a depth x, and (Tx−1 − Tx) denotes the dating time between neighboring segmented samples, where time is measured in years (a).
The grain size spectra of the samples were measured at the 1 cm intervals (70 samples in total) using a Malvern automated laser optical particle-sizer analyzer (Mastersizer-2000, Malvern, Worcestershire, UK) after the removal of carbonates with 10% HCl. LOI (loss on ignition) was analyzed after 4 h of combustion at 550 °C. Low- (976 Hz) and high- (15,616 Hz) frequency mass-specific (MS) χlf and χhf, respectively, were measured using Kappabridge MFK1-FA (AGICO). Frequency-dependent magnetic susceptibility (χfd) was calculated from Equation (3), with χlf and χhf as low and high magnetic susceptibility respectively. Metal elements (Al, Fe, Ca, Li, Na, K, Mg, Cr, Cu, Zn, Sr, Pb and Mn) and total phosphorus (TP) were analyzed using inductively coupled plasma atomic emission spectrometry (ICP-AES) after digesting sediments in a mixture of HF, HCl, HNO3 and HClO4 (3:0.5:6:0.5).
The diatom analysis followed the standard procedures put forward by Battarbee [37]. The diatom suspension was mounted on slides with Naphrax® (Brunel Microscopes Ltd., 2 Vincients Road, Bumpers Farm Industrial Estate, Chippenham Wiltshire SN14 6NQ, UK, https://www.naphrax.co.uk/index.html, accessed on 4 October 2023) after removing carbonates with HCl and organic matter with H2O2. Diatom valves were identified using an Olympus CX51 microscope (Olympus, Tokyo, Japan) with an oil immersion objective (magnification × 1000). Diatom taxonomy mainly followed the work by Krammer and Lange-Bertalot [38]. The diatom habitat, either planktonic or non-planktonic (epiphytic/benthic), was identified following previously published papers [6,14]. Given the encounter of high numbers of some non-planktonic species (i.e., genus Fragilaria, Navicula, Gomphonema and Nitzschia, and also infrequent occurrences of individual species) and their similar ecological preferences, we grouped these species into genera and calculated the relative abundance (%) for further statistical analysis.
2.4. Numerical Analysis
The diatom compositional change stratigraphy diagram was drawn using Tilia and Tilia Graph [39], and zonal changes were identified using both the constrained incremental sum of squares facility with the CONISS computer program [40]. Only diatom taxa in more than two samples and with an abundance ≥ 2% were used in diagrams and the following analyses. Because of the lack of monitoring records during the historical periods, sedimentary indicators were used as environmental proxies to represent specific environmental changes according to their potential to respond to the change.
In an attempt to summarize the major underlying gradients of the stratigraphical variations in diatom assemblage, the relative abundance data of diatoms were analyzed using principal component analysis (PCA). The first axis of PCA represents the main patterns of diatom assemblage changes, capturing the most variance of the variable matrix [41]. To explore the relationship between diatom assemblage changes and the environment, a Pearson correlation analysis was conducted for PCA-1 scores and environmental variables (TP, Cu, Pb, Zn, SAR, LOI, grain yield, population, annual average temperature and wind speed) using SPSS 26.0 software. Environmental factors that had a strong correlation with diatom assemblage succession (p ≤ 0.01) were then selected for further Redundancy Analysis (RDA) with climate indicators.
Redundancy Analysis (RDA) is a direct gradient analysis method that reveals the share of environmental variables in changes in biogenic species communities in a multidimensional space [41]. To test the explanatory ability, a series of RDAs constrained to a single environmental variable at a time were performed to check the influence of each variable using the eigenvalue ratio of the first two axes (λ1/λ2), with higher ratios indicating stronger explanatory ability. Significant factors well explaining diatom population succession were further screened for the Redundancy Analysis based on Monte-Carlo permutation tests (p < 0.01; n = 499, unrestricted substitution) to further explain their association with community change correlations. PCA and RDA were performed in CANOCO 5.0 software [41].
3. Results
3.1. Historical Changes in Lake Morphology
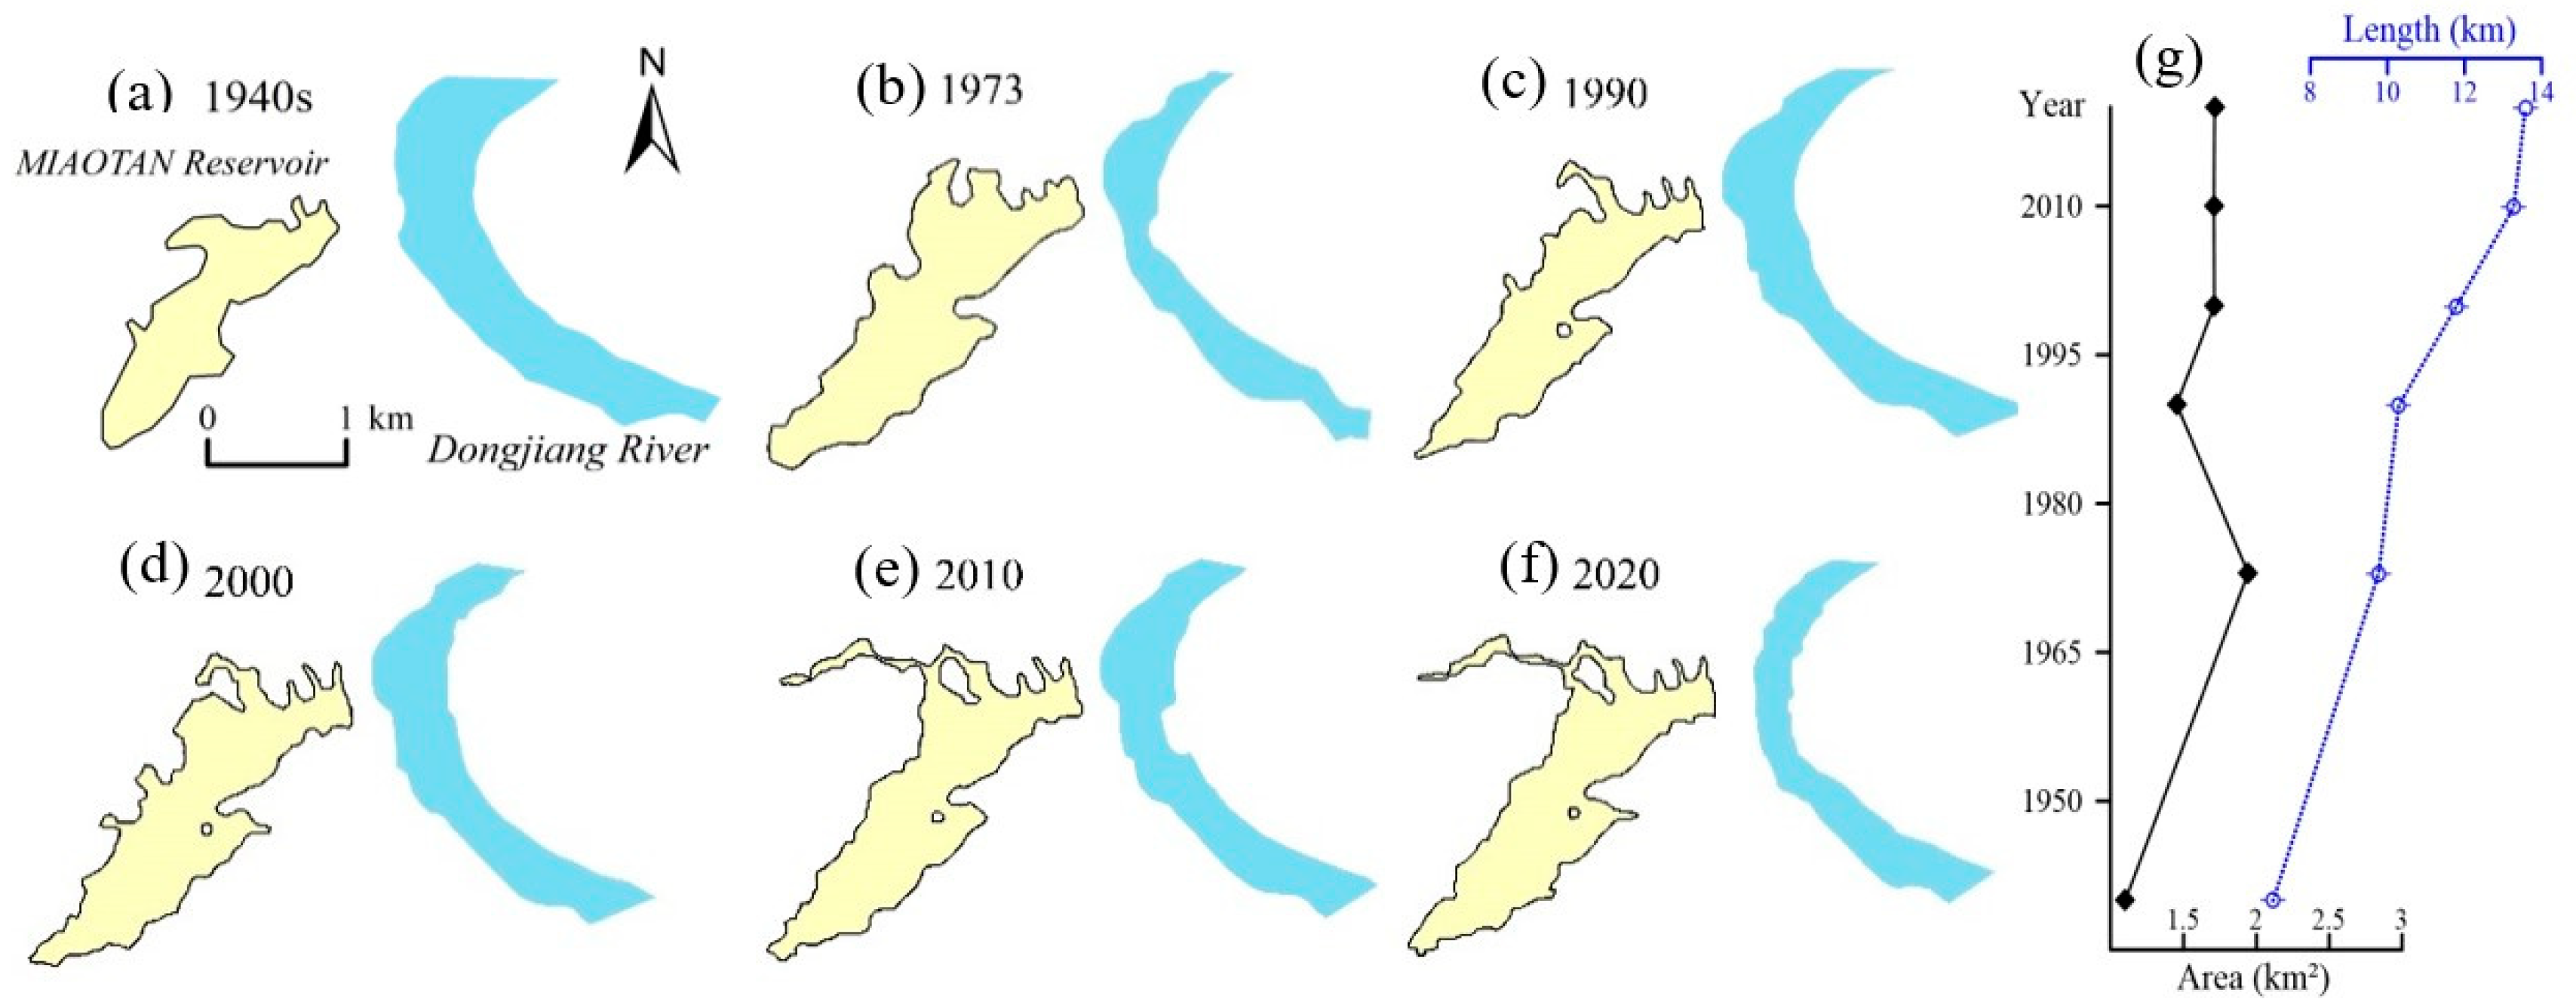
A clear trend of further lengthening the Miaotan Reservoir’s shores and a fluctuating trend in the area (Figure 2) were found. Before building the dam for water storage, there was no channel connecting the Dongjiang River (Figure 2a). Since 1956, with the Miaotan Reservoir dam, water exchange with the Dongjiang River has occurred through the reservoir culvert, which has served to store and regulate water, and the area of the reservoir’s water surface reached 1.1 km2. In 1990 (Figure 2c), the reservoir’s area was significantly reduced from 1.94 km2 to 1.45 km2, compared with (Figure 2b) that in 1973. Then, the reservoir area re-expanded, mainly occurring in the northern part of the reservoir in 2000 (Figure 2d). The expansion of the reservoir area further increased the catchment area, with a lake shoreline length of 12.6%. Until 2020, area expansion has been constant (Figure 2f), except for some changes in the southwest of the reservoir. The area and lake shore length remained at 1.71 km2 and 13.58 km in 2020, but the northeast shore of the reservoir kept connecting with the Dongjiang River via ongoing crop cultivation.
3.2. Meteorological Changes and Human Activities in the Past 70 Years
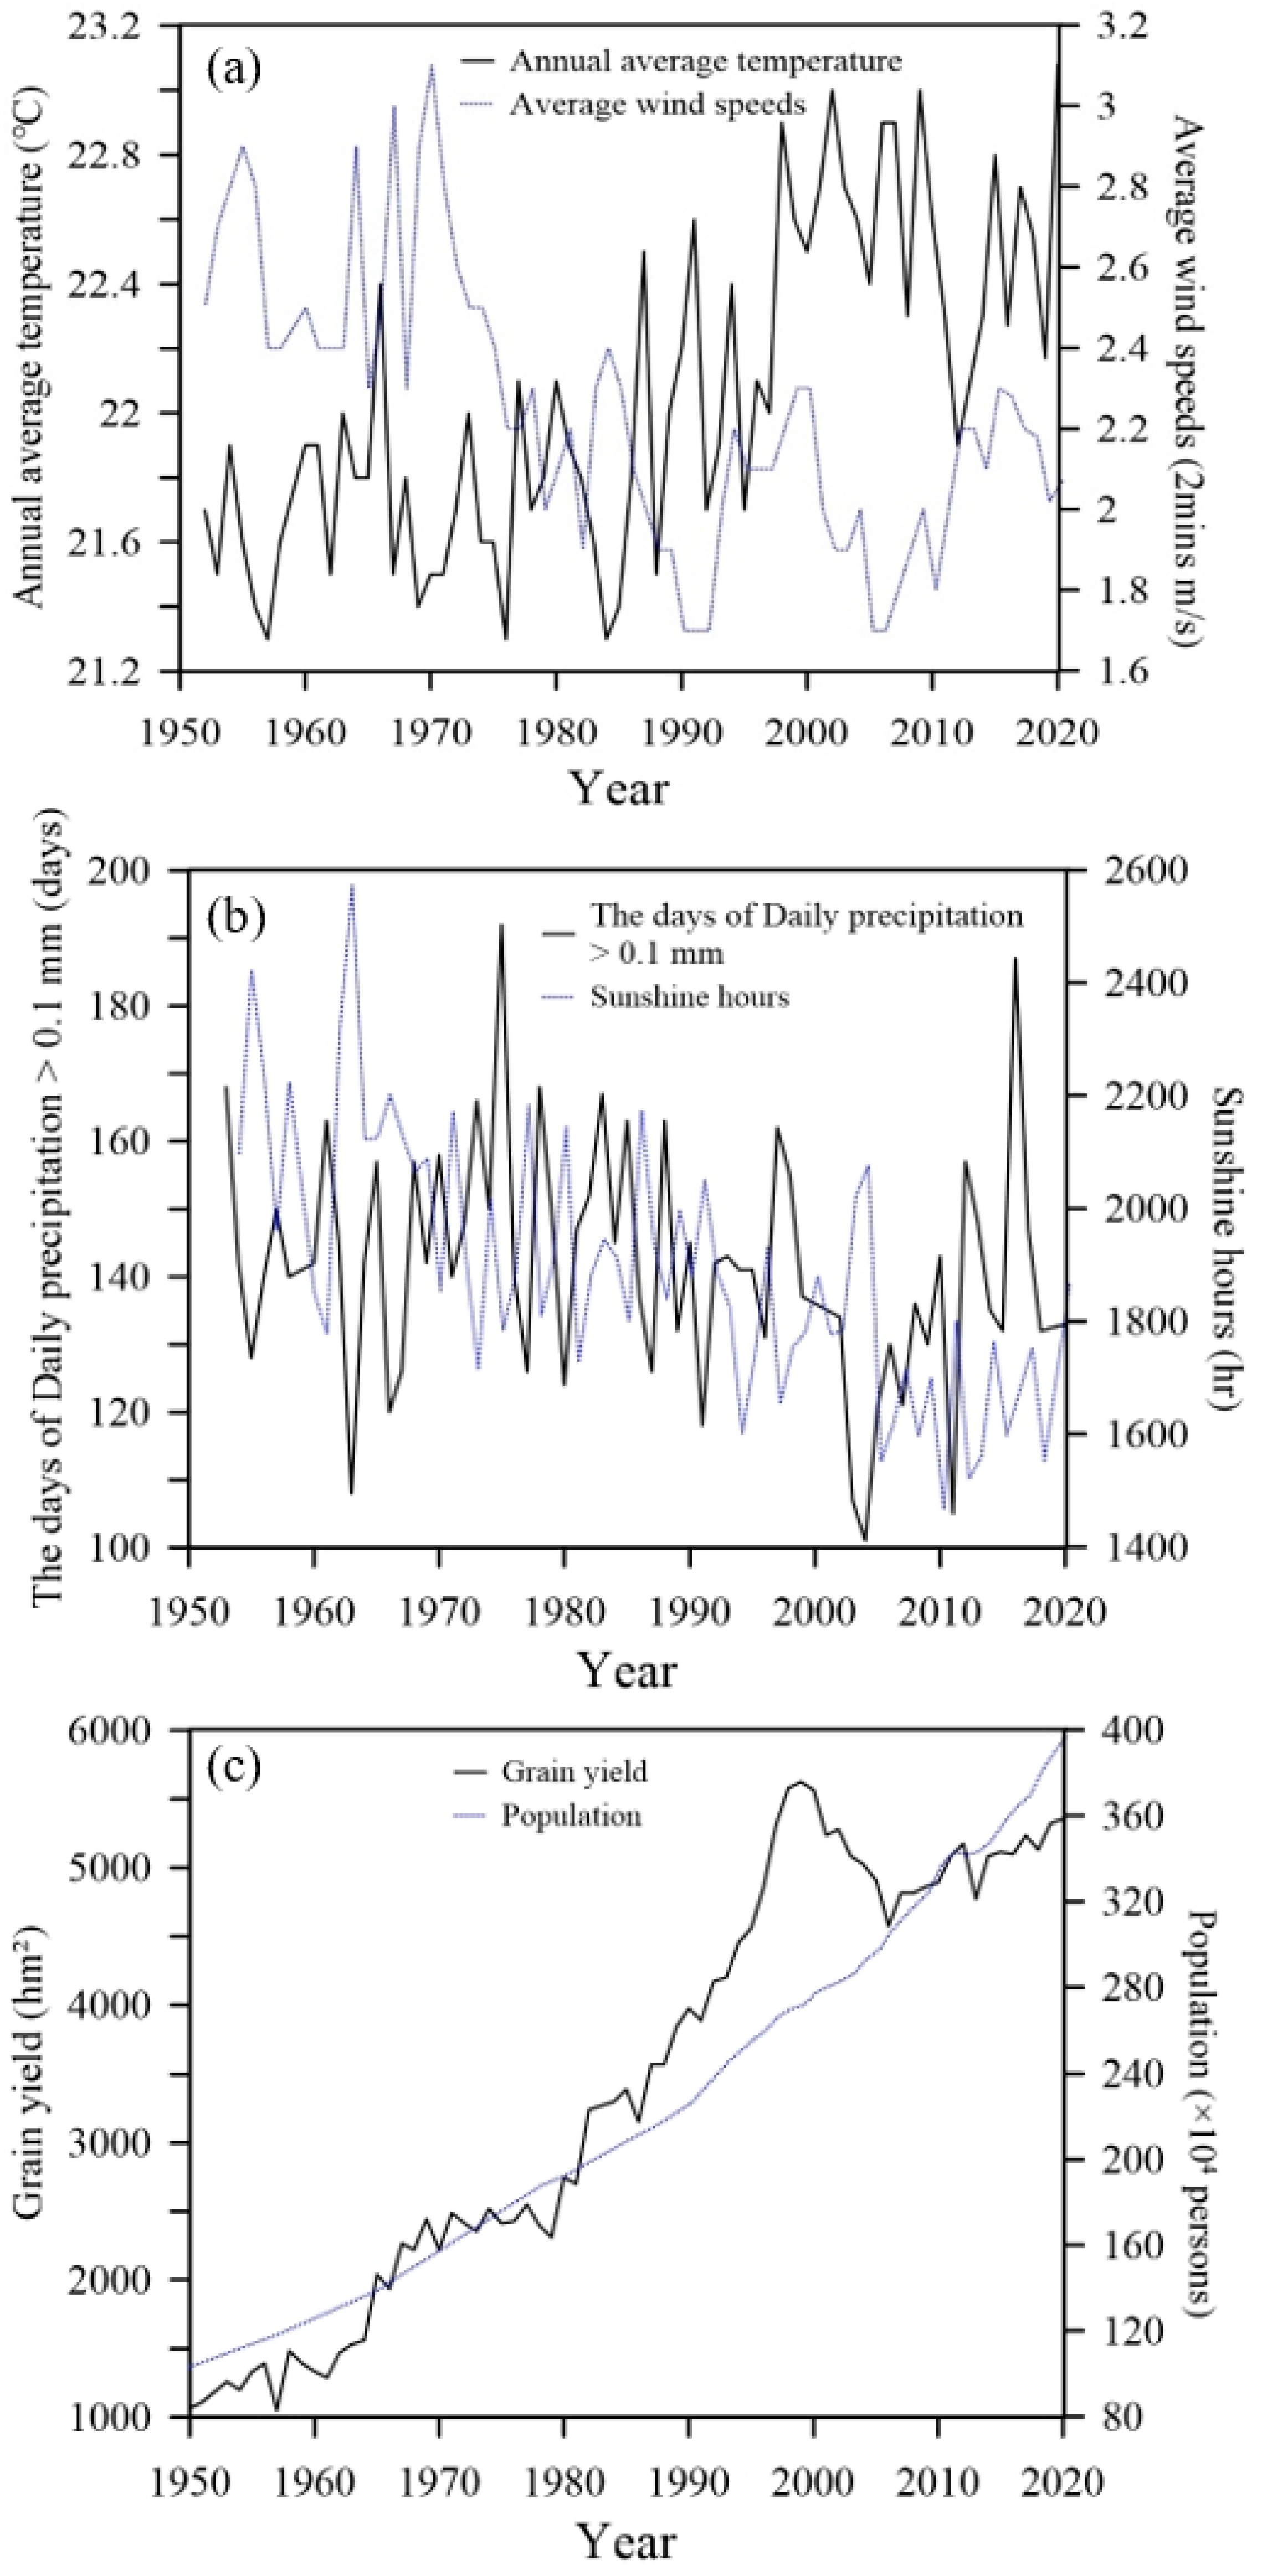
The annual average temperature showed an increasing trend (Figure 3), with an upward trend occurring significantly after 1990s. The average wind speed in the region generally did not exceed 3 m/s. In 1970–1990, the average wind speed gradually decreased and remained stable after the 1990s. It is worth mentioning that the annual average temperature and the average wind speed were significantly negatively correlated (r = −0.57, n = 69, p < 0.05, Figure 3a). The number of days with daily precipitation > 0.1 mm was below 150 days but showed an obvious valley in 1990–2010. Sunshine hours and precipitation were negatively correlated. Before the 1990s, the number of sunshine hours fluctuated around the level of 1900 h. After the 1990s, air quality decreased due to the development of urban centers in the region [42], causing sunshine hours to decrease below 1600 h and rebound in 2013 (Figure 3b).
The population of Huizhou City increased from about 1 million in the 1950s to nearly 4 million by the end of 2020. Agricultural and population data were collected from the Huizhou Statistical Yearbook for 1950–2020 [33,34]. The grain yield generally showed an increasing trend, especially during 1950–2000 (Figure 3c). The agricultural land surrounding the reservoir is extensively reclaimed. With the adoption of high-quality crop species and the use of chemical fertilizers and pesticides, grain yield in the region rose rapidly from 1950 to 2020 (Figure 3c).
3.3. Chronology
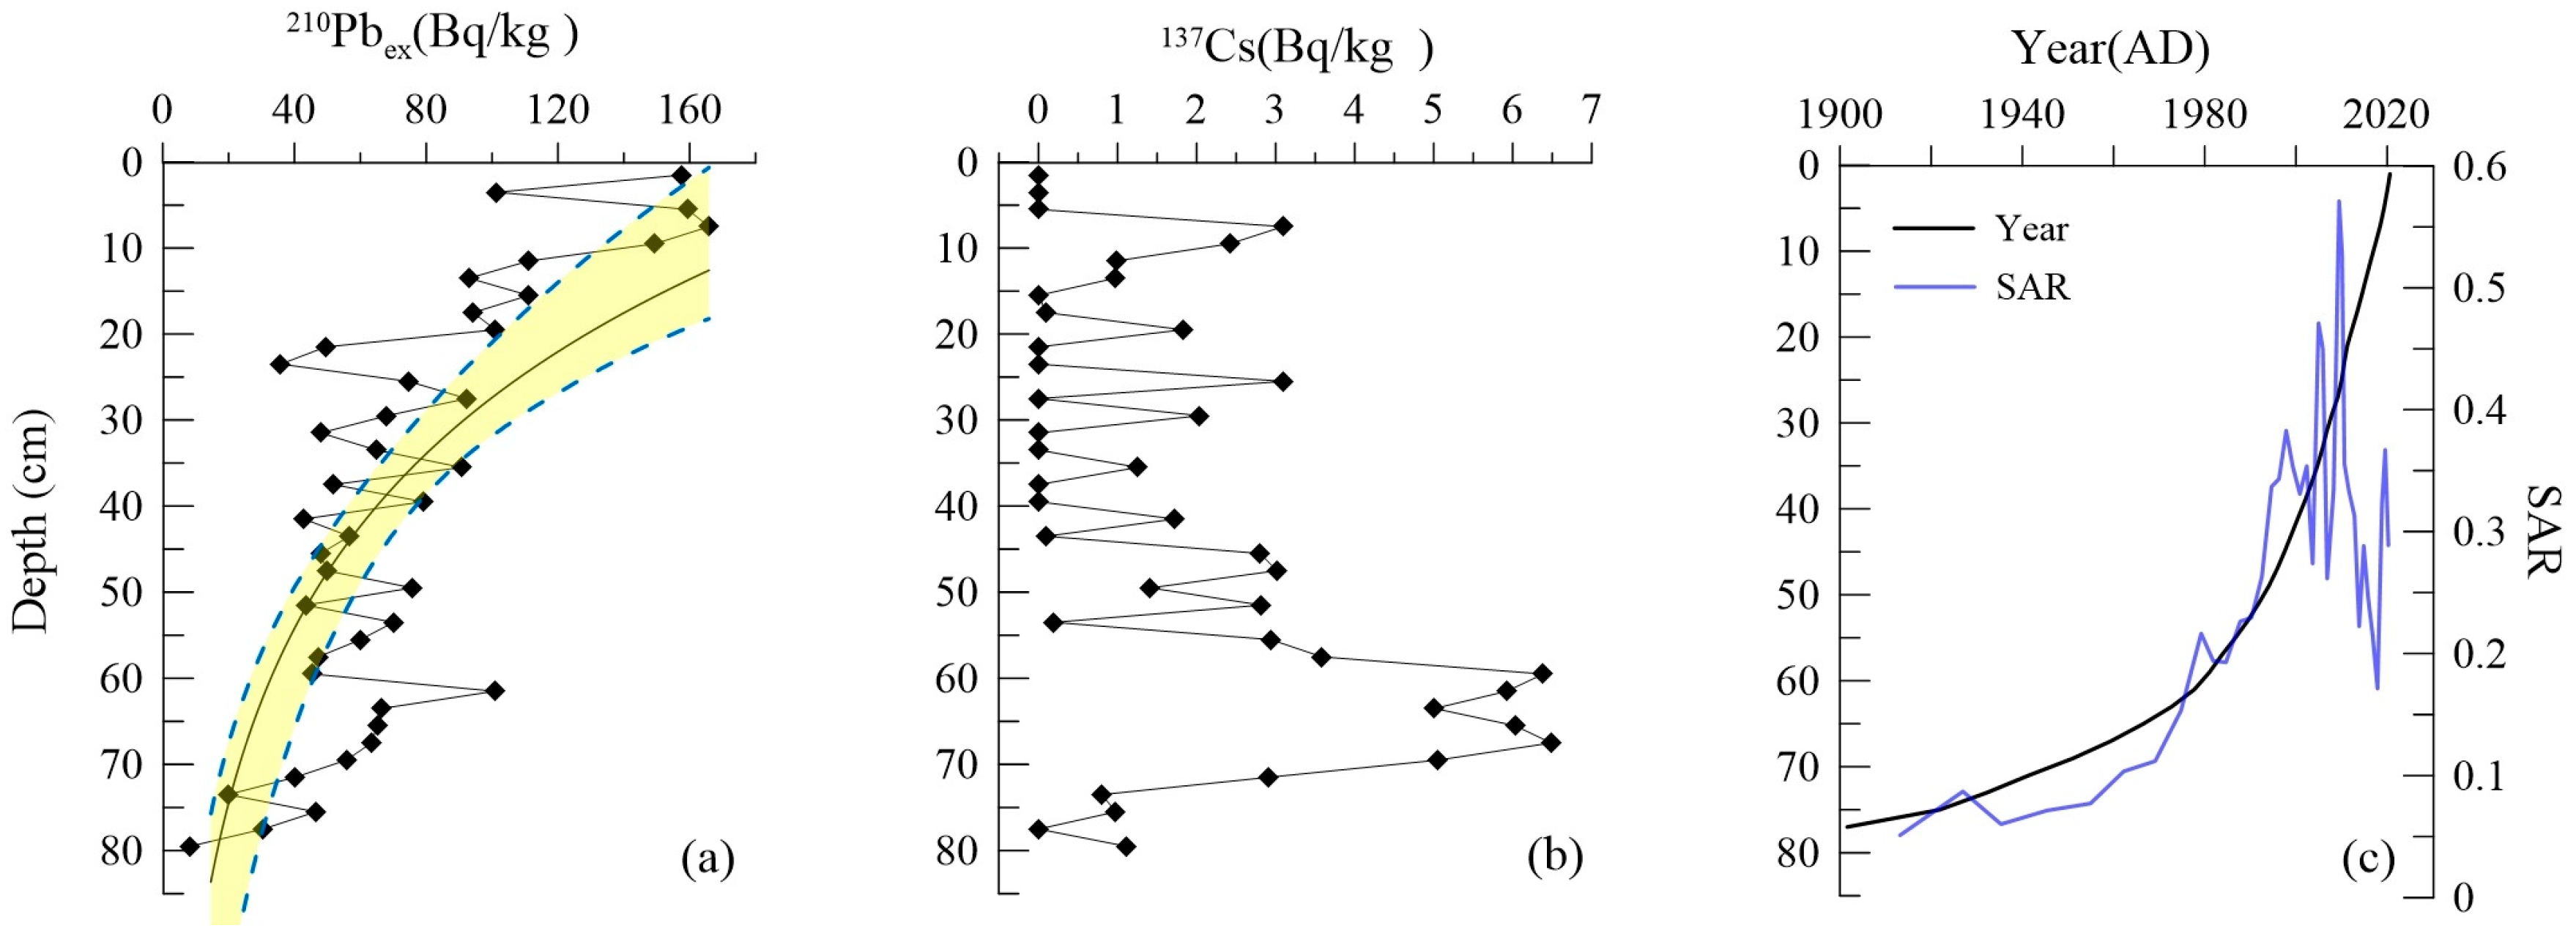
An obvious decay in 210Pb was present, and at the bottom at 80 cm, its profile was very close to the background value (Figure 4a). The 137Cs value was low (<10 Bq/kg), with an obvious peak at 58–70 cm (Figure 4b). The maximum peak in 1963 was not measured in the corresponding year, likely due to the method of sampling at 2 cm intervals. The bottom profile of 137Cs did not reach the background value. Figure 4c exhibits the age–depth curve (in black) and the sediment accumulation rate (SAR) variation curve (in blue) over time. The curve shows that the SAR increased significantly, and deposition accelerated after 1980. The average deposition rate of the sediment cores calculated by the CRS model was 0.56 cm/a (Figure 4c).
3.4. Diatom Succession
A total of 26 genera and 48 diatom taxa were identified in sediment core MT1, including planktonic species Aulacoseira granulata, Aulacoseira ambigua, Aulacoseira alpigena, Cyclostephanos dubius, Cyclostephanos meneghiniana, Cyclostephanos tholiforms and Cycotella pseudostelligera and non-planktonic (epiphytic/benthic) species Achanathes mimutissima, Achanathes sp., Fragilaria crotenensis, Nicizschia palea, Nicizschia gracilis, Nicizschina subacicularis, Pinnularia gibba, Navicula, Cymbella and Thalassiosira. Aulacoseira granulata was recorded as a dominant species in the Miaotan Reservoir. According to the main characteristics of diatom change, the evolution of diatom communities can be divided into three combinatorial zones (Figure 5), with two sub-zones within Zone II.
Zone I (70–40 cm, corresponding to 1950–2000): The planktonic species A. granulata was dominant, with species abundance reaching up to 75% of the total abundance. However, after 1992, abundance began to decline. Other planktonic species such as A. ambigua, A. alpigena and C. pseudostelligera were also present, and they accounted for approximately 5–20%. Epiphytic/benthic species N. gracilis and N. subacicularis started to appear after the 1990s.
Zone IIa (40–22 cm, corresponding to 2000–2010): The abundance of planktonic species A. granulata was about 30–50%, with some overall reduction. The abundance of coastal species N. gracilis and N. subacicularis showed an obvious upward trend compared to Zone I. The remaining epiphytic/benthic species, such as F. crotenensis, N. gracilis, Navicula, etc., were present. The abundance of planktonic species C. meneghiniana and C. dubius and epiphytic/benthic species N. gracilis and N. subacicularis were relatively stable and did not change much during this phase.
Zone IIb (22–8 cm, corresponding to 2010–2017): The enrichment of planktonic species A. granulata was only 12–28% and still declined significantly in this zone. A. ambigua and C. meneghiniana reached the highest level in this zone. The abundance of epiphytic/benthic species N. gracilis and N. subacicularis remained stable at 10–28%, and the richness of N. palea kept increasing and came to peak in the later part of this zone.
Zone III (8–0 cm, corresponding to 2017–2020): The epiphytic/benthic genus Achanathes sp. was substituted by A. granulata, N. gracilis and N. subacicularis as the dominant species, reaching a peak and accounting for 61% of the entire diatom assemblage. Moreover, the enrichment of epiphytic/benthic species N. palea, N. subaciculari and N. gracilis showed a decreasing trend.
3.5. Sedimentary Indicators
The SAR kept fluctuating around 0.3 g/(cm2·a), with an obvious increasing trend until 2005 (33 cm). After that, the value had a certain fluctuation, reaching a peak in 2008 (25 cm), again fluctuating downward then (Figure 6). The median particle size always remained in the range of 5.67–7.14 μm and fluctuated with an upward trend until 2013, then gradually decreasing after 2013. In contrast, clay (<0.4 μm) fluctuated with a decreasing trend, but the change was small, with the most obvious fluctuations between 1976 and 2007 (60–29 cm). The element values were relatively low for the overall period before 2000. The mean TP, Cu, Zn and Pb were 1369.69 mg/g, 53.28 mg/kg, 180.51 mg/kg and 71.87 mg/kg, respectively. The P, Cu and Zn flux of TP started to increase significantly after 2000. The TP flux showed the same pattern as that of the TP concentration. The TP concentration reached its peak in 2008 (25 cm). The Pb concentration reached its maximum value around 1993 (47 cm), and there has been a possible trend of the Pb concentration reaching similar levels in recent years (2 cm to surface). Additionally, heavy metal Cu peaked in 2001 (37 cm) and again in 2011 (19 cm), with a trend somewhat resembling that of TP. The variation in the Zn content was also similar to that of Cu to some extent but with more fluctuating, with the maximum occurring in 2001 (37 cm). High concentrations of TP and Pb were observed at the end of the previous decade, as well.
The PCA of diatom subfossil assemblages shows that the first four axes explain 78.62%, 9.32%, 7.82% and 1.37% of the diatom assemblage data, respectively. PCA axis 1 captures most of the diatom succession information (Figure 6).
The Pearson correlation analysis between PCA first axis scores and environmental variables (Table 2) shows that TP, Cu, Zn, grain yield and resident population have a strong linear correlation with PCA first axis scores. Grain yield (p = 0.03) responded to most environmental indicators. There were strong correlations among all deposited substances in the water body. Nutrient indicators TP and TP flux and heavy metals Cu, Zn and Pb were significantly and positively correlated with grain yield. Wind speed (p = 0.002), on the other hand, was more negatively correlated with each indicator (SAR, TP flux, Pb, etc.). Pb was relatively independent and did not correlate strongly with other indicators, except wind speed and grain yield.
3.6. Ordination Analysis
The RDA analysis results show that grain yield, Cu and population have been significant factors affecting diatom succession in the Miaotan Reservoir in the last 70 years. They explain a total of 60.3% of the diatom assemblage variance together, with axis 1 explaining 49.12%. We divided the area into four assemblage zones based on the four diatom succession stages (Figure 7). The first axis reflects nutrient enrichment and heavy metal pollution in the reservoir, relating to human activities as indicated by population, agriculture and industry (Figure 7). The negative direction of the first axis shows that the water environment of the reservoir was not heavily polluted in the early period (samples during 1950–2000), and the positive half-axis shows that the samples were polluted with heavy metals and where nutrient enrichment occurred (samples during 2017–2020). The ratio of the eigenvalues reveals that population has the highest value of 1.61, indicating that it has the strongest ability to explain the succession of diatom species (Table 3).
4. Discussion
4.1. Historical Environmental Change and Its Driving Factors in the Miaotan Reservoir
The diatom community and other proxies, including SAR, fine particles, TP flux and heavy metals in the Miaotan Reservoir, all have shown a consistent change over the past 70 years. The >60% abundance of the typical planktonic species A. granulata suggests that the reservoir went through the oligo-mesotrophic state during 1950–2000. The widespread distribution of A. granulata with high silicification and sedimentation rates [43] also suggests increased hydro-metro disturbance in the reservoir during this period. For instance, high precipitation in the 1970s–1980s (Figure 3) resulted in higher catchment runoff assemblage change.
However, a reduction in the abundance of A. granulata and a reciprocal increase in the abundance of epiphytic/benthic diatoms such as Nitzschia subacicularis, Nitzschia palea and Nitzschia gracilis in 1988/89 are indicative of a meso-eutrophic condition of the reservoir (Figure 5). Climatic data from the basin during this period show an increase in the mean surface temperature (Figure 3a). The mean wind speed showed a downward trend in 1985, and the number of days with daily precipitation > 0.1 mm also decreased compared to the previous period. The rise in the TP flux in the region (Figure 6) reflects an overall decreasing trend for water disturbance but an increasing trend for the deposition of suspended material and SAR during this period (Figure 6). The southern and eastern catchments of the reservoir are primarily utilized for irrigated agriculture, together with highly dynamic hydrological conditions and nutrient movement (Figure 1b), suggesting a temporal and spatial variation in the environmental change. With the increase in the population of Huizhou City from around 1 million in the 1950s to 2.4 million by 2000 [33,44] and the increasing demand for irrigation, the Miaotan Reservoir was built in 1956 for the purpose of irrigation storage. Prior to this, it was fed by the East River and seasonal rainfalls. Today, the reservoir hydro-ecosystem is influenced largely by the construction of an artificial aqueduct that prevents existing water exchange between the river and the reservoir [29].
The strong linear regression between SAR and sediment flux observed in different lakes, including the Miaotan Reservoir, indicates increasing exposure to anthropogenic activities over time. Industrial pollution, soil erosion and the use of nutrients, chemicals and pesticides in agriculture are common practices in the GBA affecting the diatom community. However, occasional recovery efforts for the reservoir have brought positive effects on the ecosystem. For instance, the increased abundance of eutrophic and benthic diatoms after 1980 (below 57 cm of the sediment core) suggests increased proliferation of aquatic plants in the reservoir [45], with a higher capacity to mitigate the impact of heavy metals and nutrients on the ecosystem (Figure 5). The extended reservoir area, with a water level rise shown by the combination of remote sensing images and historical data (Table 3, Figure 2), indicates a suitable habitat for A. granulata after 1980. However, since about 1988 and the early 1990s, the climatic effects prevailing in the reservoir intensified the decline of the reservoir area and water level, (Figure 2 and Figure 3) finally leading to a mesotrophic condition.
However, 2000–2010 witnessed accelerating pollution and prolonged eutrophication in the Miaotan Reservoir, with a deteriorated ecosystem and water quality, as evidenced by increased planktonic diatoms A. granulata and C. meneghiniana and non-planktonic species such as Nitzschia subacicularis, Nitzschia gracilis and Nitzschia palea [43]. The fluxes of heavy metals P, Cu, Zn and Pb in sediments increased significantly during this period, with Cu and Zn reaching a peak in 2001 (Figure 6). Despite an abnormally high content in 2001 and a slight decrease in 2006, the heavy metal contents remained relatively high until 2010 (Figure 6), indicating some prevailing climatic factors [43]. Climatic factors such as rainfall mostly intensified nutrient accumulation such as TP flux, mostly in the 2000s, yet there was little activity in 2005–2006 (Figure 3b).
Extended construction activities such as dams, spillways and culverts during the 1990s [29] further isolated the dam from the Dongjiang River, causing hydrological disruption to, for example, water and sediment balance [46]. A change in the natural pattern of sediment deposition has also been observed due to these constructions. For instance, the non-woven geotextiles used in the dam appear to have filtered sedimentary pollution and intercepted some of the particulate matter, consequently reducing the material flow to the Dongjiang River and purifying the flowing water [29]. The remote sensing images (2000–2010) of the Miaotan Reservoir (Figure 2d,e) showed a boundary that changed at the flattened southern section, and the extended northern section resulted in almost 2 km of additional shoreline length, further contributing to the material flow into the reservoir. However, ongoing restoration measures stabilized the disturbance, as evidenced by a decrease in the abundance of A. granulata and relatively constant rates of nutrient and heavy metal inputs into the Miaotan Reservoir (Figure 5).
Since the 1990s, the average temperature in the catchments has increased, and elevated temperatures have also contributed to the increased loading and release of endogenous nutrients into the reservoir. A. granulata and Nitzschia showed a significant negative correlation (Figure 6), suggesting that they have differences in their responses to nutrient loads in the reservoir over time, which has also been observed in Taibai Lake in eastern China [47]. For instance, a distinct low value observed in nutrient (TP) and heavy element (Cu) concentrations in the MT1 sediment core from the 30–28 cm section (corresponding to 2006–2008) revealed significant species turnover of diatoms A. granulata and Nitzschia. Precipitation records from 1990–2010 were one of the key factors that showed changes in the reservoir water level that may have affected the diatom community. In 2004, the rainfall was relatively low and gradually increased until 2010, forming two distinctive low values for the diatom composition.
Additionally, there was an increased number of typhoons affecting southeastern China in 2006 compared to the 2 years prior and after [48]. Typhoons commonly affect lake sedimentation, and this has been often reflected by various geophysical and geochemical indicators in the sedimentary records, such as TP and Cu [49]. In 2007–2008, a slight increase in medium-sized grains was found in the Miaotan Reservoir, which may have been caused by hydrological extremes such as typhoons, tsunamis, landslides or floods [50]. For instance, the intensified La Niña event in southeastern China in 2007–2008 is likely to have resulted in diatom community succussion indirectly, with more rainfall in the region causing increased lake and reservoir depths [51] with increased diatom habitat disturbances followed by alterations in the community. A decrease in the abundances of N. subacicularis, N. gracilis and N. palea, as well as a decline in the assemblage of A. granulata at a slower rate than that in the previous period, suggests some positive mitigation efforts made by the local environment authority regarding degraded water quality during this period [52]. However, the overall trend still indicates continuous deterioration of the ecosystem and water quality of the reservoir (Figure 5 and Figure 6). Furthermore, observed high sedimentation rates during 2009–2010 (Figure 6) clearly indicate a deteriorated reservoir environment, likely associated with intensified anthropogenic activities. After the 1990s, the Pearl River Delta (PRD) region of China suffered from increasing air pollution due to industrial development and urban expansion triggered by human activities [53]. The RDA (Figure 7) shows that Cu, population and grain yield strongly affected diatom succession during this phase (after 2000), confirming human-induced heavy metal and nutrient pollution. For instance, the diatom-inferred TP in the Miaotan Reservoir was consistently above 70 μg/L but below 110 μg/L (Figure 6), indicating that the period, 2009–2010, was a transition toward extended eutrophication [43].
According to our data on diatom assemblages, the period of 2010–2017 witnessed very high nutrient and heavy metal inputs as diatom biodiversity declined in the sedimentary records (Figure 5). The abundance of Cycotella meneghiniana, a typical eutrophic species in lakes [43], was more than 30% in the Miaotan Reservoir, indicating a degraded aquatic ecosystem after 2010. Similar to the eutrophic lake Taihu in southeast China, the marked increase in the abundance of N. subacicularis, N. gracilis and N. palea, together with a high optimum TP (104 μg/L), was reflected by prolonged eutrophication in the Miaotan Reservoir during this period [54]. Despite the relatively weak wind speed in 2010 (Figure 3a), A. granulata’s growth and abundance in the Miaotan Reservoir may have been intensified by changing meteorological conditions along with reservoir stratification and algal bloom [47]. Our results suggest that the northern area of the reservoir favored A. ambigua, which usually thrives in shallow water bodies with mesotrophic condition [54]. Zhang et al. [32] suggested that most medium-sized reservoirs in Huizhou City, including the Miaotan Reservoir, exhibited relatively poor water quality conditions due to increased water pollution in 2011. Lately, poultry and other livestock farms in the adjacent area have been identified as major sources of pollution [55]. The information provided by Lin et al. [56] indicates that there is an issue of illegal pollutant discharge, including nitrogen, phosphorus and pesticides, from livestock and poultry farming in the southeastern area of the Miaotan Reservoir [32]. The Pb content after 2015 also increased rapidly after a slight decrease, indicating a serious trend of heavy metal pollution in the Miaotan Reservoir (Figure 6), mainly being brought upon by industrial emissions, especially automobile exhaust [57].
Based on the land use map (Figure 1c), a road constructed on the dam of the Miaotan Reservoir was observed, and vehicular traffic was enabled near the reservoir, particularly in the southwestern and southern parts of the reservoir. The Miaotan Reservoir Project Management initiative in 2013 began to address water pollution issues, and in 2015, the local state council issued the “Action Plan for Prevention and Control of Water Pollution” [52] to combat water pollution, including foul smells, across the Guangdong–Hong Kong–Macao Greater Bay Area. After 2015 (above 15 cm core length), the Cu content displayed a decreasing trend in the sediment record of the Miaotan Reservoir. However, this still exceeds the Class I Surface Water Quality Standard of China, suggesting that more needs to be done to restore the ecological state of the reservoir [58].
A combination of increased human activities and climate change has led to the transition of the Miaotan Reservoir into a eutrophic stage, resulting in long-term ecological damage to the reservoir. The 2017–2020 period witnessed further changes in the ecosystem of the Miaotan Reservoir, when there was a notable shift in the abundance of the genus Achnanthes, which usually thrives in lesser concentrations of TP (60 μg/L) (Figure 5 and Figure 6). The Pb content in sediments at this time reached maximum values (Figure 6). As previously mentioned, there exists a transportation network around the Miaotan Reservoir. The rise in Pb, a significant component of automobile exhaust, signifies an increase in vehicular traffic in the vicinity, accompanied by heightened human activity in recent years. The study of Liu et al. [59] on the Zengtang Reservoir in the Guangzhou City also confirms that anthropogenic interventions in production activities can greatly increase the amount of nutrients and heavy metals entering a water body, leading to reservoir eutrophication and ecosystem degradation. Other studies [60,61] suggest that heavy metals enter lakes through various pathways. For example, Cu and Zn from industrial and waste pollution [62] and agricultural fertilizer residues, as well as Pb from automobile exhaust emissions [57], are considered solid and persistent pollutants in many aquatic ecosystems [63]. A study of stratified soil samples from a brownfield in Jiangsu Province showed that the pathway of heavy metal (Cu, Ni, Pb, Cd, As and Hg) contamination is largely dependent on agricultural discharge from upstream river catchments [61].
Pollution in the Miaotan Reservoir decelerated during 2017–2020, possibly due to improved management practices in nearby livestock farms and recent efforts to manage the river water environment [52]. However, the Miaotan Reservoir remains a persistent eutrophic water body, with heavy metal pollution threatening both ecological and human health over recent years. For instance, Pb accesses humans through the food chain, posing a risk to human health, including carcinogenic diseases [64]. Today, heavy metal pollution has become a major threat to the Miaotan Reservoir that needs to be addressed urgently with appropriate measures.
4.2. Exploration of the Variability in Pollution Sources and Their Hazards
This study highlights the advantage of subtropical reservoirs, particularly for those regions lacking natural lakes, to obtain high-resolution records of environmental changes in the Anthropocene. Until recently, studies using diatoms in lakes and reservoirs of the Pearl River Basin to reconstruct historical records and analyze mechanisms behind environmental impacts on ecosystems have received limited attention [11]. The selection of the location of the study determines how we can precisely assess the condition of the aquatic environment over time in the GBA. Although the Miaotan Reservoir was found to be a perfect site to study intra-urban water bodies in major urban agglomerations, there could be different responses to changes by the local environment. For instance, Sun et al.’s study [65] on Liuhua Lake in Guangzhou showed a slightly different trend in lacustrine evolution. Eutrophication in Liuhua Lake occurred during the 1960s, and this was likely due to differences in human settlement in the catchments. The Liuhua Lake catchment is densely populated with longer periods of impact on the lake ecosystem [65]. Unlike Liuhua Lake, which had TP as high as 146.24 µg/L in the 1980s, the Miaotan Reservoir, which is more arable with increased land and forested catchments mostly around the north, witnessed eutrophication only during the 1990s. However, the eastern area of the Sibao Reservoir more or less resembles the Miaotan Reservoir, showing a similar ecological trend over time. Fu et al. [66,67] found that the increase in N and P nutrients in the Sibao Reservoir in Jiangmen City, Guangdong Province, was due to higher temperatures and precipitation causing water quality deterioration. In addition, the Sibao Reservoir received nutrient discharge from poultry and livestock from its adjacent catchment, causing further eutrophication and water quality degradation [67]. There have been other studies on reservoirs outside the GBA, such as that by Chen et al. [68]. From these studies, it is apparent that certain reservoirs were constructed on existing cultivated and residential land, leading to the internal release of elevated levels of TP, TN and heavy metals, consequently resulting in the degradation of aquatic ecosystems and a decline in water quality. Furthermore, variations exist in the research approaches employed by different scholars. For instance, our study utilizes diatom species succession and a range of environmental factors to reconstruct the historical environmental evolution of the reservoir and to infer the causes of water body eutrophication. In contrast, Fu et al. [69] employed lengthy time series data to detect changes. Nevertheless, a common thread among the causes of water ecosystem deterioration in reservoirs and even lakes is human activity, a major disruptive factor.
Inadequate livestock and poultry management in Guangdong Province has caused persistent water pollution in the Miaotan Reservoir. Limited water regulations and poor water resource governance has further intensified the condition. In conjunction with enhancing livestock management, socioeconomic uplift is needed. High-resolution historical environmental reconstructions can help improve our understanding of reservoir ecosystems within the Guangdong–Hong Kong–Macao Greater Bay Area over decadal to centennial scales [7].
5. Conclusions
By integrating paleoenvironmental, instrumental and historically documented resources such as crop yields on multi-decadal scales, we demonstrate the evolution of the Miaotan Reservoir in the Guangdong–Hong Kong–Macao Greater Bay Area using diatom assemblages and other sedimentary proxies as indicators. We find several distinct ecological stages over the past 70 years, with occurrences of major transitions in the diatom community. Transitions occurred predominantly from the combination of the planktonic species A. granulata and nutrient-poor A. ambigua epiphytic and the benthic species N. gracilis, N. subacicularis, N. palea and Achanathes sp., indicative of gradual reservoir eutrophication. The timing and interactions among social, economic and ecological factors, such as exogenous pollutants primarily derived from agriculture, influence long-term ecological dynamics. Through a comparison of various studies on reservoir ecosystems in China, we identify commonalities in pollutants that are responsible for contamination. Although the precise mechanisms of influence may vary, they all share a common factor, which is increased human activity within and adjacent to the environment of the Miaotan Reservoir and other reservoirs. Our results highlight the importance of the long-term dynamics and responses of aquatic ecosystems to socio-economic and environmental changes while working toward a sustainable freshwater ecosystem management program.
Author Contributions
Y.L. (Yuke Li): Investigation, Data curation, Methodology, Writing—original draft preparation. Y.L. (Yan Li): Conceptualization, Methodology, Writing—review and editing, Supervision. H.Y.: Methodology, Funding acquisition, Investigation. Q.H.: Investigation, Data curation, Methodology, Validation. G.H.: Data curation, Validation. G.K.: Writing—review and editing, Funding acquisition, Project administration. All authors have read and agreed to the published version of the manuscript.
Funding
This research was funded by Innovation and Entrepreneurship training program for college students (No. xj202211078222), the Alliance of Guangzhou International Sister-City Universities (awarded to Meryem Beklioglu, Erik Jeppesen and Xuhui Dong), and the Longshan Professorship and a talent grant (#1511582101011) from the Nanjing University of Information Science and Technology (NUIST), and visiting a scholar program at Tsinghua University and Guangzhou University (China).
Data Availability Statement
The data that support the findings of this study are available from the corresponding author upon justified request.
Conflicts of Interest
The authors declare that they have no known competing financial interest or personal relationship that could have appeared to influence the work reported in this paper.
References
- Hui, E.C.; Li, X.; Chen, T.; Lang, W. Deciphering the spatial structure of China’s megacity region: A new bay area—The Guangdong-Hong Kong-Macao Greater Bay Area in the making. Cities 2020, 105, 102168. [Google Scholar] [CrossRef]
- Wang, Y.; Huang, C.; Wu, G.; Wang, W. Status and challenges of water resources and supply in the Guangdong-Hong Kong-Macao Greater Bay Area (GBA) of China. Water Cycle 2022, 3, 65–70. [Google Scholar] [CrossRef]
- Zhang, L.; Jiang, Z.; Xiaoping, H. The Protecting Strategies about the Atmosphere, Water and Wetland in Guangdong-Hong Kong-Macau Greater Bay Area. Environ. Sci. Manag. 2022, 47, 160–165, (In Chinese with English Abstract). [Google Scholar]
- Tang, J. Review and summary of the five-year practice of treating black and smelly water bodies in Guangdong. Superv. Test Cost Constr. 2020, 13, 33–37+40, (In Chinese with English Abstract). [Google Scholar]
- Wengrat, S.; Bennion, H.; Ferreira, P.A.d.L.; Figueira, R.C.L.; Bicudo, D.C. Assessing the degree of ecological change and baselines for reservoirs: Challenges and implications for management. J. Paleolimnol. 2019, 62, 337–357. [Google Scholar] [CrossRef]
- Dong, X.; Yang, X.; Chen, X.; Liu, Q.; Yao, M.; Wang, R.; Xu, M. Using sedimentary diatoms to identify reference conditions and historical variability in shallow lake ecosystems in the Yangtze floodplain. Mar. Freshw. Res. 2016, 67, 803–815. [Google Scholar] [CrossRef]
- Su, Y.; Dong, X.; Li, Y.; Hong, Q.; Flower, R. Optimizing safe and just operating spaces at sub-watershed scales to guide local environmental management. J. Clean. Prod. 2023, 398, 136530. [Google Scholar] [CrossRef]
- Bennion, H.; Simpson, G.L.; Goldsmith, B.J. Assessing degradation and recovery pathways in lakes impacted by eutrophication using the sediment record. Front. Ecol. Evol. 2015, 3, 94. [Google Scholar] [CrossRef]
- Zhou, Y.; Wang, L.; Xiao, T.; Chen, Y.; Beiyuan, J.; She, J.; Zhou, Y.; Yin, M.; Liu, J.; Liu, Y. Legacy of multiple heavy metal (loid) s contamination and ecological risks in farmland soils from a historical artisanal zinc smelting area. Sci. Total Environ. 2020, 720, 137541. [Google Scholar] [CrossRef] [PubMed]
- Dubois, N.; Saulnier-Talbot, É.; Mills, K.; Gell, P.; Battarbee, R.; Bennion, H.; Chawchai, S.; Dong, X.; Francus, P.; Flower, R.; et al. First human impacts and responses of aquatic systems: A review of palaeolimnological records from around the world. Anthr. Rev. 2018, 5, 28–68. [Google Scholar] [CrossRef]
- Lei, Y.; Du, X.; Wang, Y.; Chen, Q.; Tang, H.; Jiang, S. Diatom succession dynamics controlled by multiple forces in a subtropical reservoir in southern China. Quat. Int. 2018, 493, 227–244. [Google Scholar] [CrossRef]
- Battarbee, R.W.; Anderson, N.J.; Jeppesen, E.; Leavitt, P.R. Combining palaeolimnological and limnological approaches in assessing lake ecosystem response to nutrient reduction. Freshw. Biol. 2005, 50, 1772–1780. [Google Scholar] [CrossRef]
- Wang, C.; Lek, S.; Lai, Z.; Tudesque, L. Morphology of Aulacoseira filaments as indicator of the aquatic environment in a large subtropical river: The Pearl River, China. Ecol. Indic. 2017, 81, 325–332. [Google Scholar] [CrossRef]
- Wu, N.; Dong, X.; Liu, Y.; Wang, C.; Baattrup-Pedersen, A.; Riis, T. Using river microalgae as indicators for freshwater biomonitoring: Review of published research and future directions. Ecol. Indic. 2017, 81, 124–131. [Google Scholar] [CrossRef]
- Smol, J.P.; Stoermer, E.F. The Diatoms: Applications for the Environmental and Earth Sciences; Cambridge University Press: Cambridge, UK, 2010. [Google Scholar]
- Battarbee, R.W.; Turner, S.; Yang, H.; Rose, N.L.; Smyntek, P.M.; Reimer, P.J.; Oldfield, F.; Jones, V.J.; Flower, R.J.; Roe, K.; et al. Air pollutant contamination and acidification of surface waters in the North York Moors, UK: Multi-proxy evidence from the sediments of a moorland pool. Holocene 2014, 25, 226–237. [Google Scholar] [CrossRef]
- Tropea, A.E.; Ginn, B.K.; Cumming, B.F.; Smol, J.P. Tracking long-term acidification trends in Pockwock Lake (Halifax, Nova Scotia), the water supply for a major eastern Canadian city. Lake Reserv. Manag. 2007, 23, 279–286. [Google Scholar] [CrossRef]
- Liu, X.; Li, Y.; Shen, R.; Jeppesen, E.; Liu, Z.; Chen, F. A trophic cascade triggers blooms of Asterionella formosa in subtropical eutrophic Lake Taihu, China. Freshw. Biol. 2022, 67, 1938–1948. [Google Scholar] [CrossRef]
- Wachnicka, A.; Gaiser, E.; Collins, L.S. Correspondence of historic salinity fluctuations in Florida Bay, USA, to atmospheric variability and anthropogenic changes. J. Paleolimnol. 2013, 49, 103–115. [Google Scholar] [CrossRef]
- Zong, Y.; Kemp, A.C.; Yu, F.; Lloyd, J.M.; Huang, G.; Yim, W.W.S. Diatoms from the Pearl River estuary, China and their suitability as water salinity indicators for coastal environments. Mar. Micropaleontol. 2010, 75, 38–49. [Google Scholar] [CrossRef]
- Xu, M.; Wang, R.; Dong, X.; Zhang, Q.; Yang, X. Intensive human impacts drive the declines in heterogeneity of diatom communities in shallow lakes of East China. Ecol. Indic. 2022, 140, 108994. [Google Scholar] [CrossRef]
- Zhang, Y.; Deng, J.; Qin, B.; Zhu, G.; Zhang, Y.; Jeppesen, E.; Tong, Y. Importance and vulnerability of lakes and reservoirs supporting drinking water in China. Fundam. Res. 2022, 3, 265–273. [Google Scholar] [CrossRef]
- Kattel, G.; Gell, P.; Zawadzki, A.; Barry, L. Palaeoecological evidence for sustained change in a shallow Murray River (Australia) floodplain lake: Regime shift or press response? Hydrobiologia 2017, 787, 269–290. [Google Scholar] [CrossRef]
- Kattel, G.; Reeves, J.; Western, A.; Zhang, W.; Jing, W.; McGowan, S.; Cuo, L.; Scales, P.; Dowling, K.; He, Q. Healthy waterways and ecologically sustainable cities in Beijing-Tianjin-Hebei urban agglomeration (northern China): Challenges and future directions. Wiley Interdiscip. Rev. Water 2021, 8, e1500. [Google Scholar] [CrossRef]
- Huang, J.; Zhang, Y.; Arhonditsis, G.B.; Gao, J.; Chen, Q.; Wu, N.; Dong, F.; Shi, W. How successful are the restoration efforts of China’s lakes and reservoirs? Environ. Int. 2018, 123, 96–103. [Google Scholar] [CrossRef]
- Xian, H.; Dong, X.; Li, Y.; Huang, J.; Li, X.; Huang, G.; Jeppesen, E. Reservoirs as high-efficacy sentinels of regional atmospheric pollution and precipitation: Magnetic and chemical evidence from a typical subtropical reservoir in South China. Environ. Sci. Pollut. Res. 2023, 30, 92507–92524. [Google Scholar] [CrossRef]
- Han, B.-P.; Liu, Z. Tropical and Sub-Tropical Reservoir Limnology in China: Theory and Practice; Springer Science & Business Media: Berlin/Heidelberg, Germany, 2011; Volume 91. [Google Scholar]
- Ma, R.; Yang, G.; Duan, H.; Jiang, J.; Wang, S.; Feng, X.; Li, A.; Kong, F.; Xue, B.; Wu, J.; et al. China’s lakes at present: Number, area and spatial distribution. Sci. China Earth Sci. 2011, 54, 283–289. [Google Scholar] [CrossRef]
- Chen, Y.; He, S. Application of nonwoven geotextile in culvert drainage of Miaotan Reservoir dam body. Guangdong Water Resour. Hydropower 2010, 54–56, (In Chinese with English Abstract). [Google Scholar]
- Guangdong Bureau of Statistics. Guang Dong Statistical Yearbook—2020 Editorial Committee and Editorial and Publishing Staff; China Statistics Press: Beijing, China, 2020; pp. 4–5. ISBN 978-7-5037-9226-7. [Google Scholar]
- Zhao, J.; Li, L.; Zhang, A.-S.; Li, J. Discussions of the river-lake interconnected relationship connotation. J. East China Normal Univ. 2016, 4, 118–128, (In Chinese with English Abstract). [Google Scholar]
- Zhang, Z. Current situation of water quality of medium-sized reservoirs in Huizhou City and analysis of protection countermeasures. Guangdong Water Resour. Hydropower 2013, 49–52, (In Chinese with English Abstract). [Google Scholar]
- Chen, Y. (Ed.) Hui Zhou Statistical Yearbook—1949–1993 Editorial Committee; China Statistics Press: Beijing, China, 1993; p. 6. ISBN 7-5037-1583-9/C.924. [Google Scholar]
- Luo, Z.; Li, J. (Eds.) Hui Zhou Statistical Yearbook—2021 Editorial Committee and Editorial and Publishing Staff; China Statistics Press: Beijing, China, 2021; p. 4. ISBN 978-7-5037-9597-8. [Google Scholar]
- EarthExplorer. Available online: https://earthexplorer.usgs.gov/ (accessed on 27 September 2022).
- Appleby, P. Chronostratigraphic techniques in recent sediments. In Tracking Environmental Change Using lake Sediments: Basin Analysis, Coring, and Chronological Techniques; Springer: Berlin/Heidelberg, Germany, 2001; pp. 171–203. [Google Scholar]
- Battarbee, R.W.; Jones, V.J.; Flower, R.J.; Cameron, N.G.; Bennion, H.; Carvalho, L.; Juggins, S. Diatoms; Springer: Berlin/Heidelberg, Germany, 2001. [Google Scholar]
- Krammer, K.; Lange-Bertalot, H. Süßwasserflora von Mitteleuropa, Bd. 02/3: Bacillariophyceae: Teil 3: Centrales, Fragilariaceae, Eunotiaceae; Springer: Berlin/Heidelberg, Germany, 1991; Volume 2. [Google Scholar]
- Grimm, E.C. CONISS: A FORTRAN 77 program for stratigraphically constrained cluster analysis by the method of incremental sum of squares. Comput. Geosci. 1987, 13, 13–35. [Google Scholar] [CrossRef]
- Grimm, E.C. Tilia and Tiliagraph; Illinois State Museum: Springfield, IL, USA, 1991; p. 101. [Google Scholar]
- Ter Braak, C.J.F.; Smilauer, P. CANOCO–Reference Manual and User’s Guide to Canoco for Windows–Software for Canonical Community Ordination (Version 4.5); Microcomputer Power: Ithaca, NY, USA, 2002. [Google Scholar]
- Zhang, Q. A Study of Population Migration and Regional Economic Development Differences in China—Regional, Urban and Metropolitan Area Perspectives. Ph.D. Thesis, Fudan University, Shanghai, China, 2009. (In Chinese with English Abstract). [Google Scholar]
- Dong, X.; Yang, X.; Wang, R. Diatom indicative species of eutrophication of the lakes in the middle and lower reach regions of Yangtze River. China Environ. Sci. 2006, 26, 570–574, (In Chinese with English Abstract). [Google Scholar]
- Hui Zhou Statistical Yearbook—2000 Editorial Committee; China Statistics Press: Beijing, China, 2000; p. 6. ISBN 7-5037-3319-5/c.1790.
- Zhang, Q.H.; Dong, X.H.; Yang, X.D.; Liu, E.F.; Lin, Q.; Cheng, L.J.; Liu, L.; Jeppesen, E. Aquatic macrophyte fluctuations since the 1900s in the third largest Chinese freshwater lake (Lake Taihu): Evidences, drivers and management implications. Catena 2022, 213, 106153. [Google Scholar] [CrossRef]
- Li, Y.; Liao, Y.J.; Dong, X.H.; Xian, H.B.; Kattel, G. Hydrological disconnection from the Yangtze River triggered rapid environmental degradation in a riverine lake. Limnologica 2022, 95, 125993. [Google Scholar] [CrossRef]
- Zhang, Q.; Dong, X.; Yang, X. Environmental evolution of Lake Liangzi and its driving factors over the past 100 years, Hubei Province. J. Lake Sci. 2016, 28, 545–553, (In Chinese with English Abstract). [Google Scholar]
- Wang, J.; Wang, J.; Dai, J.; Yang, Y.; Lv, Y. Statistical analysis of the characteristics of typhoons in China from 1977 to 2018. Trans. Oceanol. Limnol. 2021, 43, 28–33, (In Chinese with English Abstract). [Google Scholar] [CrossRef]
- Das, O.; Wang, Y.; Donoghue, J.; Xu, X.; Coor, J.; Elsner, J.; Xu, Y. Reconstruction of paleostorms and paleoenvironment using geochemical proxies archived in the sediments of two coastal lakes in northwest Florida. Quat. Sci. Rev. 2013, 68, 142–153. [Google Scholar] [CrossRef]
- Xian, H.B.A.; Dong, X.H.; Li, Y.; Zhan, N.; Jeppesen, E. High-resolution reconstruction of typhoon events since similar to 1850 CE based on multi-proxy sediment records in a coastal lagoon, South China. Sci. Total Environ. 2022, 803, 150063. [Google Scholar] [CrossRef] [PubMed]
- Wen, M.; Yang, S.; Kumar, A.; Zhang, P. An Analysis of the Large-Scale Climate Anomalies Associated with the Snowstorms Affecting China in January 2008. Mon. Weather Rev. 2009, 137, 1111–1131. [Google Scholar] [CrossRef]
- Council, T.S. Circular of the State Council on the Issuance of the Action Plan for the Prevention and Control of Water Pollution. Available online: https://www.gov.cn/zhengce/content/2015-04/16/content_9613.htm (accessed on 4 October 2015).
- Lin, M.; Chan, I.-N.; Chan, C.-Y.; Wang, X.-M.; Dong, H.-Y. Emerging Air Pollution Issues in Changing Pearl River Delta of South China; IntechOpen: London, UK, 2011. [Google Scholar]
- Dong, X.H.; Bennion, H.; Battarbee, R.; Yang, X.D.; Yang, H.D.; Liu, E.F. Tracking eutrophication in Taihu Lake using the diatom record: Potential and problems. J. Paleolimnol. 2008, 40, 413–429. [Google Scholar] [CrossRef]
- Li, J. Study on the Hazards of Livestock and Poultry Breeding Pollution and the Legal Measures for Ecological Control: A Case Study of Guangdong Province in China. In Nature Environment & Pollution Technology; BoD–Books on Demand: Norderstedt, Germany, 2017; p. 16. [Google Scholar]
- Lin, Y. The Presence of Illegal Farms Results in an Excessive Amount of TP in the Water Quality of Miaotan Reservoir. Available online: https://news.sina.cn/sa/2013-04-18/detail-ikmxzfmk1980872.d.html?from=wap (accessed on 13 February 2023).
- Cetin, M.; Aljama, A.M.O.; Alrabiti, O.B.M.; Adiguzel, F.; Sevik, H.; Zeren Cetin, I. Determination and mapping of regional change of Pb and Cr pollution in Ankara city center. Water Air Soil Pollut. 2022, 233, 163. [Google Scholar] [CrossRef]
- GB 3838-2002; Environmental Quality Standards for Surface Water GHZB. China Environmental Science Press: Beijing, China, 1999.
- Liu, Y.; Qin, J.; Liang, Z. Analysis of Aquatic Ecosystem of Zeng Tang Reservior from Virtuous Cycle to Eutrophication. Guangdong Chem. Ind. 2011, 38, 99–101, (In Chinese with English Abstract). [Google Scholar]
- Liu, H.; Zhang, Z.; Li, W. Assessment and spatial patterns of trace elements and heavy metals from water body and sediments in the Liangzi Lake. Resour. Environ. Yangtze Basin 2011, 20, 105–111, (In Chinese with English Abstract). [Google Scholar]
- Yu, J.Y.; Wang, J.J.; Zhang, W.; Kattel, G.R.; Kumar, A.; Yu, Z.G. Complexity of hydrology, sewage and industries in distribution and migration pathways of heavy metals at spatial scale of China’s brownfields. Ecohydrology 2023, e2588. [Google Scholar] [CrossRef]
- Cheng, S. Heavy metal pollution in China: Origin, pattern and control. Environ. Sci. Pollut. Res. 2003, 10, 192–198. [Google Scholar] [CrossRef] [PubMed]
- Arnason, J.G.; Fletcher, B.A. A 40+ year record of Cd, Hg, Pb, and U deposition in sediments of Patroon Reservoir, Albany County, NY, USA. Environ. Pollut. 2003, 123, 383–391. [Google Scholar] [CrossRef]
- Jiang, X.; Luo, Y.; Zhao, Q.; Wu, S.; Wu, L.; Qiao, X.; Song, J. Phytoremediation of heavy metal contaminated soil I. Response of metal-enriched plant Brassica juncea to Cu, Zn, Cd, Pb pollution. Soils 2000, 52, 71–74, (In Chinese with English Abstract). [Google Scholar] [CrossRef]
- Sun, K. Revelation of Modern Water Environment Evolution and Ecological Restoration of Liuhua Lake in Guangzhou. Master’s Thesis, Guangzhou University, Guangzhou, China, 2020. (In Chinese with English Abstract). [Google Scholar]
- Fu, B.; Huang, G. Study on spatiotemporal variations and comprehensive Evaluation of water quality of Sibao Reservoir in Jiangmen City, Guangdong Province. Hydropower Energy Sci. 2019, 30, 64–71, (In Chinese with English Abstract). [Google Scholar]
- Fu, B. The Study of Non-Point Source Pollution and Health Assessment for Sibao Reservoir in Jiangmen City. Master’s Thesis, South China University of Technology, Guangzhou, China, 2020. (In Chinese with English Abstract). [Google Scholar]
- Chen, J.; Wang, J.; Yu, J.; Zeng, Y.; Yang, H.; Zhang, R.; Guo, J. Characteristics of reservoir ecosystems in Southwest China and research outlook. Earth Environ. 2017, 45, 115–125, (In Chinese with English Abstract). [Google Scholar] [CrossRef]
- Fu, B.; Huang, G. Comprehensive Evaluation of Health of Sibao Reservoir in Jiangmen City Based on Set-pair Analysis Method. Hydropower Energy Sci. 2020, 38, 46–50, (In Chinese with English Abstract). [Google Scholar]
Figure 1.
Map of the Miaotan Reservoir and its surroundings: (a) The topography of Guangdong Province, China, and its environs; (b) The essential administrative divisions of the Guangdong-Hong Kong-Macao Greater Bay Area and portions of its vicinity; (c) The land use surrounding the Miaotan Reservoir.

Figure 2.
Morphological changes in Miaotan Reservoir in different periods: (a–f) Morphology of the Miaotan Reservoir and the East River during six different time periods; (g) Trend in reservoir shoreline length and area since 1942.
Figure 2.
Morphological changes in Miaotan Reservoir in different periods: (a–f) Morphology of the Miaotan Reservoir and the East River during six different time periods; (g) Trend in reservoir shoreline length and area since 1942.

Figure 3.
Meteorological and socio-economic changes surrounding the Miaotan Reservoir in 1950–2020: (a) Average temperature and Average 2 min wind speed; (b) Days with daily precipitation > 0.1 mm and duration of sunshine; (c) Population and grain yield of Huizhou City.
Figure 3.
Meteorological and socio-economic changes surrounding the Miaotan Reservoir in 1950–2020: (a) Average temperature and Average 2 min wind speed; (b) Days with daily precipitation > 0.1 mm and duration of sunshine; (c) Population and grain yield of Huizhou City.

Figure 4.
Change in unsupported 210Pbex (a), 137Cs (b) and age–depth relationship in black and age–SAR relationship in blue (c) of sediment core MT1.
Figure 4.
Change in unsupported 210Pbex (a), 137Cs (b) and age–depth relationship in black and age–SAR relationship in blue (c) of sediment core MT1.

Figure 5.
Temporal trend of the diatom community in the sedimentary core of the Miaotan Reservoir in 1945–2020.
Figure 5.
Temporal trend of the diatom community in the sedimentary core of the Miaotan Reservoir in 1945–2020.

Figure 6.
Sedimentary proxies, including axis 1 scores of diatoms PCA analysis (PCA1), sediment accumulation rate (SAR) and medium grain size (Md), and social development variables, including permanent resident population and grain yield. The dashed lines in the figure indicate the zonation results corresponding to the succession of diatom assemblages.

Figure 7.
Redundancy analysis (RDA) exploring the relationship between diatom communities and significantly correlated variables.
Figure 7.
Redundancy analysis (RDA) exploring the relationship between diatom communities and significantly correlated variables.


Table 1.
Water quality parameters of the Miaotan Reservoir in 2019.
| Parameters | NH4+-N | NO3−-N | TN | TP | Chlorophyll a | pH | Conductivity |
|---|---|---|---|---|---|---|---|
| Unit | mg/L | mg/L | mg/L | µg/L | µg/L | µs/cm2 | |
| Value | 0.067 | 0.196 | 2.138 | 86 | 60 | 8.77 | 108.9 |
Table 2.
Paired Pearson correlation analysis between multiple proxies.
| Variable | PCA1 | SAR | TP | TP Flux | Cu | Zn | Pb | Grain Yield | Population | LOI | Temperature |
|---|---|---|---|---|---|---|---|---|---|---|---|
| SAR | −0.11 | ||||||||||
| TP | −0.55 ** | 0.65 ** | |||||||||
| Flux of TP | −0.31 | 0.92 ** | 0.84 ** | ||||||||
| Cu | −0.49 ** | 0.56 ** | 0.94 ** | 0.74 ** | |||||||
| Zn | −0.60 ** | 0.47 ** | 0.90 ** | 0.67 ** | 0.92 ** | ||||||
| Pb | −0.12 | 0.33 | 0.19 | 0.20 | 0.09 | 0.14 | |||||
| Grain yield | −0.50 ** | 0.64 ** | 0.83 ** | 0.68 ** | 0.81 ** | 0.74 ** | 0.46 ** | ||||
| Population | −0.74 ** | 0.47 ** | 0.83 ** | 0.59 ** | 0.75 ** | 0.79 ** | 0.33 | 0.89 ** | |||
| LOI | −0.81 ** | 0.26 | 0.71 ** | 0.43 ** | 0.64 ** | 0.75 ** | 0.19 | 0.72 ** | 0.94 ** | ||
| Temperature | −0.40 * | 0.37 * | 0.49 ** | 0.40 * | 0.40 * | 0.37 * | 0.33 | 0.62 ** | 0.60 ** | 0.53 ** | |
| Wind Speed | 0.07 | −0.63 ** | −0.53 ** | −0.58 ** | −0.48 ** | −0.83 * | −0.46 ** | −0.54 ** | −0.46 ** | −0.28 | −0.49 ** |
Note: **, expresses significance at p ≤ 0.01; *, expresses significance at p ≤ 0.05.
Table 3.
Significant environmental variables selected by partial RDA with forward selection procedure.
Table 3.
Significant environmental variables selected by partial RDA with forward selection procedure.
| Explanatory Variable | Ratio of Eigenvalue λ1/λ2 | Percentage of Explained Variation (%) | p |
|---|---|---|---|
| Population | 1.61 | 25.0 | 0.002 |
| Grain yield | 0.49 | 5.3 | 0.004 |
| Cu | 0.48 | 7.2 | 0.002 |
Disclaimer/Publisher’s Note: The statements, opinions and data contained in all publications are solely those of the individual author(s) and contributor(s) and not of MDPI and/or the editor(s). MDPI and/or the editor(s) disclaim responsibility for any injury to people or property resulting from any ideas, methods, instructions or products referred to in the content. |
© 2023 by the authors. Licensee MDPI, Basel, Switzerland. This article is an open access article distributed under the terms and conditions of the Creative Commons Attribution (CC BY) license (https://creativecommons.org/licenses/by/4.0/).
Share and Cite
MDPI and ACS Style
Li, Y.; Li, Y.; Yang, H.; Hong, Q.; Huang, G.; Kattel, G. Century-Scale Environmental Evolution of a Typical Subtropical Reservoir in the Guangdong–Hong Kong–Macao Greater Bay Area. Water 2023, 15, 3639. https://doi.org/10.3390/w15203639
AMA Style
Li Y, Li Y, Yang H, Hong Q, Huang G, Kattel G. Century-Scale Environmental Evolution of a Typical Subtropical Reservoir in the Guangdong–Hong Kong–Macao Greater Bay Area. Water. 2023; 15(20):3639. https://doi.org/10.3390/w15203639
Chicago/Turabian StyleLi, Yuke, Yan Li, Hanfei Yang, Quan Hong, Guoyao Huang, and Giri Kattel. 2023. "Century-Scale Environmental Evolution of a Typical Subtropical Reservoir in the Guangdong–Hong Kong–Macao Greater Bay Area" Water 15, no. 20: 3639. https://doi.org/10.3390/w15203639
Note that from the first issue of 2016, this journal uses article numbers instead of page numbers. See further details here.