
SPI and SPEI Drought Assessment and Prediction Using TBATS and ARIMA Models, Jordan

1
School of Electronic and Information Engineering, Beihang University, Beijing 100191, China
2
Department of Land, Water and Environment, School of Agriculture, University of Jordan, Amman 11942, Jordan
*
Author to whom correspondence should be addressed.
Water 2023, 15(20), 3598; https://doi.org/10.3390/w15203598
Submission received: 27 August 2023
/
Revised: 8 October 2023
/
Accepted: 11 October 2023
/
Published: 14 October 2023
Abstract
:Drought is a complex threat where its propagation is not yet controllable, causing more environmental, social, and economic damage. This research assesses the effects of incessant warming and decrescent precipitation by calculating SPI and SPEI from 1985 to 2021 in the Amman –Zarqa Basin based on five grid points on time and space scales. The study applied the Pearson Correlation Coefficient (PCC) between each one-to-one index at different time scales and the Mann–Kendall test (MKT) to determine trends with different data sources to measure the inferential capturing of historical drought features. Machine learning algorithms are used to predict near-future droughts from 2022 to 2025. TBATS and ARIMA models run diverse input datasets, including observations, CSIC, and CMIP6-ssp126 datasets. The longest drought duration was 14 months. Drought severity and average intensity were found to be −24.64 and −1.76, −23.80 and −1.83, −23.57 and −1.96, and −23.44 and −2.0 where the corresponding drought categories were SPI-12 Sweileh, SPI-9 Sweileh, SPI-12 Wadi Dhullal, SPI-12 Amman Airport, respectively. The dominant drought event occurred between Oct 2020 and Dec 2021. CMIP6-ssp126 can capture the drought occurrence and severity by measuring SPI but did not capture the severity magnitude as the observations (SPI was −2.87 by observation and −1.77 by CMIP6). There are significant differences in drought dimensions between SPI and SPEI, where SPI was more sensitive to drought assessment than SPEI. Using CMIP6-ssp126, ARIMA was more accurate than TBATS, as well as using the observed historical SPEI and CSIC across all stations. The performance metrics ME, RMSE, MAE, and MASE implied significantly promising forecasting models with values of −0.0046, 0.278, 0.179, and 0.193, respectively, for ARIMA and −0.0181, 0.538, 0.416, and 0.466, respectively, for TBATS. The outcomes suggest an increased risk of drought incidents and, consequently, water deficits in the future. Hybrid modelling is suggested for more consistency and robustness of forecasting approaches.
Keywords:
SPI; SPEI; CSIC; CMIP6 ssp126; MK Test; Amman–Zarqa Basin-Jordan; drought forecast; forecast models1. Introduction
Drought is a disaster that affects water availability, crop development, ecological sustainability, and food production [1,2,3,4,5,6]. Drought is more severe than any other hydro-meteorological hazards that affect a high number of masses and their livelihoods over a broader geographical extent [7]. More severe droughts are expected globally and regionally due to global warming and climate change, with increased drought risk [8,9,10]. Droughts are generally forecast and characterised by indices for the purposes of drought mitigation and monitoring [1,2,11]. Drought severity, duration, and affected areas have all increased globally since 1970, most notably in the tropics and subtropics, where rising temperatures and decreased precipitation have exacerbated drought conditions.
Because climatic conditions differ by region, many drought indices are used to track droughts worldwide because a single drought index does not provide detailed information about droughts. Drought assessment studies concentrate on single to two indices. Therefore, it is favourable to calculate different drought indices. Many studies were conducted to quantify droughts, and nearly 50 indices based on various variables were developed. Despite different drought indices offered, the mainstream only provides a vague explanation and inadequate information about droughts.
In recent decades, drought indices have been widely used to monitor and characterise drought events. Drought and climate scientists have elaborated the number of drought indices for this purpose. The requirements of data inputs vary from index to index, and similarly, the indices characterise different types of droughts. To identify meteorological droughts, indices such as the Palmer Drought Severity Index (PDSI), Standardized Precipitation Index (SPI), Standardized Precipitation Evapotranspiration Index (SPEI), China Z Index (CZI), and Effective Drought Index (EDI) are used frequently. In agricultural and ecological studies, drought researchers normally use the Vegetation Condition Index (VCI), Temperature Condition Index (TCI), Vegetation Health Index (VHI), Temperature Vegetation Dryness Index (TVDI), Soil Moisture Index (SMI), …, etc. Drought can escalate over time when there is no precise method to detect and predict it. However, the prolonged influence of a drought event urges characterising and forecasting drought where indices are generally used. In situ drought indices such as SPI and SPEI were proposed ages ago to monitor drought based on weather station observations. The restrictions of data availability on large-scale and fine resolutions urged further applications to construct new indices. Single remotely sensed indices were developed, although they were difficult to reflect all magnitudes of drought [12]. To justify the complication and diversity of drought, combined indices were suggested and deployed.
The Amman–Zarqa Basin is witnessing drought incidents under the significant effect of climate change, including changes in precipitation patterns and increased temperatures, which could exacerbate water scarcity and other environmental challenges in the region. In the current study, the meteorological and hydrological droughts will be characterised using SPI and SPEI indices. The meteorological data from five stations in AZB such as precipitation, temperature, and evaporation were used for the calculation of SPI and SPEI using a 3-, 6-, 9-, and 12 month scale for the temporal period 1985–2021. The drought severity, intensity, detailed frequency, and probability were calculated for each drought temporal scale.
For drought risk wake-up-calls, statistical and numerical models are used to predict drought, which were combined later with physical and dynamical models [13]. Here, the study aimed to gain insights into the relationship between drought and precipitation, evapotranspiration, and climate model projections, as well as to make the best-modelled forecast for future drought monitoring. The main research purposes are as follows: (1) calculate historical SPI and SPEI at different time scales based on station observations, CSIC-SPEI, and CMIP6-ssp126 to estimate the effects of changing precipitation and temperature on drought dimensions from 1985 to 2021, (2) calculate MKT and PCC to determine the drought trends across the basin as well as the correlation of one-to-one in situ indices to measure the inferential capturing of drought events, and so use in future in case of nontransmissible observations, (3) calculate drought frequency, longest duration, intensity, severity and probability of occurrence, and (4) train the historical SPI and SPEI datasets and validate forecasting algorithms of ARIMA and TBATS for near-future drought prediction severity between 2022 and 2025. The results might be a consistent reference for the government to enhance the specificity of drought prevention measures and allow safe response to emergency events during times of drought hotspots in the basin.
Study Area
The study area comprises the region of the Amman–Zarqa Basin, one of the important hydrological basins in Jordan, located in the northwestern part of the country (Figure 1). Its geometry extends from (31.86072 to 32.39702° N) and from (35.542293 to 36.598173° E). The climate of the Amman–Zarqa Basin is influenced by a number of factors, including its location in the eastern Mediterranean region, its proximity to the Arabian Desert, and its elevation above sea level of around 700–800 m, which contributes to the cooler temperatures compared to lower-lying areas. The summers mostly remain dry, while rainfall occurs in the winter season, where the western part of the basin receives more rainfall from the Mediterranean cold fronts, and the eastern parts mostly remain dry. Table 1 represents the temperature and precipitation of different meteorological stations in the study area. The average long-term temperature during 1985–2021 in the Wadi Dhullal meteorological station was 18.23 °C with an average minimum of 16.46 °C and an average maximum of 19.28 °C during the study period. The highest mean annual total precipitation was observed in the Swaileh meteorological station (459.45 mm), followed by Amman Airport (232.95 mm), and the lowest mean annual total precipitation was found in the Wadi Dhullal meteorological station (128.97 mm). The total annual precipitation during the rainy seasonal average was 232.8 mm, ranging from 54.2 to 201.5 mm minimum and 271.6 to 865.8 mm maximum.
2. Materials and Methods
For the drought assessment in the Amman–Zarqa Basin, the data of meteorological parameters, i.e., precipitation and temperature, were acquired for the period 1985–2021 from the Meteorological Department of Jordan for the calculation of SPI and SPEI. SPI and SPEI are calculated for each month with an ongoing display of selected time lengths according to [14] and the WMO guidelines [15,16]. Each month shows different time scales, which provide an early precaution of drought and ease to evaluate drought severity at any time. These timescales reflect the effect of drought on available water in the soil, groundwater, stream flow and reservoir storages under the effects of precipitation variances via short and long terms.
2.1. Meteorological Data Acquisition
The meteorological data of precipitation and temperature for the five meteorological stations, namely Amman Airport, Mafraq, Swaileh, Wadi Dhullal, and Zarqa, located in the Amman–Zarqa Basin, were acquired from the Meteorological Department of Jordan. The acquired data were of average monthly temperature and total monthly precipitation over the period 1985 to 2021. Table 1 shows the details of the meteorological stations and their long-term climate features.
2.2. In Situ Meteorological Drought Indices Calculations
The Standardised Precipitation Index (SPI) is one of the commonly used indexes that is used to detect a meteorological drought. This index was highlighted as an imperative starting point for drought monitoring and was developed by [14]. The study calculated 3-, 6-, 9- and 12-month timescales of SPI with the normalisation of historical records of monthly rainfall and gamma distribution function following the methodologies and equations of [14,16,17,18,19].
The SPI for the past (1985–2021) was calculated based on meteorological observations datasets and CMIP6 scenario ssp126 datasets. The meteorological observation data were obtained from the Jordan Meteorological Department, while the CMIP6 SSP126 scenario data were acquired from the World Climate Research Project (from the web page https://esgf-node.llnl.gov/projects/cmip6/, accessed in March 2023). Additional data inputs in drought analysis will be more robust in the probability analysis due to extreme wet and dry conditions that are designed to be displayed [20]. In this study, meteorological drought is a combination of two components: (i) precipitation, which represents the rainfall deficit and (ii) temperature, which includes the temperature excess and high-temperature persistence. Therefore, allowing the index to assess the effect of temperature on drought development for all climate regimes via a basic water balance calculation, the study elaborated another drought index that is ideal for studying the impact of climate change under different future scenarios.
Another important in situ drought indicator is the Standardised Precipitation Evapotranspiration Index (SPEI), which the study conducted, following the methodology used in [16,21,22], which uses precipitation and temperature data. Evapotranspiration provides essential components for aridity classification and drought indices. In sparse data basins such as AZB and specifically, the stations that are quite limited or unable to provide a complete set of variables are required at a particularly accurate scale. RStudio was employed for coding to calculate SPI and SPEI. Evapotranspiration is estimated using the Thornthwaite equation. Despite being a temperature-pivotal method, the Thornthwaite equation is common and suitable for assessing drought [23,24,25,26,27,28], especially in arid regions [29], considering heating due to climate change. Previous studies [30] compared different ET calculation methods from observations versus ERA-Interim Penman–Monteith ET for the same study location, the Amman–Zarqa Basin. Ref. [30] found that, despite the Thornthwaite simple equation requiring only temperature data, it is about 86% and 80% adjusted R2 against Penman–Montieth ET derived from ERA-Interim and Priestley Taylor ERA-CLM ET, respectively, and the corresponding standard errors were 0.03 and 0.016 mm comparing with other monthly temperature-based ET estimations.
A study by [31] made global scale correction for the Thornthwaite equation (Figure 2a), assuring its importance in aridity assessment, particularly in arid regions, by producing the Thornthwaite local coefficients. At 30 arcsec resolution (less than 1.0 km), the use of daily or monthly temperatures for reference evapotranspiration showed a reduction in error and underestimation of annual ET. For AZB, we retrieved and processed its Thornthwaite Coefficient, as shown in Figure 2b. Another global dataset of monthly surface water balance with high resolution was produced using the Thornthwaite water balance [32]. It was described as a suitable measure of possible loss of water based on temperature because it uses an energy balance approach except for producing bias with high water consumption vegetation. Therefore, a modification was required by [32] where snow cover exists at the beginning of the growing season, and active transpiration phases by considering precipitation rates. Although precipitation station-based data are available, the dominant zero daily precipitation records in the location of the study area AZB, which is used to estimate daily water balance after detracting the evaporative demand and other losses may arouse suspicion and uncertainty in observational climate datasets.
Future work, however, is recommended to apply the Hargreaves or/and Penman–Montieth Evapotranspiration equations to estimate SPEI using the available open climate data source from GCMs/RCMs such as that provided by World Climate Research Program–Coordinated Regional Climate Downscaling Experiment (WCRP/CORDEX) [33]. Although bias-adjusted daily climate data are heated debate products, uncertain observations may affect its performance [34] in some sparse data basins.
The drought severity is determined from the SPI/SPEI calculated values, which could be interpreted based on [14,21] drought severity, as shown in Table 2.
SPI was calculated from 1985 to 2021 based on two sources: (1) observations of 5 meteorological stations in AZB and (2) temperature and precipitation projections of the members of CMIP6-ssp126 mean model for the same meteorological stations’ grids. SPEI was calculated for the same time interval based on two sources: (1) observations of 5 meteorological stations in AZB and (2) CSIC-SPEI for the same meteorological stations’ grids.
2.3. Drought Probability of Occurrence, Severity and Intensity
To define drought characteristics, this study identified drought duration from the beginning of drought condition to the end of drought condition based on index value SPI (−1.0 ≥ SPI). The study chooses the longest drought duration to define drought severity [35].
Drought severity is the summation of SPI drought values parameter during the longest drought duration. When is divided by the maximum drought duration , drought intensity is concluded.
Probability of Occurrence
In order to determine the chance that a given drought risk occurred, the study calculated the probability of occurrence in (%) by dividing the number of categorised drought months events occurring to the total number of drought events occurring [36]:
2.4. Pearson Correlation Coefficient and Mann–Kendall Trend Test
The study applied two tests, namely the Pearson Correlation Coefficient (PCC) to test the relationship among drought indices and the Mann–Kendall Trend (MKT) test to compute the drought trend in the study region. PCC is one of the commonly used techniques that determines that the paired variables are strongly related to each other. The PCC for the current study was calculated, and the value ranges from +1 to −1, indicating the positive to negative perfect linear correlation, and zero or near zero indicates no correlation among the variables. In this study, the PCC was applied to observe the strength and direction of the linear correlation among SPEI and SPI at 3, 6, 9 and 12 months’ time scales using scatterplot. The MKT test was applied to the SPI and SPEI results. It is a nonparametric test that has been widely used for the measurement of temporal trends in climatic parameters and drought trends [37,38,39].
2.5. CSIC SPEI Data
The CSIC SPEI data used in this study is downloaded from the https://spei.csic.es/map/maps.html (accessed in March 2023) website developed and maintained by the Spanish Ministry of Economy, Industry and Competitiveness, State Agency Superior Council of Scientific Investigations (CSIC), and the Pyrenean Institute of Ecology (IPE). The data is available at 0.5 × 0.5-degree spatial resolution and monthly temporal resolution. The SPEI global data is provided on a 1–48 months temporal scale, and, in this study, we used it for the period 1985–2021 for 3, 6, 9, and 12 month temporal scales. For further validation and comparison, the CSIC SPEI data were used in comparison with the meteorological station-derived SPEI. CSIC is a new global dataset available for the scientific community, which uses monthly precipitation and average temperature gridded data, as well as the Thornthwaite method, to calculate evapotranspiration [21]. It uses the Kalmogrorov-Smirnov test to determine the performance of SPEI data and the logistic distribution.
2.6. Coupling of CMIP6 ssp126 Projection to Estimate SPI
The CMIP6 scenario ssp126 temperature and precipitation datasets from 1985 to 2021 were retrieved in this study using the same equations that run with observations to estimate SPI. Via selecting the coordination of each station, the output data were within the borders of a grid box for more variance and to make the model capture most of the state of the climate in the basin. The study considered the land points only in the basin as there are no sea points in the basin itself where air fluxes in the sea points are different than the air fluxes in the land points, which affects the climate characteristics in the basin.
2.7. CMIP6-ssp126
This study used CMIP6 temperatures and rainfall projections as the new age group of climate models ensemble showing best symbolised in the simulation of future climate data. This study used the mean ensemble model [40] located at each station grid point under the Shared Socioeconomic Pathway one (ssp1), the sustainable pathway that takes the green roads for the mitigation of the climate change effects and adaptation with its consequences. Ssp126 emphasises development that values nature’s boundaries and human prosperity [41].
2.8. TBATS vs. ARIMA Forecast Models
The task at hand involves conducting time-series analysis using various machine learning algorithms and techniques. The TBATS and ARIMA models were employed for this analysis. The TBATS model, short for Trigonometric seasonality, Box-Cox transformation, ARMA errors, Trend, and Seasonal components, is a sophisticated time-series forecasting model that can handle multiple seasonality and complex patterns. It was likely employed to capture the various seasonal patterns present in the data. ARIMA, shortened to Autoregressive Integrated Moving Average, is a frequently used time-series model. It incorporates autoregressive and moving average components, as well as differencing to account for non-stationarity in the data [42,43].
The basic equations of TBATS are shown in Equation (5).
where denotes the box transformation parameter at the time , which is to be applied to the observed variable in the local level ; and are the inhibited trend and the long-run trend, respectively; the seasonal pattern, component, and periods are , , and , respectively; and is the ARIMA residuals.
Equation (6) estimates the basic ARIMA; denotes the different operator for the possible values during the autoregressive process; there is a lag order of the order ; and are the coefficients of parameters and respectively; and at the time , there are residuals of errors .
The dataset was divided into four time periods, each spanning three months. These time periods were likely chosen to capture seasonal patterns and trends in the data. By examining the SPEI and SPI from historical observations, CSIC and CMIP6-ssp126 future projections, interpolation of historical observed SPI and SPEI, and CSIC-SPEI interpolation values over time periods were applied.
ARIMA models were likely used to explore the temporal dependencies and trends in the SPEI, SPI, and CMIP6 data. By leveraging machine learning algorithms and techniques, this analysis aimed to uncover important patterns, trends, and relationships within the time-series data of SPEI, SPI, CSIC, and CMIP6 variables. Such insights can be valuable in understanding and predicting climate-related phenomena, supporting decision-making, and informing climate change mitigation and adaptation strategies.
2.9. Data Loading and Pre-Processing
The handling and organising of multiple datasets based on location and climate variables were coded by RStudio. Data preprocessing and organizing in this way enabled the easy access and analysis of historical data for different locations, including Amman, Mafraq, Swaileh, Wadi Dhullal, and Zarqa, such as SPEI, SPI, CSIC, and CMIP6. Checking for NA values in the resulting data frames began by specifying the features to interpolate for different time periods. Interpolation functions were defined to fill in missing values using the “na.approx” method. Also, data were checked for outliers using a boxplot. Outliers were removed from the Amman Airport, Zarqa, Mafraq, Sweileh, and Dhullal stations using the “ts_data_clean_outliers” function.
2.10. Forecasting Function
This approach focused on forecasting using the TBATS and ARIMA single models for different time periods (3, 6, 9, and 12). For each dataset, the code loops via the features and builds a TBATS model. The time-series data is prepared by creating a time-series object with the appropriate start year and frequency. The TBATS model is then applied to the time-series data. Next, a forecast is generated for the future time (2023–2025) using the forecast function. Finally, the forecasted data is plotted. This process is repeated for the SPEI and SPI datasets derived from historical observations and the historical CSIC-SPEI and historical CMIP6-ssp126 to provide forecasts for each dataset and feature combination. The result is a series of forecast plots illustrating the predicted values for the respective time periods up to the near future in 2025. The accuracy of the forecast is evaluated using the accuracy function and evaluations for each dataset, feature, and model combination. The study used ME, RMSE, MAE, and MASE to compare the performances of the prediction models. MAE and RMSE are scale-dependent metrics leading to the median and mean predictions, respectively, rather than MASE, which is scale-free and reported as the most reliable error metric for forecast accuracy [43]. The study used the autocorrelation function (ACF) to imply the correlation with previous values in the time series. The ARIMA and TBATS time-series outputs were then converted into a long format using the “long_df” function.
Normalisation, however, and the gamma distribution function of time-series indices, as well as of historical records of monthly rainfall, were applied by removing the outliers coded by RStudio. In the prediction process, ARIMA and TBATS inputs were autocorrelated to enable stationarity as a conditional assumption to achieve a standardised data model across the entire prediction system.
3. Results
3.1. Three-Month, 6-Month, 9-Month, and 12-Month SPI
Figure 3 represents the temporal drought situations in five meteorological stations (Amman Airport, Mafraq, Swaileh, Wadi Dhullal, and Zarqa) calculating SPI using the observations of meteorological datasets and the historical baseline datasets derived from CMIP6 ssp126 (the sustainable pathway) at 3 months, 6 months, 9 months, and 12 months’ time scale. Both the observational and modelled data results of 3 months SPI (Figure 2, see the first two plots per each station in column one) show fluctuated results of wet and dry conditions even within the same year. There were extremely wet conditions that prevailed in late 1986, while it was converted to extremely dry in the preceding year, i.e., 1987, in almost all meteorological stations. Similarly, 1989, early 1992, and late 1994 were again prevailing wet conditions in the study region. The 3 months SPI results revealed extreme drought in 1995 (−1.6, −2.3, −1.2, −1.7 and −2.2 in Swaileh, Wadi Dhullal, Mafrqa, Amman Airport, and Zarqa, respectively) and extreme drought with extended period was observed during 1998–2000 in the basin. The study downloaded the latest mean ensemble CMIP6 model under the SSP126 since it reflects more justified outcomes that are included in AR6 of IPCC to study climate effects and risks [36]. The historical simulations of CMIP6 indicate decreasing precipitation and increasing temperature, thus increasing evaporation rates. For CMIP6-SSP126 results, the years 1992 and 2001 were severely wet, while normal conditions prevailed in the meteorological observational results. In early 2003, severe drought was observed, and in late 2003, the wetting conditions were concluded from the SPI 3 months results. The preceding year, 2004, in the late season, was again a dry year. Similarly, late 2008 was wet, while early 2010 was extremely dry. The results of SPI3 derived from observational data and the ones derived from CMIP6 indicated the opposite in 2013, where the conditions were severely wet in the observational data, while extreme drought was detected in the CMIP6 data results. Similarly, the year 2017 was wet, while 2018 to 2021 observed droughts with some with nearly normal conditions in some seasons. The SPI based on CMIP6 model data shows more extreme drought after 2020 and wet conditions prior to 2020 as compared to observational data.
The 6 months SPI determines the cumulative precipitation of six months, and the negative values of SPI show drought, while positive values show wet conditions in the study region. The 6 months SPI results (Figure 2, see the 3rd and 4th plots per each station in column one) show more pronounced drought events as compared to 3 months, which showed fluctuating drought situations throughout the temporal period. The SPI results of both datasets revealed wetting conditions in 1985, followed by extreme drought in the year 1986 in all meteorological stations in the study area until the end of 1986, when the wetting pattern was dominant. Again, the year 1989 was dry, while 1990 was moderately dry. Nevertheless, 1992 and 1994 were extremely wet years; late 1995 was an extremely dry year. All meteorological stations experienced moderate to severe drought during 1998–2000, but the consequent year, 2001, detected moderate moisture in the CMIP6 SPI results, where the same was normal conditions in the observational data. Early 2003 was pragmatically wet, but the latter half of 2004 was stated as dry. The year 2005 was wet, and 2008 was observed as wet based on meteorological stations’ SPI. Compared to CMIP6 results, the year 2013 was wet and dry during 2014 and 2017 and normal in 2018. Similarly, the year 2019 was moderately wet, and late 2020 was moderately dry.
The 9 months SPI requires cumulative rainfall data of 9 consecutive months. The 9 months SPI results (Figure 3, see the 5th and 6th plots per each station in column one) of both observational data and direct coupling of CMIP6 SSP126 data were fitted with few observations and overestimation of wetting and drying conditions in some years using the CMIP6 results (during years 2001, 2010, and 2013). Similar patterns such as SPI and SPEI 6 months of drought and wetting conditions was observed in 9 month SPI results. The year 1986 was a wet year for Swaileh, Zarqa, and Wadi Dhullal, but there was drought for Amman and Mafraq, while the preceding year, 1987, observed dry conditions only for Zarqa. Again, the years of 1988–1989 detected wetting situations in the study area except for Amman and Mafraq in late 1989. The year 1990 was a dry year according to the CMIP6 SSP126 dataset, which aligned with observational SPI results except for Zarqa and Wadi Dhullal. The years 1992 and 1993 were again wet years in observation-based and CMIP6 SSP126 model-based 9-month SPEI results in all stations except Swaileh in late 1993, where it witnessed severe drought. Early 1994 months were again normal. The year 1995 was again a dry year, while the early half of the year observed some wetting conditions, which were underestimated in the CMIP6-based SPI results. Similarly, there was drought in 1999 across the basin, while the same was observed as normal conditions in CMIP6 outputs, especially in Wadi Dhullal, which reached (−2.7). Drought was also observed in 2003 and 2004 in some months of the year, with intermittent wetting situations observed in the same years, while it contradicted CMIP6 as the latter simulated wet season during 2003. Wetting conditions were observed during 2008 in the observation data, which were underestimated in the CMIP6 results. In 2010 and 2011, there was extreme to moderate drought in the CMIP6 results, while the conditions were almost normal in the observational data results. However, 2013 was again overestimated as dry, while it was normal in observation-based SPI results. The year 2019 observed normal results, while CMIP6 simulated the severe drought in the study area. In contrast, there were severe drought in met stations results in 2021 while the same was observed as normal in CMIP6.
Figure 3 (see the 7th and 8th plots per station in column one) represents the 12 months’ timescale of SPI based on recorded data precipitation and temperature and CMIP6 output projections data during 1985–2021 in the Amman–Zarqa Basin. The 12 month SPI are usually used for long term drought monitoring, especially for planning hydrological and agricultural droughts in a region. The results revealed moderate to extreme drought and wet episodes during the study period. The year 1986 showed wet conditions by CMIP6 projections and norms by observed climate data. Similarly, the year 1988 was severely wet, while 1989 was moderately dry. The year 1996 observed extreme dryness in stations’ SPI, particularly in Amman Airport and Swaileh, whereas moderate dryness was observed in CMIP6 data-based SPI results. The same situation of severe drought was observed in 1998 in both datasets, where CMIP6 data underestimated the severity of drought. In 2001, the CMIP6-based SPI showed moderate moisture, whereas the same was near to normal in meteorological-based SPI results. CMIP6 indicated moderated drought across stations in late 2003, while there were moist conditions observed. The years 2007 and 2008 were moderately wet, whereas late 2010 and early 2011 were dry with more extreme values in the CMIP6 results. After 2011, the SPI results of both datasets mostly showed near-normal or below-normal situations in the study area, and this was more obvious in the Zarqa station results. This indicates that, according to the study, drought has become more frequent after 2011. CMIP6 ssp126 overestimated peak severe droughts (2013 and 2014) and some wet years (1993 and 2002) and underestimated other extreme droughts in 1999 and wet years (1991 and 2008). During 2017 and 2021, in Zarqa and Mafraq, the interim in the SPI estimation between observations and CMIP6 projections were the same, while it appears as heaving trends prior to this period.
3.2. Three-Month, 6-Month, 9-Month, and 12-Month SPEI
To investigate the 3 months’ timescale SPEI, a derived index was calculated from the meteorological data, and further evaluated with the CSIC global SPEI database, downscaled from the available global scale data for the selected meteorological stations (derived from the https://spei.csic.es/database.html, accessed in March 2023). Figure 3 (see the 2nd plot for each station in the right column) shows SPEI results for the 3 months temporal scale. Wet and dry conditions prevailed throughout the study period—even within the same year—seasonal variations in the drought characteristics. As the study area is the same river basin, negligible variation was observed among the stations results during 1985–2022. The results of the SPEI 3 months of both observational data and CSIC calculated SPEI (Figure 3, see the 1st plot for each station in the right column) show moderate drought conditions in early 1985 in Swaileh and wetting in the remaining stations. A moderate drought was observed in early 1987. CSIC SPEI showed drought conditions in 1988 and, consequently, in the same year, normal conditions were observed in the observational SPEI results. Similarly, in early 1989, extreme drought prevailed in the study region, and the latter half of the same year showed wetting conditions. Severe drought was observed in the CSIC SPEI results, while the same mild to moderate drought was seen in station observations. The years 1992–1993 were wet in both data results, whereas 1995 observed moderate to severe drought. The years 1996 and 1997 were again normal to wet, while there was a prolonged drought during 1998–2000 in the study region. Likewise, the years from 2002 to 2007 ranged from wet to normal situations, and after witnessing seasons, unpredictable situations were observed in 2008, where CSIC SPEI detected extreme drought, while the same was wet in the observational-based SPEI results. The same situation was observed in 2010, where there was extreme drought in CSIC SPEI, and moderate dryness was observed in the SPEI results across all meteorological stations. During late 2012, extreme drought was sensed, while in early 2013, wetting conditions prevailed in the study region. Early 2014 was also extremely dry, whereas the latter half of the year had moderate wet to normal conditions except for Mafraq, which witnessed continuous severe drought from 2012 to 2016. The same dry and wet conditions were observed in 2016, while the years 2018 and 2020 were extremely dry in both SPEI results. Generally, the CSIC SPEI results show more severe drought than the calculated SPEI results from climate observations.
The results of 6 months scale SPEI (Figure 3, see 3rd and 4th plots for each station in the right column) revealed somehow different patterns of dry and wet conditions in some years. The CSIC SPEI shows more extreme to severe drought in all meteorological stations as compared to observational data that indicated incidents of droughts. CSIC SPEI underestimated the wet periods such as in the case of 1987 (particularly in Wadi Dhullal and Zarqa), 1991(particularly in Mafraq), 1992, 2008, 2009, and 2013. It is noticed that the lagged fit of drought severity between the calculated SPEI and the modelled CSIC SPEI might be justified as the results of an unbiased estimator of probability weighted moment’s methodology of CSIC SPEI. In late 1986, the modelled CSIC SPEI showed extreme drought while there were wetting conditions in observations. Similarly, the modelled CSIC SPEI results underestimated the wetting conditions in 1988 and 1989, as these years were moderately wet in the observational results. The same situations were observed in 1990, where the meteorological station results observed normal to wet conditions, while the modelled CSIC SPEI observed dry to normal conditions. The study results showed wetting conditions in 1992 and 1993, whereas drought was observed during 1994 and 1995, where observations were aligned with CSIC simulations. The year 1997 was wet, while there were droughts in 1998 and 1999 in the study results of both datasets when Zarqa had severe drought (−2.6) by CSIC simulations. Similarly, 2003 and 2004 were wet years, whereas the modelled CSIC SPEI underestimated the wet situations in the years 2008–2010 and 2013 in all stations. The drought situations were observed from the analysis results during 2016, 2018, and 2020. Zarqa, Swaileh, and Amman Airport witnessed more often severe drought than other stations by modelled CSIS SPEI6. It is noted that Zarqa station had wet seasons during the first two decades (1985–2004), while CSIS SPEI6 underestimated the same period of wetness and implied high frequent drought.
In terms of the 9 month scale, the outputs showed (Figure 3, see 5th and 6th plots for each station in the right column) dry and wet years during the study period in the Amman–Zarqa Basin. There was a high variation in meteorological observation-based SPEI; CSIC SPEI were observed in earlier years of the study (1985–1993) and during 2008 and 2010 observed in Zarqa while the remaining stations were lined up with the CSIS index. In the Zarqa meteorological station, the SPEI, based on observation data, showed continuous mild to moderate dryness since 2002.
Figure 3 (see 7th and 8th plots for each station in the right column) represents the 12 month SPEI results calculated based on climate variables and CSIC SPEI results. Both the SPEI results show almost similar wet and dry trends. An almost similar pattern such as in 9 month SPEI was observed in the 12 months results with a little variation in some years. Long-term dry events show an increase after 2010, and dry events are observed from the SPEI results. The convened trends in SPEI12 for both sources, the observations and CSIC, were strong and promising in Amman, Mafraq, and Swaileh; nevertheless, it did not contest with extremes magnitudes of wet and dry years in 1986, 1987, and 2004. Across all stations, the indices indicated contradicted trends of CSIC from 2008 to 2011 except for the year 2010, where it fitted the observational SPEI12. The drought frequency was also found to be high as compared to other temporal scales.
3.3. Drought Indices Correlations and Pearson Coefficient
Pearson Correlation Coefficient (PCC) was applied to test the correlation among all the drought indices applied in this study. In five stations (Amman Airport, Mafraq, Swaileh, Wadi Dhullal, and Zarqa), there were four different datasets. In Figure 4, the green colour represents a strong correlation, and the red colour shows a weak correlation based on the R2 value. All indices correlation was found to be positive. In the Amman Airport meteorological station, a strong correlation was observed among SPI12 vs. SPEI12 (R2 = 0.84), SPI9 vs. SPEI9 (R2 = 0.79), SPI12 vs. SPEI9 (R2 = 0.80), CSIC 9 vs. CSIC 6 (R2 = 0.68), CMIP6 SPI 9 vs. CMIP6 SPI12 (R2 = 0.83), SPI 12 and SPI 9 (R2 = 0.71), and SPEI9 and SPEI6 (R2 = 0.70).
In the Mafraq meteorological station, the significant positive correlation was observed among CSIC 9 and CSIC 6 (R2 = 0.76), CMIP6 SPI9 and CMIP6 SPI12 (R2 = 0.83), CMIP6 SPI9 and CMIP6 SPI6 (R2 = 0.73), SPEI 12 and SPEI 9 (R2 = 0.84), SPI 12 and SPI 9 (R2 = 0.74), SPI 12 and SPEI 12 (R2 = 0.79), and CSIC 12 and CSIC 9 (R2 = 0.71). The results of Figure 4 in the Swaileh station detected a strong positive correlation among SPI 9 and SPEI 9 (R2 = 0.91), CMIP6 SPI 9 and CMIP6 SPI 6 (R2 = 0.71), SPEI 12 and SPEI 9 (R2 = 0.77), SPI 12 and SPEI 9 (R2 = 0.72), SPI 12 and SPI 9 (R2 = 0.73), SPI 12 and SPEI 12 (R2 = 0.93), and CMIP6 SPI 12 and CMIP6 SPI 9 (R2 = 0.83).
In Wadi Dhullal, a strong positive correlation was observed from Figure 3 among CSIC 9 and CSIC 6 (R2 = 0.76), CMIP6 SPI 9 and CMIP6 SPI12 (R2 = 0.83), SPEI 12 and SPEI 9 (R2 = 0.82), SPI 12 and SPI 9 (R2 = 0.73), CSIC 12 and CSIC 9 (R2 = 0.70), and CMIP6 SPI 12 and CMIP6 SPI 9 (R2 = 0.83). In Zarqa, a strong positive correlation was observed among SPEI9 and SPEI12 (R2 = 0.95), SPEI 9 and SPEI 6 (R2 = 0.91), SPEI 6 and SPEI 12 (R2 = 0.86), CSIC 9 and CSIC 6 (R2 = 0.73), CMIP6 SPI 9 and CMIP6 SPI 6 (R2 = 0.72), SPEI 3 and SPEI 6 (R2 = 0.79), SPI 12 and SPI 9 (R2 = 0.76), SPEI 3 and SPEI 9 (R2 = 0.70), and CMIP6 SPI 12 and CMIP6 SPI 9 (R2 = 0.83).
Correlation analysis of 3 months SPEI vs. 3 months SPI in the study sites has indicated that in both 3 months SPEI vs. 3 months, SPI are not best fitted, and there is some insignificant positive correlation. The R2 value of the Amman Airport meteorological station was 0.41, Mafraq was 0.30, Swaileh was 0.49, Wadi Dhullal was 0.30, and Zarqa was 0.15 (see Figure 4). This might be because the short-term droughts in AZB not only occur due to low precipitation but is also correspondingly affected by temperature and a high rate of evapotranspiration.
6 months of SPEI vs. SPI of 6 months indices are presented in Figure 4 for stations indicated results of almost a best fit of correlation at Swaileh meteorological stations with R2 value 0.74 and positive correlation was also observed in Amman Airport (R2 = 0.63), Mafraq (R2 = 0.51), and Wadi Dhullal (R2 = 0.53), but the results are not significantly linear fit. Insignificant correlation was found at Zarqa (R2 = 0.32) station (Figure 3).
9 months of SPEI vs. SPI of 9 months indices indicated results of almost a best fit of correlation at Swaileh meteorological stations with R2 value 0.91 and positive correlation was also observed in Amman Airport (R2 = 0.79), Mafraq (R2 = 0.72), and Wadi Dhullal (R2 = 0.67), but the results are not significantly linear fit. An insignificant correlation was found at the Zarqa (R2 = 0.53) station among SPEI vs. SPI, as it showed two separate clusters of wet and dry conditions due to its climatic variability and seasonality (Figure 4).
12-month SPEI vs. SPI for the Amman Airport, Mafraq, Swaileh, Wadi Dhullal, and Zarqa stations show a positive correlation with significant best linear fit in all meteorological stations, particularly Swaileh at 0.93. The R2 value of Amman Airport meteorological station was 0.84, Mafraq 0.79, Wadi Dhullal 0.72, and Zarqa 0.62 (Figure 4).
3.4. Results of Mann–Kendall Trend Test for SPI and SPEI
The MKT test was applied on all temporal scales of the SPI results to determine the drought trend in the study area. To interpret the MKT test results, the probability value (p-value) was calculated for a 95% confidence level, which indicated that a p-value less than 0.05 means that significant trends exist in the time-series data. If the p-value is greater than 0.05, it indicates that there is no significant trend found in the time-series data. The results of 3 months SPI revealed a significant drought-increasing trend only in Zarqa. Similarly, a significant drought-increasing trend was observed in the 6-month SPI results in Amman Airport, Mafraq, Wadi Dhullal, and Zarqa meteorological stations (Table 3) but no trend in Swaileh. The 9- and 12-month SPI results revealed significant drought-increasing trends in all stations.
The Mann–Kendall Trend test was also applied to the SPEI results of 3, 6, 9, and 12 months. All the temporal scales observed significantly increasing trends of drought in all stations in the study area (Table 4). The results of the MKT test for the 3 months and 6 months SPEI are different from that of 3 months and 6 months of SPI as the SPEI analysis more consistent droughts in recent years. The reason for more drought events in the SPEI is that the increasing temperature is causing an increase in the rate of evapotranspiration, and SPI only uses precipitation variables to measure its index. Kendall’s tau non-parametric coefficient observed insignificant probabilities of concordant (association) between drought indices on different time and space scales.
3.5. SPI and SPEI Drought Frequency
This study evaluated the drought frequency for the SPI 3 months for the station Amman Airport, which was 12.22%, Mafraq 13.35%, Swaileh 12.67%, Wadi Dhullal 14.03%, and for Zarqa, it was 13.12% during the study period. The SPEI 3 month frequency for these stations was a little higher than the results of the SPI, where it was Amman Airport 15.84%, Mafraq 16.74%, Swaileh 14.93%, Wadi Dhullal 16.06%, and Zarqa 17.65%, which means that the evapotranspiration rate affects the drought situations in the Amman–Zarqa Basin. The drought frequency of SPI6 in the Amman Airport meteorological station was 14.35%, Mafraq 15.95%, Swaileh 14.35%, Wadi Dhullal 13.67%, and in the Zarqa meteorological station, it was 13.21% (Figure 5).
Regarding SPI 9 months, the stations’ observation data revealed that the drought frequency during the study period was 15.14% in Amman Airport meteorological station, 16.06% in Mafraq, 14.45% in Swaileh, 13.99 in Wadi Dhullal, and 13.07% in Zarqa station. Extreme to severe drought years in all stations were 1994–1995, 1998–1999, 2016, 2018, and 2020. Almost 13 to 16% was the drought frequency in all meteorological stations. The SPEI results show a higher frequency than that of the SPI results. The highest drought frequency was observed in the Zarqa meteorological station (16.97%) and, comparatively, the lowest was in the Amman Airport meteorological station (15.37). The drought frequency results revealed the highest frequency of drought in the Zarqa meteorological station, while the lowest was in the Amman Airport meteorological station (Figure 5).
3.6. Drought Duration, Severity, and Intensity
The probability of occurrence of different SPI scales is shown in Table 5 based on the study period (1985–2021). SPI 9 class has the highest likelihood of occurring across all stations: Amman Airport, Mafraq, Swaileh, and Wadi Dhullal at 62.7, 73.2, 63.5, and 55.7%, respectively, except for Zarqa, where SPI 9 and SPI-12 showed the highest probabilities of 64.9% and 75.9%, respectively. The highest occurrences were typified by the moderate class of drought, while the highest severe class of drought occurred during SPI 3 in Amman Airport of 48.2%, followed by SPI 6 severe drought in Wadi Dhullal (40.7%). Zarqa, again, received the highest severe drought occurrence among SPI 3 and SPI 6 with a 32.8 and 34.5% likelihood of happening. Mafraq and Wadi Dhullal were susceptible to extreme drought based on 3-month timescale SPI with probabilities of 32.2 and 41.9% of occurrences, respectively.
The number of drought months for the given study period of 444 months is given in detail in Table 5. Mafraq received more months of drought, equalling 71 months, with different classes from moderate to extreme drought, followed by the Amman Airport SPI 9, when it was liable to 67 months long of drought. The shortest drought months in the Amman Airport on 3-month SDI were 54 months out of the total analysed months. The longest duration of drought was in Sweileh at 14 months between Jan 1999 to Feb 2020. Most of the drought intensities were severe with about 18 drought incidents on multi-temporal scales of 3-, 6-, 9-, and 12-month SPI. Two extreme drought events occurred (SPI ≥ −2.0) in Amman Airport and Wadi Dhullal based on SPI 12 and SPI 6, respectively.
The longest drought duration ranged from 6 months up to 14 months and frequently 12 months duration and 9.9 months on average. The end of the drought incident was not necessarily followed by a wet period; it often keeps track of normal drought months (−1.0 ≥ SPI ≥ 0) or short moist breaks.
Drought severity and average intensity were found at −24.64 and −1.76, −23.80 and −1.83, −23.57 and −1.96, −23.44 and −2.0, −22.58 and −1.88, and −22.02 and −1.84. The corresponding drought categories were SPI 12 Sweileh, SPI 9 Sweileh, SPI 12 Wadi Dhullal, SPI 12 Amman Airport, SPI 9 Wadi Dhullal, and SPI 12 Zarqa. The dominant drought incident that occurred among all stations was between Oct 2020 and Dec 2021, as given in Table 5.
3.7. Prediction Results
The accuracy results for each model are displayed in Table 6, detailing the forecast results for each dataset, feature, and model combination. Projections of CMIP6-ssp126 were coupled with SPI equations from 2022 to 2025 on a monthly basis. Future SPEI and SPI were modelled using TBATS and ARIMA. In Amman Airport, it is expected that the drought index TBATS SPEI-12 will range from (−2.4158 to +1.4591) with a low and high 95 percent confidence interval (5% possibility of being wrong).
The low and high 80% confidence interval illustrates more susceptibility to droughts and fewer wet periods, whereas the TBATA-modelled SPEI-12 extended from −1.745 to 0.7885. ARIMA-modelled SPEI-12 extended from −2.277 to 0.9015. At Mafraq station, TBATS SPEI-12 predicted −1.1795 (Low 95%) to 1.1941 (High 95%) with more extreme droughts from −2.0653 in July 2022 to −2.815 in Dec 2024 (95% confidence level). ARIMA SPEI-12 predicts nearly the same drought incident but starting from August 2022 (−2.0295) to Dec 2024 (−3.065). Wet intensity in Swaileh is predicted to be higher than other locations (from −0.243 to 1.724) and (from 0.5075 to 2.0865) as modelled by TBATS SPEI-12 and ARIMA SPEI-12 with hi 95%, respectively but still confronting frequent severe droughts. Zarqa forecasts higher drought intensity than the remaining locations. The midpoint implies severe drought from Jan 2023 to the end of the forecasting analysis period, with 95% TBATS prediction of −1.246 to −2.336 of SPEI-12 intensity. ARIMA forecast expects extreme drought (>−2.0) from Dec 2022 to the end of Dec 2024 (with 95% confidence) in Zarqa.
CSIC-SPEI-12 generated by TBATS in Amman Airport, Mafraq, Swaileh, Wadi Dhullal and Zarqa predicts (−0.951 to −4.073), (−1.0915 to −2.771), (−0.963 to −2.89), (−1.082 to −2.739), and (−0.896 to −2.351), respectively with 95 percent confidence interval. CSIC-SPEI-12 generated by ARIMA in Airport, Mafraq, Swaileh, Wadi Dhullal and Zarqa predicts (−3.248 to −3.566), (−2.76 to −2.91), (−2.929 to −3.127), (−3.299 to −3.904) and (−2.731 to −2.854), respectively with 95 percent confidence interval (see Figure 6).
Drought severity and average intensity were found to be −24.64 and −1.76, −23.80 and −1.83, −23.57 and −1.96, −23.44 and −2.0, in addition to the corresponding drought categories were SPI-12, SPI-9 in Sweileh, SPI-12 in Wadi Dhullal, SPI-12 in Amman Airport. The dominant drought incident that occurred among all stations was between Oct 2020 and Dec 2021. The next incident was in 1999, followed by 2014, and then one chance of dominant occurrence during 2004 and 2010.
TBATS-SPI intensities predict severe drought most of the time from January 2022 to December 2024. Amman Airport confronts severe drought during 2022 (point forecast according to TBATS-SPI-12, whereas ARIMA-SPI-12 predicts normal conditions by an average of low and high possibilities of drought incidents (−1.221 to −3.126) and (0.117 to 1.773), respectively. Swaileh predicts drought at the beginning of 2021 until April by TBATS-SPI, and then wetness to the end of 2024, while ARIMA expects no drought but normal conditions (−0.628 < ARIMA-SPI < −0.160). In the Wadi Dhullal location, the results of TBATS and ARIMA-SPI are the same as in Swaileh except that ARIMA-SPI intensity (−0.967 < ARIMA-SPI < −0.133). For Zarqa, ARIMA-SPI expects more severe and extreme drought than expected by TBATS, with low to high 80% and 90% confidences, the TBATS intensity ranges from (−1.809 to 0.758) and from −2.368 to 1.381), respectively, while ARIMA-SPI ranges from (−2.51 to 0.872) and from (−3.31 to 1.428), respectively.
For the future drought prediction and characteristics over Amman Zarqa, the climate model data of CMIP6 under the Shared Socioeconomic Pathway-Representative Concentration Pathway scenario ssp126 was used for 2022–2025. The SPI results, derived from new temperatures and precipitation datasets under the sustainable road, revealed that all months during the study period (2022–2025) will be moist. The maximum wetting condition was found above −0.5, while the drought will be up to extreme (SPI < −1.5) in October and November 2023. The maximum variation was observed in February, April, June, July, September, November, and December. For ARIMA, CMIP6 in all stations, the drought SPI concentrates in 2023 and through 2024 of about >−1.0 and less than zero index between April 2022 to October 2022.
ARIMA-SPI modelled from observations and from historical CMIP6 are approximately the same in Amman Airport and Swaileh after 2023, but the observed SPI is wetter than CMIP6 during 2022 in all stations. In Mafraq (Figure 7 gives an example of modelling process), Wadi Dhullal, and Zarqa during 2023 and 2025, the ARIMA-modelled CMIP6- SPI are wetter than the observed SPI. For the TBATS forecast, the Zarqa SPI from observations, and CMIP6, the modelled index shows the same trend. While Amman, Mafraq and Wadi-Dullal are in the same slant but TBATS-SPI-CMIP6 is wetter than TBATS-SPI-observations indices.
Future projections from CMIP6-ssp126 expect the following drought numbers within AZB: CMIP6-SPI averages are 0.08, 0.077, 0.121, 0.169, and 0.181 in Amman-Airport, Dullal, Mafraq, Swaileh, and Zarqa, respectively. The expected severe drought events are predicted to take place in October and November 2023, January and May 2025, and expected wet events in September through October to November 2024.
SPEI intensity that was modelled using CMIP6 future projections ranged from (−0.440 to 2.12), (1.45 to 2.07), (−0.54 to 2.16), (−0.48 to 2.15) to (−0.47 to 2.13) in Amman Airport, Dullail, Mafraq, Swaileh, and Zarqa, respectively. No severe incidents are expected to take place by CMIP6-SPEI until 2025.
Evaluation of the models’ accuracy provides forecast results for various datasets, features; model reports are given in Table 6. The forecast metrics for each single model ARIMA and TBATS used ME, RMSE, MAE, and MASE to measure the most accurate model per station. In all stations, using observed SPI and historical CMIP6, ARIMA was the most accurate than TBATS. By looking at the SPEI forecast, ARIMA was the most accurate model to forecast the drought index using the observed historical SPEI and CSIC across all stations.
The autocorrelation function (ACF) revealed that the present forecast values were not correlated with the former ones. The ACF between each point and the next point in the time series ranged from (−0.0393 to 0.283) by ARIMA and from (−0.0253 to 0.937) by TBATS for all datasets except CSIC.
The SPEI-TBATS modelled index using CSIC across all stations was correlated with previous ones, which means that each point in the time series is very correlated with the next point. The highest correlations were obtained for the TBATS model, in which the values were 0.926, 0.937, 0.927, 0.933, and 0.922 for Amman Airport, Dullal, Mafraq, Swaileh, and Zarqa, respectively.
MASE was far lower than 1 in all cases under both models; therefore, all suggested forecasting methods performed significantly except for CSIC-SPEI, which were more than 1 in all stations. Using hybrid models in this case is suggested, as a single model performed fairly in one dataset and distinctively well with other sets.
The ARIMA and TBATS time-series outputs were merged and converted into a long format. The plot (see Figure 8) predicts that severe drought events will take place during 2023 by TBATS and ARIMA, followed by a short-wet season and continued with severe drought during 2024.
4. Discussion
The evaluation of different indices to measure drought severity and occurrence based on meteorological recordings and comparing them with other climate models’ providers are the main objectives of this study. SPI relies on the possibility of precipitation deficit over multiple timescales, particularly 3, 6, 9, and 12-month timescales. This deficit considers the soil moisture response to precipitation variations over time and different locations on quite a short scale, while it considers a longer term for groundwater, streams and reservoirs. This proves that precipitation influence on drought is higher than precipitation and temperature combined and is responsible for drought frequency, severity, and intensity. Drought events occur and continue (drought intensity) anytime that SPI is negative and reaches −1.0 or less. Drought lasts for months, as witnessed in the basin, where it proves its prolonged duration.
In this study, we applied Pearson Correlation between each one-to-one index at different time scales, with different data sources to measure the inferential capturing of drought events. The study uses the Mann–Kendall test to determine drought trends of different geo-climatological features within the basin. The precipitation drought indication was evaluated against the precipitation and temperature combined, which serves as a signal of evapotranspiration; both are derived from different datasets. Based on weather station observations, Swaileh, Amman Airport, and Mafraq were the highest correlated (>0.72) in long-timescale SPI and SPEI, while Zarqa and Wadi Dhullal had a fair correlation (>0.62) in 12-month scale indices. Based on CSIC, 9-month SPEI was significantly correlated only with 12-month CSIC while uncorrelated with all other derived SPEI and SPI at different timescales across all grids. Based on CMIP6-ssp126, it exemplified consistency correlation with different timescales and grids (ranging from 0.56 to 0.84) except for the 12-month against 3-month timescale SPI.
With respect to correlation, PCC determines the coefficient of determination R2, which measures the proportion of the variance that is shared by different time-series scales drought indices. In other words, it explained the amount of variation by correlation. However, this study did not endeavour to investigate the relation of each variable with a lagged copy of itself. We sought to keep the changing of drought over time and capture the trend or change in seasonality due to climate variability and change in order to comprehensively detailed the historical drought features. The presence of significant trends or seasonality will allow the testing of the null hypothesis of non-stationary successive time-series drought over the basin of interest. However, autocorrelation makes it easier to model and forecast by removing the non-stationarity time-series drought indices and producing a constant mean and variance. Autocorrelation specifically avoids the bogus regression issue. The study applied autocorrelation in drought prediction, which would serve as pre-motivation of forecasting.
All gridded stations witnessed extreme drought at −2.89, −2.74, −2.82, and −2.1 in 1987 at Mafraq, Wadi Dhullal, Amman, and Zarqa, respectively, except for Swaileh, which received its extreme drought in 2020 at around −2.32. There was a delay in describing the essence of drought occurrence until 1990 (−1.76) in Zarqa via assimilation of CMIP6-ssp126. Under CMIP6 projections, the highest drought intensity was estimated in 2004 and 2013 in Swaileh, while in Zarqa, the drought intensity occurred in 2013 during the last quarter of 2004 and in May 2010. In Wadi Dhullal during 1987, 1990, 1995, 1999, 2004, 2010 and 2013, CMIP6 took the highest drought severity of around (−1.73 to −2.86). In Amman station, under CMIP projections (3 months), the highest drought values vary from severe to extreme drought (−1.51 to −2.89) during the years 1987, 1990, 1995, 2003, 2004, 2010, 2013, 2015, 2019, and 2021.
Therefore, CMIP6 is capable of capturing the drought occurrence and severity by measuring SPI but did not capture the severity magnitude the same as from observations (−2.87 by observation and −1.77 by CMIP6). Since this study chooses the sustainable pathway that suggests using green approaches for environmental conditions, the only driven variables that affect drought characteristics are changes in precipitation and temperature under different ground cover. Green land cover signifies drought intensity and duration that is less intensified than bare soil or scattered crops. Further to its capability, CMIP6 estimates the sensitivity of the climate of gridded surface temperatures to the increasing atmospheric CO2, which is defined during a longer analysis period than 40 years. This sensitivity cannot be discovered via observations.
The provided observation datasets estimate the 6-month SPI and compare it to the projected CMIP6 temperature and precipitation monthly gridded data for the reference period 1985–2022. The corresponding drought index for SPI6 calculated by CMIP6 ssp1.5 shows identical ups and downs of wet and dry intensity but a delay in observing the change. This can be explained by providing information on CMIP6 that evolves surface soil moisture and crop stress conditions at fine-gridded spatial resolution. Drought indices driven by CMIP6 projections for the same period demonstrate the capability for capturing early signals of flash drought, which is carried by combining hot, dry, and windy conditions, leading to higher evaporation stress and hence, rapid soil moisture depletion. Except for a few indices, as shown in Figure 6, the extreme drought occurred in 2013 from July to September (−2.96, −2.91, & −3.1) in Amman Airport station show contrary to the calculated observed SPI6, which shows nearly normal conditions (SPI6 values in Amman station 0.48, −0.09, and −0.03, respectively). Other drought indices corresponding to CMIP6 projections are shifts in drought early signals.
The CSIC global SPEI uses Probability Weighted Moments (PWMs) based on the plotting position formula between sites and across time scales, and this method had no solutions at some geographical sites. The unbiased PWMs yielded excellent results and provided SPEI series with equal variance throughout the basin. It is noticed that the lagged fit of drought severity between the calculated SPEI and the modelled CSIC SPEI might be justified as the results of an unbiased estimator of probability weighted moment’s methodology of CSIC SPEI.
Longer time scale drought analysis shows a better correlation between SPI and SPEI since it suppresses the variability and outliers of data outputs; SPI12 vs. SPEI12 best fit than SPI6 vs. SPEI6 and accordingly, the outputs of SPI3 vs. SPEI3. Long-term drought monitoring is significant for planning and mitigating the impacts of hydrological droughts in any region.
The longest drought duration ranged from 6 months up to 14 months and is frequently 12 month durations and 9.9 months on average. The end of a drought incident is not necessarily followed by a wet period; it is often tracked by normal drought months (−1.0 ≥ SPI ≥ 0) or short moist breaks.
Drought severity and average intensity were found to be −24.64 and −1.76, −23.80 and −1.83, −23.57 and −1.96, −23.44 and −2.0 where the corresponding drought categories were SPI 12 Sweileh, SPI 9 Sweileh, SPI 12 Wadi Dhullal, and SPI 12 Amman Airport.
The dominant drought incidents occurred among all stations between Oct 2020 and Dec 2021. The next occurring incident was in 1999, followed by 2014, and then there was a chance of a dominant occurrence during 2004 and 2010.
The SPI values are more extreme than that of SPEI in the whole temporal period, which indicates that there might be abrupt changes in the amount of precipitation, but temperature and rate of evapotranspiration might be changing comparatively at a slow rate.
This study adopted the effect of climatological driving factors on drought rather than evaluating vegetation destruction and its dynamic monitoring, soil moisture depletion, water scarcity, and so on. SPEI partially enhances the capability of the vegetative health index to monitor drought [44]. SPI reflects versatility to detect drought dimensions with flexibility and utility [45]. Since hydrological drought, vegetation drought, and socio-economic drought are accordingly responding to meteorological drought, SPI and SPEI are the prime indices. Overall, our study provides a basic reference for reasonably choosing SPI or SPEI derived from different sources, mainly in case of sparse observational weather data, to obtain a better understanding of the environmental conditions and future risks. Liu and colleagues [46] declared in their study the effective approach of SPI and SPEI to measure the changes in drought characteristics on time and space ranges. In this study, we applied Pearson Correlation between each one-to-one index at different time scales having different data sources to measure the inferential capturing of drought events. With respect to correlation, PCC measures the coefficient of determination R2, which measures the proportion of the variance that is shared by different time-series scales of drought indices. In other words, it explained the amount of variation by correlation.
We can notice that ARIMA modelled SPEI-12 declared severe droughts more frequent than modelled TBATS SPEI-12 in Amman Airport point. Amman, Swaileh and Wadi Dhullal by ARIMA are susceptible to more severe drought as the point forecast is >−1.0 CSIC-SPEI-12 intensity, the means of low to high 95%. Mafraq confronts normal dryness conditions with average drought intensity ARIMA-SPI by −0.786, but TBATS expects severe drought in Mafraq from Jan 2022 to April 2023. The CMIP6-ssp126 SPI and SPEI modelled TBATS and ARIMA results revealed that all months during the study period (2022–2025) will be dry as compared to the historical period (1985–2021).
Few studies have examined the effect of spatial and temporal normalisation that is widely deployed on constructed drought indices. The study of [47] concluded that rescaling of time-series, original data would lead to losing the ability to track the drought development, reduce the truthfulness of drought severity, obscure the drought signal and reduce the evidence content.
5. Conclusions
This study determined drought trends with different data sources to measure the inferential capturing of historical drought features. The longest drought duration ranged 6–14 months. The end of drought incidents did not necessarily follow a wet period; it often keeps track of normal drought months (−1.0 ≥ SPI ≥ 0) or short moist breaks.
The 9-month SPI was a good indicator of a change in drought. The SPI values are more extreme and more sensitive to drought assessment than SPEI, given that no association exists on an ordinal scale than that of SPEI in the whole temporal period. This indicates that there might be abrupt changes in the amount of precipitation, but temperature and rate of evapotranspiration might be comparatively changing at a slow rate.
CMIP6 is capable of capturing the drought occurrence and severity by measuring SPI but did not capture the same severity magnitude as the observations. CMIP6 estimates the sensitivity of the climate of gridded surface temperatures to the increasing atmospheric CO2, which is defined during a longer analysis period than 40 years. This sensitivity cannot be discovered via observations.
The results revealed that there will be continuous and more prolonged drought events in the study area. These droughts will be more frequent, severe, and of longer duration. It can be seen that the ARIMA-modelled SPEI-12 declared severe droughts more frequent than the TBATS-modelled SPEI-12 in the Amman Airport, Swaileh, and Wadi Dhullal. Mafraq confronts normal dryness conditions with an average drought intensity of ARIMA-SPI, but TBATS expects severe drought in Mafraq. ARIMA was the most accurate model to forecast the drought index using the observed historical SPEI and CSIC across all stations.
The performance metrics ME, RMSE, MAE, and MASE give an indication that TBATS and ARIMA are significantly promising models for forecasting since they correspond to the observed data. Where the trends differed only a little by using the CSIC index as an input, hybrid modelling is suggested for more consistency and robustness in forecasting approaches. The ACF revealed that the present forecast values were not correlated with the former ones. In general, TBATS and ARIMA performed slightly differently depending on the inputs. The mid-term to long-term predictions generally failed to achieve inevitable certainty, which requires continuous scientific future work in drought signals predictions. Our study findings underscored the necessity of seasonality and spatial differences for the best monitoring of drought by merging the in situ with remotely sensing drought indices.
Author Contributions
Conceptualization, N.A.H.; methodology, N.A.H.; software, N.A.H. and F.A.-S.; validation, N.A.H., F.A.-S. and Y.D.; formal analysis, N.A.H. and F.A.-S.; investigation, N.A.H.; resources, N.A.H. and F.A.-S.; data interpretation, N.A.H., F.A.-S. and Y.D.; writing—original draft preparation, N.A.H.; writing—review and editing, N.A.H., F.A.-S. and Y.D.; visualization, N.A.H. and F.A.-S.; supervision, Y.D. and F.A.-S.; funding acquisition, Y.D. All authors have read and agreed to the published version of the manuscript.
Funding
Publications fees were funded by Beihang University, Beijing.
Data Availability Statement
Data is available upon request.
Acknowledgments
The authors would like to thank the Ministry of Water and Irrigation, Jordan, CMIP6, and CSIC for making their modelling outputs available. The authors would also like to thank the editor and reviewers for their insightful comments and substantial help in improving this article. Appreciation is extended to Weng Jingnong, the Executive Director of Regional Centre for Space Science and Technology Education in Asia and the Pacific (RCSSTEAP), Yang Dongkai, Tan Yumin, and Beihang University for their continuous support.
Conflicts of Interest
The authors declare no conflict of interest.
References
- Moazzam, M.F.U.; Lee, B.G.; Rahman, G.; Waqas, T. Spatial Rainfall Variability and an Increasing Threat of Drought, According to Climate Change in Uttaradit Province, Thailand. Atmos. Clim. Sci. 2020, 10, 357–371. [Google Scholar] [CrossRef]
- Rafiq, M.; Li, Y.C.; Cheng, Y.; Rahman, G.; Ullah, I.; Ali, A. Spatial and temporal fluctuation of rainfall and drought in Balochistan province, Pakistan. Arab. J. Geosci. 2022, 15, 214. [Google Scholar] [CrossRef]
- Rahman, A.U.; Dawood, M. Spatio-statistical analysis of temperature fluctuation using Mann–Kendall and Sen’s slope approach. Clim. Dyn. 2017, 48, 783–797. [Google Scholar] [CrossRef]
- Ndayiragije, J.M.; Li, F. Effectiveness of Drought Indices in the Assessment of Different Types of Droughts, Managing and Mitigating Their Effects. Climate 2022, 10, 125. [Google Scholar] [CrossRef]
- Müller, L.M.; Bahn, M. Drought legacies and ecosystem responses to subsequent drought. Glob. Change Biol. 2022, 28, 5086–5103. [Google Scholar] [CrossRef]
- Mukherjee, S.; Mishra, A.; Trenberth, K.E. Climate Change and Drought: A Perspective on Drought Indices. Curr. Clim. Change Rep. 2018, 4, 145–163. [Google Scholar] [CrossRef]
- Khan, A.A.; Zhao, Y.; Khan, J.; Rahman, G.; Rafiq, M.; Moazzam, M.F.U. Spatial and Temporal Analysis of Rainfall and Drought Condition in Southwest Xinjiang in Northwest China, Using Various Climate Indices. Earth Syst. Environ. 2021, 5, 201–216. [Google Scholar] [CrossRef]
- Dai, A. Increasing drought under global warming in observations and models. Nat. Clim. Change 2013, 3, 171. [Google Scholar] [CrossRef]
- He, X.; Pan, M.; Wei, Z.; Wood, E.F.; Sheffield, J. A global drought and flood catalogue from 1950 to 2016. Bull. Am. Meteorol. Soc. 2020, 101, E508–E535. [Google Scholar] [CrossRef]
- Asadieh, B.; Krakauer, N.Y. Global trends in extreme precipitation: Climate models versus observations. Hydrol. Earth Syst. Sci. 2015, 19, 877–891. [Google Scholar] [CrossRef]
- Alamgir, M.; Shahid, S.; Hazarika, M.K.; Nashrrullah, S.; Bin Harun, S.; Shamsudin, S. Analysis of Meteorological Drought Pattern During Different Climatic and Cropping Seasons in Bangladesh. J. Am. Water Resour. Assoc. 2015, 51, 794–806. [Google Scholar] [CrossRef]
- Xu, L.; Abbaszadeh, P.; Moradkhani, H.; Chen, N.; Zhang, X. Continental drought monitoring using satellite soil moisture, data assimilation and an integrated drought index. Remote Sens. Environ. 2020, 250, 112028. [Google Scholar] [CrossRef]
- Strazzo, S.; Collins, D.C.; Schepen, A.; Wang, Q.J.; Becker, E.; Jia, L. Application of a hybrid statistical-dynamical system to seasonal prediction of north american temperature and precipitation. Mon. Weather Rev. 2019, 147, 607–625. [Google Scholar] [CrossRef]
- McKee, T.B.; Nolan, J.; Kleist, J. The relationship of drought frequency and duration to time scales. In Proceedings of the 8th Conference on Applied Climatology, Anaheim, CA, USA, 17–22 January 1993. [Google Scholar]
- Wilhite, D.; Svoboda, M.; Hayes, M. Understanding the complex impacts of drought: A key to enhancing drought mitigation and preparedness. Water Resour. Manag. 2007, 21, 763–774. [Google Scholar] [CrossRef]
- Vicente-Serrano, S.M.; Beguería, S. Comment on ‘Candidate distributions for climatological drought indices (SPI and SPEI)’ by James H. Stagge et al. Int. J. Climatol. 2016, 36, 2120–2131. [Google Scholar] [CrossRef]
- Tigkas, D.; Vangelis, H.; Tsakiris, G. DrinC: A software for drought analysis based on drought indices. Earth Sci. Inform. 2015, 8, 697–709. [Google Scholar] [CrossRef]
- Surendran, U.; Kumar, V.; Ramasubramoniam, S.; Raja, P. Development of Drought Indices for Semi-Arid Region Using Drought Indices Calculator (DrinC)—A Case Study from Madurai District, a Semi-Arid Region in India. Water Resour. Manag. 2017, 31, 3593–3605. [Google Scholar] [CrossRef]
- Li, J.; Wang, Y.; Li, Y.; Ming, W.; Long, Y.; Zhang, M. Relationship between meteorological and hydrological droughts in the upstream regions of the Lancang–Mekong River. J. Water Clim. Chang. 2022, 13, 421–433. [Google Scholar] [CrossRef]
- Guttman, N.B. accepting the standardized precipitation index: A calculation algorithm. JAWRA J. Am. Water Resour. Assoc. 1999, 35, 311–322. [Google Scholar] [CrossRef]
- Beguería, S.; Vicente-Serrano, S.M.; Angulo-Martínez, M. A multiscalar global drought dataset: The SPEI base: A new gridded product for the analysis of drought variability and impacts. Bull. Am. Meteorol. Soc. 2010, 91, 1351–1354. [Google Scholar] [CrossRef]
- Beguería, S.; Vicente-Serrano, S.M.; Reig, F.; Latorre, B. Standardized precipitation evapotranspiration index (SPEI) revisited: Parameter fitting, evapotranspiration models, tools, datasets and drought monitoring. Int. J. Climatol. 2014, 34, 3001–3023. [Google Scholar] [CrossRef]
- Zhou, J.; Wang, Y.; Su, B.; Wang, A.; Tao, H.; Zhai, J.; Kundzewicz, Z.W.; Jiang, T. Choice of potential evapotranspiration formulas influences drought assessment: A case study in China. Atmos. Res. 2020, 242, 104979. [Google Scholar] [CrossRef]
- van der Schrier, G.; Barichivich, J.; Briffa, K.R.; Jones, P.D. A scPDSI-based global data set of dry and wet spells for 1901–2009. J. Geophys. Res. Atmos. 2013, 118, 4025–4048. [Google Scholar] [CrossRef]
- Trenberth, K.E.; Dai, A.; Van Der Schrier, G.; Jones, P.D.; Barichivich, J.; Briffa, K.R.; Sheffield, J. Global warming and changes in drought. Nat. Clim. Change 2014, 4, 17–22. [Google Scholar] [CrossRef]
- Zhang, J.; Sun, F.; Xu, J.; Chen, Y.; Sang, Y.; Liu, C. Dependence of trends in and sensitivity of drought over China (1961–2013) on potential evaporation model. Geophys. Res. Lett. 2016, 43, 206–213. [Google Scholar] [CrossRef]
- Aschonitis, V.G.; Papamichail, D.; Demertzi, K.; Colombani, N.; Mastrocicco, M.; Ghirardini, A.; Castaldelli, G.; Fano, E.-A. High-resolution global grids of revised Priestley–Taylor and Hargreaves–Samani coefficients for assessing ASCE-standardized reference crop evapotranspiration and solar radiation. Earth Syst. Sci. Data 2017, 9, 615–638. [Google Scholar] [CrossRef]
- Quej, V.H.; Almorox, J.; Arnaldo, J.A.; Moratiel, R. Evaluation of Temperature-Based Methods for the Estimation of Reference Evapotranspiration in the Yucatán Peninsula, Mexico. J. Hydrol. Eng. 2019, 24, 05018029. [Google Scholar] [CrossRef]
- Duffy, K.A.; Schwalm, C.R.; Arcus, V.L.; Koch, G.W.; Liang, L.L.; Schipper, L.A. How close are we to the temperature tipping point of the terrestrial biosphere? Sci. Adv. 2021, 7, eaay1052. [Google Scholar] [CrossRef] [PubMed]
- Al-Shibli, F.M.; Ottom, M.A.; Saoub, H.; Al-Weshah, R. Comparative analysis of potential evapotranspiration calculation methods with era-reanalysis climate models’ projections in western asia, jordan. Appl. Ecol. Environ. Res. 2021, 19, 4849–4879. [Google Scholar] [CrossRef]
- Aschonitis, V.; Touloumidis, D.; ten Veldhuis, M.-C.; Coenders-Gerrits, M. Correcting Thornthwaite potential evapotranspiration using a global grid of local coefficients to support temperature-based estimations of reference evapotranspiration and aridity indices. Earth Syst. Sci. Data 2022, 14, 163–177. [Google Scholar] [CrossRef]
- Abatzoglou, J.T.; Dobrowski, S.Z.; Parks, S.A.; Hegewisch, K.C. TerraClimate, a high-resolution global dataset of monthly climate and climatic water balance from 1958–2015. Sci. Data 2018, 5, 170191. [Google Scholar] [CrossRef] [PubMed]
- Di Nunno, F.; Granata, F. Future trends of reference evapotranspiration in Sicily based on CORDEX data and Machine Learning algorithms. Agric. Water Manag. 2023, 280, 108232. [Google Scholar] [CrossRef]
- Berg, P.; Almén, F.; Bozhinova, D. HydroGFD3.0 (Hydrological Global Forcing Data): A 25 km global precipitation and temperature data set updated in near-real time. Earth Syst. Sci. Data 2021, 13, 1531–1545. [Google Scholar] [CrossRef]
- Malik, A.; Kumar, A.; Salih, S.Q.; Yaseen, Z.M. Hydrological Drought Investigation Using Streamflow Drought Index. In Intelligent Data Analytics for Decision-Support Systems in Hazard Mitigation: Theory and Practice of Hazard Mitigation; Springer: Berlin/Heidelberg, Germany, 2021; pp. 63–88. [Google Scholar] [CrossRef]
- Aiyelokun, O.; Ogunsanwo, G.; Ojelabi, A.; Agbede, O. Gaussian Naïve Bayes Classification Algorithm for Drought and Flood Risk Reduction. In Intelligent Data Analytics for Decision-Support Systems in Hazard Mitigation: Theory and Practice of Hazard Mitigation; Springer: Berlin/Heidelberg, Germany, 2021; pp. 49–62. [Google Scholar] [CrossRef]
- Talukdar, S.; Singha, P.; Mahato, S.; Shahfahad; Pal, S.; Liou, Y.-A.; Rahman, A. Land-use land-cover classification by machine learning classifiers for satellite observations—A review. Remote Sens. 2020, 12, 1135. [Google Scholar] [CrossRef]
- Dawood, M.; Rahman, A.-U.; Ullah, S.; Mahmood, S.; Rahman, G.; Azam, K. Spatio-statistical analysis of rainfall fluctuation, anomaly and trend in the Hindu Kush region using ARIMA approach. Nat. Hazards 2020, 101, 449–464. [Google Scholar] [CrossRef]
- Rahman, G.; Rahman, A.; Anwar, M.M.; Dawood, M.; Miandad, M. Spatio-temporal analysis of climatic variability, trend detection, and drought assessment in Khyber Pakhtunkhwa, Pakistan. Arab. J. Geosci. 2022, 15, 81. [Google Scholar] [CrossRef]
- Li, C.; Zwiers, F.; Zhang, X.; Li, G.; Sun, Y.; Wehner, M. Changes in annual extremes of daily temperature and precipitation in CMIP6 models. J. Clim. 2021, 34, 3441–3460. [Google Scholar] [CrossRef]
- Riahi, K.; Van Vuuren, D.P.; Kriegler, E.; Edmonds, J.; O’Neill, B.C.; Fujimori, S.; Bauer, N.; Calvin, K.; Dellink, R.; Fricko, O.; et al. The Shared Socioeconomic Pathways and their energy, land use, and greenhouse gas emissions implications: An overview. Glob. Environ. Change 2017, 42, 153–168. [Google Scholar] [CrossRef]
- Abotaleb, M.; Makarovskikh, T.; Yonar, A.; Badr, A.; Mishra, P.; Williams, A.; Yonar, H. State of the art in wind speed in England using BATS, TBATS, Holt’s Linear and ARIMA model. Mausam 2022, 73, 129–138. [Google Scholar] [CrossRef]
- Perone, G. Comparison of ARIMA, ETS, NNAR, TBATS and hybrid models to forecast the second wave of COVID-19 hospitalizations in Italy. Eur. J. Health Econ. 2022, 23, 917–940. [Google Scholar] [CrossRef]
- Zeng, J.; Zhang, R.; Qu, Y.; Bento, V.A.; Zhou, T.; Lin, Y.; Wu, X.; Qi, J.; Shui, W.; Wang, Q. Improving the drought monitoring capability of VHI at the global scale via ensemble indices for various vegetation types from 2001 to 2018. Weather Clim. Extrem. 2022, 35, 100412. [Google Scholar] [CrossRef]
- Tramblay, Y.; Koutroulis, A.; Samaniego, L.; Vicente-Serrano, S.M.; Volaire, F.; Boone, A.; Le Page, M.; Llasat, M.C.; Albergel, C.; Burak, S.; et al. Challenges for drought assessment in the Mediterranean region under future climate scenarios. Earth-Sci. Rev. 2020, 210, 103348. [Google Scholar] [CrossRef]
- Liu, C.; Yang, C.; Yang, Q.; Wang, J. Spatiotemporal drought analysis by the standardized precipitation index (SPI) and standardized precipitation evapotranspiration index (SPEI) in Sichuan Province, China. Sci. Rep. 2021, 11, 1280. [Google Scholar] [CrossRef]
- Zhang, H.; Yin, G.; Zhang, L. Evaluating the impact of different normalization strategies on the construction of drought condition indices. Agric. For. Meteorol. 2022, 323, 109045. [Google Scholar] [CrossRef]
Figure 1.
(a) Study area location and meteorological stations’ location within the basin. (b) The study location topographic map (Source: Royal Jordanian Geographic Centre).
Figure 1.
(a) Study area location and meteorological stations’ location within the basin. (b) The study location topographic map (Source: Royal Jordanian Geographic Centre).

Figure 2.
(a) Gridded global map of the annual weighing Thornthwaite Coefficient at 30 arc-sec scale (Reprinted from Ref. [31]. Copyright 2022, copyright Copernicus Publications, archived in PANGAEA). (b) Amman–Zarqa Basin weighing Thornthwaite Coefficient at 30 arc-sec scale mathematically reprocessed using spatial analyst GIS.

Figure 3.
Temporal analysis of 3 month, 6 month, 9 month, and 12 month SPI and SPEI using climatological observations, projections of climate models for CMIP6-ssp126, and CSIC-downscaled datasets across the basin’s main stations in the following order: Amman Airport, Mafraq, Zarqa, Wadi Dhullal, and Swaileh.


Figure 4.
Pearson correlation matrix among different drought indices, where green circles show strong correlations, (orange to yellow) show insignificant correlations, and red circles show weak correlations. Scatterplot of 12 months SPEI vs. 12 months SPI in (a) Amman Airport, (b) Zarqa, (c) Wadi Dhullal, (d) Swaileh, and (e) Mafraq for the period 1985–2021, showing the R-squared value per station in the scatterplots in blue circles. While the small red circles scatterplots show the best achievable R2 among analysis per each station regardless to monthly timescales.


Figure 5.
Percentage of frequency of drought to the total number of months during 1985–2021 in different temporal scales based on SPI and SPEI at Amman–Zarqa Basin.
Figure 5.
Percentage of frequency of drought to the total number of months during 1985–2021 in different temporal scales based on SPI and SPEI at Amman–Zarqa Basin.

Figure 6.
ARIMA and TBATS models forecast results per station from 2022 to 2025. Each figure shows comparison plotting of monthly drought using SPI and SPEI. SPI’s three modelled groups are ARIMA and TBATS from observations (dark red), from CSIC and CMIP6 (steel-blue), and the future indices calculated from future CMIP6ssp126 projections (2022–2025) in (orange).

Figure 7.
ARIMA-SPI forecast example for Mafraq modelled from historical observations showing the training period (red arrows), testing (yellow arrows) and forecast (green arrows) run periods (light gray is the low and high 95% confidence interval, dark grey is the 80% confidence interval, and the blue curve is the point average forecast).

Figure 8.
Time series (ts-data) for the single models TBATS and ARIMA, including the historical baseline drought index and the generated forecast in the near future (black are the training data; generated drought index by ARIMA and TBATS are coloured).
Figure 8.
Time series (ts-data) for the single models TBATS and ARIMA, including the historical baseline drought index and the generated forecast in the near future (black are the training data; generated drought index by ARIMA and TBATS are coloured).


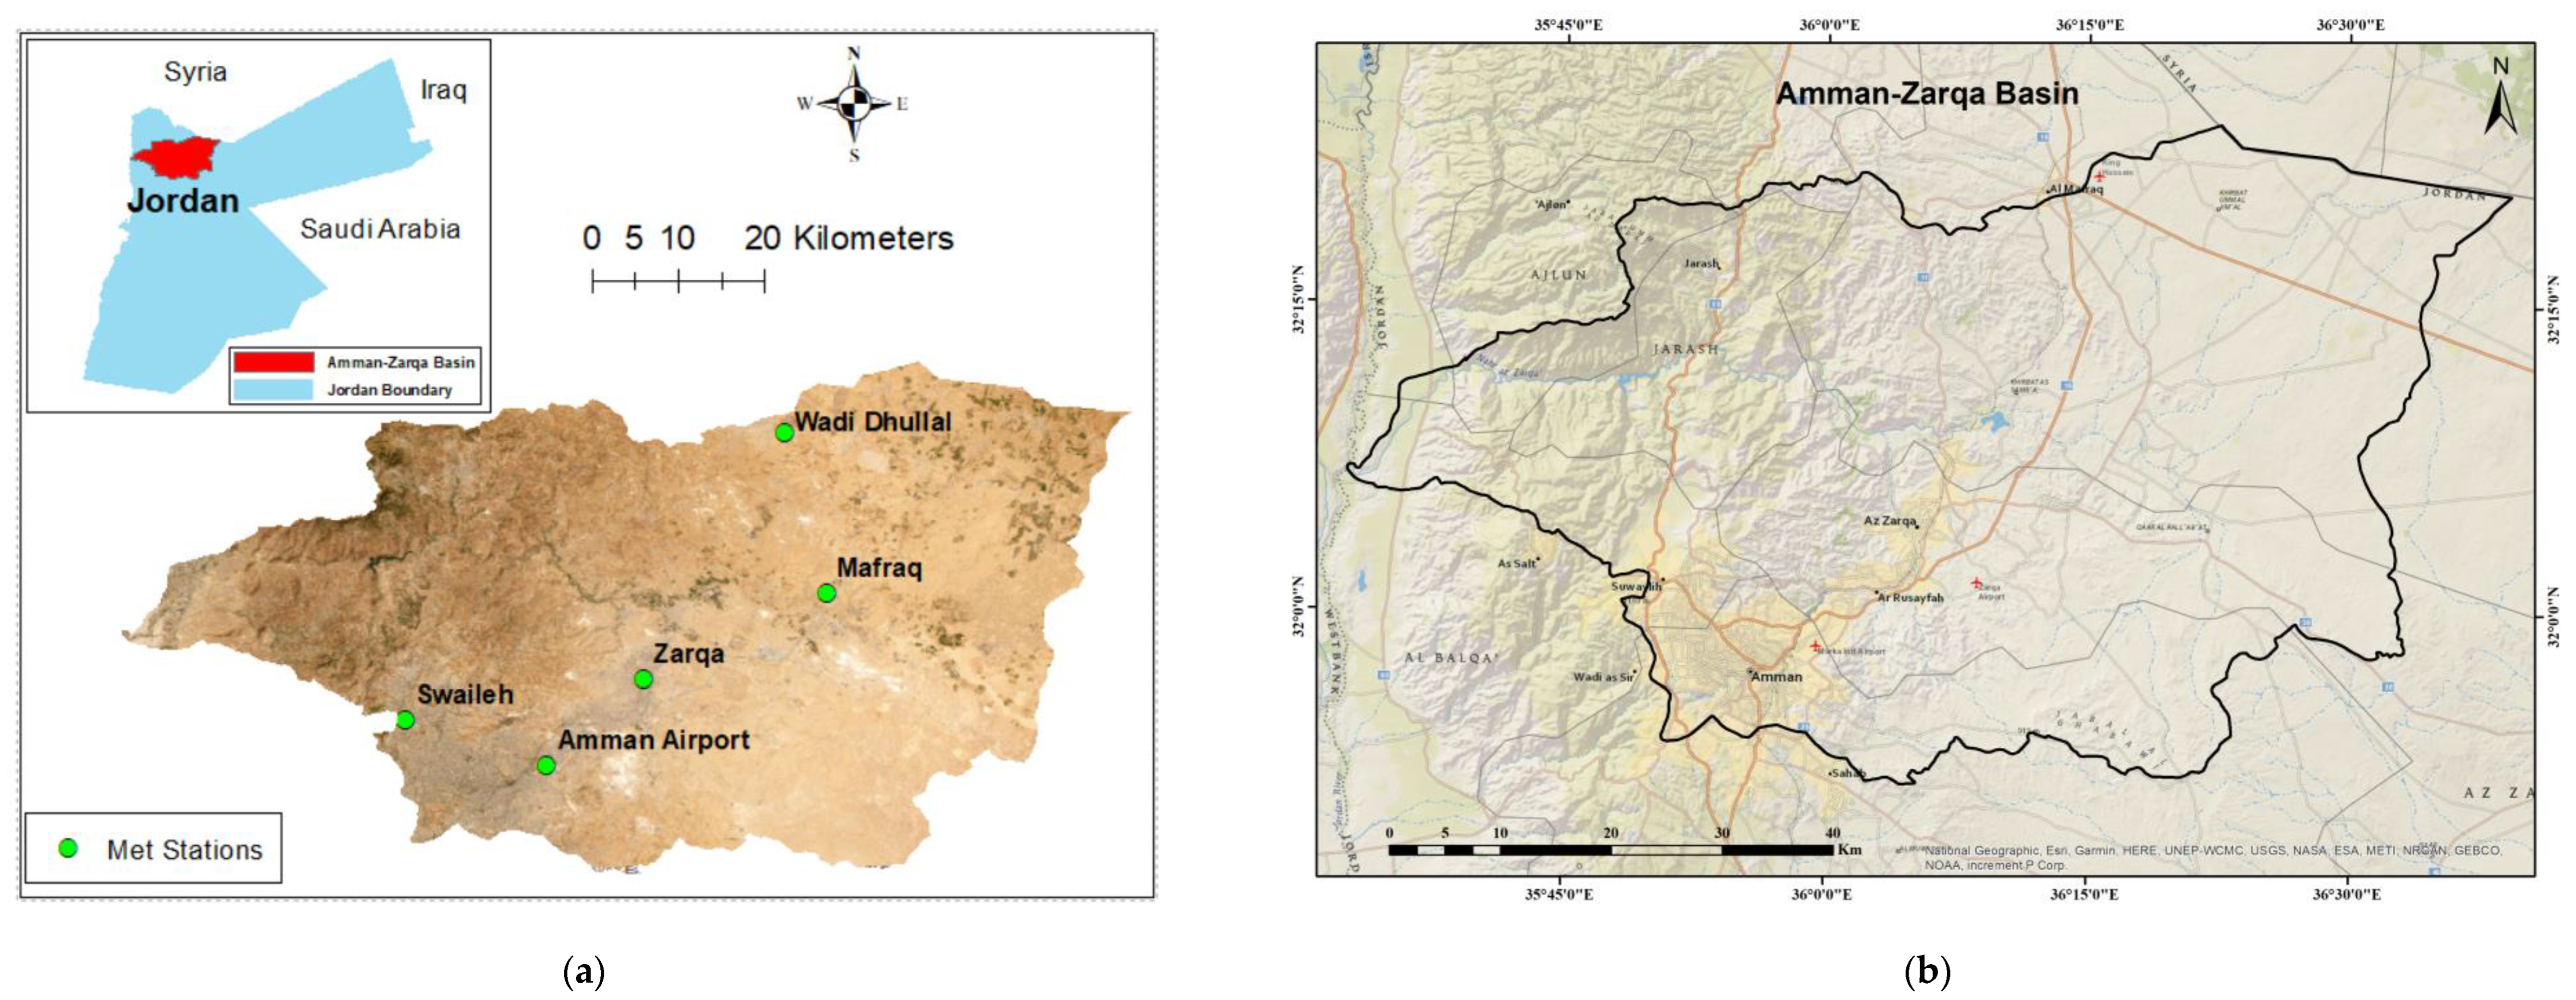
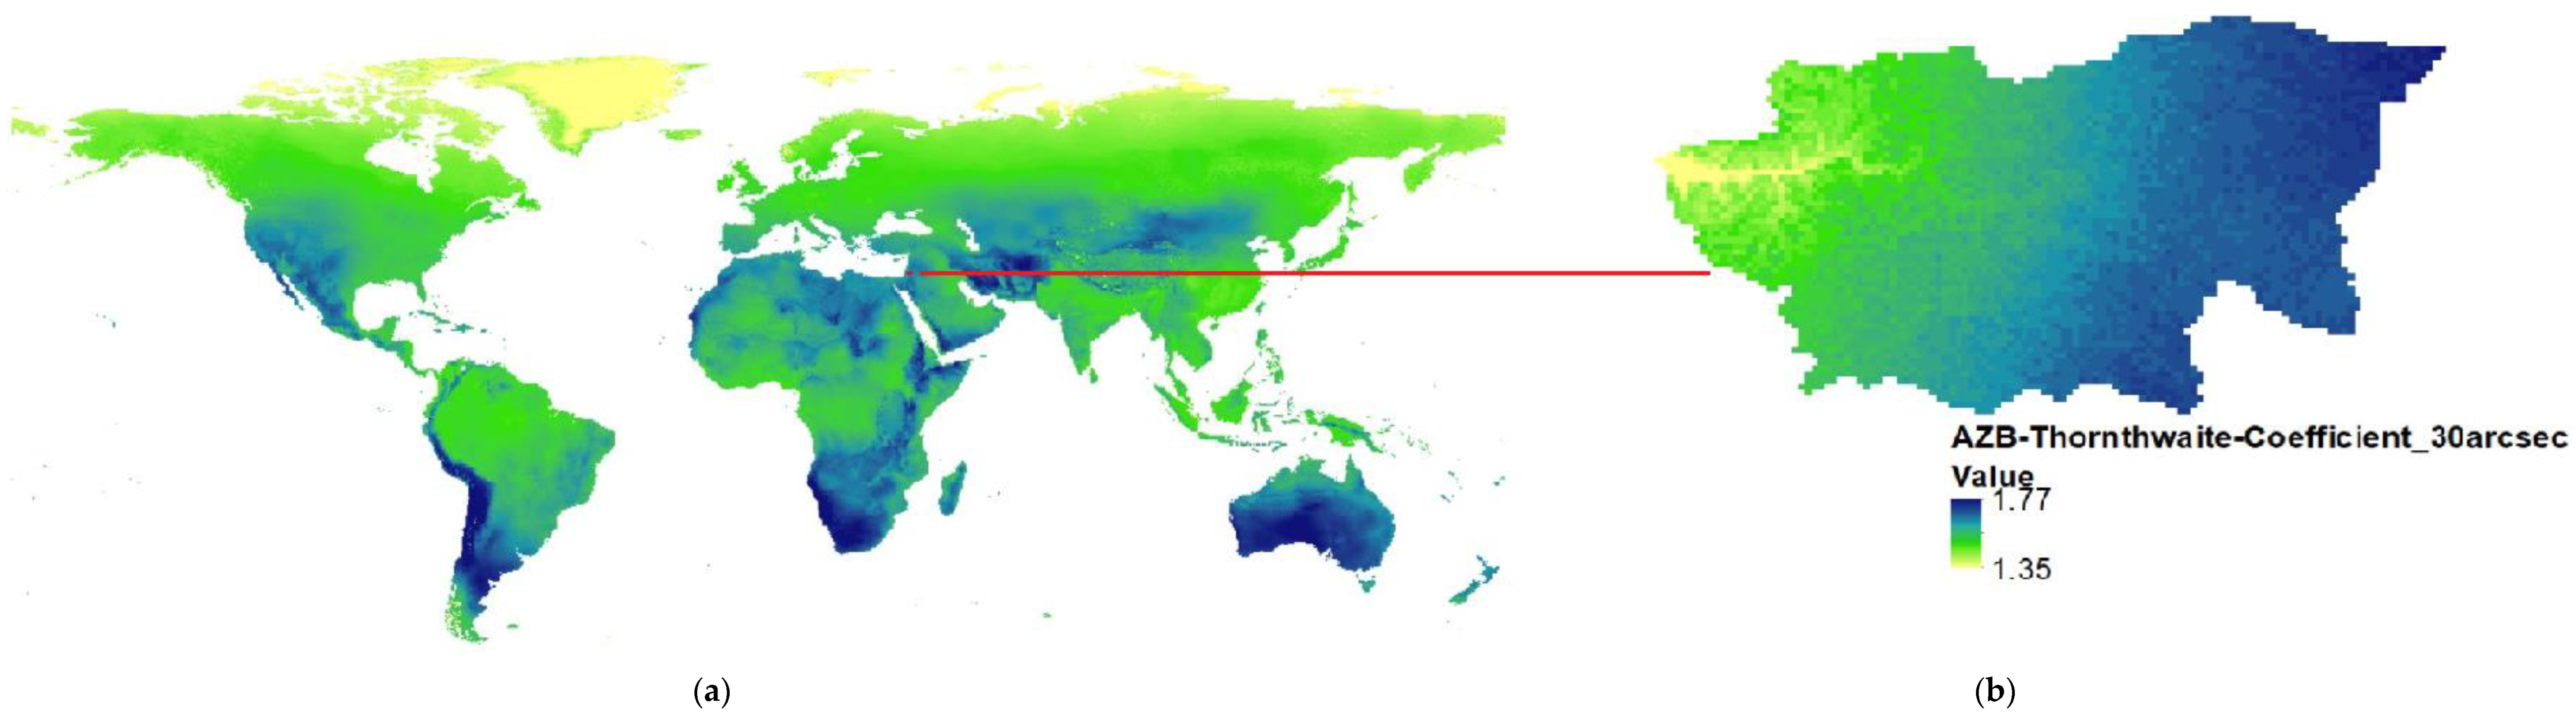
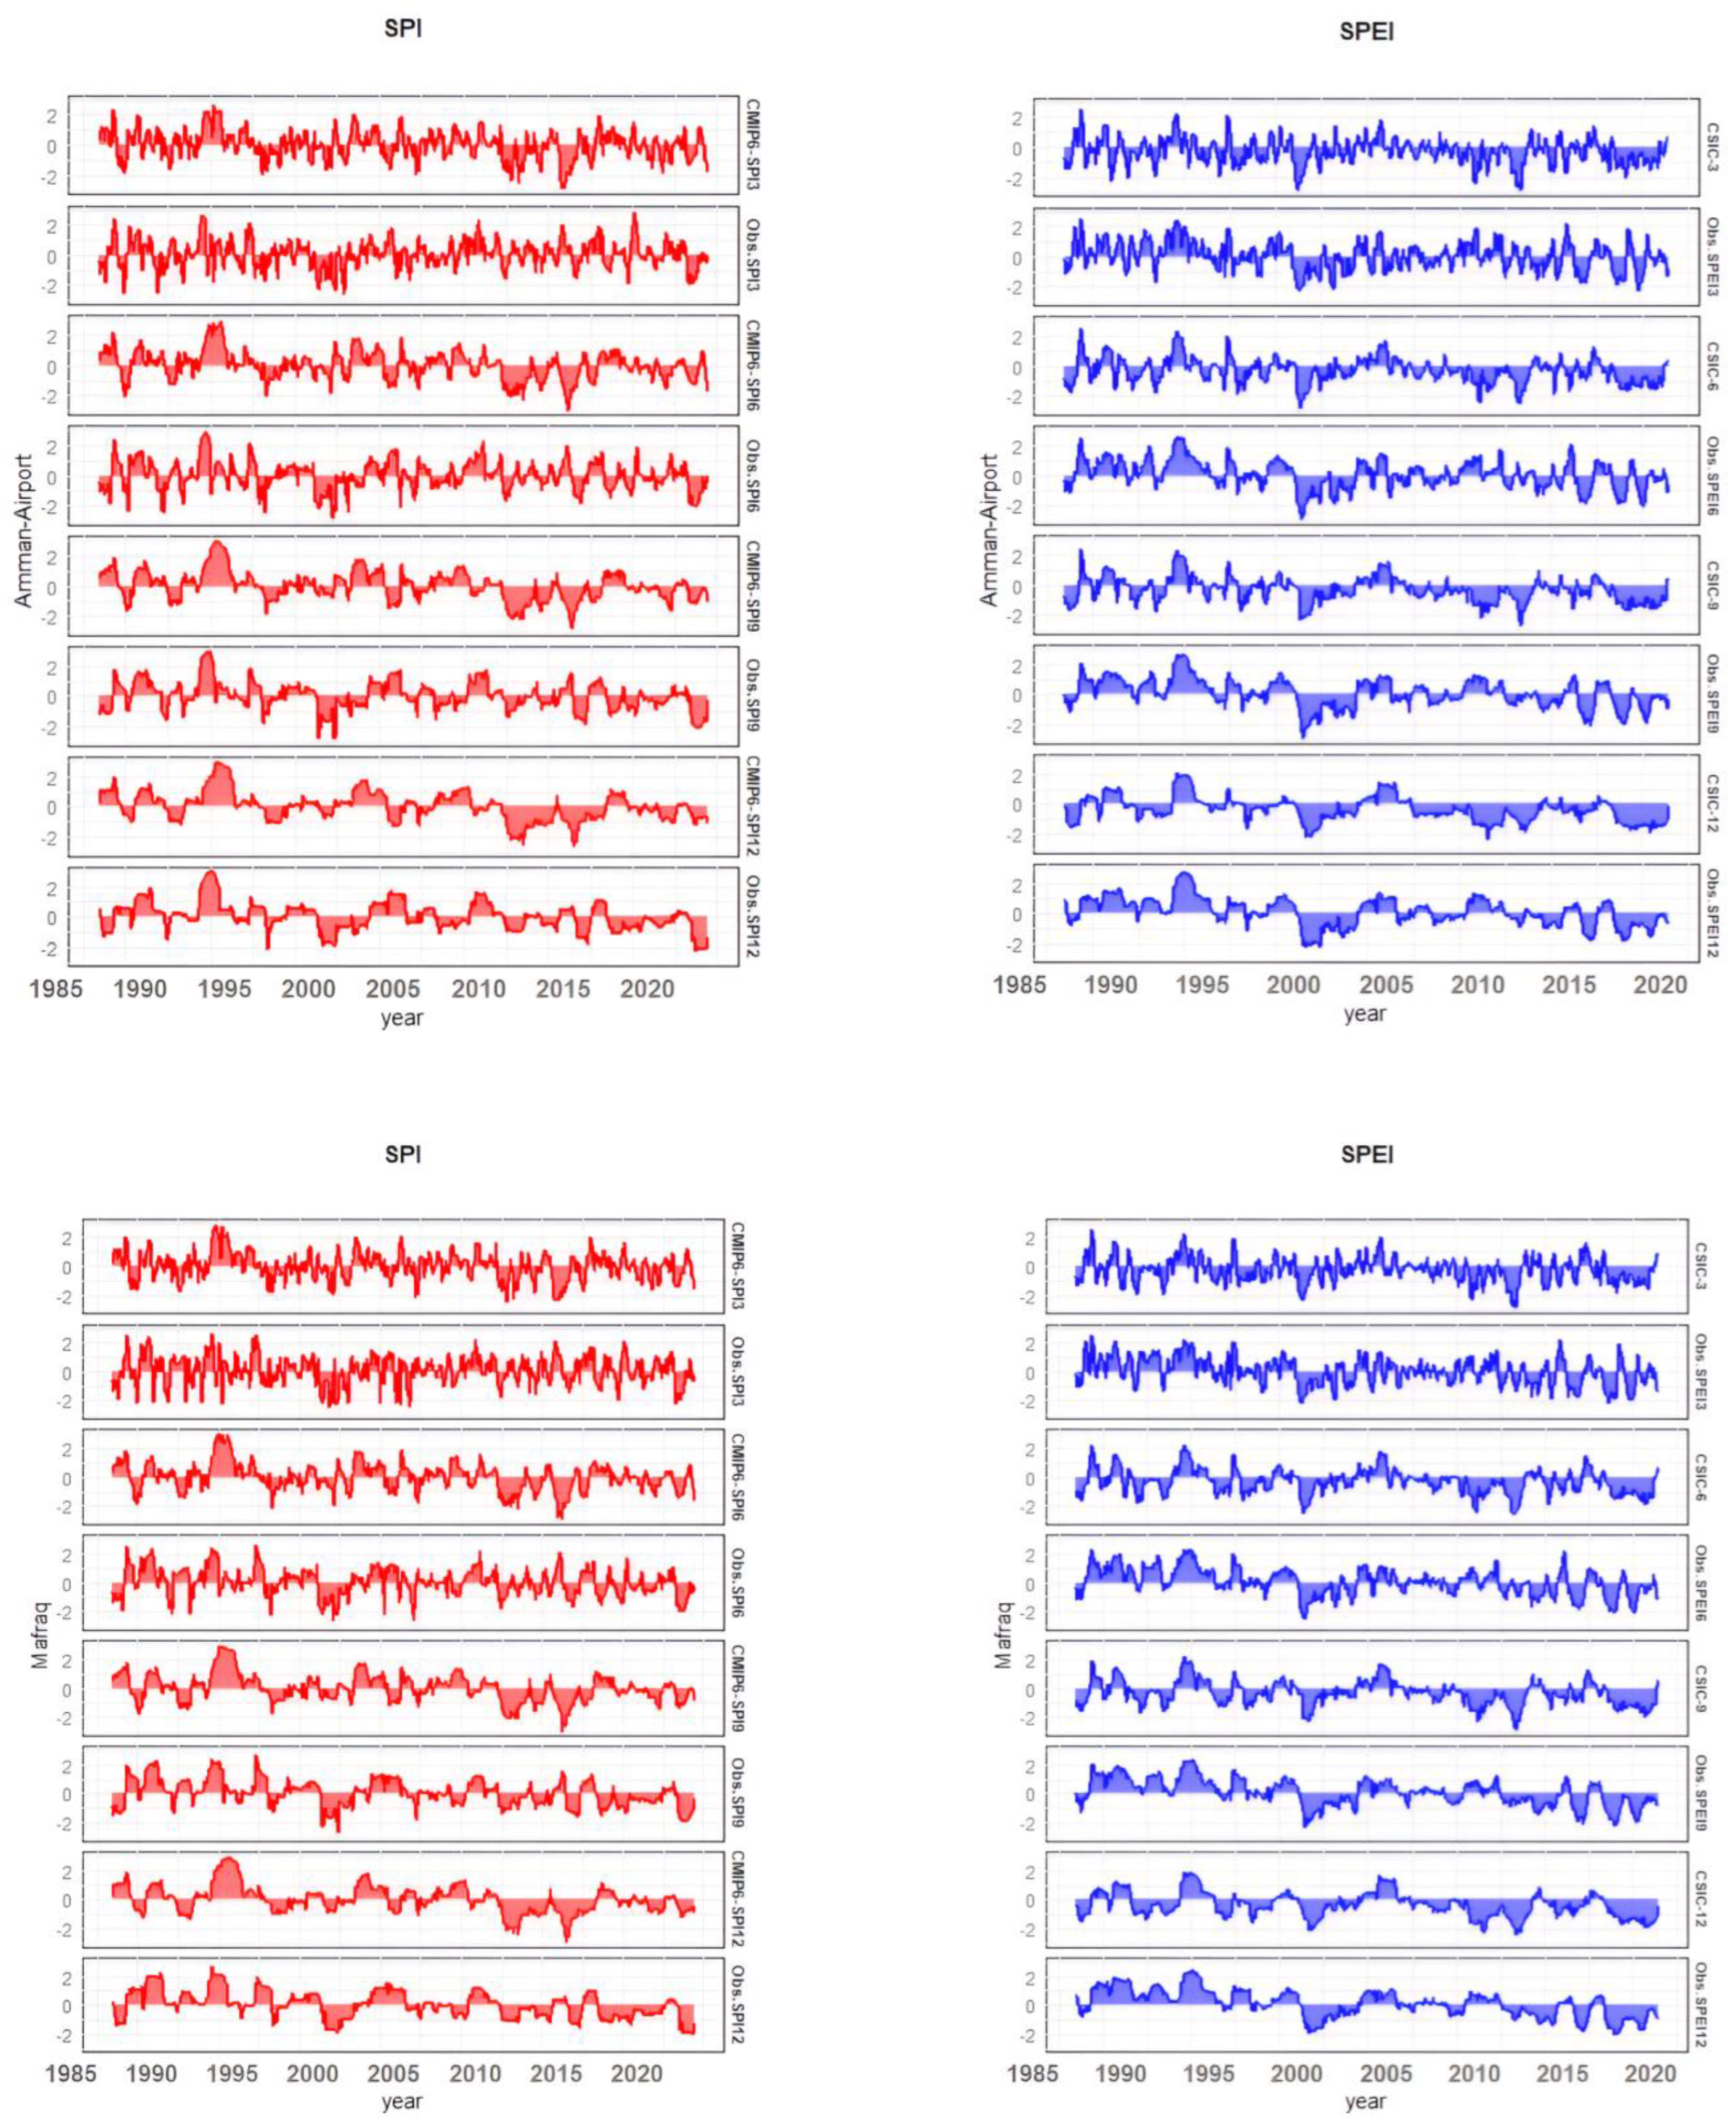
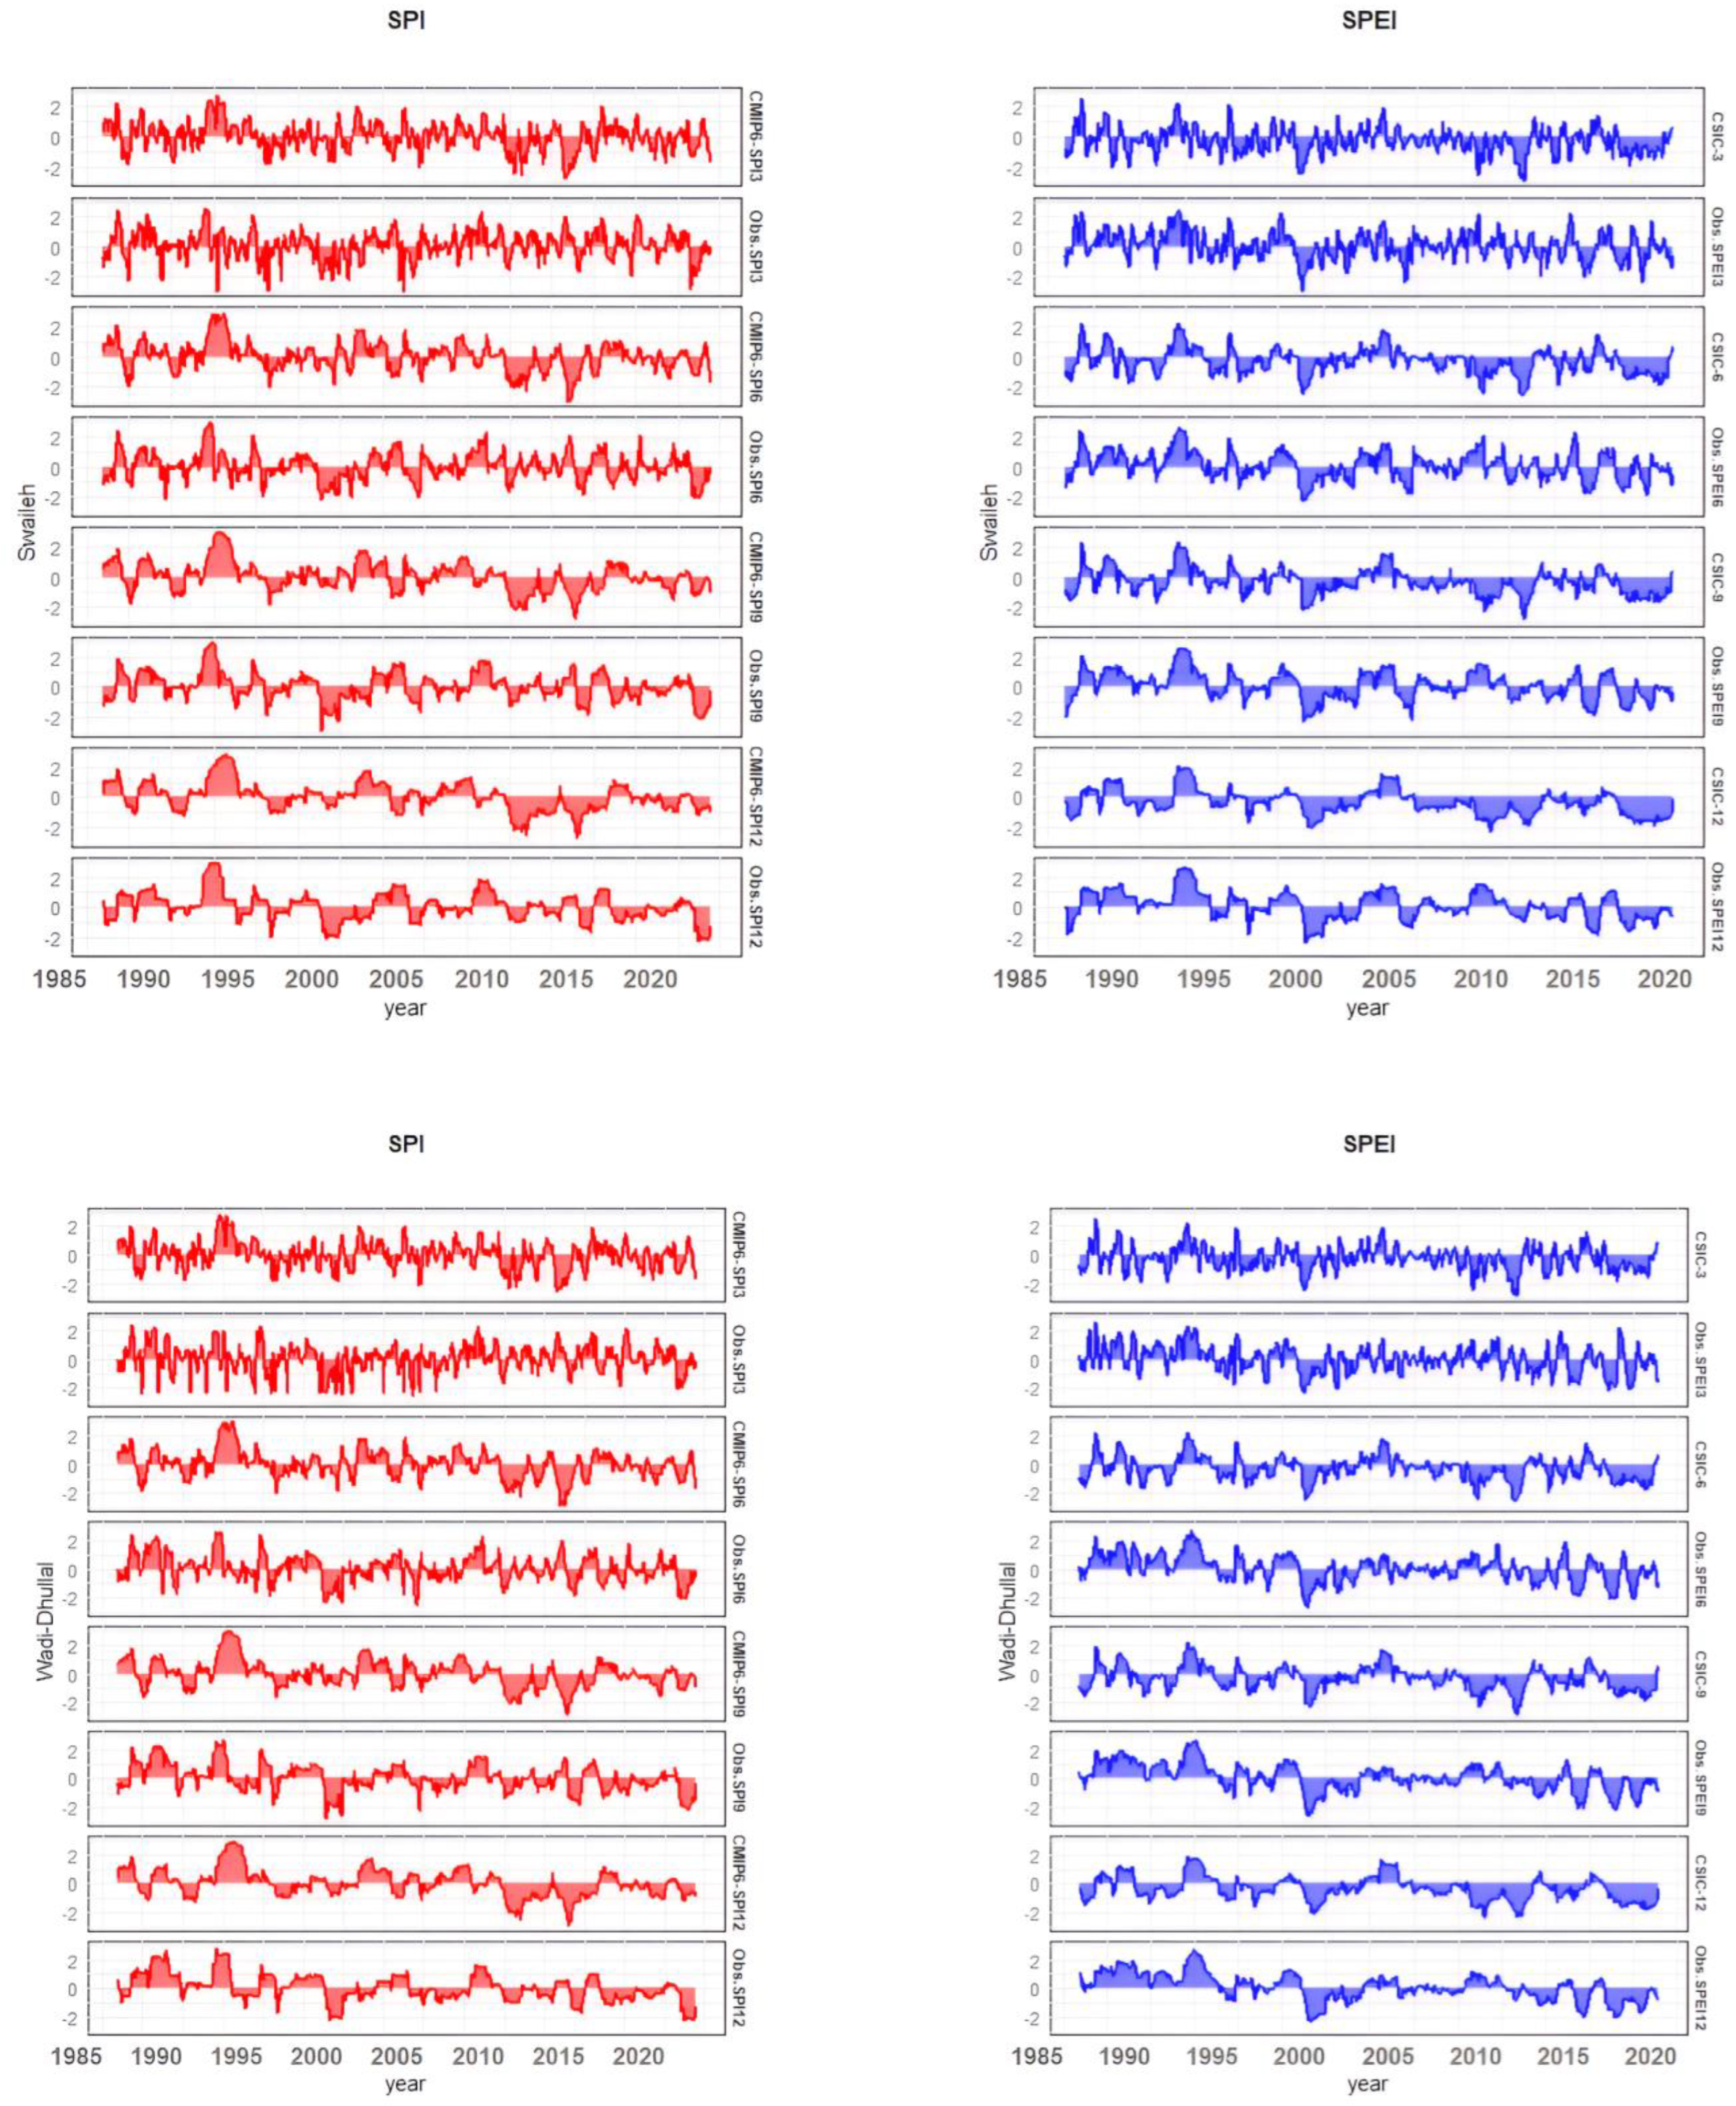
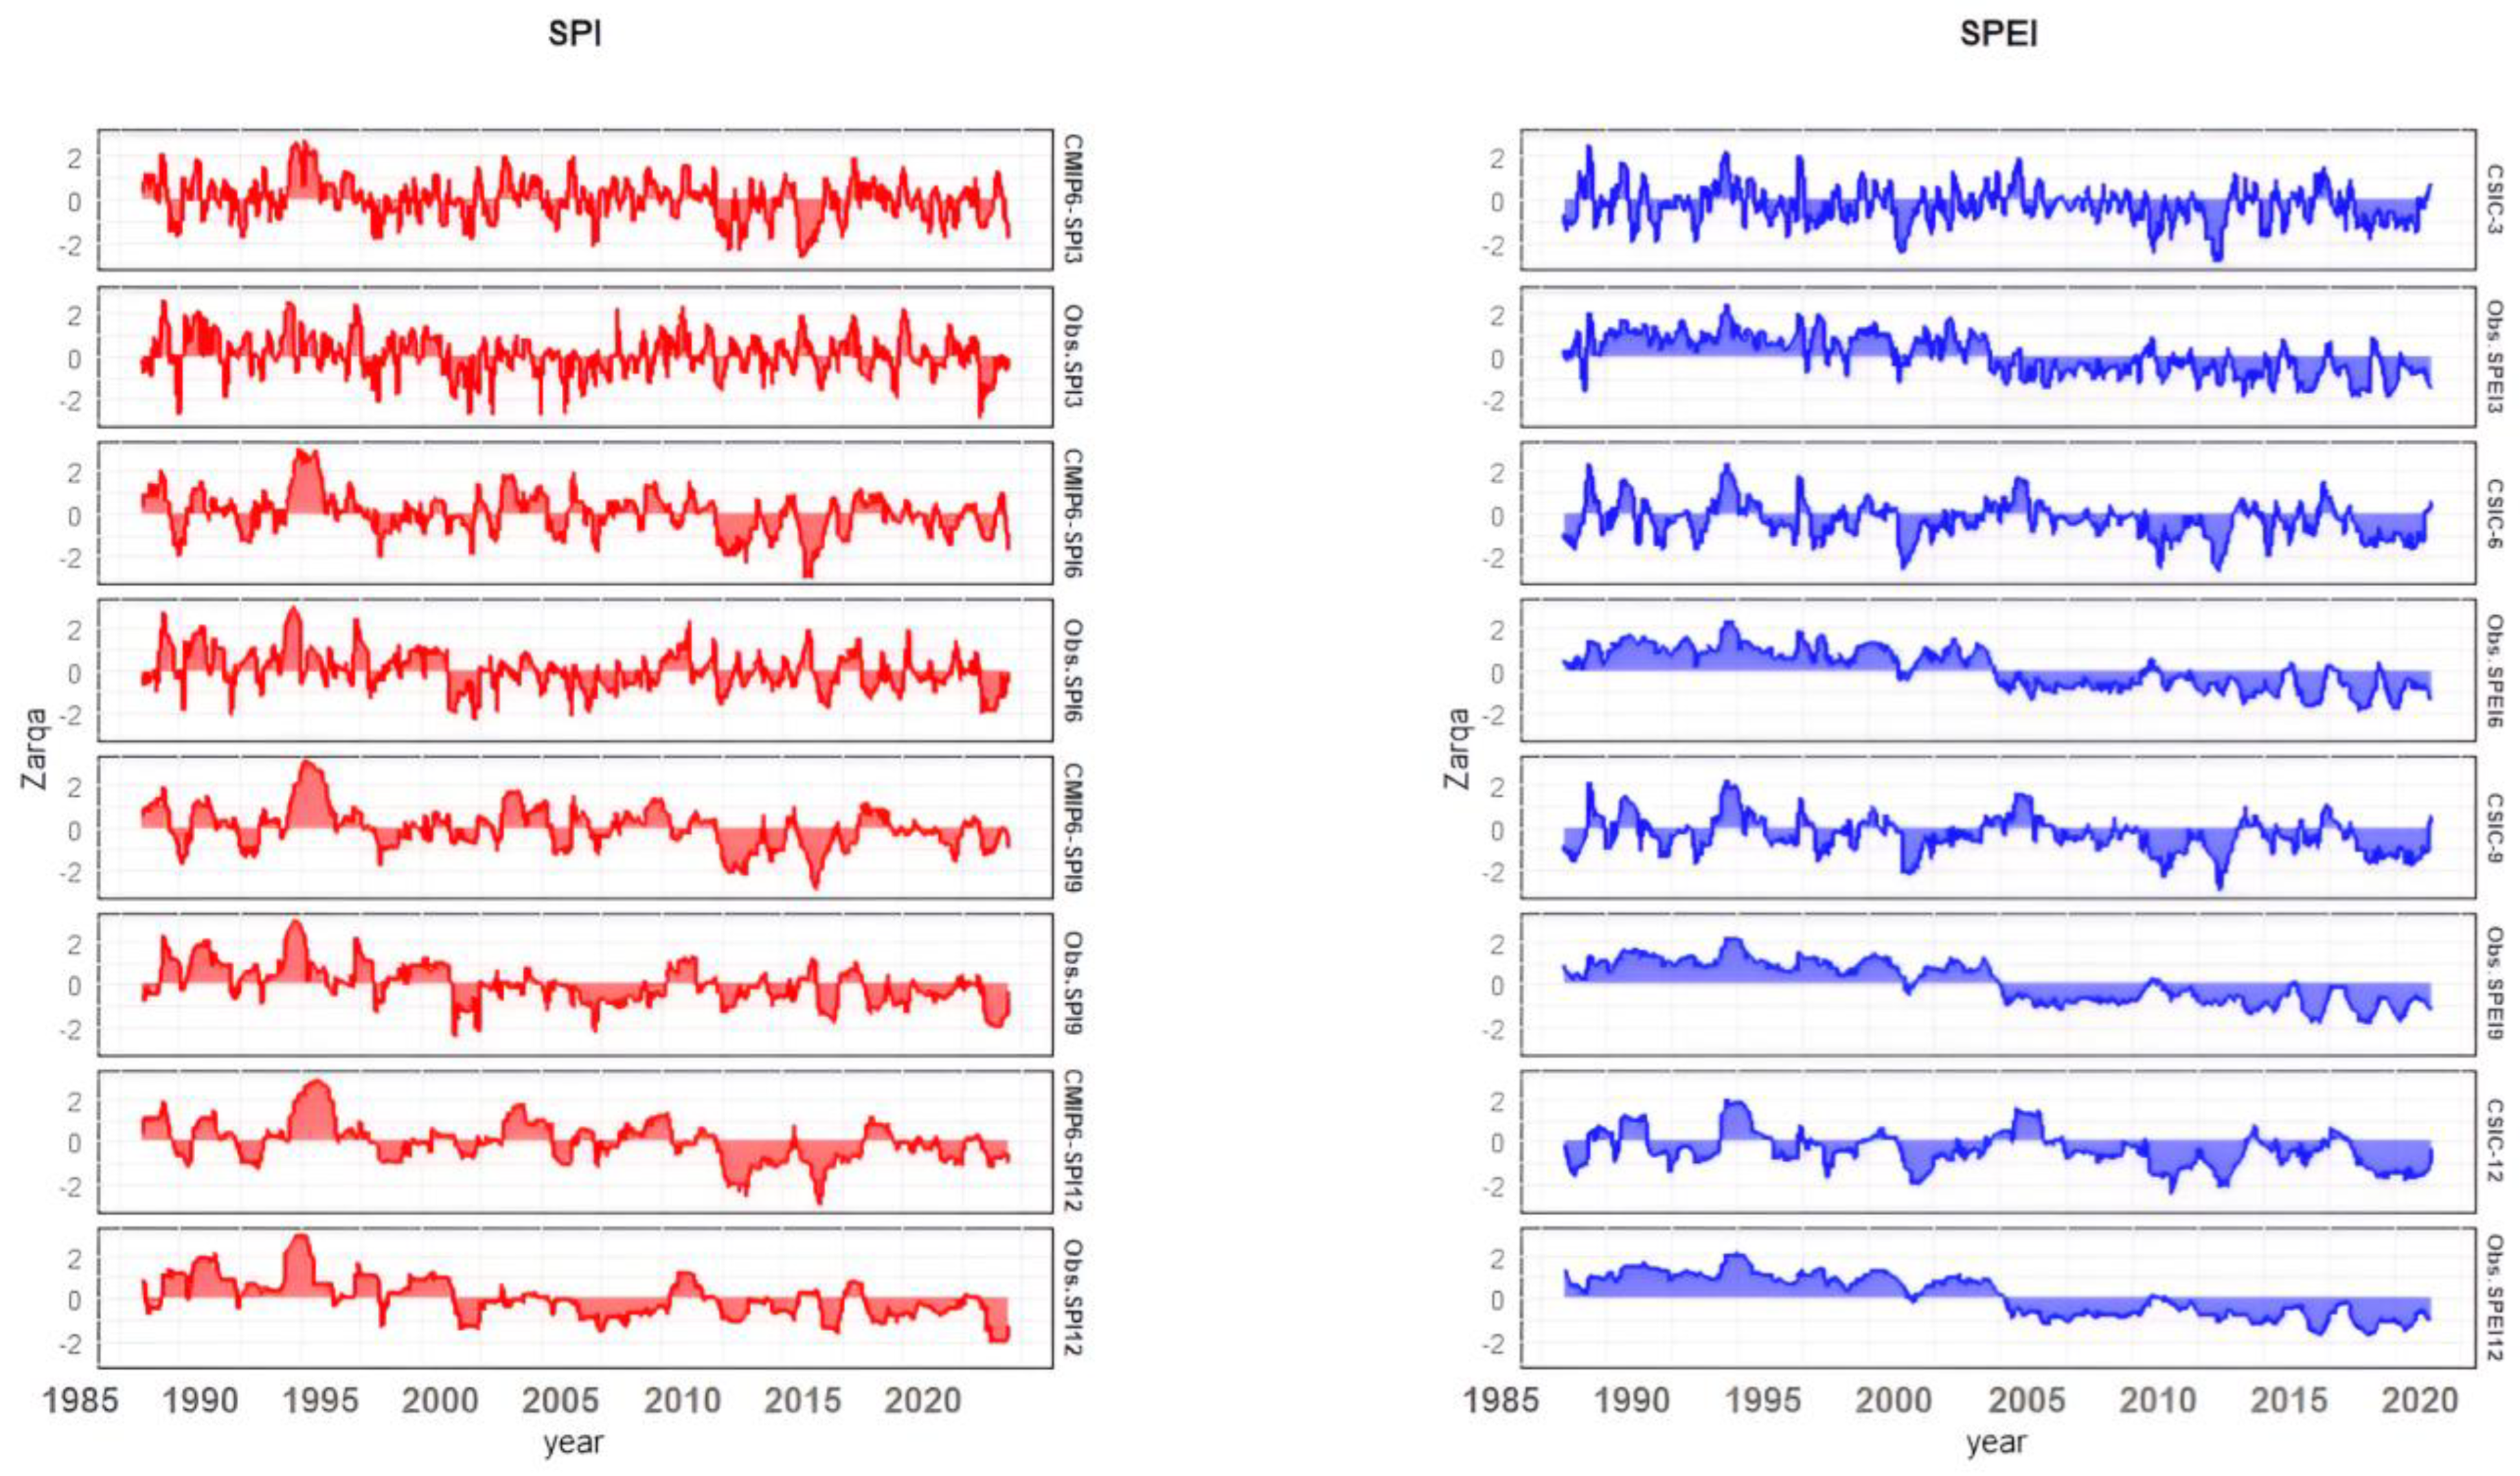
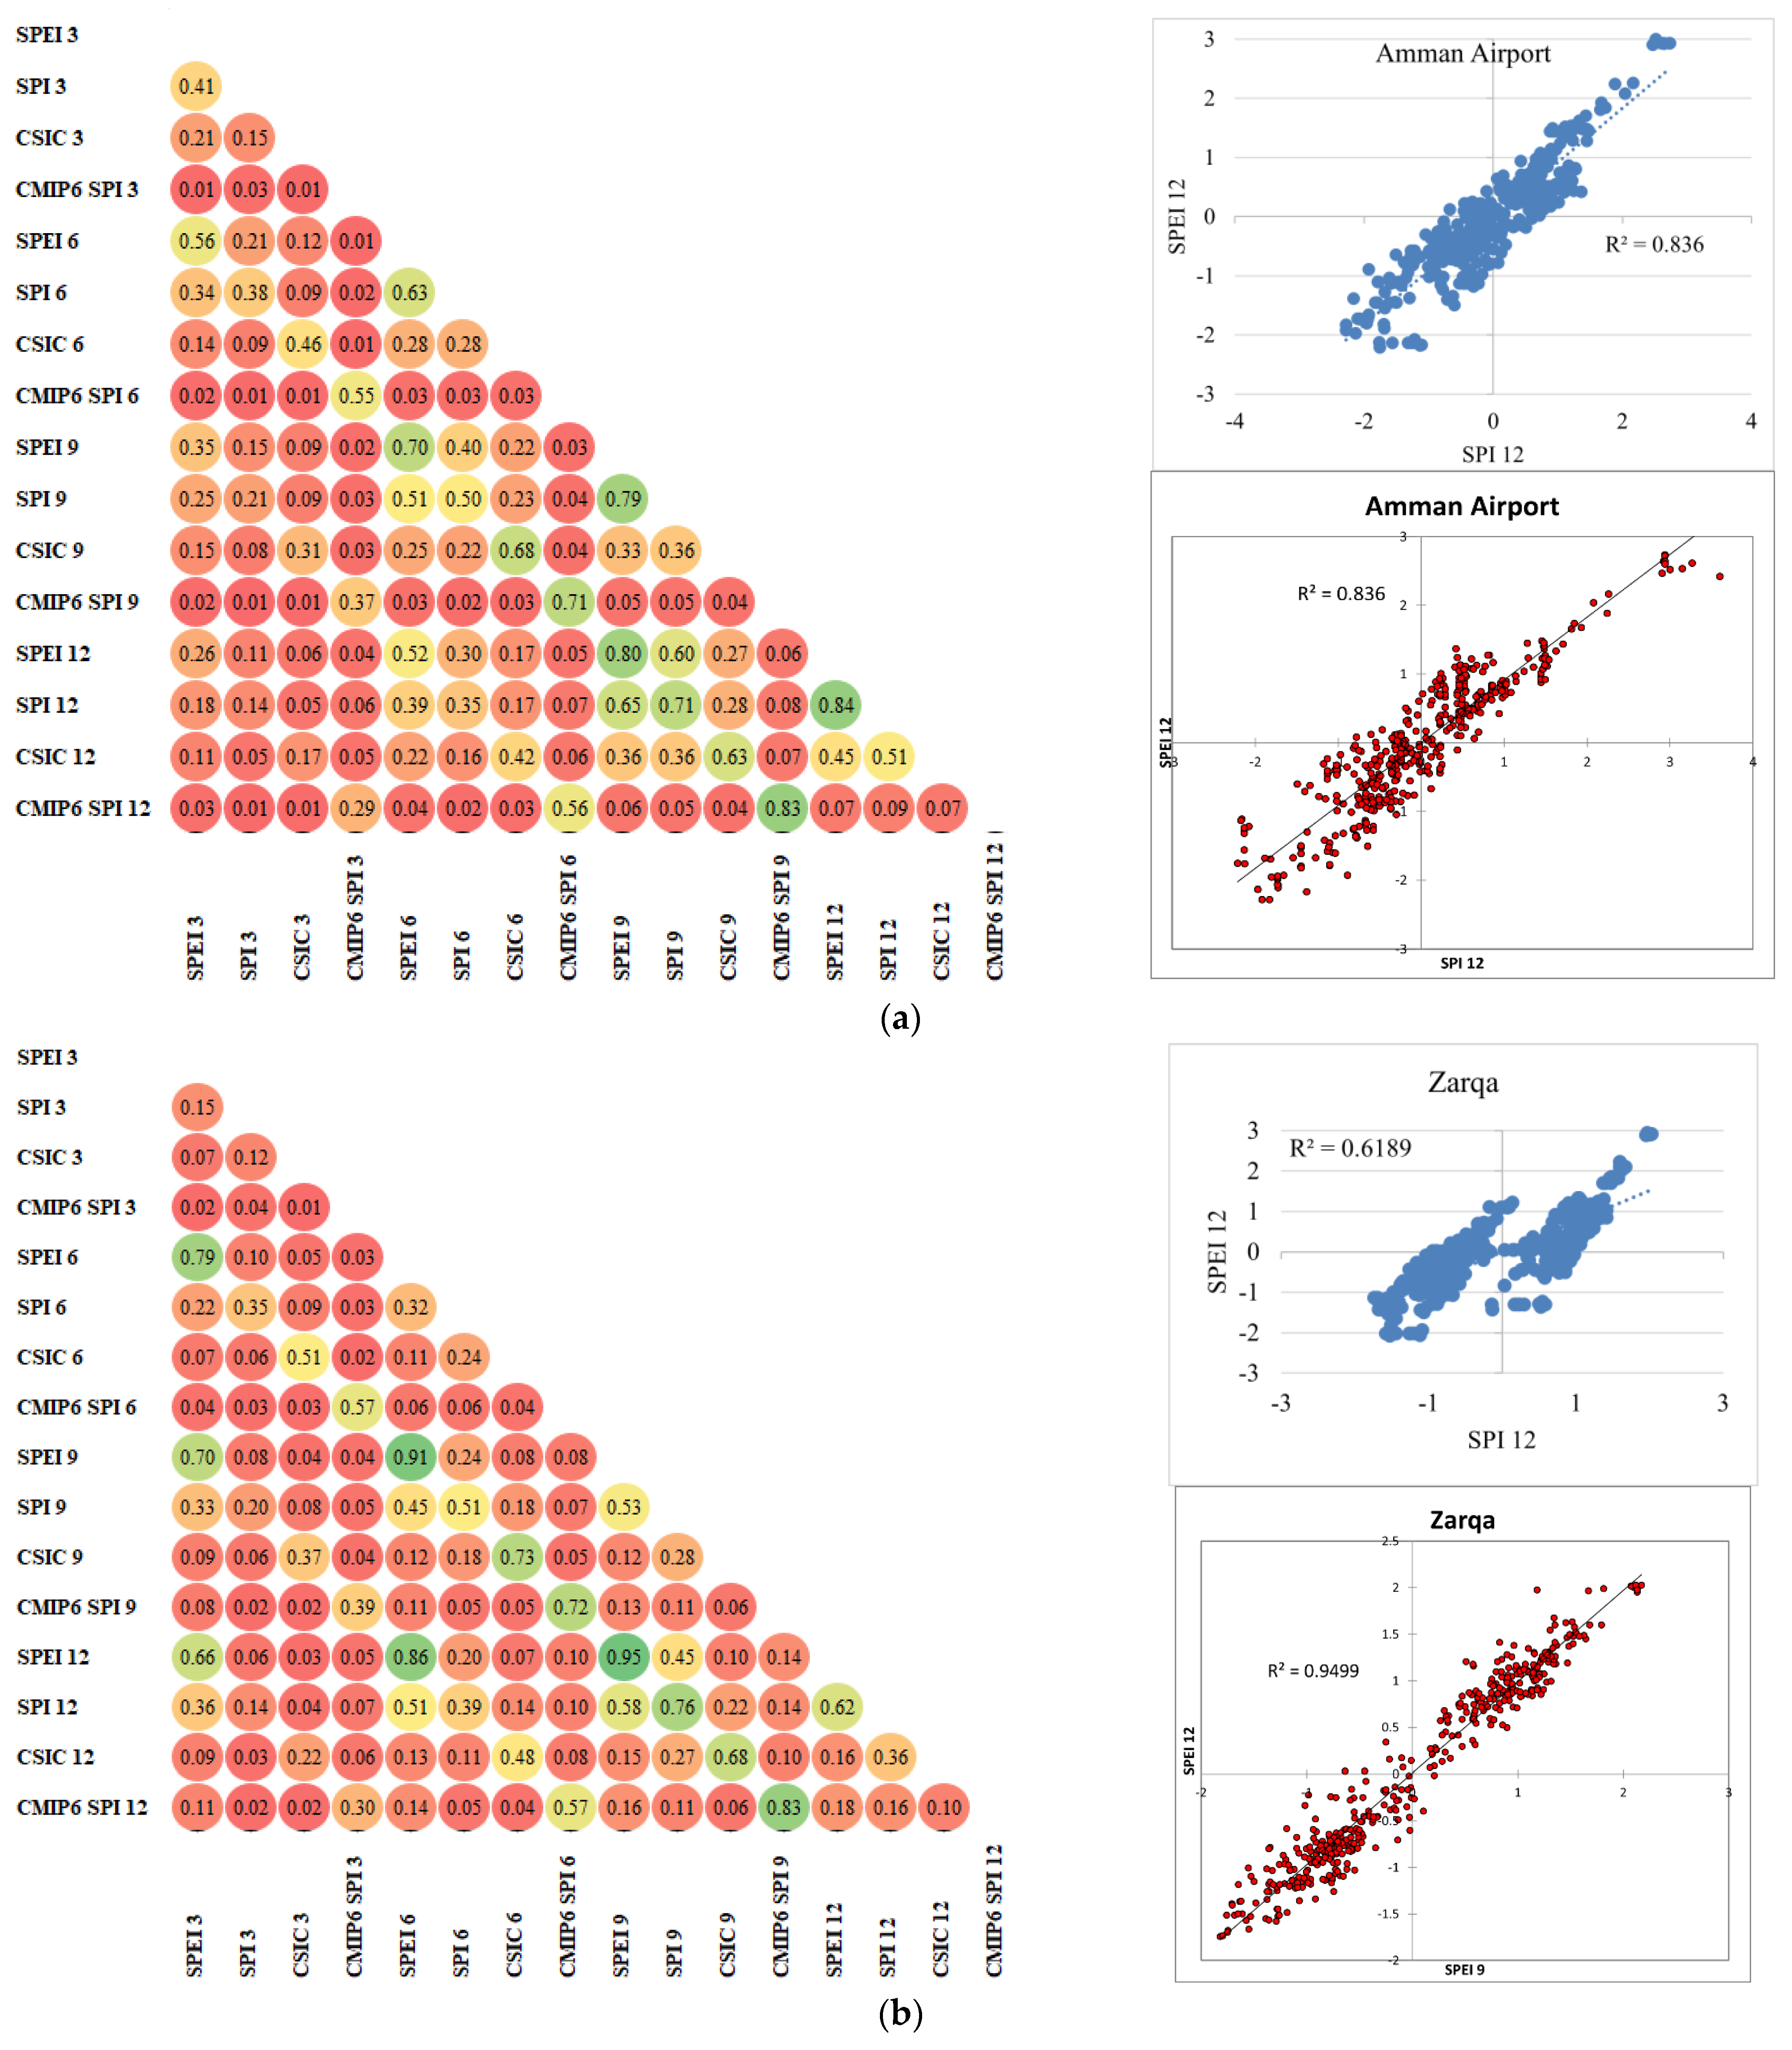
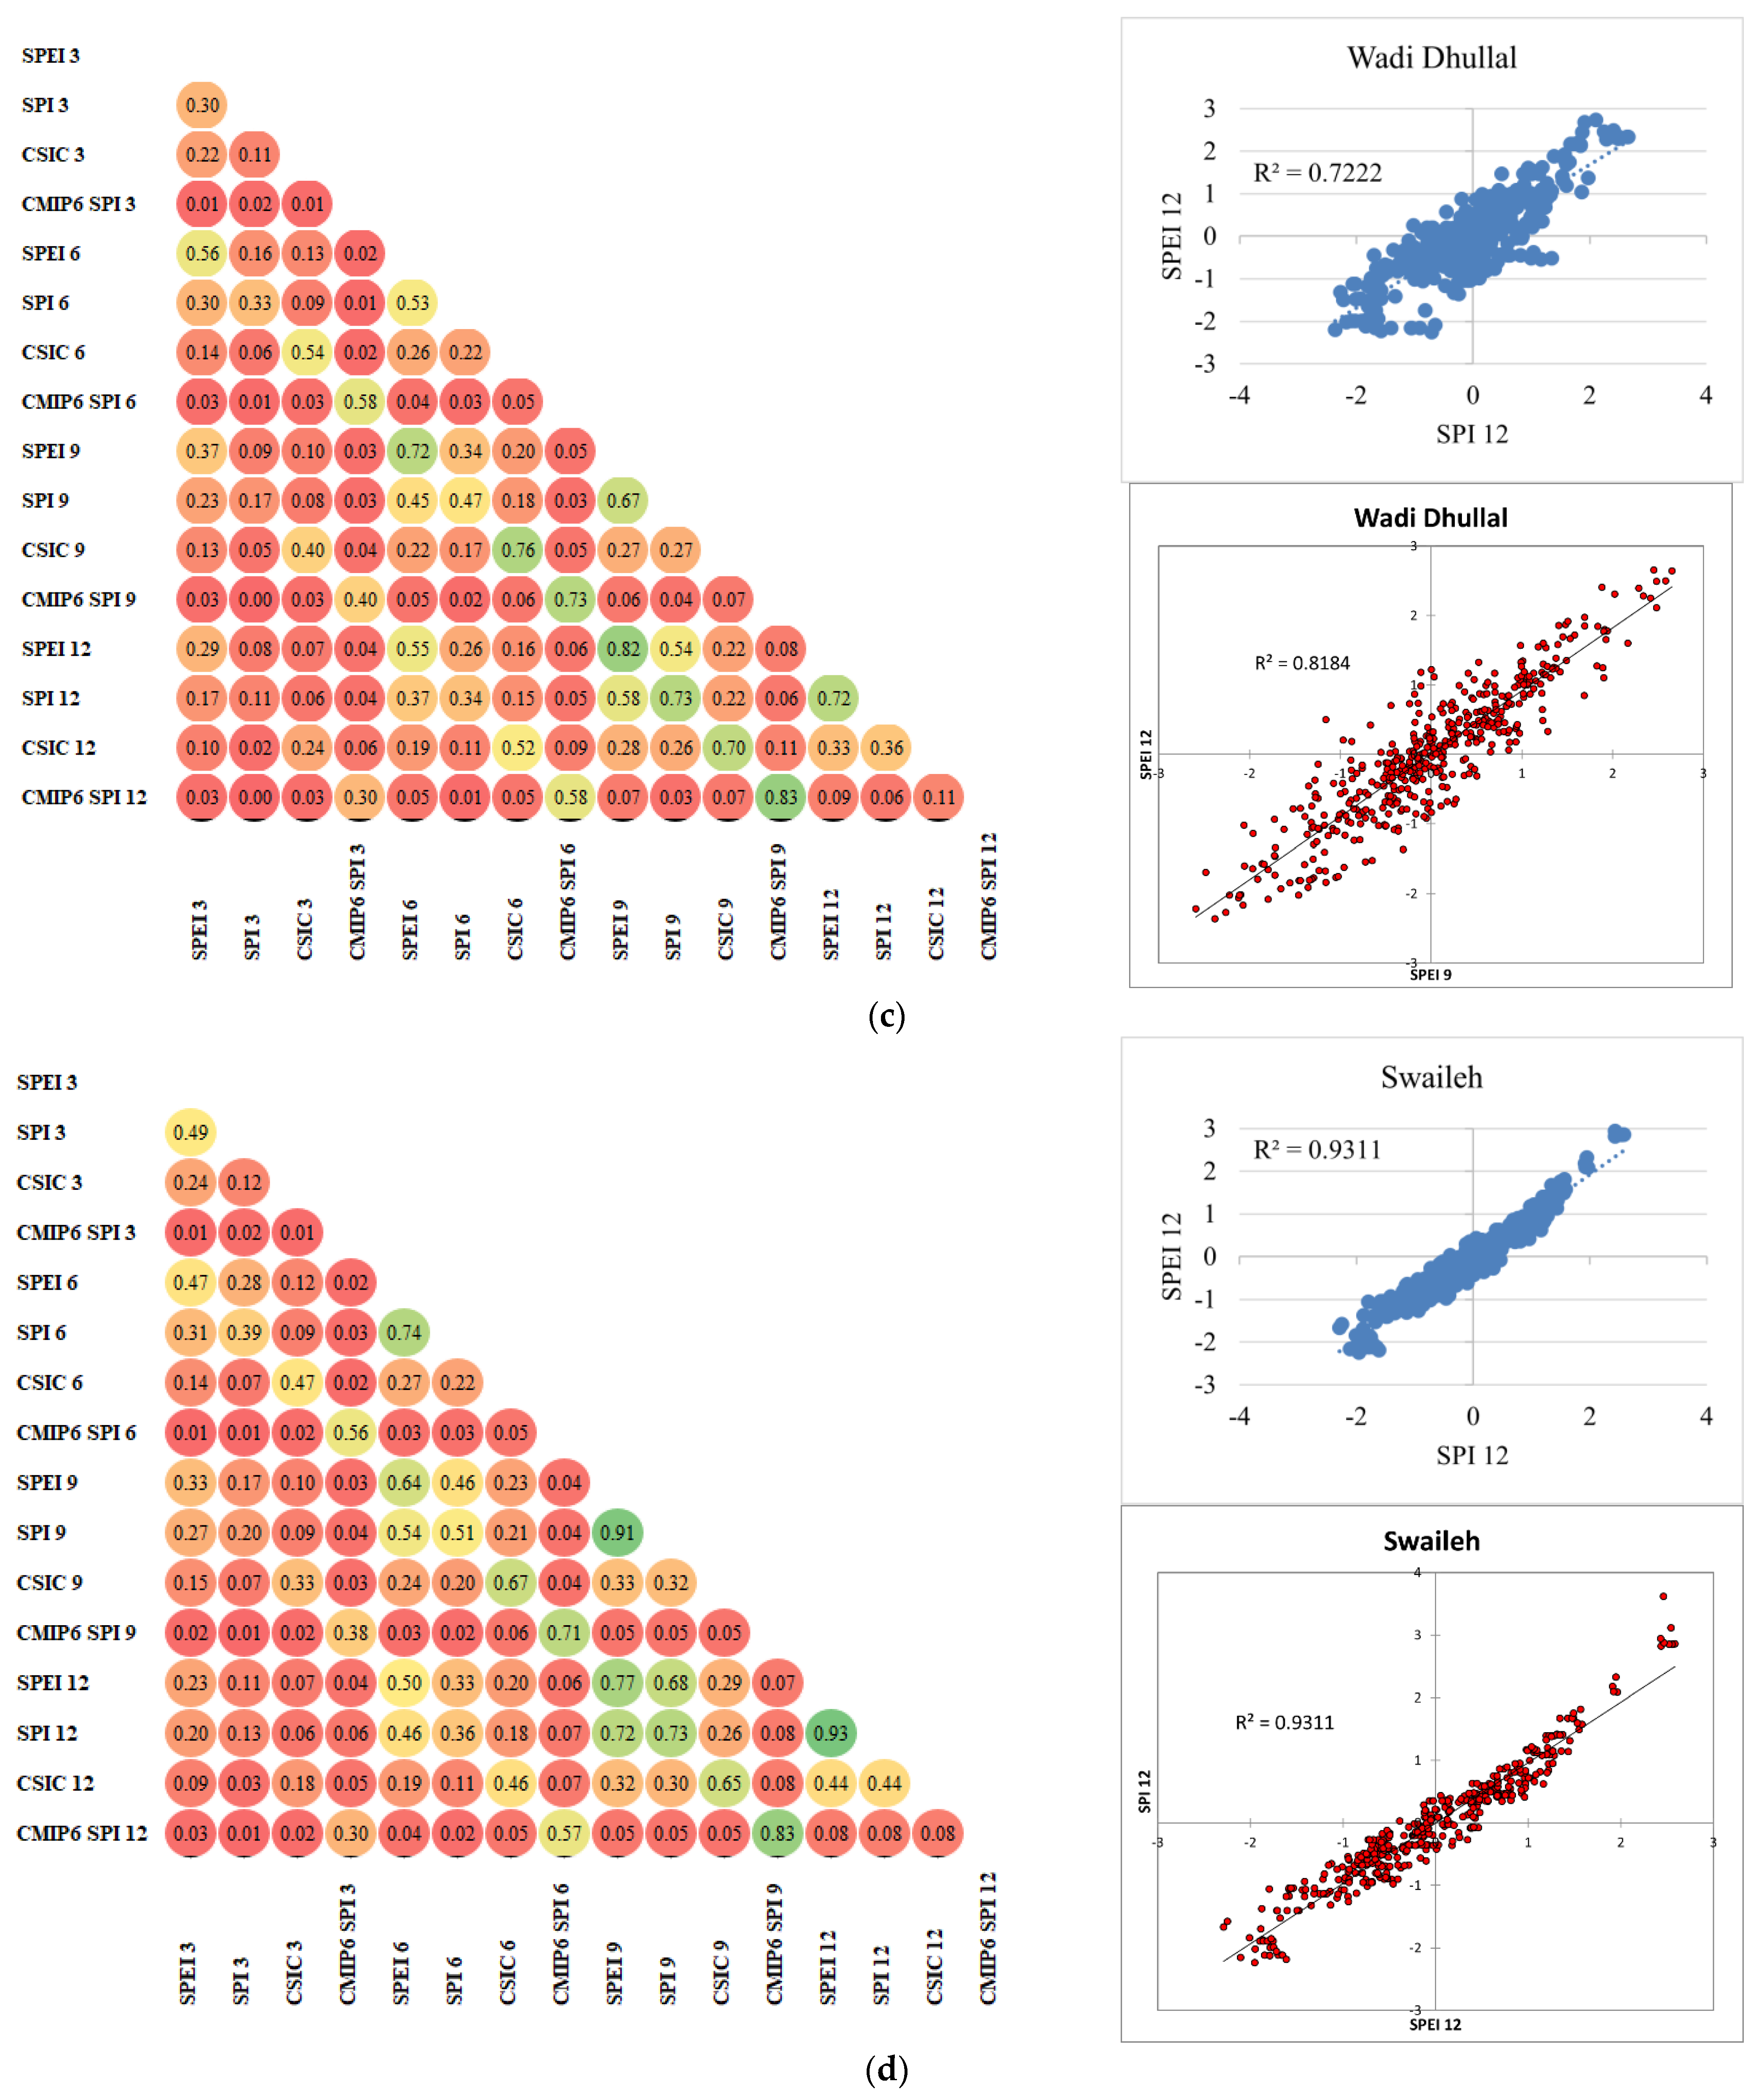
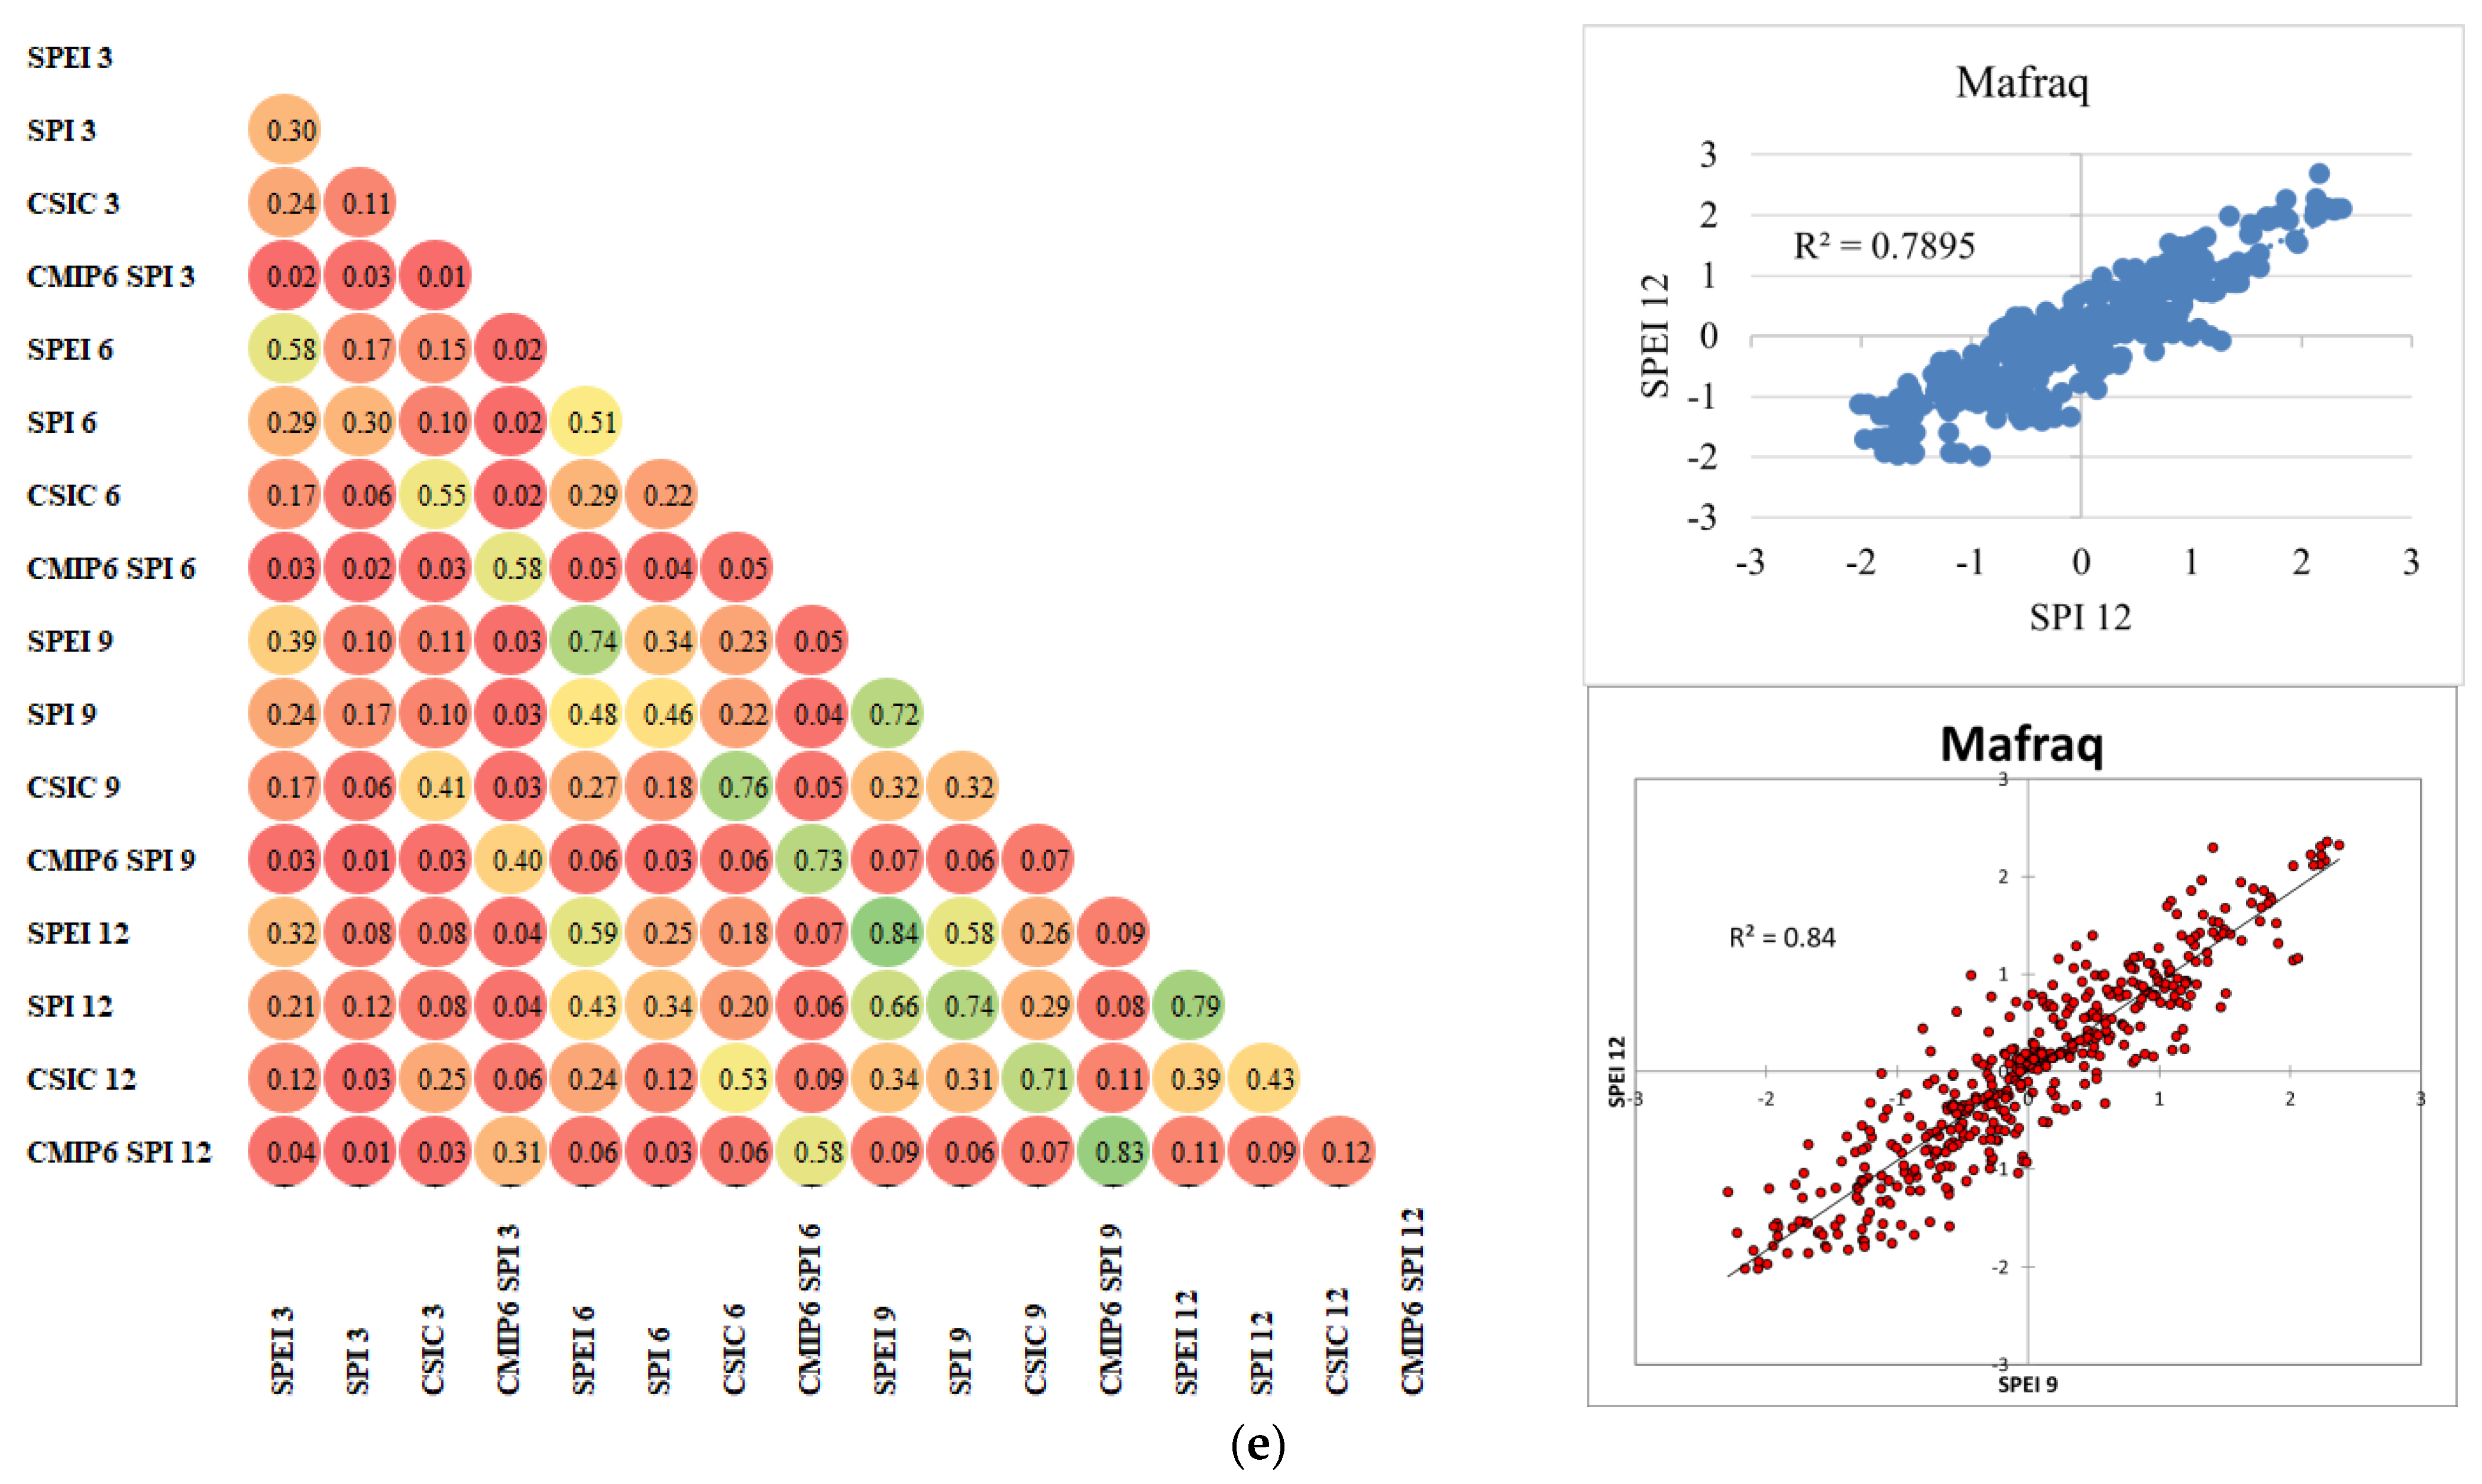
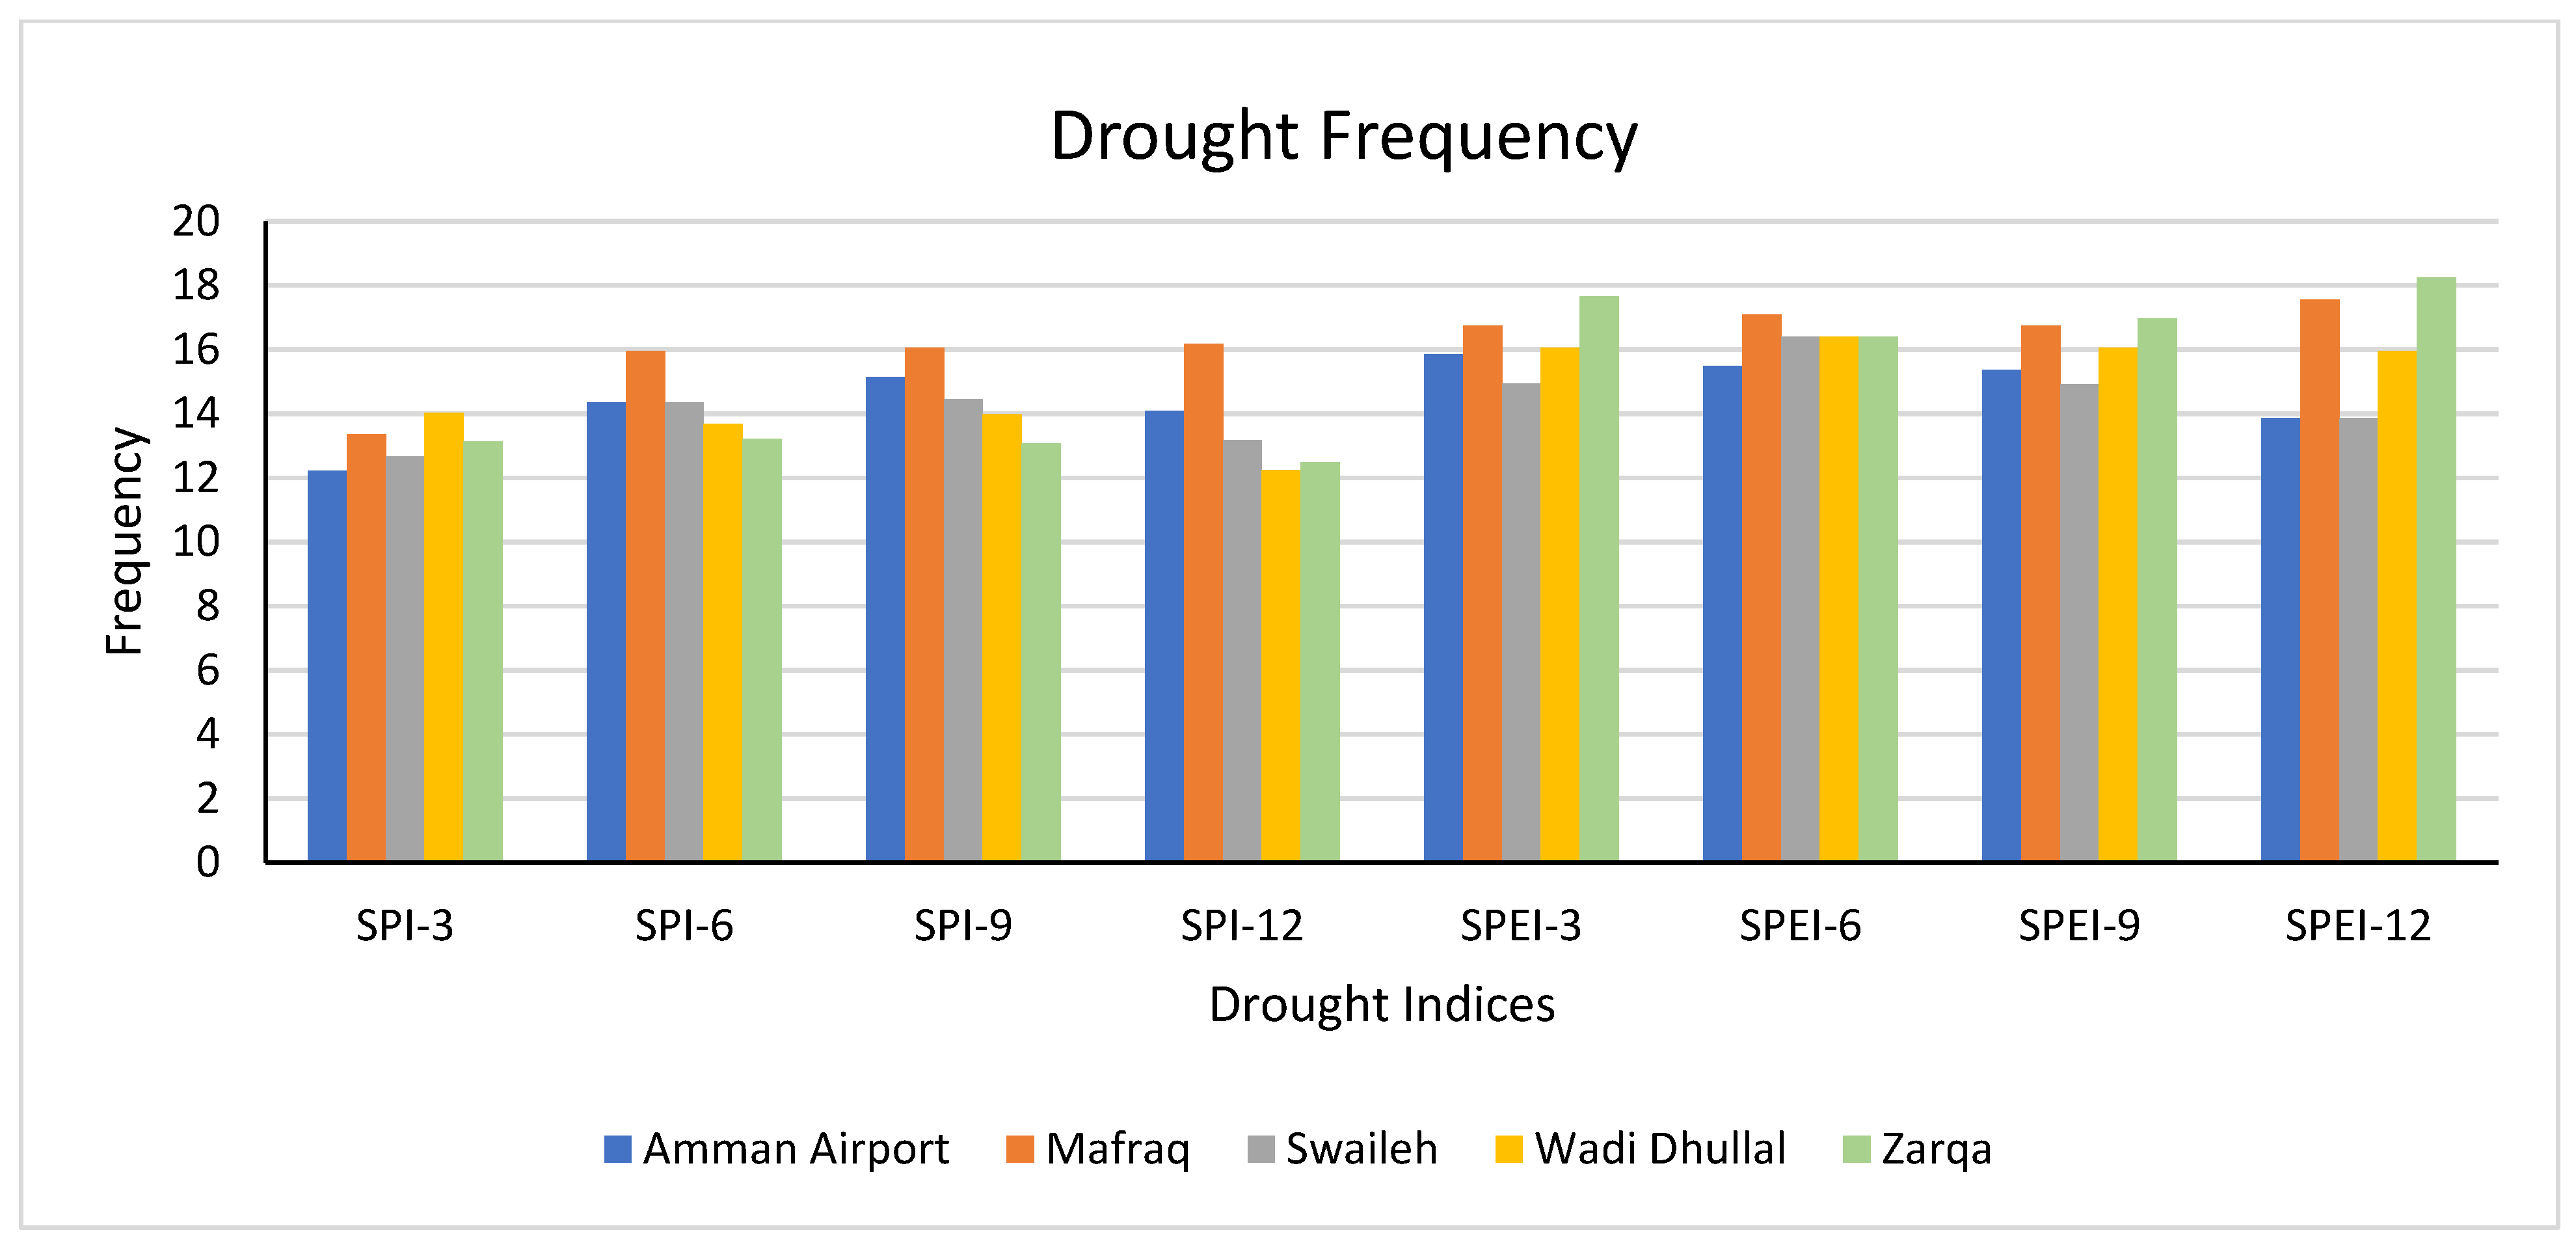
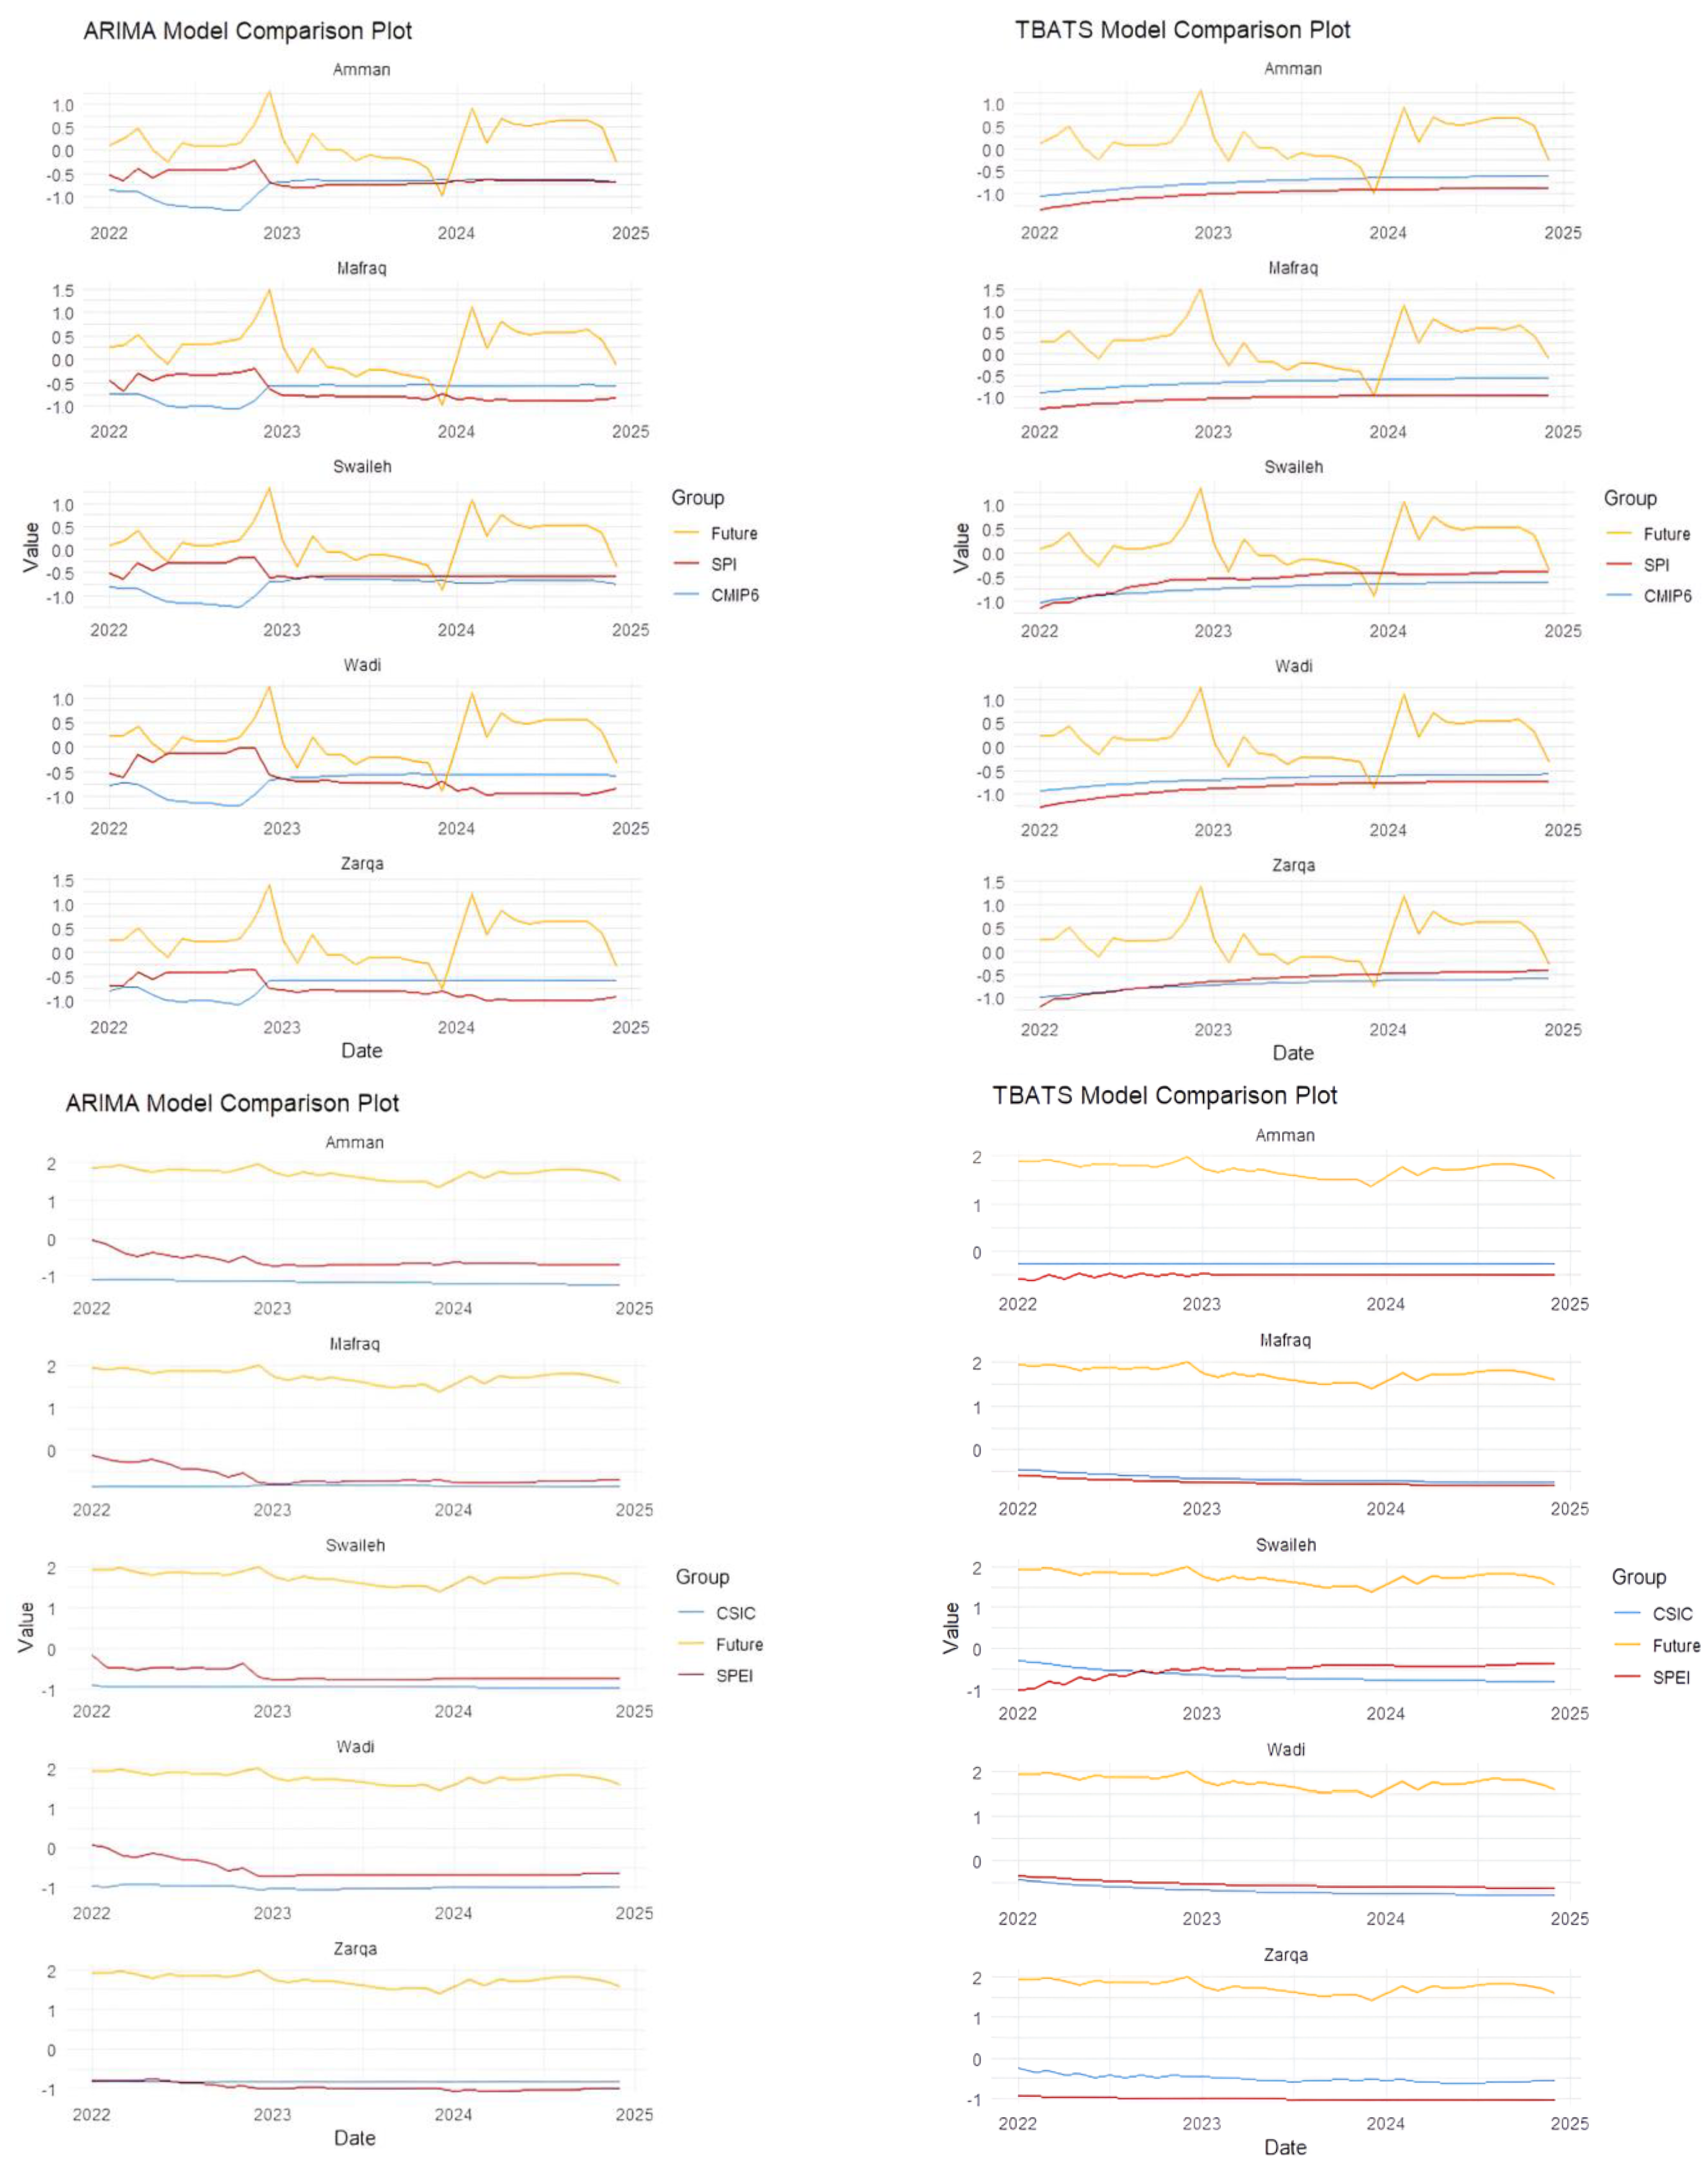
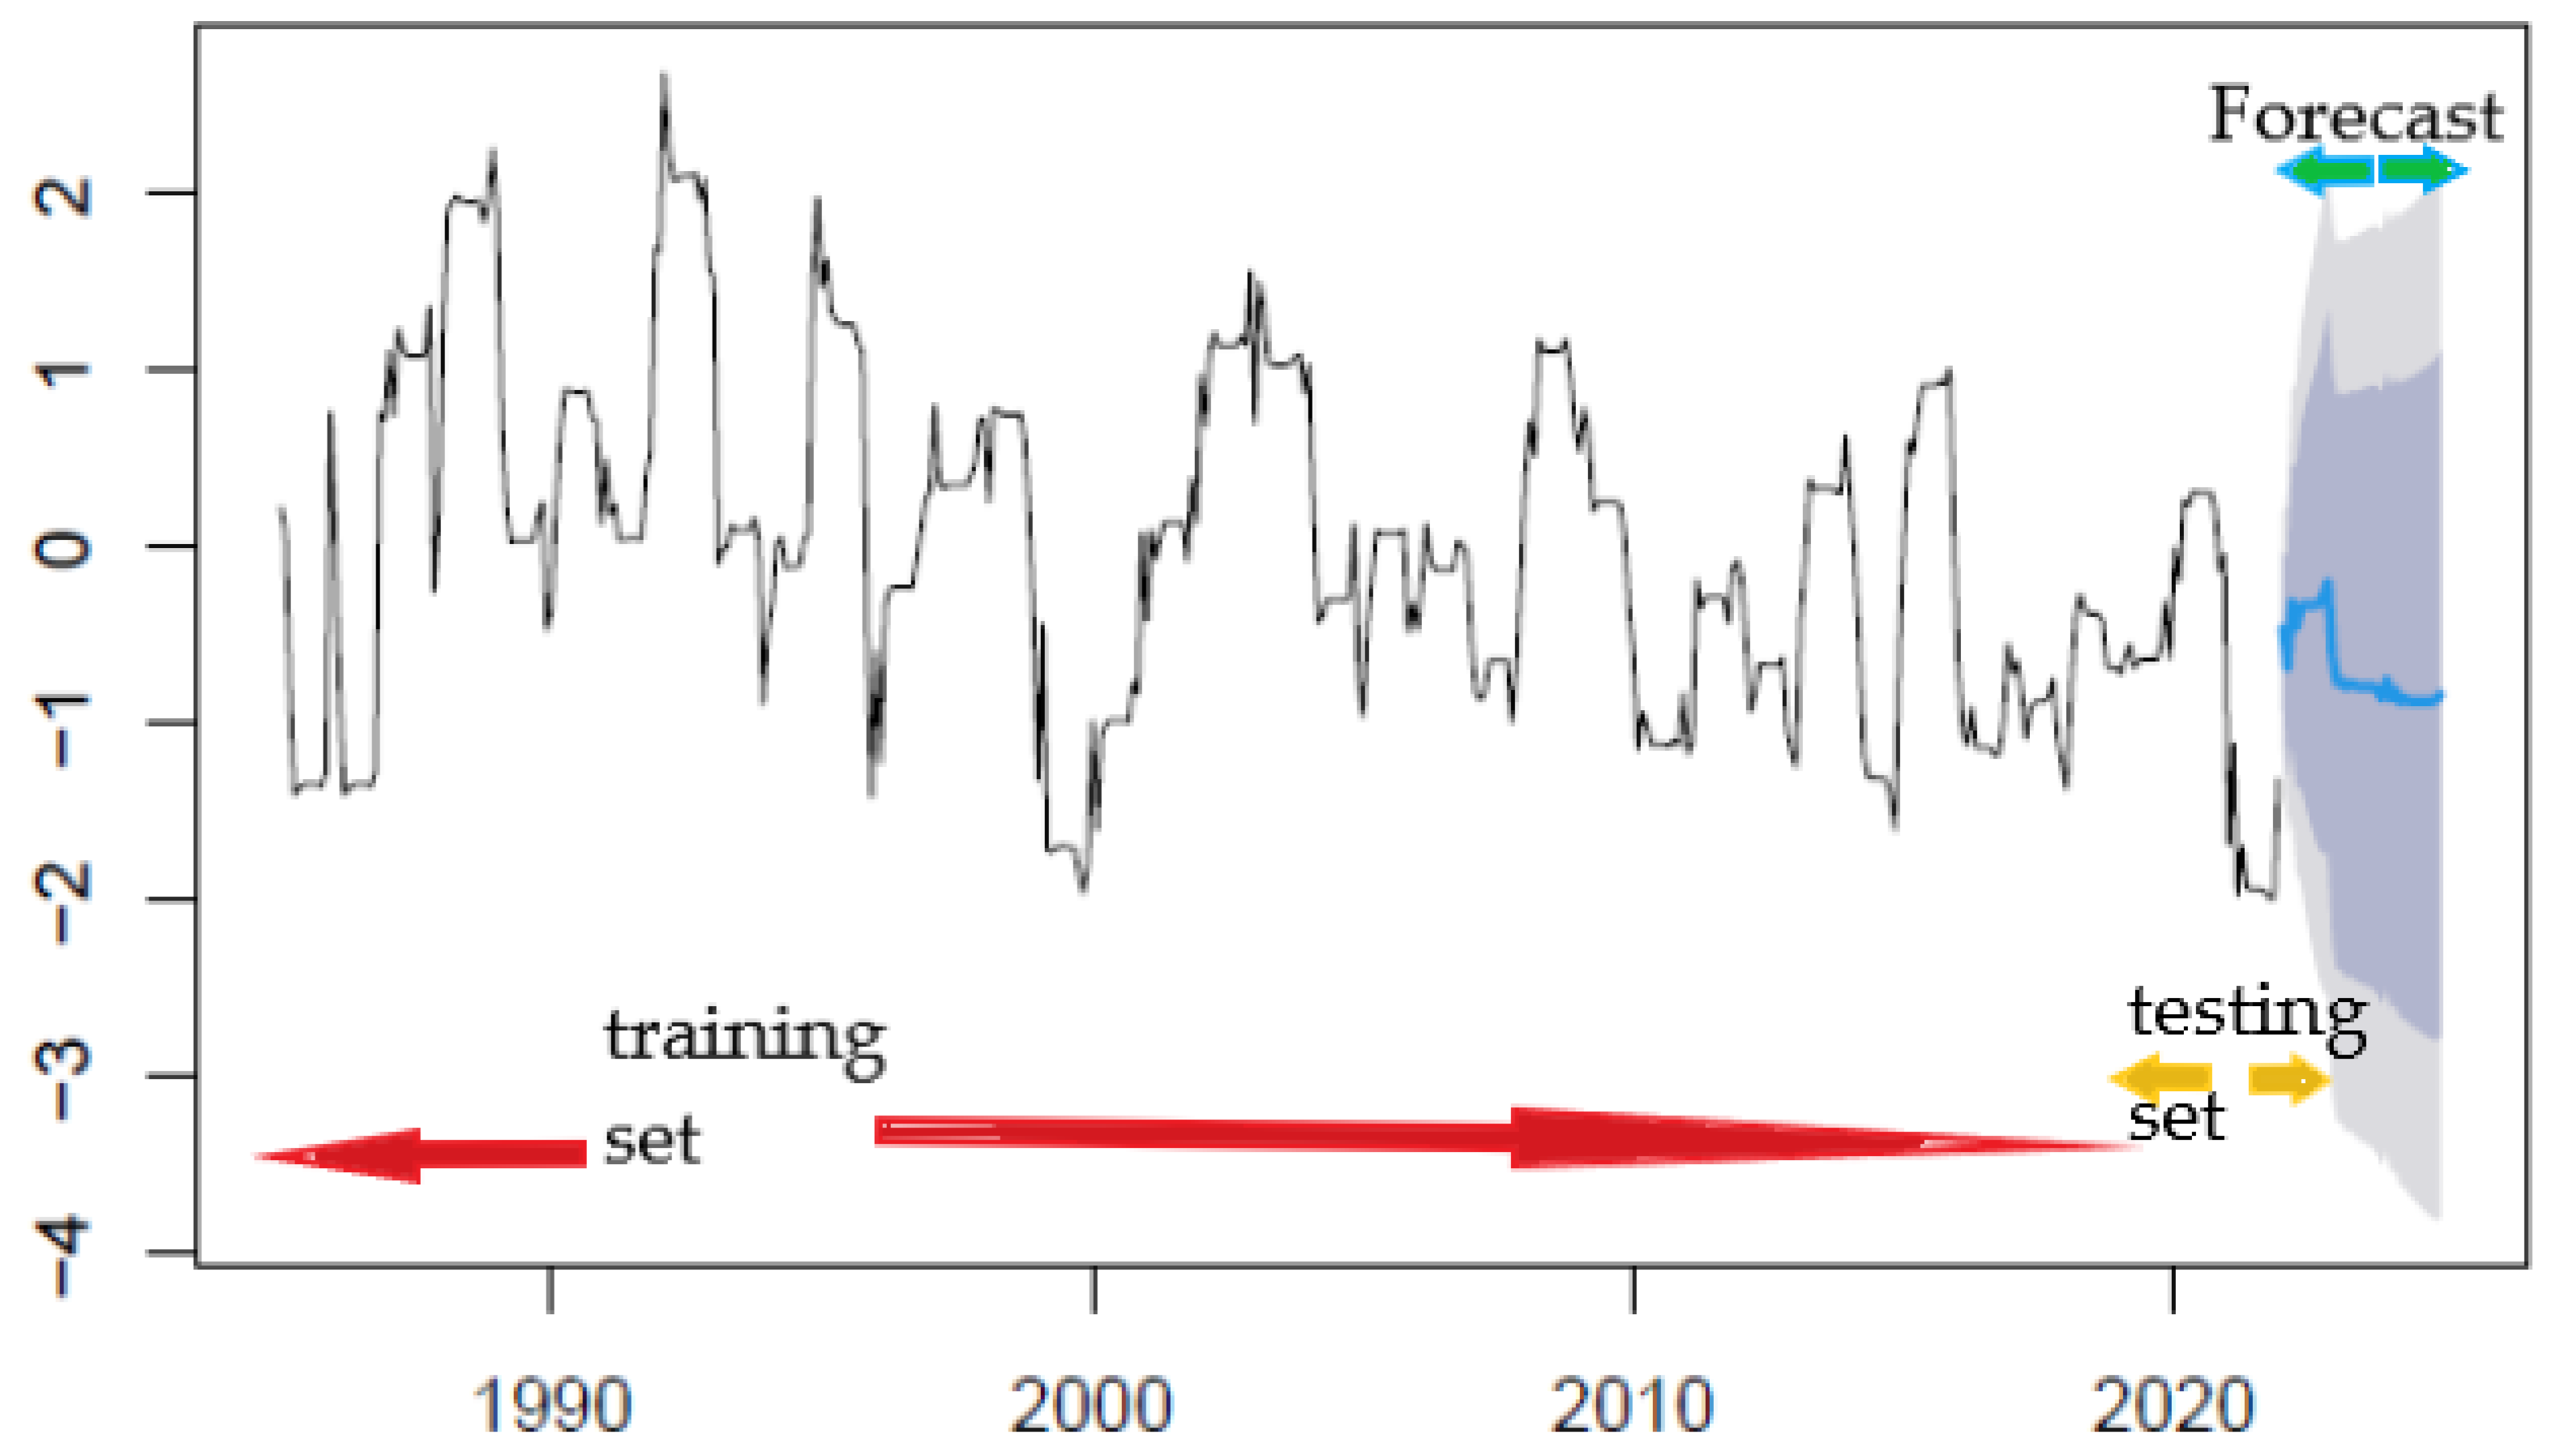
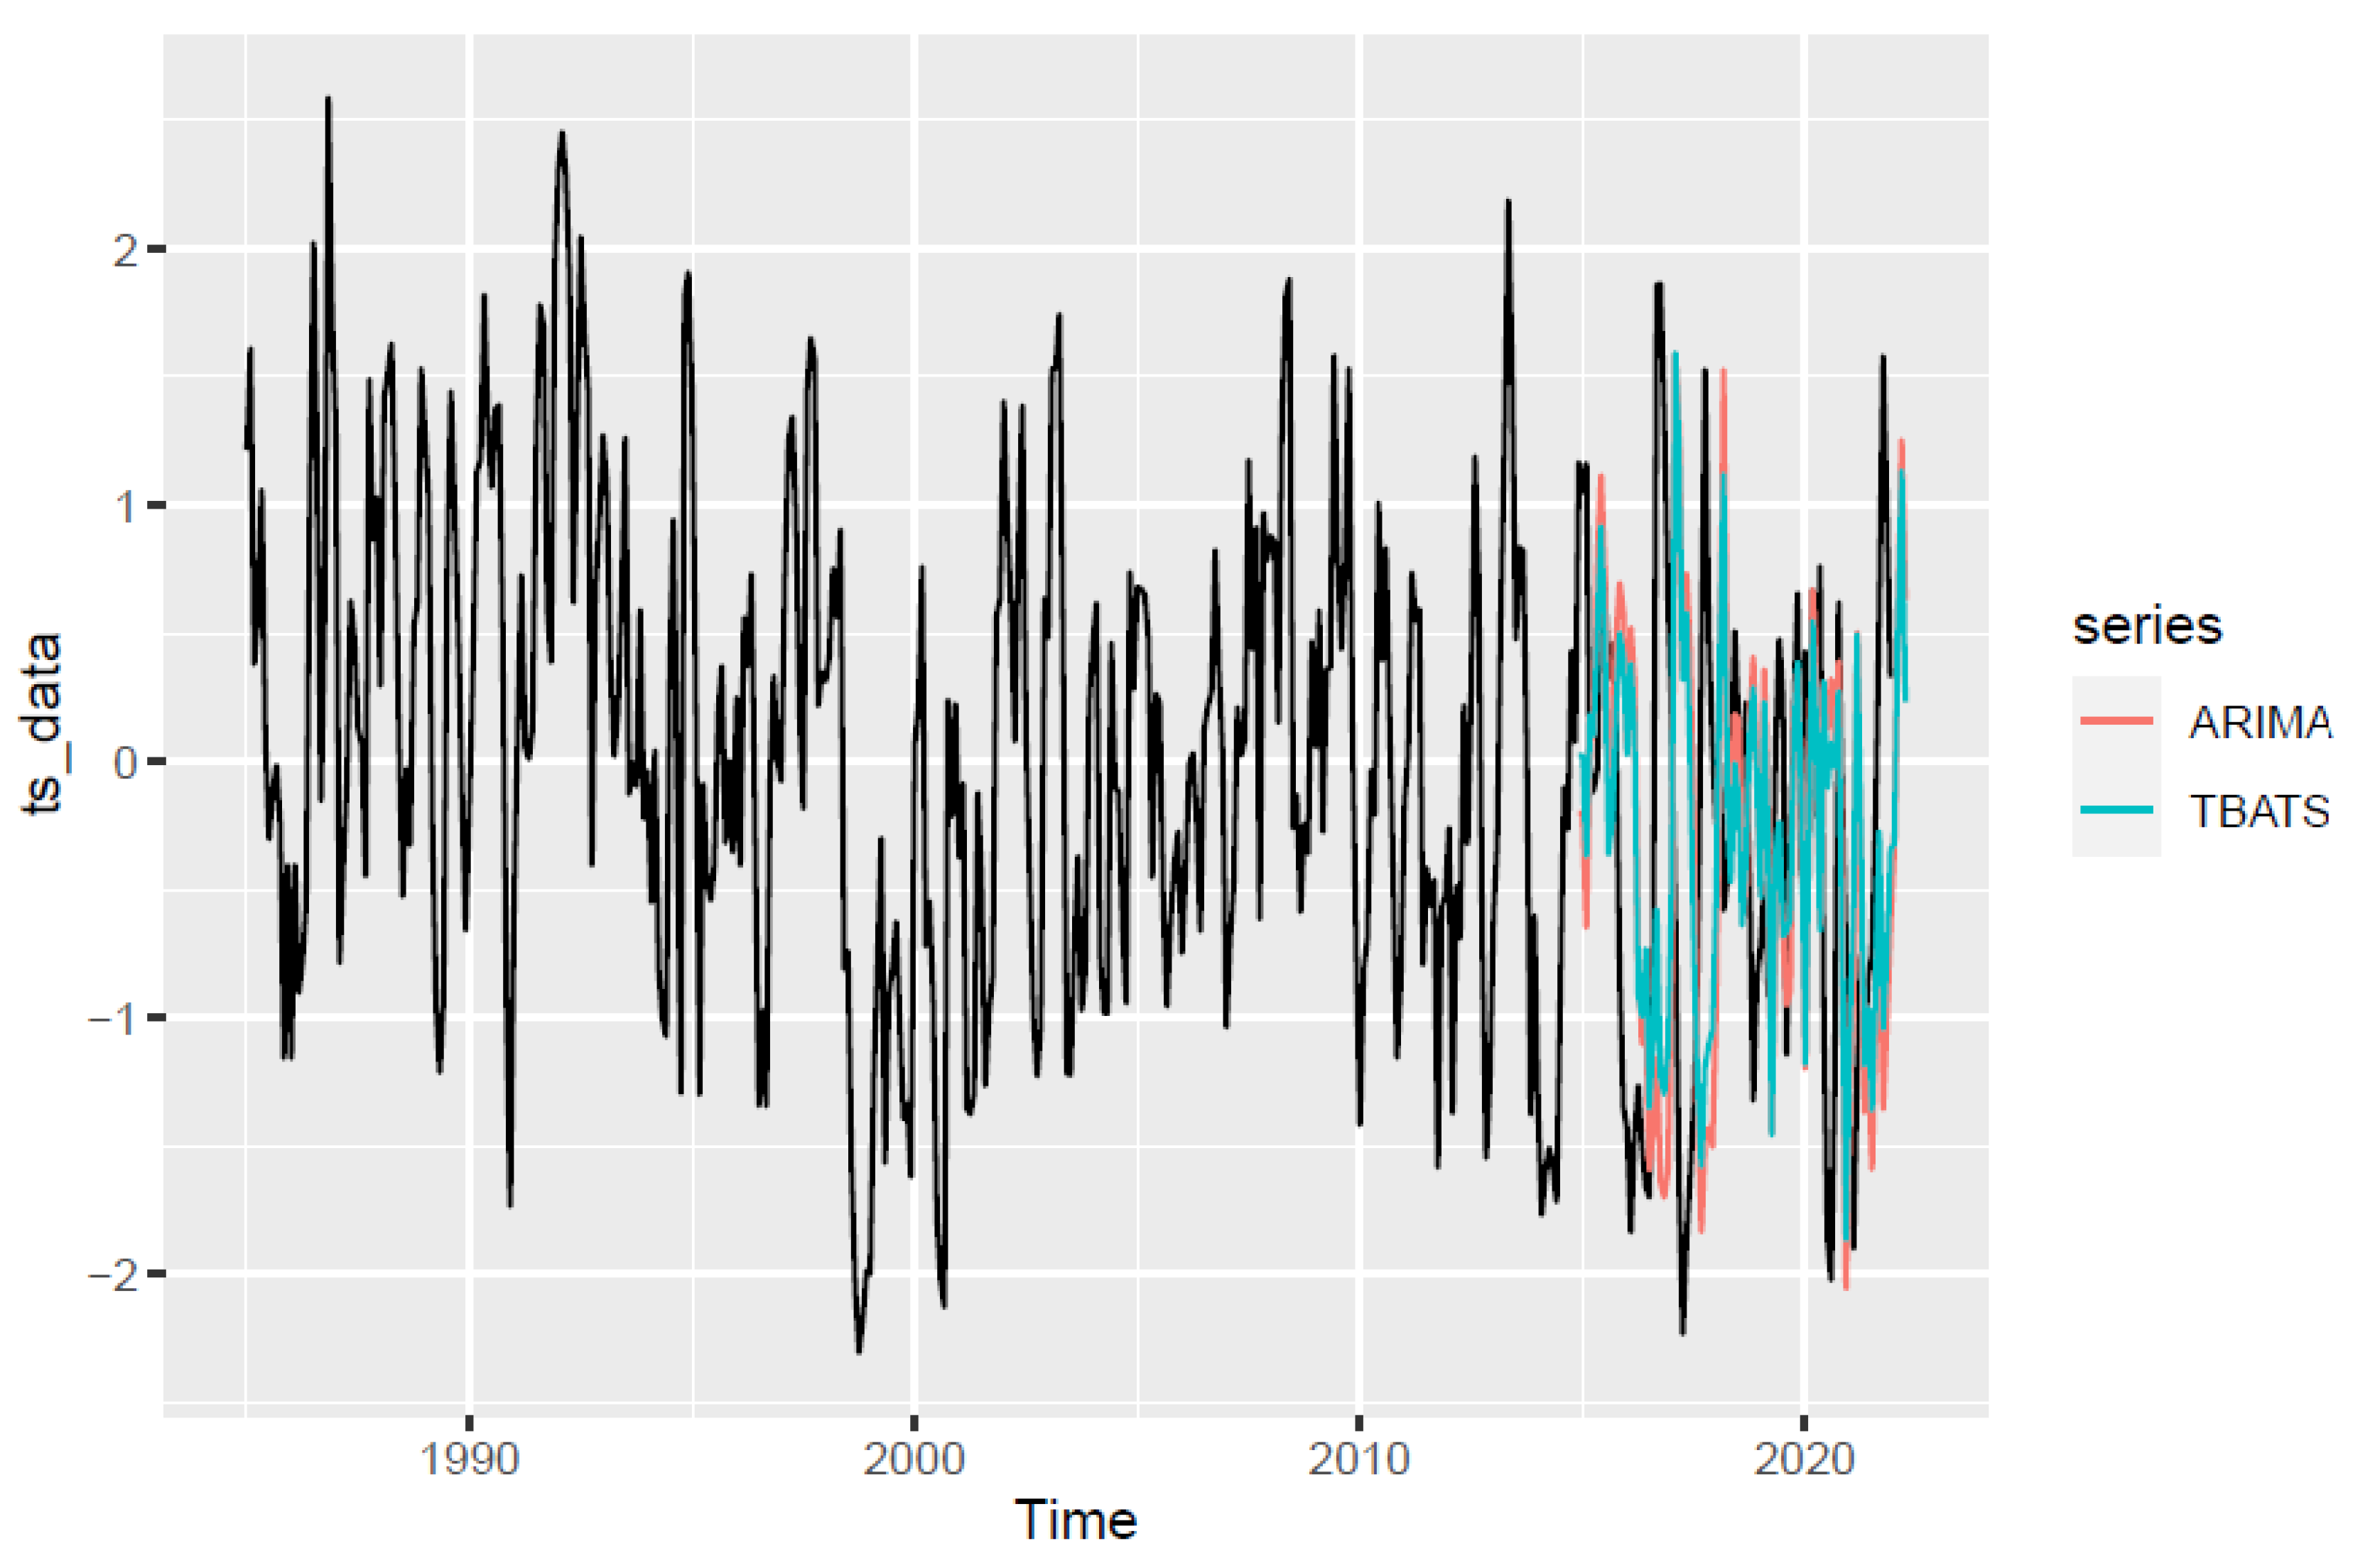
Table 1.
Basic statistics of mean daily minimum, mean maximum, mean, standard deviation (SD), temperature, and precipitation during 1985–2021.
Table 1.
Basic statistics of mean daily minimum, mean maximum, mean, standard deviation (SD), temperature, and precipitation during 1985–2021.
| Station Name | Station ID | Stations | Minimum Temperature (°C) | Maximum Temperature (°C) | Average Temperature (°C) | Precipitation (mm/day) | |||||||||||||
|---|---|---|---|---|---|---|---|---|---|---|---|---|---|---|---|---|---|---|---|
| Long. (°E) | Lat. (°N) | Min | Max | Mean | SD | Min | Max | Mean | SD | Min | Max | Mean | SD | Min | Max | Mean | SD | ||
| Amman Airport | AD0019 | 36.2352 | 32.3219 | −5.3 | 29.2 | 12.4 | 6.47 | 1.8 | 43.50 | 23.73 | 8.35 | 16.14 | 19.00 | 18.02 | 0.57 | 0.0 | 52.60 | 0.64 | 2.88 |
| Mafraq | AL0015 | 36.0883 | 32.0641 | −7.2 | 26 | 9.93 | 5.94 | 1.4 | 43.5 | 24.51 | 8.42 | 15.43 | 18.19 | 17.67 | 0.57 | 0.0 | 40.2 | 0.4 | 1.79 |
| Swaileh | AL0017 | 35.8392 | 32.0223 | −6.6 | 30.8 | 11.71 | 6.45 | −0.5 | 39.50 | 20.45 | 8.34 | 14.19 | 17.13 | 16.11 | 0.61 | 0.0 | 100.5 | 1.26 | 5.27 |
| Wadi Dhullal | AL0019 | 35.987 | 31.9746 | −8.1 | 25.7 | 10.41 | 6.30 | 1.7 | 45.50 | 26.13 | 8.83 | 16.46 | 19.28 | 18.23 | 0.53 | 0.0 | 39.10 | 0.35 | 1.63 |
| Zarqa | AL0055 | 36.28 | 32.1547 | −3.68 | 31.59 | 11.55 | 6.75 | 1.22 | 44.78 | 24.52 | 9.24 | 15.42 | 20.28 | 17.99 | 1.67 | 0.0 | 49.04 | 0.54 | 2.37 |
Table 2.
Drought severity based on SPI And SPEI values.
| SPI AND SPEI VALUE | DROUGHT CATEGORIES |
|---|---|
| >2 | Extremely Wet |
| 1.50–1.99 | Severely Wet |
| 1.00–1.49 | Moderately Wet |
| −0.99–0.99 | Nearly Normal |
| −1.49–−1.0 | Moderate Drought |
| −1.99–−1.5 | Severe Drought |
| <−2 | Extreme Drought |
Table 3.
MKT test results of SPI for the meteorological stations located in Amman–Zarqa Basin.
| Met-Station | SPI 3 | SPI 6 | SPI 9 | SPI 12 | ||||
|---|---|---|---|---|---|---|---|---|
| Kendall’s Tau | p-Value | Kendall’s Tau | p-Value | Kendall’s Tau | p-Value | Kendall’s Tau | p-Value | |
| Amman Airport | −0.0115 | 0.7197 | −0.0751 | 0.0188 | −0.1679 | <0.0001 | −0.2167 | <0.0001 |
| Mafraq | −0.0474 | 0.1375 | −0.1501 | <0.0001 | −0.2494 | <0.0001 | −0.3017 | <0.0001 |
| Swaileh | −0.0044 | 0.8915 | −0.0542 | 0.0896 | −0.1247 | 0.0001 | −0.1678 | <0.0001 |
| Wadi Dhullal | −0.0407 | 0.2027 | −0.1316 | <0.0001 | −0.2288 | <0.0001 | −0.2793 | <0.0001 |
| Zarqa | −0.1141 | 0.0004 | −0.2182 | <0.0001 | −0.3378 | <0.0001 | −0.4032 | <0.0001 |
Table 4.
MKT test results of SPEI for the meteorological stations located in Amman–Zarqa Basin.
| Met-Station | SPEI 3 | SPEI 6 | SPEI 9 | SPEI 12 | ||||
|---|---|---|---|---|---|---|---|---|
| Kendall’s Tau | p-Value | Kendall’s Tau | p-Value | Kendall’s Tau | p-Value | Kendall’s Tau | p-Value | |
| Amman Airport | −0.1657 | <0.0001 | −0.2401 | <0.0001 | −0.2938 | <0.0001 | −0.3453 | <0.0001 |
| Mafraq | −0.2518 | <0.0001 | −0.3379 | <0.0001 | −0.4079 | <0.0001 | −0.4575 | <0.0001 |
| Swaileh | −0.1477 | <0.0001 | −0.1798 | <0.0001 | −0.2231 | <0.0001 | −0.2613 | <0.0001 |
| Wadi Dhullal | −0.2065 | <0.0001 | −0.2966 | <0.0001 | −0.3733 | <0.0001 | −0.4300 | <0.0001 |
| Zarqa | −0.5111 | <0.0001 | −0.5848 | <0.0001 | −0.6170 | <0.0001 | −0.6480 | <0.0001 |
Table 5.
Drought characteristics for basin stations under SPI scales include drought percentage, drought duration, severity, intensity, and probability of occurrences.
Table 5.
Drought characteristics for basin stations under SPI scales include drought percentage, drought duration, severity, intensity, and probability of occurrences.
| Station | SPI | Total Months | No of Drought Months | Drought Percentage (%) | Longest Drought Duration | Longest Drought Duration (Months) | Drought Severity | Drought Intensity | Probability of Occurrence (%) | ||
|---|---|---|---|---|---|---|---|---|---|---|---|
| Moderate | Severe | Extreme | |||||||||
| Amman-Airport | SPI 3 | 442 | 54 | 12.22 | October 2020 to May 2021 | 8 | −12.16 | −1.52 (Severe) | 38.9 | 48.2 | 13 |
| SPI 6 | 440 | 64 | 14.6 | September 1998 to May 1999 | 9 | −14.60 | −1.62 (Severe) | 53.1 | 25 | 21.9 | |
| SPI 9 | 437 | 67 | 15.3 | January 2014 to October 2014 and January 2021 to November 2021 | 11 | −20.63 | −1.87 (Severe) | 62.7 | 22.4 | 14.9 | |
| SPI 12 | 434 | 62 | 14.3 | January 1999 to February 2000 and January 2021 to December 2021 | 12 | −23.44 | −2.0 (Extreme) | 59.7 | 24.2 | 16.2 | |
| Mafraq | SPI 3 | 442 | 59 | 13.3 | October 2020 to March 2021 | 6 | −10.62 | −1.77 (Severe) | 44.1 | 23.7 | 32.2 |
| SPI 6 | 440 | 71 | 16.1 | November 2020 to July 2021 and February 2014 to July 2014 | 9 | −15.03 | −1.67 (Severe) | 57.8 | 25.4 | 19.7 | |
| SPI 9 | 437 | 71 | 16.3 | December 2020 to November 2021 and February 2014 to November 2014 | 12 | −20.13 | −1.68 (Severe) | 73.2 | 22.5 | 7.04 | |
| SPI 12 | 434 | 71 | 16.4 | December 2020 to November 2021 and February 2010 to November 2010 | 12 | −21.37 | −1.78 (Severe) | 69.01 | 32.4 | 0 | |
| Swaileh | SPI 3 | 442 | 56 | 12.7 | October 2020 to March 2021 and March 2004 to July 2004 | 6 | −11.32 | −1.89 (Severe) | 44.6 | 26.8 | 28.6 |
| SPI 6 | 439 | 63 | 14.4 | September 1998 to August 1999 and November 2020 to August 2021 | 10 | −18.31 −16.85 | −1.83 (Severe) −1.69 | 55.6 | 31.7 | 12.7 | |
| SPI 9 | 436 | 63 | 14.5 | December 1998 to December 1999 | 13 | −23.80 | −1.83 (Severe) | 63.5 | 23.8 | 12.7 | |
| SPI 12 | 434 | 57 | 13.1 | January 1999 to February 2000 | 14 | −24.64 | −1.76 (Severe) | 57.9 | 21.1 | 21.1 | |
| Wadi Dhullal | SPI 3 | 442 | 62 | 14.0 | October 2020 to March 2021 | 6 | −10.64 | −1.77 (Severe) | 32.3 | 27.4 | 41.9 |
| SPI 6 | 439 | 59 | 13.4 | October 1998 to August 1999 | 10 | −20.32 | −2.03 (Extreme) | 40.7 | 40.7 | 20.3 | |
| SPI 9 | 436 | 61 | 14.0 | January 1999 to December 1999 and January 2021 to November 2021 | 12 | −22.58 | −1.88 (Severe) | 55.7 | 27.9 | 16.4 | |
| SPI 12 | 433 | 53 | 12.2 | January 1999 to December 1999 and January 2021 to December 2021 | 12 | −23.14 −23.57 | −1.93 (Severe) −1.96 | 54.7 | 18.9 | 26.4 | |
| Zarqa | SPI 3 | 442 | 58 | 13.1 | October 2020 to May 2021 | 8 | −13.41 | −1.68 (Severe) | 48.3 | 32.8 | 19.0 |
| SPI 6 | 439 | 58 | 13.2 | November 2020 to August 2021 | 10 | −16.73 | −1.67 (Severe) | 55.2 | 34.5 | 10.3 | |
| SPI 9 | 436 | 57 | 13.1 | December 2020 to November 2021 and January 2014 to October 2014 | 12 | −21.12 | −1.76 (Severe) | 64.9 | 24.6 | 10.5 | |
| SPI 12 | 434 | 54 | 12.4 | January 2021 to December 2021 and March 1999 to December 1999 | 12 | −22.02 | −1.84 (Severe) | 75.9 | 11.1 | 13.0 | |
Table 6.
Forecast accuracy metrics for the TBATS and ARIMA, including the autocorrelation coefficient (ACF) to SPI and SPEI among the 5 stations in the basin.
Table 6.
Forecast accuracy metrics for the TBATS and ARIMA, including the autocorrelation coefficient (ACF) to SPI and SPEI among the 5 stations in the basin.
| Forecast Model | Performance Metrics | Amman Airport | Mafraq | Sweileh | Wadi Dhullal | Zarqa | |||||||||||||||
|---|---|---|---|---|---|---|---|---|---|---|---|---|---|---|---|---|---|---|---|---|---|
| SPI | SPEI | SPI | SPEI | SPI | SPEI | SPI | SPEI | SPI | SPEI | ||||||||||||
| Obs. SPI | CMIP6 | Obs. SPEI | CSIC | Obs. SPI | CMIP6 | Obs. SPEI | CSIC | Obs. SPI | CMIP6 | Obs. SPEI | CSIC | Obs. SPI | CMIP6 | Obs. SPEI | CSIC | Obs. SPI | CMIP6 | Obs. SPEI | CSIC | ||
| ARIMA | ME | −0.00812 | 0.000103 | −0.0097 | 0.007619 | −0.00378 | −0.00507 | −0.00515 | −0.00516 | −0.00703 | 0.000546 | −0.00381 | −0.00113 | −0.00613 | −0.0054 | −0.009217 | −0.00288 | −0.00666 | −0.0078 | −0.00731 | −0.006423 |
| RMSE | 0.33797 | 0.2534 | 0.2924 | 0.2843 | 0.3295 | 0.2557 | 0.2649 | 0.2587 | 0.3357 | 0.2546 | 0.3493 | 0.2829 | 0.328 | 0.25 | 0.2718 | 0.2697 | 0.2835 | 0.2532 | 0.1398 | 0.2685 | |
| MAE | 0.19799 | 0.1651 | 0.20085 | 0.1809 | 0.1877 | 0.1676 | 0.1863 | 0.182 | 0.1956 | 0.1659 | 0.213 | 0.1813 | 0.1898 | 0.1674 | 0.1996 | 0.1895 | 0.1643 | 0.1657 | 0.1001 | 0.1811 | |
| MASE | 0.1808 | 0.1684 | 0.2038 | 0.2291 | 0.1787 | 0.1657 | 0.2086 | 0.1996 | 0.17596 | 0.16688 | 0.1961 | 0.2162 | 0.1795 | 0.1661 | 0.2276 | 0.2125 | 0.1877 | 0.1656 | 0.2171 | 0.2115 | |
| ACF | −0.00353 | −0.0195 | −0.00529 | −0.0393 | −0.001855 | −0.01948 | 0.00076 | 0.004896 | −0.00021 | 0.03832 | 0.00227 | 0.2828 | 0.00613 | −0.0189 | 0.0208 | 0.001871 | −0.00031 | −0.0206 | −0.00123 | −0.000809 | |
| TBATS | ME | 0.007987 | −0.02138 | −0.0104 | −0.0709 | 0.006229 | −0.0207 | 1.43 × 10⁻⁶ | −0.0705 | 0.01236 | 0.0212 | 0.00445 | −0.06594 | 0.00529 | −0.0206 | −0.00491 | −0.06782 | 0.0208 | −0.0209 | −0.00568 | −0.06081 |
| RMSE | 0.4062 | 0.3079 | 0.3358 | 1.225 | 0.38052 | 0.315 | 0.3029 | 1.2488 | 0.3821 | 0.3108 | 0.386 | 1.2217 | 0.3915 | 0.3073 | 0.3176 | 1.212 | 0.03196 | 0.308 | 0.1589 | 1.2102 | |
| MAE | 0.2448 | 0.2115 | 0.2312 | 1.0239 | 0.226 | 0.2157 | 0.2127 | 1.0222 | 0.2506 | 0.2126 | 0.2447 | 1.0213 | 0.2398 | 0.2128 | 0.2317 | 0.9963 | 0.1977 | 0.2124 | 0.1138 | 1.0003 | |
| MASE | 0.2235 | 0.2157 | 0.2346 | 1.2965 | 0.21515 | 0.2134 | 0.2381 | 1.121 | 0.2254 | 0.2139 | 0.2252 | 1.2184 | 0.2268 | 0.2114 | 0.2642 | 1.1174 | 0.2257 | 0.2122 | 0.2467 | 1.1684 | |
| ACF | 0.000367 | 0.00374 | −0.00722 | 0.9265 | 0.001415 | 0.00378 | 0.00682 | 0.9367 | −0.02531 | 0.00363 | 0.00492 | 0.9273 | 3.36 × 10⁻⁶ | 0.00608 | 0.00499 | 0.9328 | −0.00094 | 0.0522 | 0.01125 | 0.9223 | |
Disclaimer/Publisher’s Note: The statements, opinions and data contained in all publications are solely those of the individual author(s) and contributor(s) and not of MDPI and/or the editor(s). MDPI and/or the editor(s) disclaim responsibility for any injury to people or property resulting from any ideas, methods, instructions or products referred to in the content. |
© 2023 by the authors. Licensee MDPI, Basel, Switzerland. This article is an open access article distributed under the terms and conditions of the Creative Commons Attribution (CC BY) license (https://creativecommons.org/licenses/by/4.0/).
Share and Cite
MDPI and ACS Style
Hasan, N.A.; Dongkai, Y.; Al-Shibli, F. SPI and SPEI Drought Assessment and Prediction Using TBATS and ARIMA Models, Jordan. Water 2023, 15, 3598. https://doi.org/10.3390/w15203598
AMA Style
Hasan NA, Dongkai Y, Al-Shibli F. SPI and SPEI Drought Assessment and Prediction Using TBATS and ARIMA Models, Jordan. Water. 2023; 15(20):3598. https://doi.org/10.3390/w15203598
Chicago/Turabian StyleHasan, Nivin Abdelrahim, Yang Dongkai, and Fayha Al-Shibli. 2023. "SPI and SPEI Drought Assessment and Prediction Using TBATS and ARIMA Models, Jordan" Water 15, no. 20: 3598. https://doi.org/10.3390/w15203598
Note that from the first issue of 2016, this journal uses article numbers instead of page numbers. See further details here.