
Integrating Open-Source Datasets to Analyze the Transboundary Water–Food–Energy–Climate Nexus in Central Asia

 , ,
, ,  , , , ,
Abstract
:1. Introduction
1.1. Data Scarcity in Central Asia
1.2. Open-Source Data for the Transboundary WFEC Nexus
2. Materials and Methods
3. Results
3.1. Climate

| ID | Name | Description | Spatial Extent | Temporal Extent | Resolution (Accuracy) | Data Created/Published | Type of Data | Data Source | Data Provider | Online Link |
|---|---|---|---|---|---|---|---|---|---|---|
| C01 | GHCN-daily V3 | Daily records of precipitation and temperature station data | Global | At least 30 years of data for each station | Daily | 2012, 2023 | Time series (csv) | Menne et al. [29,30] | NOAA | https://www.ncei.noaa.gov/metadata/geoportal/rest/metadata/item/gov.noaa.ncdc:C00861/html (accessed on 26 April 2023) |
| C02 | Central Asia temperature and precipitation data | Monthly records from station data | Central Asia | Variable length time series between 1879–2003 | Monthly | 2003 | Time series (tab-delimited ASCII) | Williams et al. [31] | NSIDC | https://nsidc.org/data/g02174/versions/1#anchor-1 (accessed 26 April 2023) |
| C03 | CHELSA v2.1 | Monthly precipitation and temperature time series | Global | 1979–2018, projected climatologies for selected GCM models for 1981–2010, 2011–2040, 2041–2070, and 2071–2100 | 30 arc-seconds, data quality should be validated prior to use. | 2021 | Raster (tif) | Karger et al. [32,33,34] | WSL | https://chelsa-climate.org/ (accessed on 22 May 2023) |
| C04 | WorldClim | Historical monthly weather data downscaled from CRU-TS-4.03 | Global | 1960–2018 | 2.5 arc-minutes/monthly | Raster (tif) | WorldClim [35,36] | WorldClim | https://www.worldclim.org/data/monthlywth.html (accessed on 22 May 2023) | |
| C05 | ERA5-Land | Single-level precipitation sum and air temperature at 2 m above ground | Global | 1950–present | 6 arc-minutes/from hourly to monthly | 2023 | Raster (GRIB) | CDS [37] | CDS | https://cds.climate.copernicus.eu/cdsapp#!/dataset/reanalysis-era5-land?tab=overview (accessed on 26 April 2023) |
| C06 | CRU-TS-4.06.01 | High-resolution gridded data of month-by-month variation in climate | Global | 1901–2021 | 30 arc-minutes/monthly | 2023 | Raster (netCDF) | University of East Anglia Climate Research Unit [38] | CEDA | https://data.ceda.ac.uk/badc/cru/data/cru_ts/cru_ts_4.06/data/ (accessed on 26 April 2023) |
| C07 | GPM IMERG | Daily precipitation L3 (the successor product of TRMM). | Global | 2000–present | 6 arc-minutes/daily | 2023 | Raster (netCDF) | Huffman et al. [39] | NASA GES DISC | https://disc.gsfc.nasa.gov/datasets/GPM_3IMERGDF_06/summary (accessed on 26 April 2023) |
| C08 | APHRODITE v1801 R1 | Daily precipitation analysis product | Monsoon Asia (incl. Central Asia) | 1998–2015 | 15 arc-minutes/daily | 2018 | Raster (netCDF) | Yatagai et al. [40] | APHRODITE | http://aphrodite.st.hirosaki-u.ac.jp/download/data/search/ (accessed on 26 April 2023) |
| C09 | GPCC Full Data Daily Version 2022 | Daily gridded precipitation data | Global | 1982–2020 | 60 arc-minutes/daily | 2022 | Raster (netCDF) | Ziese et al. [41,42] | GPC | https://opendata.dwd.de/climate_environment/GPCC/full_data_monthly_v2022/025/ (accessed on 26 April 2023) |
| C10 | CHIRPS | Quasi-global satellite and observation-based precipitation estimates over land | Quasi-global | 1981–near present | 3 arc-minutes/pentad to monthly | 2014 | Raters (netCDF) | Funk et al. [43,44] | Climate Hazard Center, UC Santa Barbara | https://www.chc.ucsb.edu/data (accessed on 26 April 2023) |
| C11 | PERSIANN-CDR V1 | Precipitation Estimation from Remotely Sensed Information using Artificial Neural Networks | Global | 1982–present (note large data gaps until 1999) | 2.4 arc-minutes/subdaily to annual | 2014 | Raster (netCDF) | Sorooshian et al. [45,46] | NCEI, NOAA | https://www.ncei.noaa.gov/metadata/geoportal/rest/metadata/item/gov.noaa.ncdc:C00854/html (accessed on 23 May 2023) |
| C12 | Global aridity and PET database v3 | Potential evaporation and aridity index | Global | Average data from 1970–2000 | 30 arc-seconds | 2022 | Vector (shp) | Zomer et al. [47,48] | CGIAR | https://cgiarcsi.community/2019/01/24/global-aridity-index-and-potential-evapotranspiration-climate-database-v3/ (accessed on 23 May 2023) |
| C13 | SSEpop | Actual evaporation | Global | Annual data from 2003–2021 | Suitable for regional focus | 2020 | Raster (tif) | Senay et al. [49] | USGS | https://earlywarning.usgs.gov/fews/product/466 (accessed on 23 May 2023) |
| C14 | GFDLESM4 | Projections of future precipitation and temperature for shared socio-economic pathways | Global | Daily data from 1980 to 2100 | 100 km resolution | 2018 | Raster (netCDF) | Krasting et al. [50] | NOAA | https://www.wdc-climate.de/ui/cmip6?input=CMIP6.CMIP.NOAA-GFDL.GFDL-ESM4 (accessed on 13 September 2023) |
| C15 | IPSL-CM6A-LR | Projections of future precipitation and temperature for shared socio-economic pathways | Global | Daily data from 1980 to 2100 | 250 km resolution | 2018 | Raster (netCDF) | Boucher et al. [51] | IPLS | https://www.wdc-climate.de/ui/cmip6?input=CMIP6.CFMIP.IPSL.IPSL-CM6A-LR (accessed on 13 September 2023) |
| C16 | MRI-ESM2.0 | Projections of future precipitation and temperature for shared socio-economic pathways | Global | Daily data from 1980 to 2100 | 250 km resolution | 2019 | Raster (netCDF) | Yukimoto et al. [52] | MRI | https://www.wdc-climate.de/ui/cmip6?input=CMIP6.CMIP.MRI.MRI-ESM2-0.historical (accessed on 13 September 2023) |
| C17 | UKESM1.0-LL | Projections of future precipitation and temperature for shared socio-economic pathways | Global | Daily data from 1980 to 2100 | 250 km resolution | 2019 | Raster (netCDF) | Tang et al. [53] | MOHC | https://www.wdc-climate.de/ui/cmip6?input=CMIP6.CMIP.MOHC.UKESM1-0-LL.esm-piControl (accessed on 13 September 2023) |
3.2. Hydrology
| ID | Name | Description | Spatial Extent | Temporal Extent | Resolution (Accuracy) | Data Created/Published | Type of Data | Data Source | Data Provider | Online Link |
|---|---|---|---|---|---|---|---|---|---|---|
| H01 | HydroRIVERS V1.0 | River network | Global | NA | Suitable for regional focus | 2013 | Vector (shp) | Lehner et al. [73] | WWF HydroSHEDS | https://www.hydrosheds.org/products/hydrorivers (accessed on 6 September 2023) |
| H02 | HydroBASINS V1.0 | Basin outlines consistent with river network | Global | NA | Suitable for regional focus | 2013 | Vector (shp) | Lehner et al. [73] | WWF HydroSHEDS | https://www.hydrosheds.org/products/hydrobasins (accessed on 6 September 2023) |
| H03 | HydroLAKES V1.0 | Lake outlines | Global | NA | Suitable for regional focus | 2013 | Vector (shp) | Messager et al. [74] | WWF HydroSHEDS | https://www.hydrosheds.org/products/hydrolakes (accessed on 6 September 2023) |
| H04 | CA-discharge data set | Geolocations of river gauges in mountainous Central Asia, including basin outlines, discharge, and basin characterization | Mountainous parts of the drainage basins Issy Kul, Chu, Talas, Syr Darya, Amu Darya, Murghab, Harirud | Time series of various lengths between 1915–2012 | Suitable for water balance modelling at basin scale | 2023 | Vector as geopackage (shp/gpkg) | Marti et al. [18] | Zenodo.org | https://www.doi.org/10.5281/zenodo.7743778 (accessed on 24 July 2023) |
| H05 | Randolph Glacier Inventory V6.0 | Glacier outlines | Global | 2014 | Suitable for regional focus | 2017 | Vector (shp) | RGI Consortium [75] | Global Land Ice Measurements from Space Initiative (GLIMS) | https://www.glims.org/RGI/ (accessed on 3 April 2023) |
| H06 | High Mountain Asia Snow ReanalysisV1 | Snow cover and snow water equivalents | High mountain Asia | 1 October 1999–30 September 2017 | 16 arc-second | 2021 | Raster (netCDF) | Liu et al. [76] | National Snow and Ice Data Center (NSIDC) | https://nsidc.org/data/hma_sr_d/versions/1 (accessed on 3 April 2023) |
| H07 | Glacier thickness Farinotti | Glacier thickness on RGI based on inverse modelling | Global | 2014 | Suitable for regional focus | 2019 | Raster (tif) | Farinotti et al. [77] | ETH Zurich | https://www.research-collection.ethz.ch/handle/20.500.11850/315707 (accessed on 3 April 2023) |
| H08 | Glacier thickness Millan | Glacier thickness on RGI based on inverse modelling | Global | 2014 | ~50 m | 2022 | Raster (tif) | Millan et al. [78] | SEDOO | https://www.sedoo.fr/theia-publication-products/?uuid=55acbdd5-3982-4eac-89b2-46703557938c (accessed on 3 April 2023) |
| H09 | Glacier thinning rates | Glacier thinning rates on RGI | Global | Average rate of change between 2000–2019 | Suitable for regional focus | 2021 | Table (csv) | Hugonnet et al. [79] | SEDOO | https://doi.org/10.6096/13 (accessed on 3 April 2023) |
| H10 | Glacier ablation rates | Glacier ablation rates for many of the glaciers with area >2 km2 in High Mountain Asia | High Mountain Asia | Average ablation rate between 2000–2016 | Suitable for regional focus in basins dominated by glacier melt from larger glaciers | 2021 | Table (csv) | Miles et al. [80] | ZENODO | https://doi.org/10.5281/zenodo.3843292 (accessed on 24 July 2023) |
| H11 | Projections of glacier melt | Projections of glacier melt under CMIP 6 climate projections | Global | 2000–2100 | Suitable for regional focus | 2023 | Raster (netCDF) | Rounce et al. [81] | National Snow and Ice Data Center (NSIDC) | https://nsidc.org/data/hma2_ggp/versions/1 (accessed on 24 July 2023) |
| H12 | HiHydroSoils V2.0 | High resolution (250 m) soil maps hydraulic properties | Global | NA | ~250 m | 2020 | Raster (tif) | FutureWater [82] | FutureWater | https://www.futurewater.eu/projects/hihydrosoil/ (accessed on 24 April 2023) |
| H13 | FLO1K | Map of average mean, minimum and maximum river runoff | Global | Averages between 1960–2015 | 30 arc-seconds. Suitable where discharge measurements are unavailable | 2018 | Raster (netCDF) | Barbarossa et al. [83] | Figshare | https://doi.org/10.6084/m9.figshare.c.3890224.v1 (accessed on 3 May 2023) |
| H14 | Northern Hemisphere Permafrost–Ground Temperature Map (2000-2016) | Provides modeled mean annual ground temperatures at the top layer of the permafrost | Northern Hemisphere | Based on average temperatures between 2000–2016 | 30 arc-seconds | 2018 | Raster (netCDF) | Obu et al. [84,85] | Arctic Permafrost Geospatial Center | https://doi.org/10.1594/PANGAEA.888600 (accessed on 3 April 2023) |
| H15 | Soil Moisture Active Passive (SMAP) | Two datasets (near real-time as well as historic data) providing estimates of global land surface moisture measured by a passive microwave radiometer | Global | Near real-time data, as well as from 2015–today | 36 km2 | 2021/2022 | Raster (HDF5) | O’Neill et al. [86,87] | National Snow and Ice Data Center | https://doi.org/10.5067/NCTT8THPWRTL (accessed on 6 September 2023) https://doi.org/10.5067/LPJ8F0TAK6E0 (accessed on 6 September 2023) |
3.3. Geography and Topography
| ID | Name | Description | Spatial Extent | Temporal Extent | Resolution (Accuracy) | Data Created/Published | Type of Data | Data Source | Data Provider | Online Link |
|---|---|---|---|---|---|---|---|---|---|---|
| T01 | Global Administrative Areas (GADM) | Delineation of country and administrative boundaries | Global | NA | Suitable for regional focus | 2022 | Vector (shp/gpkg) | GADM [58] | GADM | https://gadm.org/data.html (accessed on 22 May 2023) |
| T02 | Digital Elevation—Shuttle Radar Topography Mission (SRTM) | Void-filled and non-void-filled options obtained by radar from space | Global | NA | 1 arc-seconds or 3 arc-seconds | 2000/2018 | Raster (tif) | Earth Resources Observation and Science Center (EROS) [94] | United States Geological Survey (USGS)—Earth Resources Observation and Science (EROS) Center | https://doi.org/10.5066/F7PR7TFT (accessed on 22 May 2023) |
| T03 | HydroSHEDS V1.0 | Hydrological conditioned DEM and other DEM-based products (flow direction, flow accumulation, land mask grid) | Global | NA | 3, 15, 30 arc-seconds and 5, 6 arc-minutes | 2007/2008 | Raster (tif) | Lehner et al. [95] | WWF HydroSheds | https://www.hydrosheds.org/downloads (accessed on 22 May 2023) |
| T04 | Copernicus Global Land Service | Land cover data of 23 classes, including transitions of land cover classes over time capturing land cover changes | Global | Annual between 2015—2019 | ~100 m (Mapping accuracy is just over 80%) | 2020 | Raster (tif) | Buchhorn et al. [96] | Copernicus Global Land Service | https://land.copernicus.eu/global/products/lc (accessed on 6 September 2023) |
| T05 | Land cover classification gridded maps | Global maps categorizing the land surface into 22 classes, defined by the FAO Land Cover Classification System | Global | Annual between 1992—2020 | ~300 m | 2019 | Raster (netCDF4) | Copernicus Climate Change Service [90] | Copernicus Climate Change Service | https://doi.org/10.24381/cds.006f2c9a (accessed on 17 May 2023) |
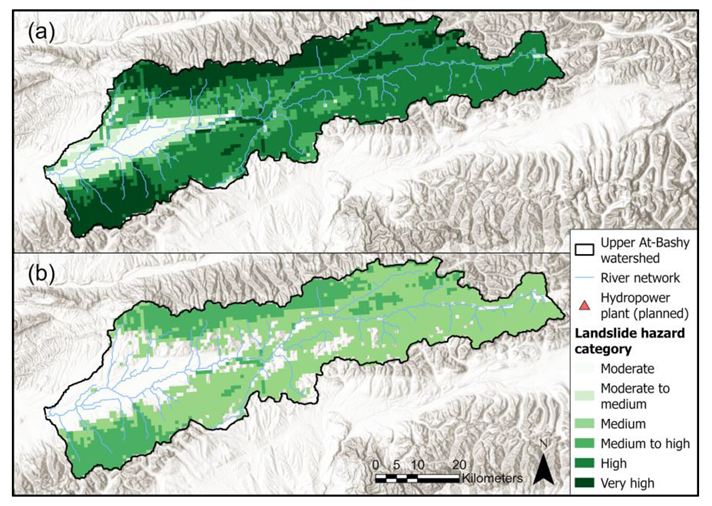
3.4. Geomorphology
| ID | Name | Description | Spatial Extent | Temporal Extent | Resolution (Accuracy) | Data Created/Published | Type of Data | Data Source | Data Provider | Online Link |
|---|---|---|---|---|---|---|---|---|---|---|
| G01 | Global lithological map (GLiM) | Lithological map with three-level classification system for rock types | Global | - | Suitable for regional focus | 2012 | Vector (shp) | Moosdorf and Hartmann [98,100] | Commission for the Geological Map of the World | https://ccgm.org/en/product/world-lithology-map/ (accessed on 24 July 2023) |
| G02 | Generalized Geology of the Former Soviet Union | Geological map showing geology, oil and gas fields, and geologic provinces | Former Soviet Union | - | Suitable for regional focus | 1999 | Vector (shp) | Persits et al. [101] | United States Geological Survey (USGS) | https://certmapper.cr.usgs.gov/data/apps/world-maps/ (accessed on 5 May 2023) |
| G03 | Soil Erosion | Assessment of global soil erosion using the RUSLE method | Global | 2001, 2012 | ~25 km | 2017/2019 | Raster (tif) | Borrelli et al. [102,103] | Joint Research Centre of the European Commission | https://esdac.jrc.ec.europa.eu/content/global-soil-erosion (Available upon request) (accessed on 5 May 2023) |
| G04 | Landslide Hazard | Global landslide hazard map containing rainfall and earthquake-induced landslide hazards | Global | - | ~1 km | 2020/2021 | Raster (tif) | The World Bank [104] | The World Bank | https://datacatalog.worldbank.org/search/dataset/0037584 (accessed on 5 February 2023) |
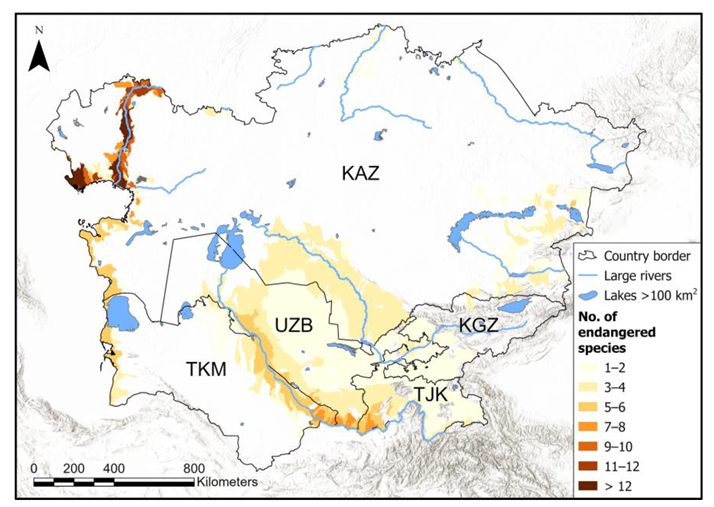
3.5. Ecology
| ID | Name | Description | Spatial Extent | Temporal Extent | Resolution (Accuracy) | Data created/Published | Type of Data | Data Source | Data Provider | Online Link |
|---|---|---|---|---|---|---|---|---|---|---|
| E01 | Freshwater Ecoregions | Delineation of 426 freshwater conservation units with distinct freshwater communities | Global | NA | Suitable for global and regional focus | 2008 | Vector (shp) | Abell et al. [123] | The Nature Conservancy and World Wildlife Fund 2019 | www.feow.org (accessed on 2 May 2023) |
| E02 | Key Biodiversity Areas | Areas contributing significantly to biodiversity | Global | Updated regularly | Suitable for global, regional, and national focus | 2016 | Vector (shp) | IUCN [134] | Bird Life International (2022) | www.keybiodiversityareas.org/kba-data (Available upon request) (accessed on 2 May 2023) |
| E03 | IUCN Red List of Freshwater species | Distribution ranges of freshwater species | Global | Updated regularly | Suitable for global and regional focus | 2021 | Vector (shp) | IUCN [135] | IUCN | www.iucnredlist.org/resources/spatial-data-download (accessed on 2 May 2023) |
| E04 | Global EPTO Database | Comprehensive table of Ephemeroptera, Plecoptera, Trichoptera, and Odonata (EPTO) occurrence records | Global | 1951–2021 (94% with complete date) | Suitable for global, regional, and national focus | 2023 | Table (csv) with coordinates and catchment IDs | Grigoropoulou et al. [136] | IGB Leibniz-Institute of Freshwater Ecology and Inland Fisheries | https://fred.igb-berlin.de/data/package/829 (accessed on 2 May 2023) |
| E05 | Living Planet Index Database | Time-series of population abundance data for vertebrate species (public version) | Global | 1970–2021 | Varying | 2022 | Table (csv) of species with yearly abundance metrics and site coordinates | Living Planet Index [137] | Zoological Society of London and WWF 2022 | www.livingplanetindex.org (accessed on 2 May 2023) |
| E06 | Free-Flowing Rivers | Global river network including a connectivity status assessment on the reach scale | Global | NA | Suitable for global and regional focus | 2019 | Vector (gdb) | Grill et al. [129,138] | Grill and Lehner (2019) | https://doi.org/10.6084/m9.figshare.7688801 (accessed on 2 May 2023) |
| E07 | World Database on Protected Areas | Global Database on Protected Areas (WDPA) and World Database on Other Effective Area-based Conservation Measures (WD-OECM) | Global | Updated regularly | Suitable for global, regional, and national focus | 2023 | Vector (shp) | UNEP-WCMC and IUCN [139] | Protected Planet | www.protectedplanet.net (accessed on 2 May 2023) |
| E08 | Ramsar sites | Global point information of Ramsar Sites | Global | NA | Suitable for global and regional focus | 2021 | Table (csv) with coordinates or Vector (shp) | Ramsar [140] | Ramsar Sites Information Service | https://rsis.ramsar.org (accessed on 2 May 2023) |
| E09 | Global Environmental Stratification (GEnS) | High-resolution bioclimate map of the world | Global | NA | 30 arc-seconds | 2018 | Raster, Vector (tif, shp) | Metzger [132,133] | M. Metzger | https://datashare.ed.ac.uk/handle/10283/3089 (accessed on 2 May 2023) |
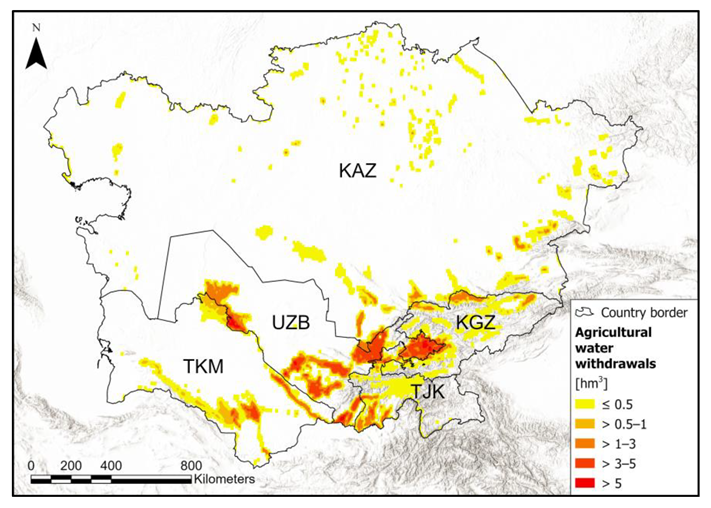
3.6. Anthropogenic Uses
| ID | Name | Description | Spatial Extent | Temporal Extent | Resolution (Accuracy) | Data Created/Published | Type of Data | Data Source | Data Provider | Online Link |
|---|---|---|---|---|---|---|---|---|---|---|
| A01 | Global Energy Observatory—Hydro PowerPlants | Consolidated and processed dataset of hydropower plants | Global | NA | Suitable for regional focus | Varied, modified in 2018 | Vector (shp) and table (xls) | Global Energy Observatory [147] | Global Energy Observatory (GEO) | https://globalenergyobservatory.org/list.php?db=PowerPlants&type=Hydro (accessed on 19 May 2023) |
| A02 | Global Georeferenced Database of Dams (GOODD) | Location of >38,000 dams and associated watersheds | Global | NA | Suitable for regional focus. Older structures are mostly complete, newer ones are incomplete | 2020 | Vector (shp) | Mulligan et al. [148] | Global Dam Watch | https://www.globaldamwatch.org/ (accessed on 19 May 2023) |
| A03 | Irrigation canals by OpenStreetMap (OSM) | Location of OSM irrigation channels | Global | -- | Suitable for regional focus (incomplete) | 2020 | Vector (shp) | OpenStreetMap contributors [149] | OpenStreetMap | https://www.openstreetmap.org/#map=6/40.388/68.994 (accessed on 20 November 2023) |
| A04 | Electricity network by OpenStreetMap | OpenStreetMap electricity network | Global | -- | Suitable for regional focus (incomplete) | 2020 | Vector (shp) | OpenStreetMap contributors [149] | OpenStreetMap | https://www.openstreetmap.org/#map=6/40.388/68.994 (accessed on 20 November 2023) |
| A05 | AQUASTAT | Data on harvested area, crop yields, renewable water resources, and agricultural water withdrawal | Global | 1964–2020 | Suitable for regional and national focus | 1993 | Table (xls) | FAO [146] | FAO | https://tableau.apps.fao.org/views/ReviewDashboard-v1/country_dashboard?%3Aembed=y&%3AisGuestRedirectFromVizportal=y (accessed on 20 May 2023) |
| A06 | Crop Calendar | Global crop planting/harvesting dates for 19 major crops; combined data from Food and Agriculture Organization (FAO) and United States Department of Agriculture (USDA) | Global | NA | 5 arc-minutes or 0.5 arc-degrees | 2010 | Raster (netCDF, ArcINFO ASCII) | Sacks et al. [150,151] | Center for Sustainability and the Global Environment (SAGE), University of Wisconsin-Madison, USA, | https://sage.nelson.wisc.edu/data-and-models/datasets/crop-calendar-dataset/ (accessed on 21 June 2023) |
| A07 | MapSPAM | Crop production indicators for 42 crop types, including physical area, harvest area, production, and yield | Global | 2000, 2005, 2010 | 5 arc-minutes | 2010 | Raster (csv) | MapSPAM (CGIAR, FAO, World bank etc.) [152] | Harvard database | https://www.mapspam.info/data/ (accessed on 19 February 2023) |
| A08 | Harmonized World Soil database (HWSD) v 1.2 | Dataset of harmonized soil properties | Global | 30 arc-seconds | 2009 | Raster (mdb) | FAO, IIASA, ISRIC-World Soil Information, Institute of Soil Science-Chinese Academy of Sciences (ISSCAS), and the JRC [153] | FAO | https://www.fao.org/soils-portal/soil-survey/soil-maps-and-databases/harmonized-world-soil-database-v12/en/ (accessed on 19 May 2023) | |
| A09 | Gridded Population of the World (GPW) v4 | Gridded population counts aggregated from national and sub-national levels | Global | 2000, 2005, 2010, 2015, 2020 | 30 arc-seconds | 2018 | Raster (tif, ASCII; netCDF4) | Center for International Earth Science Information Network—CIESIN—Columbia University [154] | Center for International Earth Science Information Network (CIESIN)- Socioeconomic Data and Applications Center (SEDAC) | https://sedac.ciesin.columbia.edu/data/set/gpw-v4-population-count-rev11 (accessed on 19 May 2023) |
| A10 | Human Development Index (HDI) | An index for assessing human developments considering three dimensions: (i) a long and healthy life, (ii) the status of knowledge, and (iii) the standard of living | Global | 1990–2021 | Suitable for regional focus | 2020 | Table (csv, xls) | United Nations Development Programme (UNDP) [155] | UNDP | http://hdr.undp.org/en/content/download-data (accessed on 19 May 2023) |
4. Discussion
4.1. Data Updates and Integration
4.2. Real-Time Applications
4.3. WFEC Nexus Application in Central Asia: The Case of Hydropower
4.4. Data Limitations
4.5. Promoting Data Sharing and Fostering Collaboration
5. Conclusions
Author Contributions
Funding
Data Availability Statement
Conflicts of Interest
References
- IPCC. Fact Sheets|Climate Change 2022: Impacts, Adaptation and Vulnerability; IPCC: Geneva, Switzerland, 2022; ISBN 9789291691623. [Google Scholar]
- Butchart, S.H.M.; Walpole, M.; Collen, B.; van Strien, A.; Scharlemann, J.P.W.; Almond, R.E.A.; Baillie, J.E.M.; Bomhard, B.; Brown, C.; Bruno, J.; et al. Global Biodiversity: Indicators of Recent Declines. Science 2010, 328, 1164–1168. [Google Scholar] [CrossRef]
- Ravallion, M. On Measuring Global Poverty. Annu. Rev. Econom. 2020, 12, 167–188. [Google Scholar] [CrossRef]
- Simpson, G.B.; Jewitt, G.P. The Water-Energy-Food Nexus in the Anthropocene: Moving from ‘Nexus Thinking’ to ‘Nexus Action’. Curr. Opin. Environ. Sustain. 2019, 40, 117–123. [Google Scholar] [CrossRef]
- European Commission. Water-Energy-Food-Ecosystem Nexus. Available online: https://international-partnerships.ec.europa.eu/policies/climate-environment-and-energy/water-energy-food-ecosystem-nexus_en (accessed on 25 May 2023).
- de Strasser, L.; Lipponen, A.; Howells, M.; Stec, S.; Bréthaut, C. A Methodology to Assess the Water Energy Food Ecosystems Nexus in Transboundary River Basins. Water 2016, 8, 59. [Google Scholar] [CrossRef]
- Dukhovny, V.A.; Sokolov, V.I.; Ziganshina, D.R. Integrated Water Resources Management in Central Asia, as a Way of Survival in Conditions of Water Scarcity. Quat. Int. 2013, 311, 181–188. [Google Scholar] [CrossRef]
- Hamidov, A.; Helming, K.; Balla, D. Impact of Agricultural Land Use in Central Asia: A Review. Agron. Sustain. Dev. 2016, 36, 6. [Google Scholar] [CrossRef]
- Yazdani, E. Geopolitical Dynamics of the Persian Gulf and Central Asia in the US Global Policy. Shanlax Int. J. Arts Sci. Humanit. 2020, 8, 1–15. [Google Scholar] [CrossRef]
- Sorg, A.; Mosello, B.; Shalpykova, G.; Allan, A.; Hill Clarvis, M.; Stoffel, M. Coping with Changing Water Resources: The Case of the Syr Darya River Basin in Central Asia. Environ. Sci. Policy 2014, 43, 68–77. [Google Scholar] [CrossRef]
- Siegfried, T.; Mujahid, A.U.H.; Marti, B.S.; Molnar, P.; Krager, D.N.; Yakovlev, A. Assessing Future Hydrological Impacts of Climate Change on High-Mountain Central Asia: Insights from a Stochastic Soil Moisture Water Balance Model. EGUsphere 2023, 2023, 1–43. [Google Scholar] [CrossRef]
- Liu, J.; Hull, V.; Godfray, H.C.J.; Tilman, D.; Gleick, P.; Hoff, H.; Pahl-Wostl, C.; Xu, Z.; Chung, M.G.; Sun, J.; et al. Nexus Approaches to Global Sustainable Development. Nat. Sustain. 2018, 1, 466–476. [Google Scholar] [CrossRef]
- Estoque, R.C. Complexity and Diversity of Nexuses: A Review of the Nexus Approach in the Sustainability Context. Sci. Total Environ. 2023, 854, 158612. [Google Scholar] [CrossRef] [PubMed]
- Djumaboev, K.; Anarbekov, O.; Holmatov, B.; Hamidov, A.; Gafurov, Z.; Murzaeva, M.; Sušnik, J.; Maskey, S.; Mehmood, H.; Smakhtin, V. Surface Water Resources. In The Aral Sea Basin; Routledge: Abingdon, UK, 2019; pp. 25–38. [Google Scholar]
- Pohl, B.; Annika, K.; Hull, W.; Blumstein, S.; Abdullaev, I.; Kazbekov, J.; Reznikova, T.; Ekaterina, S.; Eduard, I.; Görlitz, S. Rethinking Water in Central Asia—The Costs of Inaction and Benefits of Water Cooperation; Swiss Agency for Development and Cooperation: Bern, Switzerland, 2017. [Google Scholar]
- Alamanos, A. Sustainable Water Resources Management under Water-Scarce and Limited-Data Conditions. Cent. Asian J. Water Res. 2021, 7, 1–19. [Google Scholar] [CrossRef]
- Gerlitz, L.; Vorogushyn, S.; Gafurov, A. Climate Informed Seasonal Forecast of Water Availability in Central Asia: State-of-the-Art and Decision Making Context. Water Secur. 2020, 10, 100061. [Google Scholar] [CrossRef]
- Marti, B.; Yakovlev, A.; Karger, D.N.; Ragettli, S.; Zhumabaev, A.; Wakil, A.W.; Siegfried, T. CA-Discharge: Geo-Located Discharge Time Series for Mountainous Rivers in Central Asia. Sci. Data 2023, 10, 579. [Google Scholar] [CrossRef]
- Gorgoglione, A.; Castro, A.; Chreties, C.; Etcheverry, L. Overcoming Data Scarcity in Earth Science. Data 2020, 5, 5. [Google Scholar] [CrossRef]
- Chen, Y.; Li, W.; Fang, G.; Li, Z. Review Article: Hydrological Modeling in Glacierized Catchments of Central Asia—Status and Challenges. Hydrol. Earth Syst. Sci. 2017, 21, 669–684. [Google Scholar] [CrossRef]
- Gosling, S.N.; Arnell, N.W. A Global Assessment of the Impact of Climate Change on Water Scarcity. Clim. Chang. 2016, 134, 371–385. [Google Scholar] [CrossRef]
- Strobl, J.; Nazarkulova, A. Open Geospatial Data: New Opportunities for GIS and GIScience in Central Asia? In Proceedings of the Annual Central Asia GIS Conference GISCA, Urumqi, China, 29–31 May 2014.
- United Nations Development Programme. Using Geospatial Data for Sustainable Development; United Nations Development Programme: New York, NY, USA, 2018. [Google Scholar]
- Singh, C.; Solomon, D.; Rao, N. How Does Climate Change Adaptation Policy in India Consider Gender? An Analysis of 28 State Action Plans. Clim. Policy 2021, 21, 958–975. [Google Scholar] [CrossRef]
- Ostapenko, O.; Olczak, P.; Koval, V.; Hren, L.; Matuszewska, D.; Postupna, O. Application of Geoinformation Systems for Assessment of Effective Integration of Renewable Energy Technologies in the Energy Sector of Ukraine. Appl. Sci. 2022, 12, 592. [Google Scholar] [CrossRef]
- Reisenbüchler, M.; Alapfy, B.; Rutschmann, P.; Siegfried, T. Hydro4U—Nachhaltige Kleinwasserkraft in Zentralasien. WasserWirtschaft 2021, 111, 10–15. [Google Scholar] [CrossRef]
- Zhang, X.; Dong, Q.; Cheng, L.; Xia, J. A Budyko-Based Framework for Quantifying the Impacts of Aridity Index and Other Factors on Annual Runoff. J. Hydrol. 2019, 579, 124224. [Google Scholar] [CrossRef]
- ISIMIP3 Consortium. ISIMIP3 Simulation Protocol. Available online: https://www.isimip.org/protocol/3/ (accessed on 26 April 2023).
- Menne, M.J.; Imke, D.; Bryant, K.; McNeill, S.; Thomas, K.; Yin, X.; Anthony, S.; Ray, R.; Vose, R.S.; E.Gleason, B.E.; et al. Global Historical Climatology Network—Daily (GHCN-Daily) Version 6. 2021. Available online: https://doi.org/10.7289/V5D21VHZ (accessed on 26 April 2023).
- Menne, M.J.; Durre, I.; Vose, R.S.; Gleason, B.E.; Houston, T.G. An Overview of the Global Historical Climatology Network-Daily Database. J. Atmos. Ocean. Technol. 2012, 29, 897–910. [Google Scholar] [CrossRef]
- Williams, M.W.; Konovalov, V.G. Central Asia Temperature and Precipitation Data, 1879–2003. 2008. Available online: https://doi.org/10.7265/N5NK3BZ8 (accessed on 26 April 2023).
- Karger, D.N.; Conrad, O.; Böhner, J.; Kawohl, T.; Kreft, H.; Soria-Auza, R.W.; Zimmermann, N.E.; Linder, H.P.; Kessler, M. Climatologies at High Resolution for the Earth’s Land Surface Areas. Sci. Data 2017, 4, 170122. [Google Scholar] [CrossRef]
- Karger, D.N.; Conrad, O.; Böhner, J.; Kawohl, T.; Kreft, H.; Soria-Auza, R.W.; Zimmermann, N.E.; Linder, H.P.; Kessler, M. Climatologies at High Resolution for the Earth’s Land Surface Areas. 2021. Available online: https://doi.org/10.16904/envidat.228.v2.1 (accessed on 22 May 2023).
- Beck, H.E.; Wood, E.F.; McVicar, T.R.; Zambrano-Bigiarini, M.; Alvarez-Garreton, C.; Baez-Villanueva, O.M.; Sheffield, J.; Karger, D.N. Bias Correction of Global High-Resolution Precipitation Climatologies Using Streamflow Observations from 9372 Catchments. J. Clim. 2020, 33, 1299–1315. [Google Scholar] [CrossRef]
- Fick, S.E.; Hijmans, R.J. WorldClim 2: New 1-km Spatial Resolution Climate Surfaces for Global Land Areas. Int. J. Climatol. 2017, 37, 4302–4315. [Google Scholar] [CrossRef]
- Harris, I.; Jones, P.D.; Osborn, T.J.; Lister, D.H. Updated High-Resolution Grids of Monthly Climatic Observations—The CRU TS3. 10 Dataset. Int. J. Climatol. 2014, 34, 623–642. [Google Scholar] [CrossRef]
- Muñoz Sabater, J. ERA5-Land Hourly Data from 1950 to Present. Copernicus Climate Change Service (C3S) Climate Data Store (CDS). 2019. Available online: https://doi.org/10.24381/cds.e2161bac (accessed on 26 April 2023).
- University of East Anglia Climatic Research Unit; Harris, I.C.; Jones, P.D.; Osborn, T. CRU TS4.06: Climatic Research Unit (CRU) Time-Series (TS) Version 4.06 of High-Resolution Gridded Data of Month-by-Month Variation in Climate (January 1901–December 2021). 2022. Available online: https://catalogue.ceda.ac.uk/uuid/e0b4e1e56c1c4460b796073a31366980 (accessed on 26 April 2023).
- Huffman, G.J.; Stocker, E.F.; Bolvin, D.T.; Nelkin, E.J.; Tan, J. GPM IMERG Final Precipitation L3 1 Day 0.1 Degree x 0.1 Degree Version 6. 2019. Available online: https://doi.org/10.5067/GPM/IMERGDF/DAY/06 (accessed on 26 April 2023).
- Yatagai, A.; Kamiguchi, K.; Arakawa, O.; Hamada, A.; Yasutomi, N.; Kitoh, A. APHRODITE: Constructing a Long-Term Daily Gridded Precipitation Dataset for Asia Based on a Dense Network of Rain Gauges. Bull. Am. Meteorol. Soc. 2012, 93, 1401–1415. [Google Scholar] [CrossRef]
- Ziese, M.; Rauthe-Schöch, A.B.A.; Finger, P.; Rustemeier, E.; Hänsel, S.; Schneider, U. GPCC Full Data Daily Version 2022 at 1.0°: Daily Land-Surface Precipitation from Rain-Gauges Built on GTS-Based and Historic Data. 2022. Available online: https://doi.org/10.5676/DWD_GPCC/FD_D_V2022_100 (accessed on 23 April 2023).
- Schamm, K.; Ziese, M.; Becker, A.; Finger, P.; Meyer-Christoffer, A.; Schneider, U.; Schröder, M.; Stender, P. Global Gridded Precipitation over Land: A Description of the New GPCC First Guess Daily Product. Earth Syst. Sci. Data 2014, 6, 49–60. [Google Scholar] [CrossRef]
- Funk, C.; Peterson, P.; Landsfeld, M.; Pedreros, D.; Verdin, J.; Shukla, S.; Husak, G.; Rowland, J.; Harrison, L.; Hoell, A.; et al. The Climate Hazards Infrared Precipitation with Stations—A New Environmental Record for Monitoring Extremes. Sci. Data 2015, 2, 150066. [Google Scholar] [CrossRef]
- Funk, C.C.; Peterson, P.J.; Landsfeld, M.F.; Pedreros, D.H.; Verdin, J.P.; Rowland, J.D.; Romero, B.E.; Husak, G.J.; Michaelsen, J.C.; Verdin, A.P. A Quasi-Global Precipitation Time Series for Drought Monitoring; U.S. Geological Survey: Reston, VA, USA, 2014. [Google Scholar]
- Sorooshian, S.; Hsu, K.; Braithwaite, D.; Ashouri, H. NOAA CDR Program NOAA Climate Data Record (CDR) of Precipitation Estimation from Remotely Sensed Information Using Artificial Neural Networks (PERSIANN-CDR), Version 1. 2014. Available online: https://doi.org/10.7289/V51V5BWQ (accessed on 23 May 2023).
- Ashouri, H.; Hsu, K.-L.; Sorooshian, S.; Braithwaite, D.K.; Knapp, K.R.; Cecil, L.D.; Nelson, B.R.; Prat, O.P. PERSIANN-CDR: Daily Precipitation Climate Data Record from Multisatellite Observations for Hydrological and Climate Studies. Bull. Am. Meteorol. Soc. 2015, 96, 69–83. [Google Scholar] [CrossRef]
- Zomer, R.J.; Xu, J.; Trabucco, A. Version 3 of the Global Aridity Index and Potential Evapotranspiration Database. Sci. Data 2022, 9, 409. [Google Scholar] [CrossRef]
- Zomer, R.J.; Trabucco, A. Version 3 of the “Global Aridity Index and Potential Evapotranspiration (ET0) Database”: Estimation of Penman-Monteith Reference Evapotranspiration. 2022. Available online: https://doi.org/10.6084/m9.figshare.7504448.v4 (accessed on 23 May 2023).
- Senay, G.B.; Kagone, S.; Velpuri, N.M. Operational Global Actual Evapotranspiration: Development, Evaluation, and Dissemination. Sensors 2020, 20, 1915. [Google Scholar] [CrossRef]
- Krasting, J.P.; John, J.G.; Blanton, C.; McHugh, C.; Nikonov, S.; Radhakrishnan, A.; Rand, K.; Zadeh, N.T.; Balaji, V.; Durachta, J.; et al. NOAA-GFDL GFDL-ESM4 Model Output Prepared for CMIP6 CMIP 2018, Version YYYYMMDD; Earth System Grid Federation: Chicago, IL, USA, 2018. [Google Scholar]
- Boucher, O.; Denvil, S.; Levavasseur, G.; Cozic, A.; Caubel, A.; Foujols, M.-A.; Meurdesoif, Y.; Bony, S.; Flavoni, S.; Idelkadi, A.; et al. IPSL IPSL-CM6A-LR Model Output Prepared for CMIP6 CFMIP 2018, Version YYYYMMDD; Earth System Grid Federation: Chicago, IL, USA, 2018. [Google Scholar]
- Yukimoto, S.; Koshiro, T.; Kawai, H.; Oshima, N.; Yoshida, K.; Urakawa, S.; Tsujino, H.; Deushi, M.; Tanaka, T.; Hosaka, M.; et al. MRI MRI-ESM2.0 Model Output Prepared for CMIP6 CMIP Historical 2019, Version YYYYMMDD; Earth System Grid Federation: Chicago, IL, USA, 2019. [Google Scholar]
- Tang, Y.; Rumbold, S.; Ellis, R.; Kelley, D.; Mulcahy, J.; Sellar, A.; Walton, J.; Jones, C. MOHC UKESM1.0-LL Model Output Prepared for CMIP6 CMIP Esm-PiControl 2019, Version YYYYMMDD; Earth System Grid Federation: Chicago, IL, USA, 2019. [Google Scholar]
- Peña-Guerrero, M.D.; Umirbekov, A.; Tarasova, L.; Müller, D. Comparing the Performance of High-resolution Global Precipitation Products across Topographic and Climatic Gradients of Central Asia. Int. J. Climatol. 2022, 42, 5554–5569. [Google Scholar] [CrossRef]
- Dilinuer, T.; Yao, J.; Chen, J.; Zhao, Y.; Mao, W.; Li, J.; Yang, L. Systematical Evaluation of Three Gridded Daily Precipitation Products Against Rain Gauge Observations Over Central Asia. Front. Earth Sci. 2021, 9, 699628. [Google Scholar] [CrossRef]
- Salehie, O.; Ismail, T.; Shahid, S.; Ahmed, K.; Adarsh, S.; Asaduzzaman, M.; Dewan, A. Ranking of Gridded Precipitation Datasets by Merging Compromise Programming and Global Performance Index: A Case Study of the Amu Darya Basin. Theor. Appl. Climatol. 2021, 144, 985–999. [Google Scholar] [CrossRef]
- Zandler, H.; Haag, I.; Samimi, C. Evaluation Needs and Temporal Performance Differences of Gridded Precipitation Products in Peripheral Mountain Regions. Sci. Rep. 2019, 9, 15118. [Google Scholar] [CrossRef] [PubMed]
- GADM. GADM Data v4.1. 2022. Available online: https://gadm.org/data.html (accessed on 22 May 2023).
- Esri; Airbus DS; USGS; NGA; NASA; CGIAR; Robinson, N.; NCEAS; NLS; OS; et al. World Hillshade [ArcGIS Map Service]. 2022. Available online: https://services.arcgisonline.com/arcgis/rest/services/Elevation/World_Hillshade/MapServer (accessed on 10 May 2023).
- Zadereev, E.; Lipka, O.; Karimov, B.; Krylenko, M.; Elias, V.; Pinto, I.S.; Alizade, V.; Anker, Y.; Feest, A.; Kuznetsova, D.; et al. Overview of Past, Current, and Future Ecosystem and Biodiversity Trends of Inland Saline Lakes of Europe and Central Asia. Inl. Waters 2020, 10, 438–452. [Google Scholar] [CrossRef]
- Huang, W.; Duan, W.; Chen, Y. Rapidly Declining Surface and Terrestrial Water Resources in Central Asia Driven by Socio-Economic and Climatic Changes. Sci. Total Environ. 2021, 784, 147193. [Google Scholar] [CrossRef]
- Englmaier, G.K.; Hayes, D.S.; Meulenbroek, P.; Terefe, Y.; Lakew, A.; Tesfaye, G.; Waidbacher, H.; Malicky, H.; Wubie, A.; Leitner, P.; et al. Longitudinal River Zonation in the Tropics: Examples of Fish and Caddisflies from the Endorheic Awash River, Ethiopia. Hydrobiologia 2020, 847, 4063–4090. [Google Scholar] [CrossRef]
- Li, Z.; Chen, Y.; Li, Y.; Wang, Y. Declining Snowfall Fraction in the Alpine Regions, Central Asia. Sci. Rep. 2020, 10, 3476. [Google Scholar] [CrossRef]
- Barandun, M.; Fiddes, J.; Scherler, M.; Mathys, T.; Saks, T.; Petrakov, D.; Hoelzle, M. The State and Future of the Cryosphere in Central Asia. Water Secur. 2020, 11, 100072. [Google Scholar] [CrossRef]
- Hunger, M.; Döll, P. Value of River Discharge Data for Global-Scale Hydrological Modeling. Hydrol. Earth Syst. Sci. 2008, 12, 841–861. [Google Scholar] [CrossRef]
- Sarzaeim, P.; Bozorg-Haddad, O.; Zolghadr-Asli, B.; Fallah-Mehdipour, E.; Loáiciga, H.A. Optimization of Run-of-River Hydropower Plant Design under Climate Change Conditions. Water Resour. Manag. 2018, 32, 3919–3934. [Google Scholar] [CrossRef]
- Zhao, G.; Gao, H.; Naz, B.S.; Kao, S.-C.; Voisin, N. Integrating a Reservoir Regulation Scheme into a Spatially Distributed Hydrological Model. Adv. Water Resour. 2016, 98, 16–31. [Google Scholar] [CrossRef]
- Siegfried, T.; Bernauer, T.; Guiennet, R.; Sellars, S.; Robertson, A.W.; Mankin, J.; Bauer-Gottwein, P.; Yakovlev, A. Will Climate Change Exacerbate Water Stress in Central Asia? Clim. Chang. 2012, 112, 881–899. [Google Scholar] [CrossRef]
- Mirzaei, A.; Zibaei, M. Water Conflict Management between Agriculture and Wetland under Climate Change: Application of Economic-Hydrological-Behavioral Modelling. Water Resour. Manag. 2021, 35, 1–21. [Google Scholar] [CrossRef]
- Gernaat, D.E.H.J.H.J.; Bogaart, P.W.; van Vuuren, D.P.V.; Biemans, H.; Niessink, R. High-Resolution Assessment of Global Technical and Economic Hydropower Potential. Nat. Energy 2017, 2, 821–828. [Google Scholar] [CrossRef]
- Zhang, Q.; Chen, Y.; Li, Z.; Fang, G.; Xiang, Y.; Li, Y.; Ji, H. Recent Changes in Water Discharge in Snow and Glacier Melt-Dominated Rivers in the Tienshan Mountains, Central Asia. Remote Sens. 2020, 12, 2704. [Google Scholar] [CrossRef]
- Jet Propulsion Laboratory—Californica Institute of Technology SMAP—Soil Moisture Active Passive. Available online: https://smap.jpl.nasa.gov/ (accessed on 6 September 2023).
- Lehner, B.; Grill, G. Global River Hydrography and Network Routing: Baseline Data and New Approaches to Study the World’s Large River Systems. Hydrol. Process. 2013, 27, 2171–2186. [Google Scholar] [CrossRef]
- Messager, M.L.; Lehner, B.; Grill, G.; Nedeva, I.; Schmitt, O. Estimating the Volume and Age of Water Stored in Global Lakes Using a Geo-Statistical Approach. Nat. Commun. 2016, 7, 13603. [Google Scholar] [CrossRef]
- RGI Consortium Randolph Glacier Inventory—A Dataset of Global Glacier Outlines, Version 6. 2017. Available online: https://www.glims.org/RGI/ (accessed on 3 April 2023).
- Liu, Y.; Fang, Y.; Margulis, S.A. Spatiotemporal Distribution of Seasonal Snow Water Equivalent in High Mountain Asia from an 18-Year Landsat–MODIS Era Snow Reanalysis Dataset. Cryosphere Discuss. 2021, 15, 5261–5280. [Google Scholar] [CrossRef]
- Farinotti, D.; Round, V.; Huss, M.; Compagno, L.; Zekollari, H. Large Hydropower and Water-Storage Potential in Future Glacier-Free Basins. Nature 2019, 575, 341–344. [Google Scholar] [CrossRef]
- Millan, R.; Mouginot, J.; Rabatel, A.; Morlighem, M. Ice Velocity and Thickness of the World’s Glaciers. Nat. Geosci. 2022, 15, 124–129. [Google Scholar] [CrossRef]
- Hugonnet, R.; McNabb, R.; Berthier, E.; Menounos, B.; Nuth, C.; Girod, L.; Farinotti, D.; Huss, M.; Dussaillant, I.; Brun, F.; et al. Accelerated Global Glacier Mass Loss in the Early Twenty-First Century. Nature 2021, 592, 726–731. [Google Scholar] [CrossRef]
- Miles, E.; McCarthy, M.; Dehecq, A.; Kneib, M.; Fugger, S.; Pellicciotti, F. Health and Sustainability of Glaciers in High Mountain Asia. Nat. Commun. 2021, 12, 2868. [Google Scholar] [CrossRef] [PubMed]
- Rounce, D.R.; Hock, R.; Maussion, F.; Hugonnet, R.; Kochtitzky, W.; Huss, M.; Berthier, E.; Brinkerhoff, D.; Compagno, L.; Copland, L.; et al. Global Glacier Change in the 21st Century: Every Increase in Temperature Matters. Science 2023, 379, 78–83. [Google Scholar] [CrossRef] [PubMed]
- Simons, G.W.H.; Koster, R.; Droogers, P. HiHydroSoil v2.0—A High Resolution Soil Map of Global Hydraulic Properties. 2020. Available online: https://www.futurewater.eu/projects/hihydrosoil/ (accessed on 24 April 2023).
- Barbarossa, V.; Huijbregts, M.A.J.; Beusen, A.H.W.; Beck, H.E.; King, H.; Schipper, A.M. Data Descriptor: FLO1K, Global Maps of Mean, Maximum and Minimum Annual Streamflow at 1 Km Resolution from 1960 through 2015. Sci. Data 2018, 5, 180052. [Google Scholar] [CrossRef] [PubMed]
- Obu, J.; Westermann, S.; Kääb, A.; Bartsch, A. Ground Temperature Map, 2000–2016, Northern Hemisphere Permafrost. 2018. Available online: https://doi.org/10.1594/PANGAEA.888600 (accessed on 3 April 2023).
- Obu, J.; Westermann, S.; Bartsch, A.; Berdnikov, N.; Christiansen, H.H.; Dashtseren, A.; Delaloye, R.; Elberling, B.; Etzelmüller, B.; Kholodov, A.; et al. Northern Hemisphere Permafrost Map Based on TTOP Modelling for 2000–2016 at 1 Km2 Scale. Earth-Sci. Rev. 2019, 193, 299–316. [Google Scholar] [CrossRef]
- O’Neill, P.E.; Chan, S.; Njoku, E.G.; Jackson, T.; Bindlish, R.; Chaubell, J. Near Real-Time SMAP L2 Radiometer Half-Orbit 36 Km EASE-Grid Soil Moisture, Version 107. 2022. Available online: https://doi.org/10.5067/NCTT8THPWRTL (accessed on 6 September 2023).
- O’Neill, P.E.; Chan, S.; Njoku, E.G.; Jackson, T.; Bindlish, R.; Chaubell, J. SMAP L2 Radiometer Half-Orbit 36 Km EASE-Grid Soil Moisture, Version 8. 2021. Available online: https://nsidc.org/data/spl2smp/versions/8 (accessed on 3 April 2023).
- Alapfy, B.; Hayes, D.S.; Schwedhelm, H.; Ramos, I.; Zeiringer, B.; Coeck, J.; López, R.; Verhelst, P.; Rüther, N.; Siegfried, T.; et al. European Innovations in Kyrgyzstan: Development of the At-Bashy Small Hydro Project. In Proceedings of the Hydropower & Dams ASIA Conference, Kuala Lumpur, Malaysia, 14–16 March 2023; Aqua-Media International: Wallington, UK, 2023. [Google Scholar]
- Lehner, B. HydroSHEDS—Technical Documentation, Data Version 1.1; World Wildlife Fund US: Washington, DC, USA, 2022. [Google Scholar]
- Copernicus Climate Change Service—Climate Data Store Land Cover Classification Gridded Maps from 1992 to Present Derived from Satellite Observation. Copernicus Climate Change Service (C3S) Climate Data Store (CDS). 2019. Available online: https://doi.org/10.24381/cds.006f2c9a (accessed on 17 May 2023).
- Siqueira, P.P.; Oliveira, P.T.S.; Bressiani, D.; Meira Neto, A.A.; Rodrigues, D.B.B. Effects of Climate and Land Cover Changes on Water Availability in a Brazilian Cerrado Basin. J. Hydrol. Reg. Stud. 2021, 37, 100931. [Google Scholar] [CrossRef]
- Bhandari, A.; Joshi, R.; Thapa, M.S.; Sharma, R.P.; Rauniyar, S.K. Land Cover Change and Its Impact in Crop Yield: A Case Study from Western Nepal. Sci. World J. 2022, 2022, 5129423. [Google Scholar] [CrossRef]
- Mahmood, R.; Pielke, R.A.; Hubbard, K.G.; Niyogi, D.; Bonan, G.; Lawrence, P.; McNider, R.; McAlpine, C.; Etter, A.; Gameda, S.; et al. Impacts of Land Use/Land Cover Change on Climate and Future Research Priorities. Bull. Am. Meteorol. Soc. 2010, 91, 37–46. [Google Scholar] [CrossRef]
- Earth Resources Observation and Science (EROS) Center. USGS EROS Archive—Digital Elevation—Shuttle Radar Topography Mission (SRTM) 1 Arc-Second Global. 2018. Available online: https://www.usgs.gov/centers/eros/science/usgs-eros-archive-digital-elevation-shuttle-radar-topography-mission-srtm-1?qt-science_center_objects=0#overview (accessed on 4 April 2023).
- Lehner, B.; Verdin, K.; Jarvis, A. New Global Hydrography Derived From Spaceborne Elevation Data. Eos Trans. Am. Geophys. Union 2008, 89, 93. [Google Scholar] [CrossRef]
- Buchhorn, M.; Smets, B.; Bertels, L.; De Roo, B.; Lesiv, M.; Tsendbazar, N.-E.; Herold, M.; Fritz, S. Copernicus Global Land Service: Land Cover 100m: Collection 3: Epoch 2016: Globe. 2020. Available online: https://land.copernicus.eu/global/products/lc (accessed on 10 May 2023).
- Dhaubanjar, S.; Lutz, A.F.; Gernaat, D.E.H.J.; Nepal, S.; Smolenaars, W.; Pradhananga, S.; Biemans, H.; Ludwig, F.; Shrestha, A.B.; Immerzeel, W.W. A Systematic Framework for the Assessment of Sustainable Hydropower Potential in a River Basin—The Case of the Upper Indus. Sci. Total Environ. 2021, 786, 147142. [Google Scholar] [CrossRef]
- Hartmann, J.; Moosdorf, N. The New Global Lithological Map Database GLiM: A Representation of Rock Properties at the Earth Surface. Geochem. Geophys. Geosyst. 2012, 13. [Google Scholar] [CrossRef]
- Renard, K.G.; Foster, G.R.; Weesies, G.A.; Mccool, D.K.; Yoder, D.C. Predicting Soil Erosion by Water: A Guide to Conservation Planning with the Revised Universal Soil Loss Equation (RUSLE); US Department of Agriculture (USDA): Washington DC, USA, 1997; ISBN 0160489385. [Google Scholar]
- Moosdorf, N.; Hartmann, J. Lithological Map of the World. Scale 1:35 000 000. 1st Edition. 2015. Available online: https://www.dropbox.com/s/9vuowtebp9f1iud/LiMW_GIS2015.gdb.zip?dl=0 (accessed on 16 May 2023).
- Persits, F.M.; Ulmishek, G.F.; Steinshouer, D.W. Maps Showing Geology, Oil and Gas Fields and Geologic Provinces of the Former Soviet Union: U.S. Geological Survey Open-File Report 97-470-E: GIS Data 1999. Available online: https://doi.org/10.3133/ofr97470E (accessed on 5 May 2023).
- Borrelli, P.; Robinson, D.A.; Fleischer, L.R.; Lugato, E.; Ballabio, C.; Alewell, C.; Meusburger, K.; Modugno, S.; Schütt, B.; Ferro, V.; et al. An Assessment of the Global Impact of 21st Century Land Use Change on Soil Erosion. Nat. Commun. 2017, 8, 2013. [Google Scholar] [CrossRef] [PubMed]
- European Commission. J.R.C. European Soil Data Centre: Global Soil Erosion. 2019. Available online: https://esdac.jrc.ec.europa.eu/content/global-soil-erosion (accessed on 5 May 2023).
- The World Bank Global Landslide Hazard Map. 2021. Available online: https://datacatalog.worldbank.org/search/dataset/0037584 (accessed on 5 February 2023).
- Hayes, D.S.; Brändle, J.M.; Seliger, C.; Zeiringer, B.; Ferreira, T.; Schmutz, S. Advancing towards Functional Environmental Flows for Temperate Floodplain Rivers. Sci. Total Environ. 2018, 633, 1089–1104. [Google Scholar] [CrossRef]
- Böck, K.; Polt, R.; Schülting, L. Ecosystem Services in River Landscapes. In Riverine Ecosystem Management; Springer International Publishing: Cham, Switzerland, 2018; pp. 413–433. [Google Scholar]
- Lynch, A.J.; Cooke, S.J.; Arthington, A.H.; Baigun, C.; Bossenbroek, L.; Dickens, C.; Harrison, I.; Kimirei, I.; Langhans, S.D.; Murchie, K.J.; et al. People Need Freshwater Biodiversity. WIREs Water 2023, 10, e1633. [Google Scholar] [CrossRef]
- Tickner, D.; Opperman, J.J.; Abell, R.; Acreman, M.; Arthington, A.H.; Bunn, S.E.; Cooke, S.J.; Dalton, J.; Darwall, W.; Edwards, G.; et al. Bending the Curve of Global Freshwater Biodiversity Loss: An Emergency Recovery Plan. Bioscience 2020, 70, 330–342. [Google Scholar] [CrossRef]
- He, F.; Zarfl, C.; Bremerich, V.; David, J.N.W.; Hogan, Z.; Kalinkat, G.; Tockner, K.; Jähnig, S.C. The Global Decline of Freshwater Megafauna. Glob. Chang. Biol. 2019, 25, 3883–3892. [Google Scholar] [CrossRef]
- Hayes, D.S.; Schaufler, G.; Schmutz, S.; Unfer, G.; Führer, S.; Auer, S.; Seliger, C. Hydro-Morphological Stressors Reduce Distribution Range and Affect Population Status of Cyprinid Fishes in Austria. Front. Environ. Sci. 2022, 10, 991722. [Google Scholar] [CrossRef]
- Carolli, M.; Garcia de Leaniz, C.; Jones, J.; Belletti, B.; Huđek, H.; Pusch, M.; Pandakov, P.; Börger, L.; van de Bund, W. Impacts of Existing and Planned Hydropower Dams on River Fragmentation in the Balkan Region. Sci. Total Environ. 2023, 871, 161940. [Google Scholar] [CrossRef] [PubMed]
- Brooks, T.M.; Mittermeier, R.A.; da Fonseca, G.A.B.; Gerlach, J.; Hoffmann, M.; Lamoreux, J.F.; Mittermeier, C.G.; Pilgrim, J.D.; Rodrigues, A.S.L. Global Biodiversity Conservation Priorities. Science 2006, 313, 58–61. [Google Scholar] [CrossRef] [PubMed]
- Seliger, C.; Scheikl, S.; Schmutz, S.; Schinegger, R.; Fleck, S.; Neubarth, J.; Walder, C.; Muhar, S. Hy:Con: A Strategic Tool for Balancing Hydropower Development and Conservation Needs. River Res. Appl. 2016, 32, 1438–1449. [Google Scholar] [CrossRef]
- Scheikl, S.; Seliger, C.; Loach, A.; Preis, S.; Schinegger, R.; Walder, C.; Schmutz, S.; Muhar, S. Schutz Ökologisch Sensibler Fließgewässer: Konzepte Und Fallbeispiele. Osterr. Wasser Und Abfallwirtsch. 2016, 68, 288–300. [Google Scholar] [CrossRef]
- WWF/TNC Freshwater Ecoregions of the World—A Global Biogeographical Regionalization of the Earth’s Freshwater Biodiversity. Available online: http://www.feow.org (accessed on 3 May 2023).
- Groves, C.R.; Jensen, D.B.; Valutis, L.L.; Redford, K.H.; Shaffer, M.L.; Scott, J.M.; Baumgartner, J.V.; Higgins, J.V.; Beck, M.W.; Anderson, M.G. Planning for Biodiversity Conservation: Putting Conservation Science into Practice. Bioscience 2002, 52, 499–512. [Google Scholar] [CrossRef]
- Olson, D.M.; Dinerstein, E.; Wikramanayake, E.D.; Burgess, N.D.; Powell, G.V.N.; Underwood, E.C.; D’amico, J.A.; Itoua, I.; Strand, H.E.; Morrison, J.C.; et al. Terrestrial Ecoregions of the World: A New Map of Life on Earth: A New Global Map of Terrestrial Ecoregions Provides an Innovative Tool for Conserving Biodiversity. Bioscience 2001, 51, 933–938. [Google Scholar] [CrossRef]
- Spalding, M.D.; Fox, H.E.; Allen, G.R.; Davidson, N.; Ferdaña, Z.A.; Finlayson, M.; Halpern, B.S.; Jorge, M.A.; Lombana, A.; Lourie, S.A.; et al. Marine Ecoregions of the World: A Bioregionalization of Coastal and Shelf Areas. Bioscience 2007, 57, 573–583. [Google Scholar] [CrossRef]
- Higgins, J.V. Maintaining the Ebbs and Flows of the Landscape: Conservation Planning for Freshwater Ecosystems. In Drafting a Conservation Blueprint: A Practitioner’s Guide to Regional Planning for Biodiversity.; Groves, C., Ed.; Nature Conservancy and Island Press: Washington, DC, USA, 2003; pp. 291–318. [Google Scholar]
- Abell, R.A.; Olson, D.; Dinerstein, E.; Hurley, P.T. Freshwater Ecoregions of North America: A Conservation Assessment; Island Press: Washington, DC, USA, 2000. [Google Scholar]
- Thieme, M.L.; Abell, R.; Burgess, N.; World Wildlife Fund; Lehner, B.; Dinerstein, E.; Olsen, D.; Teugeln, G.; Kamdem-Toham, A.; Stiassny, M.L.J.; et al. Freshwater Ecoregions of Africa and Madagascar: A Conservation Assessment; Island Press: Washington, DC, USA, 2005. [Google Scholar]
- Gilman, R.T.; Abell, R.A.; Williams, C.E. How Can Conservation Biology Inform the Practice of Integrated River Basin Management? Int. J. River Basin Manag. 2004, 2, 135–148. [Google Scholar] [CrossRef]
- Abell, R.; Thieme, M.L.; Revenga, C.; Bryer, M.; Kottelat, M.; Bogutskaya, N.; Coad, B.; Mandrak, N.; Balderas, S.C.; Bussing, W.; et al. Freshwater Ecoregions of the World: A New Map of Biogeographic Units for Freshwater Biodiversity Conservation. Bioscience 2008, 58, 403–414. [Google Scholar] [CrossRef]
- Brito, J.G.; Martins, R.T.; Oliveira, V.C.; Hamada, N.; Nessimian, J.L.; Hughes, R.M.; Ferraz, S.F.B.; de Paula, F.R. Biological Indicators of Diversity in Tropical Streams: Congruence in the Similarity of Invertebrate Assemblages. Ecol. Indic. 2018, 85, 85–92. [Google Scholar] [CrossRef]
- Martins, R.T.; Brito, J.; Dias-Silva, K.; Leal, C.G.; Leitão, R.P.; Oliveira, V.C.; Oliveira-Júnior, J.M.B.; de Paula, F.R.; Roque, F.O.; Hamada, N.; et al. Congruence and Responsiveness in the Taxonomic Compositions of Amazonian Aquatic Macroinvertebrate and Fish Assemblages. Hydrobiologia 2022, 849, 2281–2298. [Google Scholar] [CrossRef]
- Schmidt-Kloiber, A.; Hering, D. Www.Freshwaterecology.Info—An Online Tool That Unifies, Standardises and Codifies More than 20,000 European Freshwater Organisms and Their Ecological Preferences. Ecol. Indic. 2015, 53, 271–282. [Google Scholar] [CrossRef]
- Lehner, B.; Liermann, C.R.; Revenga, C.; Vörösmarty, C.; Fekete, B.; Crouzet, P.; Döll, P.; Endejan, M.; Frenken, K.; Magome, J.; et al. High-resolution Mapping of the World’s Reservoirs and Dams for Sustainable River-flow Management. Front. Ecol. Environ. 2011, 9, 494–502. [Google Scholar] [CrossRef] [PubMed]
- Mulligan, M.; Saenz-Cruz, L.; van Soesbergen, A.; Smith, V.T.; Zurita, L. Global Dam Database and Geowiki v1. 2009. Available online: http://globaldamwatch.org/ (accessed on 2 May 2023).
- Grill, G.; Lehner, B. Mapping the World’s Free-Flowing Rivers: Data Set and Technical Documentation. Nature 2019, 569, 215–221. [Google Scholar] [CrossRef]
- European Commission. Council Directive 92/43/EEC of 21 May 1992 on the Conservation of Natural Habitats and of Wild Fauna and Flora (OJ L 206 22.07.1992 p. 7). In Documents in European Community Environmental Law; Cambridge University Press: Cambridge, UK, 2006; pp. 568–583. [Google Scholar]
- European Commission. Directive 2009/147/EC of the European Parliament and of the Council of 30 November 2009 on the Conservation of Wild Birds. OJ L 20, 26.1.2010. 2009, pp. 7–25. Available online: https://eur-lex.europa.eu/legal-content/EN/TXT/?uri=CELEX%3A32009L0147 (accessed on 2 May 2023).
- Metzger, M.J.; Bunce, R.G.H.; Jongman, R.H.G.; Sayre, R.; Trabucco, A.; Zomer, R. A High-Resolution Bioclimate Map of the World: A Unifying Framework for Global Biodiversity Research and Monitoring. Glob. Ecol. Biogeogr. 2013, 22, 630–638. [Google Scholar] [CrossRef]
- Metzger, M.J. The Global Environmental Stratification: A High-Resolution Bioclimate Map of the World. 2018. Available online: https://doi.org/10.7488/ds/2354 (accessed on 9 May 2023).
- IUCN. A Global Standard for the Identification of Key Biodiversity Areas. 2016. Available online: https://portals.iucn.org/library/node/46259 (accessed on 2 May 2023).
- IUCN (International Union for Conservation of Nature). The IUCN Red List of Threatened Species. 2022. Available online: https://www.iucnredlist.org (accessed on 2 May 2023).
- Grigoropoulou, A.; Hamid, S.A.; Acosta, R.; Akindele, E.O.; Al-Shami, S.A.; Altermatt, F.; Amatulli, G.; Angeler, D.G.; Arimoro, F.O.; Aroviita, J.; et al. The Global EPTO Database: Worldwide Occurrences of Aquatic Insects. Glob. Ecol. Biogeogr. 2023, 32, 642–655. [Google Scholar] [CrossRef]
- LPI Living Planet Index Database. 2022. Available online: https://www.livingplanetindex.org (accessed on 2 May 2023).
- Grill, G.; Lehner, B.; Thieme, M.; Geenen, B.; Tickner, D.; Antonelli, F.; Babu, S.; Borrelli, P.; Cheng, L.; Crochetiere, H.; et al. Mapping the World’s Free-Flowing Rivers. Nature 2019, 569, 215–221. [Google Scholar] [CrossRef]
- UNEP-WCMC and IUCN World Database on Protected Areas (WDPA). 2023. Available online: https://www.protectedplanet.net/en (accessed on 2 May 2023).
- Ramsar Ramsar Wetlands of International Importance. 2023. Available online: https://rsis.ramsar.org (accessed on 2 May 2023).
- Global Runoff Data Centre GRDC Major River Basins of the World. 2021. Available online: https://www.bafg.de/SharedDocs/ExterneLinks/GRDC/mrb_shp_zip.html?nn=201762 (accessed on 25 May 2023).
- Shi, H.; Luo, G.; Zheng, H.; Chen, C.; Hellwich, O.; Bai, J.; Liu, T.; Liu, S.; Xue, J.; Cai, P.; et al. A Novel Causal Structure-Based Framework for Comparing a Basin-Wide Water–Energy–Food–Ecology Nexus Applied to the Data-Limited Amu Darya and Syr Darya River Basins. Hydrol. Earth Syst. Sci. 2021, 25, 901–925. [Google Scholar] [CrossRef]
- Hayes, D.S.; Schülting, L.; Carolli, M.; Greimel, F.; Batalla, R.J.; Casas-Mulet, R. Hydropeaking: Processes, Effects, and Mitigation. In Encyclopedia of Inland Waters; Elsevier: Amsterdam, The Netherlands, 2022; pp. 134–149. [Google Scholar]
- Black, N.; Coast, S. Geodata Collection in the 21st Century. Bull. Soc. Univ. Cartogr. 2006, 40, 3–8. [Google Scholar]
- Dankova, R.; Burton, M.; Salman, M.; Clark, A.K.; Pek, E. Modernizing Irrigation in Central Asia: Concept and Approaches. Directions in Investment, No. 6; FAO: Rome, Italy; World Bank: Rome, Italy, 2022. [Google Scholar]
- Food and Argiculture Organ Organization of the United Nations (FAO). AQUASTAT Crop Water Information. Available online: https://www.fao.org/land-water/databases-and-software/crop-information (accessed on 20 May 2023).
- Gupta, R.; Shankar, H.; Venkata, A.T.Y. Global Energy Observatory (GEO)—List of Hydro PowerPlants. Available online: https://globalenergyobservatory.org/list.php?db=PowerPlants&type=Hydro (accessed on 19 May 2023).
- Mulligan, M.; van Soesbergen, A.; Sáenz, L. GOODD, a Global Dataset of More than 38,000 Georeferenced Dams. Sci. Data 2020, 7, 31. [Google Scholar] [CrossRef]
- OpenStreetMap Contributors. 2015. Available online: https://planet.openstreetmap.org (accessed on 20 November 2022).
- Sacks, W.J.; Deryng, D.; Foley, J.A.; Ramankutty, N. Crop Planting Dates: An Analysis of Global Patterns. Glob. Ecol. Biogeogr. 2010, 19, 607–620. [Google Scholar] [CrossRef]
- Sacks, W.J.; Deryng, D.; Foley, J.A.; Ramankutty, N. Crop Calendar Dataset. 2010. Available online: https://sage.nelson.wisc.edu/data-and-models/datasets/crop-calendar-dataset/ (accessed on 21 June 2023).
- Mapspam Spatial Production Allocation Model. Available online: https://mapspam.info/ (accessed on 19 February 2023).
- FAO; IIASA; ISRIC-World Soil Information; Institute of Soil Science; Chinese Academy of Science (ISSCAS); Joint Research Centre of the European Commission (JRC). Harmonized World Soil Database v 1.2. 2009. Available online: https://www.fao.org/soils-portal/data-hub/soil-maps-and-databases/harmonized-world-soil-database-v12/en/ (accessed on 19 May 2023).
- Center for International Earth Science Information Network—CIESIN—Columbia University Gridded Population of the World, Version 4 (GPWv4): Population Count, Revision 11. Available online: https://sedac.ciesin.columbia.edu/data/set/gpw-v4-population-count-rev11 (accessed on 19 May 2023).
- UNDP (United Nations Development Programme). Human Development Report 2021/2022. 2022. Available online: https://hdr.undp.org/data-center/documentation-and-downloads (accessed on 19 May 2023).
- Oweis, T.; Hachum, A.; Pala, M. Lentil Production under Supplemental Irrigation in a Mediterranean Environment. Agric. Water Manag. 2004, 68, 251–265. [Google Scholar] [CrossRef]
- Mohamoud, M.; Abdalla, A.; Elhag, M.; Yousif, L. Estimation of Water Requirement and Water Productivity of Sesame Crop (Sesamum Indicum L.) in Dryland Areas of Sennar State, Sudan. Sudan J. Desertif. Res. 2019, 11, 1–16. [Google Scholar]
- Torres, R.R.; Robaina, A.D.; Peiter, M.X.; Ben, L.H.B.; Mezzomo, W.; Kirchner, J.H.; Rosso, R.B.; Pimenta, B.D.; Pereira, A.C.; Loregian, M.V. Water Productivity and Production Function in Irrigated Millet Crop. Semin. Ciências Agrárias 2019, 40, 2837. [Google Scholar] [CrossRef]
- HydroSHEDS V2. Available online: https://www.hydrosheds.org/hydrosheds-v2 (accessed on 25 May 2023).
- CNES SWOT—A Promising Hydrology and Oceanography Mission. Available online: https://swot.cnes.fr/en/SWOT/index.htm (accessed on 22 May 2023).
- Ragettli, S.; Donauer, T.; Molnar, P.; Delnoije, R.; Siegfried, T. Unraveling the Hydrology and Sediment Balance of an Ungauged Lake in the Sudano-Sahelian Region of West Africa Using Remote Sensing. Earth Surf. Dyn. 2022, 10, 797–815. [Google Scholar] [CrossRef]
- Boothroyd, R.J.; Williams, R.D.; Hoey, T.B.; Barrett, B.; Prasojo, O.A. Applications of Google Earth Engine in Fluvial Geomorphology for Detecting River Channel Change. WIREs Water 2021, 8, e21496. [Google Scholar] [CrossRef]
- Cruz, R.C.; Reis Costa, P.; Vinga, S.; Krippahl, L.; Lopes, M.B. A Review of Recent Machine Learning Advances for Forecasting Harmful Algal Blooms and Shellfish Contamination. J. Mar. Sci. Eng. 2021, 9, 283. [Google Scholar] [CrossRef]
- Elbeltagi, A.; Srivastava, A.; Deng, J.; Li, Z.; Raza, A.; Khadke, L.; Yu, Z.; El-Rawy, M. Forecasting Vapor Pressure Deficit for Agricultural Water Management Using Machine Learning in Semi-Arid Environments. Agric. Water Manag. 2023, 283, 108302. [Google Scholar] [CrossRef]
- Chakraborty, M.; Sarkar, S.; Mukherjee, A.; Shamsudduha, M.; Ahmed, K.M.; Bhattacharya, A.; Mitra, A. Modeling Regional-Scale Groundwater Arsenic Hazard in the Transboundary Ganges River Delta, India and Bangladesh: Infusing Physically-Based Model with Machine Learning. Sci. Total Environ. 2020, 748, 141107. [Google Scholar] [CrossRef]
- Zhu, M.; Wang, J.; Yang, X.; Zhang, Y.; Zhang, L.; Ren, H.; Wu, B.; Ye, L. A Review of the Application of Machine Learning in Water Quality Evaluation. Eco-Environ. Health 2022, 1, 107–116. [Google Scholar] [CrossRef]
- Shirvani-Hosseini, S.; Samadi-Koucheksaraee, A.; Ahmadianfar, I.; Gharabaghi, B. Data Mining Methods for Modeling in Water Science. In Computational Intelligence for Water and Environmental Sciences; Springer Nature: Singapore, 2022; pp. 157–178. [Google Scholar]
- Meyer, H.; Pebesma, E. Machine Learning-Based Global Maps of Ecological Variables and the Challenge of Assessing Them. Nat. Commun. 2022, 13, 2208. [Google Scholar] [CrossRef]
- Ho, L.; Goethals, P. Machine Learning Applications in River Research: Trends, Opportunities and Challenges. Methods Ecol. Evol. 2022, 13, 2603–2621. [Google Scholar] [CrossRef]
- Hydrosolutions Count4D: A Web Application for Efficient Irrigation and Water Resources Management. Available online: https://www.hydrosolutions.ch/projects/count4d-a-web-application-for-efficient-irrigation-and-water-resources-management (accessed on 25 May 2023).
- Tilmant, A. Hydropower and the Water-Energy-Food Nexus. In The Zambezi River Basin; Routledge: New York, NY, USA, 2017; pp. 82–101. [Google Scholar]
- Sabyrbekov, R.; Overland, I.; Vakulchuk, R. Climate Change in Central Asia; Sabyrbekov, R., Overland, I., Vakulchuk, R., Eds.; SpringerBriefs in Climate Studies; Springer Nature: Cham, Switzerland, 2023; ISBN 978-3-031-29830-1. [Google Scholar]
- Zeng, R.; Cai, X.; Ringler, C.; Zhu, T. Hydropower versus Irrigation—An Analysis of Global Patterns. Environ. Res. Lett. 2017, 12, 034006. [Google Scholar] [CrossRef]
- Hayes, D.S.; Lautsch, E.; Unfer, G.; Greimel, F.; Zeiringer, B.; Höller, N.; Schmutz, S. Response of European Grayling, Thymallus Thymallus, to Multiple Stressors in Hydropeaking Rivers. J. Environ. Manage. 2021, 292, 112737. [Google Scholar] [CrossRef]
- Azimov, U.; Avezova, N. Sustainable Small-Scale Hydropower Solutions in Central Asian Countries for Local and Cross-Border Energy/Water Supply. Renew. Sustain. Energy Rev. 2022, 167, 112726. [Google Scholar] [CrossRef]
- Jorde, K.; Alapfy, B.; Schwelhelm, H.; Siegfried, T.; Habersack, H.; De Keyser, J.; Anarbekov, O. EU Supports Small Hydropower in Central Asia. Int. J. Hydropower Dams 2022, 29, 52–59. [Google Scholar]
- Tripathy, P.; Malladi, T. Global Flood Mapper: Democratising Open EO Resources for Flood Mapping. In Proceedings of the EGU General Assembly 2021, online, 19–30 April 2021. [Google Scholar]
- Seliger, C.; Scheikl, S.; Schmutz, S.; Schinegger, R.; Fleck, S.; Neubarth, J.; Walder, C.; Muhar, S. Note: Hy:Con: A Strategic Tool for Balancing Hydropower Development and Conservation Needs. River Res. Appl. 2017, 33, 276. [Google Scholar] [CrossRef]
- Xu, R.; Zeng, Z.; Pan, M.; Ziegler, A.; Holden, J.; Spracklen, D.; Brown, L.; He, X.; Chen, D.; Bin, Y.; et al. A Global-Scale Framework for Hydropower Development Incorporating Strict Environmental Constraints. Nat. Water 2023, 1, 113–122. [Google Scholar] [CrossRef]


| Background | Main Institutions * | Role in the Project | n | WFEC Nexus Expertise |
|---|---|---|---|---|
| Engineering | TUM, BOKU, ILF, SJE, | Hydropower planning and construction, analysis of hydropower potential | 14 | Energy |
| Hydrology | HSOL | Modelling of water resources and climate change effects | 2 | Water (hydrology), climate |
| Ecology | BOKU, TIIAME, EV-INBO | Fish biodiversity and ecology assessments | 9 | Water (ecology) |
| Water and land resources management | IWMI | Cross-border WFEC Nexus analyses with a focus on agricultural aspects | 3 | Food, water (management) |
| Spatial analysis | CARTIF, IWMI | Benefits and trade-off analyses in the context of the WFEC Nexus | 7 | Nexus modelling |
Disclaimer/Publisher’s Note: The statements, opinions and data contained in all publications are solely those of the individual author(s) and contributor(s) and not of MDPI and/or the editor(s). MDPI and/or the editor(s) disclaim responsibility for any injury to people or property resulting from any ideas, methods, instructions or products referred to in the content. |
© 2023 by the authors. Licensee MDPI, Basel, Switzerland. This article is an open access article distributed under the terms and conditions of the Creative Commons Attribution (CC BY) license (https://creativecommons.org/licenses/by/4.0/).
Share and Cite
De Keyser, J.; Hayes, D.S.; Marti, B.; Siegfried, T.; Seliger, C.; Schwedhelm, H.; Anarbekov, O.; Gafurov, Z.; López Fernández, R.M.; Ramos Diez, I.; et al. Integrating Open-Source Datasets to Analyze the Transboundary Water–Food–Energy–Climate Nexus in Central Asia. Water 2023, 15, 3482. https://doi.org/10.3390/w15193482
De Keyser J, Hayes DS, Marti B, Siegfried T, Seliger C, Schwedhelm H, Anarbekov O, Gafurov Z, López Fernández RM, Ramos Diez I, et al. Integrating Open-Source Datasets to Analyze the Transboundary Water–Food–Energy–Climate Nexus in Central Asia. Water. 2023; 15(19):3482. https://doi.org/10.3390/w15193482
Chicago/Turabian StyleDe Keyser, Jan, Daniel S. Hayes, Beatrice Marti, Tobias Siegfried, Carina Seliger, Hannah Schwedhelm, Oyture Anarbekov, Zafar Gafurov, Raquel M. López Fernández, Ivan Ramos Diez, and et al. 2023. "Integrating Open-Source Datasets to Analyze the Transboundary Water–Food–Energy–Climate Nexus in Central Asia" Water 15, no. 19: 3482. https://doi.org/10.3390/w15193482