
Effectiveness of a Dam-Breach Flood Alert in Mitigating Life Losses: A Spatiotemporal Sectorisation Analysis in a High-Density Urban Area in Brazil

1
Postgraduate Program in Sanitation, Environment and Water Resources, Federal University of Minas Gerais, Belo Horizonte 31270-901, Minas Gerais, Brazil
2
Department of Hydraulic and Water Resources Engineering, Federal University of Minas Gerais, Belo Horizonte 31270-901, Minas Gerais, Brazil
*
Author to whom correspondence should be addressed.
Water 2023, 15(19), 3433; https://doi.org/10.3390/w15193433
Submission received: 29 July 2023
/
Revised: 28 August 2023
/
Accepted: 26 September 2023
/
Published: 29 September 2023
(This article belongs to the Special Issue Advances in Dam-Break Modeling for Flood Hazard Mitigation: Theory, Numerical Models, and Applications in Hydraulic Engineering)
Abstract
:The integration of early warning and evacuation systems (EWES) with estimations for mitigating the loss of life in flood risk assessments marks an advancement towards developing robust emergency action plans for dam breaks. Through the simulation of diverse EWES scenarios, the impact of these systems, coupled with community preparedness, on minimising the potential for loss of life could be calculated. This study was conducted in the theoretical context of a dam break located upstream from a densely populated urban region in Brazil. Hydrodynamic and agent-based models were utilised to estimate potential loss of life across various scenarios and simulations. The Monte Carlo approach, in combination with the LifeSim model, was applied to assess how factors such as warning issuance timing, evacuation strategies and community responses impact the model’s outcomes. Sensitivity analysis was performed considering the overall exposed area and specific areas at risk for different spatiotemporal EWES strategies. The results of simulations highlighted the EWES’ great potential for risk mitigation and displayed optimal times for warning issuance. The warning diffusion and the protective action initiation parameters proved crucial for improving EWES. The spatiotemporal sectorisation of the alert and evacuation was also an effective strategy to optimise EWES. This methodology should allow for further similar tests and incite EWES improvements based on consistent loss of life alleviation simulations.
1. Introduction
Dams located upstream of urban areas present a substantial risk, primarily attributed to the large volume and velocities of water involved in the possibility of a flood event triggered by their failure [1,2]. The high level of vulnerability and exposure in urbanised downstream valleys intensifies this risk [3,4,5]. Loss of life (LOL) is considered the most severe consequence of floods. This consequence carries significant weight due to its objective quantifiability and crucial role in shaping the public perception of disasters [6]. From 1998 to 2017, of 7000 recorded disasters worldwide 43% were attributed to flood events. These floods resulted in damages exceeding USD 650 billion, affecting over 2 billion people and causing over 142,000 fatalities [7].
The frequency of floods is increasing on a global scale, along with the number of people affected and the incurred fatalities [8]. However, the number of people impacted and fatalities per event show a decreasing trend [9,10]. This indicates advancements in flood risk management and assessment, which is crucial for decision-making in risk mitigation, including resource allocation for structural or non-structural measures [11,12].
Early warning and evacuation systems (EWES) are essential in minimising LOL during disasters. By providing anticipated alerts and facilitating organised evacuations, these systems play a vital role in mitigating the risk of casualties [13,14]. Different emergency management interventions during the 1953 flood in Canvey Island demonstrated the potential to mitigate LOL [15]. Studies conducted on the 2019 Brumadinho tailings dam failure in Brazil, which led to over 260 fatalities and extensive damages [16], highlight the potential benefits of early warning systems and population preparedness. According to Lumbroso et al. [17], loss of life could have been entirely avoided if an EWES was efficiently implemented with a projected alert time of 15 min and a well-prepared population. Similarly, the floods experienced in Germany in July 2021, resulting in more than 180 fatalities, underscore the importance of implementing operational forecasting models to enhance warning systems and facilitate an adequate response from the affected population [14,18]. In contrast, a study conducted over another tailings dam breach that occurred in Brazil in 2007 revealed that if no warning and evacuation had been implemented, fatalities would probably have been another consequence of the accident [19].
Hence, LOL and EWES analyses effectively evaluate flood risks, ensure the integrity of safety structures and facilitate comprehensive emergency planning [20,21]. Numerous models for estimating life losses have been developed since the 1970s [20,22,23,24,25,26,27,28,29,30]. Generally, according to Jonkman et al. [28], the estimation of life losses in these models is determined by three main factors: the number of people potentially at risk, the effectiveness of evacuation and shelter strategies to determine the number of people exposed to the event and the estimation of the exposure/fatality rate (Equation (1)).
where is the estimate LOL; is the fatality rate; is the evacuation rate; and is the number of people at risk.
Models for estimating life losses are classified as empirical, which relates population mortality solely to event characteristics, and mechanistic (agent-based), which provides a more detailed simulation of the flood, allowing for modelling individual behaviour and causes of fatality [31]. Empirical models are mainly suitable for preliminary and rapid estimation. Agent-based models are recommended when the simulation is conducted to support decision-making processes and assist in selecting measures to reduce the potential impacts of flooding [32].
Among the models currently available, only the Life Safety Model [27] and LifeSim [26] are built on agent-based principles, which allow for dynamic analyses. HEC-LifeSim 1.0.1 software fully incorporates the agent-based LifeSim model [33]. This model stands out as one of the most up-to-date and comprehensive for the proposed purposes, widely used in North American consulting and insurance companies [34]. It has also been applied in various studies [19,35,36,37,38,39,40,41,42], and its application is growing in different countries (Australia, Brazil, Morocco and Switzerland). However, it still presents some obstacles due to the need for a large quantity and quality of input data [43]. The model is structured through a modular modelling system, where modules exchange information through a database with multiple layers and tables of geographic information systems. The model has a probabilistic approach via Monte Carlo analysis and consists of four main modules: the flood-routine module (FRM), which includes a network representing flood characteristics throughout the area and time; the shelter loss module (SLM), which simulates the exposure of individuals in buildings during each event as a result of structural damages and submersion criteria; the warning and evacuation module (WEM), which simulates the distribution and dynamics of the population at risk after the issuance of the alert; and the loss of life module (LLM), which estimates the losses through probability distributions obtained from a set of historical flood events [44,45].
A significant advantage of applying these models, which has been little explored in the literature, is the ability to measure, in advance, the efficiency of alert and evacuation systems with different characteristics, such as the decision-making process of stakeholders involved in hazard identification and warning issuance [46], the mechanisms of warning dissemination and their influence [47,48], as well as the preparedness and prior knowledge of the population regarding mobilisation and evacuation to safe places [49,50]. The spatial and temporal sectorisation of alerts and evacuations adapting the system to the specific characteristics of each sector can bring significant benefits in terms of system efficiency [51,52,53].
Although some studies developed a LOL analysis related to different EWES scenarios, the sectorisation of flood warning and evacuation throughout LOL simulation is still unexplored in the literature. Additionally, uncertainty analyses related to different EWES scenarios are rare [15,17,19]. Especially for highly urbanised areas, if simultaneous alert and evacuation procedures are deployed for significant populations, traffic problems and specific population behaviour characteristics may compromise evacuation, which cannot be appropriately analysed without a sectorisation approach. Therefore, this article aims to explore the potential for enhancing the effectiveness of alert systems through the sectorisation of alerts and evacuations based on the spatial and temporal characteristics of land use and occupancy in the downstream valley. In order to achieve this objective, the hypothetical failure of the Pampulha Lake water dam (Brazil), located upstream of a high-density urban area, is analysed for different alert and evacuation scenarios.
2. Case Study
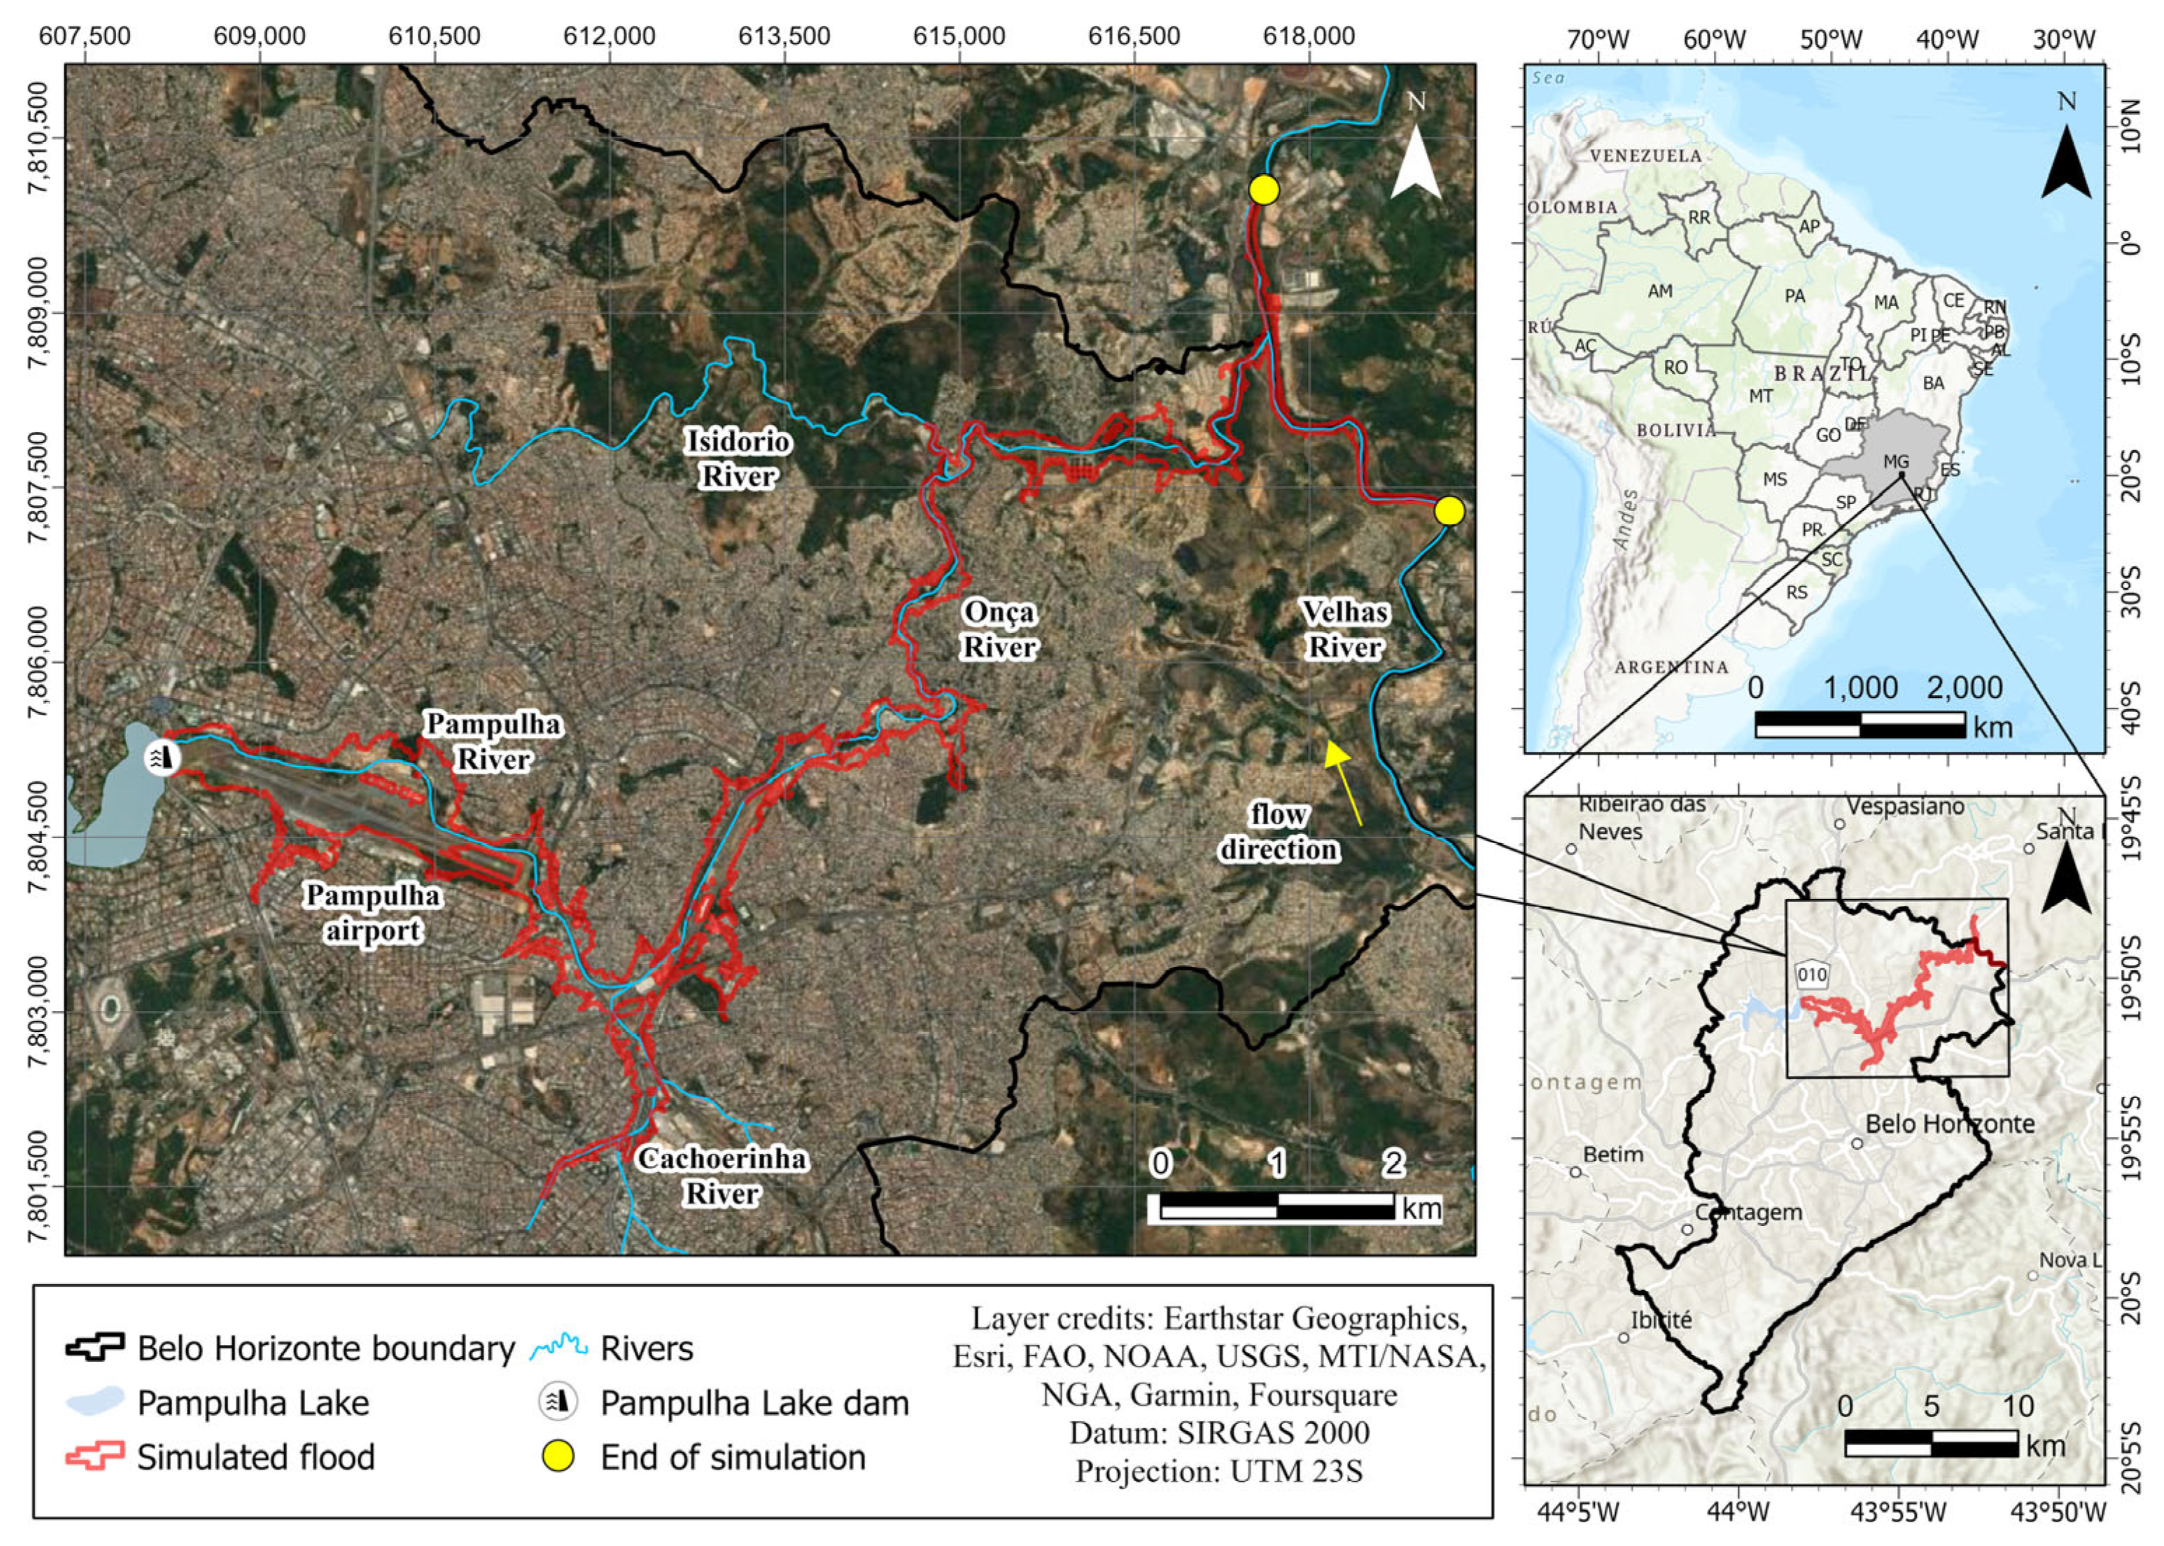
As a case study, the hypothetical failure of the Pampulha Lake Dam (PL.Dam) and its potential LOL were selected for different EWES approaches in its high-density downstream valley, situated in Belo Horizonte City, the State of Minas Gerais, Brazil (Figure 1). The area is highly populated, accounting for around 13,381 people potentially exposed to the dam-break flood risk.
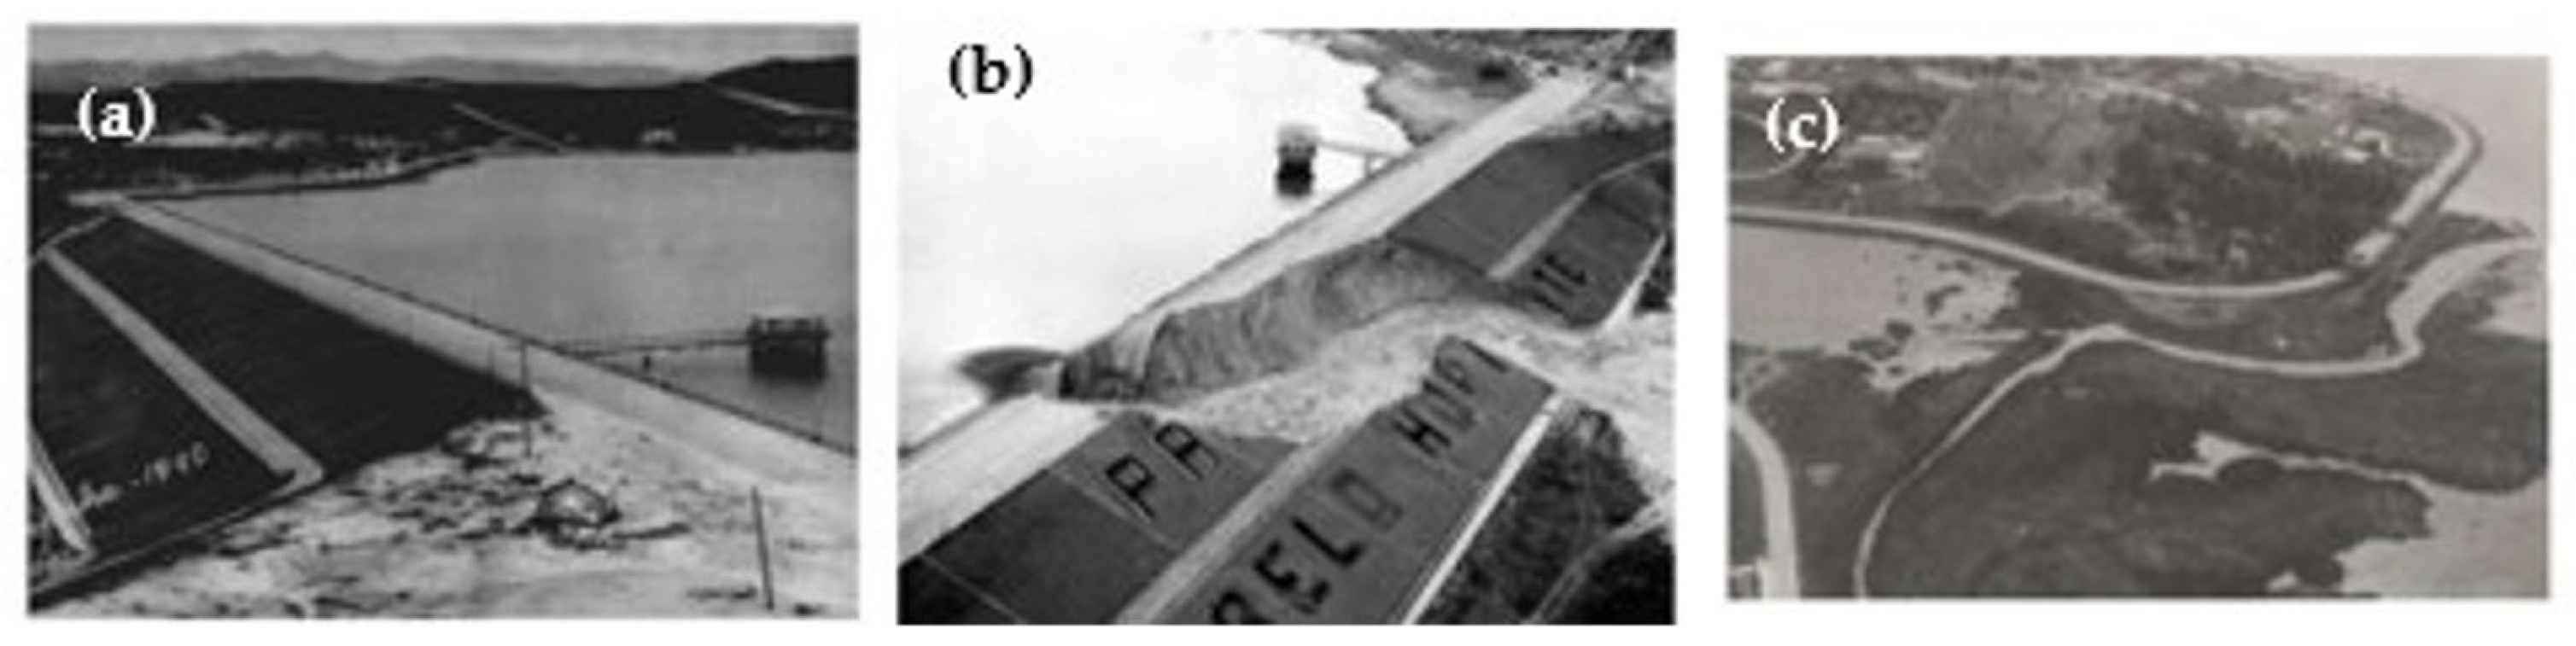
The PL.Dam collapsed in 1954 because of internal erosion (piping) caused by inadequate positioning of its drains, resulting in the gradual water flow from the reservoir over the downstream floodplain (Figure 2). It led to limited economic losses, as the valley had few urban developments at that time. Four years after the accident, the dam was reconstructed with new configurations for the overflow system and currently has a capacity of 20 hm3 [54].
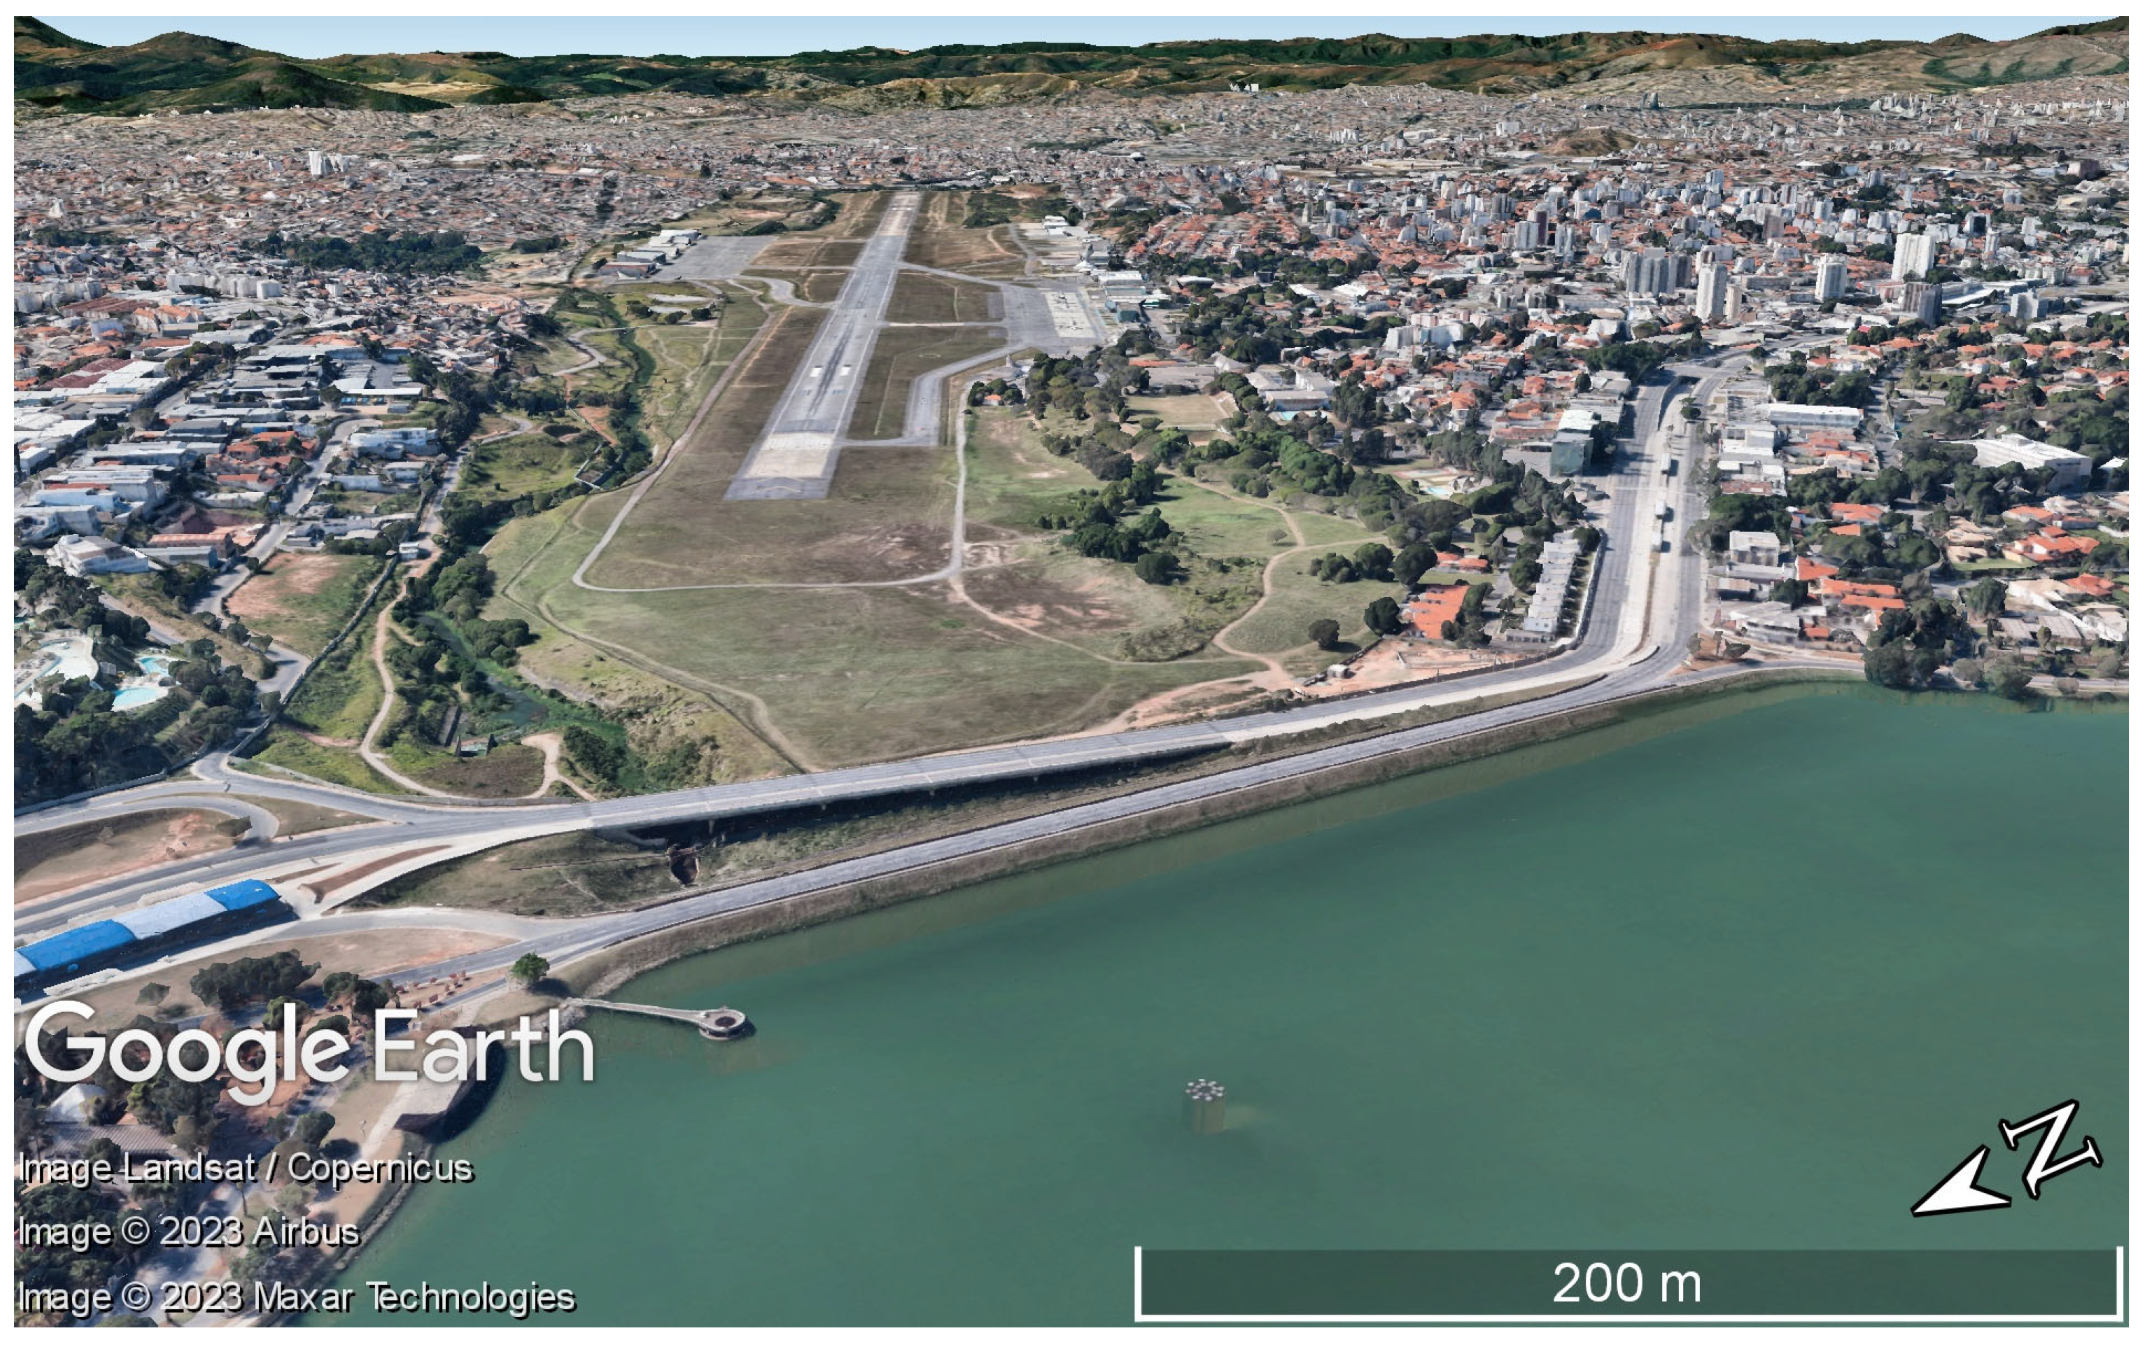
A local study created hydrodynamic simulations aiming to represent the 1954 accident [54]. This study also gathered current dam information, which is more relevant for the purpose of this article. As the conditions are entirely different, we highlight that this article does not intend to match the real flood event or its consequences, considering only the current risk situation. Currently, the dam serves the functions of sediment containment, landscape enhancement and flood control, and the downstream valley has had a high urbanisation rate since then (Figure 3).
The maximum height of the dam is 20 m, with a crest at an elevation of 805 m. It has a width of 20 m and a length of 450 m. The spillway system consists of a linear overflow of the side channel type. Additionally, there is an auxiliary tulip overflow [54]. The contributing basin upstream of its reservoir spans an area of 98.3 km2 [54]. This basin exhibits a pronounced level of urbanisation, closely accompanied by a significant presence of sanitation-related issues. These challenges, in turn, contribute to water quality degradation within the Pampulha Lake [55].
3. Materials and Methods
In order to understand the spatiotemporal effect of alerts and mobilisation, the analyses developed have two main goals: to estimate uncertainty in flood alert and mobilisation times in relation to land use, event time occurrence and anticipation; and to elucidate if alert sectorisation could improve LOL alleviation from the perspective of organising mobilisation according to spatiotemporal event characteristics. From this perspective, the HEC-LifeSim model [33] is used for examining the potential effectiveness of different sectorised and non-sectorised alert and evacuation systems adapted to dam-failure floods.
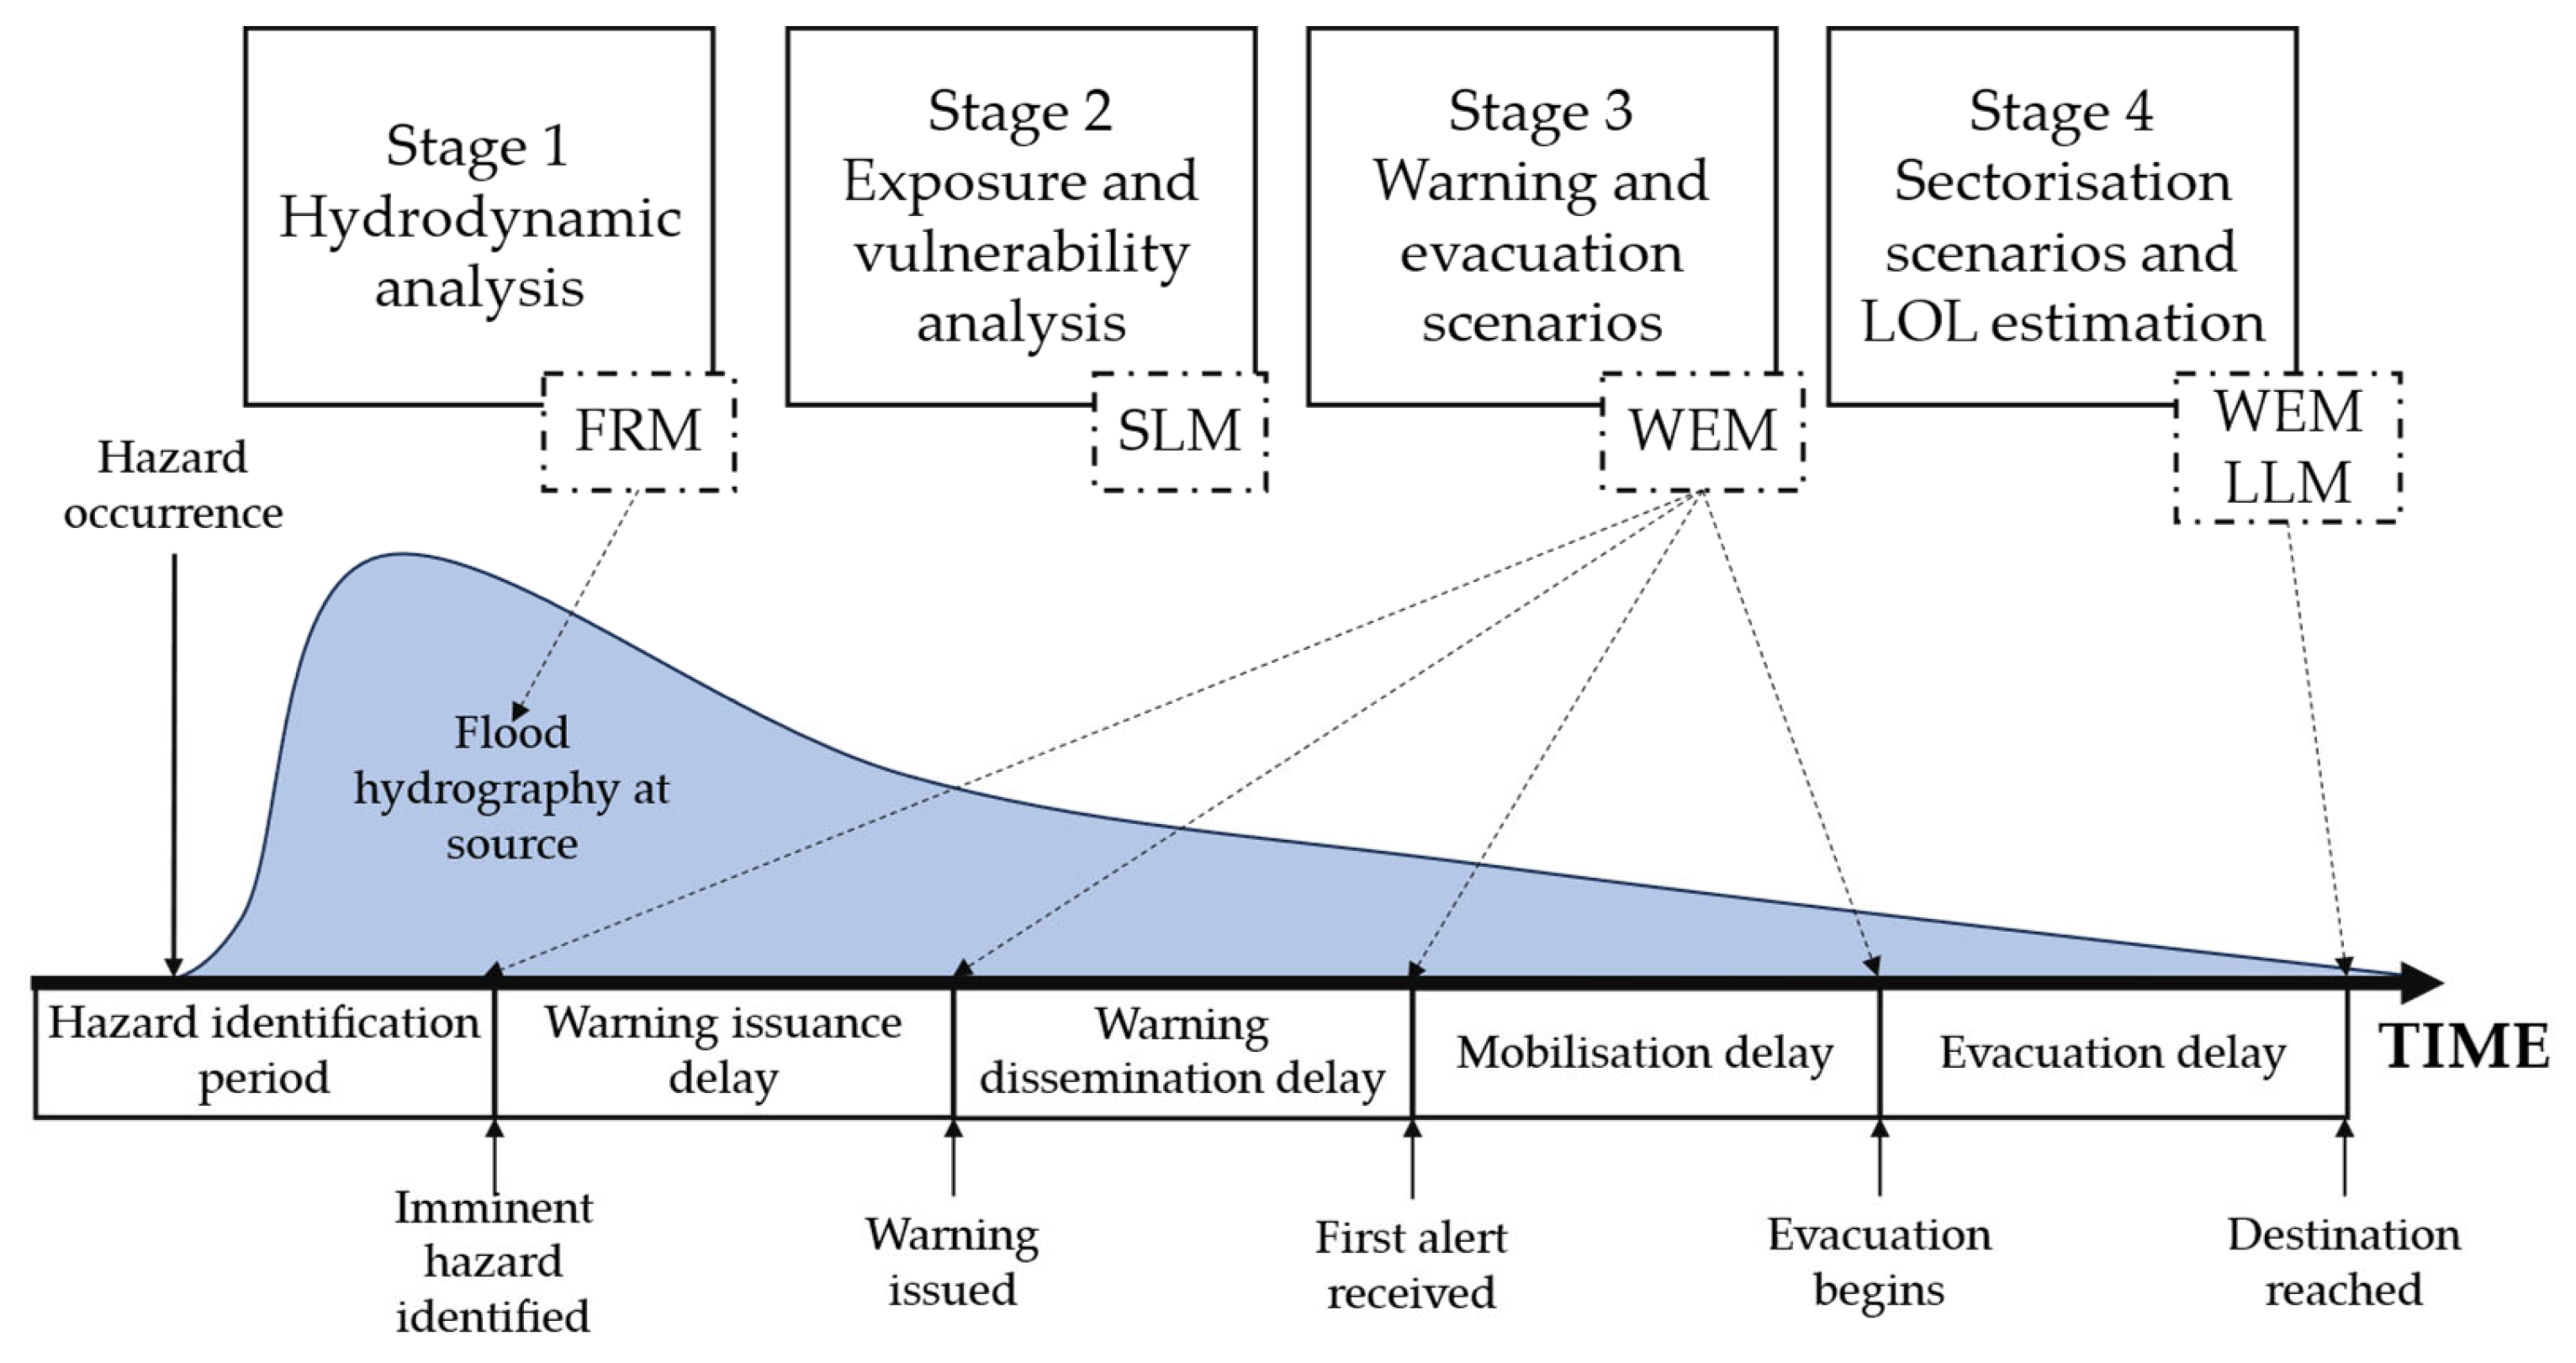
The probabilistic and agent-based simulations in HEC-LifeSim, encompassing its four main modules (flood routine module—FRM; shelter module—SLM; warning and evacuation module—WEM; and loss of life module—LLM), adhere to the timeline for individuals exposed to the flood event (Figure 4). Commencing when the imminent threat is identified, the timeline encompasses the first delay associated with the necessary time to issue the warning. Subsequently, the timeline extends until the agent reaches a safe location.
In order to achieve the goals of this article, the development of the proposed analyses is based on the implementation of the different modules of the HEC-LifeSim model, which is organised in this article into four stages (Figure 4): (1) evaluation of potential flood dynamics; (2) analysis of exposure and vulnerability in the affected area; (3) development of alert and mobilisation scenarios in order to estimate uncertainty related to EWES; and (4) development of specific alert and evacuation spatiotemporal scenarios based on the sectorisation of the EWES. Hence, the analysis of the effectiveness of the warning system in terms of LOL alleviation potential is achieved for the different tested scenarios.
The application of the presented methodological stages (Figure 4) in the PL.Dam is detailed in the following sections of this article.
3.1. Dynamic Flood Evaluation
The purpose of simulating the flood is solely to determine one specific hypothetical hazardous scenario for enabling LOL analysis and the evaluation of uncertainty and EWES efficiency under different scenarios. Therefore, the analysis of flood dynamics followed the basic premises for a deterministic dam-breach flood analysis [56].
Based on the dam description (Table 1), a piping breach simulation was performed to generate a flood hydrograph, according to Froehlich [57]. A sunny day scenario was considered, taking into account a trigger in the elevation corresponding to the normal operation of the reservoir. Consequently, the influence of the dam spillway system was not considered in this particular case.
The flood wave propagation through the valley was simulated through solving shallow water equations via the Eulerian-Lagrangian method implemented in the HEC-RAS 6.4 model [58], considering two-dimensional flow. The digital elevation model, with a resolution of one metre and derived from publicly accessible data (https://bhmap.pbh.gov.br, accessed on 25 July 2023), was used in the study, incorporating necessary modifications to address potential flow limitations caused by singularities. The Manning coefficient of 0.2 was applied to building areas, locations with steep slopes, and immediately downstream of the dam. In contrast, a coefficient of 0.1 was employed for the remaining areas [58]. Upstream conditions accounted for the dam breach outflow hydrograph, while downstream conditions considered the normal depth and average flow during the wet season in the Velhas River (Figure 1).
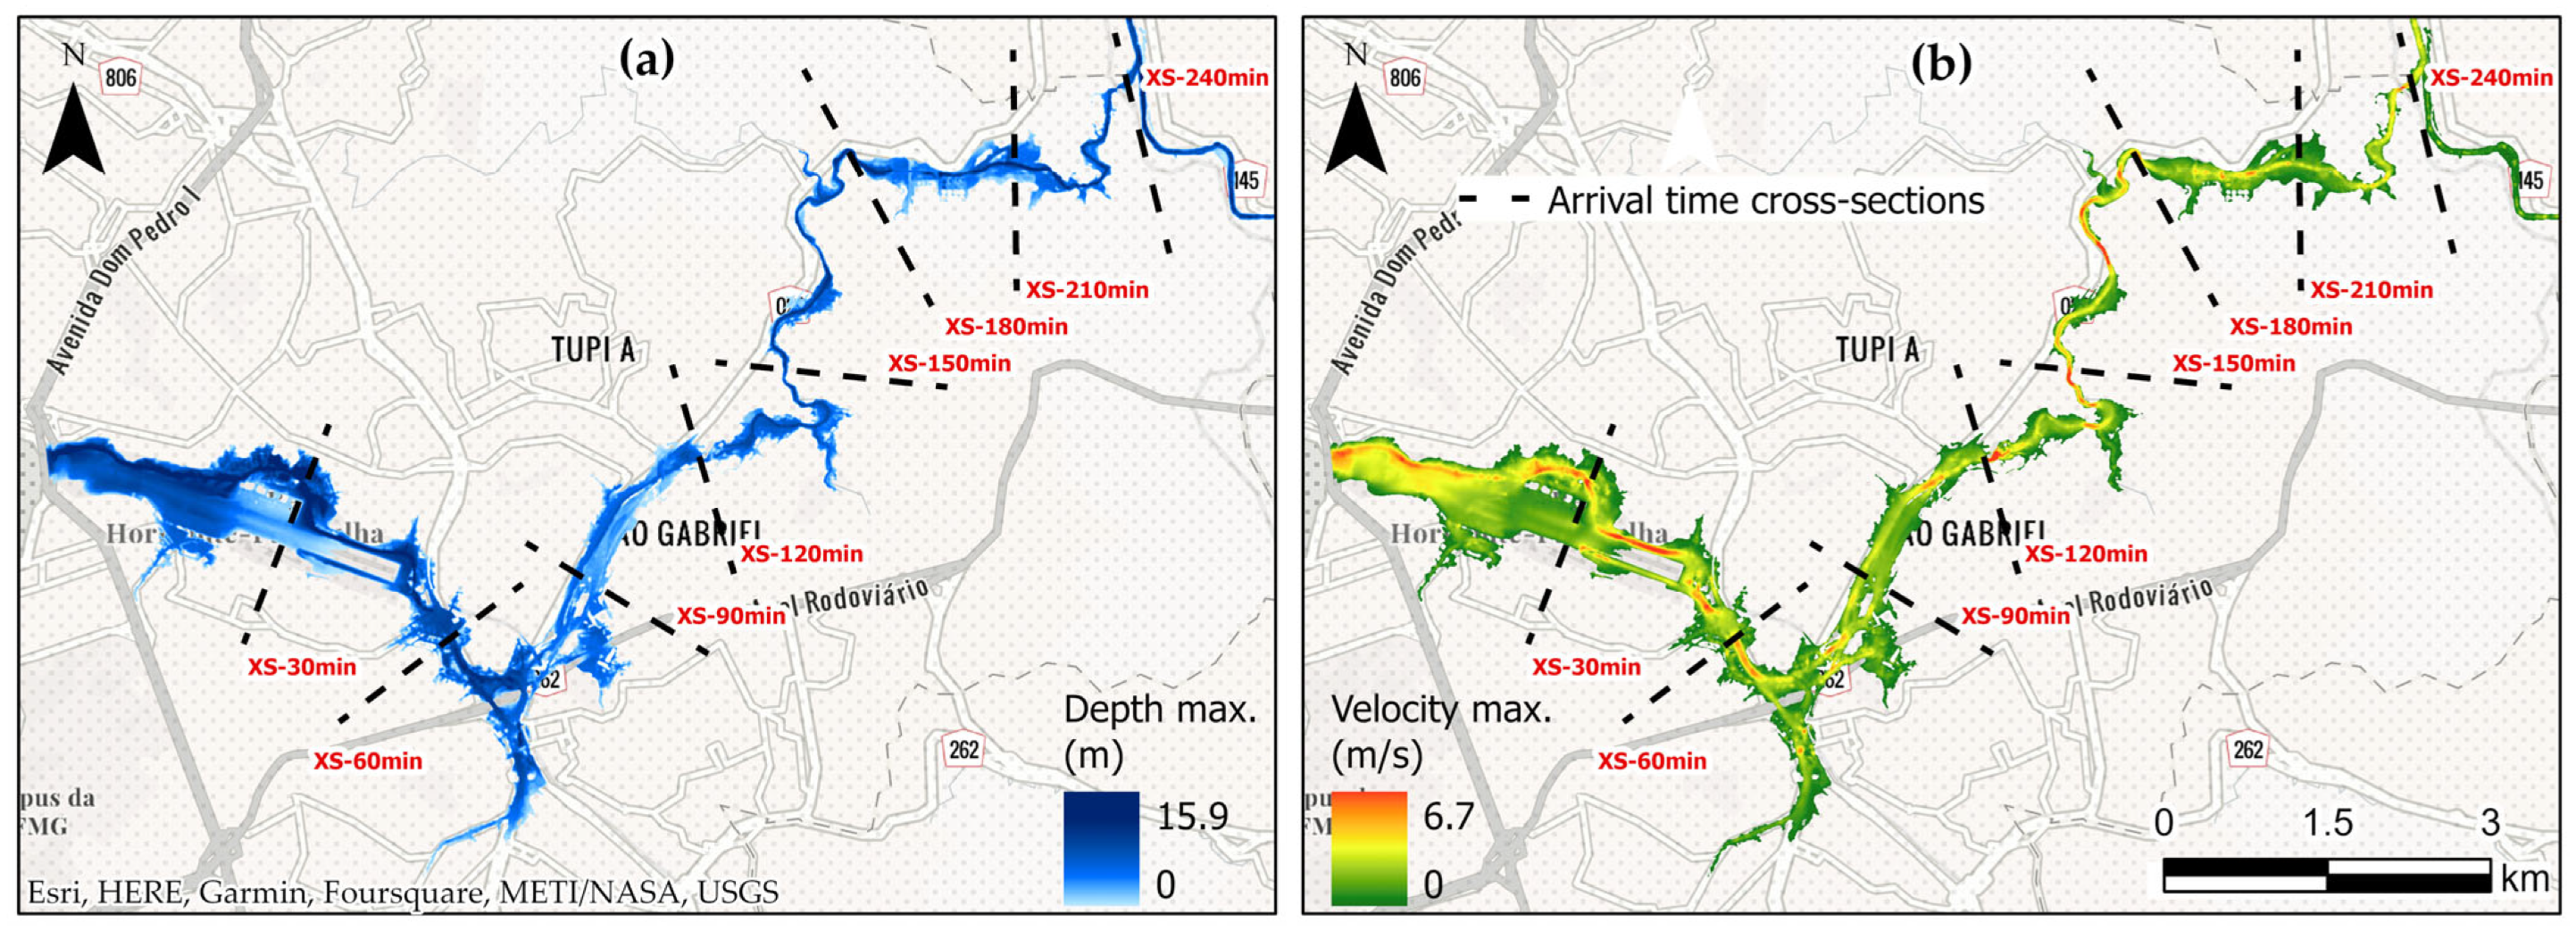
The downstream section of the PL.Dam covered approximately 16.7 kilometres, following the course of the Pampulha River until its confluence with the Onça River, which flows into the Velhas River, marking the municipal boundary of Belo Horizonte (Figure 1). The maximum depths and velocities and the flood wave arrival times are shown in Figure 5 and summarised in Table 2.
This flood scenario was the input for the HEC-LieSim flood-routine module (FRM), according to (Figure 4), including all the required details concerning the flood hydrodynamics through the downstream valley, allowing for the computation of flood depths, velocities and flood wave arrival times over the floodplain and the different elements at risk.
3.2. Exposure and Vulnerability Analysis of the Valley
Population exposure mapping is essential for characterising elements at risk in areas potentially impacted by flood events [59]. Microscale analysis is required to optimise investments by evaluating the cost–benefit ratio of structural and non-structural measures to reduce the risk [60], analysing loss of life, the efficiency of warning systems and population evacuation [61]. The LifeSim simulations are based on microscale data.
Exposure and vulnerability analysis was conducted in order to fulfil the LifeSim Shelter Loss Model (SLM) data input requirements. This analysis involves the representation of buildings as points, wherein information about the structures, such as the number of storeys, occupancy type and construction material, is considered. Additionally, the model requires data regarding the population in these buildings during daytime and nighttime and their mobility patterns. However, a significant challenge lies in acquiring the requisite high-resolution data [62] to represent the SLM accurately.
Based on the more recent available census data, public municipality layers and a buffer of 100 metres in the inundation boundary, 38,002 buildings with populations of 101,865 and 106,520 individuals were estimated during daytime and nighttime, respectively. It was observed that approximately 7.5% of the total population in both periods consisted of individuals aged 65 years or older, which was considered as a factor when representing the population’s mobility characteristics. Besides residential places, the authors considered public places such as schools, hospitals, and companies and population allocation based on census data about work and education characteristics.
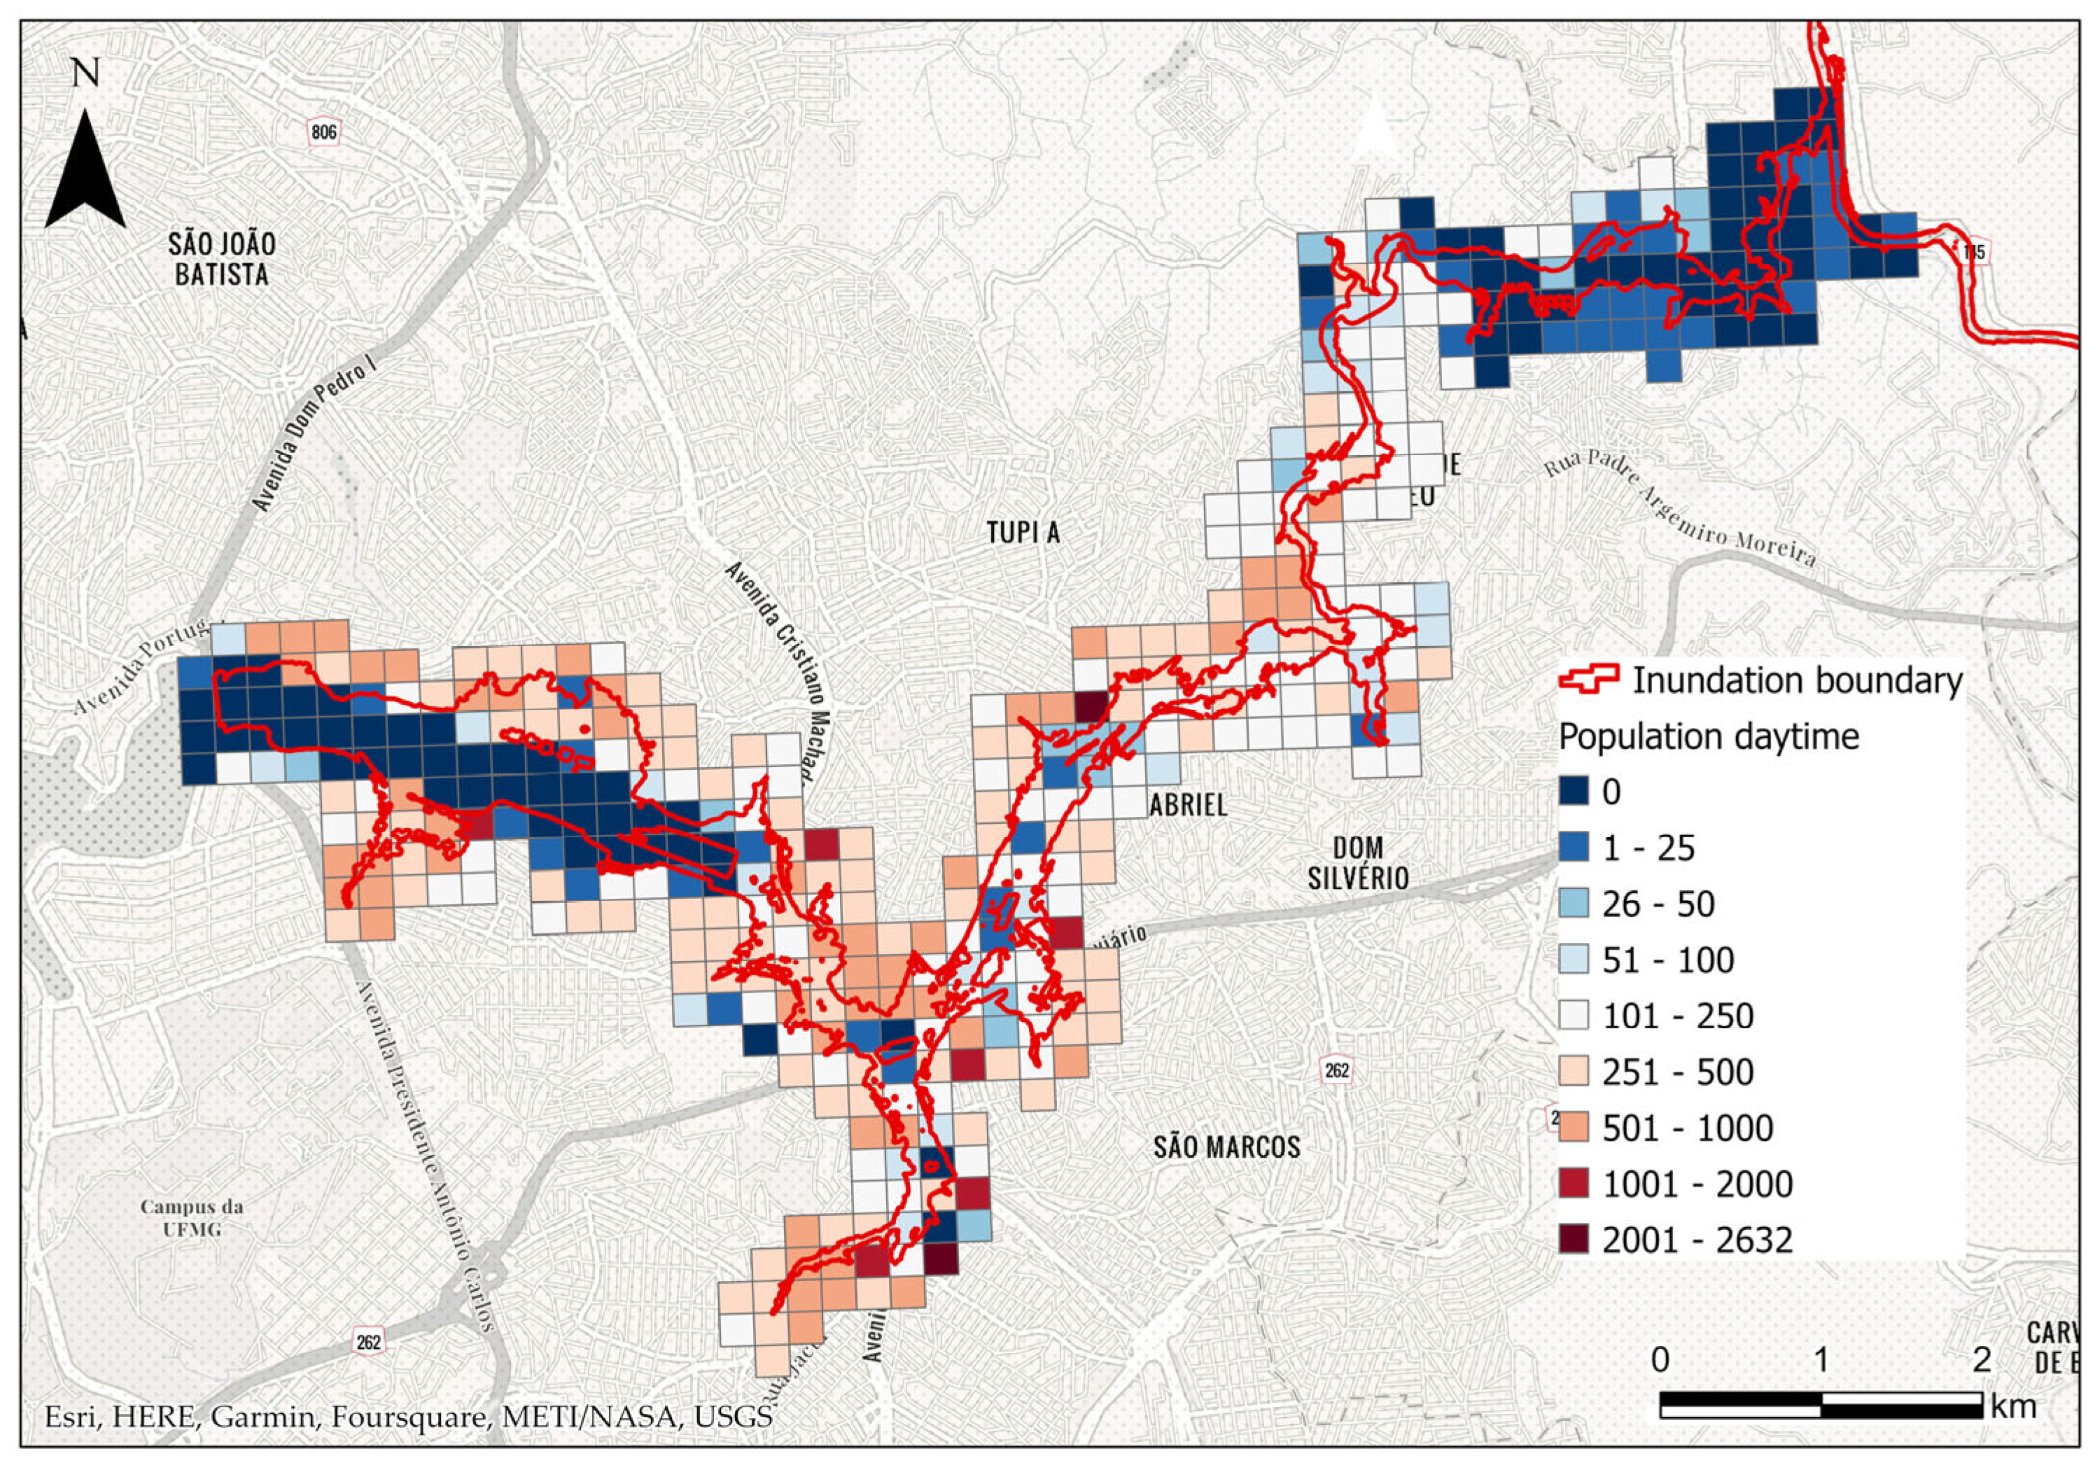
It is crucial to acknowledge that the primary focus of this study, as stated in the dynamic flood simulation section, is not to tackle or elucidate the uncertainties related to the analysis of exposure and vulnerability. Instead, the purpose of conducting exposure and vulnerability analysis is solely to parameterise the SLM in order to facilitate LOL analysis and evaluate uncertainty and efficiency within the context of EWES in various scenarios. The estimated population was aggregated within a statistical grid, a geographic unit derived from Brazilian census data with a spatial resolution of 200 × 200 metres, corresponding to the daytime period used in this study (Figure 6).
Based on the direct exposure of the population revealed by overlaying the generated exposure maps and the inundation boundary, it is estimated that a daytime rupture event can directly impact a population of 13,381 people. The total number of exposed buildings reaches 4417, with 3820 buildings classified as residential, 587 as commercial and 10 as public places.
3.3. Warning and Evacuation Scenarios
The timeline depicting the warning and evacuation process is represented in LifeSim under the flood hydrograph in Figure 4. The timeline commences with hazard identification and encompasses subsequent stages, including warning issuance, warning dissemination, mobilisation and evacuation delays, ending when the agent reaches the designated destination.
For the delay in issuing the warning, which is defined as the time from when the managers receive the notification of the imminent hazard to the issuance of an evacuation order to the public, Sorensen and Mileti [63] highlight the scarcity of studies on the time it takes to decide to issue an alert. Most of the research conducted on this topic is related to chemical emergencies. However, since many chemical accidents involve fast-moving events that require quick decisions and have a potential for fatalities, the results are relevant to other dangerous situations, such as dam failures. Based on the analysis of these historical cases, Sorensen and Mileti [63] present Equation (2) to represent warning issuing delay.
where is the probability of delay in the decision; is the time [min]; and and are coefficients specific for adjusting empirical data.
For the delay in warning dissemination, which is the period between the issuance of the warning and when it is received by the population at risk, Sorensen and Mileti [64] consider two main factors: the sending of the first alert, which covers the use of technologies, dissemination channels and repetition of the alert; and the receipt of the first alert, which involves population and event characteristics that influence the alert diffusion process. The authors discuss a specific model of first alert diffusion. Variables that influence it are highlighted, such as direct alert, which is the alert directly received through a communication channel, and indirect alert, which is the alert received through informal messages from friends, neighbours, colleagues and relatives. Thus, based on the analysis of historical cases of floods, volcanic eruptions and chemical accidents with a high variability of alert diffusion time, Sorensen and Mileti [64] present the following Equation (3).
where is the alerted population; is the rate of the alerted population at the time t; is the population that has not been warned at the time t; is the coefficient related to the effectiveness of the direct alert system at time t; and is the coefficient associated with the effectiveness of the indirect alert at time t.
For the delay in the initiation of mobilisation, which is the time it takes for the population to take a protective measure after receiving the alert, Sorensen and Mileti [65], through the analysis of mobilisation in historical cases of hurricanes, floods and material accidents, developed a model relating the population’s response to the mobilisation speed and the average time for the initiation of mobilisation, as presented below (Equation (4)).
where is the cumulative probability of being mobilised at time ; is the time [h]; is the coefficient related to the mobilisation speed; and is the coefficient related to the average time for mobilisation.
Each equation presented above is accompanied by coefficients that depend on population characteristics, the issued alert and the event under consideration. HEC-LifeSim v 1.0.1 already incorporates the recommended values for these coefficients with an uncertainty range into the warning and evacuation module (WEM). However, it is also possible to define specific coefficients for a particular case and construct customised curves based on them [66].
Regarding evacuation delay, the Greenshields et al. [67] transportation model is used to represent the effects of traffic density and road capacity on vehicle speed. These aspects are quite relevant in the valley downstream of the PL.Dam, where the evacuation process encompasses over 13,000 people. The interaction of these aspects can significantly decrease the speed at which vehicles can reach designated safe areas.
The number of vehicles is obtained by the occupancy rate determined by the user. This rate is only considered for people evacuating in vehicles, a parameter also defined by the user. In order to determine evacuation routes, the Dijkstra’s optimisation algorithm [68] is employed to identify the path (imported by the OpenStreetMap database) with the shortest time between the building and the corresponding destination.
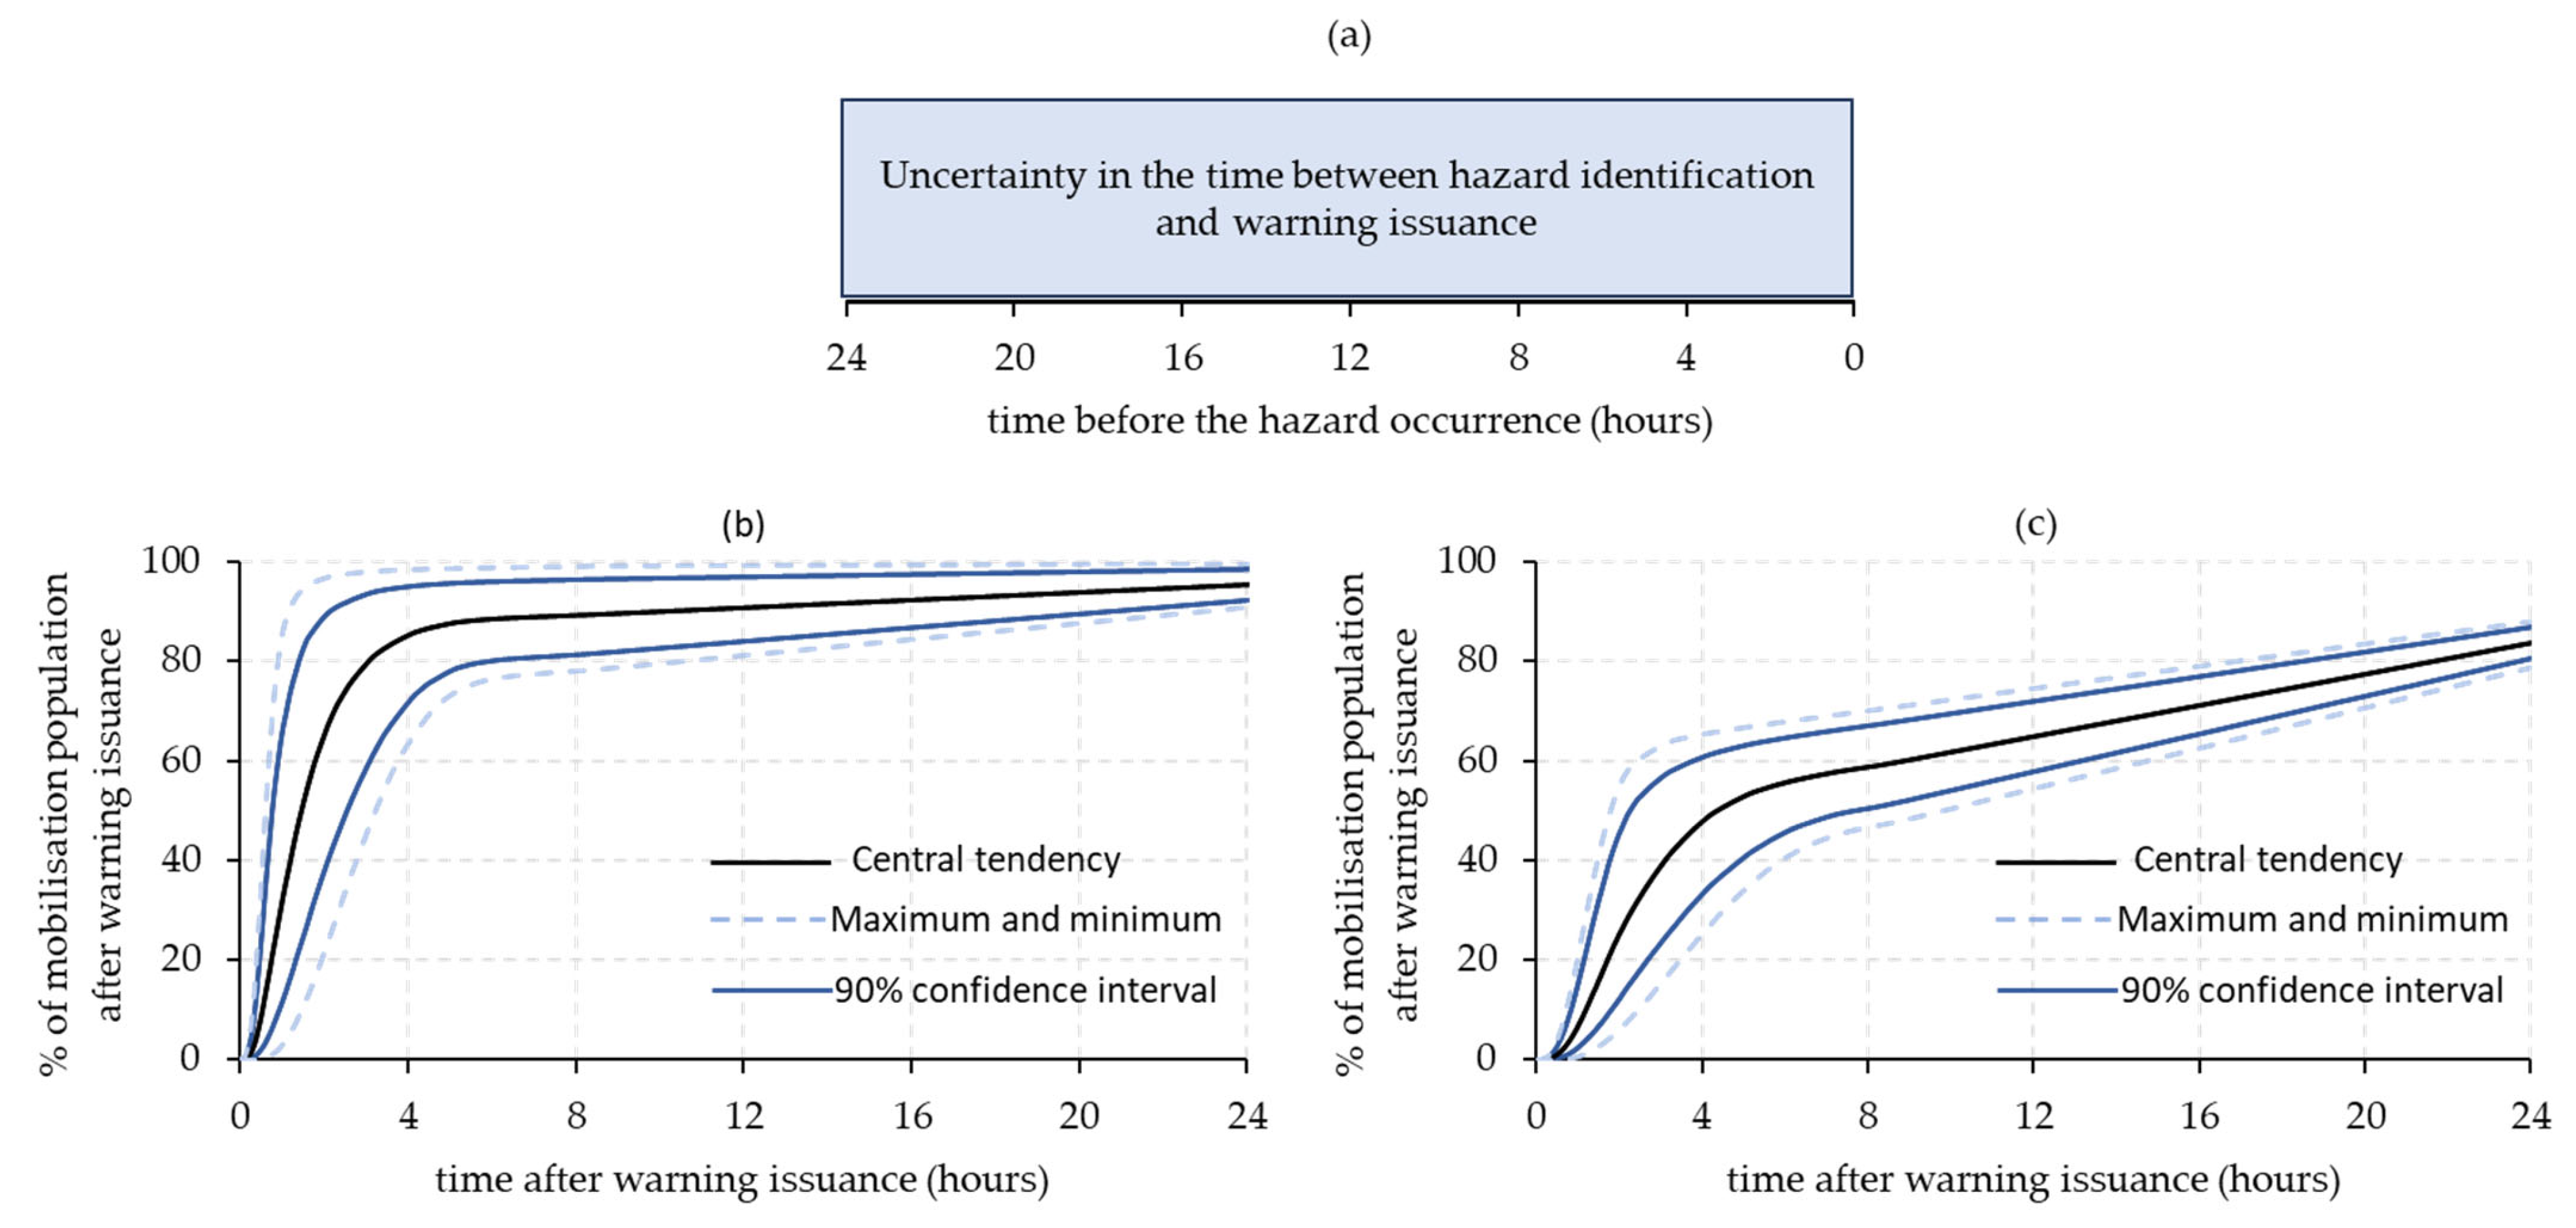
In this work, Monte Carlo simulations were conducted to analyse the warning and evacuation processes in two parts. The first part involved a sufficiently long interval in representing the time between the hazard identification and the warning issuance, ranging from 0 to 24 h, starting at the onset of the rupture and characterised by uniform uncertainty. This interval was used to evaluate the optimal response time for the emergency managers. The second part of the analysis focused on the influence of uncertainty in the recommended values of warning dissemination delay and mobilisation time proposed by Sorensen and Mileti in [64,65]. We examined two types of parameterisation—the first type involved fast warning dissemination and a population with high perception and preparedness for mobilisation. The second type consisted of the same warning dissemination rate, but with a population with low levels of perception and preparedness (Figure 7). Only the mobilisation pattern was varied because this aspect has more impact on time and the evacuated percentage of the population achieved than warning dissemination times.
Before these analyses, tests were conducted to assess the evacuation mode (50% on foot and 50% using vehicles, as well as 100% on foot) to identify routes to avoid and the safest evacuation points. The goal was to optimise the evacuation process, whether on foot or using vehicles. However, the results were not highly sensitive to changes in this parameter. Since the region of interest had a significant population, evacuating by vehicles, although it could promote fast displacements, could be limited due to traffic limitations. In contrast, congestion does not affect pedestrian evacuation but may lead to slower speeds than vehicle evacuation in certain situations. Based on these preliminary tests, the 50%/50% on foot and by vehicle evacuation mode was adopted for all the simulations.
3.4. Sectorisation Scenarios and LOL Estimation
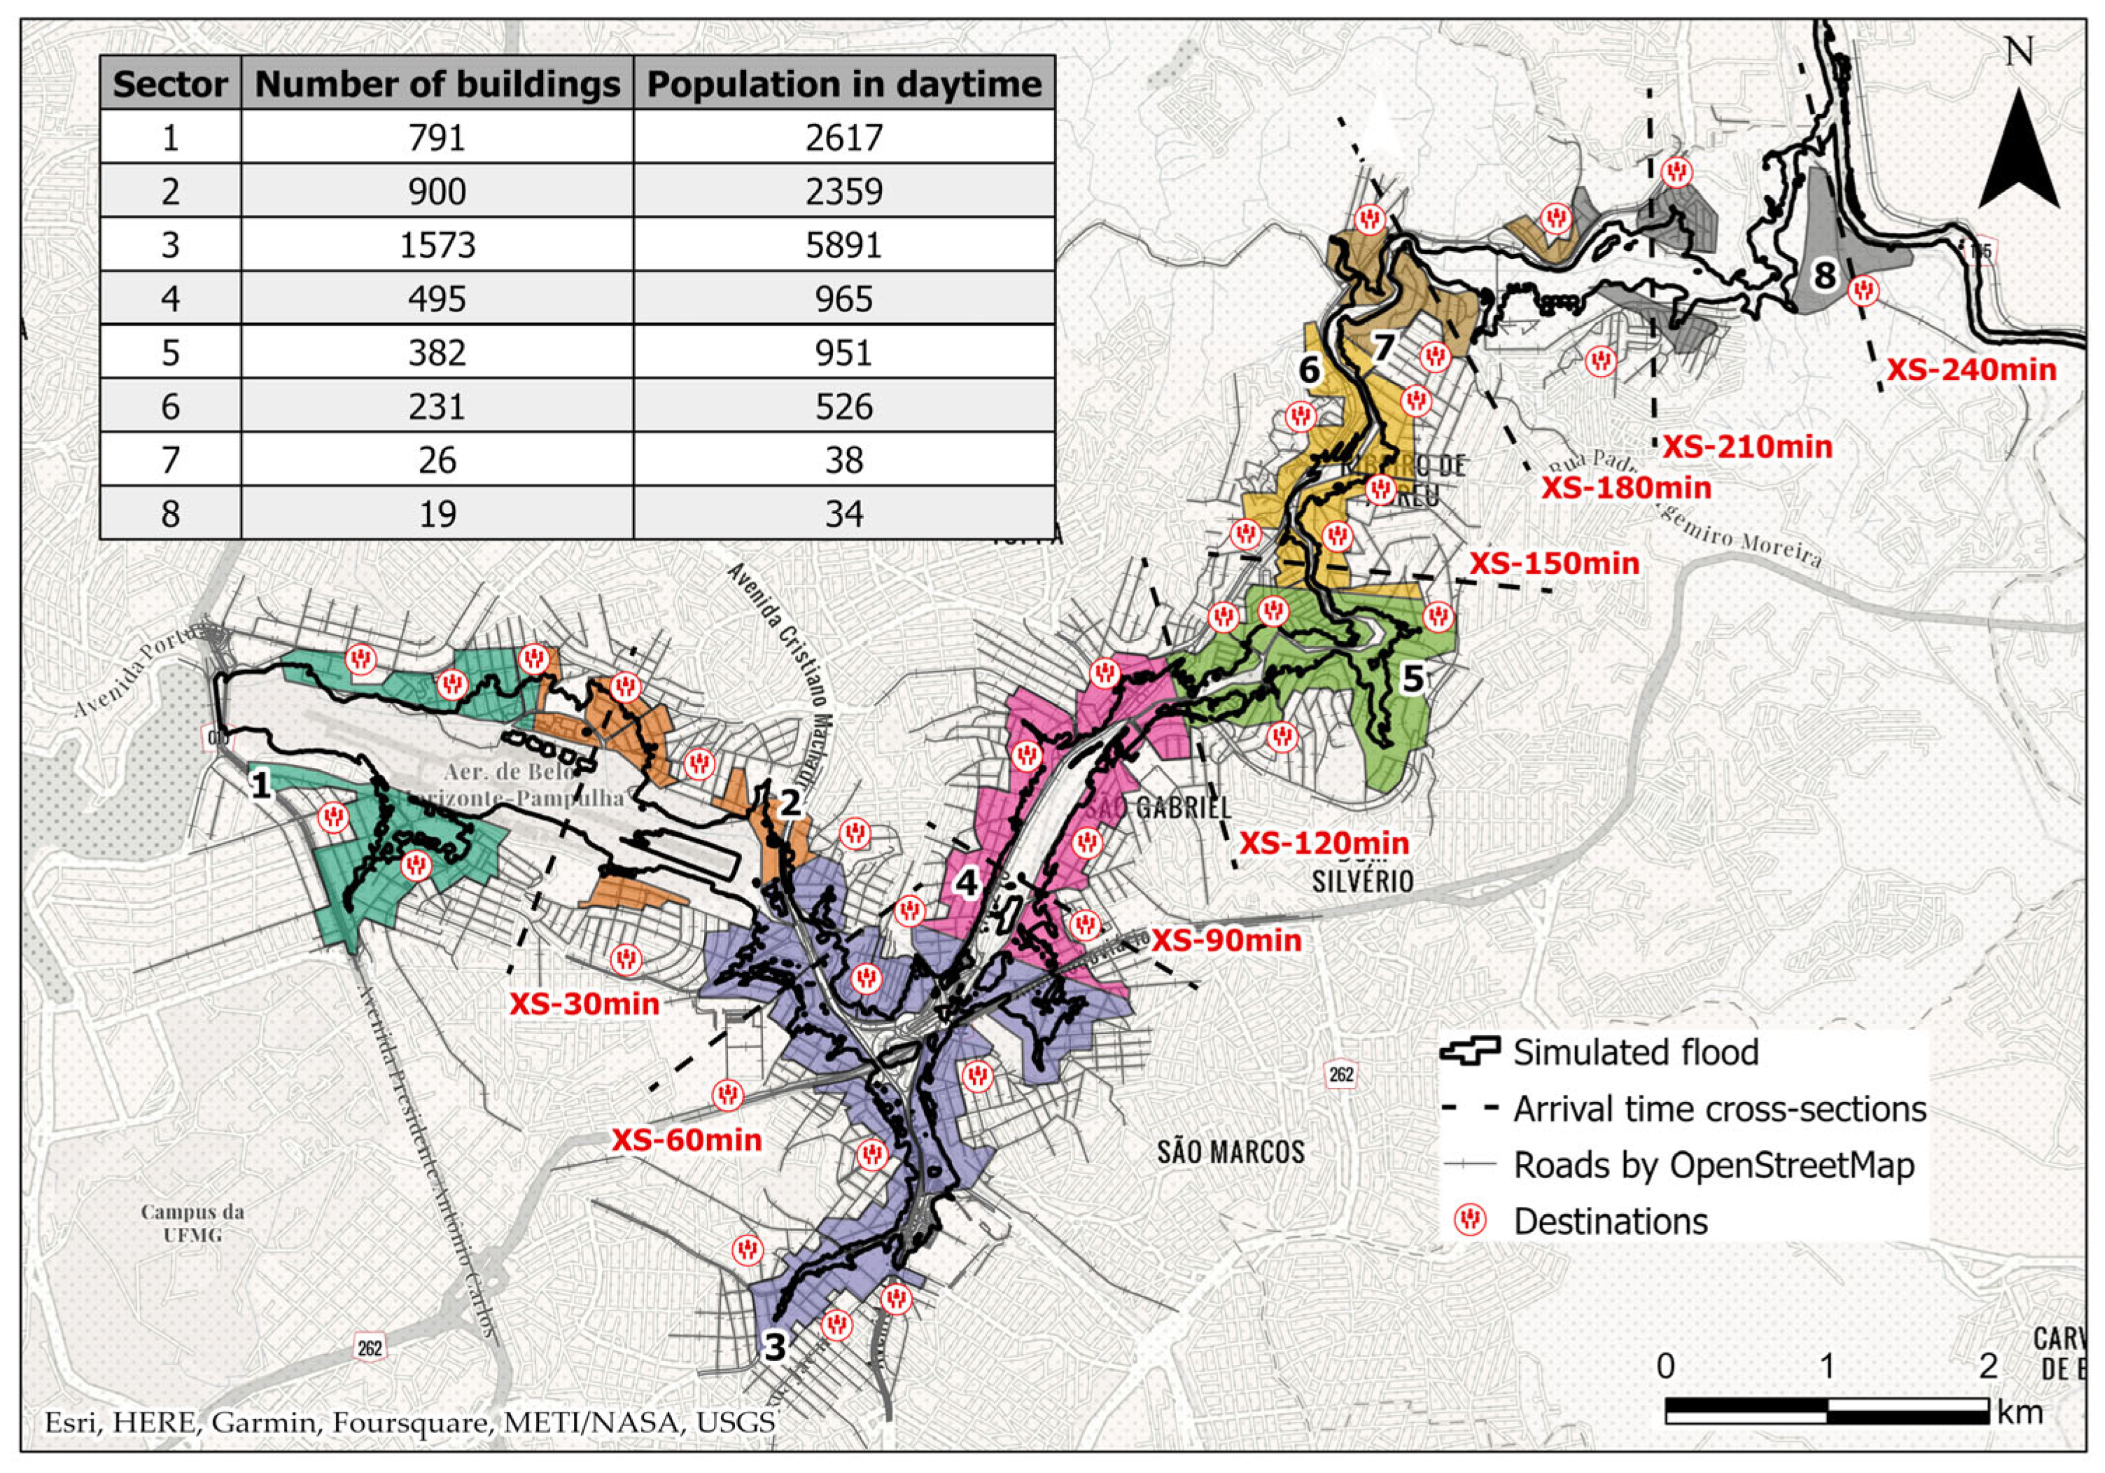
Partitioning the downstream valley into distinct sectors and assessing their outcomes using EWES and LOL simulations allows for identifying unique characteristics and proposing specific actions for each sector. In this study, we choose to evaluate sectors based on local conditions and using the distance of approximately 2 kilometres along the flow path of the flood wave to determine the sector’s limits. This discretisation aligns spatially with the arrival time cross-sections, delineated every 30 min. A total of eight sectors were analysed. Among these sectors, the first three exhibited the highest concentration of population and buildings directly impacted by flooding (Figure 8).
In HEC-LifeSim, the loss of life module (LLM) involves the application of probability distributions for fatality rates derived from the research conducted by McClelland and Bowles [44] and subsequently updated by Aboelata et al. [45]. The updates were based on the analysis of 54 historical cases, further subdivided into approximately 250 homogeneous regions based on event characteristics. The majority of these cases pertained to floods resulting from dam failures.
The LLM involves three distinct curves corresponding to different flood risk zones: the chance zone, which encompasses an area with a high probability of LOL; the compromised zone, representing an area with a moderate probability of LOL; and the safe zone, defining an area with a very low probability of LOL. To determine the risk zone allocation for an agent or groups of agents affected by the flood while inside a building, a submergence threshold is employed, considering the mobility of each agent. If the floodwater surpasses this threshold, the affected agents are allocated to the respective risk zone based on this threshold. When the flood reaches vehicles or agents during the evacuation process, the stability criteria indicated via USACE [33] are applied. If the floodwater exceeds these criteria, the affected agents are allocated to the chance zone. Conversely, if the stability criteria are not exceeded, the affected agents are assigned to the safe zone.
A recent version of the model, LifeSim v.2.0, has been implemented [69]. The Loss of Life Module (LLM) in this new version considers two flood zones: high hazard and low hazard. During the development process, the developed team encountered challenges in identifying and characterising an intermediate flood zone. To address this, they conducted a comprehensive review and expansion of the existing database compiled from the studies conducted by McClelland and Bowles [49] and Aboelata et al. [50]. Nevertheless, specific issues identified in the 2.0 version were reported to the Risk Management Center of the U.S. Army Corps of Engineers. Therefore, the more reliable HEC-LifeSim v.1.0.1 was used for the tests. With some modifications implemented in the LLM in order to bring it closer to the latest version, the probability distribution curves of fatality rates for high-hazard and low-hazard zones were considered in the model, in which the high-hazard zone combines the chance and the compromised zones, while the low-hazard zone comprises the safe zone.
Ten thousand simulations were conducted using HEC-LifeSim v.1.0.1 to account for uncertainties. These uncertainties encompassed a range of values defined in the Warning and Evacuation Module (WEM) and the application of fatality rate distributions derived from the LLM. The evacuation routes were established utilising road data obtained from OpenStreetMap. Safe destinations were determined based on local plans (Figure 8).
4. Results and Discussion
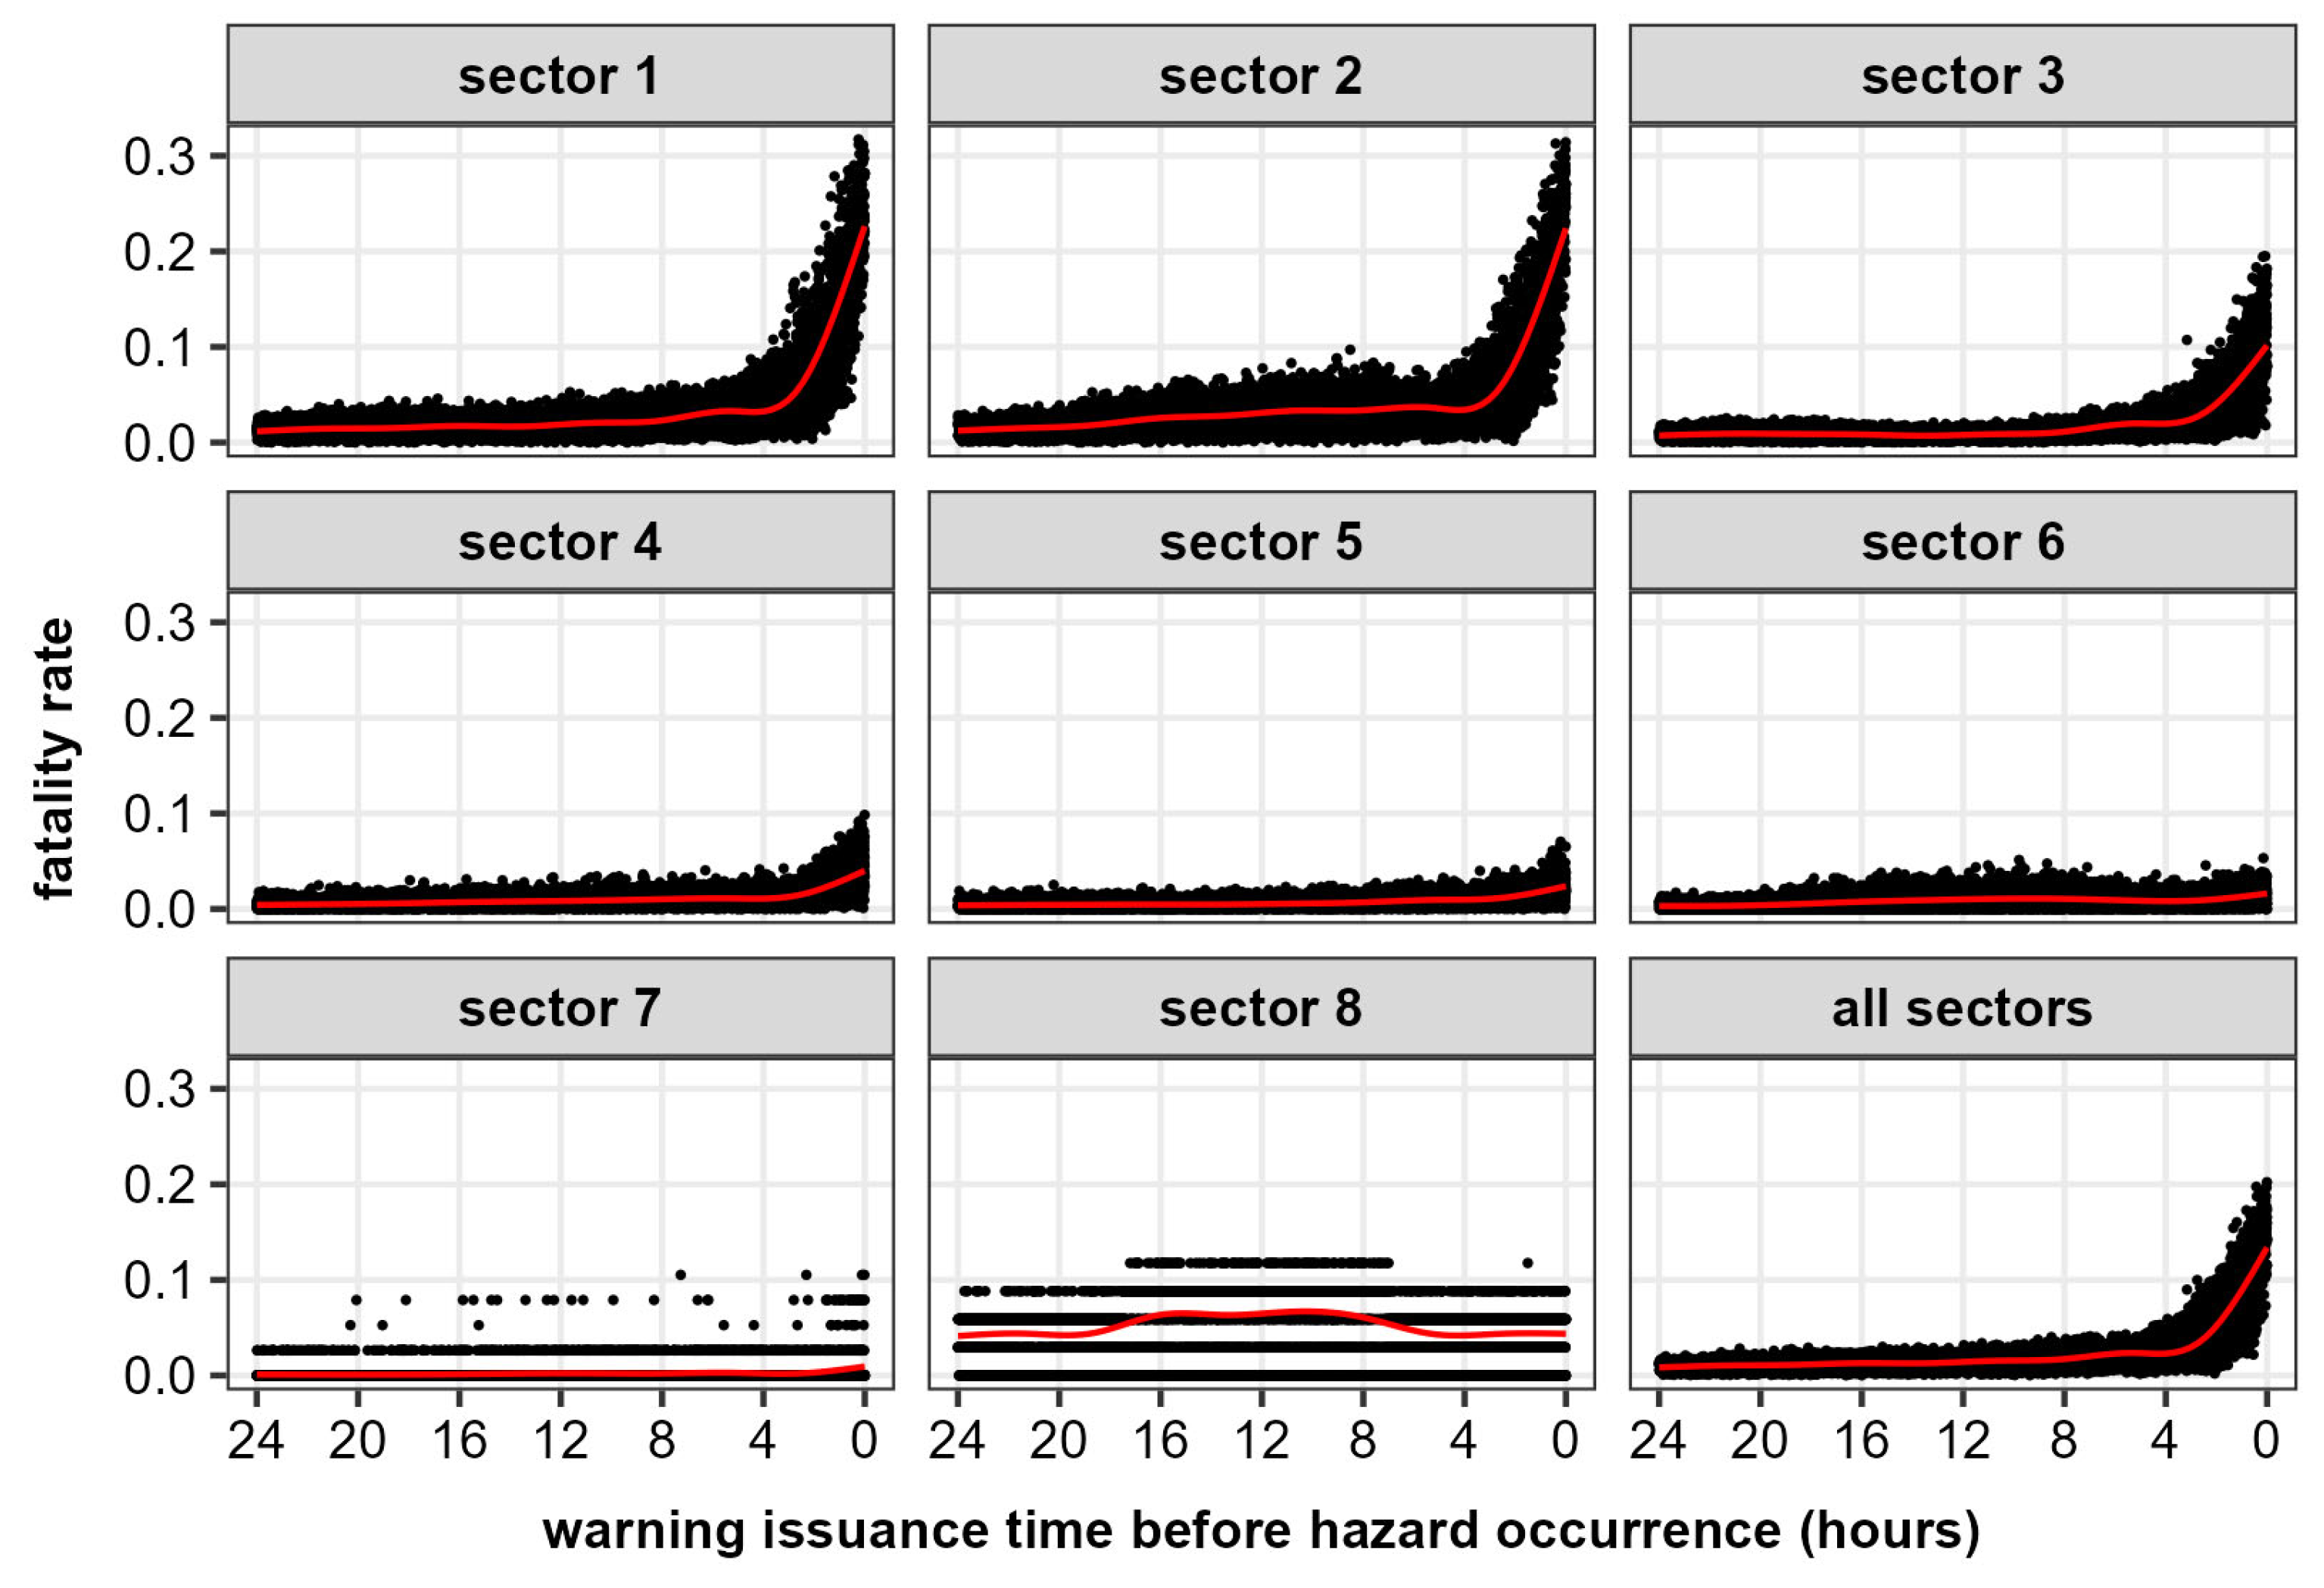
An apparent effect can be observed in the potential reduction of fatalities by increasing the alert systems and on-site mobilisation capacity, facilitating a more efficient evacuation in an emergency (Figure 9 and Figure 10).
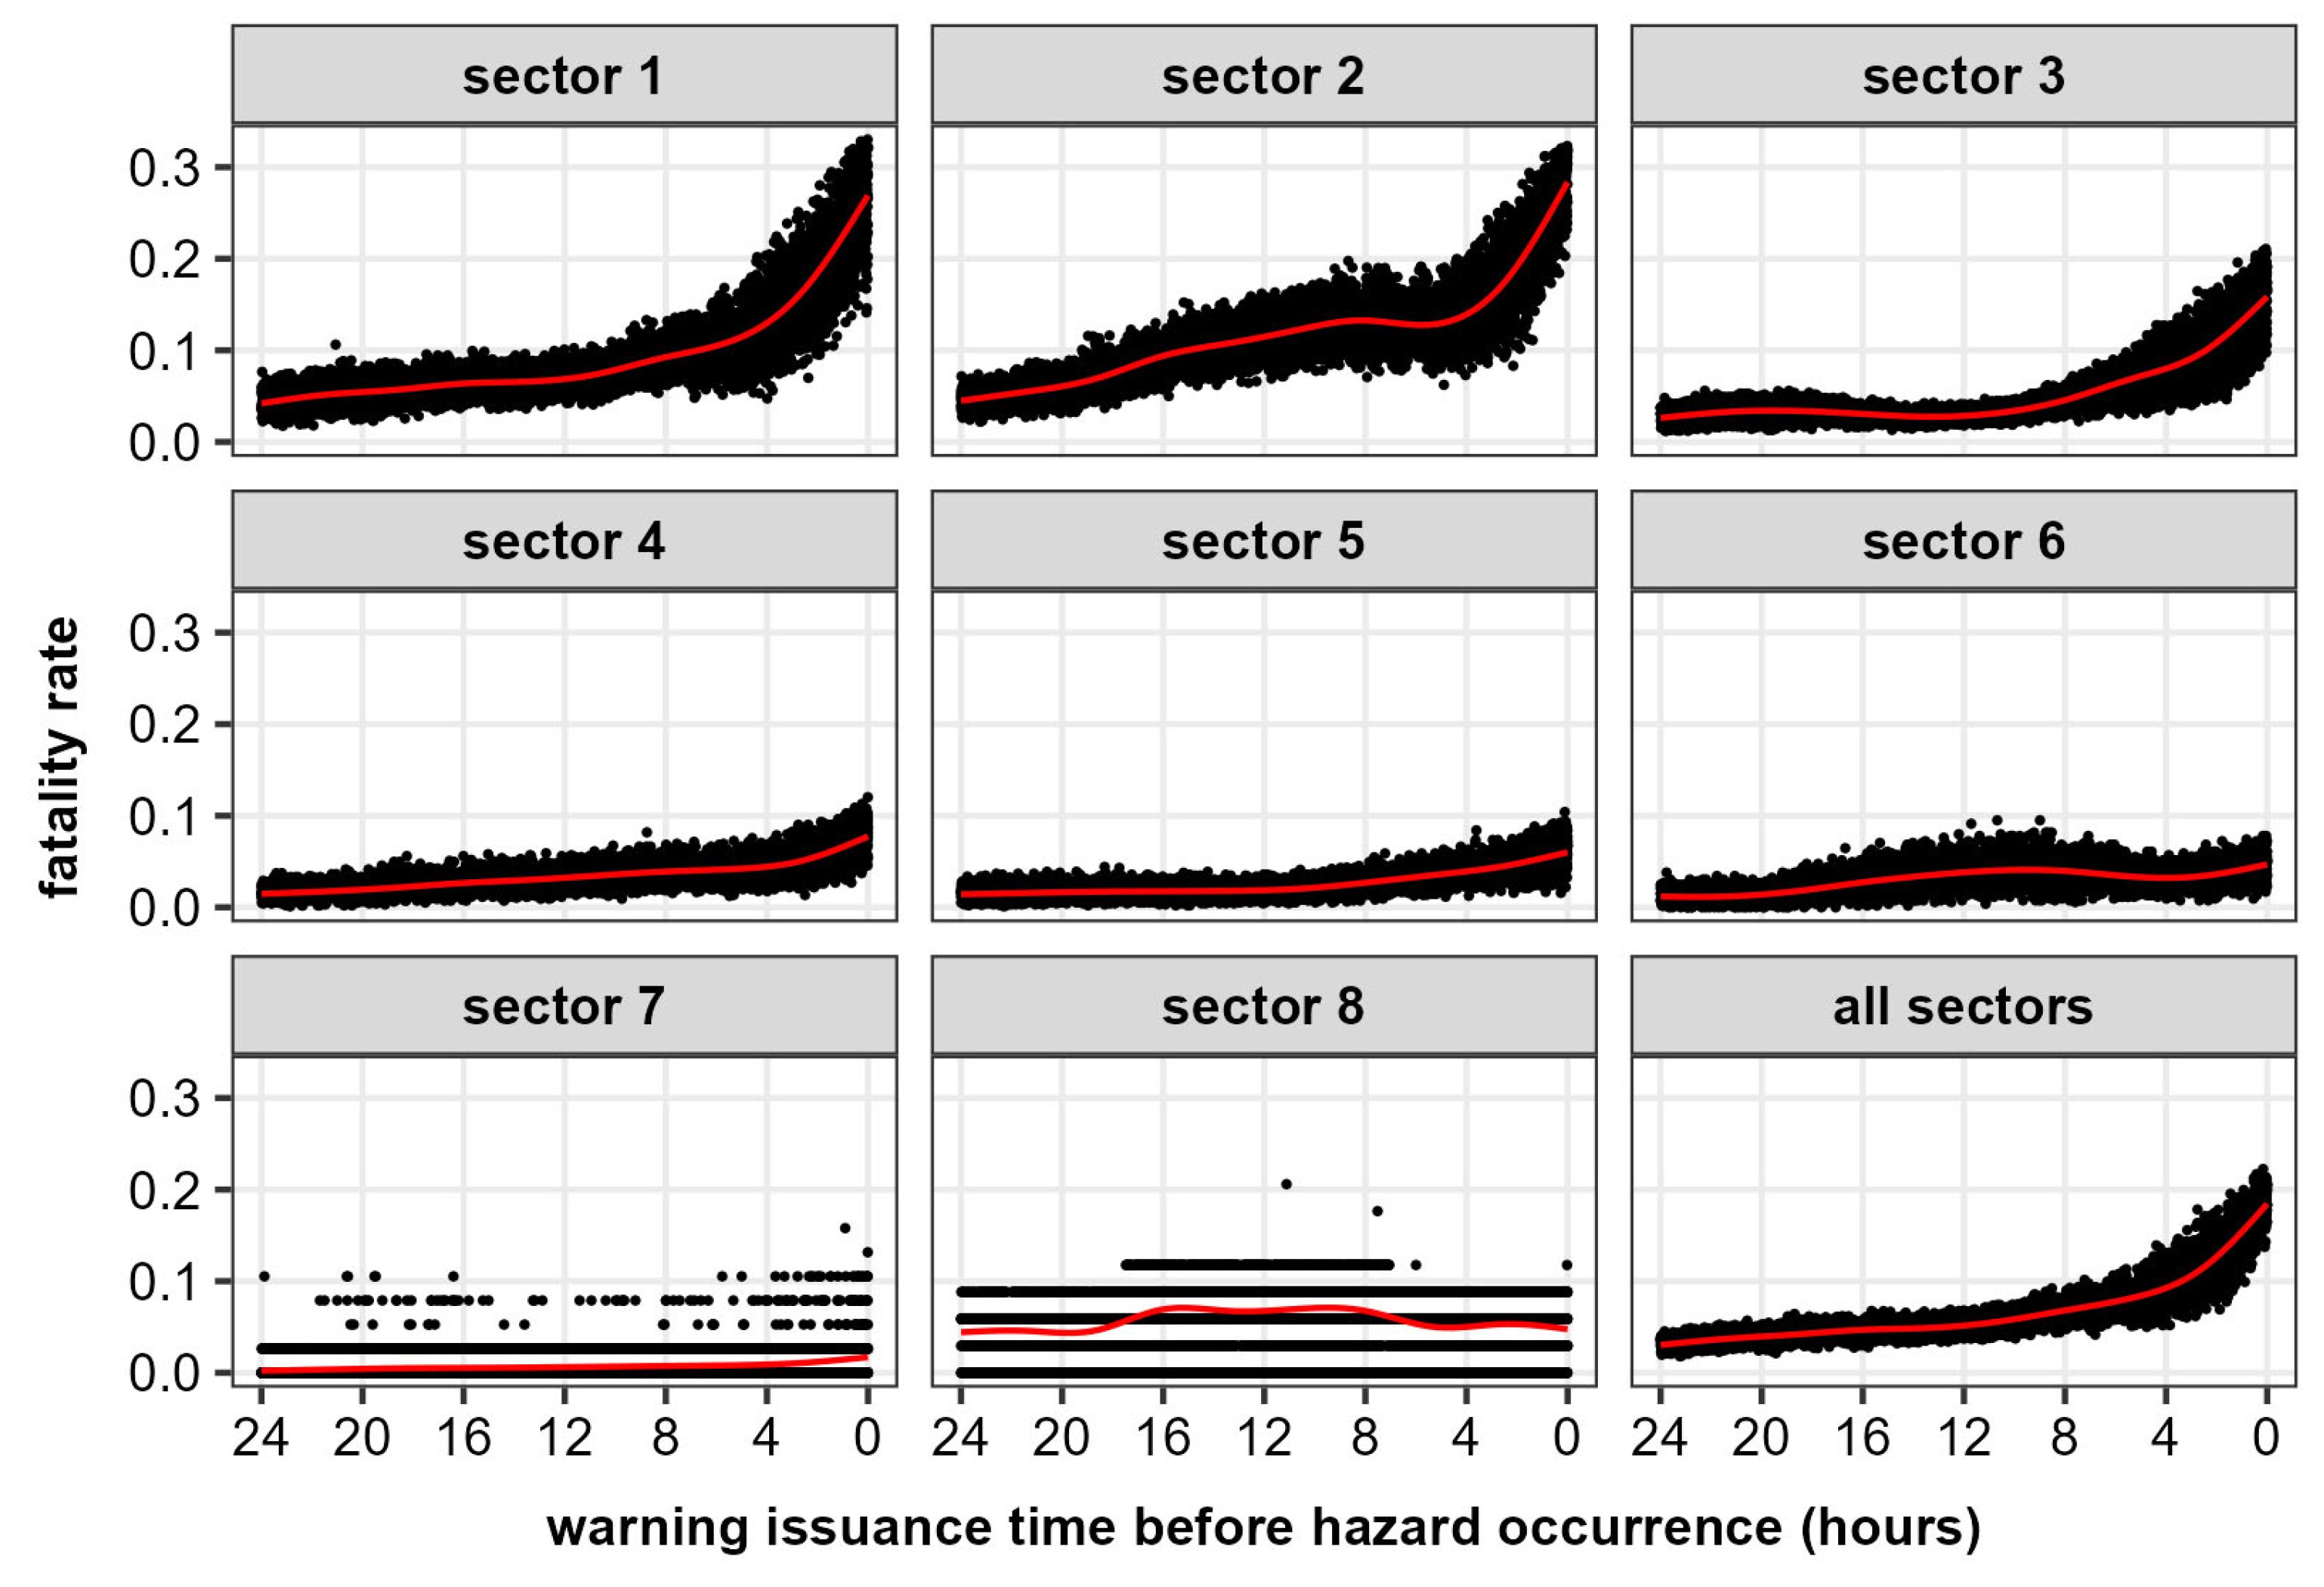
The first three sectors exhibit the highest sensitivity in terms of fatality rates. In cases of high mobilisation, there is an observed trend towards optimising the desired scenario of issuing warnings four hours before the occurrence of the hazard (Figure 9). However, in cases of low mobilisation, such a favourable scenario is not observed, as the likelihood of LOL rates exceeding 0.1 remains prevalent even when alerts are issued up to 12 h before the dam-breach event, specifically for sectors 1 and 2 (Figure 10).
The influence of the warning and evacuation module (WEM) on LOL in the other sectors is comparatively less pronounced compared to the three initial sectors. This observation can be attributed to two primary factors. First, the relatively lower hazard posed by the flood in this area might contribute to a diminished impact on the other sectors. Second, the arrival time of the floodwater, which is around 90 min in sector 4, could also permit a longer time for the population to reach safe places. In the last two sectors, the LOL does not demonstrate any apparent relationship to both warning issuance and mobilisation times.
The exclusive impact of mobilisation can be assessed by examining the range of LOL rates estimates for the same time of warning issuance. This range is observed to be wider when the warning is issued closer to the hazard occurrence. It implies that even in an optimal mobilisation scenario, a delay in issuing the warning has a more pronounced impact on the estimation of LOL.
Upon comparing the quantiles of high preparedness and mobilisation (Table 3), the significant impact of this delay on the warning and evacuation timeline becomes evident. The median of the low mobilisation scenario is observed to exceed the 0.9 quantile of the high mobilisation scenario. Thus, determining the appropriate curve or range of curves of a specific case study to employ in the LifeSim model becomes an essential step to LOL evaluation. Moreover, the improvement of mobilisation could significantly impact the mitigating of LOL.
Depending on the specific case study, the pattern curves in the WEM of LifeSim may not accurately represent the local context. Therefore, adjusting the definition of the curve locally using Equations (2)–(4) is recommended, along with additional studies on the definition of coefficient equations [70,71]. These adjustments can ensure the appropriate application of the curves to the local conditions.
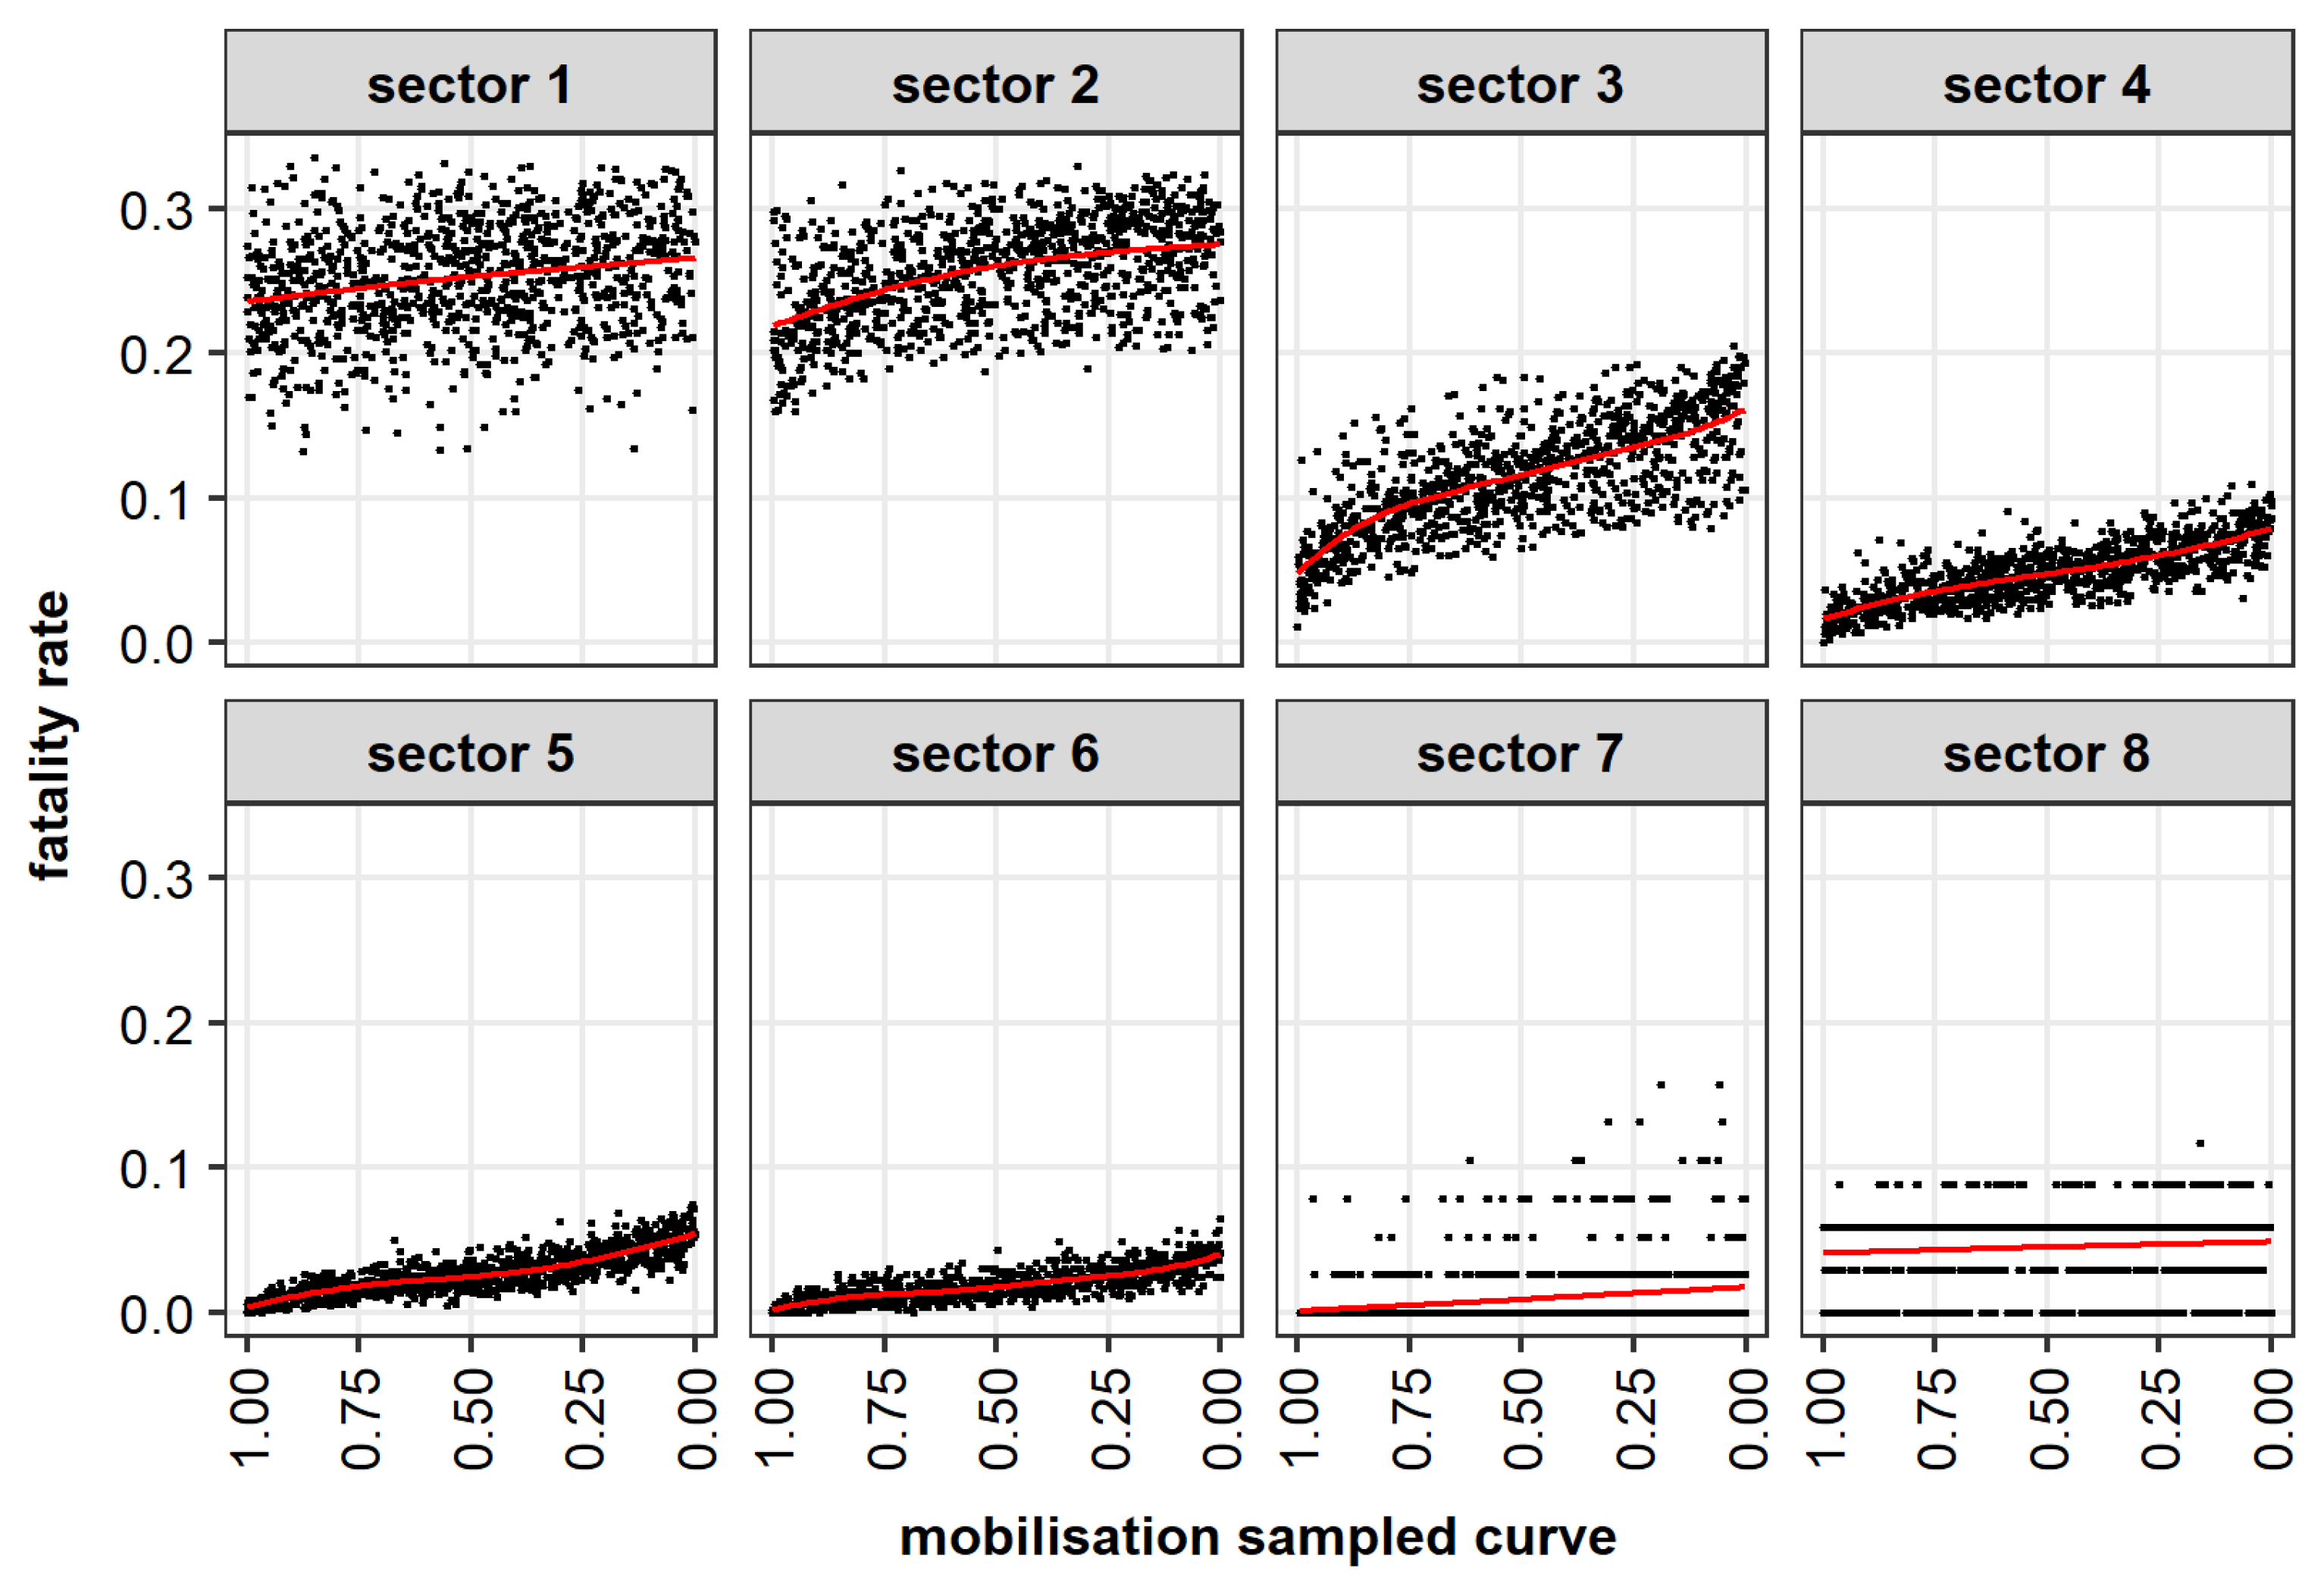
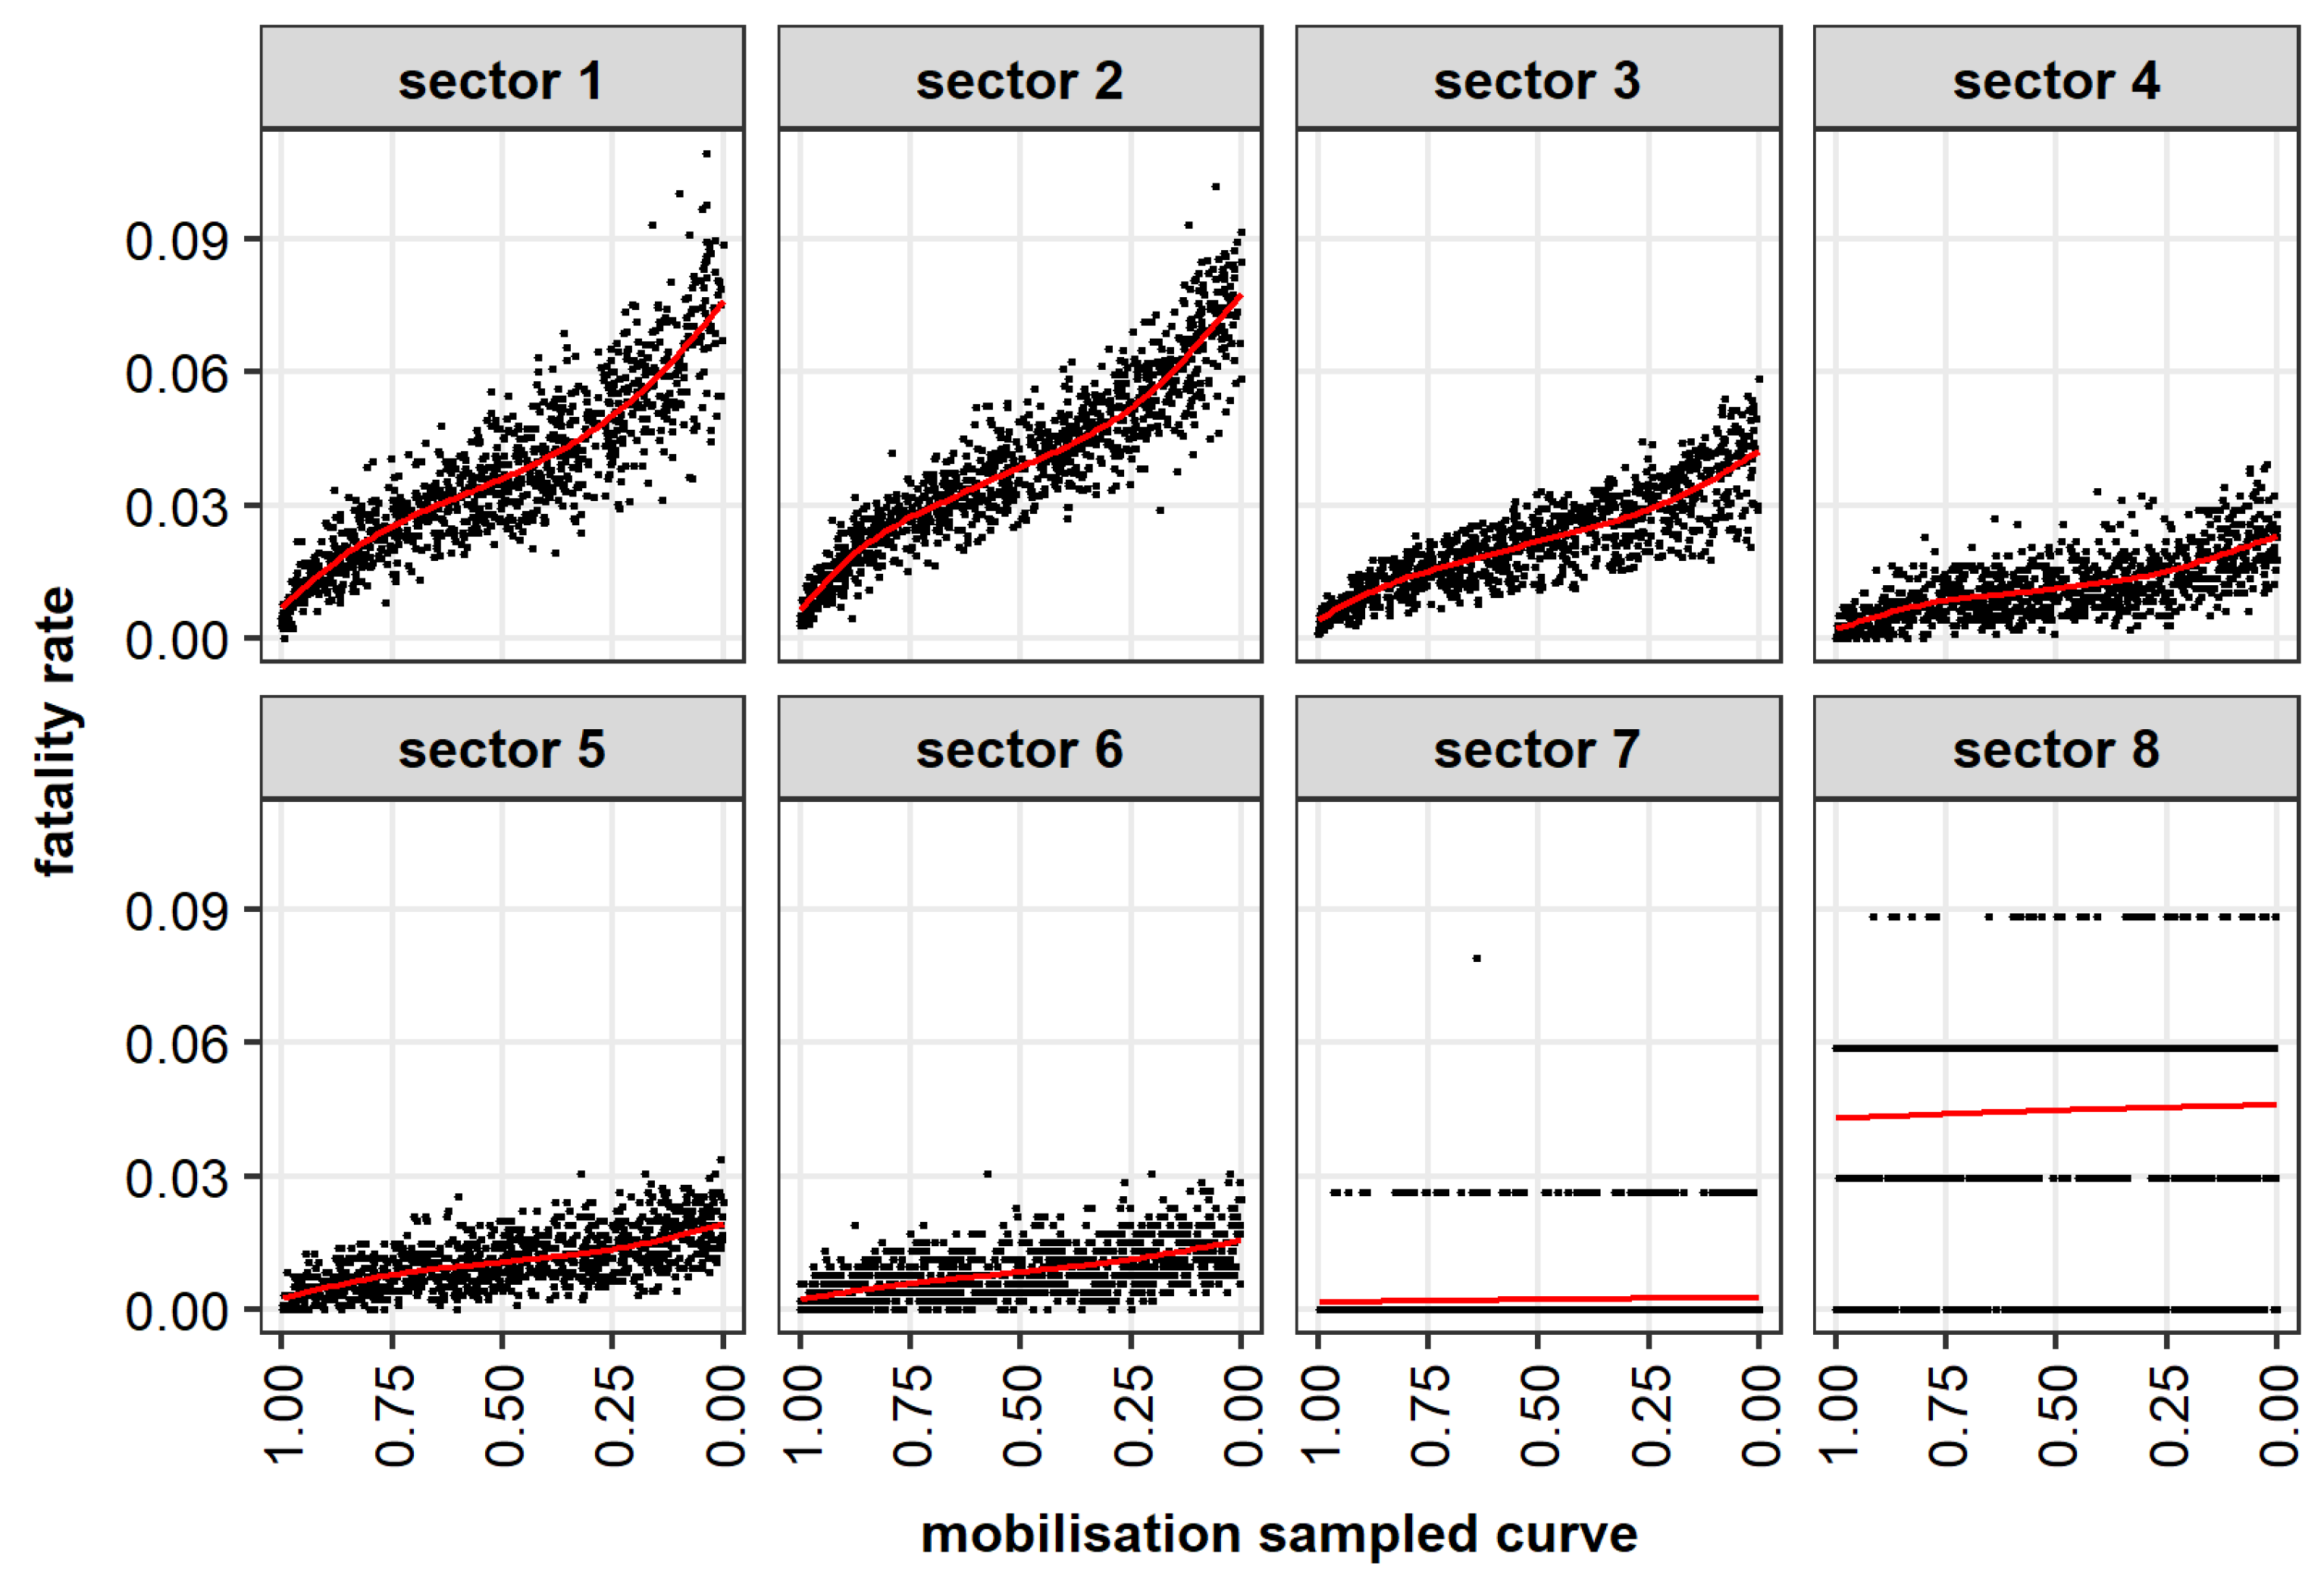
In order to examine a more specific influence of mobilisation on estimating LOL, two predetermined instances of warning issuance time were established and simulated. These simulations were designed to evaluate the effects of mobilisation in isolation. In this analysis, the focus was to evaluate the potential gains related to high levels of mobilisation. Values closer to one indicate a more optimised mobilisation, as depicted in the sampled curve of Figure 7b. Conversely, values closer to zero signify a less favourable scenario.
It is worth noting that when the warning is issued at the moment of the dam-breach event, the impact of mobilisation does not exhibit a clear trend (Figure 11), mainly in the first two sectors, compared to when the warning is issued four hours before the occurrence of the hazard (Figure 12).
Even with optimal preparedness and awareness of the population, there is insufficient time to observe a substantial impact on the evaluation of LOL for the first two sectors. However, in the simulation focused on the critical time of four hours, the mobilisation primarily affects these regions.
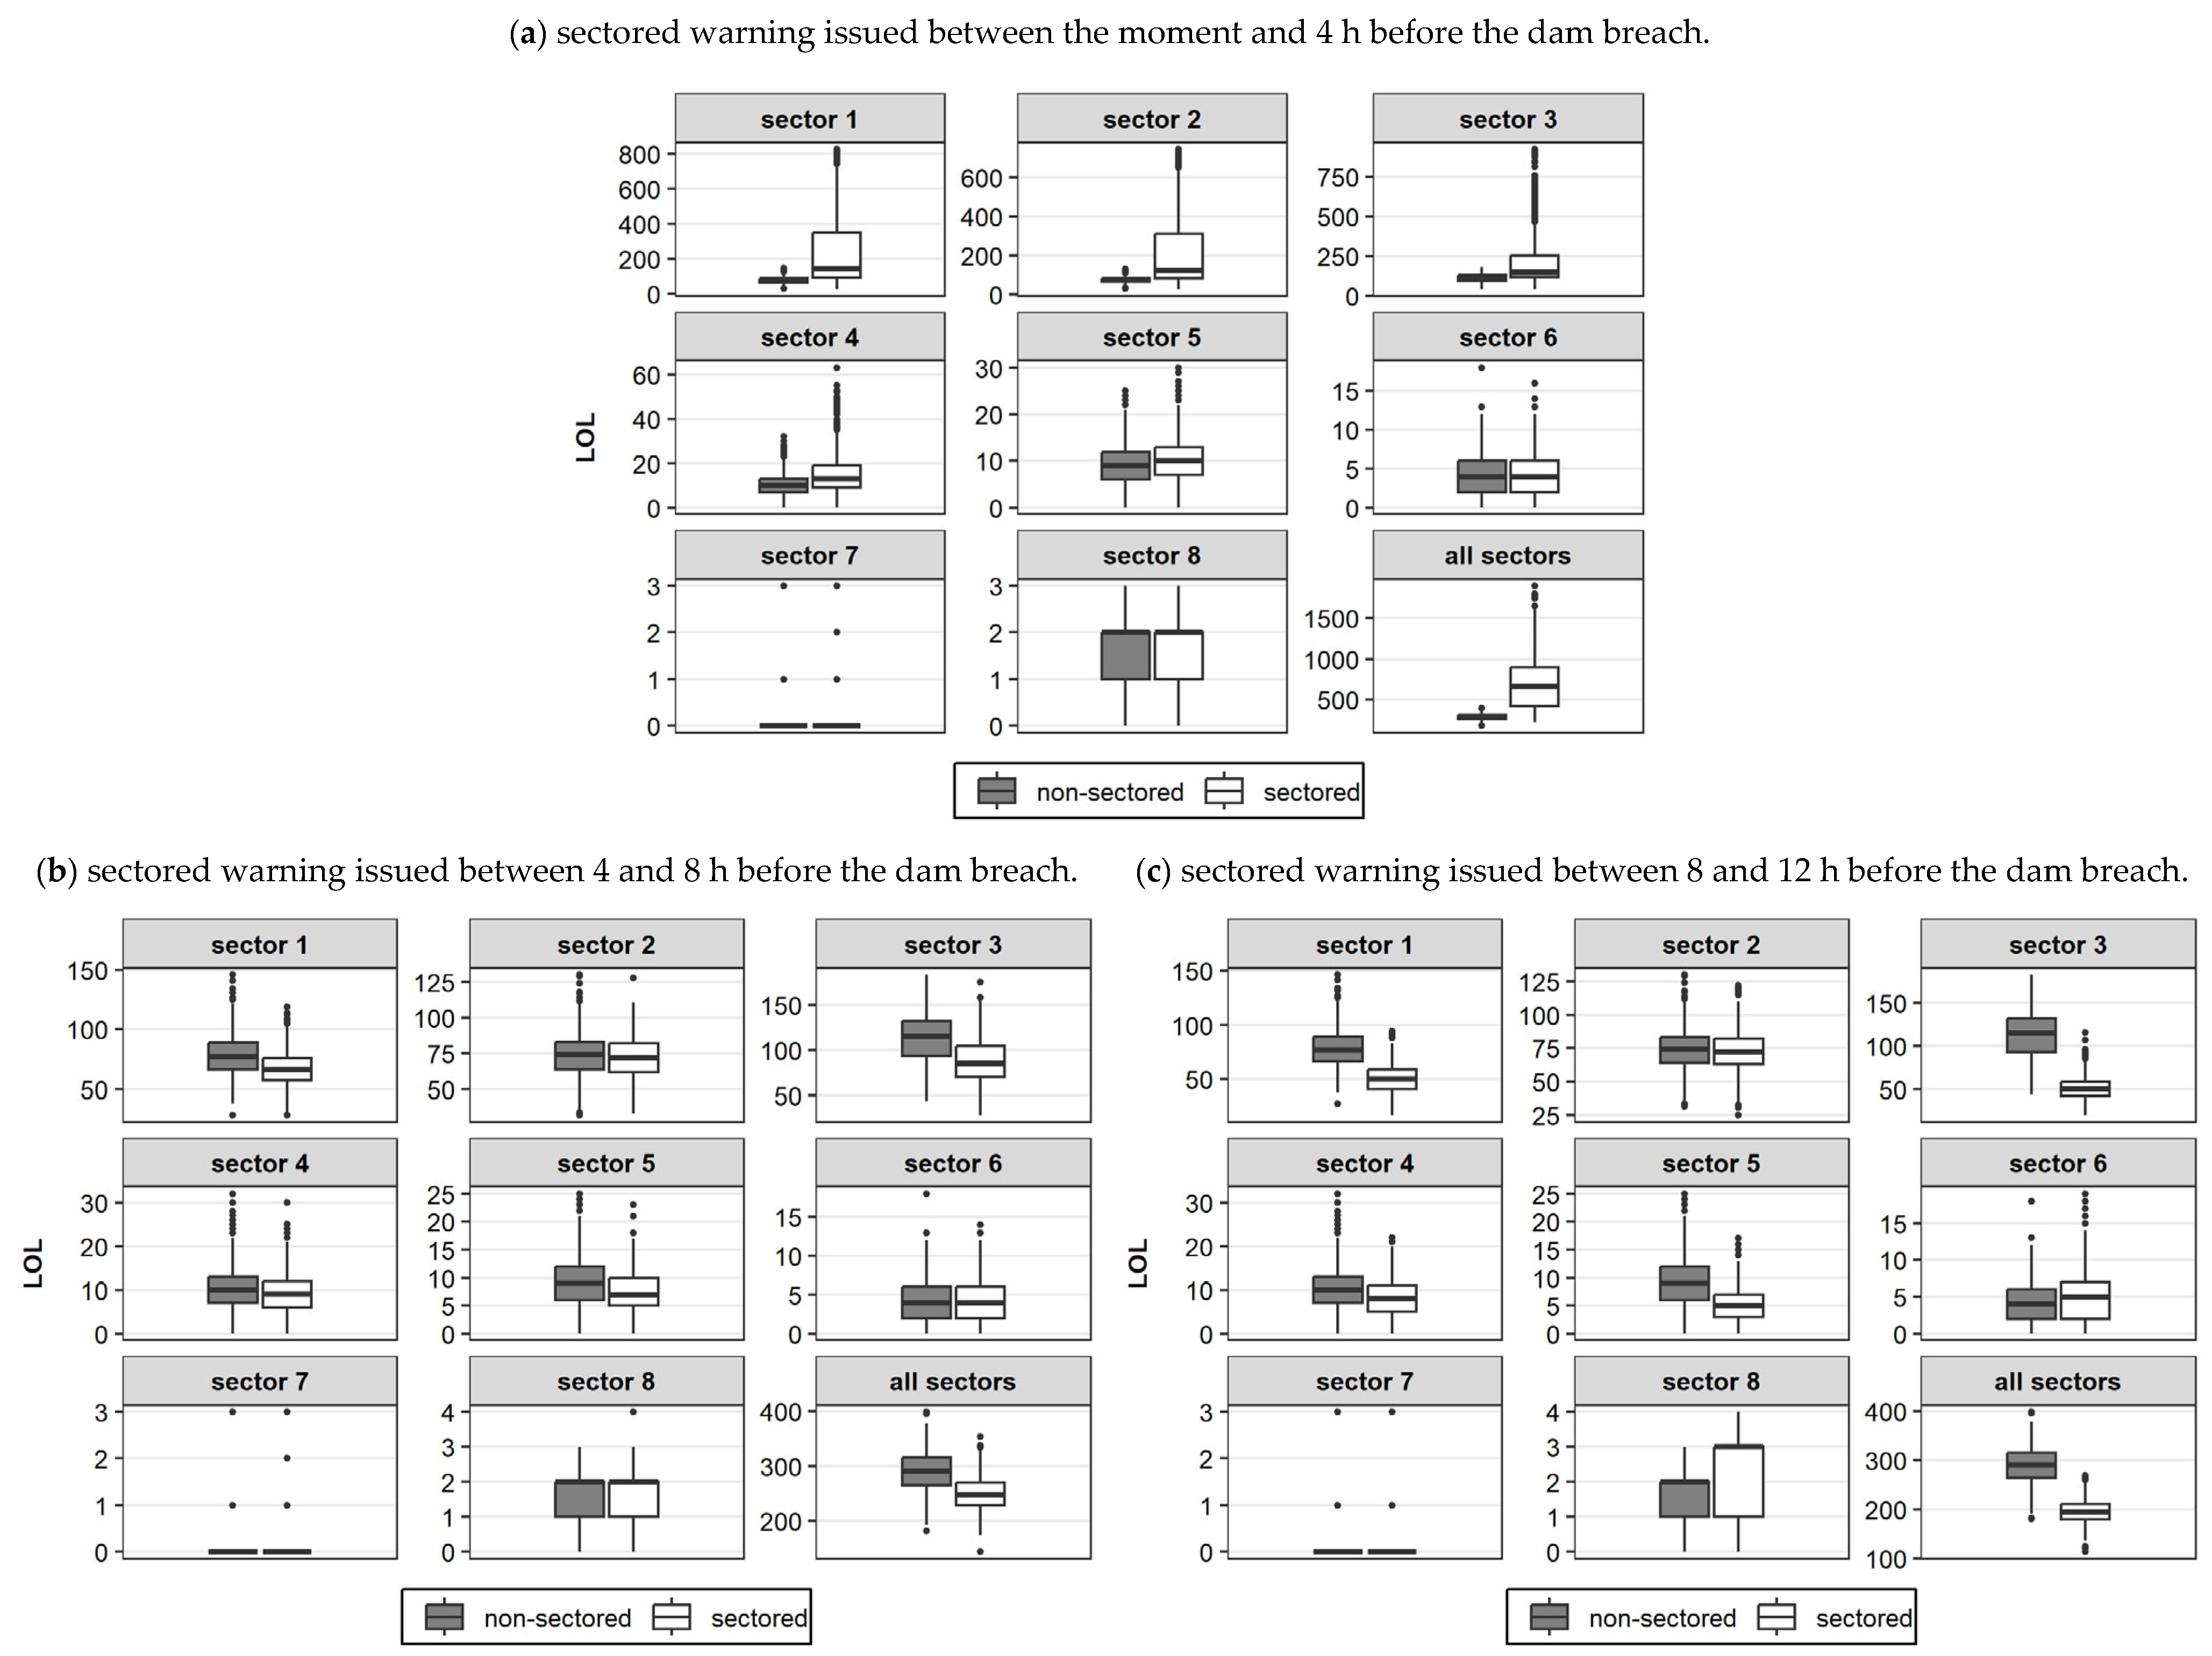
In high mobilisation scenarios, it was concluded that a minimum of four hours was required for anticipated warning issuance for significant alleviation of LOL (Figure 9). Three scenarios of sectored downstream areas were analysed to assess if this four-hour timeframe represents an optimal event anticipation and to evaluate the impact of spatial and temporal sectorization (Figure 13). These scenarios involved varying the time of anticipated warning issuance, ranging from the moment of hazard occurrence to four hours, four to eight hours and eight to twelve hours. These sectored downstream scenarios were compared to a reference scenario of a four-hour fixed warning issuance in a non-sectored downstream valley, with the results summarised within the respective sectors. To isolate the specific impact of warning issuance, the dissemination of this issuance and the mobilisation of the population were set without uncertainty, considering the median curve presented in Figure 7b.
The first four hours (Figure 13a) reveal a notable sensitivity in estimating the LOL, particularly within the first three sectors. However, this sensitivity diminishes between four and eight hours (Figure 13b), with a minor difference of two fatalities simulated in the second sector. A slight decrease in the mean values of LOL from eight to twelve hours is also evident (Figure 13c), except for in the third sector, where the mean value experiences a reduction of over 40%.
It suggests that having prior knowledge limited to four hours may not be an optimal scenario for reducing the LOL in the third sector. While the other sectors exhibit stabilisation or only a slight difference in the absolute values of the median after the initial four hours, the LOL in the third sector continues to show significant changes, as a function of their specific vulnerability, exposure and hydrodynamic characteristics.
It is crucial to maintain awareness that although the design of an efficient EWES and the strategic implementation of sectorisation can unquestionably result in a notable decrease in the LOL, the perceptions and patterns exposed in this paper can be specific to the actual case study. In other cases, the results may vary. Several studies have unveiled a noticeable trend regarding mitigating LOL in EWES scenarios with different magnitudes. However, it was noticed that during critical junctures, mainly when an imminent hazard is near, the optimal course of action for the population might involve seeking shelter within buildings. This recommendation is based on observations that, during such moments, a significant influx of vehicles can reduce the road capacity, consequently reelevating the LOL [35,37,40].
The results and specificities of the study underline the importance of LOL simulations in obtaining a deeper understanding of the functioning of the EWES implemented or suggested. These findings and their patterns can help define alternative methods of disseminating warnings and allocating resources to increase awareness and preparedness among at-risk populations.
5. Conclusions
The estimation of loss of life (LOL) plays a vital role in flood emergency planning. This study assesses the impact of early warning and evacuation systems (EWES) on the potential LOL in the hypothetical scenario of a dam breach at Pampulha Lake. Specifically, the analysis focuses on examining the impact of this event on various sectors located in a downstream valley of the dam.
The LOL estimation revealed that a minimum desirable time for issuing warnings before the hazardous event was four hours, particularly in a scenario with high population mobilisation. Furthermore, it was revealed that the level of preparedness and perception of mobilisation, especially in the initial three sectors, significantly influenced the mitigation of LOL.
6. Further Research
The proposed sectorisation approach was crucial for understanding the effectiveness of dam-breach flood alerts in mitigating loss of life. It revealed that the effect of different warning and evacuation strategies might influence the areas at risk differently, according to their vulnerability, exposure and the hazard and EWES spatiotemporal characteristics. Therefore, it is recommended that similar approaches should be used in other case studies when EWES effectiveness is aimed for, especially for high-density population areas.
Furthermore, the estimation inputs for LOL calculations involve several uncertainties. A dam-breach flood event exhibits significant variability due to uncertainties associated with dam-breach parameters [72,73]. Acquiring data for exposure and vulnerability analysis at the microscale, particularly in this case, poses challenges, necessitating the consideration of various hypotheses regarding the transfer of characteristics from another scale to the microscale [62]. Furthermore, relying solely on a sample of historical events to characterise the warning and evacuation processes may not adequately represent the specific circumstances of a region in different contexts from those used in this analysis. In this study, our primary objective was to analyse the impact of LOL alleviation. Further research could consider and discuss these cited sources of uncertainties in the estimation model aiming to enhance the understanding of these uncertainties.
Author Contributions
Conceptualisation, A.F.R.S. and J.C.E.; methodology, A.F.R.S. and J.C.E.; validation, A.F.R.S. and J.C.E.; formal analysis, A.F.R.S. and J.C.E.; investigation, A.F.R.S. and J.C.E.; resources, A.F.R.S. and J.C.E.; writing—original draft preparation, A.F.R.S. and J.C.E.; writing—review and editing, A.F.R.S. and J.C.E.; visualisation, A.F.R.S.; supervision, J.C.E.; project administration, J.C.E.; funding acquisition, J.C.E. All authors have read and agreed to the published version of the manuscript.
Funding
This research was funded by the Brazilian research institutions, foundations and agencies Coordenação de Aperfeiçoamento de Pessoal de Nível Superior (CAPES), Conselho Nacional de Desenvolvimento Científico e Tecnológico (CNPq), Fundação de Amparo à Pesquisa do Estado de Minas Gerais (FAPEMIG) and Pró-Reitoria de Pesquisa, Universidade Federal de Minas Gerais (PRPq/UFMG).
Data Availability Statement
The data are available upon request.
Conflicts of Interest
The authors declare no conflict of interest. The funders had no role in the design of the study; in the collection, analyses, or interpretation of data; in the writing of the manuscript; or in the decision to publish the results.
References
- Ge, W.; Sun, H.; Zhang, H.; Li, Z.; Guo, X.; Wang, X.; Qin, Y.; Gao, W.; van Gelder, P. Economic Risk Criteria for Dams Considering the Relative Level of Economy and Industrial Economic Contribution. Sci. Total Environ. 2020, 725, 138139. [Google Scholar] [CrossRef] [PubMed]
- Sarchani, S.; Koutroulis, A.G. Probabilistic Dam Breach Flood Modeling: The Case of Valsamiotis Dam in Crete. Nat. Hazards 2022, 114, 1763–1814. [Google Scholar] [CrossRef]
- Mishra, A.; Mukherjee, S.; Merz, B.; Singh, V.P.; Wright, D.B.; Villarini, G.; Paul, S.; Kumar, D.N.; Khedun, C.P.; Niyogi, D.; et al. An Overview of Flood Concepts, Challenges, and Future Directions. J. Hydrol. Eng. 2022, 27, 2164. [Google Scholar] [CrossRef]
- Chai, J.; Wu, H.-Z. Prevention/Mitigation of Natural Disasters in Urban Areas. Smart Constr. Sustain. Cities 2023, 1, 4. [Google Scholar] [CrossRef]
- Zheng, Q. Method for a New Risk Assessment of Urban Inundation: G-DEMATEL-AHP. MethodsX 2023, 10, e101997. [Google Scholar] [CrossRef]
- Jonkman, S.N.; Van Gelder, P.H.A.J.M.; Vrijling, J.K. An Overview of Quantitative Risk Measures for Loss of Life and Economic Damage. J. Hazard Mater 2003, 99, 1–30. [Google Scholar] [CrossRef]
- CRED; UNISDR. Economic Losses, Poverty and Disasters 1998–2017; UNISDR: Geneva, Switzerland, 2018. [Google Scholar]
- Zhang, J.; Xu, W.; Liao, X.; Zong, S.; Liu, B. Global Mortality Risk Assessment from River Flooding under Climate Change. Environ. Res. Lett. 2021, 16, 064036. [Google Scholar] [CrossRef]
- Hu, P.; Zhang, Q.; Shi, P.; Chen, B.; Fang, J. Flood-Induced Mortality across the Globe: Spatiotemporal Pattern and Influencing Factors. Sci. Total Environ. 2018, 643, 171–182. [Google Scholar] [CrossRef]
- Merz, B.; Blöschl, G.; Vorogushyn, S.; Dottori, F.; Aerts, J.C.J.H.; Bates, P.; Bertola, M.; Kemter, M.; Kreibich, H.; Lall, U.; et al. Causes, Impacts and Patterns of Disastrous River Floods. Nat. Rev. Earth Environ. 2021, 2, 592–609. [Google Scholar] [CrossRef]
- Hammond, M.J.; Chen, A.S.; Djordjević, S.; Butler, D.; Mark, O. Urban Flood Impact Assessment: A State-of-the-Art Review. Urban Water J. 2015, 12, 14–29. [Google Scholar] [CrossRef]
- Kreibich, H.; Van Loon, A.F.; Schröter, K.; Ward, P.J.; Mazzoleni, M.; Sairam, N.; Abeshu, G.W.; Agafonova, S.; AghaKouchak, A.; Aksoy, H.; et al. The Challenge of Unprecedented Floods and Droughts in Risk Management. Nature 2022, 608, 80–86. [Google Scholar] [CrossRef]
- Kreibich, H.; Hudson, P.; Merz, B. Knowing What to Do Substantially Improves the Effectiveness of Flood Early Warning. Bull. Am. Meteorol. Soc. 2021, 102, E1450–E1463. [Google Scholar] [CrossRef]
- Thieken, A.H.; Bubeck, P.; Heidenreich, A.; von Keyserlingk, J.; Dillenardt, L.; Otto, A. Performance of the Flood Warning System in Germany in July 2021—Insights from Affected Residents. Nat. Hazards Earth Syst. Sci. 2023, 23, 973–990. [Google Scholar] [CrossRef]
- Lumbroso, D.; Davison, M. Use of an Agent-Based Model and Monte Carlo Analysis to Estimate the Effectiveness of Emergency Management Interventions to Reduce Loss of Life during Extreme Floods. J. Flood Risk Manag. 2018, 11, S419–S433. [Google Scholar] [CrossRef]
- Rotta, L.H.S.; Alcântara, E.; Park, E.; Negri, R.G.; Lin, Y.N.; Bernardo, N.; Mendes, T.S.G.; Souza Filho, C.R. The 2019 Brumadinho Tailings Dam Collapse: Possible Cause and Impacts of the Worst Human and Environmental Disaster in Brazil. Int. J. Appl. Earth Obs. Geoinf. 2020, 90, 102–119. [Google Scholar] [CrossRef]
- Lumbroso, D.; Davison, M.; Body, R.; Petkovšek, G. Modelling the Brumadinho Tailings Dam Failure, the Subsequent Loss of Life and How It Could Have Been Reduced. Nat. Hazards Earth Syst. Sci. 2021, 21, 21–37. [Google Scholar] [CrossRef]
- Apel, H.; Vorogushyn, S.; Merz, B. Brief Communication: Impact Forecasting Could Substantially Improve the Emergency Management of Deadly Floods: Case Study July 2021 Floods in Germany. Nat. Hazards Earth Syst. Sci. 2022, 22, 3005–3014. [Google Scholar] [CrossRef]
- Silva, A.F.R.; Eleutério, J.C. Analysis of Flood Warning and Evacuation Efficiency by Comparing Damage and Life-Loss Estimates with Real Consequences Related to the São Francisco Tailings Dam Failure in Brazil. Nat. Hazards Earth Syst. Sci. 2023, 23, 3095–3110. [Google Scholar] [CrossRef]
- Ge, W.; Jiao, Y.; Wu, M.; Li, Z.; Wang, T.; Li, W.; Zhang, Y.; Gao, W.; van Gelder, P. Estimating Loss of Life Caused by Dam Breaches Based on the Simulation of Floods Routing and Evacuation Potential of Population at Risk. J. Hydrol. 2022, 612, 128059. [Google Scholar] [CrossRef]
- Jiao, H.; Li, W.; Ma, D. Assessment of Life Loss Due to Dam Breach Using Improved Variable Fuzzy Method. Sci. Rep. 2022, 12, 3237. [Google Scholar] [CrossRef]
- Friedman, D.G. Computer Simulation in Natural Hazard Assessment; Institute of Behavioral Science, University of Colorado: Boulder, CO, USA, 1975. [Google Scholar]
- Brown, C.A.; Graham, W.J. Assessing the Threat to Life from Dam Failure. J. Am. Water Resour. Assoc. 1988, 24, 1303–1309. [Google Scholar] [CrossRef]
- DeKay, M.L.; McClelland, G.H. Predicting Loss of Life in Cases of Dam Failure and Flash Flood. Risk Anal. 1993, 13, 193–205. [Google Scholar] [CrossRef]
- Graham, W. A Procedure for Estimating Loss of Life Caused by Dam Failure. Sediment; U.S. Department of the Interior Bureau of Reclamation: Denver, CO, USA, 1999. [Google Scholar]
- Aboelata, M.; Bowles, D.S. LIFESim: A Model for Estimating Dam Failure Life Loss; Utah State University: Logan, UT, USA, 2005. [Google Scholar]
- Johnstone, W.M.; Sakamoto, D.; Assaf, H.; Bourban, S. Architecture, Modelling Framework and Validation of BC Hydro’s Virtual Reality Life Safety Model. In Proceedings of the International Symposium on Stochastic Hydraulics, Nijmegen, The Netherlands, 23–24 May 2005; Volume 2005. [Google Scholar]
- Jonkman, S.N.; Vrijling, J.K.; Vrouwender, A.C.W.M. Methods for the Estimation of Loss of Life Due to Floods: A Literature Review and a Proposal for a New Method. Nat. Hazards 2008, 46, 353–389. [Google Scholar] [CrossRef]
- U.S. Department of the Interior Bureau of Reclamation. RCEM—Reclamation Consequence Estimating Methodology—Guidelines for Estimating Life Loss for Dam Safety Risk Analysis; U.S. Department of the Interior Bureau of Reclamation: Washington, DC, USA, 2015. [Google Scholar]
- Huang, D.; Yu, Z.; Li, Y. Calculation Method and Application of Loss of Life Caused by Dam Break in China. Nat. Hazards 2017, 85, 39–57. [Google Scholar] [CrossRef]
- Jonkman, S.N.; Maaskant, B.B.; Kolen, B.B.; Needham, J.T.J. Loss of Life Estimation—Review, Developments and Challenges. In Proceedings of the III European Conference on Flood Risk Management, Lyon, France, 17–21 October 2016; Volume 7. [Google Scholar]
- Zhuo, L.; Han, D. Agent-Based Modelling and Flood Risk Management: A Compendious Literature Review. J. Hydrol. 2020, 591, 125600. [Google Scholar] [CrossRef]
- USACE HEC-LifeSim. Life Loss Estimation. User’s Manual—Version 1.0.1; USACE: Davis, CA, USA, 2018. [Google Scholar]
- Needham, J.; Fields, W.; Lehman, W. The US Army Corps of Engineers Scalable Approach to Estimating Loss of Life from Flooding. In Proceedings of the III European Conference on Flood Risk Management, Lyon, France, 17–21 October 2016; p. 6. [Google Scholar]
- Hill, P.; Kavanagh, C.; Lang, S. Applications of Simulation Model to Estimate Potential Loss of Life. In Proceedings of the XXVI International Congress on Large Dams, Viena, Austria, 1–7 July 2018. [Google Scholar]
- Kalinina, A.; Spada, M.; Burgherr, P. Alternative Life-Loss Rates for Failures of Large Concrete and Masonry Dams in Mountain Regions of OECD Countries. In Proceedings of the XXVIII International European Safety and Reliability Conference, ESREL 2018, Trondheim, Norway, 17–21 June 2018; p. 9. [Google Scholar]
- Leong-Cuzack, T.; Nielsen, C.; Kavanagh, C.; Watt, S. Quantitative Assessment of Dam Safety Emergency Management Using HEC-LifeSim: Is It Feasible? In Proceedings of the Australian Committee on Large Dams Conference, Auckland, New Zealand, 9–12 October 2019; p. 11. [Google Scholar]
- Wang, H. Lessons Learnt From Evacuation Modelling for Dam Failure Consequence Assessments. In Proceedings of the Australian Committee on Large Dams Conference, Auckland, New Zealand, 9–12 October 2019; p. 9. [Google Scholar]
- Tomura, S.; Chiba, M.; Yamamoto, T.; Uemura, F.; Masuya, S.; Omura, N.; Yoshida, T.; Takeda, A.; Hoshino, T.; Yamada, T.; et al. Fatality Estimation by Life Loss Evaluation Model for the Large-Scale Floods under Future Climate. In Proceedings of the 22nd Congress of the International Association for Hydro-Environment Engineering and Research-Asia Pacific Division, IAHR-APD 2020: “Creating Resilience to Water-Related Challenges”, Sapporo, Japan, 14–17 September 2020; pp. 1–8. [Google Scholar]
- El Bilali, A.; Taleb, A.; Boutahri, I. Application of HEC-RAS and HEC-LifeSim Models for Flood Risk Assessment. J. Appl. Water Eng. Res. 2021, 9, 336–351. [Google Scholar] [CrossRef]
- Kalinina, A.; Spada, M.; Burgherr, P. Quantitative Assessment of Uncertainties and Sensitivities in the Estimation of Life Loss Due to the Instantaneous Break of a Hypothetical Dam in Switzerland. Water 2021, 13, 22. [Google Scholar] [CrossRef]
- El Bilali, A.; Taleb, I.; Nafii, A.; Taleb, A. A Practical Probabilistic Approach for Simulating Life Loss in an Urban Area Associated with a Dam-Break Flood. Int. J. Disaster Risk Reduct. 2022, 2022, 103011. [Google Scholar] [CrossRef]
- Lang, S. Current Australian and International Practices for Dam Failure Consequence Assessments. In Proceedings of the Australian Committee on Large Dams Conference, Melbourne, Australia, 10 November–10 December 2018; Australian National Committee on Large Dams: Melbourne, VIC, Austrália, 2018; pp. 1–6. [Google Scholar]
- McClelland, D.M.; Bowles, D.S. Estimating Life Loss for Dam Safety Risk Assessment—A Review and New Approach; Institute for Water Resources, U.S. Army Corps of Engineers: Alexandria, VA, USA, 2002. [Google Scholar]
- Aboelata, M.; Bowles, D.S.; McClelland, D.M. A Model for Estimating Dam Failure Life Loss. In Proceedings of the Australian Committee on Large Dams Risk Workshop, Launceston, TAS, Australia, 10 October 2003; p. 18. [Google Scholar]
- Sorensen, J.H.; Lindell, M.K.; Baker, E.J.; Lehman, W.P. Community Response to Hurricane Threat: Estimates of Warning Issuance Time Distributions. Weather Clim. Soc. 2020, 12, 837–846. [Google Scholar] [CrossRef]
- Lindell, M.K.; Sorensen, J.H.; Baker, E.J.; Lehman, W.P. Community Response to Hurricane Threat: Estimates of Warning Diffusion Time Distributions. Weather Clim. Soc. 2021, 22, 04021007. [Google Scholar] [CrossRef]
- Koll, C.; Lindell, M.K.; Chen, C.; Wang, H. Emergency Warning Dissemination in a Multiplex Social Network. JASSS 2023, 26, 4946. [Google Scholar] [CrossRef]
- Lindell, M.K.; Sorensen, J.H.; Baker, E.J.; Lehman, W.P. Community Response to Hurricane Threat: Estimates of Household Evacuation Preparation Time Distributions. Transp. Res. D Transp. Environ. 2020, 85, 102457. [Google Scholar] [CrossRef]
- Chen, C.; Koll, C.; Wang, H.; Lindell, M.K. An Interdisciplinary Agent-Based Evacuation Model: Integrating the Natural Environment, Built Environment, and Social System for Community Preparedness and Resilience. Nat. Hazards Earth Syst. Sci. 2023, 23, 733–749. [Google Scholar] [CrossRef]
- Alaeddine, H.; Serrhini, K.; Maizia, M.; Néron, E. A Spatiotemporal Optimization Model for the Evacuation of the Population Exposed to Flood Hazard. Nat. Hazards Earth Syst. Sci. 2015, 15, 687–701. [Google Scholar] [CrossRef]
- Lee, Y.H.; Kim, H.I.; Han, K.Y.; Hong, W.H. Flood Evacuation Routes Based on Spatiotemporal Inundation Risk Assessment. Water 2020, 12, 2271. [Google Scholar] [CrossRef]
- Bopp, E.; Douvinet, J. Alerting People Prioritising Territories over Technologies. A Design Framework for Local Decision Makers in France. Appl. Geogr. 2022, 146, 102769. [Google Scholar] [CrossRef]
- Vianini Neto, L. Estudo de Ruptura Da Barragem Da Pampulha, Em Belo Horizonte: Retroanálise Da Brecha Do Acidente de 1954 e Ruptura Hipotética Nas Condições Atuais. Master’s Thesis, Federal University of Minas Gerias, Belo Horizonte, Brazil, 2016. [Google Scholar]
- Silva, T.F.G.; Vinçon-Leite, B.; Giani, A.; Figueredo, C.C.; Petrucci, G.; Lemaire, B.; Von Sperling, E.; Tassin, B.; Seidl, M.; Khac, V.T.; et al. Modelagem Da Lagoa Da Pampulha: Uma Ferramenta Para Avaliar o Impacto Da Bacia Hidrográfica Na Dinâmica Do Fitoplâncton. Eng. Sanit. Ambient. 2016, 21, 95–108. [Google Scholar] [CrossRef]
- Psomiadis, E.; Tomanis, L.; Kavvadias, A.; Soulis, K.X.; Charizopoulos, N.; Michas, S. Potential Dam Breach Analysis and Flood Wave Risk Assessment Using HEC-RAS and Remote Sensing Data: A Multicriteria Approach. Water 2021, 13, 364. [Google Scholar] [CrossRef]
- Froehlich, D.C. Embankment Dam Breach Parameters and Their Uncertainties. J. Hydraul. Eng. 2008, 134, 1708–1721. [Google Scholar] [CrossRef]
- Brunner, G.W. HEC-RAS. River Analysis System. Hydraulic Reference Manual—Version 6.0; U.S. Army Corps of Engineers: Davis, CA, USA, 2021. [Google Scholar]
- Merz, B.; Kreibich, H.; Schwarze, R.; Thieken, A. Review Article “Assessment of Economic Flood Damage”. Nat. Hazards Earth Syst. Sci. 2010, 10, 1697–1724. [Google Scholar] [CrossRef]
- De Moel, H.; Jongman, B.; Kreibich, H.; Merz, B. Flood Risk Assessments at Different Spatial Scales. Mitig. Adapt. Strat. Glob. Chang. 2015, 20, 865–890. [Google Scholar] [CrossRef] [PubMed]
- Mauro, M.D.; De Bruijn, K.M.; Meloni, M. Quantitative Methods for Estimating Flood Fatalities: Towards the Introduction of Loss-of-Life Estimation in the Assessment of Flood Risk. Nat. Hazards 2012, 63, 1083–1113. [Google Scholar] [CrossRef]
- Paprotny, D.; Mengel, M. Population, Land Use and Economic Exposure Estimates for Europe at 100 m Resolution from 1870 to 2020. Sci. Data 2023, 10, 372. [Google Scholar] [CrossRef] [PubMed]
- Sorensen, J.; Mileti, D. First Alert and/or Warning Issuance Time Estimation for Dam Breaches, Controlled Dam Releases, and Levee Breaches or Overtopping; U.S. Army Corps of Engineers: Davis, CA, USA, 2015. [Google Scholar]
- Sorensen, J.; Mileti, D. First Alert or Warning Diffusion Time Estimation for Dam Breaches, Controlled Dam Releases and Levee Breaches or Overtopping; U.S. Army Corps of Engineers: Davis, CA, USA, 2015. [Google Scholar]
- Sorensen, J.; Mileti, D. Protective Action Initiation Time Estimation for Dam Breaches, Controlled Dam Releases, and Levee Breaches or Overtopping; U.S. Army Corps of Engineers: Davis, CA, USA, 2015. [Google Scholar]
- Needham, J.; Sorensen, J.; Mileti, D.; Lang, S. Warning and Mobilization of Populations at Risk of Dam Failure. In Proceedings of the ANCOLD Conference, Adelaide, Australia, 17–19 October 2016; pp. 1–10. [Google Scholar]
- Greenshields, B.D.; Channing, W.; Miller, H. A Study of Traffic Capacity. In Proceedings of the XIV Annual Meeting of the Highway Research Board, Washington, DC, USA, 18–20 November 1935. [Google Scholar]
- Dijkstra, E.W. A Note on Two Problems in Connexion with Graphs. Numer. Math. 1959, 1, 269–271. [Google Scholar] [CrossRef]
- USACE LifeSim. Version 2.0. Hydrologic Engineering Center; U.S. Army Corps of Engineers: Davis, CA, USA, 2021. [Google Scholar]
- Sorensen, J.; Mileti, D. Influence Weights and Measures for the Factors Shaping First Alert/Warning Delay, Diffusion and Protective Action Initiation Curves for Dam Breaches, Controlled Dam Releases, and Levee Breaches or Overtopping; U.S. Army Corps of Engineers: Davis, CA, USA, 2015. [Google Scholar]
- Sorensen, J.; Mileti, D. Interview Schedule. Community Warning Issuance, Diffusion, and Protective Action Initiation Estimation; U.S. Army Corps of Engineers: Davis, CA, USA, 2015. [Google Scholar]
- Bello, D.; Alcayaga, H.; Caamaño, D.; Pizarro, A. Influence of Dam Breach Parameter Statistical Definition on Resulting Rupture Maximum Discharge. Water 2022, 14, 1776. [Google Scholar] [CrossRef]
- Rizzo, C.; Maranzoni, A.; D’Oria, M. Probabilistic Mapping and Sensitivity Assessment of Dam-Break Flood Hazard. Hydrol. Sci. J. 2023, 68, 700–718. [Google Scholar] [CrossRef]
Figure 1.
Pampulha Lake reservoir and its dam and downstream valley location.

Figure 2.
Photos (a) before, (b) during and (c) after the 1954 Pampulha Lake dam failure. Source: adapted from Vianini Neto [54].
Figure 2.
Photos (a) before, (b) during and (c) after the 1954 Pampulha Lake dam failure. Source: adapted from Vianini Neto [54].

Figure 3.
Image of the current downstream valley occupation of the Pampulha Lake dam.

Figure 4.
LifeSim modules and their relationship with the methodological approach.

Figure 5.
Maximum depths (a) and velocities (b) with arrival time cross-sections for each 30 min.

Figure 6.
Downstream exposure and vulnerability analysis and the inundation boundary.

Figure 7.
Two parts of analysis in the warning and evacuation process and their values: (a) between the hazard identification and the warning issuance; and uncertainties in the recommended values of warning dissemination delay and mobilisation time proposed by Sorensen and Mileti [61,62], considering (b) fast warning dissemination and high perception and preparedness of the population and fast warning dissemination and (c) low perception and preparedness of the population.

Figure 8.
Sectors, their number of buildings and population directly impacted by the flood, and the roads and destinations used in EWES and LOL evaluation.
Figure 8.
Sectors, their number of buildings and population directly impacted by the flood, and the roads and destinations used in EWES and LOL evaluation.

Figure 9.
Fatality rates for the high mobilisation scenario summarised by sector and general estimation.
Figure 9.
Fatality rates for the high mobilisation scenario summarised by sector and general estimation.

Figure 10.
Fatality rates for the low mobilisation scenario summarised by sector and general estimation.
Figure 10.
Fatality rates for the low mobilisation scenario summarised by sector and general estimation.

Figure 11.
Fatality rates for the high mobilisation scenario summarised by sector when the warning is issued at the moment of dam breach.
Figure 11.
Fatality rates for the high mobilisation scenario summarised by sector when the warning is issued at the moment of dam breach.

Figure 12.
Fatality rates for the high mobilisation scenario summarised by sector when the warning is issued four hours before dam breach.
Figure 12.
Fatality rates for the high mobilisation scenario summarised by sector when the warning is issued four hours before dam breach.

Figure 13.
Comparison between a non-sectored simulation, where a fixed warning was issued four hours prior to the occurrence of the hazard, and sectored simulations with warnings issued within different time ranges: (a) between the moment of a dam breach and 4 h, (b) between 4 and 8 h and (c) between 8 and 12 h.


Table 1.
Dam characteristics by [54] to obtain the breach hydrograph, applying the proposed equations of Froehlich [57].
| Parameter | Value |
|---|---|
| Crest length (m) | 450 |
| Height (m) | 20 |
| Crest elevation (m) | 805 |
| Maximum operation elevation (m) | 801 |
| Volume at maximum operation elevation (hm3) | 10 |
Table 2.
Summarised results of the dam-breach simulation in each arrival time cross-section.
| Cross-Section | Average Maximum Depth (m) | Average Maximum Velocity (m/s) |
|---|---|---|
| XS-30 min | 4.8 | 1.0 |
| XS-60 min | 3.9 | 0.9 |
| XS-90 min | 2.4 | 0.9 |
| XS-120 min | 2.8 | 1.2 |
| XS-150 min | 4.6 | 2.9 |
| XS-180 min | 4.1 | 1.3 |
| XS-210 min | 4.0 | 0.5 |
| XS-240 min | 4.8 | 0.9 |
Table 3.
Quantiles of LOL for each scenario of mobilisation by sector and general simulation.
| Sector | High Mobilisation | Low Mobilisation | ||||||||||||
|---|---|---|---|---|---|---|---|---|---|---|---|---|---|---|
| 0.05 | 0.25 | 0.50 | 0.75 | 0.90 | 0.95 | 0.99 | 0.05 | 0.25 | 0.50 | 0.75 | 0.90 | 0.95 | 0.99 | |
| 1 | 13 | 33 | 53 | 83 | 176 | 345 | 638 | 106 | 150 | 189 | 276 | 450 | 578 | 738 |
| 2 | 16 | 38 | 64 | 102 | 165 | 304 | 574 | 108 | 175 | 258 | 327 | 433 | 542 | 692 |
| 3 | 16 | 38 | 61 | 98 | 200 | 341 | 700 | 128 | 171 | 214 | 347 | 609 | 774 | 1024 |
| 4 | 0 | 4 | 7 | 13 | 19 | 26 | 49 | 11 | 21 | 30 | 42 | 54 | 65 | 86 |
| 5 | 0 | 2 | 5 | 9 | 14 | 18 | 32 | 9 | 15 | 21 | 31 | 44 | 53 | 68 |
| 6 | 0 | 1 | 3 | 6 | 10 | 12 | 17 | 4 | 9 | 15 | 21 | 26 | 29 | 35 |
| 7 | 0 | 0 | 0 | 0 | 0 | 1 | 1 | 0 | 0 | 0 | 0 | 1 | 1 | 3 |
| 8 | 0 | 1 | 2 | 3 | 3 | 3 | 4 | 0 | 1 | 2 | 3 | 3 | 4 | 4 |
| All | 59 | 129 | 197 | 304 | 570 | 1032 | 1950 | 416 | 563 | 713 | 1037 | 1613 | 2023 | 2499 |
Disclaimer/Publisher’s Note: The statements, opinions and data contained in all publications are solely those of the individual author(s) and contributor(s) and not of MDPI and/or the editor(s). MDPI and/or the editor(s) disclaim responsibility for any injury to people or property resulting from any ideas, methods, instructions or products referred to in the content. |
© 2023 by the authors. Licensee MDPI, Basel, Switzerland. This article is an open access article distributed under the terms and conditions of the Creative Commons Attribution (CC BY) license (https://creativecommons.org/licenses/by/4.0/).
Share and Cite
MDPI and ACS Style
Silva, A.F.R.; Eleutério, J.C. Effectiveness of a Dam-Breach Flood Alert in Mitigating Life Losses: A Spatiotemporal Sectorisation Analysis in a High-Density Urban Area in Brazil. Water 2023, 15, 3433. https://doi.org/10.3390/w15193433
AMA Style
Silva AFR, Eleutério JC. Effectiveness of a Dam-Breach Flood Alert in Mitigating Life Losses: A Spatiotemporal Sectorisation Analysis in a High-Density Urban Area in Brazil. Water. 2023; 15(19):3433. https://doi.org/10.3390/w15193433
Chicago/Turabian StyleSilva, André Felipe Rocha, and Julian Cardoso Eleutério. 2023. "Effectiveness of a Dam-Breach Flood Alert in Mitigating Life Losses: A Spatiotemporal Sectorisation Analysis in a High-Density Urban Area in Brazil" Water 15, no. 19: 3433. https://doi.org/10.3390/w15193433
Note that from the first issue of 2016, this journal uses article numbers instead of page numbers. See further details here.