
Instability of Embankment Slopes Due to Overflow and Drawdown


1
Department of Civil and Environmental Engineering, Dongshin University, Naju 58245, Republic of Korea
2
School of Engineering, University of Glasgow, Singapore 138683, Singapore
3
School of Engineering and Digital Sciences, Nazarbayev University, Nur-Sultan 010000, Kazakhstan
*
Author to whom correspondence should be addressed.
Water 2023, 15(19), 3402; https://doi.org/10.3390/w15193402
Submission received: 10 August 2023
/
Revised: 23 September 2023
/
Accepted: 26 September 2023
/
Published: 28 September 2023
(This article belongs to the Special Issue Prediction and Prevention of Risks Related to Hydro-Geotechnical Hazards)
Abstract
:Establishing a geotechnical rationale for an embankment overflow is challenging. The occurrence of embankment overflow is deemed unlikely since the initial highest water level of the embankment is assumed to be fixed as a designed flood water level or a seasonal flood-limited water level when calculating the rainfall amount in the hydrological stability analysis. However, the possibility of overtopping can be assessed by employing copula functions. This approach takes into account the return frequency of overflow and the fluctuation of probable water levels due to climate change rather than relying on the fixed highest water levels of an embankment. This study examined the effect of tensile cracks leading to the shallow failure of embankment slopes during drawdown and placed an emphasis on the vulnerability of embankment slopes due to extreme rainfall events. Throughout the comprehensive numerical simulations, it was found that the critical period for embankment slope collapse was immediately after drawdown for the upstream slope and during the initial stages of overflow for the downstream slope.
1. Introduction
Geotechnical structures, such as embankments and dams, provide numerous benefits to society. However, in recent years, floods resulting from dam failures have caused numerous disasters. The unexpected collapse of these structures, designed to store and discharge water, has caused significant damage and loss of life. Notable examples of dam collapses include the Vaiont Dam collapse in Italy (1963) [1], the Johnstown dam collapse in Pennsylvania, United States (1889) [2], the Machhu II Dam collapse in India (1974) [3], the Lake Delhi Dam collapse in the United States (2010) [4], and the Saddle Dam collapse in Laos (2019) [5]. Tragically, each of these incidents resulted in more than 2000 fatalities. Investigation into the causes of these collapses indicated that overtopping embankments or dams due to heavy rainfall, exceeding the designed capacity, was a primary factor. Research on the causes of dam collapses worldwide has revealed that 34% of these incidents were caused by overtopping due to insufficient spillway capacity, 30% by foundation defects, and 28% by piping and seepage [6]. Recognizing the potential risks posed by climate change, the International Committee on Large Dams (ICOLD) has emphasized the urgent need to develop monitoring and prediction technologies to safeguard dams. Table 1 summarizes the causes of dam collapses identified by researchers.
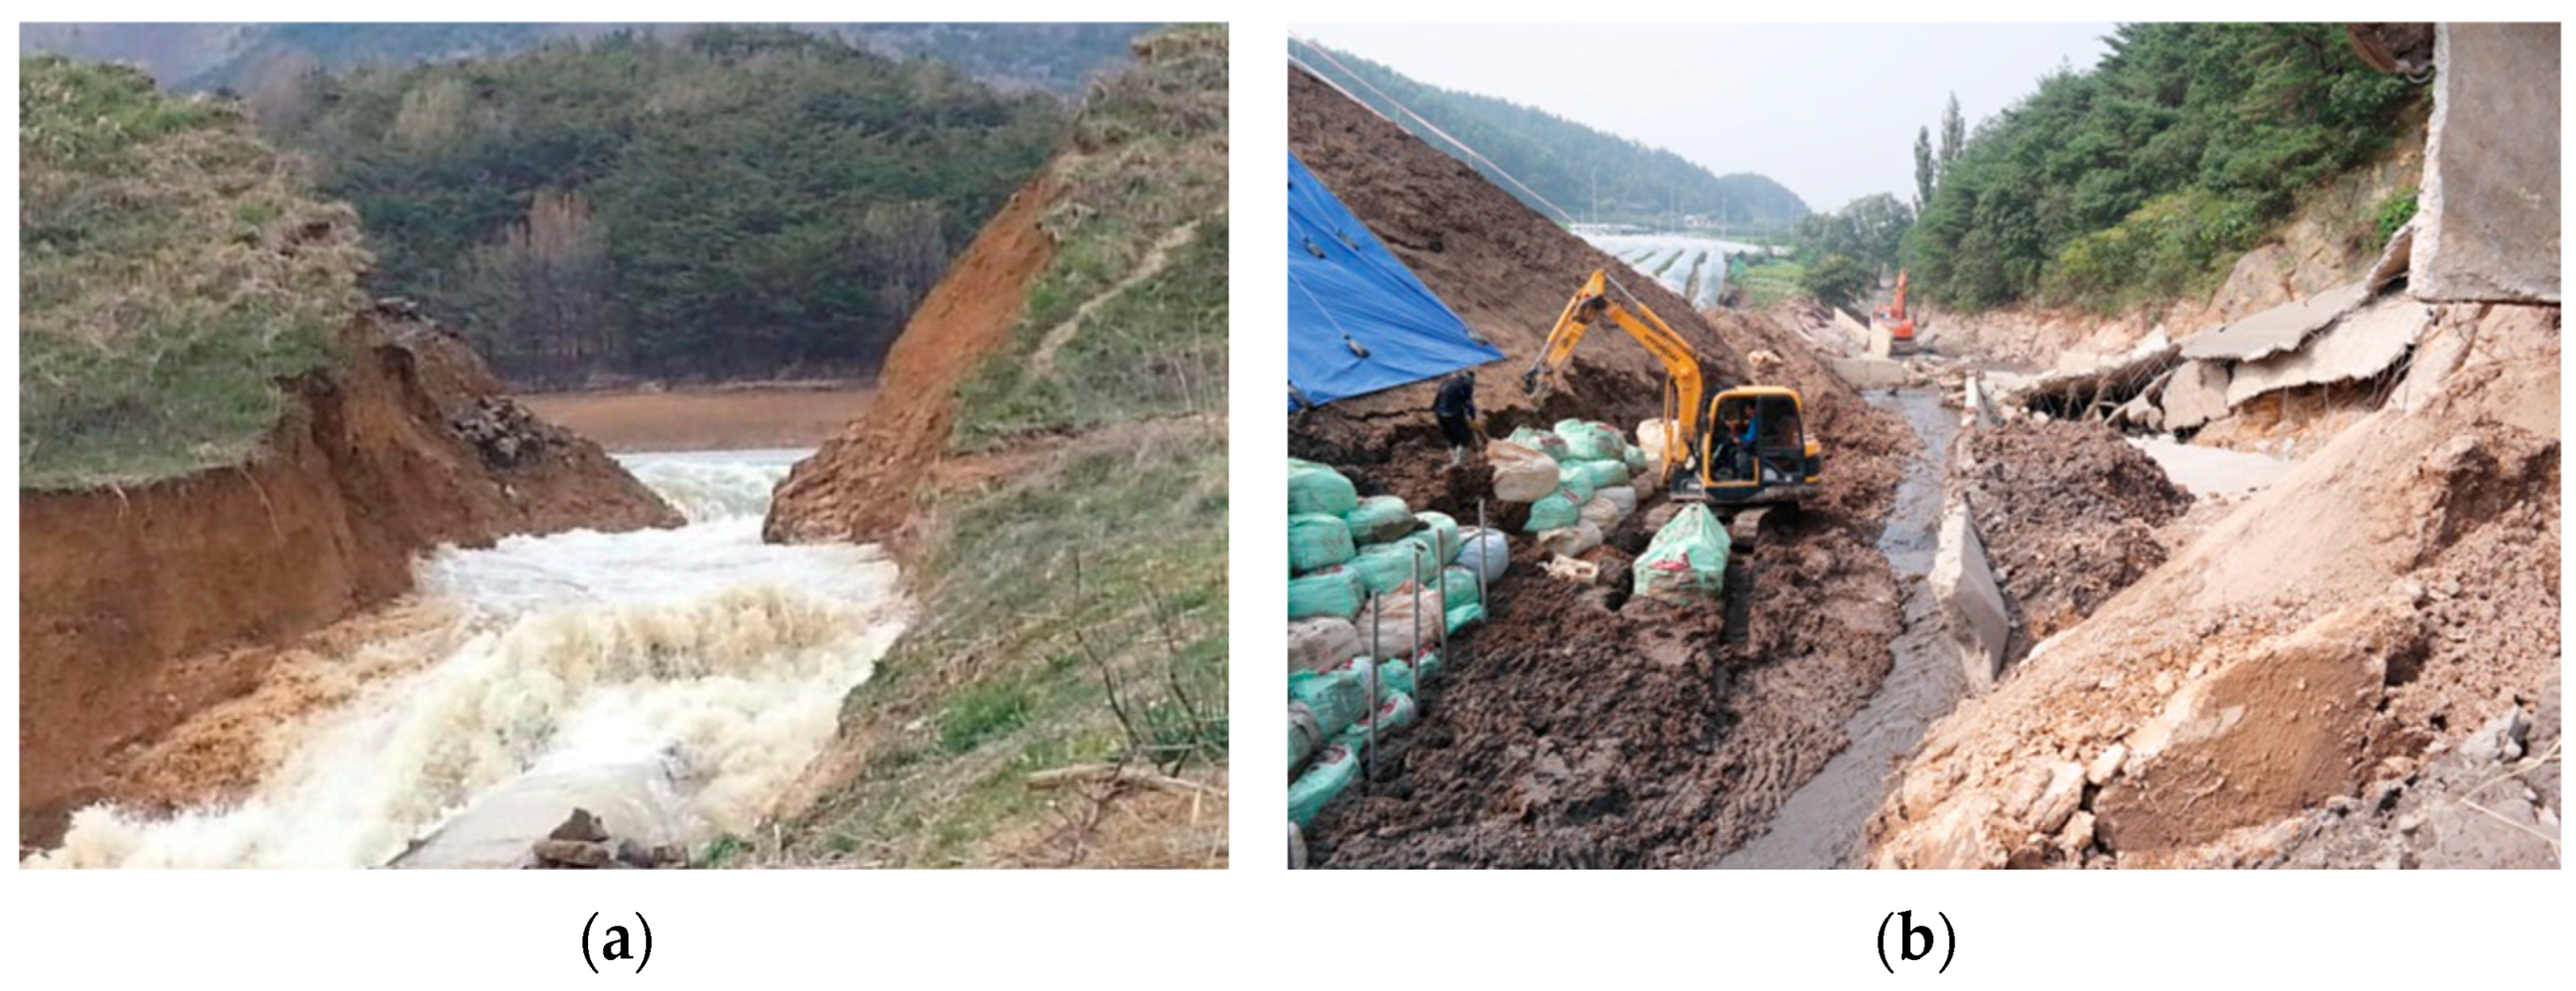
Overtopping poses significant risks, leading to potential landslides in concrete gravity dams and total or partial failures in earth or rockfill dams. The primary causes of overtopping are attributed to a lack of hydrological data and errors in hydrological design. Recent cases in Korea exemplify the consequences of overtopping caused by extreme water level fluctuations due to changes in rainfall patterns. The collapse of the San-Dae Reservoir in Gyeong Ju City, Gyeong-buk Province in 2013 can largely be attributed to the ageing of the reservoir and a decrease in its functionality [13]. These factors significantly altered its storage capacity. Similarly, the Cho-San Reservoir faced significant challenges during maintenance works to raise the embankment height. A heavy rainfall event with a recorded rainfall of over 300 mm ultimately led to the collapse of a 20 m retaining wall. The collapse of the Geo-Yeon reservoir dam in Yeongcheon City, Gyeong-buk Province, in 2014 was primarily caused by heavy rainfall [14]. This catastrophic event was exacerbated by the fact that the dam had deteriorated over a span of more than 70 years, ultimately leading to its collapse when inundated (Figure 1).
Various factors contribute to an embankment collapse, including unexpected and flash floods due to the impact of climate change, as well as insufficient dam freeboard, resulting in significant damages to downstream areas of the embankment. Therefore, various hydraulic and hydrological variables contributing to the embankment collapse are being determined and incorporated into the risk analysis [15,16,17,18]. However, a limitation arises during the risk analyses due to the assumption that the initial water level is set as either an ordinary high water level or a seasonal flood-limited water level. This assumption hampers the effectiveness of risk modeling, especially when dealing with unexpected and localized heavy rainfall events [19].
This study addressed the hydrological instability of embankment slopes by employing copula functions to model the initial water levels of an embankment based on historical rainfall characteristics. In addition, the analysis incorporated an instability assessment of unsaturated slopes subjected to rainwater infiltration and overtopping. While the instability of embankment slopes is typically associated with rapid drawdown, this study focused on the stability analysis for embankments that have recently experienced failures under extreme rainfall events, considering the possibility of overtopping. In addition, shallow failures of embankment slopes were also investigated with the incorporation of tension cracks.
2. Hydrological Analysis of Embankment Slope
2.1. Initial Water Levels of an Embankment Using Copula Functions
First, the stability of the embankment or dam slope was hydrologically examined to determine the probability of overtopping. An initial water level of the embankment was calculated, which is a major uncertainty variable in the hydrological analysis, using the copula function. This function was based on the statistical relationship between the antecedent rainfall and past data on the water levels, offering an effective means for understanding variable dependency, particularly when examining the distribution between variables. The copula function was first introduced by Sklar (1959) [20]. This study evaluated the occurrence of unexpected overtopping. For the given probability variables X and Y, the marginal cumulative distribution functions and exist for the multivariate cumulative distribution function . If these marginal cumulative distribution functions are independent of each other, a copula function C also exists. Here, the marginal cumulative distribution functions and are determined by the probability distribution functions of the probability variables X and Y. The copula function defines the multivariate cumulative distribution function of the marginal cumulative distribution functions and , as shown in Equation (1). In this equation, x represents the antecedent rainfall and y corresponds to the dam water level, corresponding to the observed x.
In this study, the initial fluctuating water level was determined using the copula function that considers the relationship between the antecedent rainfall and dam water levels. Table 2 presents the multivariate probability distribution equations of the commonly known copula functions, which mainly use two variables which were applied to all three copula functions to check whether overflow occurred with consideration of the initial fluctuation of water level. Table 3 lists the maximum, minimum, and average rainfall amounts calculated from the 48-h maximum rainfall data collected at 12 rainfall observatories near dams to perform probability rainfall modeling for overtopping. Table 3 also includes the standard deviations and constants required for the probability rainfall analysis.
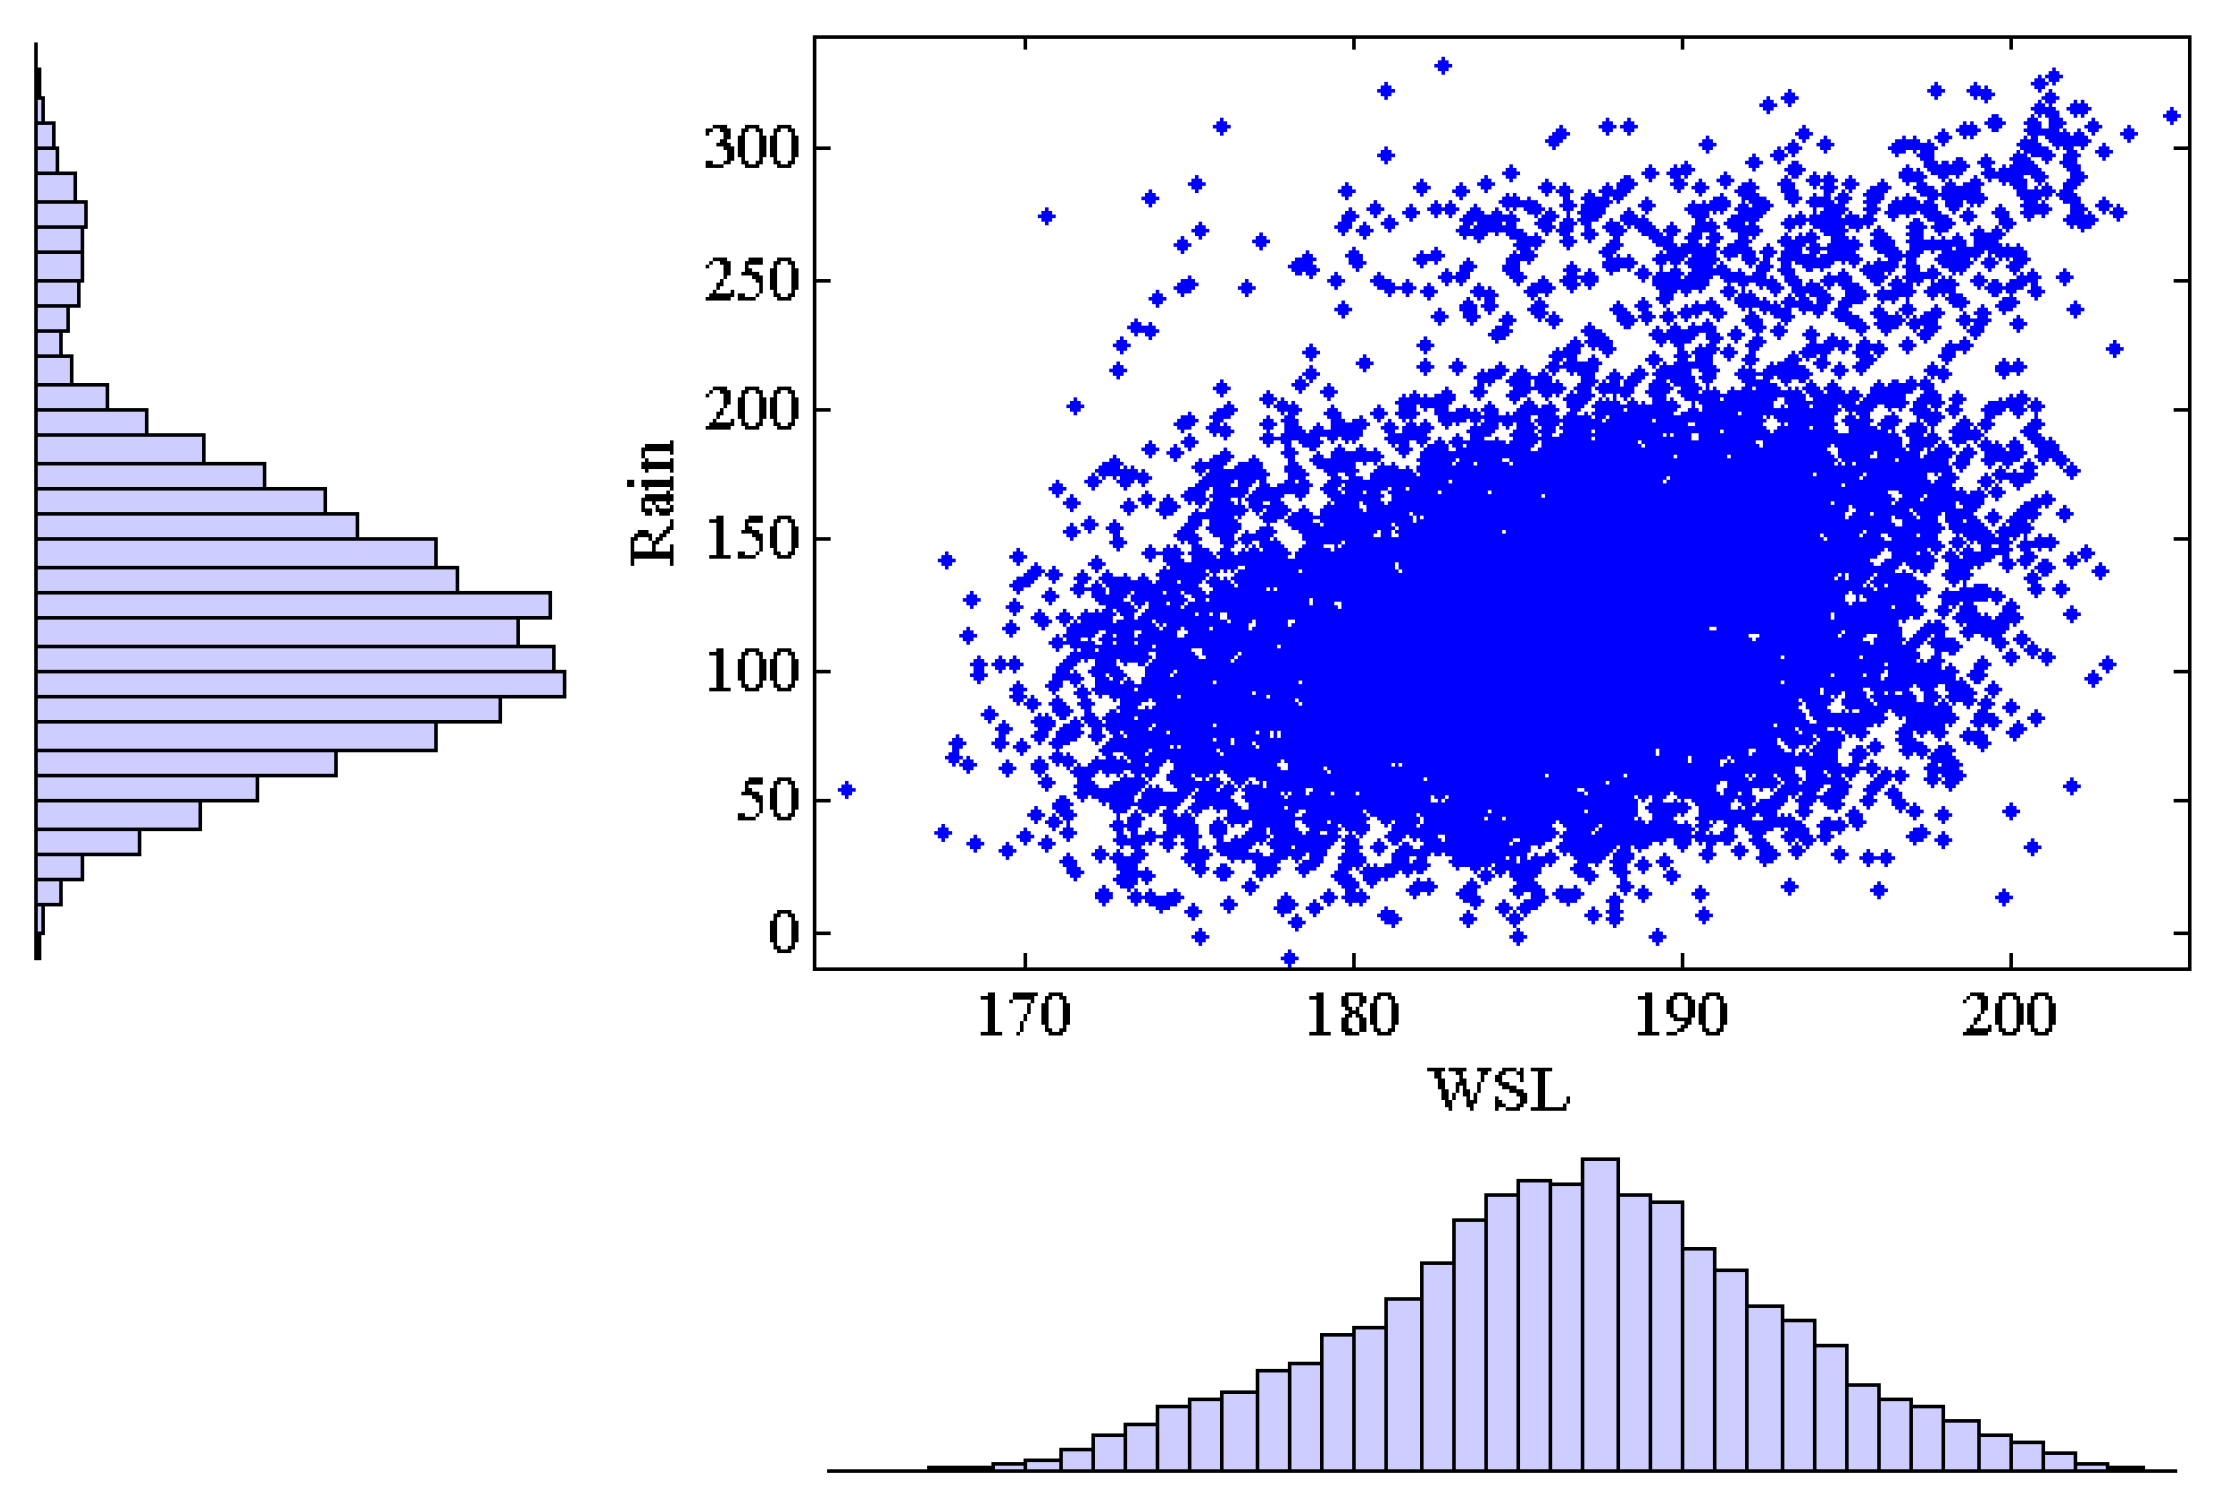
Figure 2 shows the results of modeling the water levels based on the observed antecedent rainfall and water level data using the three copula functions, as presented in Table 2. With the consideration of the fluctuation of the water level, the Gumbel function consistently revealed the highest probability of overflow occurrence. These findings highlighted the effectiveness of the probability distribution for accurately describing conventional rainfall patterns and water level characteristics. A risk analysis was then performed using the modeled water level results as the initial fluctuating water level. As a result, this approach enabled a highly reliable dam risk analysis by considering the fluctuations in the initial water levels.
2.2. Overtopping Probability
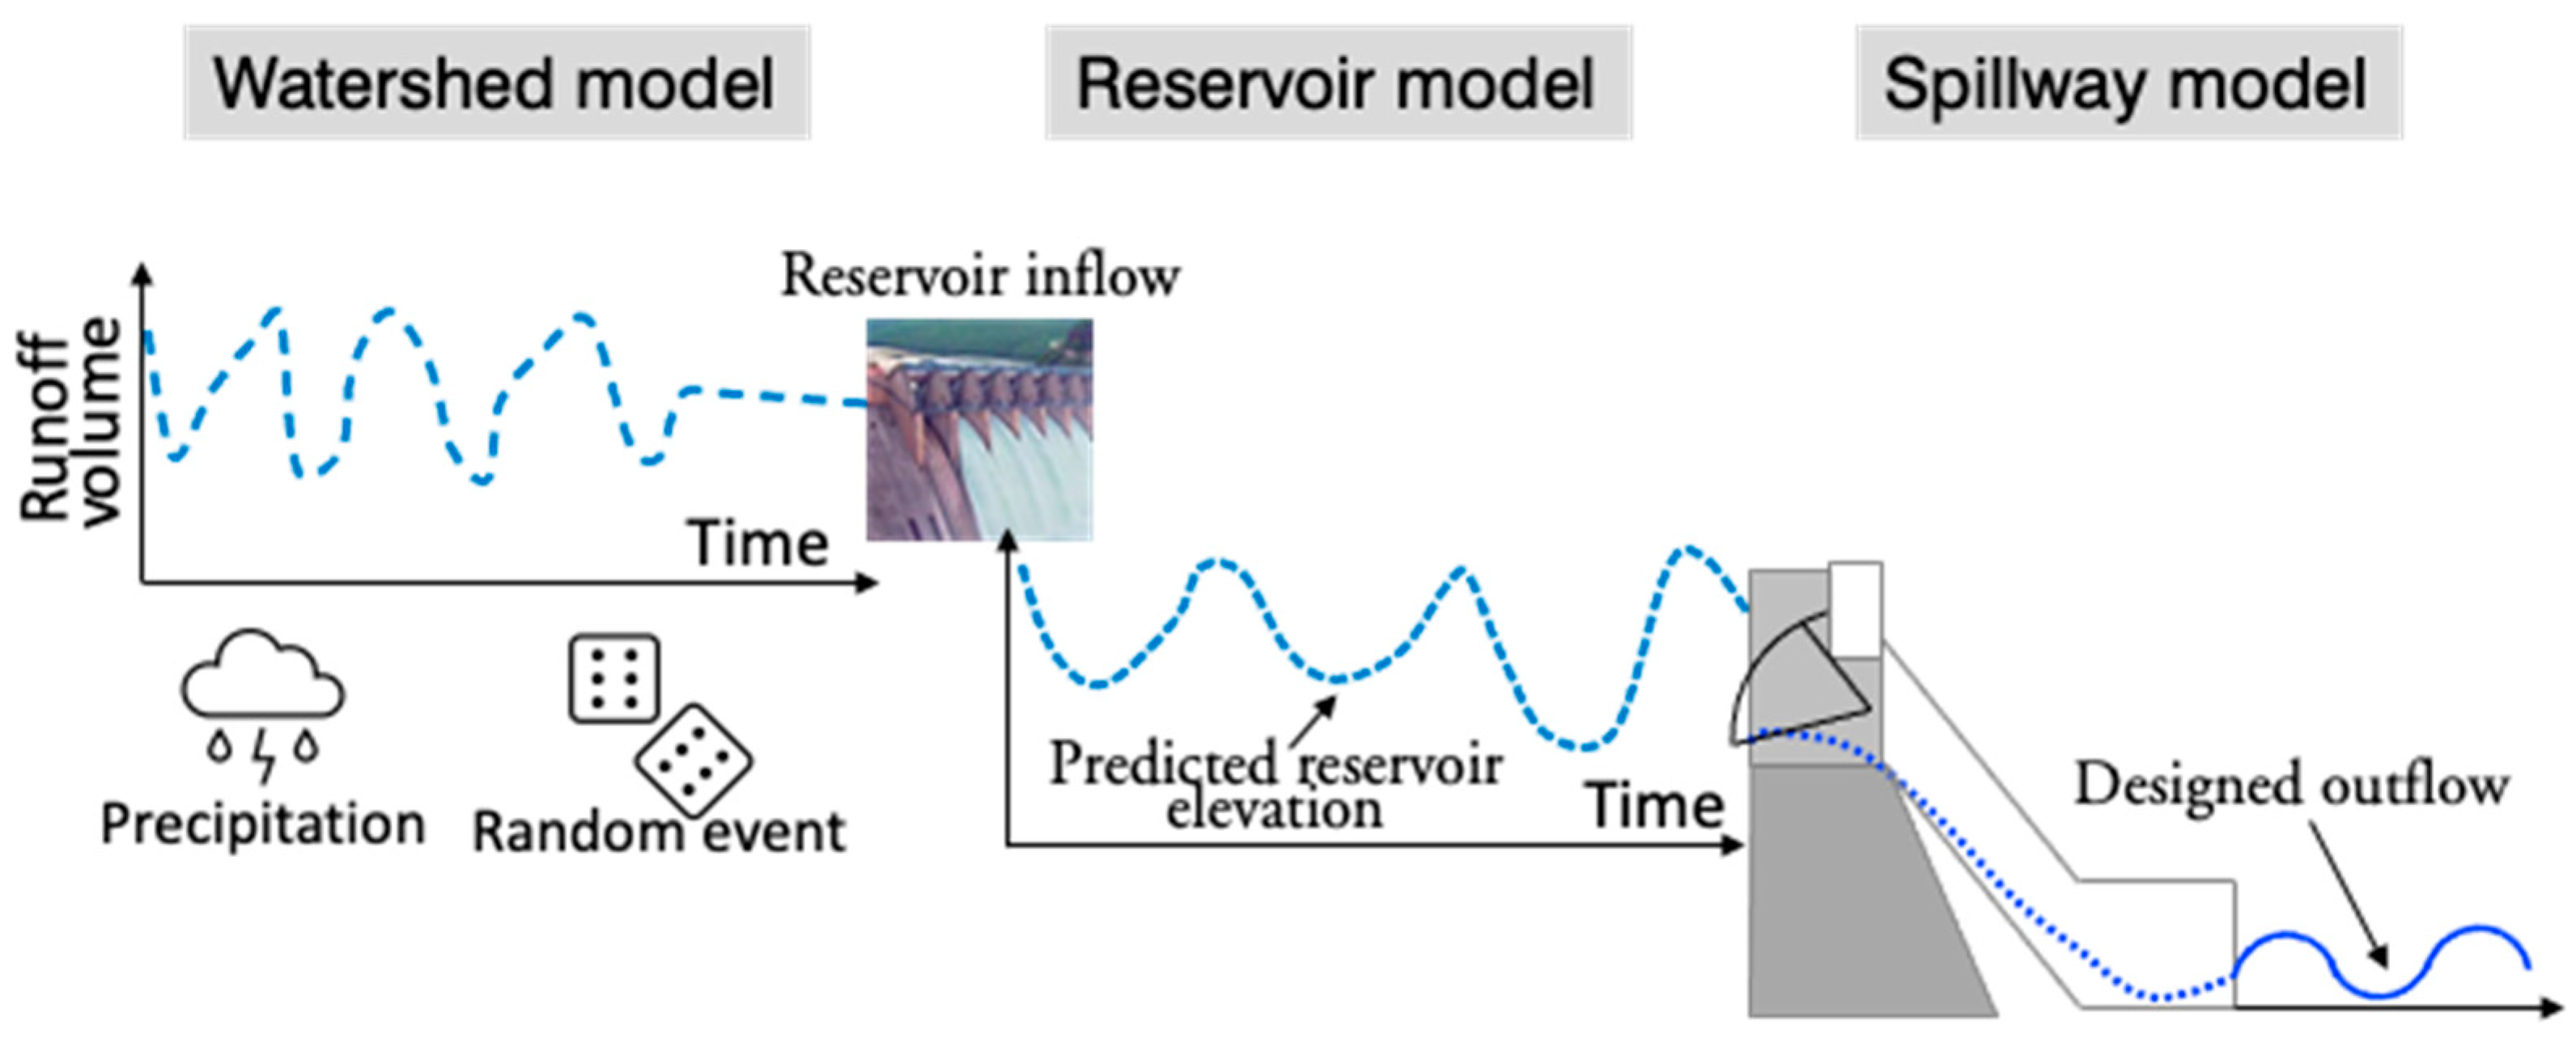
In South Korea, the hydrological stability of the embankment typically involves three essential steps. First, probability rainfall amounts are estimated for rainfall observatories in the drainage basin, and these estimates are converted to real rainfall amounts. Second, a rainfall–runoff analysis is performed, considering the estimated areal rainfall amounts and drainage basin characteristic factors. Finally, the runoff from the rainfall–runoff analysis is used as the dam inflow, and the safety assessment is evaluated. Further details of this process can be found in the work of Na et al. (2014) [22]. Figure 3 shows a conceptual diagram of the dam risk analysis process.
However, the risk assessment of dams commonly used in South Korea assumes that the initial water level is set as either the designed flood water level (i.e., the project water elevation) or the seasonal flood limit water level that are determined by the size of the dam and the rainfall frequency, according to regulatory standards. This assumption neglects the consideration of water levels caused by antecedent rainfall, thereby leading to a lack of effective representation of the actual circumstances in the simulation. Thus, the possibility of overflow is excluded because of the design flood level and the seasonal flood limit water level. For this reason, it is necessary to analyze the stability of the embankment against overflow with consideration for extreme rainfall due to climate change. In order to evaluate all these situations, this study aims to analyze the drawdown and overflow conditions based on the basic design cross-section of soil dams or embankments [23,24,25].
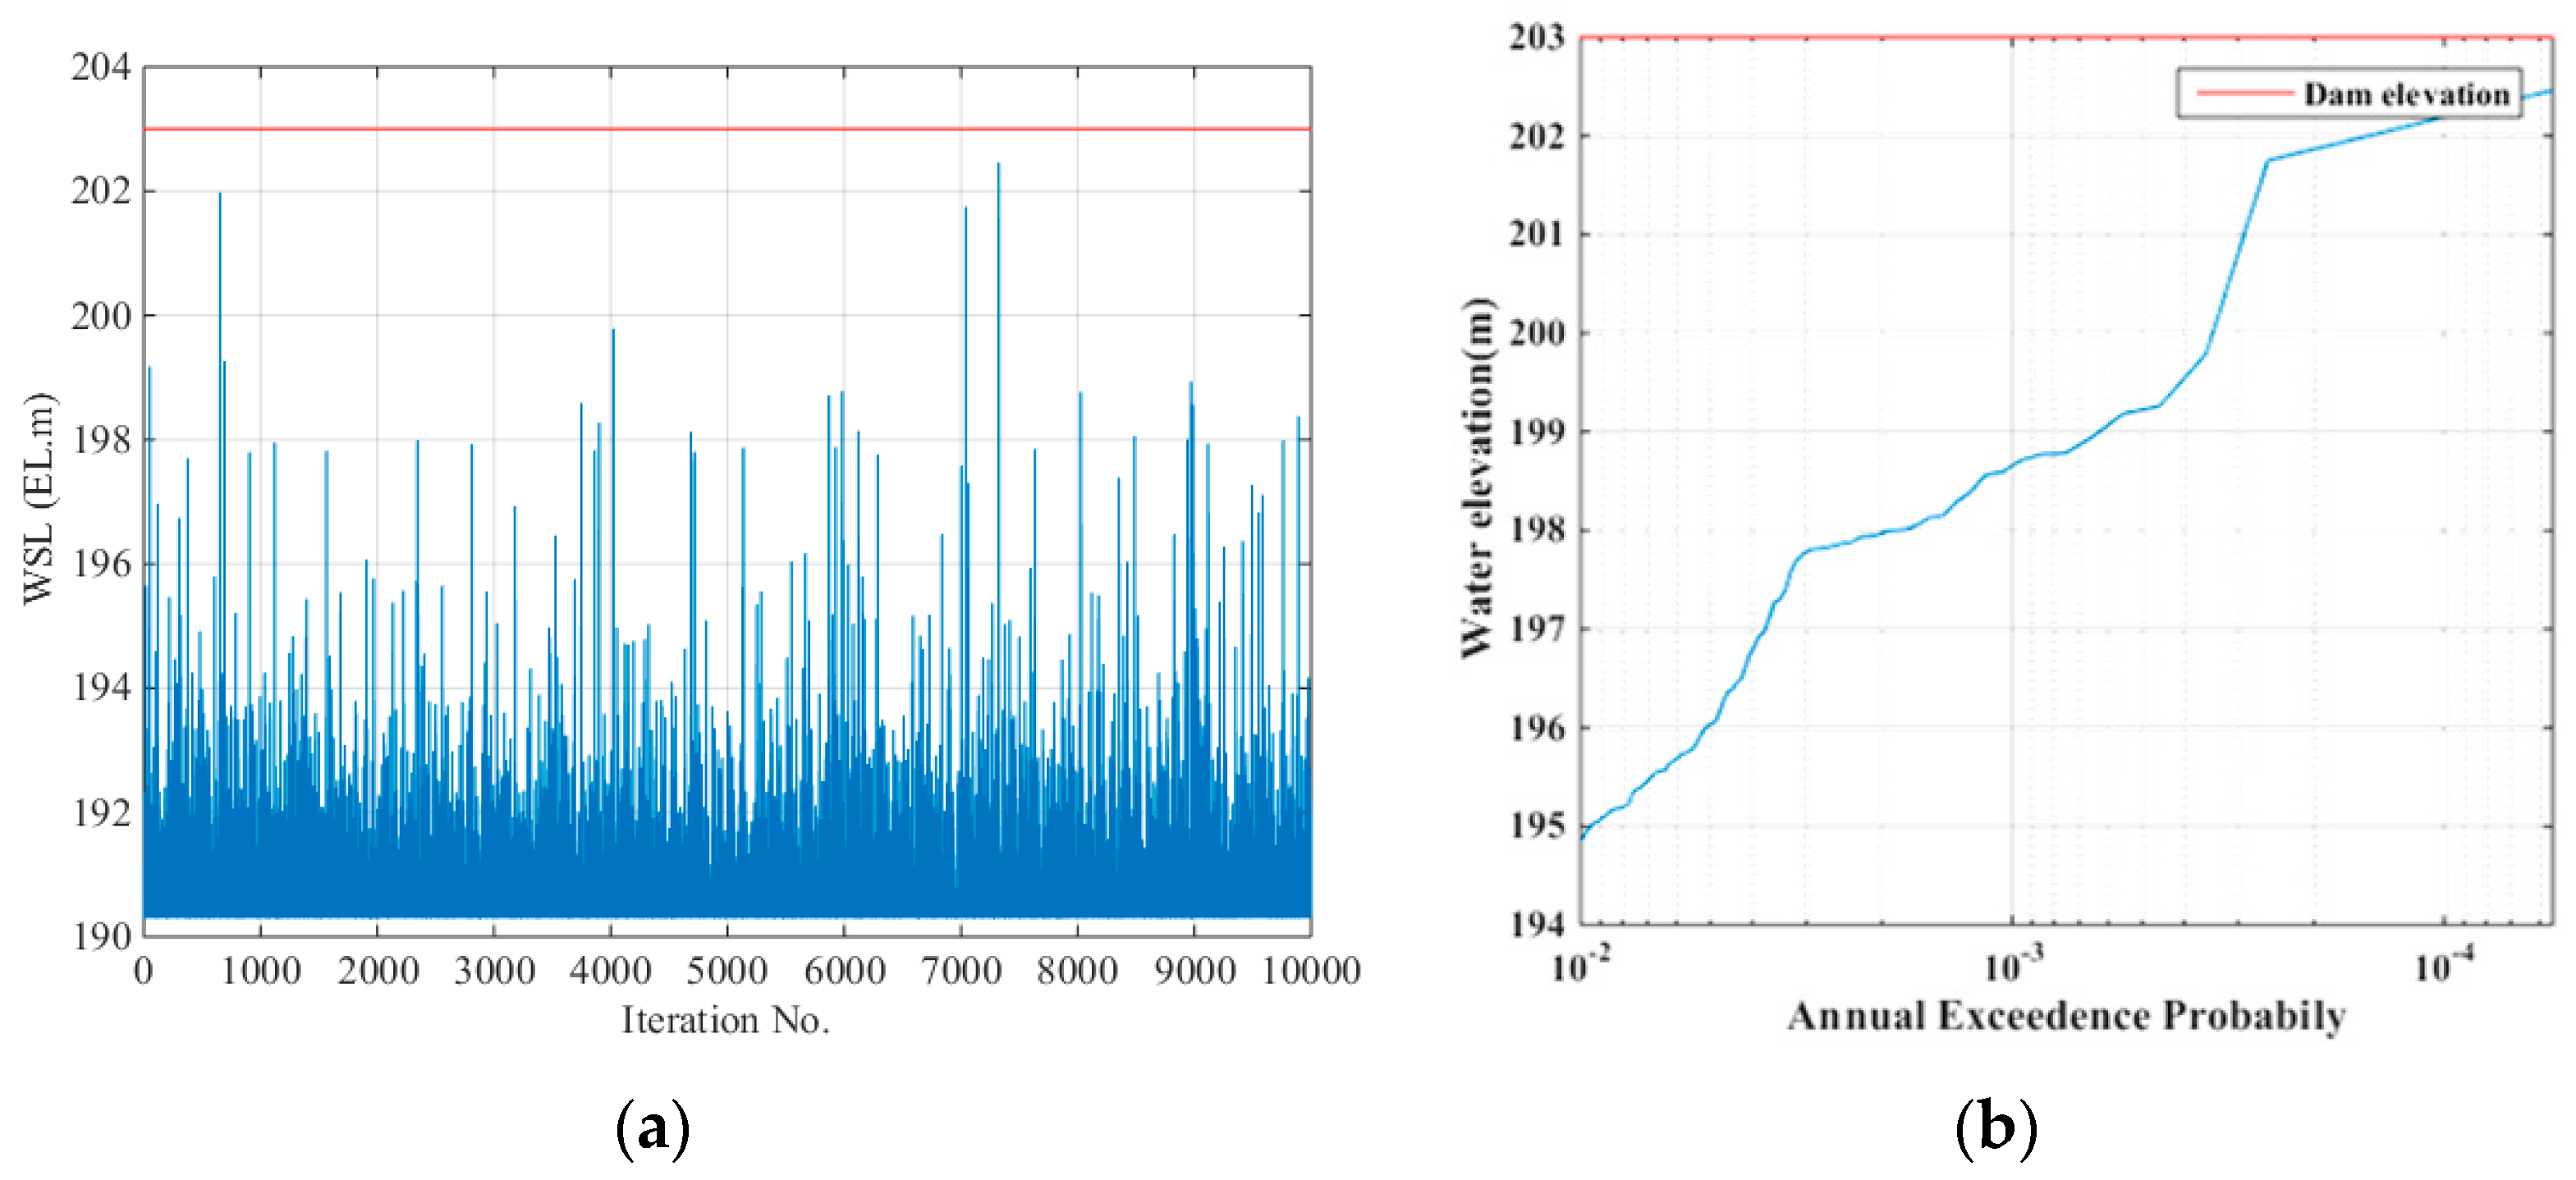
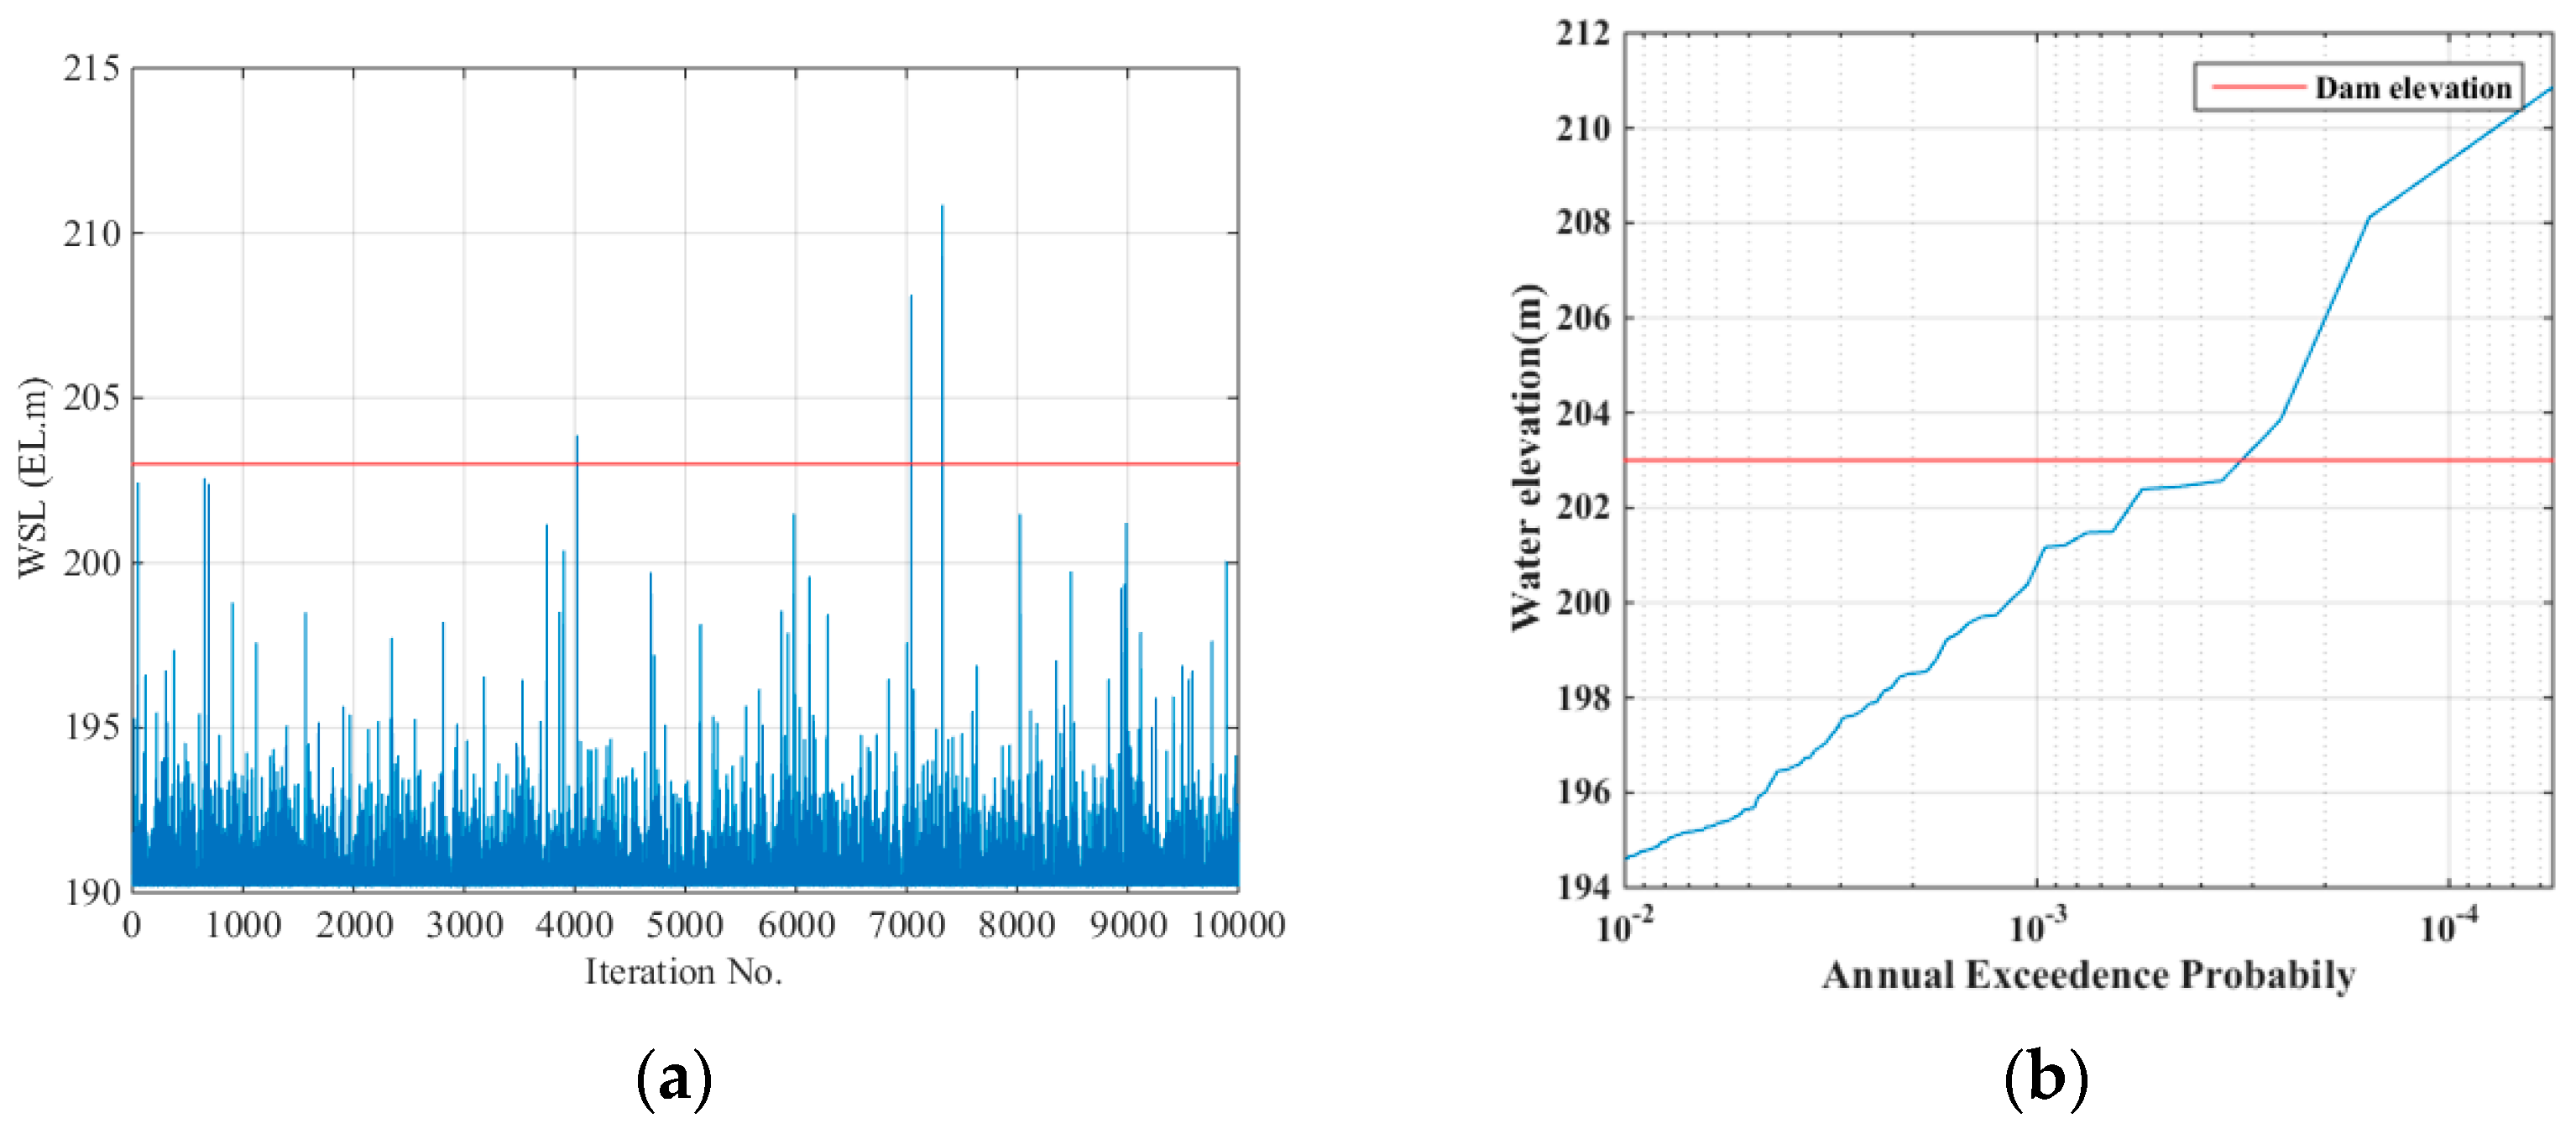
Figure 4 illustrates the results of the analysis, assuming that the initial water levels were the designed flood water levels. The red line in Figure 4 represents the dam crest, and the simulation was performed 10,000 times. The figures demonstrated that no overtopping events occurred when the dam operation simulations were based on the design flood water level, and the annual exceedance probability remained stable even at a 10,000-year recurrence interval. Figure 5 presents the results of the analysis, assuming the initial water levels derived from antecedent rainfall using the Gumbel function. It was found that no overtopping events occurred during the dam operation simulations when considering the conventional projected flood elevation. However, overtopping events were observed when considering the water level fluctuations, estimating potential dam overtopping at a design frequency of approximately 6000 years. The difference between these results was the result of confirming the stability up to a 10,000-year return period by setting the initial water level of the dam as the design flood level and the fluctuating water level during the dam operation simulation. The results emphasized the effectiveness of considering antecedent rainfall in the simulation.
3. Geotechnical Analysis of Embankment Slope
3.1. Stability Analysis of a Slope Due to Drawdown
In the previous section, the hydraulic stability of embankment overtopping was assessed using probable rainfall scenarios to account for extreme rainfall caused by climate change, enabling a comprehensive examination of potential overtopping occurrences. To evaluate the geotechnical stability of the embankment due to overtopping, a slope stability analysis was conducted with the incorporation of the unsaturated soil characteristics and water infiltration. In the analysis of this study, the numerical simulation was performed, assuming that the height of the embankment was approx. 10 m. However, similar results were obtained in the cross-section of a larger scale, so the tendency for stability could be inferred [24,26]. A seepage analysis with the design flood water level was carried out to determine the stability of the embankment slope due to drawdown. The factor of safety for the upstream and downstream slopes was calculated using Bishop’s simple method, and appropriate countermeasures were proposed if the values were below the factor of safety listed in Table 4.
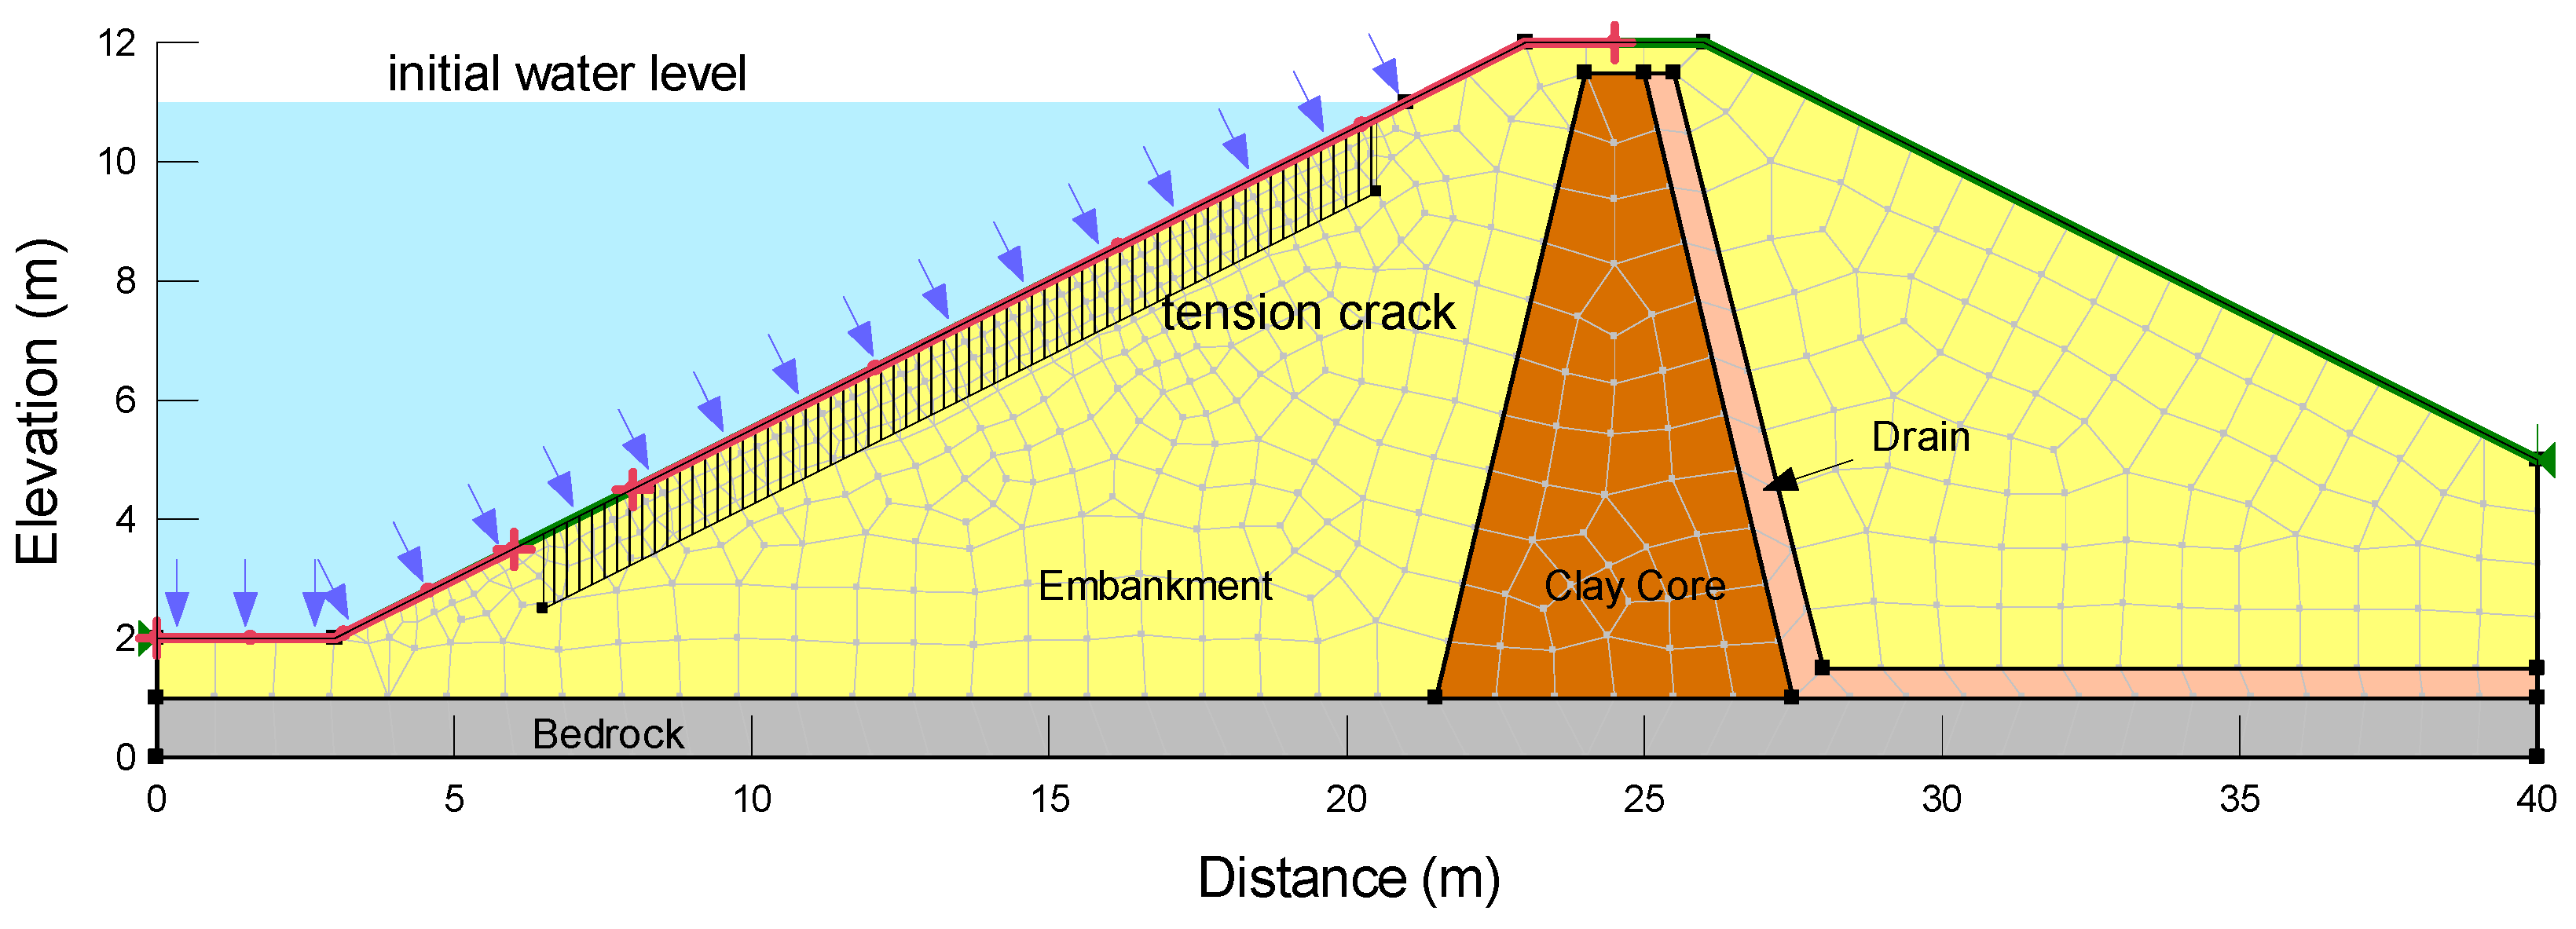
For the slope stability analysis, the soil parameters such as the unit weight, cohesion, and internal friction angle were selected based on the average values derived from the literature, which are listed in Table 5. Bishop’s simplified method of slices for circular slip surfaces was used in the calculation of the factor of safety. For the seepage analysis under drawdown conditions, the hydraulic soil parameters such as the saturated permeability and unsaturated permeability function were inferred from the soil water characteristic curve [27] for each soil layer, as listed in Table 5. In the seepage analysis of unsaturated soil, the fitting parameters (e.g., a, n, m, of the soil–water characteristic curve (SWCC)) were determined using the van Genuchten (1980) equation [28]. Figure 6 illustrates the finite element model on a typical embankment, consisting of a clay core and a drain system. The bedrock was set as an impermeable layer at the bottom. Since drawdown represents the most unstable condition for the embankment slope, the factor of safety at the pore-water distribution in the upstream slope during a 5-h drawdown was thoroughly examined. The difference in the safety factor was analyzed by comparing and not considering the tension cracks on the embankment slopes. Tension cracks are associated with slope failure during shrinkage due to a rapid drawdown of the water level, which could be modeled in the analysis [29,30].
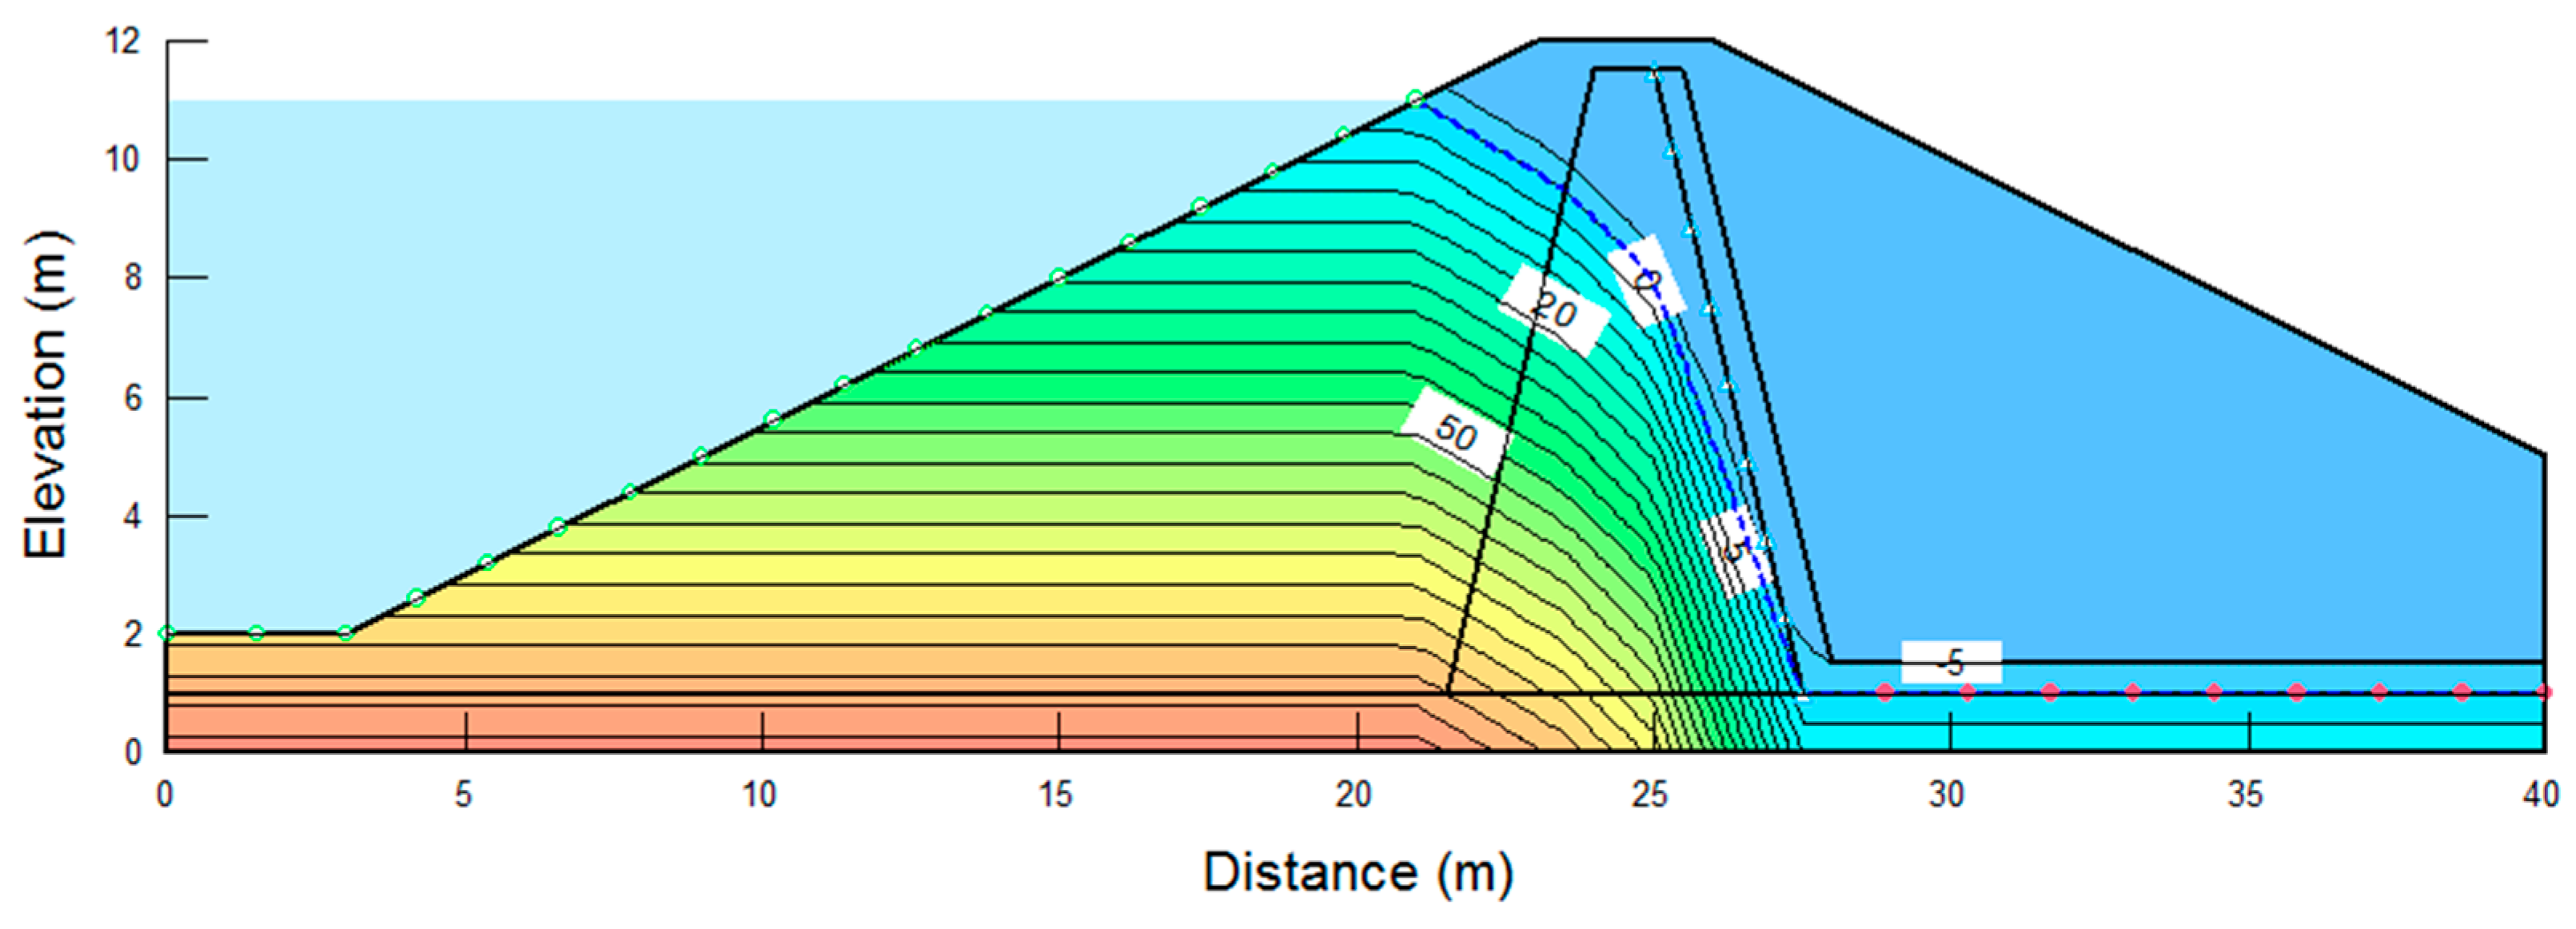
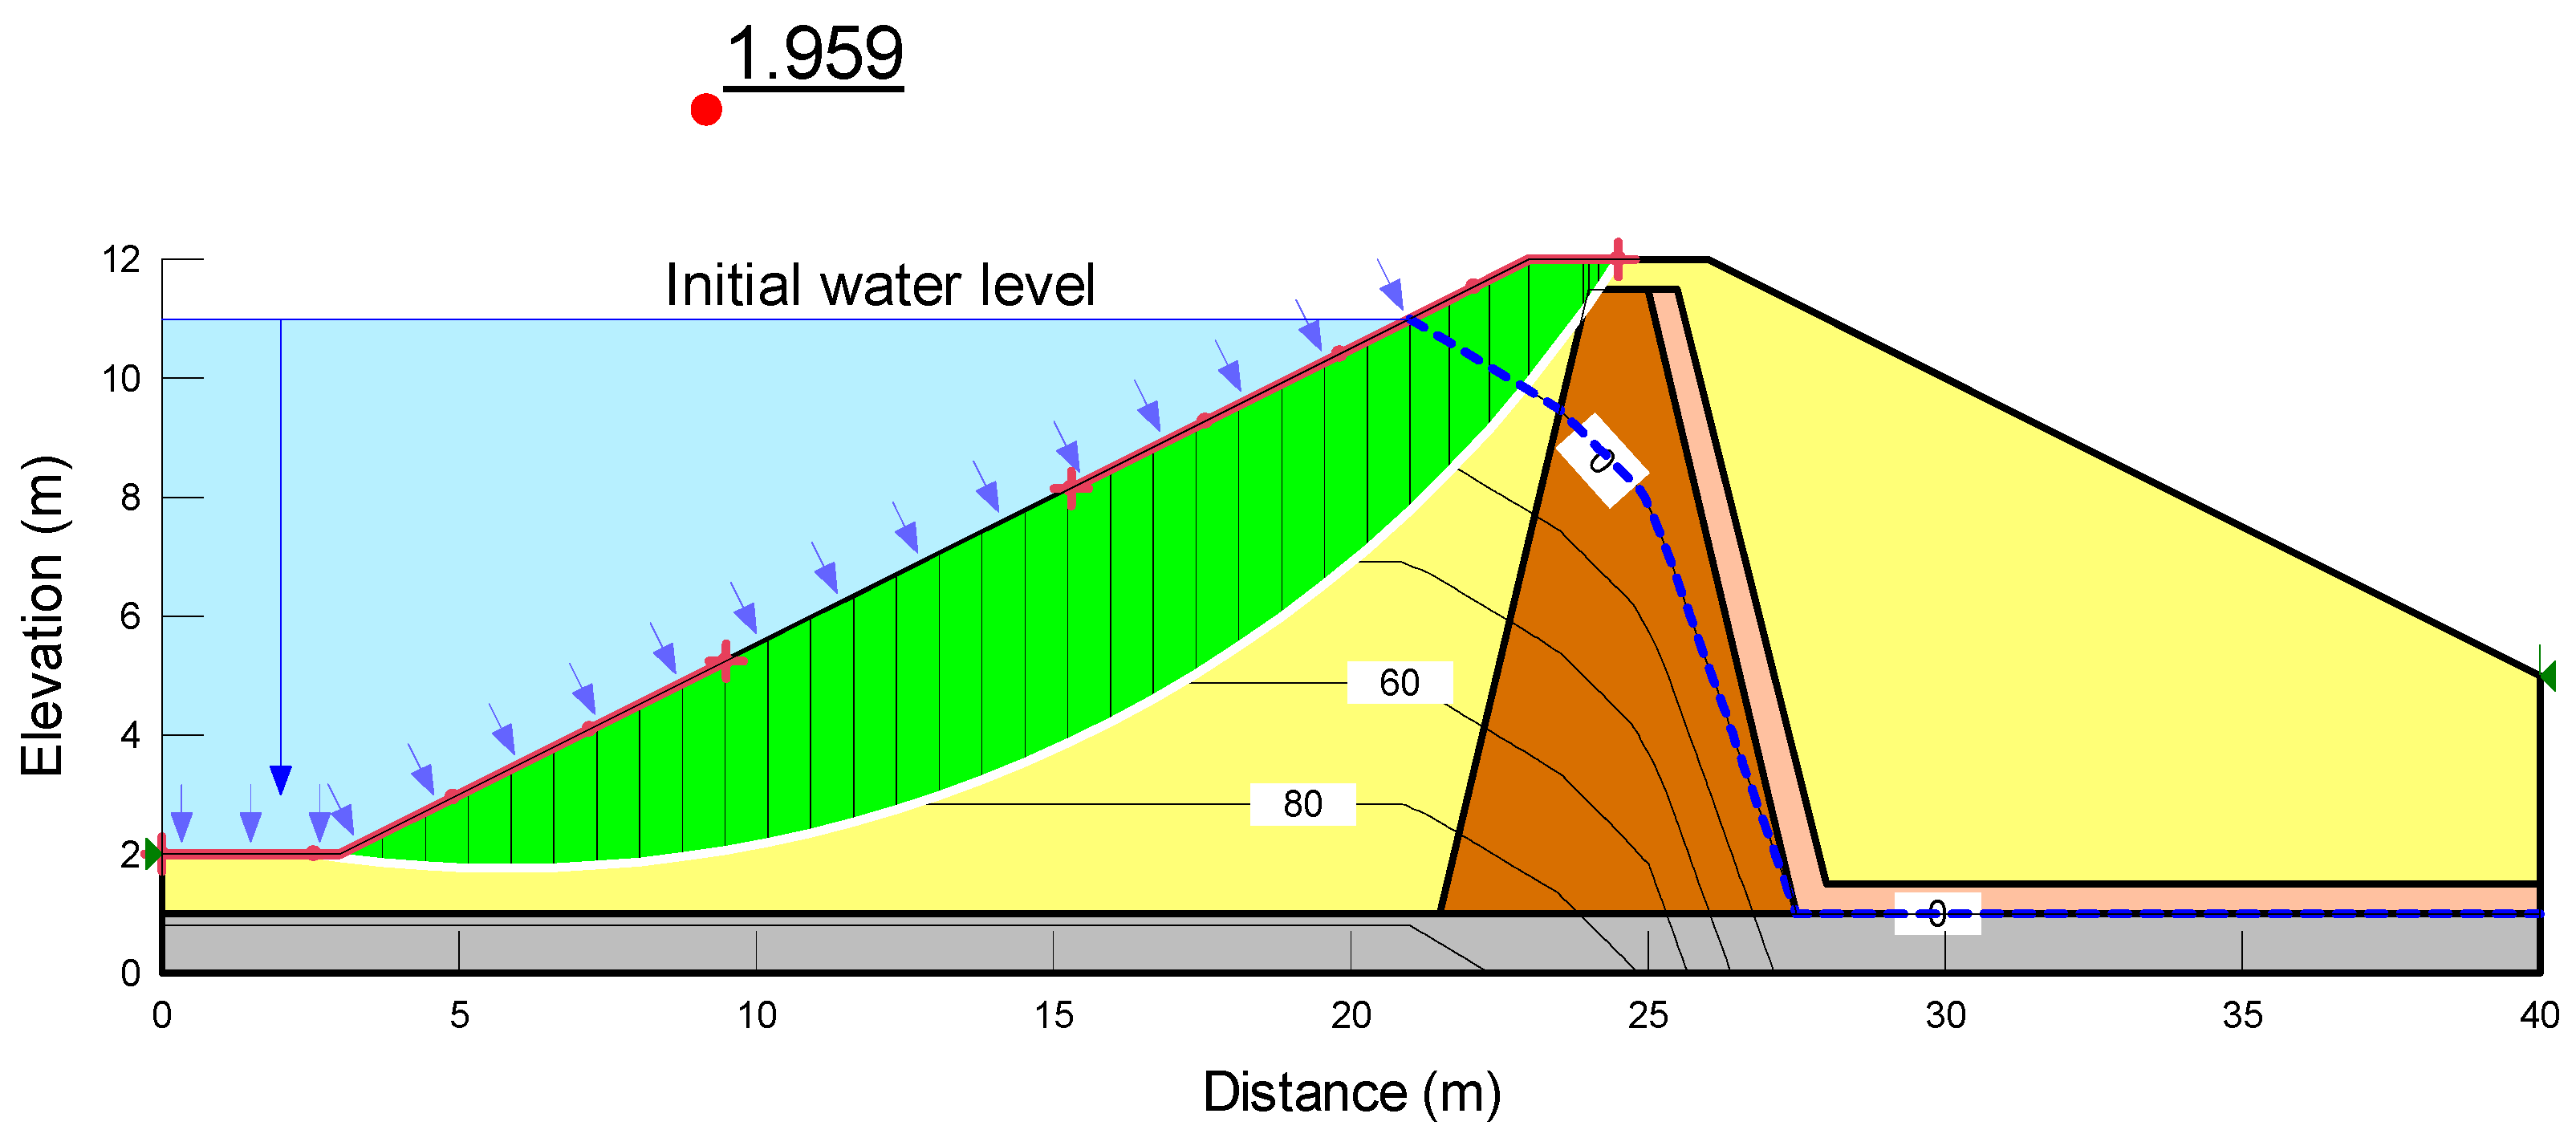
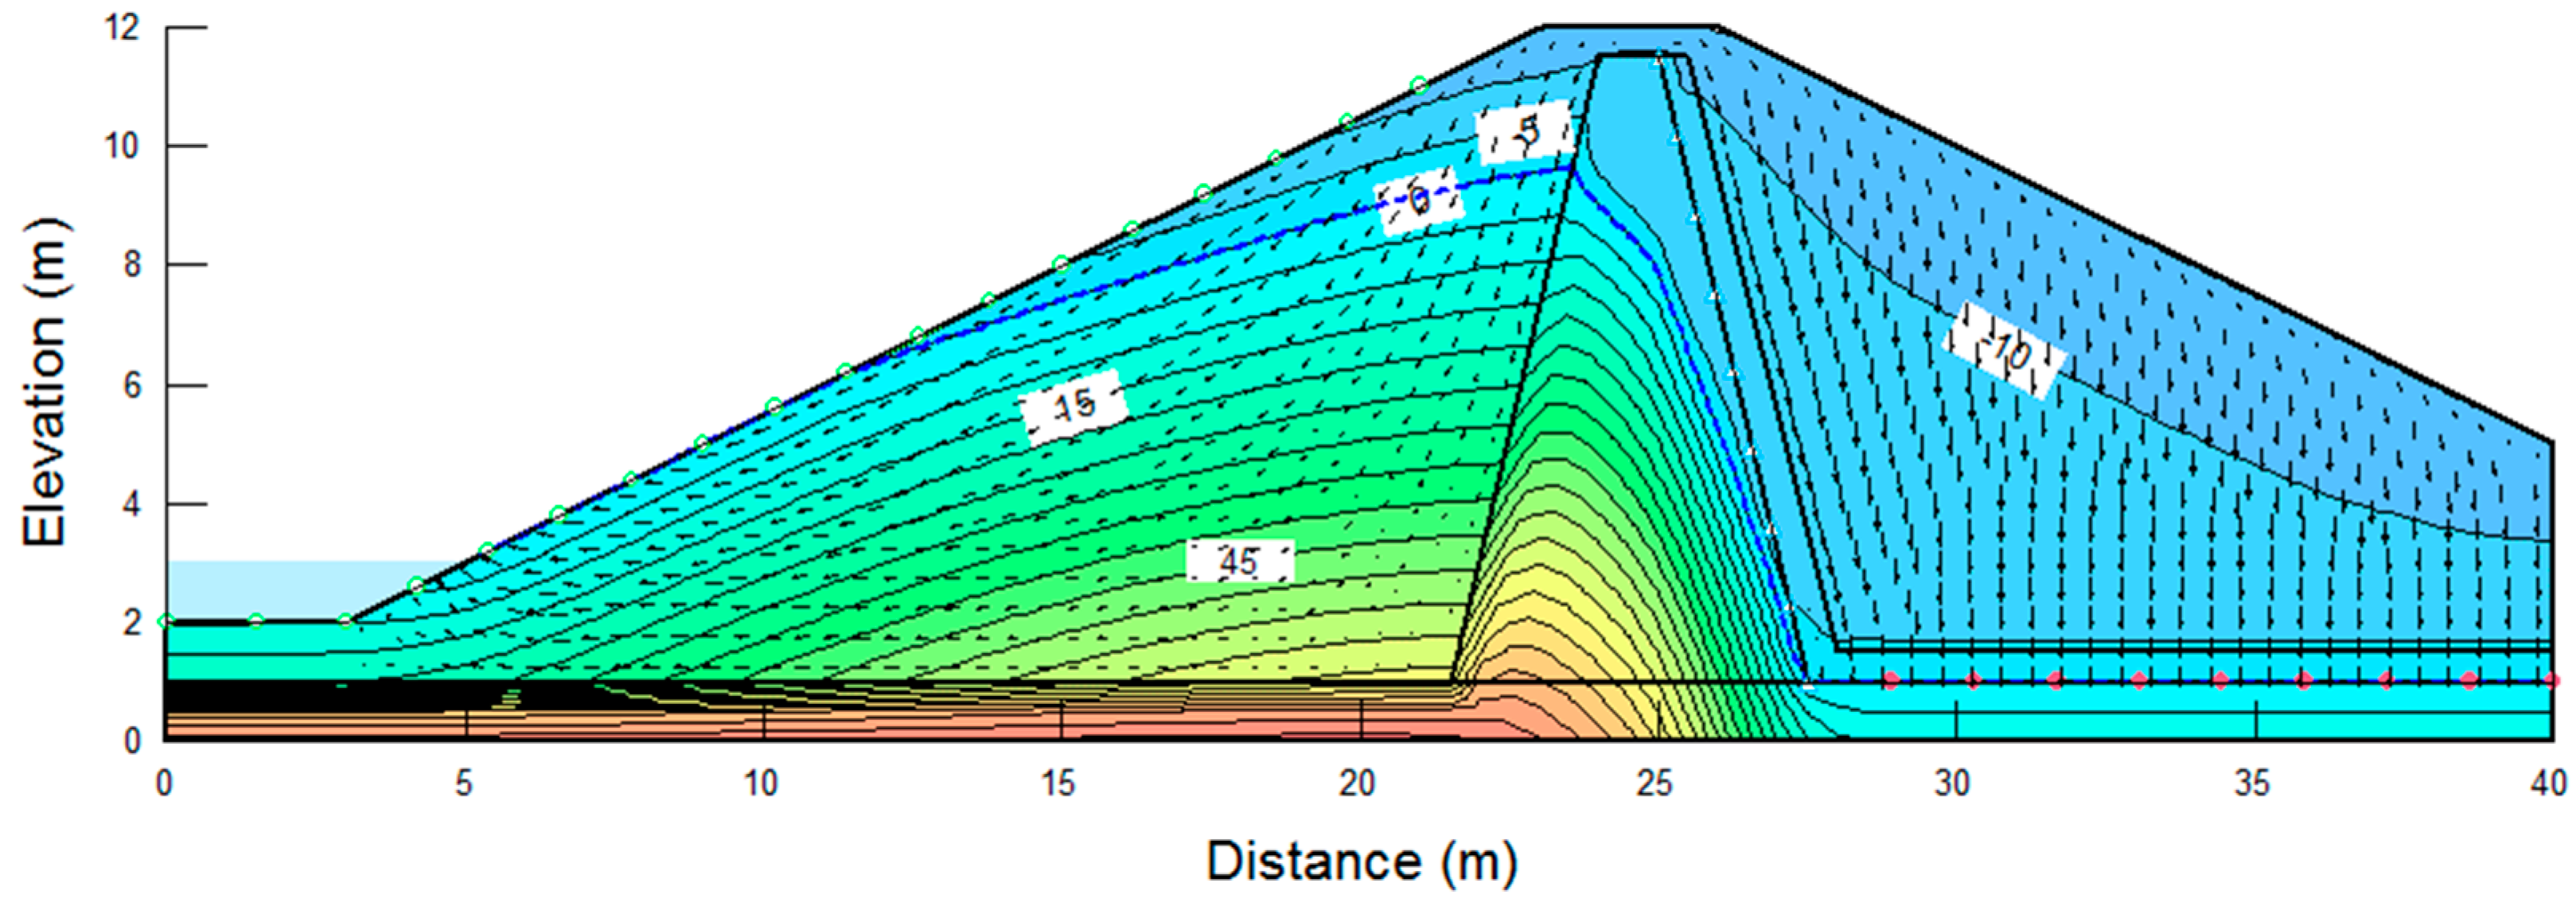
The slope inclination for both the upstream and downstream slopes was set to a standard embankment slope of 1:2 (vertical to horizontal ratio, V:H). A drawdown scenario was assumed in the simulation, during which the initial water level on the upstream slope decreased from a 90% (Figure 6) to a 10% water level (Figure 9) over 5 h. The pore-water pressure distribution within the embankment at the initial 90% water level is shown in Figure 7. In comparison, the slope instability of the upstream slope at the initial 90% water level is depicted in Figure 8. As shown in Figure 7, the pore-water pressure was determined based on the initial water level and drain conditions. Figure 9 shows the pore-water pressure distribution after the drawdown and revealed that the water tended to be drained towards the slope side due to the drawdown on the upstream slope. Consequently, the pore-water pressure gradually decreased over time. The results indicated that the upstream slope exhibited a relatively low risk at the initial 90% water level due to the existence of the water pressure acting on the slope surface. However, when the water pressure on the slope surface was absent under the drawdown conditions, the slope presented a high risk of instability (Figure 10). This was due to the fact that when the water level on the upstream slope dropped rapidly, the retained pore water within the slope reduced both the effective stress and soil strength.
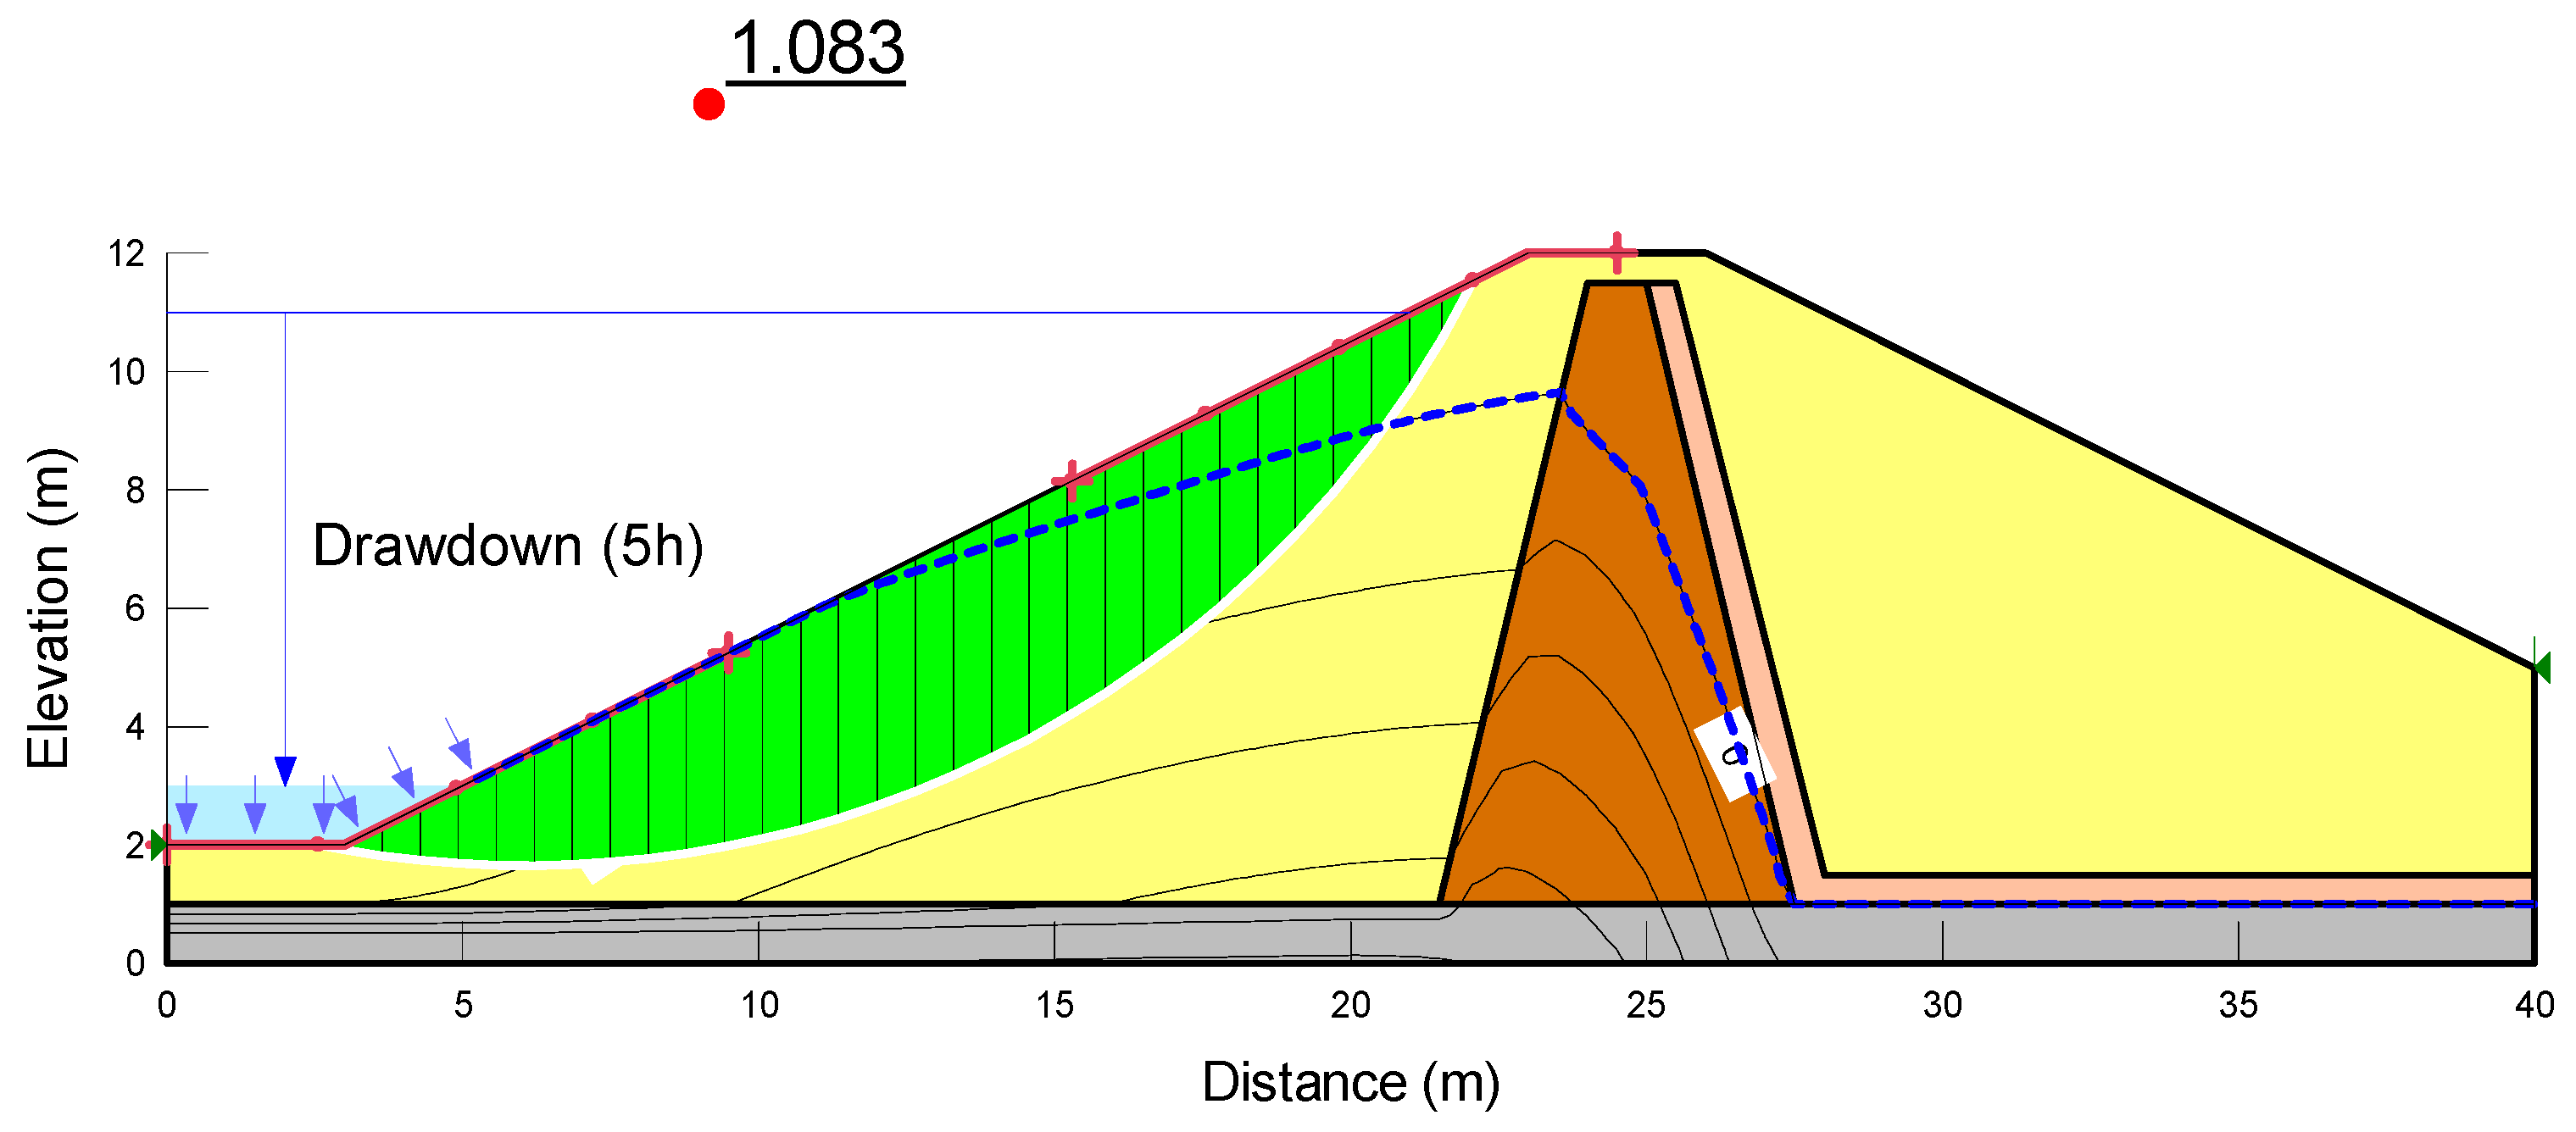
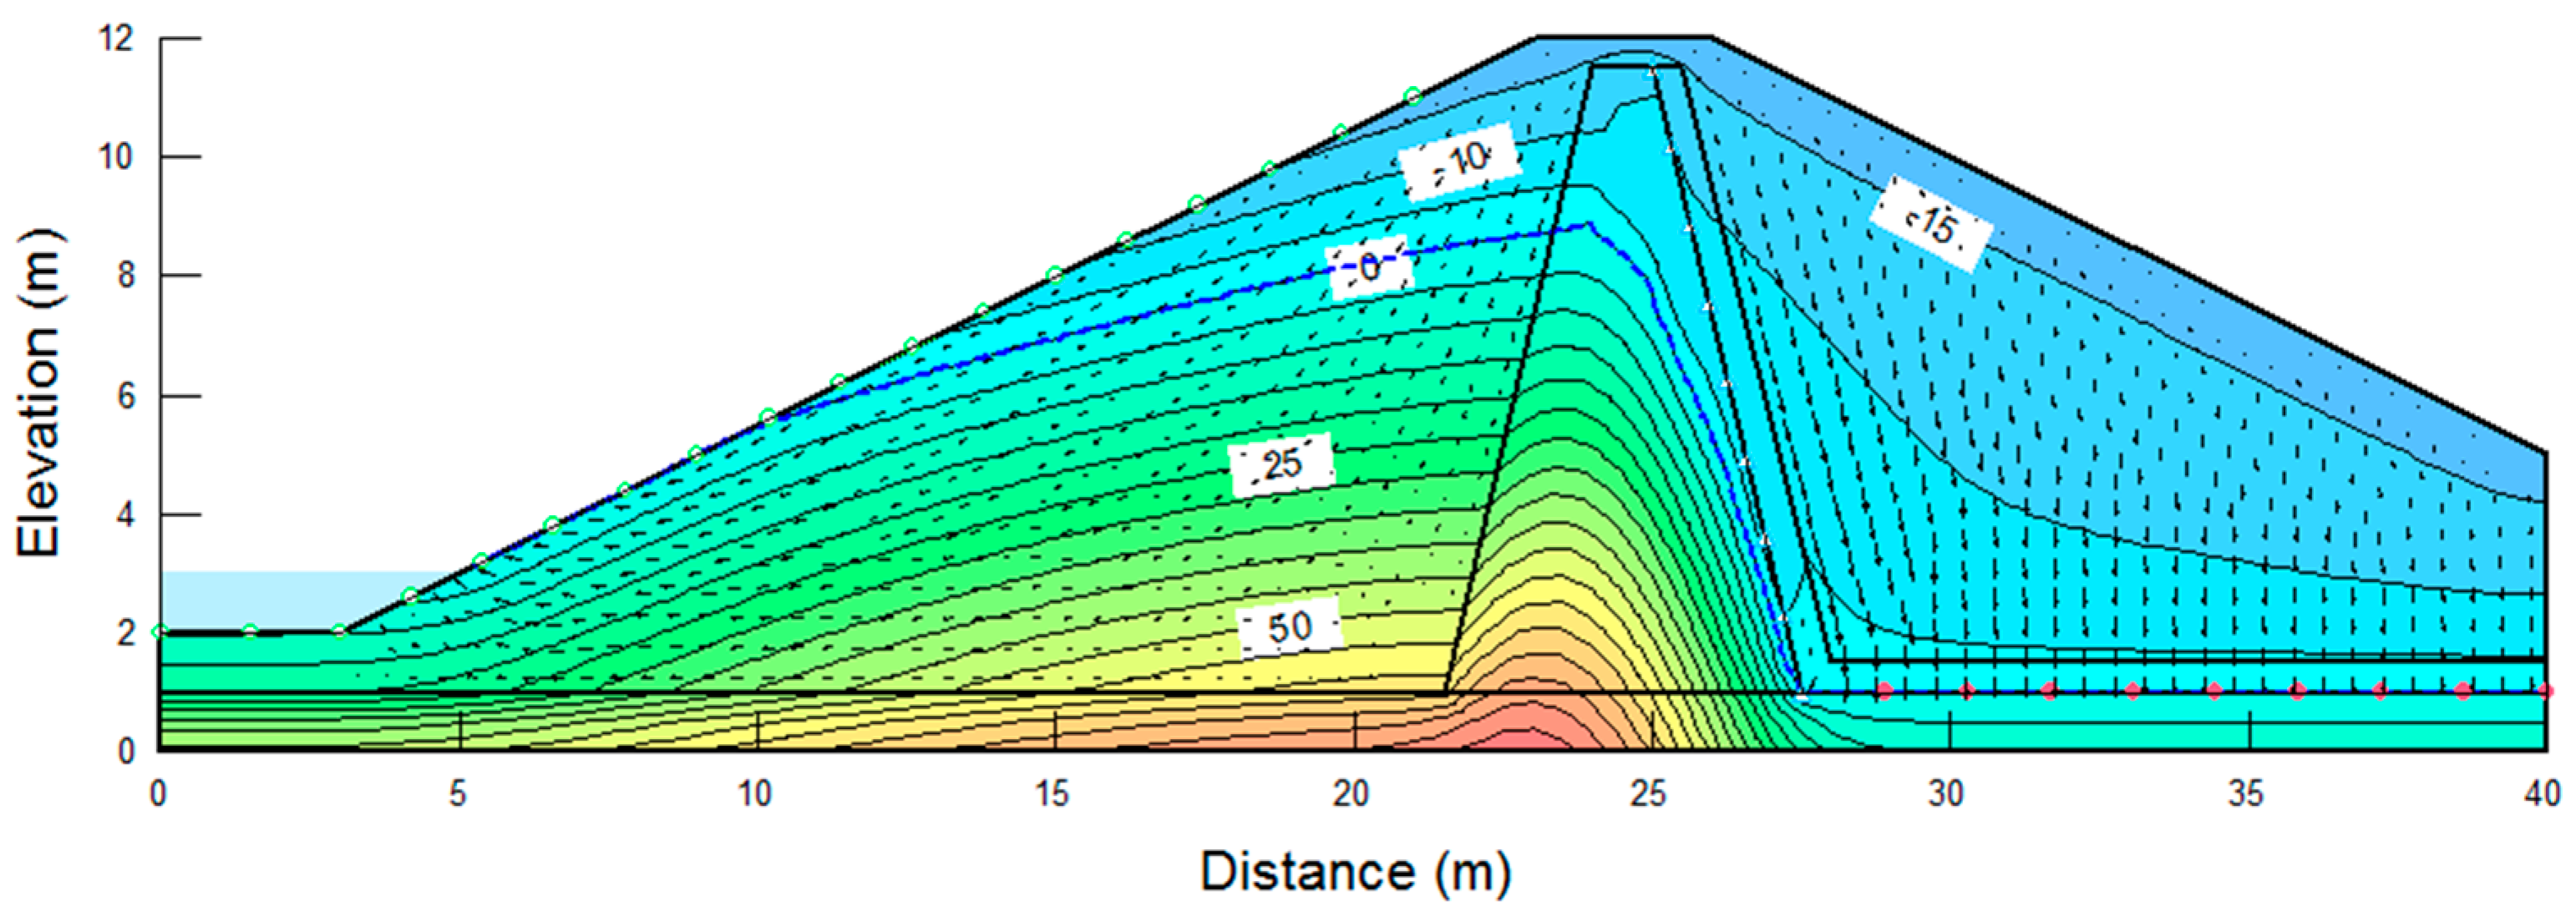
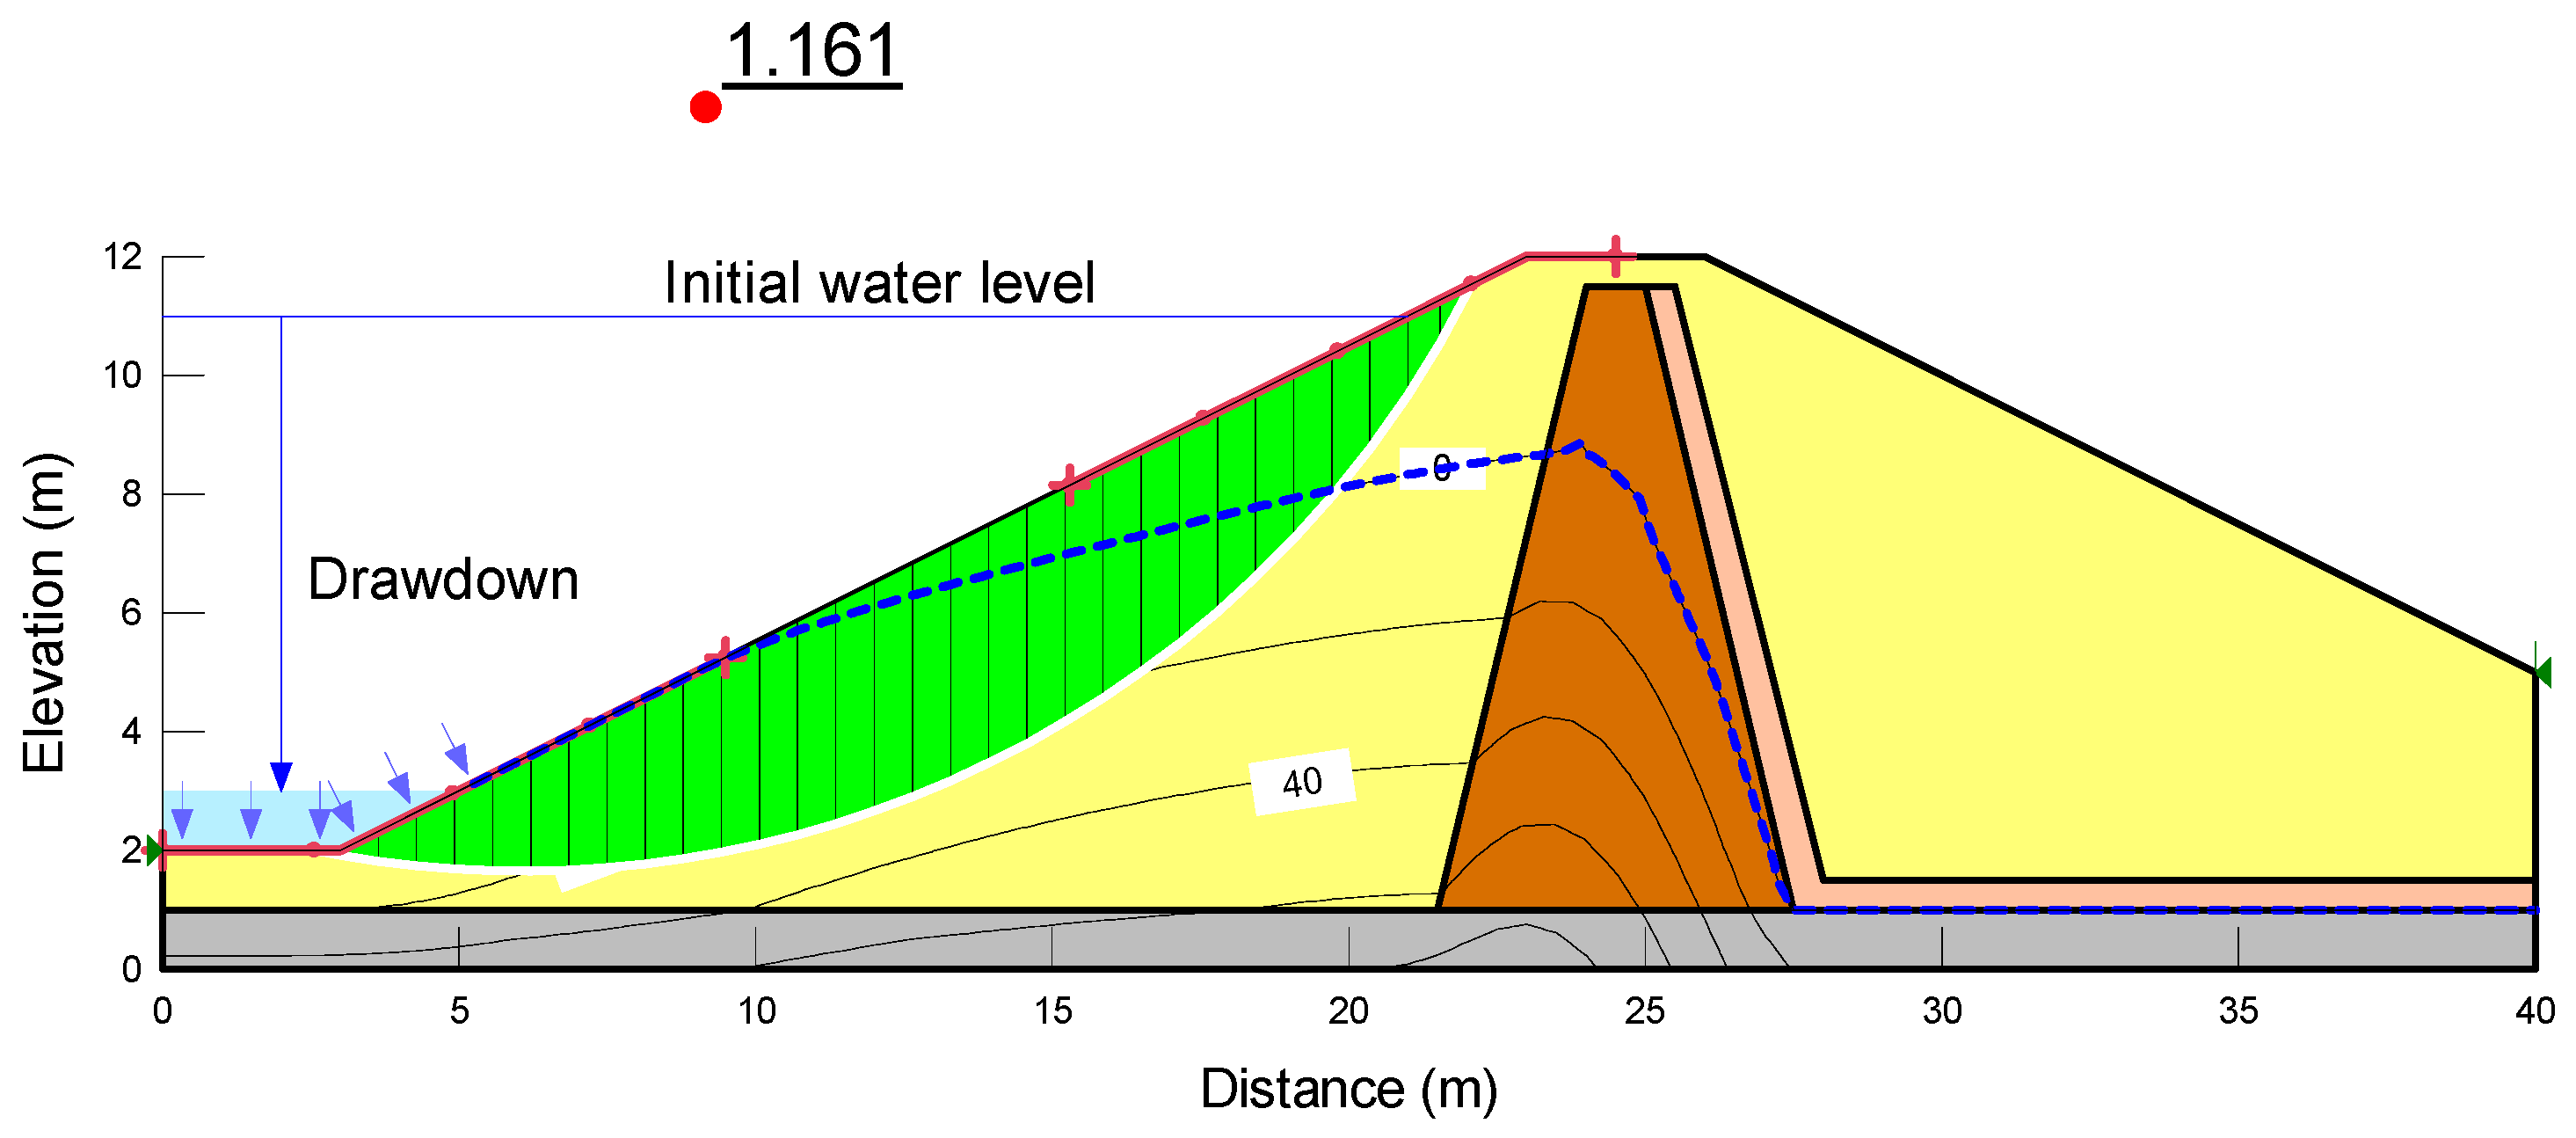
A high pore-water pressure was still observed in the upstream slope, even if the water level rapidly dropped. The rapid dissipation of the pore-water pressure resulted in a substantial reduction in the effective stress, which played a crucial role in contributing to slope instability in addition to the absence of the water pressure acting on the slope surface. The factors of safety under the initial 90% water level and drawdown were 1.959 and 1.083, respectively. A significant drop in the factor of safety was observed immediately after the water level drawdown, as shown in Figure 10. To examine the slope instability with respect to the effective stress variations as the pore-water pressure dissipated, the factor of safety for the upstream slope was re-assessed one day after the drawdown (Figure 11). Despite a greater dissipation of the pore-water pressure compared to Figure 9, as depicted in Figure 12, the embankment upstream slope still exhibited instability (the factor of safety was 1.161).
In general, the analysis assumed that the soils were homogenous, and the most unstable condition for embankments was considered to be during drawdown. In reality, embankments can experience cracking and deformation as the pore water drains out. However, since the numerical simulations could not capture these phenomena, this study focused solely on the slope stability due to water level changes (drawdown) and tension cracks.
3.2. Stability Analysis of a Slope Due to Drawdown and Tension Cracks
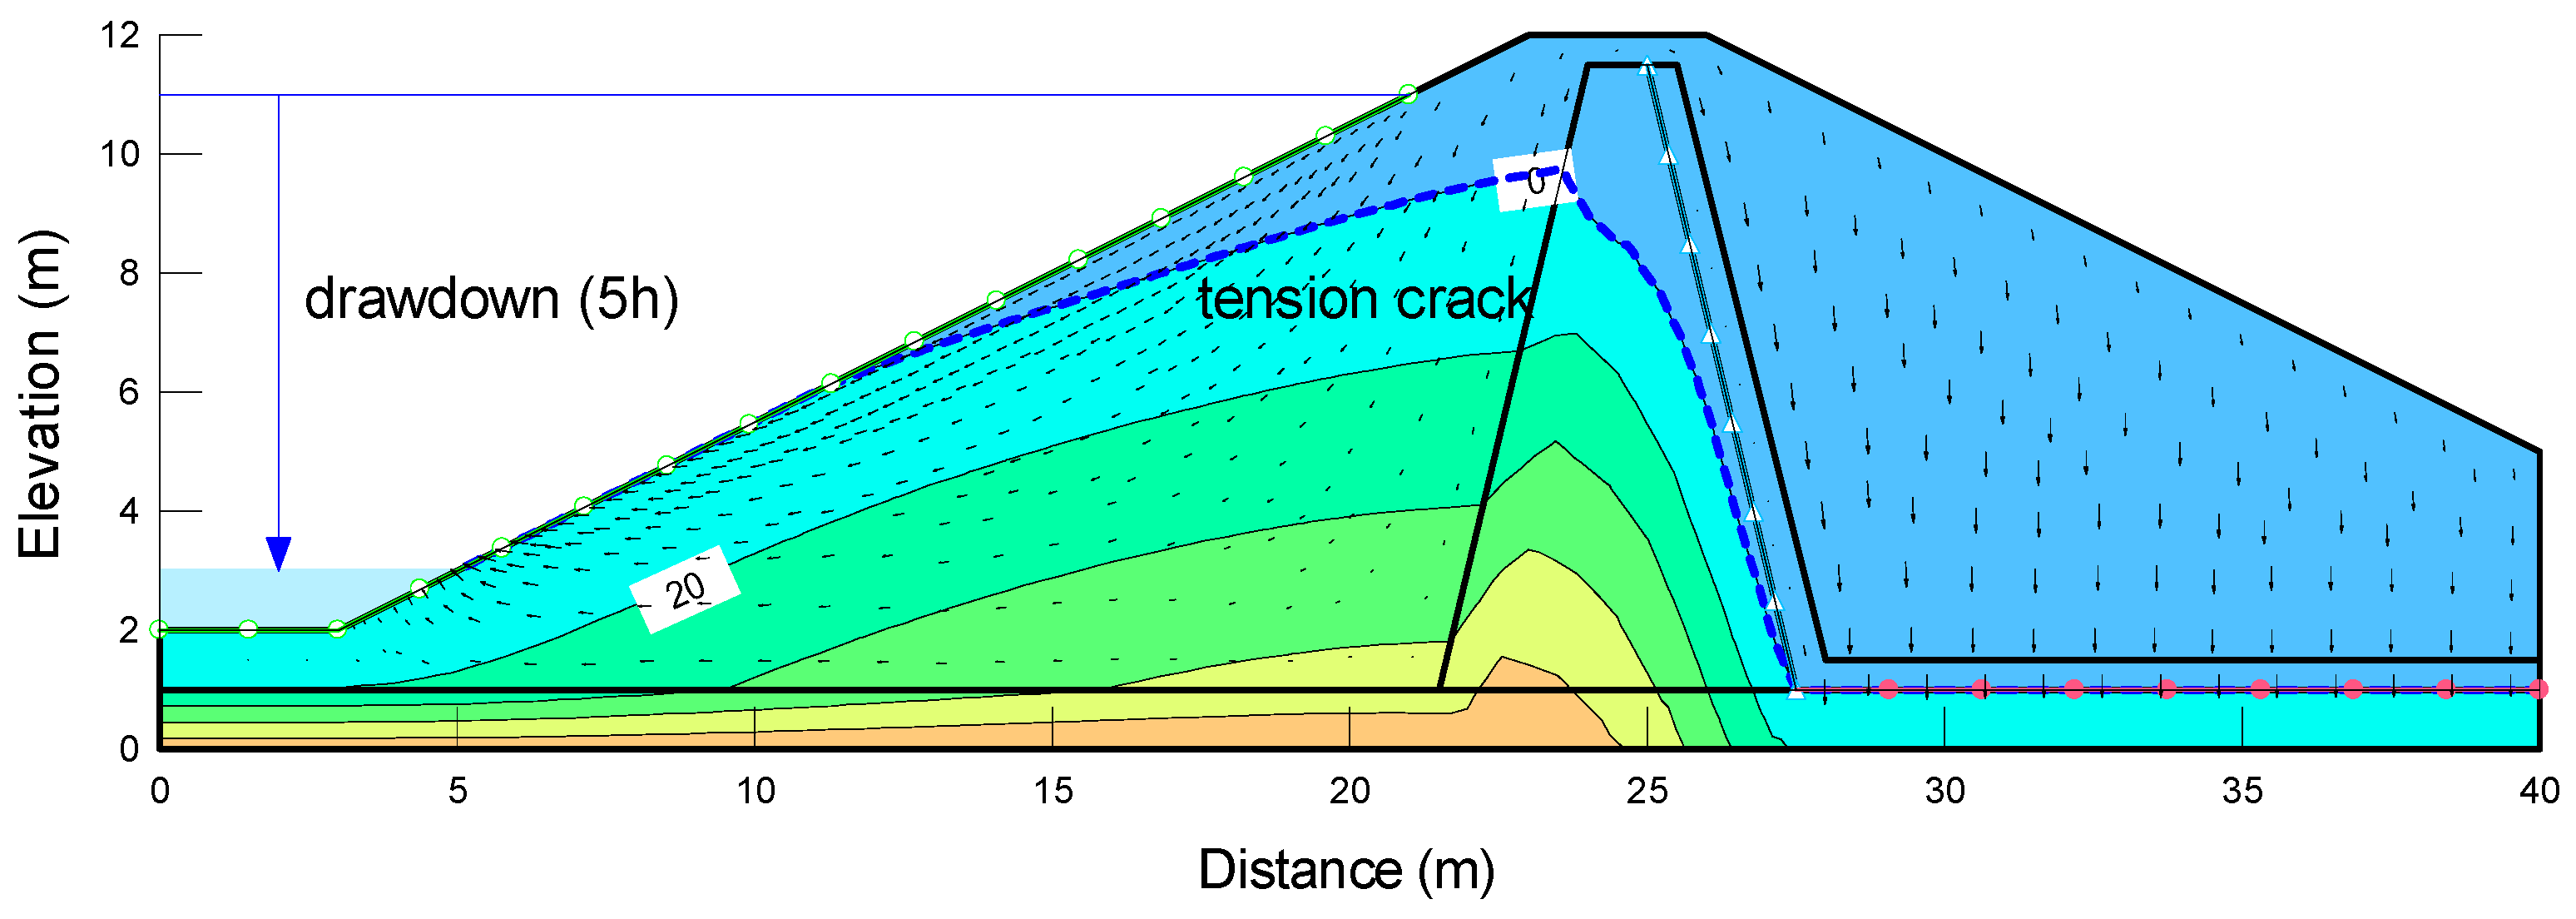
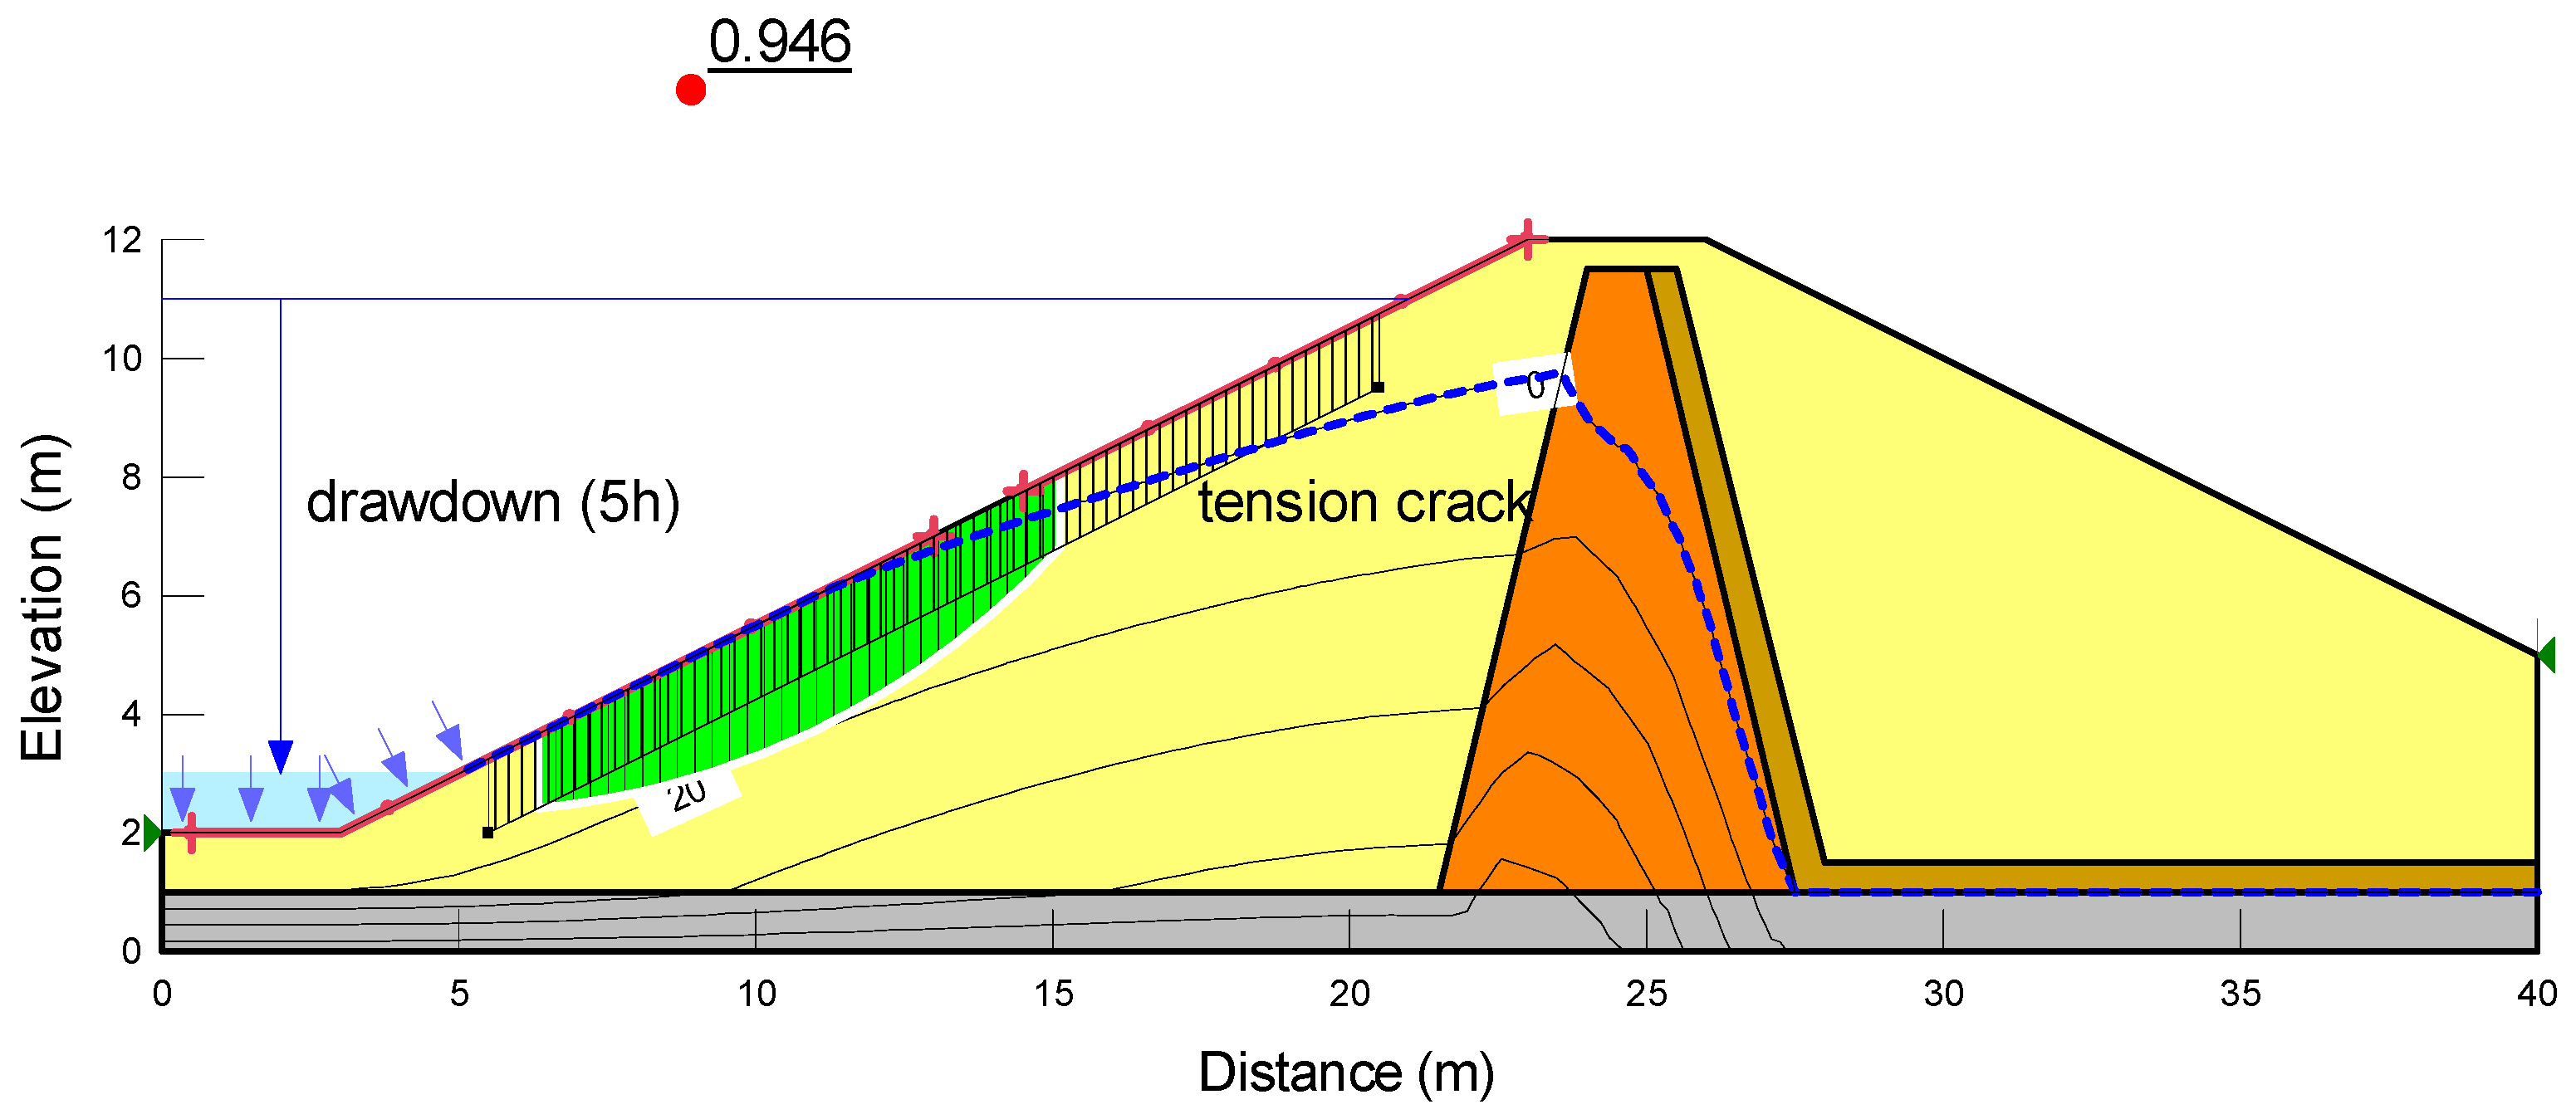
In this section, the safety factor of the embankment slope was calculated with the incorporation of tension cracks. In most cases, tension cracks represent the primary factor contributing to the failure of the embankment slope during drawdown events by decreasing the shear resistance to slip failure. As a result, the distributions of the pore-water pressure obtained from the seepage analysis remained consistent whether tensile cracks were present (Figure 13) or absent (Figure 9) on the slope of the embankment. However, a shallow failure was observed in the slope, as shown in Figure 14. It was attributed to the presence of tension cracks after 5 h of drawdown. In this case, the embankment slope exhibited a lower safety factor compared to the scenarios where no tensile cracks were present.
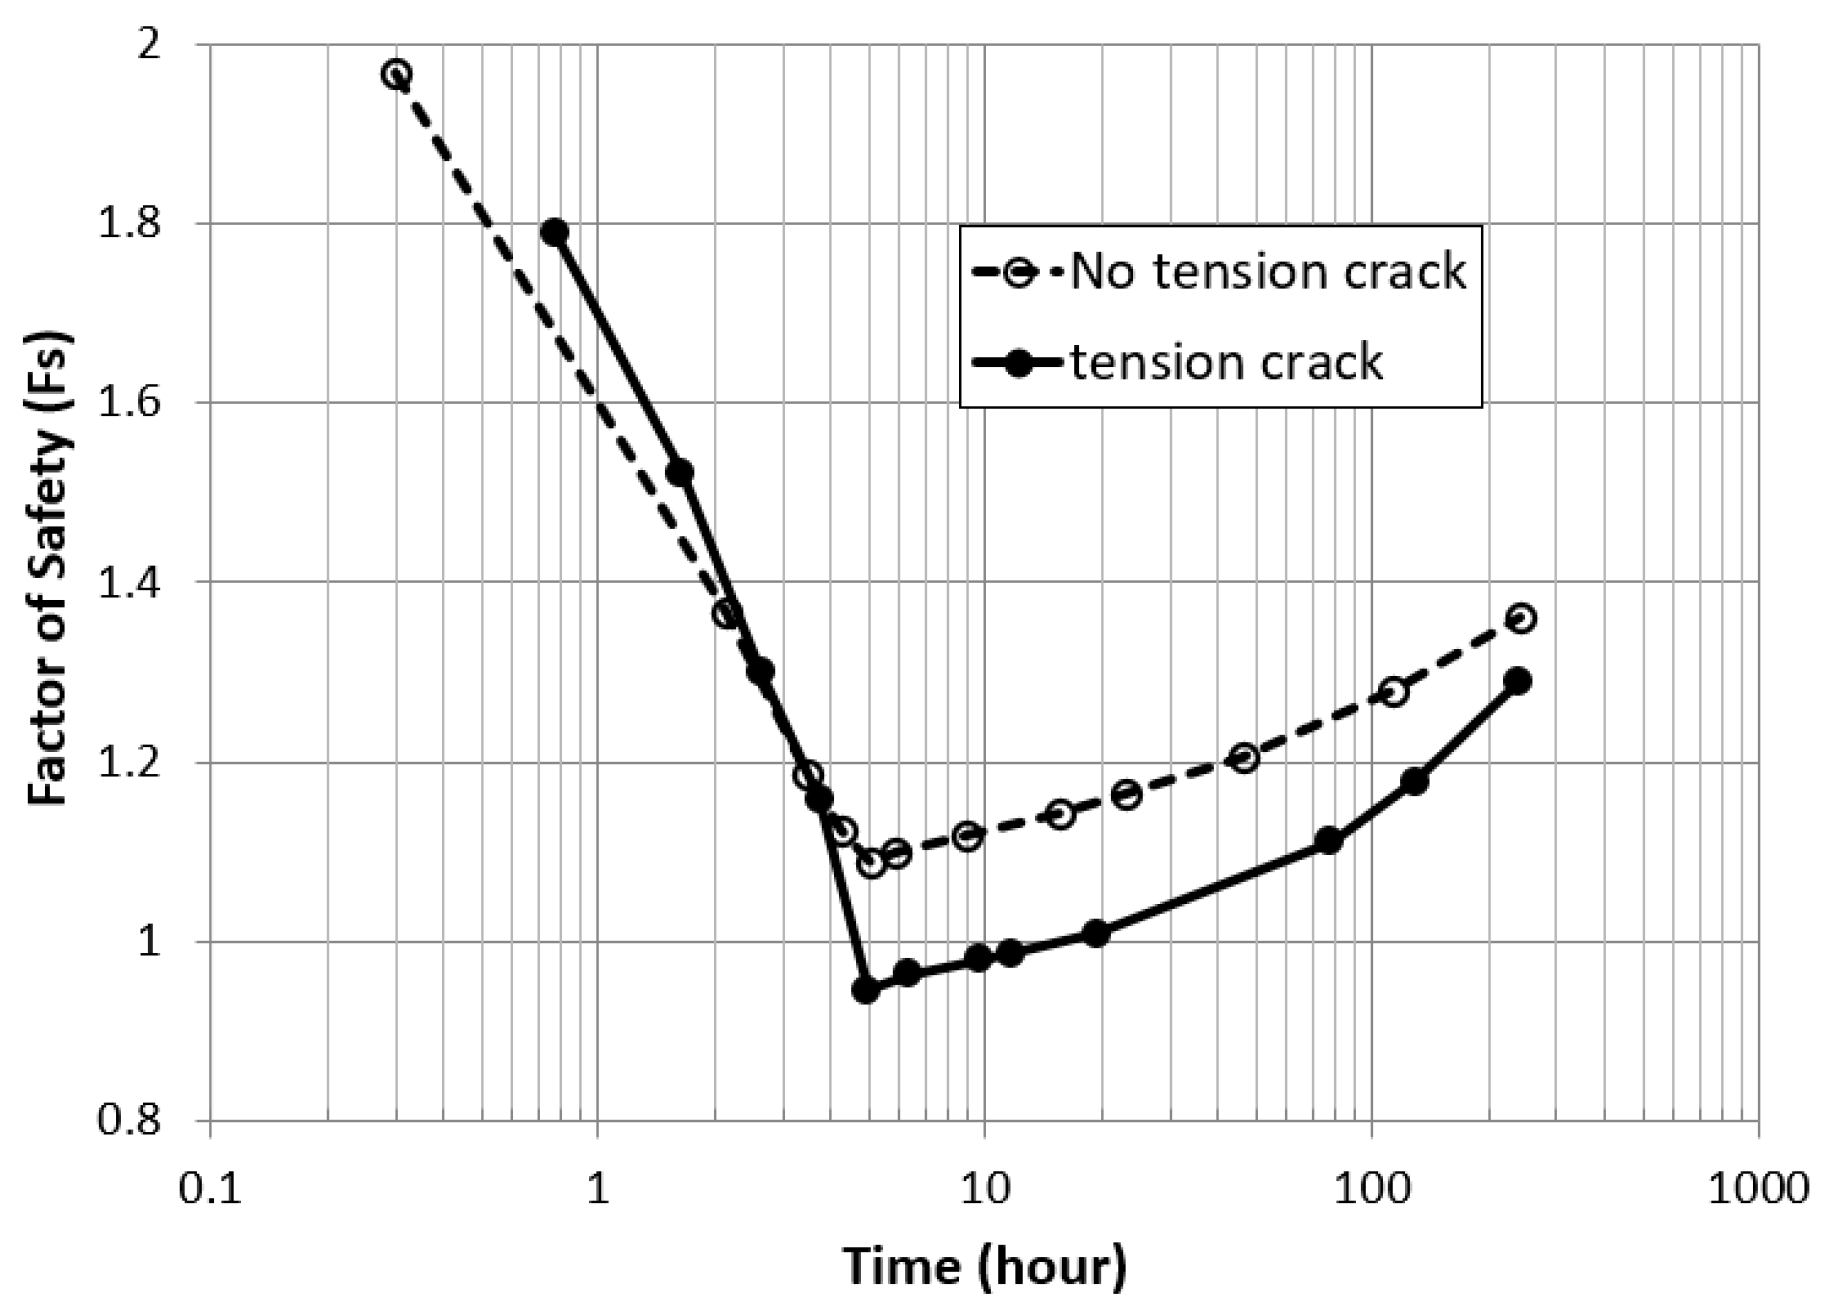
In general, when an embankment slope that has been submerged for an extended period is suddenly exposed to sunlight during drawdown, it is prone to the formation of tensile cracks, significantly elevating the risk of collapse. Figure 15 shows the changes in the factor of safety for the upstream slope over time after drawdown. The lowest factor of safety was obtained at 5 h due to a higher pore-water pressure remaining in the embankment slope, resulting in a significant reduction in the effective stress. However, the factor of safety tended to recover after 5 h as the pore-water pressure decreased. As observed in the comparison, the embankment slope during drawdown was vulnerable to failure caused by tensile cracks. These cracks represent a pivotal factor that can lead to potential collapses, thereby emphasizing the necessity for a thorough evaluation of the reinforcement measures during construction.
3.3. Stability Analysis of a Slope Due to Overtopping
The probable rainfall was estimated at the weather station near the target basin area to assess the potential for embankment overtopping. Subsequently, a transient simulation was conducted. Figure 6 depicts the stability analysis of the embankment slope subjected to overtopping, assuming that the embankment’s hydraulic and mechanical properties were the same. The most critical condition for the embankment slope was observed when the water pressure from the water level disappeared. However, it was also essential to assess the stability of the downstream slope against overtopping caused by prolonged rainfall.
The wetting zone in the downstream slope extended deeper and wider due to prolonged rainfall. The water infiltration into the slope caused the unsaturated permeability function to reach the saturated permeability rapidly. Overtopping was prone to occur due to heavy rain and extreme fluctuations in the initial water level. As a result, there was sufficient time and rain to consider the downstream slope as saturated conditions after overtopping. Similar to the upstream slope, the slope angle was set at 1:2 (V:H). A rainfall intensity of 20 mm/h () was considered in the analysis.
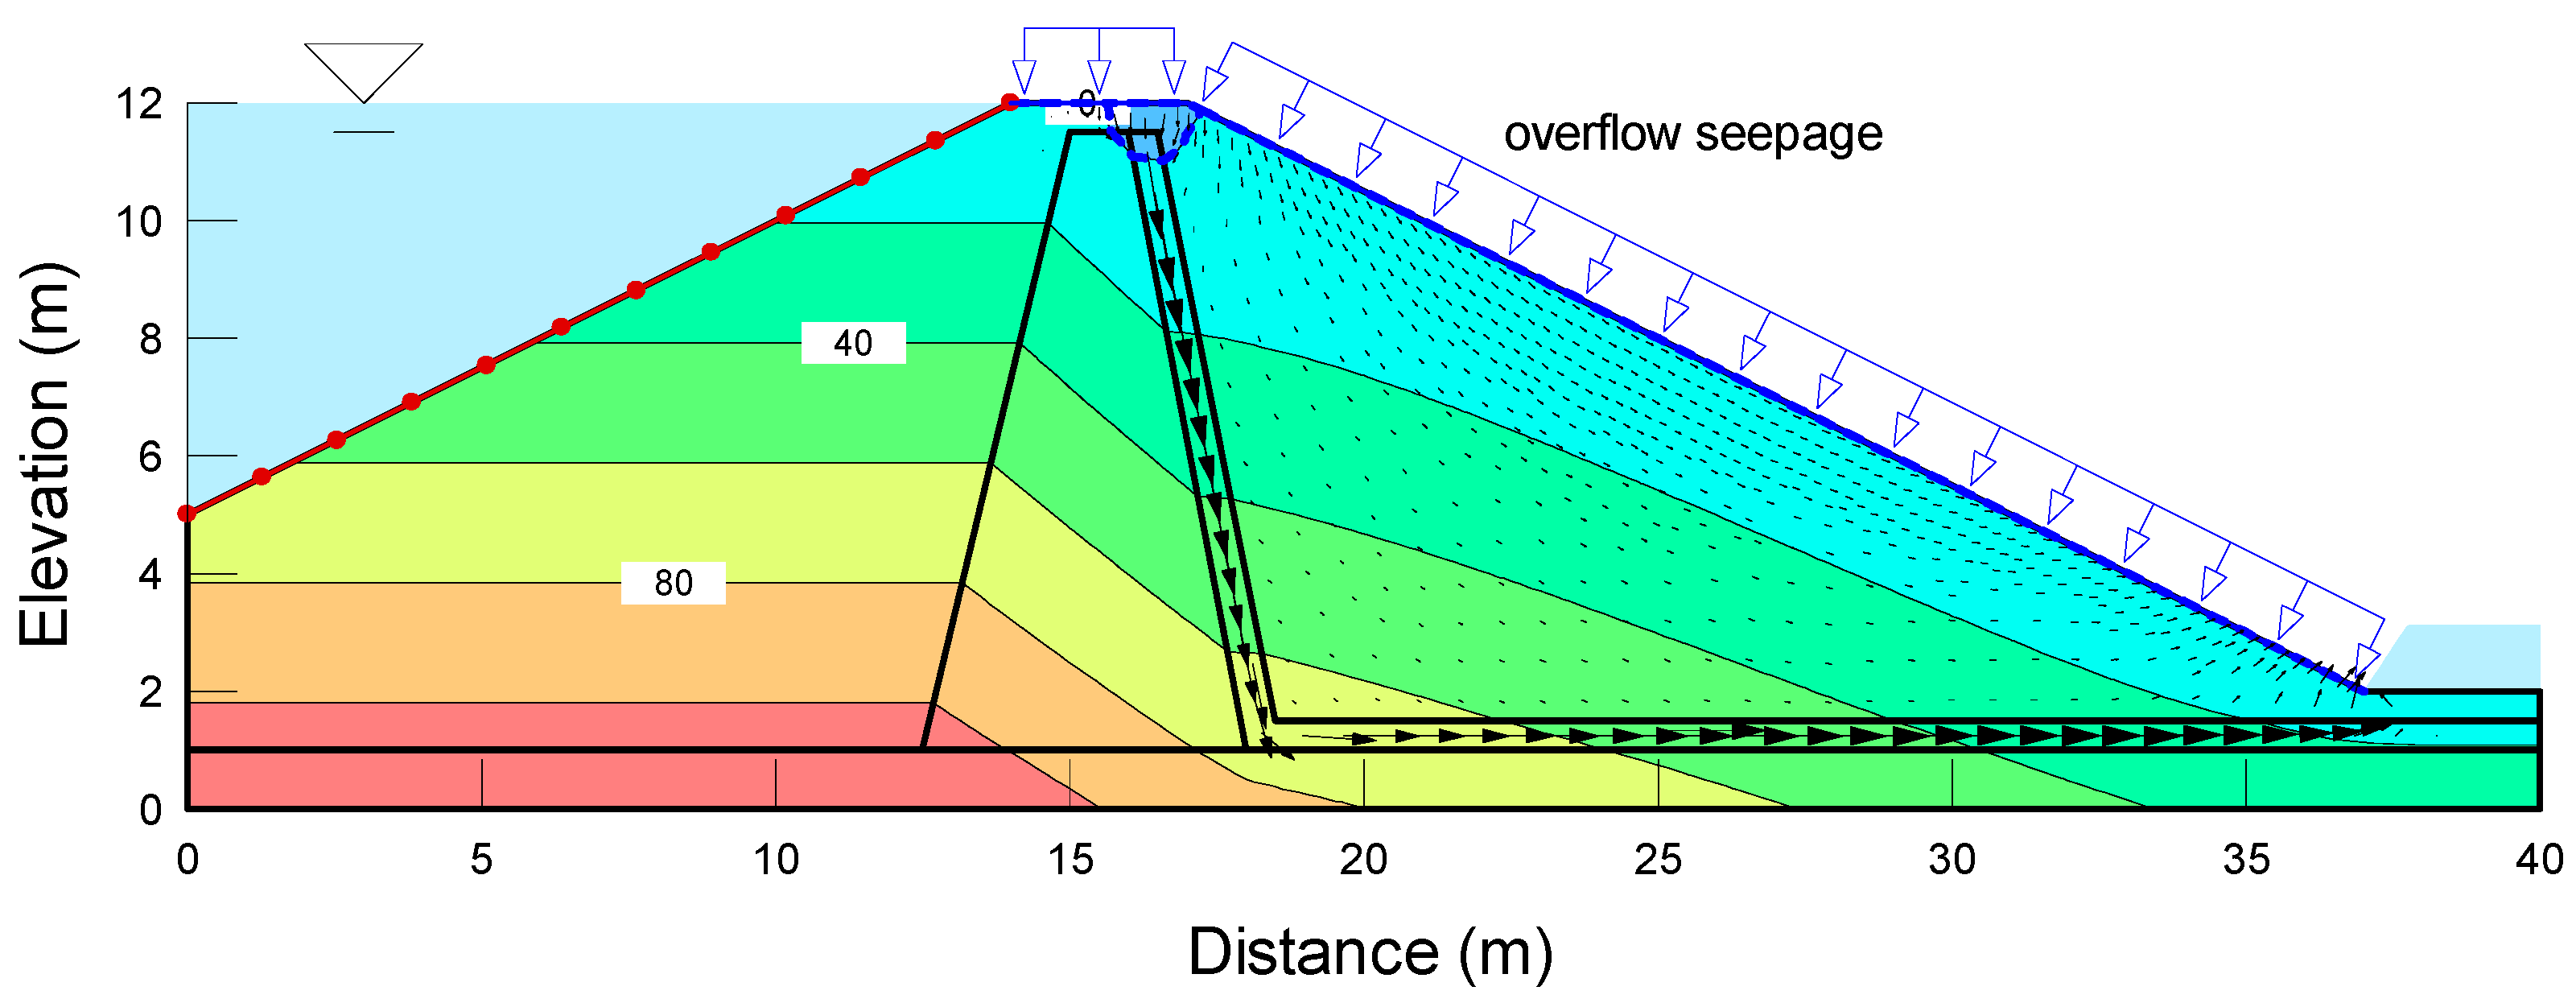
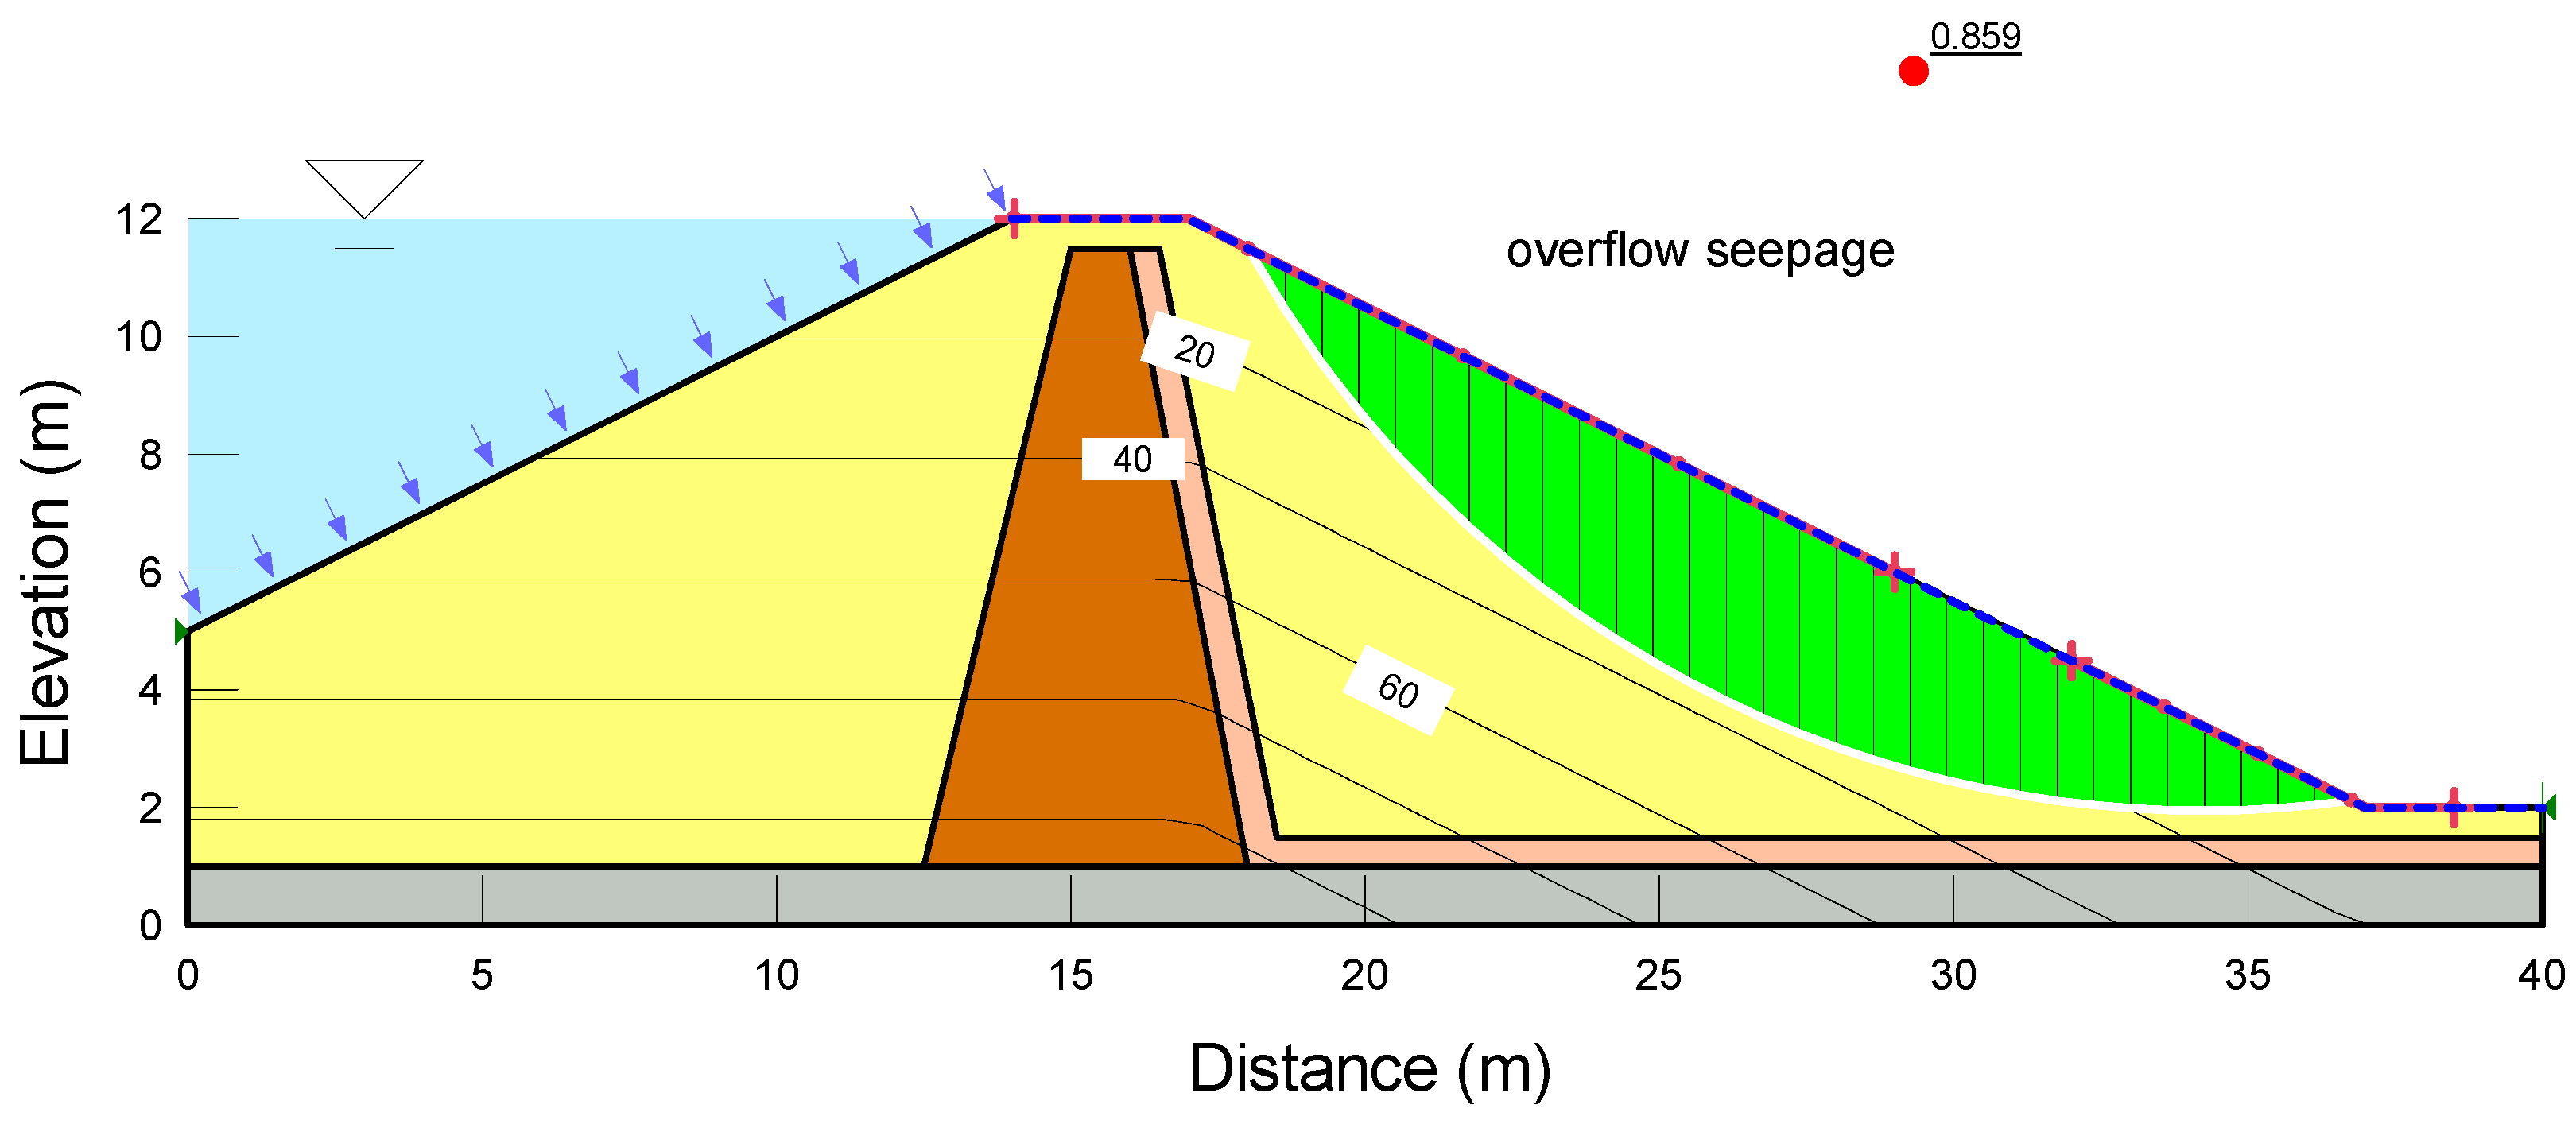
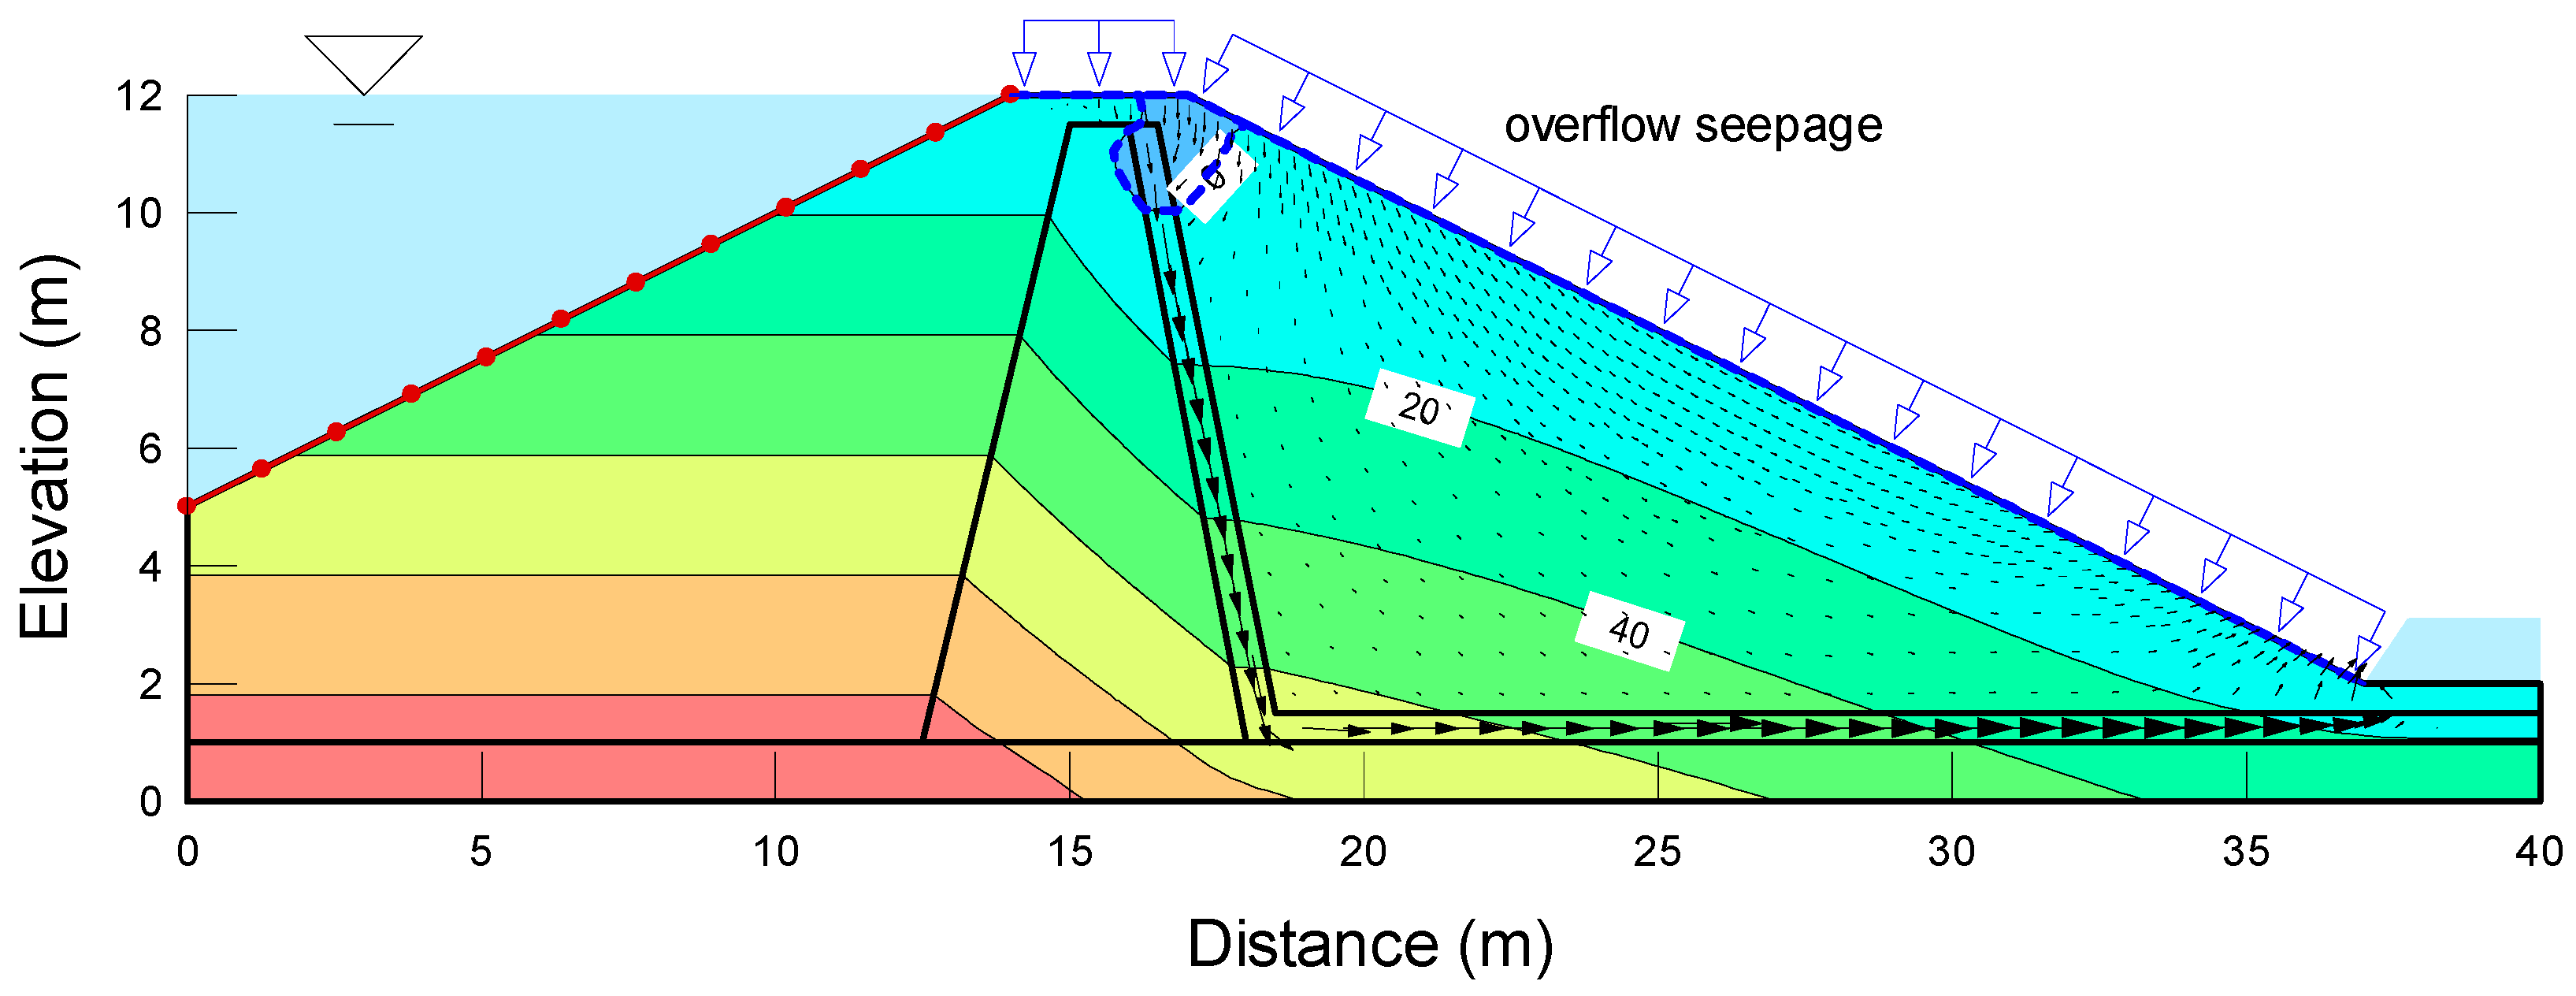
Figure 16 illustrates the distribution of the pore-water pressure in the embankment slope as the overtopping commenced. In contrast, Figure 17 shows the factor of safety for the downstream slope under the overtopping conditions. The rainfall made the slope saturated, resulting in a lower factor of safety below unity. As overtopping progressed, the pore-water pressure in the saturated downstream slope decreased due to the drainage layer of the clay core. The reduction in the pore-water pressure increased the effective stresses of the soil, leading to a partial improvement in the factor of safety for the slope compared to the initial conditions.
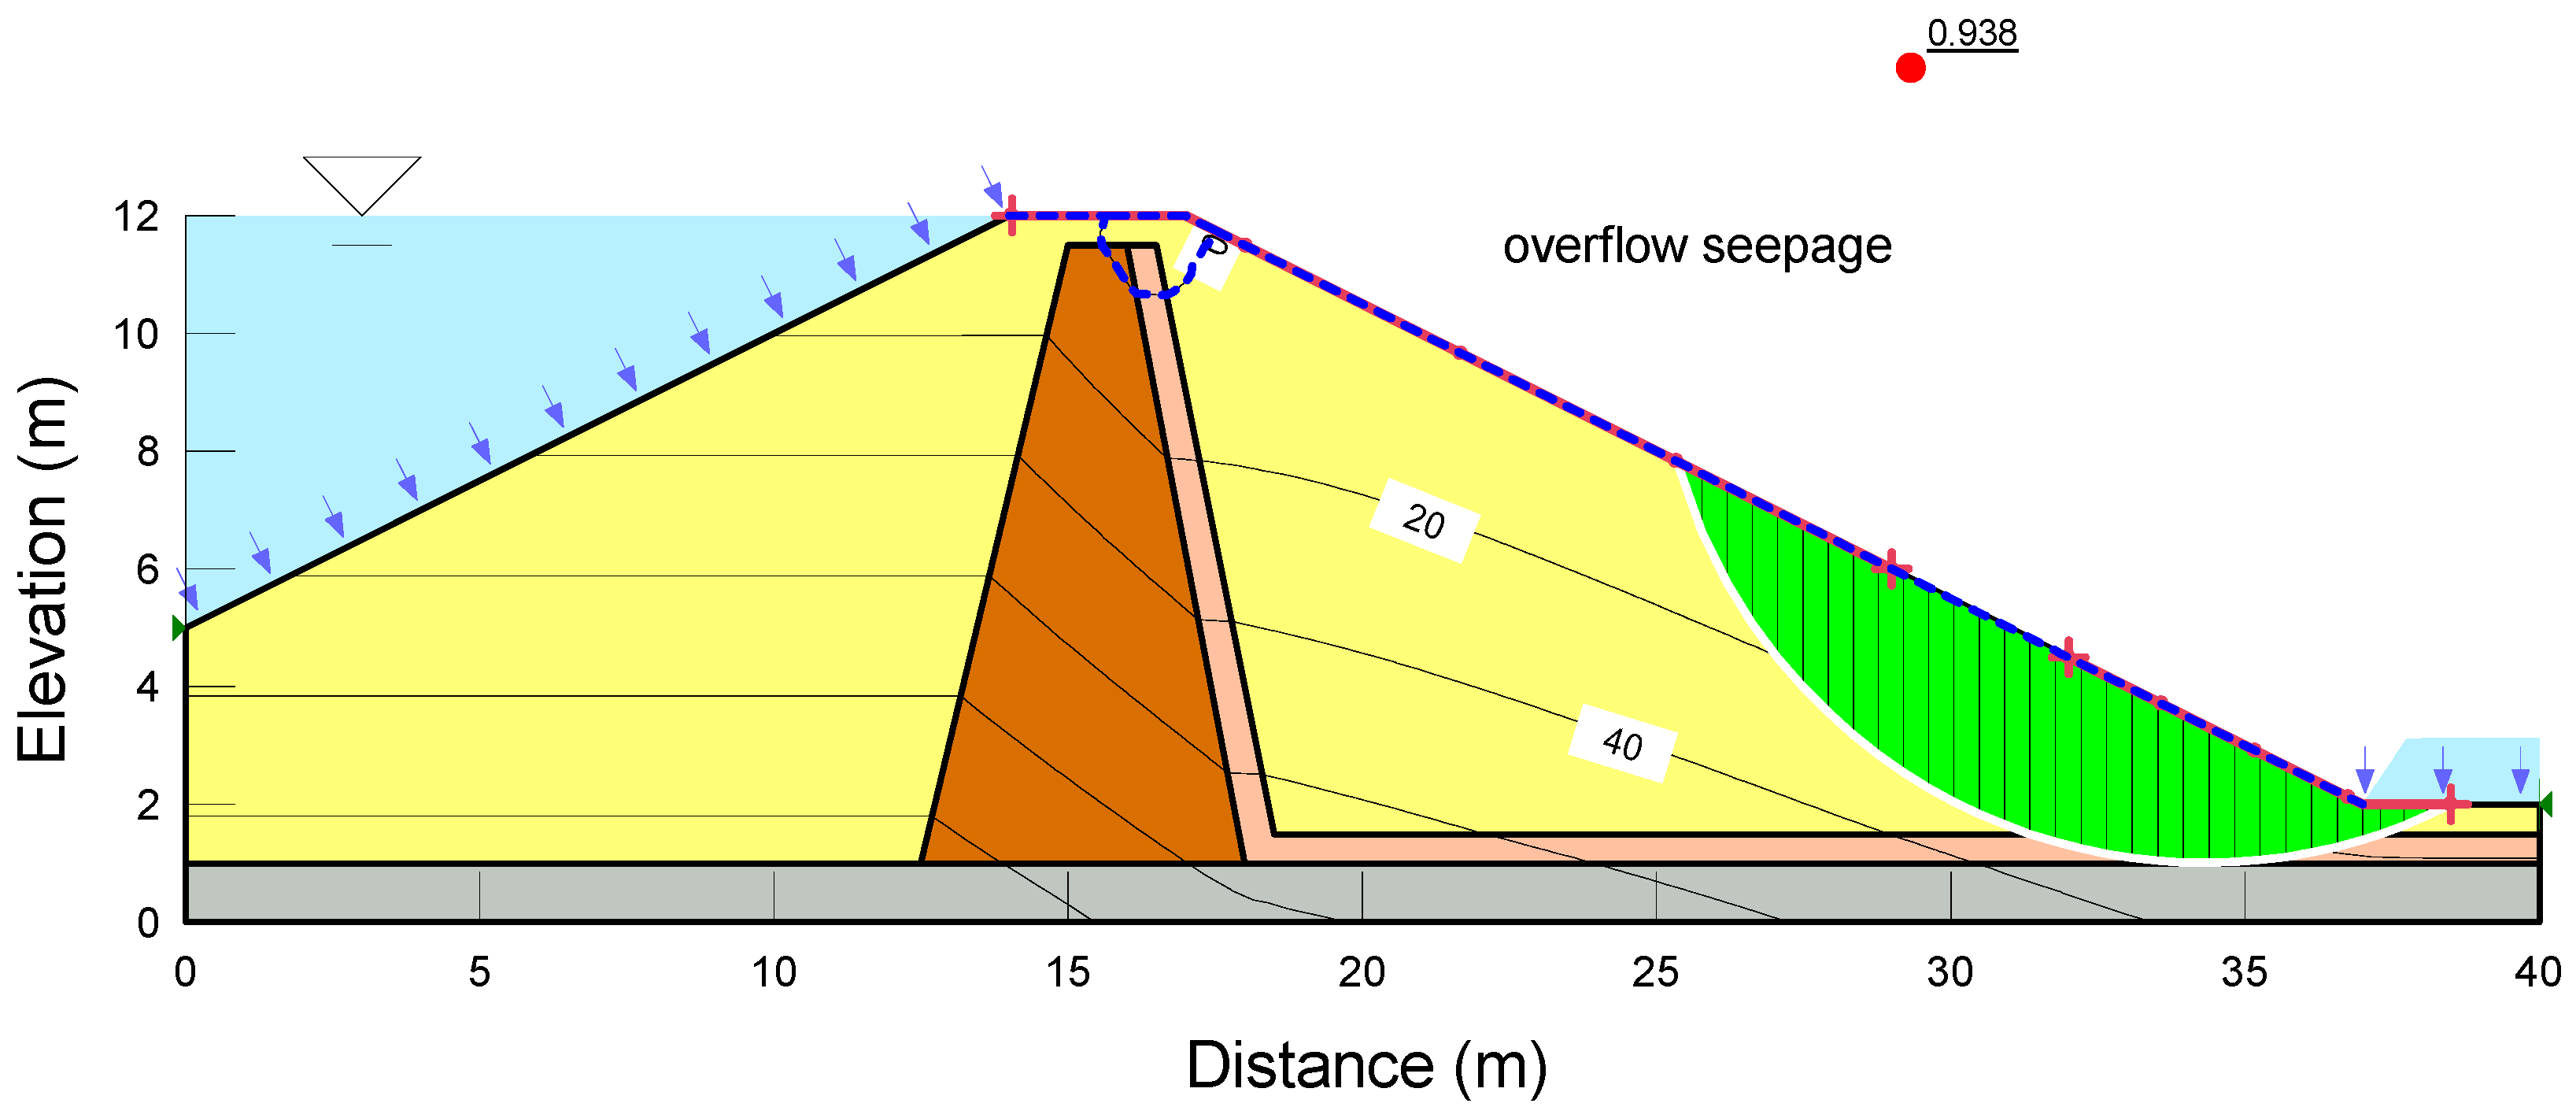
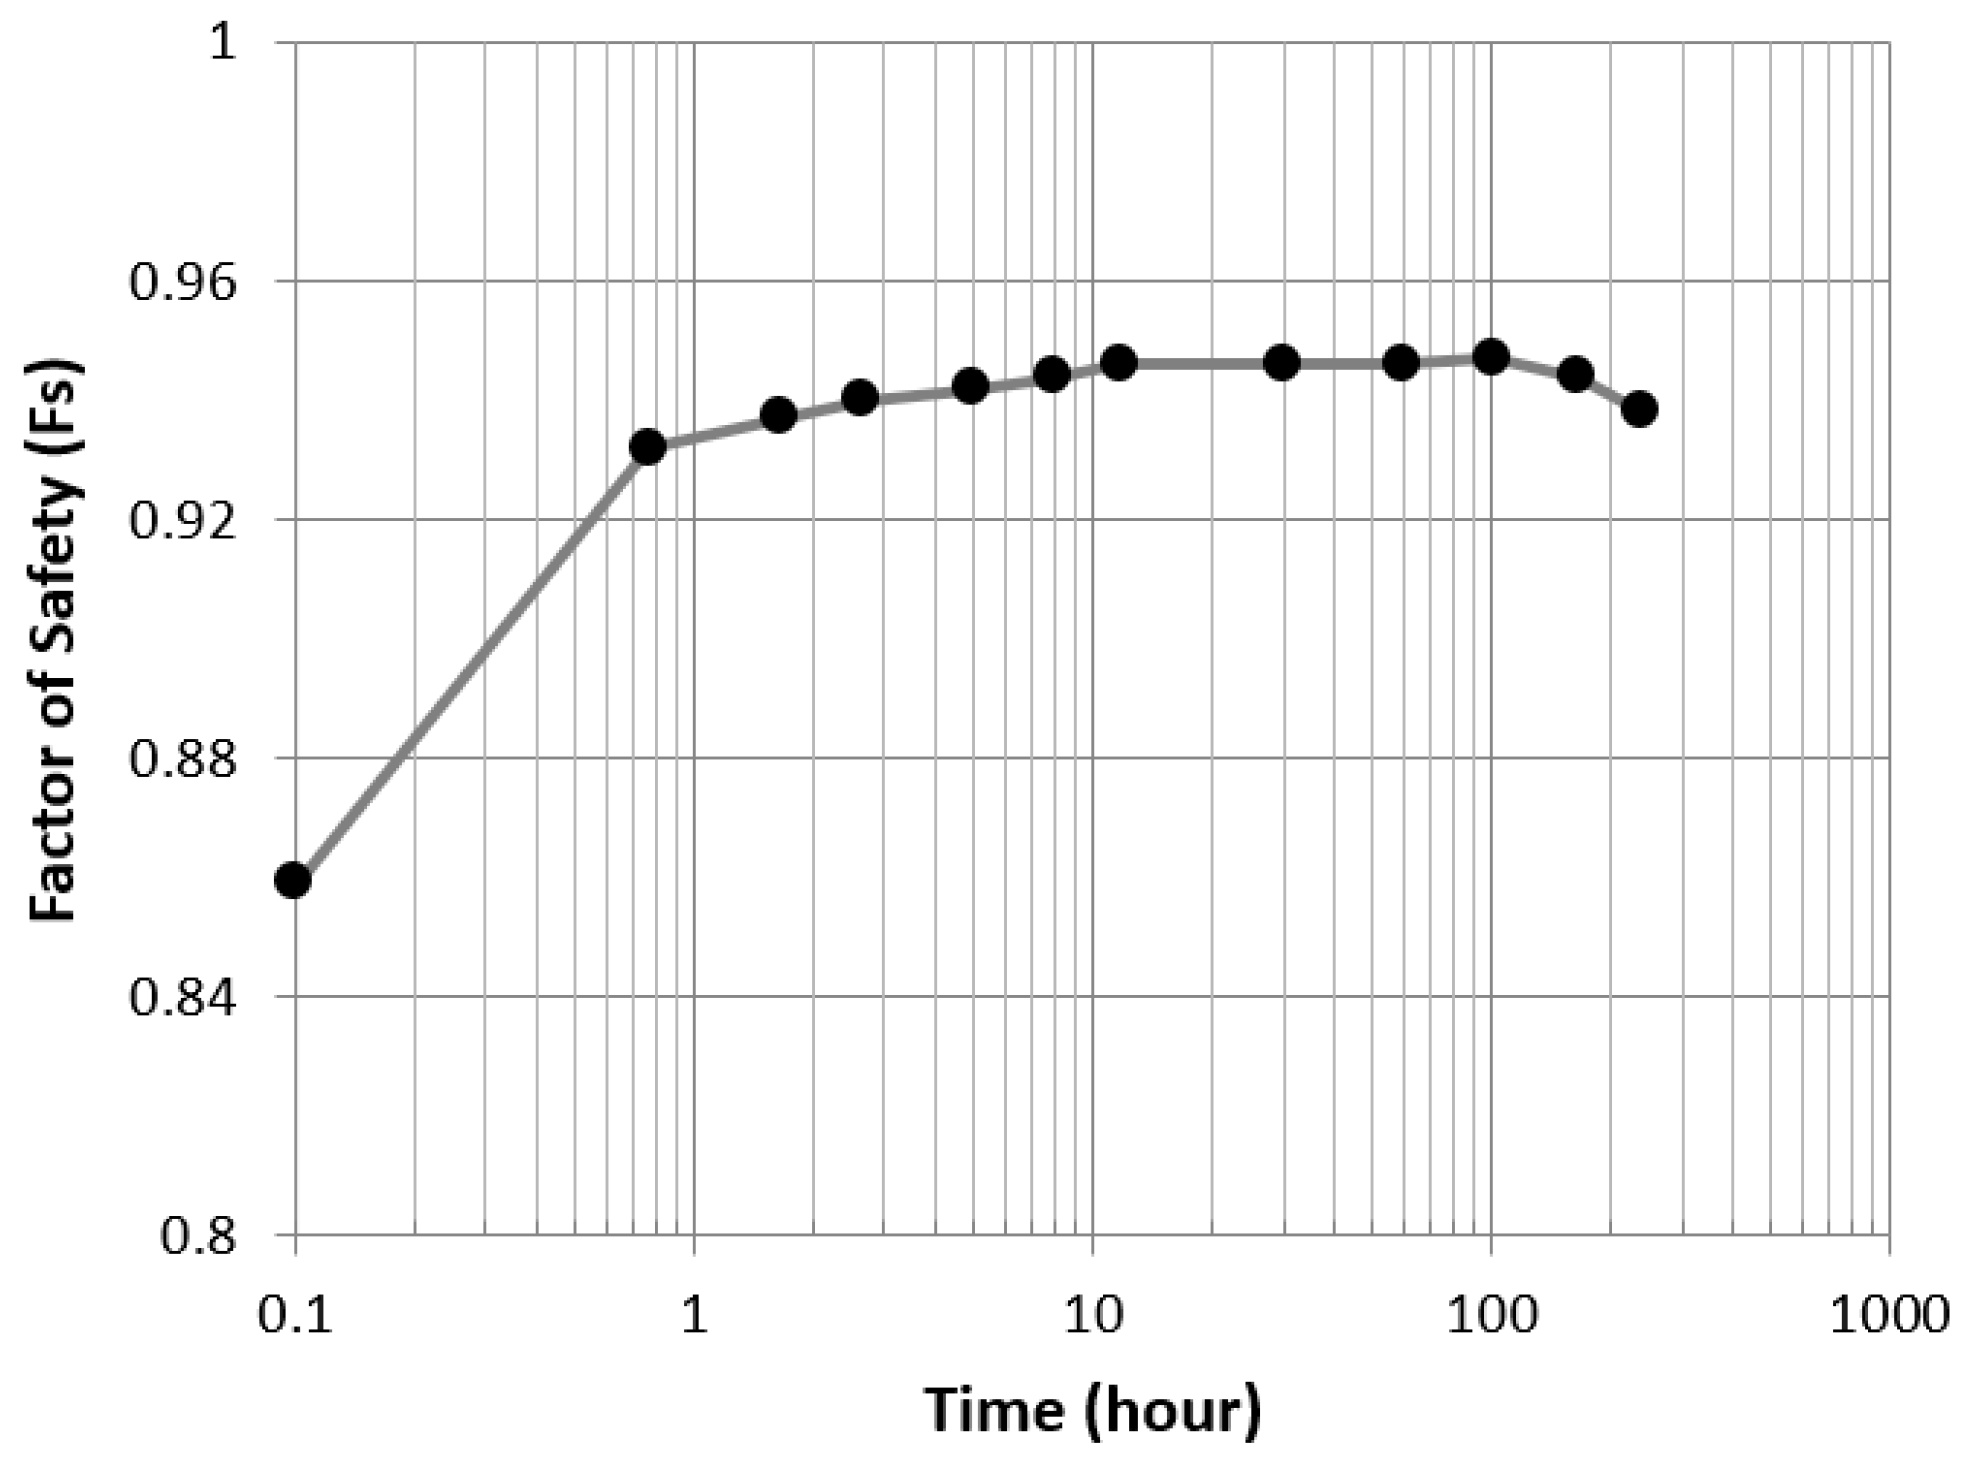
Figure 18 presents the pore-water pressure distribution within the slope after 10 days of overtopping, while Figure 19 shows the factor of safety of the downstream slope after the same duration. The results exhibited that the pore-water pressures and factors of safety were improved, but the slope remained in an unstable condition. To assess the slope stability over time, Figure 20 illustrates the changes in the factor of safety from the beginning stage of overtopping to after 10 days. It was found that the downstream slope experienced its greatest instability at the beginning of overtopping, and it gradually increased as the pore-water pressure decreased slightly.
4. Conclusions
This study highlighted the importance of estimating the embankment risk through an evaluation of overtopping rather than relying solely on the fixed water levels. A numerical analysis was conducted to assess the instability of the embankment under different rainfall scenarios that could lead to embankment overtopping. The key conclusions and contributions of this study are as follows.
- 1.
- The hydrological analyses revealed that utilizing copula functions to account for the water level fluctuations resulted in a higher probability of overtopping than a conventional approach that relied on the seasonal flood-limited water level. This proposed approach can be viewed as a proactive effort for enhancing the stability of the embankment slope in the face of climate change challenges.
- 2.
- During rapid drawdown, the upstream slope of the embankments presented the highest risk. However, an increased risk was identified in the downstream slope of the embankments during the initial stages of overflow, which could result in soil erosion and entrainment due to saturated conditions.
- 3.
- Countermeasures against tensile cracks, a critical factor triggering collapses during drawdown events, should be thoroughly examined. In addition, the approach involving the initial fluctuation of the water levels plays a crucial role in the potential for embankment overflow during extreme rainfall events.
Author Contributions
Conceptualization, J.K.; methodology, Y.K.; software, J.K.; validation, Y.K.; investigation, J.K.; data curation, A.S.; writing—original draft preparation, Y.K.; writing—review and editing, A.S.; visualization, J.K.; supervision, Y.K.; project administration, J.K.; funding acquisition, J.K. All authors have read and agreed to the published version of the manuscript.
Funding
This research was supported by the National Research Foundation of Korea (NRF) grant funded by the Korean government (Ministry of Education) (No. 2020R1I1A- 307511011).
Institutional Review Board Statement
Not applicable.
Informed Consent Statement
Not applicable.
Data Availability Statement
All or some of the data are available from the corresponding authors upon reasonable request.
Conflicts of Interest
The authors declare no conflict of interest.
References
- von Hardenberg, W. Expecting Disaster: The 1963 Landslide of the Vajont Dam. Arcadia 2011, 3. [Google Scholar]
- Kaktins, U.; Davis Todd, C.; Wojno, S.; Coleman, N. Revisiting the timing and events leading to and causing the Johnstown flood of 1889. Pa. Hist. 2013, 80, 335–363. [Google Scholar] [CrossRef]
- Dhar, O.N.; Rakhecha, P.R.; Mandal, B.N.; Sangam, R.B. The rainstorm which caused the Morvi dam disaster in August 1979/L’orage qui a provoqué la catastrophe du barrage Morvi août 1979. Hydrol. Sci. J. 1981, 26, 71–81. [Google Scholar] [CrossRef]
- Eash, D.A. Floods of July 23–26, 2010, in the Little Maquoketa River and Maquoketa River Basins. In Northeast Iowa: U.S. Geological Survey Open-File Report 2011–1301; 2012; p. 45. [Google Scholar]
- Chraibi, A.F.; Schleiss, A.J.; Tournier, J.P. Failure of Saddle Dam, Xe-Pian Xe-Namnoy Project: Executive Summary. In Dam Breach Modelling and Risk Disposal. ICED 2020; Zhang, J.M., Zhang, L., Wang, R., Eds.; Springer Series in Geomechanics and Geoengineering; Springer: Cham, Switzerland, 2020. [Google Scholar]
- Lou, W.C. Mathematical Modeling of Earth Dam Breaches. Unpublished. Ph.D. Dissertation, Colorado State University, Fort Collins, CO, USA, 1981. [Google Scholar]
- Middlebrooks, T.A. Earth-Dam Practice in the United States. Teans. Amer. Soc. Civil Eng. 1953, 118, 679–722. [Google Scholar] [CrossRef]
- Gruner, E. The Mechanism of Dam Failure. In Proceedings of the 9th Congress of the International Commission on Large Dams, Istanbul, Turkey, 4–8 September 1967; pp. 197–206. [Google Scholar]
- Takase, K. Statistic Study on Failure, Damage and Deterioration of Earth Dams in Japan. In Proceedings of the 9th Congress of the International Commission on Large Dams, Istanbul, Turkey, 4–8 September 1967; pp. 1–19. [Google Scholar]
- Babb, A.O.; Mermel, T.W. Catalog of Dam Disasters, Failures and Accidents; U.S. Bureau of Reclamation: Washington, DC, USA, 1968.
- Biswas, A.K.; Chatterjee, S. Dam Disasters—An Assessment. Eng. J. 1971, 54, 3–8. [Google Scholar]
- USCOLD. Lessons from Large Dams, Report of the Committee on Failures and Accidents to Large Dams of USCOLD; American Society of Civil Engineers: New York, NY, USA, 1975. [Google Scholar]
- Liu, D.; Lee, K.H. Flooding Simulation of Sandae Reservoir Collapse using 2D Hydrologic Model FLO-2D. J. Environ. Sci. Int. 2022, 31, 757–766. [Google Scholar]
- Lee, J.Y.; Park, D.H.; Kim, S.J.; Kim, T.W. Estimation of Break Outflow from the Goeyeon Reservoir Using DAMBRK Model. KSCE J. Civil. Environ. Eng. Res. 2017, 37, 459–466. [Google Scholar]
- Prendergast, J.D. Probabilistic Concept for Gravity Dam Analysis, Special Rep, M-265, Construction Engineering Research Lab; U.S. Army Corps of Engineers: Champaign, IL, USA, 1979.
- Dekay, M.L.; McClelland, G. Predicting loss of lifein cases of dam failure and flash flood. Risk Anal. 1993, 13, 2. [Google Scholar] [CrossRef]
- Kwon, H.H.; Moon, Y.I. Improvement of Overtopping Risk Evaluations Using Probabilistic Concepts for Existing Dams. Stoch. Environ. Res. Risk Assess. 2006, 20, 223–237. [Google Scholar] [CrossRef]
- Hsu, Y.C.; Tung, Y.K.; Kuo, J.T. Evaluation of dam overtopping probability induced by flood and wind. Stoch. Environ. Res. Risk Assess. 2011, 25, 35–49. [Google Scholar] [CrossRef]
- Kwon, H.H.; Moon, Y.I.; Khalil, A.F. Nonparametric monte carlo simulation for flood frequency curve derivaion: An application to a KOREAN watershed. J. Am. Water Resour. Assoc. 2007, 43, 1316–1328. [Google Scholar] [CrossRef]
- Sklar, M. Foncitions de Repartition a n Dimensions et Leurs Marges; Publications de Institut de Statistique Universite de Paris: Paris, France, 1959; Volume 8, pp. 229–231. [Google Scholar]
- Nelsen, R.B. An Introduction to Copula; Springer: New York, NY, USA, 2006; pp. 109–155. [Google Scholar]
- Na, B.K.; Kim, J.Y.; Lim, J.Y.; Kwon, H.H. Improvement of Hydtologic Dam Risk Analysis Model Considering Uncertainty of Hydrologic Analysis Process. J. Korea Water Resour. Assoc. 2014, 47, 853–865. [Google Scholar] [CrossRef]
- Sun, Y.; Li, Z.; Yang, K.; Wang, G.; Hu, R. Analysis of the Influence of Water Level Change on the Seepage Field and Stability of a Slope Based on a Numerical Simulation Method. Water 2023, 15, 216. [Google Scholar] [CrossRef]
- Liu, D.; Lin, T.; Gao, J.; Xue, B.; Yang, J.; Chen, C.; Zhang, W.; Sun, W. Study on the Influence of Water Level on Earth Dam Reinforced by Cut-Off Wall: A Case Study in Wujing Reservoir. Water 2023, 15, 140. [Google Scholar] [CrossRef]
- Xu, J.S.; Yang, X.L. Three-dimensional stability analysis of slope in unsaturated soils considering strength nonlinearity under water drawdown. Eng. Geol. 2018, 237, 102–115. [Google Scholar] [CrossRef]
- Ministry of Land, Infrastructure and Transport. Criteria and Description of River Design; Ministy of Land, Infrastructure and Transport: Seoul, Republic of Korea, 2009.
- GeoStudio, version 8.16.5. Manual for SEEP/W and SLOPE/W Modeling; GEO-SLOPE International, Ltd.: Calgary, AB, Canada, 2016.
- van Genuchten, M.T. A Closed Form Equation for Predicting the Hydraulic Conductivity of Unsaturated Soils. Soil Sci. Soc. Am. J. 1980, 44, 892–898. [Google Scholar] [CrossRef]
- Jeong, S.; Lee, K.; Kim, J.; Kim, Y. Analysis of rainfall-induced landslide on unsaturated soil slopes. Sustainability 2017, 9, 1280. [Google Scholar] [CrossRef]
- Kim, J.; Kim, Y.; Jeong, S.; Hong, M. Rainfall-induced landslides by deficit field matric suction in unsaturated soil slopes. Environ. Earth Sci. 2017, 76, 808. [Google Scholar] [CrossRef]
Figure 1.
Dam collapses due to localized heavy rains in South Korea: (a) San-Dae reservoir; (b) Geo-Yeon reservoir.
Figure 1.
Dam collapses due to localized heavy rains in South Korea: (a) San-Dae reservoir; (b) Geo-Yeon reservoir.

Figure 2.
Initial water surface level calculated using the copula function.

Figure 3.
Conceptual diagram for the hydrologic dam risk analysis.

Figure 4.
Conceptual diagram for the hydrologic dam risk analysis. (a) Simulation using the project water elevation; (b) initial water level below the dam crest.
Figure 4.
Conceptual diagram for the hydrologic dam risk analysis. (a) Simulation using the project water elevation; (b) initial water level below the dam crest.

Figure 5.
Ensemble scenarios for the dam water surface level, considering the water surface level estimated through the copula analysis at the dam. (a) Simulation using the fluctuating water level; (b) result of predicting overflow.
Figure 5.
Ensemble scenarios for the dam water surface level, considering the water surface level estimated through the copula analysis at the dam. (a) Simulation using the fluctuating water level; (b) result of predicting overflow.

Figure 6.
Initial condition of an embankment with tension cracks.

Figure 7.
Pore-water pressure of an embankment under the initial conditions.

Figure 8.
Stability of an embankment before rapid drawdown under the initial conditions (Fs = 1.959).
Figure 8.
Stability of an embankment before rapid drawdown under the initial conditions (Fs = 1.959).

Figure 9.
Drawdown of the pore-water pressures of an embankment after 5 h.

Figure 10.
Stability of an embankment with rapid drawdown after 5 h (Fs = 1.083).

Figure 11.
Drawdown of the pore-water pressure of an embankment after one day.

Figure 12.
Stability of an embankment with rapid drawdown after one day (Fs = 1.161).

Figure 13.
Distribution of the pore-water pressures in the embankment with tension cracks (after 5 h of drawdown).
Figure 13.
Distribution of the pore-water pressures in the embankment with tension cracks (after 5 h of drawdown).

Figure 14.
Stability of an embankment with drawdown after 5 h (Fs = 0.946).

Figure 15.
Variations in the safety factor in an embankment during rapid drawdown.

Figure 16.
Pore-water pressure of an embankment under the initial conditions after overtopping.

Figure 17.
Stability of an embankment under the initial conditions after overtopping (Fs = 0.859).

Figure 18.
Pore-water pressure of an embankment over 10 d after overtopping.

Figure 19.
Stability of an embankment over 10 d after overtopping (Fs = 0.938).

Figure 20.
Variations in the safety factor during the overtopping of an embankment.


Table 1.
Causes of dam collapses.
| Causes | Middlebrooks (1953) [7] | Gruner (1967) [8] | Takase (1967) [9] | Babb and Mermel (1968) [10] | Biswas and Chatterjee (1971) [11] | USCOLD (1975) [12] |
|---|---|---|---|---|---|---|
| Overtopping | 30 | 23 | 28 | 36 | 35 | 38 |
| Piping and seepage | 38 | 40 | 44 | 30 | 25 | 44 |
| Foundation defects | 15 | 2 | 10 | 15 | - | 9 |
| Others | 17 | 35 | 18 | 19 | 40 | 9 |
Table 2.
Bivariate copula functions used in the analysis (Nelsen, 2006 [21]).
Table 2.
Bivariate copula functions used in the analysis (Nelsen, 2006 [21]).
| Name | |
|---|---|
| Gaussian | |
| Gumbel | |
| Student-t |
Table 3.
Annual maximum rainfall for 48 h in 12 stations for the rainfall probability analysis.
| Station | Mean (mm) | Stan. Dev. (mm) | Skewness | Kurtosis | Minimum (mm) | Maximum (mm) |
|---|---|---|---|---|---|---|
| 1 | 177.94 | 86.63 | 0.73 | 2.96 | 44.00 | 403.00 |
| 2 | 196.76 | 109.97 | 1.05 | 3.31 | 46.50 | 492.00 |
| 3 | 180.46 | 98.29 | 1.16 | 3.90 | 55.00 | 464.30 |
| 4 | 182.69 | 85.38 | 1.02 | 3.45 | 50.50 | 409.00 |
| 5 | 186.84 | 91.03 | 0.91 | 2.83 | 82.00 | 408.00 |
| 6 | 177.59 | 92.19 | 1.50 | 6.25 | 44.90 | 529.00 |
| 7 | 190.15 | 86.50 | 1.39 | 6.59 | 57.00 | 534.00 |
| 8 | 190.65 | 83.04 | 0.85 | 3.05 | 74.20 | 427.00 |
| 9 | 194.82 | 86.42 | 1.28 | 4.39 | 91.00 | 470.00 |
| 10 | 187.80 | 90.31 | 1.35 | 4.51 | 79.00 | 475.00 |
| 11 | 184.06 | 83.76 | 1.05 | 4.06 | 63.50 | 450.70 |
| 12 | 185.21 | 92.21 | 0.73 | 2.53 | 66.50 | 402.00 |
Table 4.
Factor of safety standard for the reinforcement of the embankment.
| Unstable Factors | Condition of Pore-Water Pressure | Factor of Safety |
|---|---|---|
| Regardless of tension cracks | Regardless of pore-water pressure | Above 2.0 |
| With regard to pore-water pressure | Above 1.4 | |
| With regard to tension cracks | Regardless of pore-water pressure | Above 1.8 |
| With regard to pore-water pressure | Above 1.3 |
Table 5.
Physical and hydraulic parameters of the materials.
| Soil Type | Unit Weight (kN/m3) | Cohesion (kN/m2) | Friction Angle (°) | Permeability (m/s) | SWCC Parameters a (kPa), n | Sat./Res. WC (m3/m3) |
|---|---|---|---|---|---|---|
| Fill-up Ground | 19 | 5 | 30 | 5 × 10⁻⁶ | 17.54, 3.9 | 0.38/0.01 |
| Clay core | 18 | 15 | 15 | 1 × 10⁻⁹ | 50, 2.06 | 0.45/0.08 |
| Drain | 19 | 0 | 32 | 1 × 10⁻⁴ | 1.5, 2.1 | 0.3/0.0 |
| Bedrock | - | - | - | Impenetrable | - | - |
Disclaimer/Publisher’s Note: The statements, opinions and data contained in all publications are solely those of the individual author(s) and contributor(s) and not of MDPI and/or the editor(s). MDPI and/or the editor(s) disclaim responsibility for any injury to people or property resulting from any ideas, methods, instructions or products referred to in the content. |
© 2023 by the authors. Licensee MDPI, Basel, Switzerland. This article is an open access article distributed under the terms and conditions of the Creative Commons Attribution (CC BY) license (https://creativecommons.org/licenses/by/4.0/).
Share and Cite
MDPI and ACS Style
Kim, J.; Kim, Y.; Satyanaga, A. Instability of Embankment Slopes Due to Overflow and Drawdown. Water 2023, 15, 3402. https://doi.org/10.3390/w15193402
AMA Style
Kim J, Kim Y, Satyanaga A. Instability of Embankment Slopes Due to Overflow and Drawdown. Water. 2023; 15(19):3402. https://doi.org/10.3390/w15193402
Chicago/Turabian StyleKim, Jaehong, Yongmin Kim, and Alfrendo Satyanaga. 2023. "Instability of Embankment Slopes Due to Overflow and Drawdown" Water 15, no. 19: 3402. https://doi.org/10.3390/w15193402
Note that from the first issue of 2016, this journal uses article numbers instead of page numbers. See further details here.