Article

Relationship Identification between Water-Energy Resource Utilization Efficiency and Ecological Risk in the Context of Assessment-Decoupling Two-Stage Framework—A Case Study of Henan Province, China

1
School of Water Conservancy and Transportation, Zhengzhou University, Zhengzhou 450001, China
2
Henan International Joint Laboratory of Water Cycle Simulation and Environmental Protect, Zhengzhou 450001, China
*
Author to whom correspondence should be addressed.
Water 2023, 15(19), 3377; https://doi.org/10.3390/w15193377
Submission received: 5 September 2023 / Revised: 20 September 2023 / Accepted: 21 September 2023 / Published: 26 September 2023
(This article belongs to the Special Issue China Water Forum 2023)

Abstract

:
The situation of resource utilization and eco-environment protection remains critical globally. The harmony between eco-environment health and water-energy utilization efficiency is a strong support for the realization of high-quality development. In this paper, an Assessment-Decoupling two-stage framework was developed to investigate the relationship between water-energy resource utilization and ecological security. In detail, an improved input-output indicator system was constructed to assess the water-energy resource utilization efficiency (WEUE), and its influencing factors were examined from multiple system perspectives; then, we intended to evaluate the ecological risk (ER) from a raster-scale perspective based on land-use types; and finally, the decoupling idea was introduced to quantify the fitness relationship of the above two aspects. The framework was applied to Henan Province, China. The study found that: (1) the WEUE of Henan Province shows a “W” pattern of development during 2000–2020; in 2000–2010, the WEUE of South Henan declined, while in 2010–2020, the WEUE of Henan Province gradually improved, with significant increases in various districts. (2) The ecological risk index (ERI) in Henan Province generally shows a decreasing trend, and the spatial difference is more obvious, with the high-risk areas mainly concentrated in the central, east, and south Henan, and the west of Henan is mainly a low-risk area. (3) There is strong spatial variation in the decoupling states of WEUE and ERI of the 18 districts in Henan Province, and the differences become more pronounced over time. The number of districts with a strong negative decoupling state has been increasing during the entire period, and a total of 14 districts have reached the above state in 2020. The developed framework offers a new idea for clarifying the relationship between resource utilization and ecological conditions, and the obtained results can provide data support for the realization of sustainable development.

1. Introduction

Water resources and energy are two types of essential resources that are indispensable for the development of human society. The former, as a primary natural resource, plays a fundamental role in ensuring the survival of human beings, and the latter, as an important strategic resource, is vital to guaranteeing the security of the country and the development of the regional economy [1]. The health of ecosystems is closely linked to the sustainable use of water and energy resources. Ecosystems provide conditions for the formation and storage of water resources. For instance, forests, wetlands, and rivers play a role in regulating the water cycle and protecting water quality [2]. The extraction and utilization of energy can disturb and damage ecosystems, such as the construction of hydroelectric power plants [3]. With sustained economic growth and rapid urbanization, the irrational and crude use of water and energy resources has led to increasingly prominent problems in ecological service functions. In Australia, for example, large-scale water resource development projects (e.g., diversion projects and the construction of reservoirs) have been implemented to meet agricultural and urban water needs, resulting in the loss of wetlands and the destruction of watershed ecosystems [4]. Oil field development and oil extraction in countries such as Saudi Arabia have led to soil contamination, pollution, and depletion of water resources, with long-term negative impacts on the surrounding terrestrial and marine ecosystems [5]. Therefore, it is crucial to investigate what kind of relationship exists between the utilization of water and energy resources and ecosystem change for the sustainable development of countries or regions.
Currently, there are quite a few studies related to water and energy. Research on water resources focuses on water resource evaluation and management [6], utilization efficiency [7], and climate change [8], and that of energy focuses on utilization efficiency [9], system optimization and intelligence [10], and energy transformation [11]. At the same time, a large number of scholars have also carried out research on the coupling of water and energy. For example, Okadera et al. [12] studied the water footprint of energy production and consumption as well as its external dependence in Thailand and Liaoning Province of China, respectively. Venkates et al. [13] analyzed the energy consumption of urban water recycling systems in Norway and studied the environmental impacts of their carbon emissions. In terms of efficiency measurement, numerous studies have been carried out on both water and energy utilization efficiency. For instance, Shi et al. [14] employed a data envelopment analysis (DEA) model to assess the efficiency of agricultural water utilization and explored spatial network correlation characteristics through the social network analysis (SNA) method. Kadir et al. [15] applied various data analysis models (i.e., residual augmented least squares, Engel’s coefficient, and quantile autoregressive distributive lagging technique) to explore the impact of energy use efficiency on economic growth. It can be found that previous studies on the utilization efficiency of water and energy have mainly focused on individual systems, but both water and energy are part of resources, and few scholars have linked the efficiency of the two.
The concept of ecological risk (ER) was first introduced by the U.S. Environmental Protection Agency (USEPA) in 1990. ER is the likelihood that ecosystems will be negatively affected by external factors (i.e., the possible effects of accidents or disasters with uncertainty on ecosystems and their components), which threatens the stability of ecosystems at some level [16]. Since the emergence of this concept, ER has been instrumental in the evaluation of ecological quality and management of the ecological environment, and a structural framework with international leadership has been initially developed in terms of theory [17] and methodology [18]. Early ER assessment mainly focused on the study of environmental pollution, which generally includes four parts: heavy metals [19,20], sediments [21,22], soil [23,24], and polycyclic aromatic chemicals [25,26]. Meanwhile, the scale of ER assessment is mostly a single risk source and a single risk recipient. In recent years, studies on ER assessment have paid more attention to the overall impact of ecosystems and the spatial relevance of ERs, and the scale of assessment has been extended to regional scales (e.g., watersheds [27], urban agglomerations [28], economic zones [29]). With the deepening of research on land use and ER, the assessment of ER from the perspective of land use has gradually become mainstream research [30]. Dynamic changes in land use distribution patterns directly trigger changes in the regional ecological environment, and ER assessment with land use change as the starting point can better characterize the impact of land use change on ecological processes and functions [31].
As research continues, multi-system coupling studies have been carried out by intercalating water, energy, and other elements, as well as investigating their nexus. Examples include water-energy-food [32], water-energy-economy [33], water-land-energy-food [34,35], and water-energy-food-carbon [36] systems. At this stage, scholars recognize that the processes of water utilization and energy extraction will inevitably pose a threat to the health of the ecosystem. Therefore, scholars have carried out relevant research on the coupling relationship between water resources, energy, and ecosystems. For example, Temel et al. [37] used a fuzzy multi-criteria decision-making method to assess the ecological impacts of runoff and hydropower plants by screening the relevant indicators of their ecological impacts. Mikulcic et al. [38] discussed the developments in energy, water, and the environment in 2018. Shahzad et al. [39] implemented an overview of the interconnectivity of energy, water, the environment, and future energy-efficient desalination possibilities to save energy and protect the environment. Summarily, at present, the relationship between water-energy-ecosystems has been widely studied in a systematic framework. However, existing studies have ignored the need to explore the relationship between water-energy resource utilization efficiency (WEUE) and ER. How to quantify the relationship between the above two aspects is an issue that requires prompt solutions, which is also of great significance for social, economic, and eco-environmental sustainability.
With the rapid advancement of economic development and increasing population, China’s Henan province is increasingly suffering from water shortages, energy woes, and ecological environmental pollution, which need to be urgently addressed. Through an extensive literature review, there are currently more studies in Henan Province that address individual systems or interrelations such as water, energy, and ecology. For instance, Zuo et al. [40] developed a type-2 fuzzy interval planning method based on scenarios to effectively plan agricultural water, energy, food, and crop areas in Henan Province. Zhang et al. [41] proposed a comprehensive diagnostic framework to quantify the spatial equilibrium state of water resources in Henan Province in terms of the water-economy-ecology relationship. Luo et al. [42] proposed a new framework to assess the coordinated development status of socio-economy, water, and ecology in Henan Province. Although the nexus between water, energy, and ecology in Henan Province has been studied to some extent, less research has specifically explored the relationship between the use of water and energy resources and ecological health. Moreover, to the best of our knowledge, there are no studies analyzing the relationship between WEUE and ER in this region.
Therefore, this paper aims to develop an Assessment-Decoupling two-stage framework to study the relationships between water-energy resource utilization and ecological security, with the former characterized by WEUE and the latter by ER. In this framework, firstly, the WEUE is assessed from a systemic perspective by constructing an improved indicator system, and its driving factors are identified. Secondly, the ER is quantified on a raster scale based on the land use type. Lastly, the fitness relationship between the WEUE and ER is explored. Then, the above framework is applied to Henan Province, China, where water supply and demand are in conflict and energy consumption is extremely high. Compared to existing studies, our potential contributions are: (1) developing an Assessment-Decoupling two-stage framework for clarifying the relationship between resource utilization and ecological conditions; (2) establishing an integrated evaluation index system to quantify the WEUE, in which the aspects of water and energy are both considered from the overall perspective; (3) identifying the relationship between WEUE and ER and exploring the dynamic correlation features between the two; (4) applying the framework to Henan Province of China and conducting studies in view of multiple scales, dimensions, and aspects.

2. Methodology

The Assessment-Decoupling two-stage framework is shown in Figure 1. WEUE was measured by the Super-SBM model, and the influencing factors of WEUE were comprehensively considered from four aspects with the application of the Tobit regression model. ER is evaluated based on land-use data from a raster perspective. Then, the Tapio model was used to identify the fitness relationship between the above two aspects.

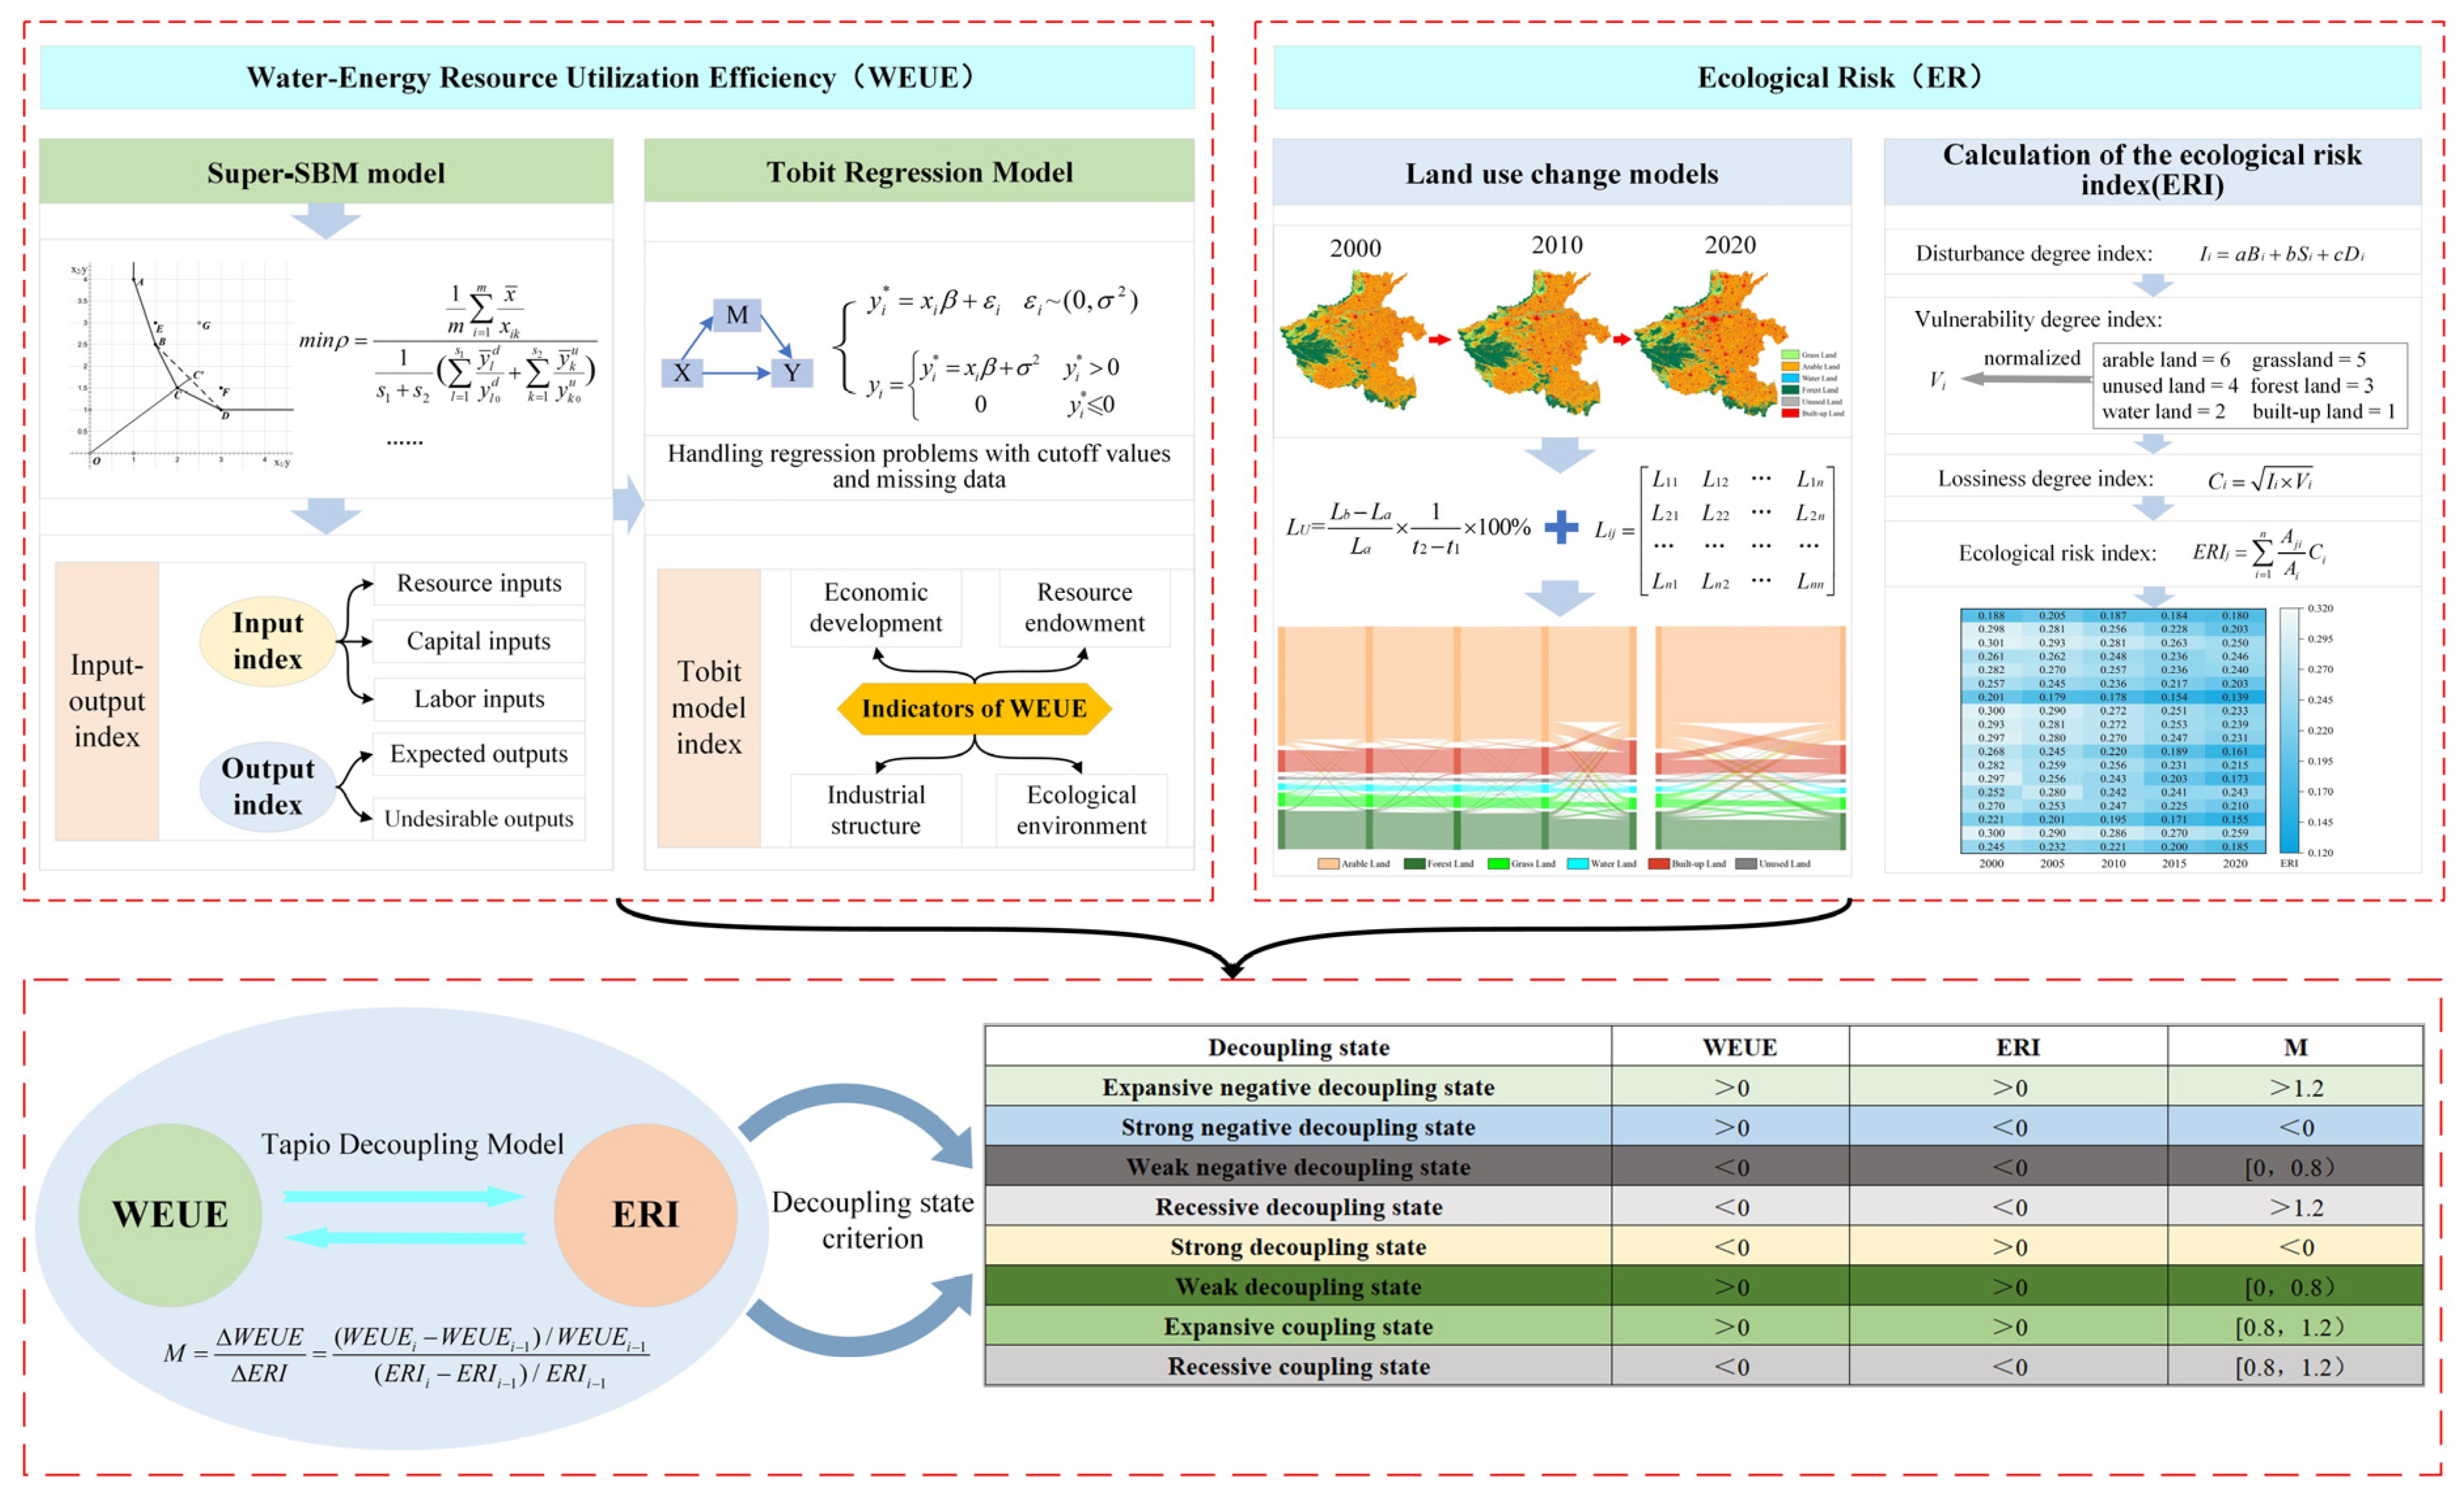
2.1. WEUE Measurement Method

2.1.1. Super-SBM Model

The Super-SBM model solves the slack variable problem as well as compensates for the shortcomings of previous models in which effective decision-making units could not be further compared, making the measured efficiency values more realistic and comparable [43]. The Super-SBM model amalgamates the strengths of both the SBM model and the super-efficiency DEA model, which not only takes into full consideration the slack variables of the input and output indicators of each decision-making unit (DMU), but also avoids the problem that multiple DMUs are located in the same production frontier and cannot be further compared with each other in terms of their efficiency [44]. The Super-SBM model can be denoted as [45]:
m i n ρ = 1 m i = 1 m a ¯ a i k 1 s 1 + s 2 ( l = 1 s 1 b ¯ l d b l 0 d + k = 1 s 2 b ¯ k u b k 0 u )
s . t . { a ¯ j = 1 , j j 0 n a i j λ j b ¯ d j = 1 , j j 0 n b l j d λ i b ¯ u j = 1 , j j 0 n b k j d λ j b ¯ d b l j d b ¯ u b k j d λ i 0 ; i = 1 , 2 , , m ; j = 1 , 2 , , n ; l = 1 , 2 , , s 1 ; k = 1 , 2 , , s 2
where the number of decision-making units is denoted by n; m denotes inputs; s1 denotes desired outputs; s2 denotes non-desired outputs; a, bd, and bu denote elements in the input matrix, elements in the desired output matrix, and elements in the non-desired output matrix, respectively; and ρ is the WEUE. When ρ ≥ 1, it means that the WEUE of the region is relatively effective; if ρ < 1, it means the WEUE of the region needs further improvement.
The scientific rationality of the selection of input-output indicators directly affects the rationality of the final results of the Super-SBM model [46]. The basic idea of WEUE is to simultaneously satisfy the minimization of resource consumption and the maximization of production value. Based on this idea, the two indicators of total water consumption and energy consumption are selected as resource inputs, the investment in fixed assets is selected as the indicator reflecting capital inputs, the end-of-year area practitioners are taken as the indicator reflecting labor inputs, and output indicators of production efficiency are expressed in terms of gross regional product. To assess regional WEUE more scientifically and comprehensively, it is necessary to consider environmental pollution in the input-output indicators. Currently, most of the Super-SBM models consider environmental pollution in the form of non-desired outputs. This study incorporates environmental pollution into the new input perspective; that is, sewage discharge and CO2 emissions are included in the model calculations as the indicators reflecting the environmental carrying inputs. The final input-output indicators system is shown in Table 1.

2.1.2. Tobit Regression Model

In fact, the WEUE is affected by a variety of factors in addition to the selected input and output indicators [47,48]. The WEUE are all greater than 0, at which point the efficiency values are left-constrained truncated variables. The direct use of the least squares method for regression analysis will make the parameter estimation biased. The Tobit model can better the solve regression analysis of restricted dependent variables and is therefore considered to examine the influence factor of WEUE [49]. The regression model can be constructed by taking WEUE measured by the Super-SBM model as an explanatory variable and the influencing factors as explanatory variables. The model is formulated as follows [50]:
y i * = x i β + ε i   ε i ~ ( 0 , σ 2 )
y i = { y i * = x i β + ε i y i * > 0 0 y i * 0
where yi is the dependent variable, taking the value of yi* when yi* > 0 and 0 when yi* ≤ 0; xi represents the independent variable; β denotes the coefficient; and the error term εi is assumed to be independent and obeys normal distribution.
In this study, the influencing factors affecting WEUE are synthesized from four aspects: economic development, resource endowment, industrial structure, and ecological environment. Regarding economic development, because of the different development levels among regions, the policies on water conservation and energy utilization will be different, which affects the WEUE of each region. This study used the gross domestic product and energy consumption per GDP to measure the socio-economic level of a region [51]. In terms of the resource endowment aspect, differences in WEUE are primarily due to differences in resource conditions, and different water resources and energy holdings also affect the concepts and ways of resource utilization, which would inevitably affect WEUE. This study used per capita water resources and per capita energy production to measure the natural endowment of resources in various areas [52]. In terms of the industrial structure aspect, agriculture is a significant user of water, and irrigation techniques and facilities in agriculture affect water use efficiency. The water use and energy consumption of industry also have a great impact on regional WEUE. Thus, the proportion of agricultural water consumption and the proportion of secondary industry were selected to represent the industrial structure [53]. In terms of the ecological environment aspect, human activities can have negative impacts on the ecological environment, such as chemical oxygen demand emissions, which pollute the ecological environment, and these negative impacts also indirectly affect the WEUE. This study used the sewage treatment rate and chemical oxygen demand emission to represent the ecological environment factors [54]. The indicators of WEUE influencing factors are shown in Table 2.

2.2. ER Measurement Method

2.2.1. Land-Use Change Model

(1) A single dynamic index is used to describe the rate and magnitude of change of a single land-use type over a period, which can characterize land-use change. The formula for a single motivation is [55]:
L U = L b L a L a × 1 t 2 t 1 × 100 %
where LU represents the dynamic index corresponding to the land-use type during the specified study period; La denotes the initial area of a specific land type at the commencement of the study period, while Lb represents the corresponding area after said period; t2t1 signifies the number of study periods in years.
(2) The land-use transfer matrix not only captures the static area data for each land category in a specific area and time but also provides a more comprehensive depiction of the transfers out of each land category at the beginning of the period and the transfers into each land category at the end of the period. It enables a more detailed understanding of land-use dynamics and transitions [56,57].
L i j = [ L 11 L 12 L 1 n L 21 L 22 L 2 n L n 1 L n 2 L n n ]
where Lij denotes an n × n matrix, each row and column of the matrix represents a land-use type, and n is the total land-use types in the study.

2.2.2. Calculation of the ER

In this study, ER characterization at the raster scale was described by the ecological risk index (ERI). It is used to characterize the relative magnitude of integrated ER within a sample site, evaluate the risk of loss of ecological service functions, and compare the differences in ER in each region with the formulas listed below [58]:
E R I j = i = 1 n A j i A i C i
where ERIj is the value of the ERI in the jth evaluation cell; Aji is the area of land-use type i in the jth evaluation cell; Ci is the lossiness index, which represents the ER parameter of the land-use type i.
The lossiness index, which is a composite of the disturbance and vulnerability indices for a given land use type, is calculated as [59]:
C i = I i × V i
where Ii is the disturbance degree index of land-use type i; and Vi is the vulnerability degree index of land-use type i.
Among them, the disturbance degree index Ii is a combination of fragmentation, separation, and dominance, and the calculation formula is [60]:
I i = e B i + f S i + g D i
where Bi is the fragmentation index; Si is the separation index; Di is the dominance index; e, f, and g are the weights of the fragmentation, separation, and dominance indices, respectively; combined with the existing research [61,62], the Bi, Si, and Di are assigned weights of 0.5, 0.3, and 0.2, respectively; the formulas for the three indices are detailed in reference [63].
According to the actual condition, arable land is identified as the most susceptible to vulnerability, with grassland, unused land, and forest land following in terms of susceptibility. In contrast, water land and built-up land demonstrate a higher level of stability. The six land-use types were assigned values of 6 for arable land, 5 for grass land, 4 for unused land, 3 for forest land, 2 for more stable water land, and 1 for built-up land. Normalization needs to be carried out to obtain their respective vulnerability indices Vi.

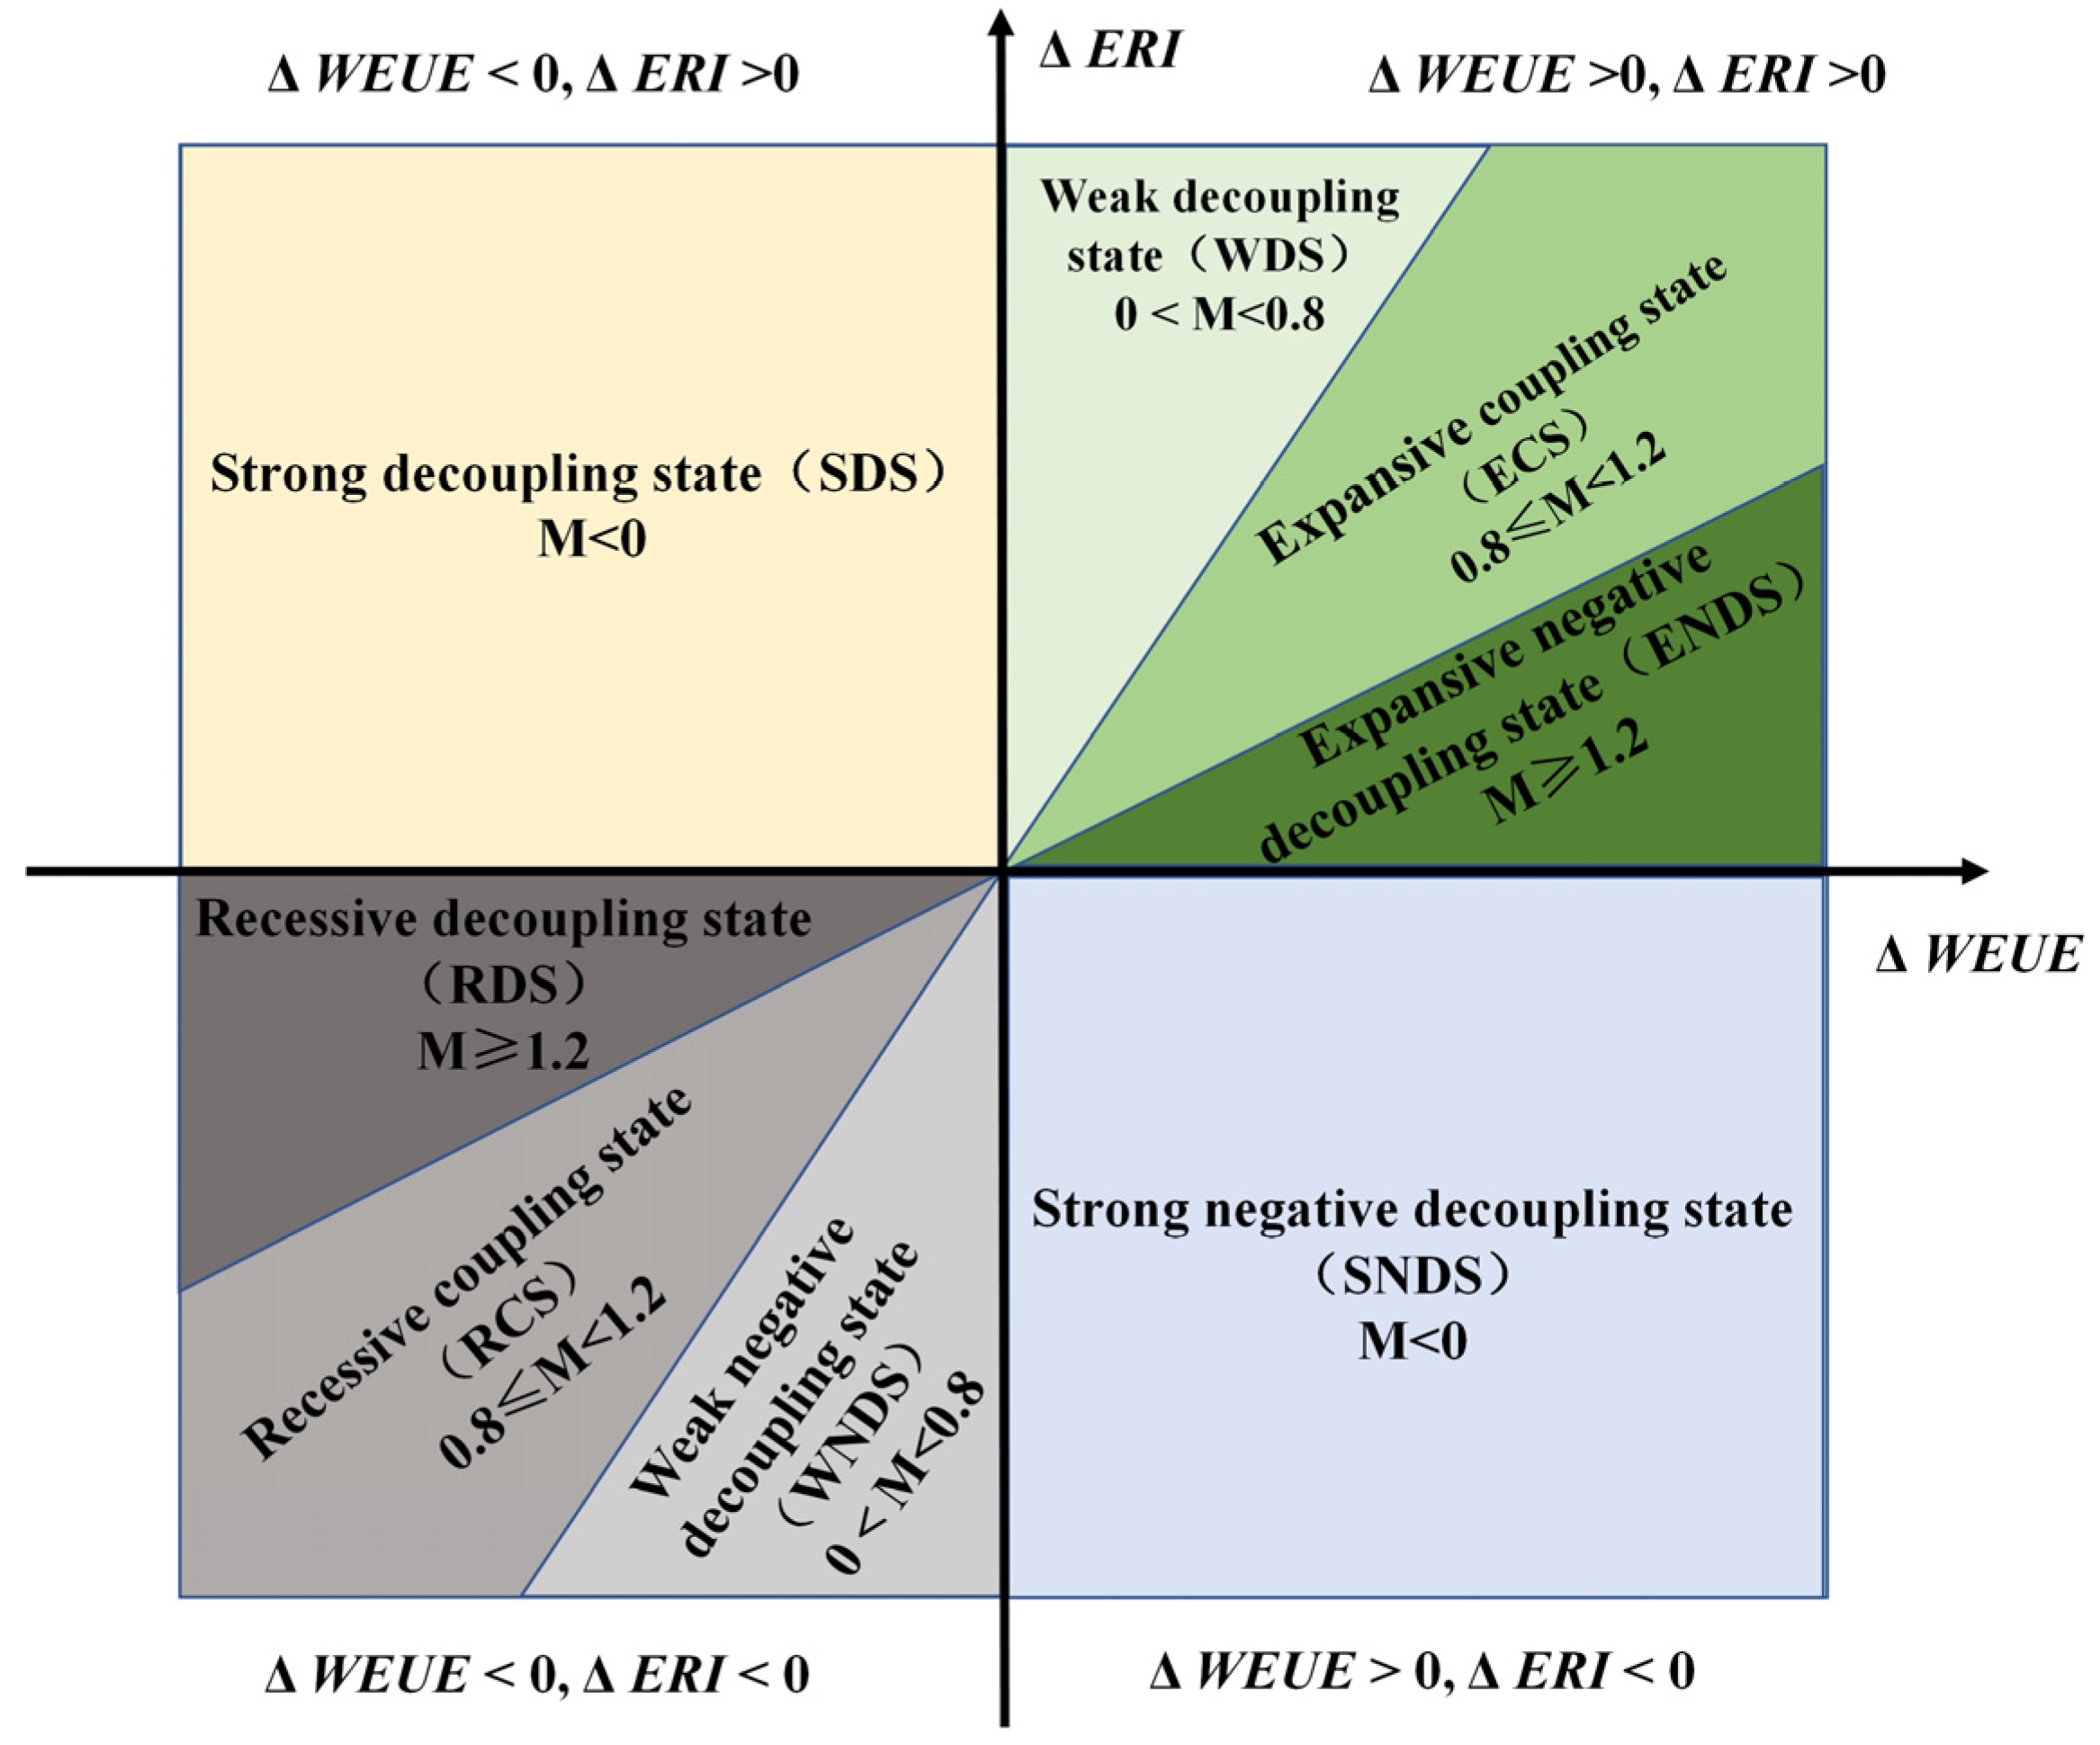
2.3. Tapio Decoupling Model

Tapio theory can be used to explore the fitness degree of different objects at various scales, identify fitness relationships, and refine the decoupling states [64,65]. Based on the Tapio theory, we construct the elastic decoupling models of WEUE and ERI to investigate the decoupling degree between them. The model is expressed as follows [66]:
M = Δ W E U E Δ E R I = ( W E U E i W E U E i 1 ) / W E U E i 1 ( E R I i E R I i 1 ) / E R I i 1
where M is the decoupling index of WEUE and ERI, respectively, which is used to quantify the degree of decoupling between WEUE and ERI; ΔWEUE and ΔERI are the change rates of WEUE and ERI in a certain period; WEUEi−1 and ERIi−1 are WEUE and ERI at the beginning of the period; WEUEi and ERIi are WEUE and ERI at the end of the period. Referring to the existing research, the definition criteria of the decoupling states were determined (Figure 2), in which the strong negative decoupling state (SNDS) is the best one.

3. Case Study

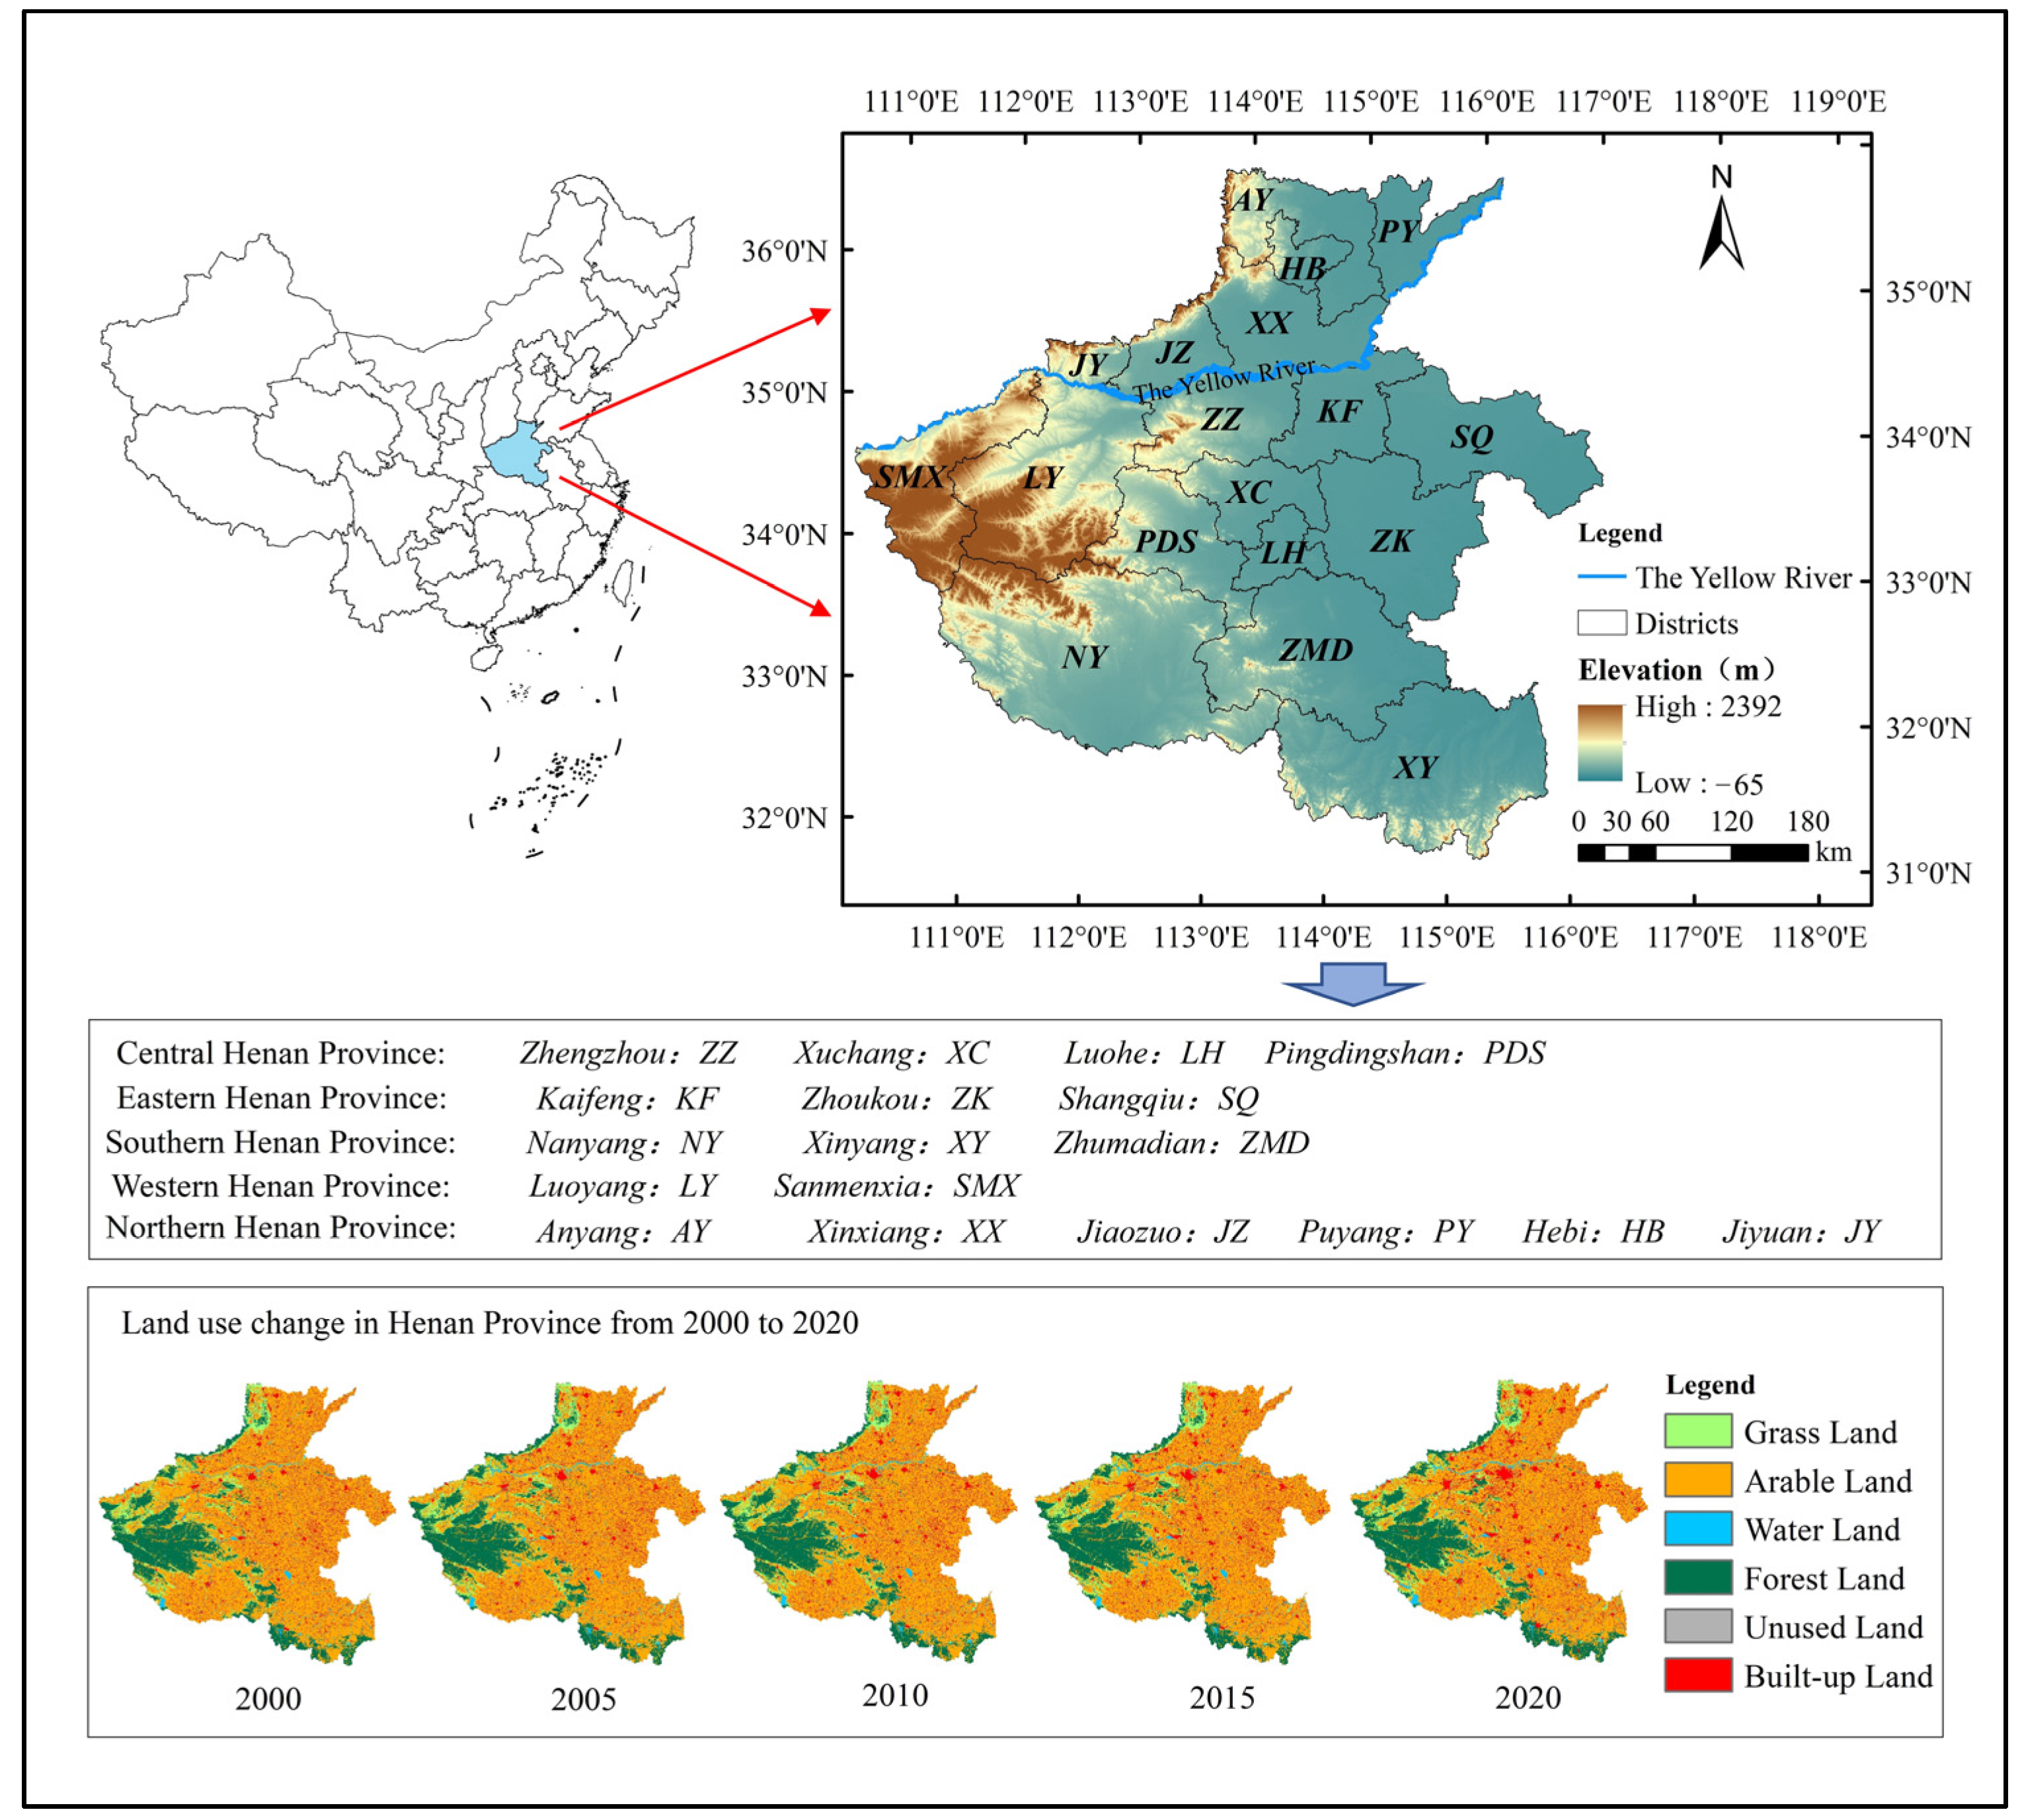
3.1. Overview of the Study Area

Henan Province is located at latitudes 31°23′~36°22′ N and 110°21′~116°39′ E, with a total area of 16.7 × 10⁴ km2. The average annual precipitation in this area is approximately 771 mm, with a decreasing trend from southeast to northwest and an extremely unbalanced intra-annual distribution of precipitation [67]. The spatial distribution of water resources is not compatible with the population, arable land, mineral resources, distribution of cities and towns, and industrial layout, resulting in conflicts between water supply and demand. Henan Province is rich in coal resources but has long been overly dependent on coal energy, leading to more serious environmental pollution [68]. Meanwhile, the large amount of exhaust gas and wastewater generated during coal-fired power generation and industrial production has caused some pollution pressure on air and water quality. The location and administrative division of the study area are illustrated in Figure 3.

3.2. Data Source

Taking 2000–2020 as the study period, total water consumption was obtained from the Water Resources Bulletin of Henan Province (https://slt.henan.gov.cn/bmzl/szygl/szygb/ (accessed on 24 July 2023)). Land-use data with a spatial resolution of 1 km was acquired from the Resource and Environment Science and Data Center (https://www.resdc.cn/ (accessed on 25 July 2023)). Data on energy consumption and per capita energy production came from the China Energy Statistics Yearbook (http://www.stats.gov.cn/sj/ndsj/ (accessed on 25 July 2023)). Data on per capita water resources, the proportion of secondary industry, the proportion of agricultural water consumption, sewage treatment rate, chemical oxygen demand emission, gross domestic product, and investment in fixed assets were from the Henan Province Statistical Yearbook (https://tjj.henan.gov.cn/tjfw/tjcbw/tjnj/ (accessed on 26 July 2023)). Data on indicators such as the end-of-year area practitioners, regional gross domestic product, sewage discharge, and CO2 emissions for cities in Henan Province were obtained from the statistical yearbooks of each prefecture-level administrative region.

4. Results and Discussion

4.1. Analysis of Measured WEUE

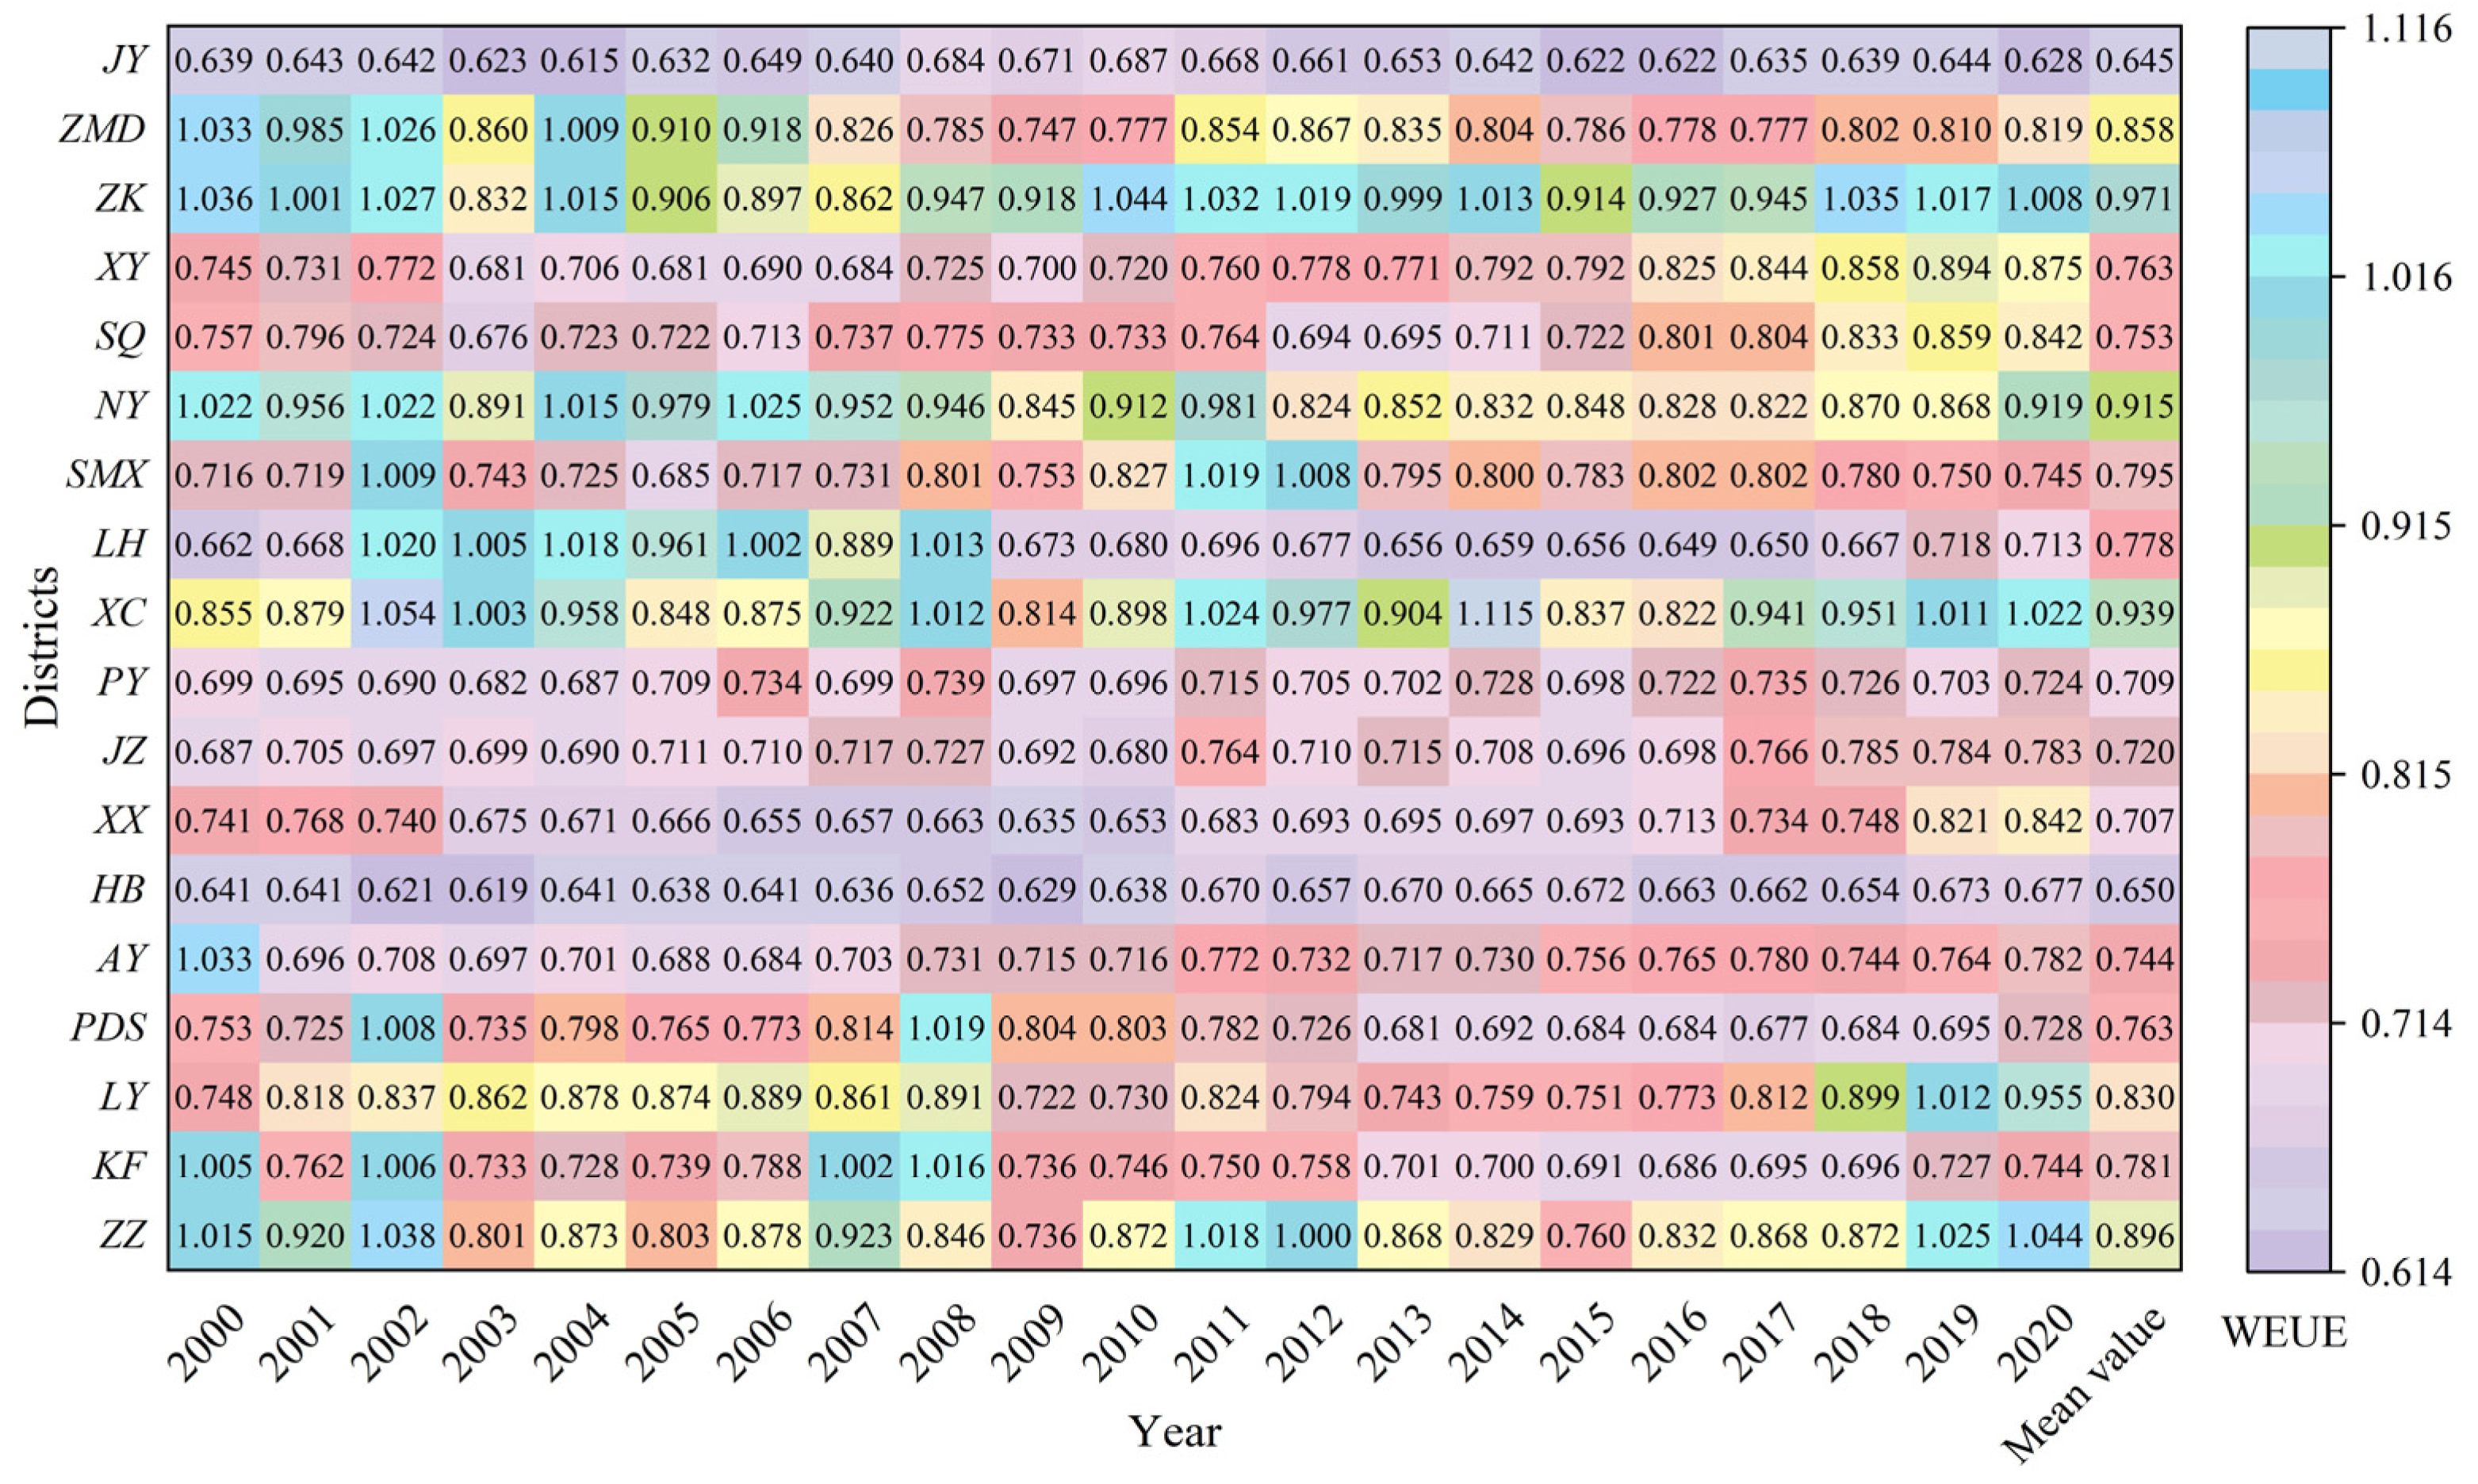
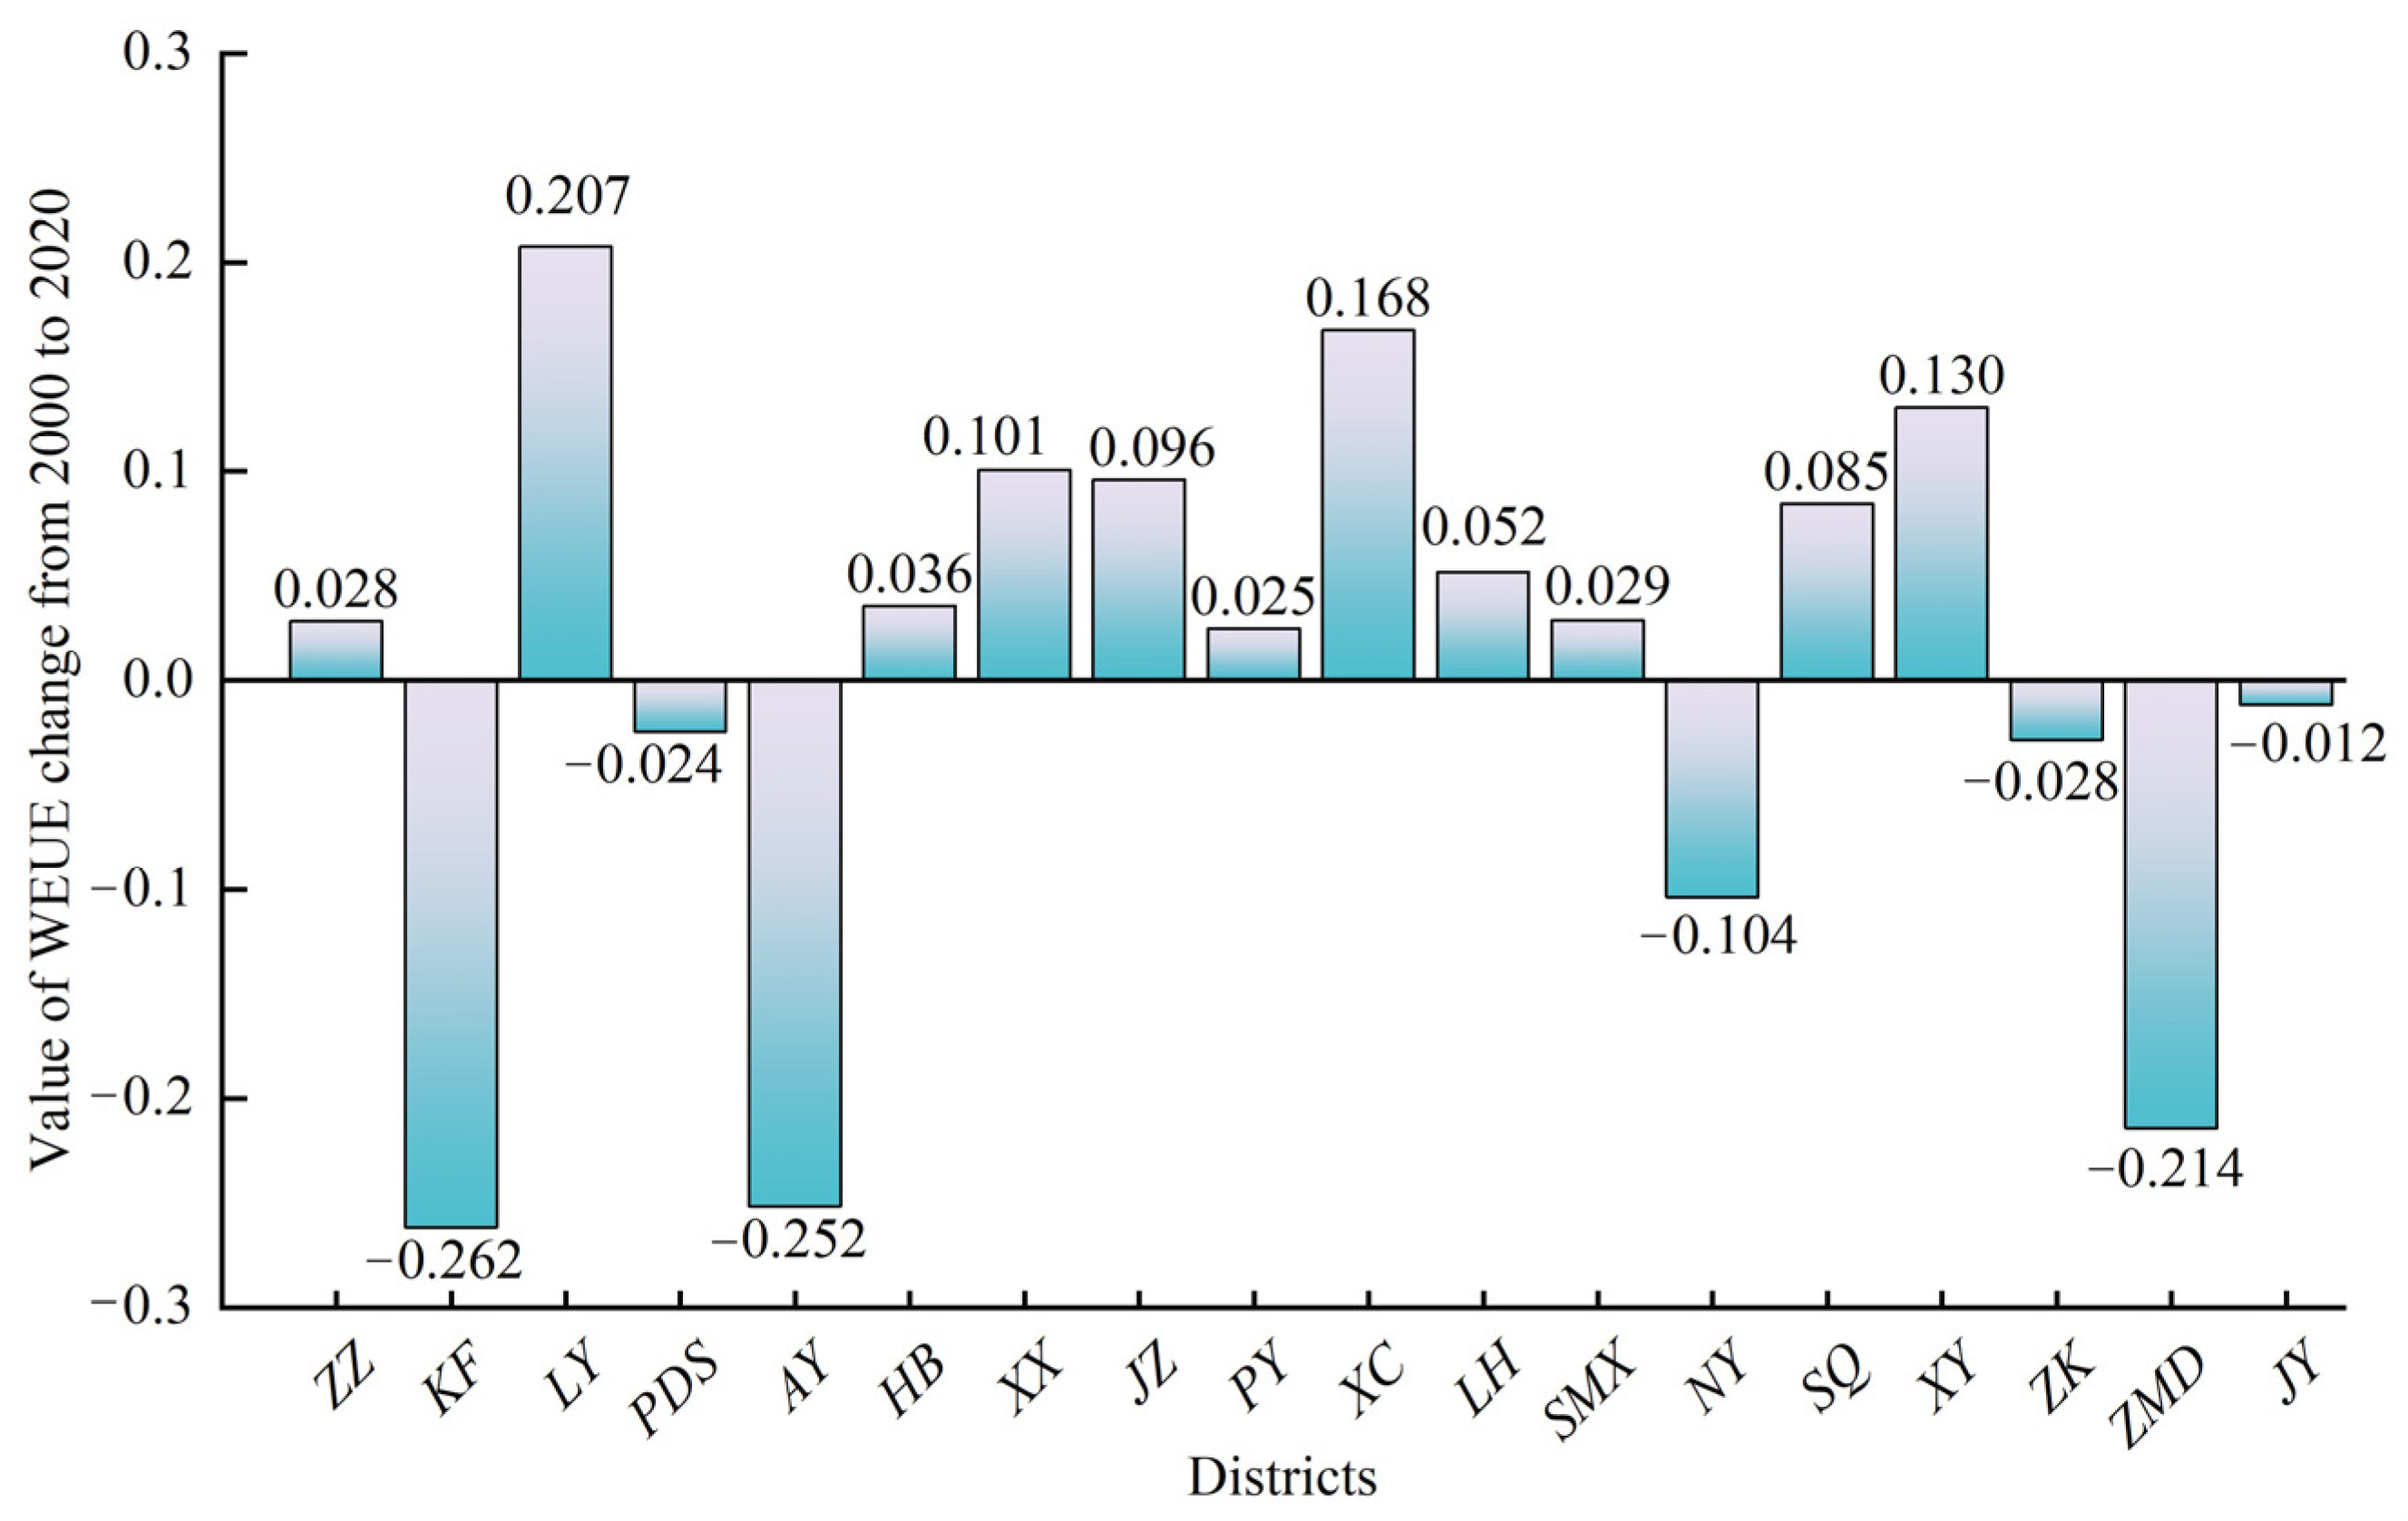
4.1.1. Temporal Change of WEUE

The obtained WEUEs of 18 districts in Henan Province from 2000 to 2020 are shown in Figure 4. From the perspective of time, the WEUE of all districts in Henan Province showed fluctuating changes from 2000 to 2020, experiencing the process of “decreasing-rising-decreasing-rising”, and the overall development basically presented a “W”-shaped trend. The maximum value of WEUE (1.115) occurred in Xuchang in 2014, and the minimum value (0.615) occurred in Jiyuan in 2004. The top three districts in terms of WEUE are Zhoukou, Xuchang, and Nanyang, whose 20-year average WEUE are 0.971, 0.939, and 0.915, respectively. The last three districts are Xinxiang, Hebi, and Jiyuan, whose 20-year average values are 0.707, 0.650, and 0.645, respectively. From the changes in WEUE during the study period, it could be seen (Figure 5) that there was a significant difference among districts in the study area. The WEUE of Kaifeng, Anyang, and Zhumadian decreased most significantly, by 0.262, 0.252, and 0.214, respectively. Pingdingshan, Nanyang, Zhoukou, and Jiyuan were all lowered to varying degrees, and the WEUE of the remaining districts were raised to varying degrees, with Luoyang raising the highest (0.207), followed by Xuchang (0.168).

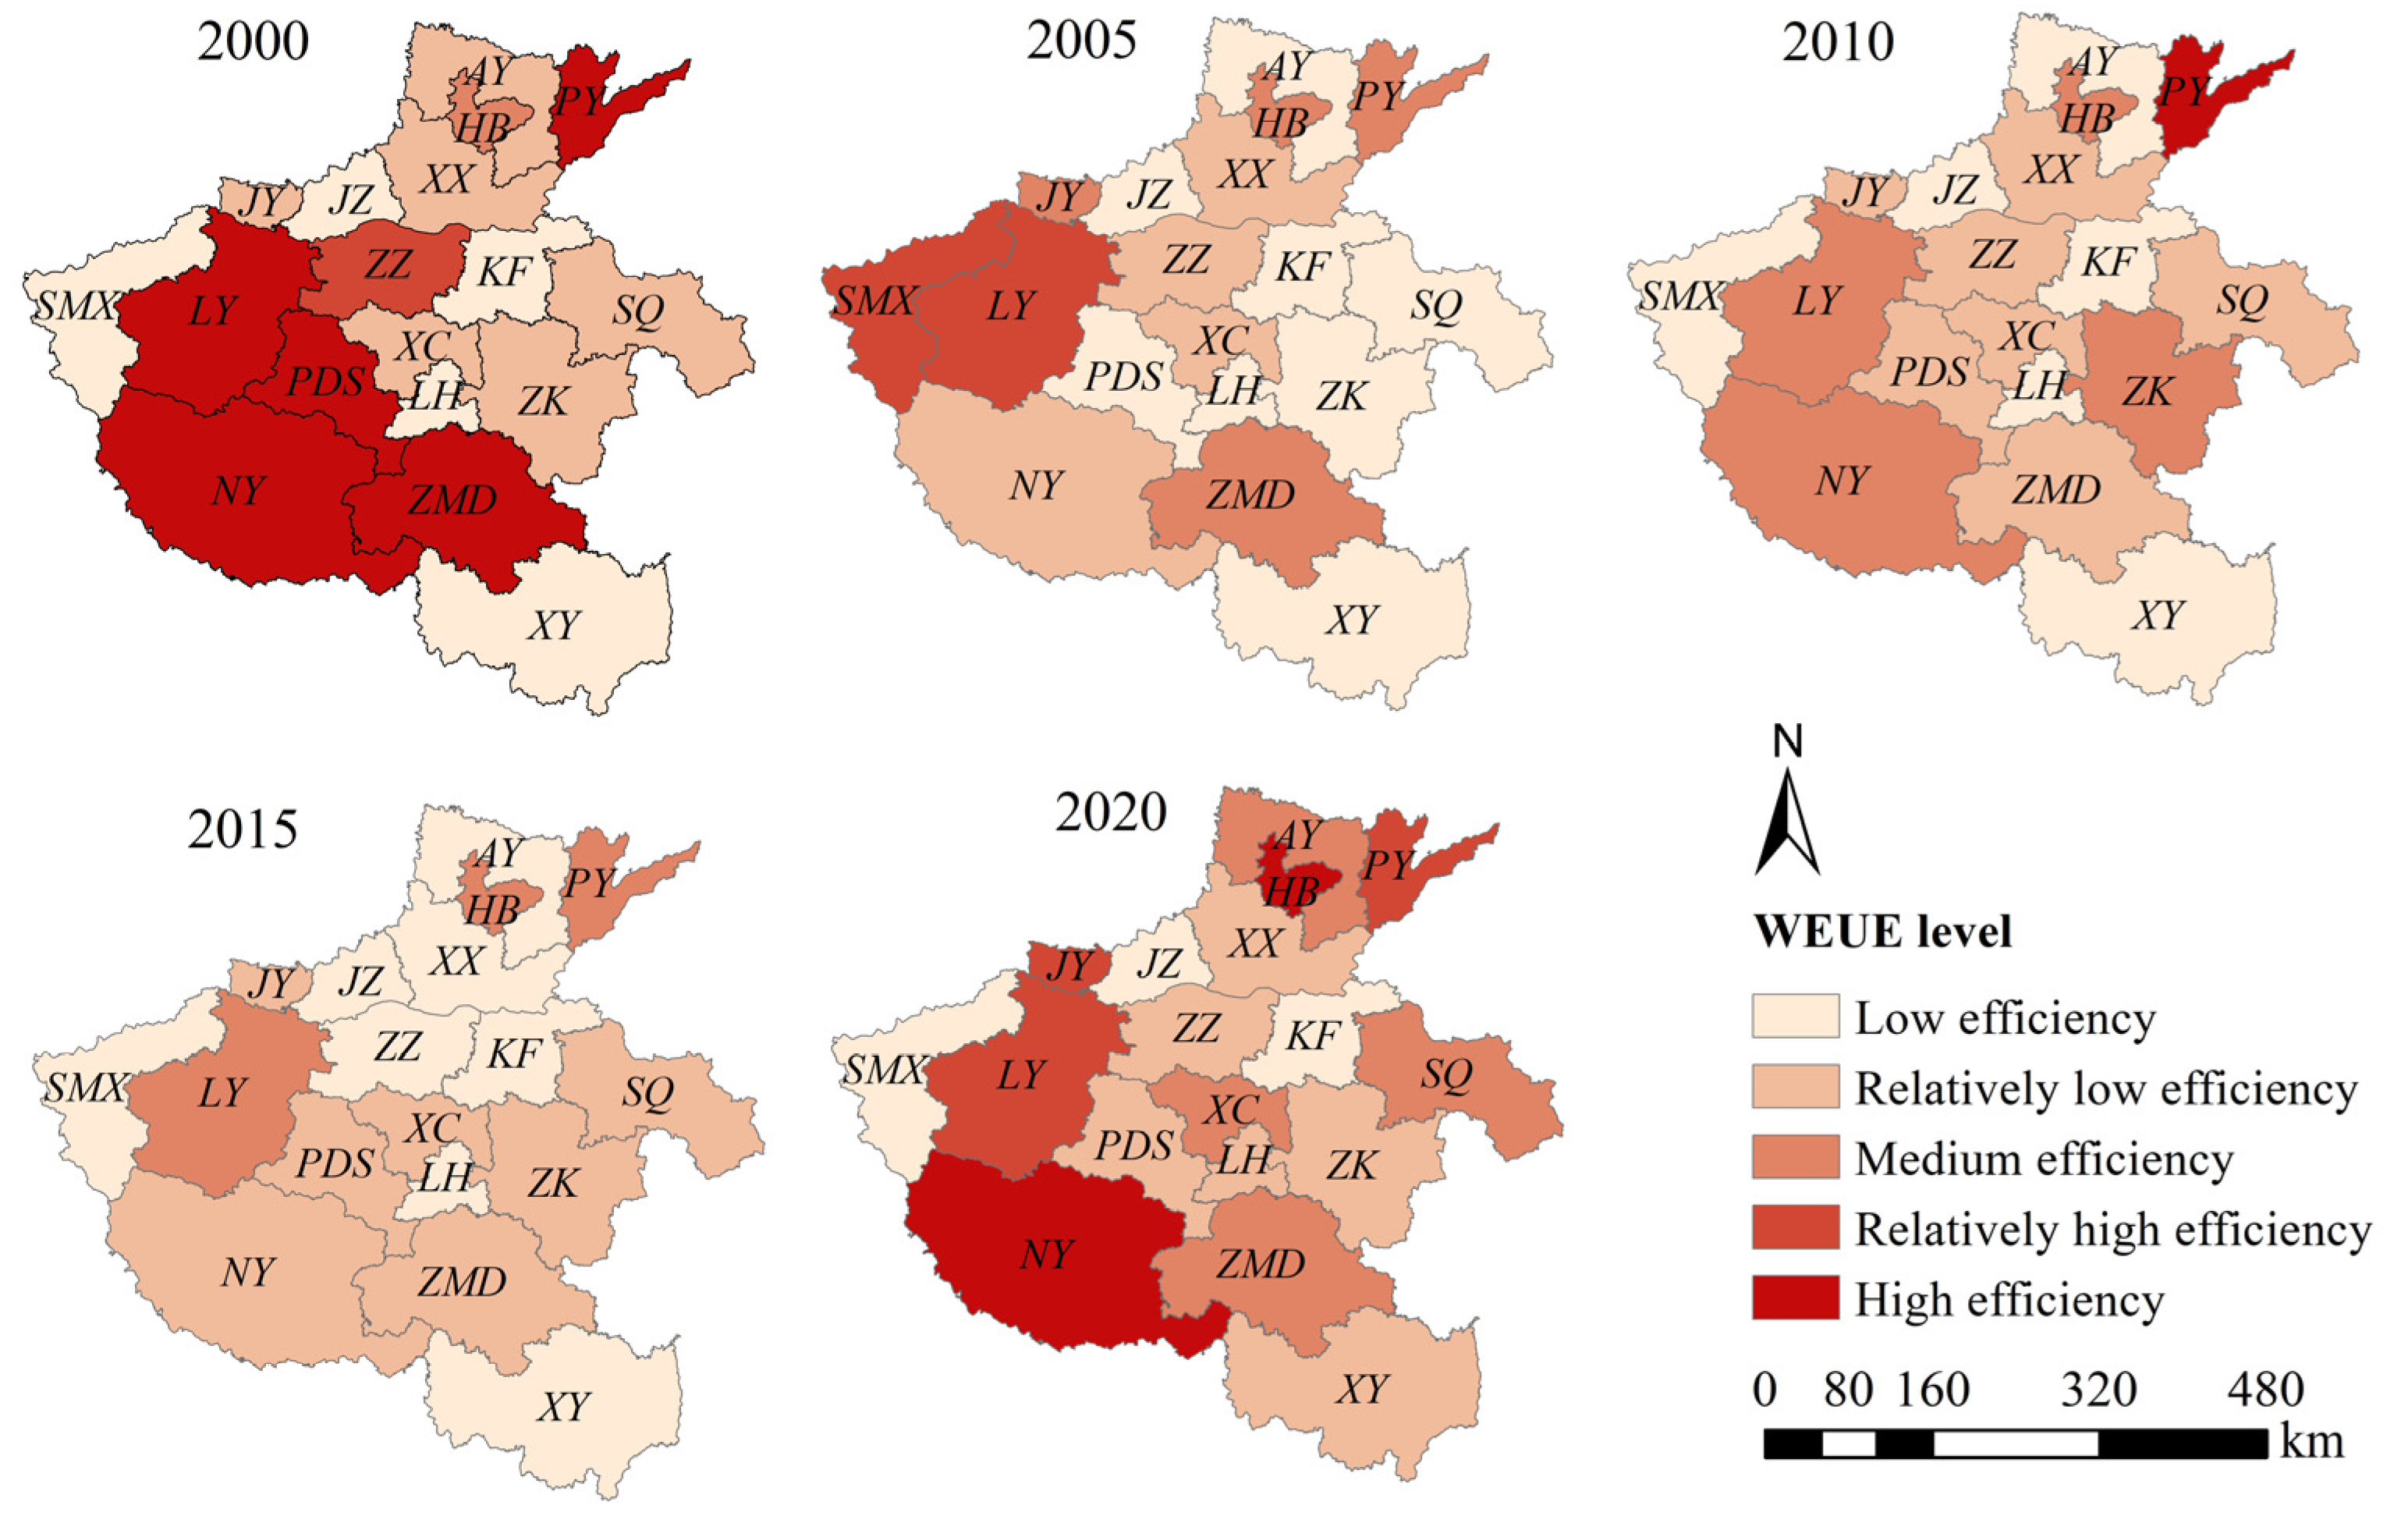
4.1.2. Spatial Variation of WEUE

In this study, the natural discontinuity grading method was used to classify the WEUE of districts in Henan Province into five levels from low to high: low efficiency, relatively low efficiency, medium efficiency, relatively high efficiency, and high efficiency. The levels of WEUE were spatially visualized with a time step of 5 years and a time cross-section of the years 2000, 2005, 2010, 2015, and 2020, as shown in Figure 6.
The spatial development of the WEUE level in each region of Henan Province was uneven, and the difference was prominent, with obvious spatial distribution characteristics. In 2000, there were five districts with WEUEs of high efficiency, mainly distributed in the southwest of Henan. By 2005, the WEUE levels in Henan Province were reduced to different degrees, with Pingdingshan experiencing the most significant reduction, from high efficiency to low efficiency. Low efficiency was predominant during this period and was distributed in the central as well as the eastern parts of Henan. Until 2010, the overall WEUE level of Henan Province increased, and the period was mainly relatively low efficiency, which was distributed in central Henan, and only Puyang was high efficiency. Compared with 2010, the WEUE level in 2015 began to decrease, and it was mainly low efficiency and relatively low efficiency. Up to 2020, the WEUE level in Henan Province had improved dramatically. However, Jiyuan and Kaifeng were still low-efficiency, with Nanyang realizing a substantial breakthrough from relatively low efficiency to high efficiency, spanning a total of three ratings. After calculating the multi-year average values of WEUE in the five subdivisions and major districts of Henan, the values were 0.844, 0.835, 0.826, 0.813, and 0.696 for central, eastern, southern, western, and northern Henan, respectively, with the highest in central Henan and the lowest in western Henan.
In 2000, the WEUE of Henan Province was generally higher than the rest of the time cross-section. However, during the period of 2000–2005, the WEUE decreased significantly. It was because the economy of Henan Province developed rapidly from 2000 to 2005, and the process of urbanization was accelerated. In terms of energy consumption, the increase was slow before 2002, but coal consumption rose sharply after 2002, resulting in a failure to keep up with the corresponding energy-saving measures and technologies. Moreover, agriculture was one of the main areas of water resource utilization in Henan Province, and agricultural irrigation systems and technologies were relatively unsound, with problems of water wastage and inefficient water use. As a result, there was a significant decrease in WEUE during this period. During the period 2005–2010, Henan Province’s WEUE improved to a certain extent. It can be attributed to the implementation of a system combining total water consumption control and quota management, improvement of the water abstraction licensing system, refinement of the technical equipment and management of resource extraction, elimination of outdated extraction methods, and an increase in the rate of energy resource recovery. During the 2010–2015 period, the WEUE of Henan Province reached its lowest. Under the environment of the financial crisis, a series of high-consumption and high-pollution practices had a serious impact on the WEUE as a result of the over-pursuit of economic benefits and the neglect of environmental issues in the recovery of economic development. From 2015 to 2020, the WEUE of Henan Province as a whole had a significant increase, which was due to the implementation of the new development concept, the optimization and upgrading of innovative technology and industrial structures, and the water-saving technology. Meanwhile, the public’s awareness of water conservation has improved, and a revision of the law on the prevention and control of water pollution was released in 2017. They led to a shift toward the intensification of crude water consumption in Henan Province, and the province began to focus on the development of environmental protection and vigorously promote the construction of ecological civilization. Under the leadership of this environment, Henan Province began to change the mode of economic development, focusing on ecological benefits, which finally led to the improvement of WEUE.

4.1.3. Analysis of Influencing Factors in WEUE

Table 3 displays the calculated results from a Tobit regression analysis that was performed to analyze the factors influencing the WEUE in 18 districts of Henan Province.
(1) Economic development: GDP had a positive effect on the increase of WEUE. The regression coefficient was 1.511, with a significance level of 1%. As socio-economic development continues to evolve, people’s awareness of resource utilization and management increases, and technological advances and innovations could also contribute to a more efficient use of water resources. The regression coefficient of ECG was -0.0358 with a significance level of 1%. With economic development and technological progress, the utilization of water resources in the production process would increase, and the ECG would gradually decrease. The results showed a decrease in ECG and an increase in WEUE.
(2) Resource endowment: PWR and PCP had a positive effect on WEUE enhancement. The regression coefficients are 0.0004 and 0.0396, which are at a 1% significance level. Higher PWR and PCP indicated that each person could have more water and energy available for use, which could meet the needs of people’s production and living and reduce waste or overutilization due to the shortage of water and energy.
(3) Industrial structure: There was a contribution of PAC to WEUE enhancement with a regression coefficient of 1.3998 and a 1% significance level. Henan is one of China’s major agricultural provinces, and agriculture is an important area of water and energy use. With the development of modern agriculture, the gradual popularization of water-saving and energy-reducing facilities has led to a gradual increase in resource efficiency, thus promoting the enhancement of WEUE. PSI inhibited the WEUE enhancement with a regression coefficient of −3.3799, a 1% significance level, and included many high water and energy-consuming industries, such as manufacturing and construction, which also inhibited WEUE as a result.
(4) Ecological environment: STR had a positive effect on WEUE enhancement, and COD had an inhibitory effect. The regression coefficients were 0.0107 and −0.0003, respectively. In terms of inputs, the reduction of pollutant emissions was effective in reducing ecosystem damage and improving environmental quality in order to increase water resources, energy availability, and economic output. In terms of outputs, pollutants as non-desired outputs, cleaner production, emission standards, and a series of other policies for reducing pollutant emissions and improving pollution prevention play an important role in enhancing the improvement of WEUE.

4.2. Analysis of Changes in ERI

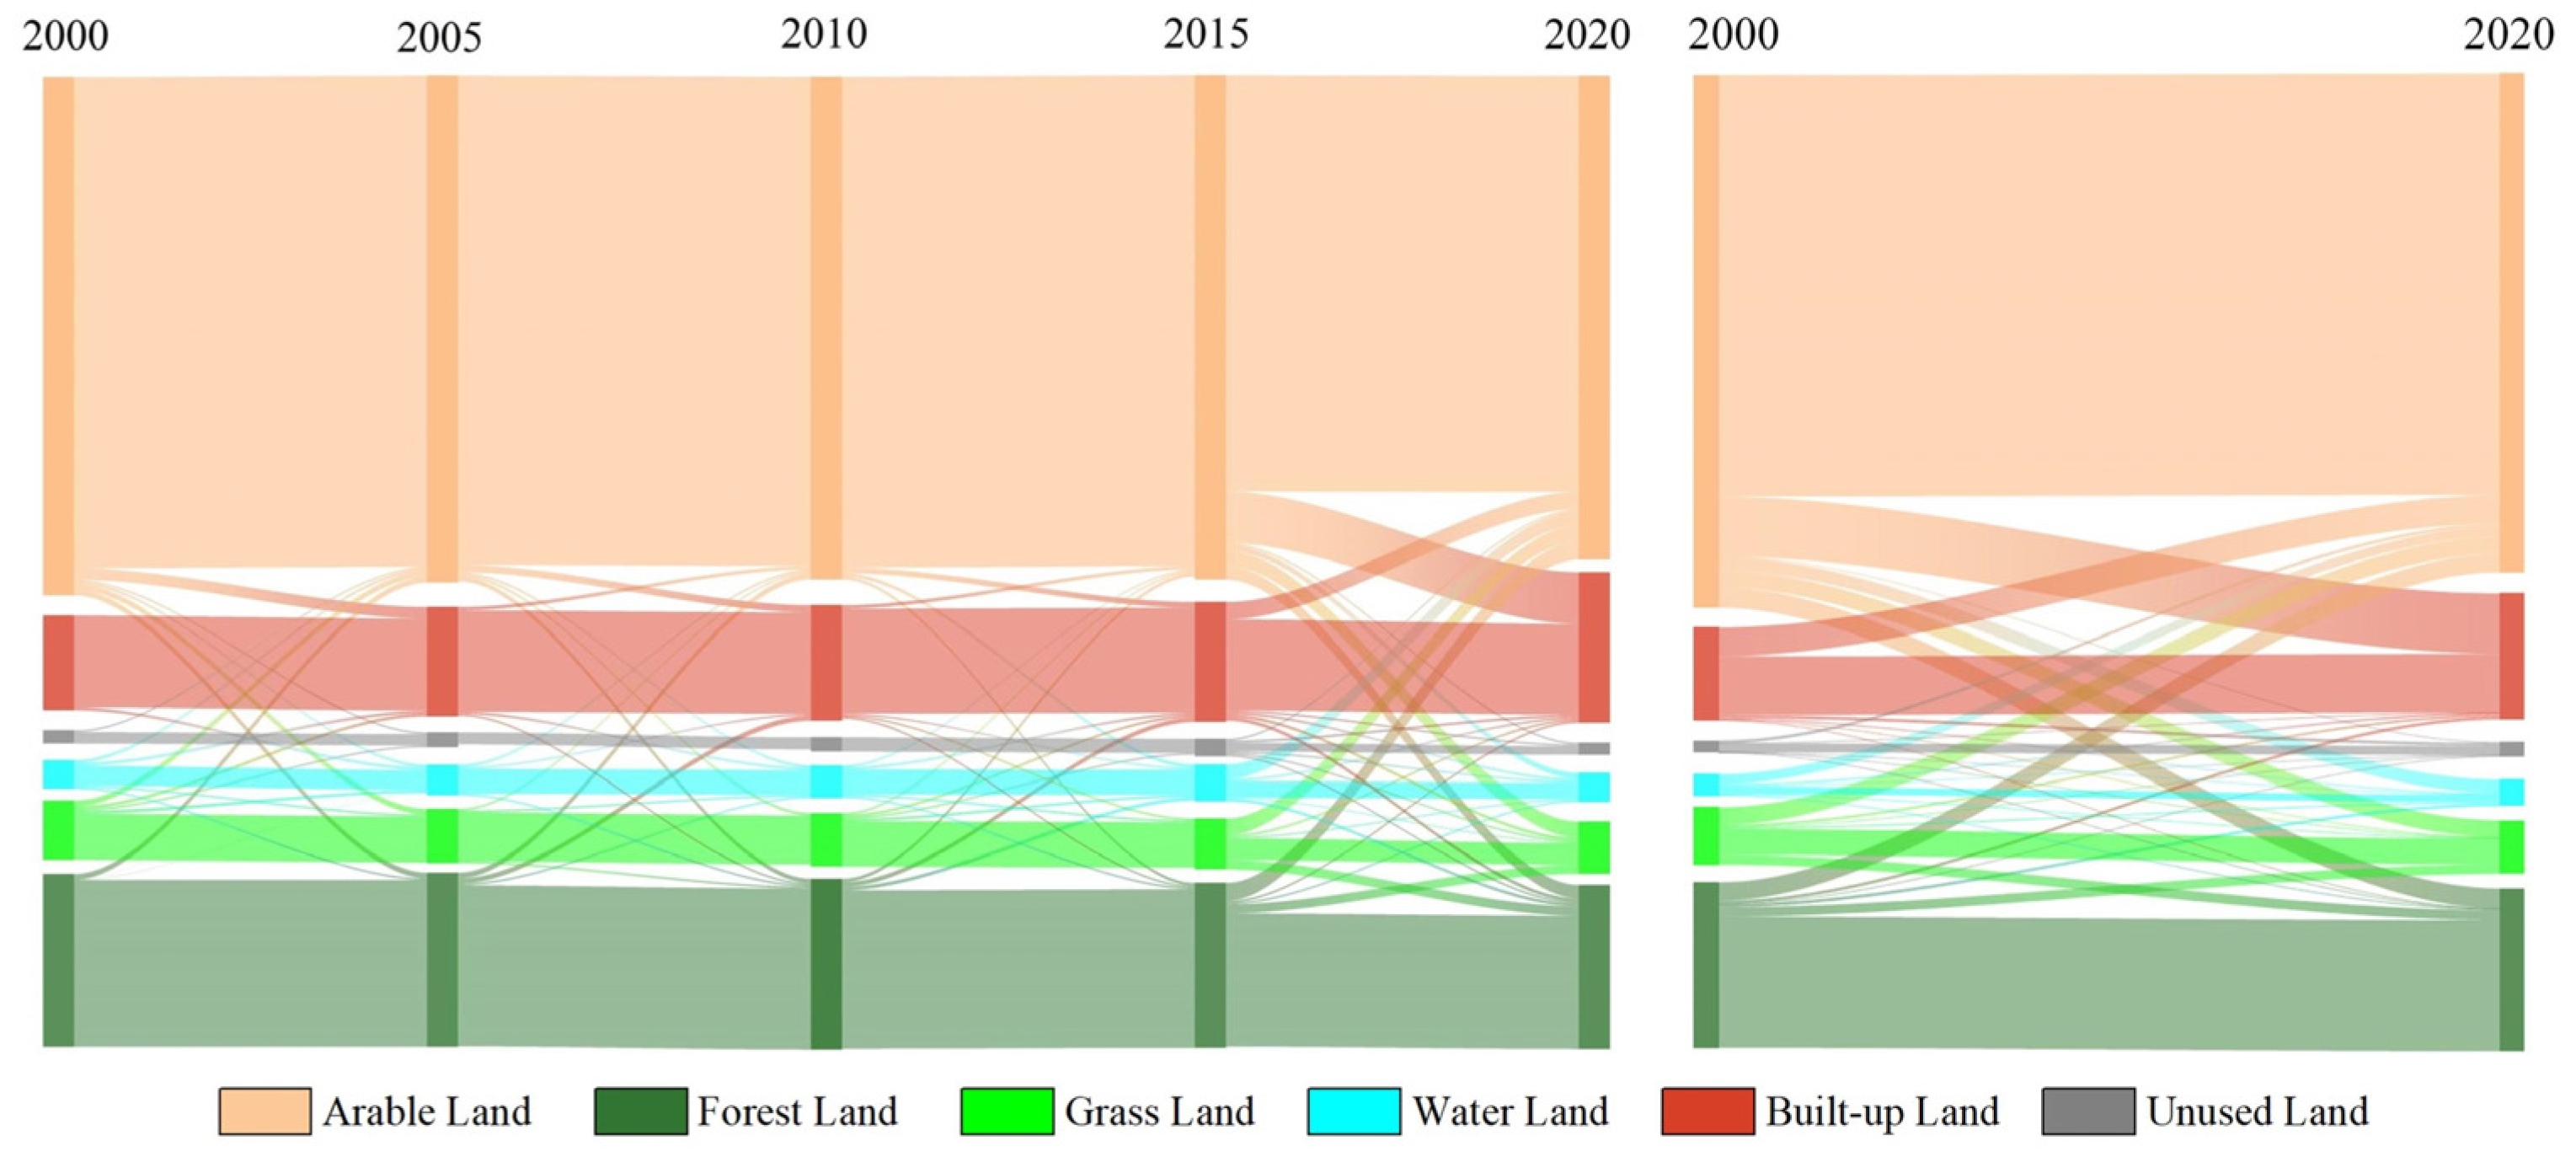
4.2.1. Analysis of Land-Use Change

By referring to Table 4, it became evident that during the period from 2000 to 2020, there were notable variations in the areas of different land-use types within Henan Province. The consistent structure throughout this period was characterized by arable land, with it being the largest, followed by forest land, built-up land, grass land, water land, and unused land. Arable land and forest land were the primary land-use categories in Henan Province, making up approximately 80% of the total land area. Conversely, the extent of unused land was found to be less than 0.1%. During the study period, the largest change in the area was arable land, which decreased by 4990 km2. With a time window width of 5 years, arable land decreased by 2942 km2 during 2015–2020, accounting for 59% of the total decrease in arable land. Followed by built-up land, which increased by 4821 km2 from 2000 to 2020, and built-up land increased by 3191 km2 during 2015–2020, accounting for 66% of the total increase in built-up area of land use. The maximum value of the dynamic index for the six land use types occurred in the period of 2015–2020 in the case of build-up land with 3.43%, followed by water land with 2.66% for the period of 2000–2005. Forest land had the smallest value of change in the dynamic index, with a minimum value of 0.01%, followed by water land with a minimum value of 2.66%, and grass land with 0.02%. Land use transfers by phase from 2000–2020 are shown in Figure 7. It could be noticed that during the period of the study, the main focus was on the transfer of arable land and built-up land. Between 2000 and 2015, the interconversion of different land uses was relatively negligible. However, the most substantial change in land use occurred from 2015 to 2020, particularly with a substantial conversion of arable land into built-up land. Simultaneously, there was a notable conversion of arable land to forest land, grass land, water land, and unused land. Additionally, there was a transfer of built-up land back to arable land, although the extent of this transfer was considerably smaller compared to the conversion from arable land to built-up land.

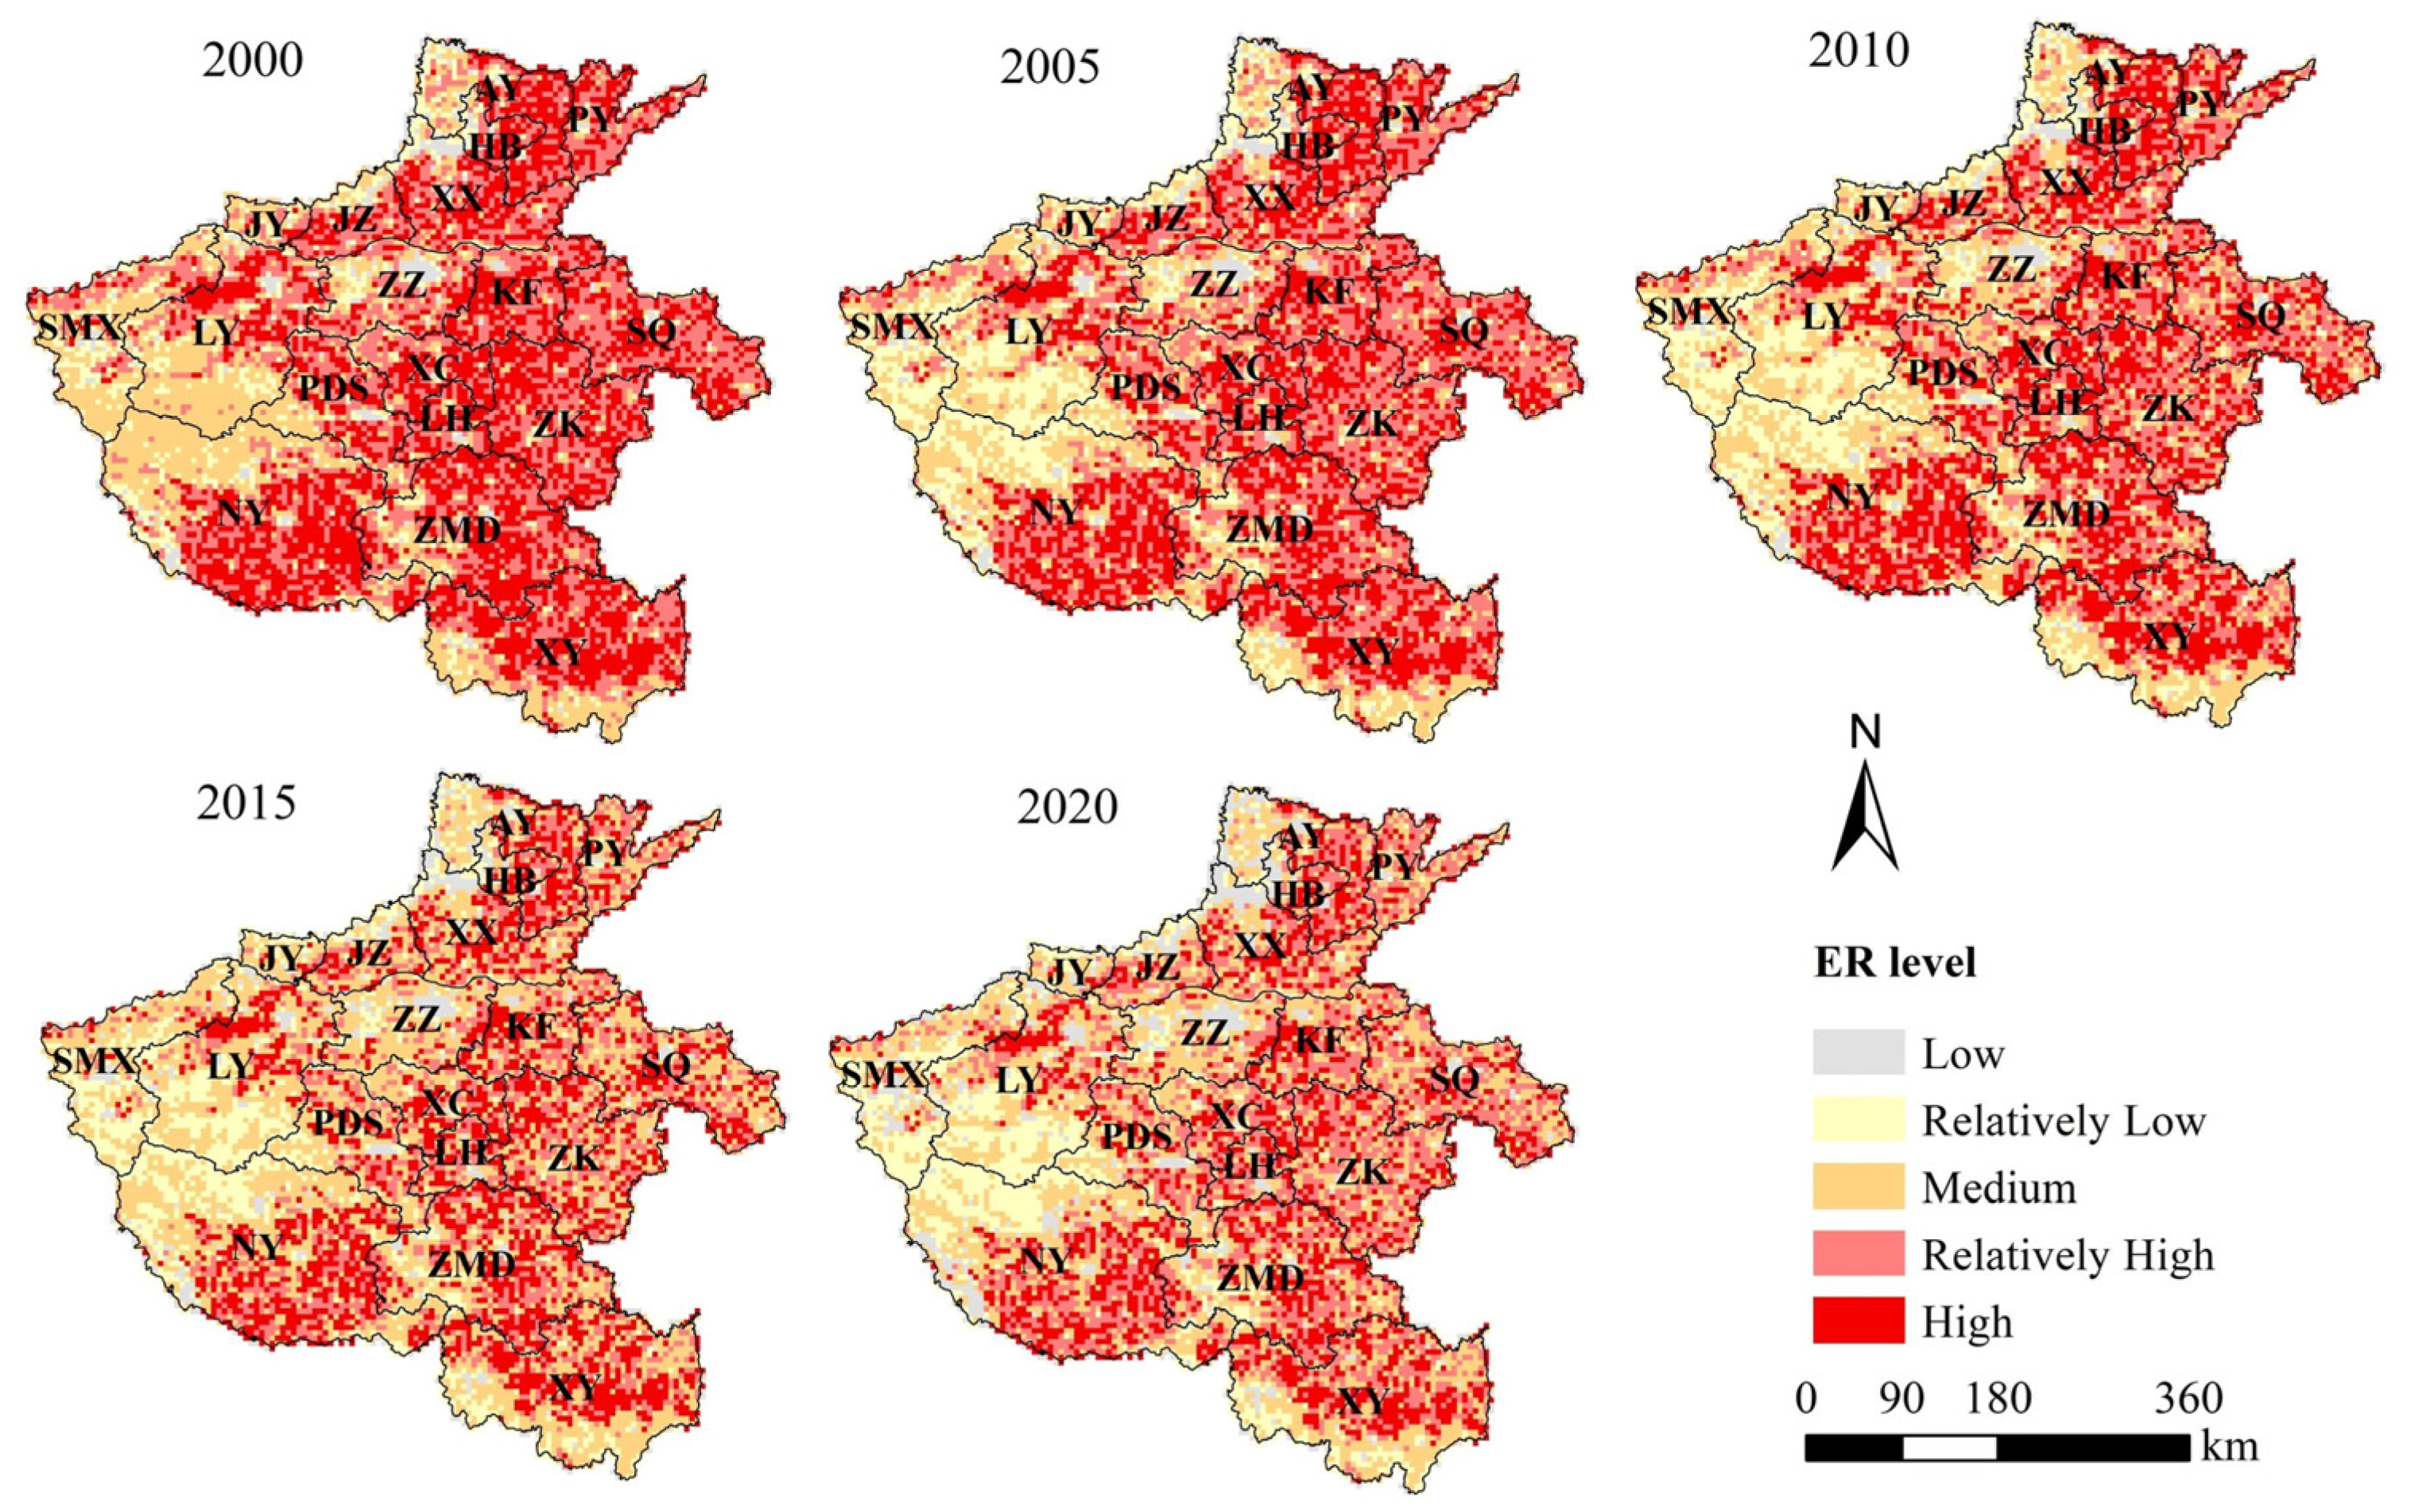
4.2.2. Characterization of Spatial Variation in the ERI

Utilizing the Ordinary Kriging approach, the spatial interpolation of the ERI was conducted for the 8417 evaluation grid cells within the designated study area. Through ArcGIS data processing, it was found that the range of the ERI for the five periods was all within 0–0.326. In order to facilitate the comparison of the spatial distribution of ER in five periods in the study area, the ERI for each period was divided into five classes based on the relative index method. The divisions were as follows: high ER (>0.25), relatively high ER (0.2–0.25), medium ER (0.15–0.2), relatively low ER (0.1–0.15), and low ER (<0.1). Figure 8 displays the mapping of spatial and temporal variations in ER across the five-time periods.
From 2000 to 2020, notable spatial disparities in the ER were evident across Henan Province. As a general trend, the ER exhibited a consistent decrease during this period. During the period 2000–2010, the ER in the study area changed less markedly and was dominated by high and relatively high ER levels. It was mainly distributed in the central Henan district, which was dominated by arable land, including Nanyang, Zhumadian, Zhoukou, Luohe, and other districts dominated by arable land area. The medium ER areas, on the other hand, were mainly concentrated in Sanmenxia, southwest of Luoyang, and northwest of Nanyang, which are mainly forested areas. Until the period of 2010–2020, the ER of the study area changed considerably, mainly from high ER and relatively high ER to medium and relatively low ER. During this period, the most obvious change was in the ER level of western Henan, which changed from the previous medium ER area to the low ER area. It is followed by central Henan, which was characterized by high and relatively high ER, changing to mainly relatively high and medium ER. During the period of 2000–2020, the low ER areas were primarily concentrated in the central region, which was dominated by built-up land. Following two decades of rapid economic growth and the expansion of built-up land, areas with low ER were predominantly concentrated in the central and northern districts of Henan Province. In general, the ER of the entire study area exhibited a declining trend. According to the results of the previous land use changes, it could be seen that the large reduction in the area of arable land indicated that the high ER land use types were reduced and transformed into low ER arable land. Especially from 2010 to 2020, there was a significant change in the ER level.

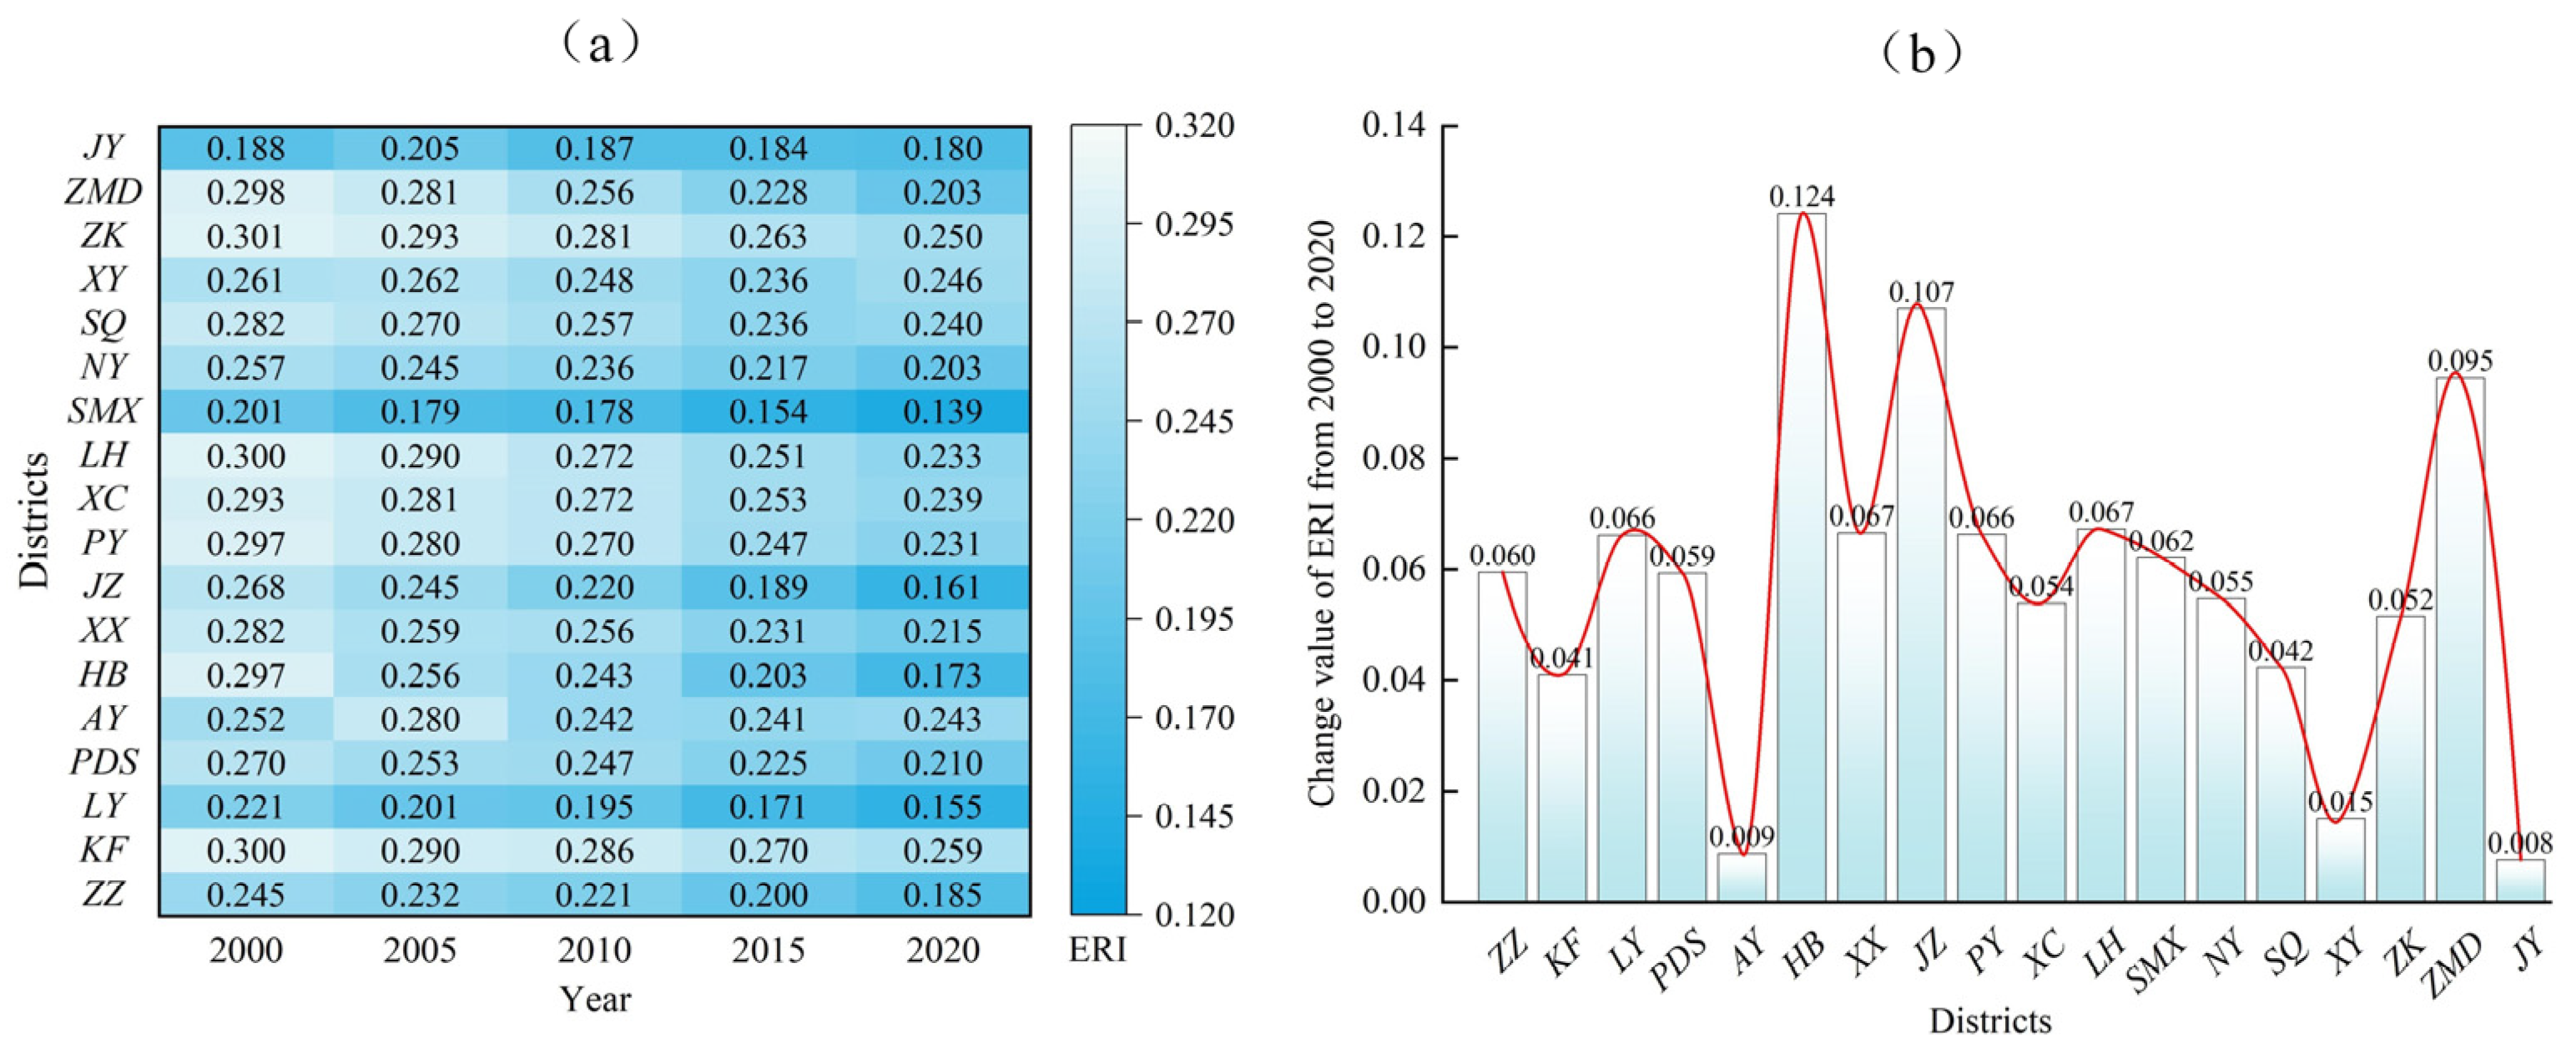
4.2.3. Temporal Change of ERI

The ERI of each district in Henan Province is shown in Figure 9a, and the change in ERI from 2000 to 2020 is shown in Figure 9b. From 2000 through 2020, the ERI of each district showed a decreasing trend. Among them, Jiyuan had the most negligible change in ERI, from 0.188 in 2000 to 0.180 in 2020, with a change value of −0.008; followed by Anyang, from 0.252 in 2000 to 0.233 in 2020, with a change value of −0.019. It was worth mentioning that the ERI of Jiyuan, Anyang, and Xinyang increased from 2000 to 2005, whose change values were 0.017, 0.028, and 0.001, respectively. Apart from this, Anyang increased its ERI by 0.002 during 2015–2020. Hebi had the largest change in the value of the ERI, from 0.297 in 2000 to 0.173 in 2020, a decrease of 0.124; followed by Jiaozuo, which changed from 0.268 in 2000 to 0.161 in 2020, a decrease of 0.107.
Through the analysis, it could be found that the ER of Henan Province decreased in recent years, which was related to its decreasing area of arable land and increasing area of build-up land. Over the past two decades, urbanization in Henan Province has progressed significantly, leading to a continuous increase in the urban population. Consequently, there had been a rising demand for land in various districts within the province. The urbanization rate of the permanent population in Henan Province in 2020 (54.2%) increased by 1 percent compared to the urbanization rate in 2019 (53.2%). The increase in the urbanization rate and the acceleration of the urbanization process contributed to the expansion of built-up land, which led to an increase in the area of built-up land. Particularly after 2010, the spatial and temporal transformations of built-up land and arable land across the study area became notably evident. The above phenomenon should be attributed to multiple aspects. On the one hand, it was due to the increased demand for built-up land as a result of urban expansion, and more and more arable land was developed into built-up land to meet the needs of urban development and road transportation expansion. On the other hand, people’s awareness of ecological environmental protection had gradually increased in recent years, so they began to pay more attention to the development and utilization of land resources according to local conditions and protection, so part of the built-up land was converted into arable land. However, the ecology of arable land was more fragile than that of built-up land. At the same time, the transformation of the arable land area was caused by human activities, which threatened the stability of the ecosystem at a certain level. This is the main reason for reducing ER in Henan Province.

4.3. Relationship between WEUE and ERI

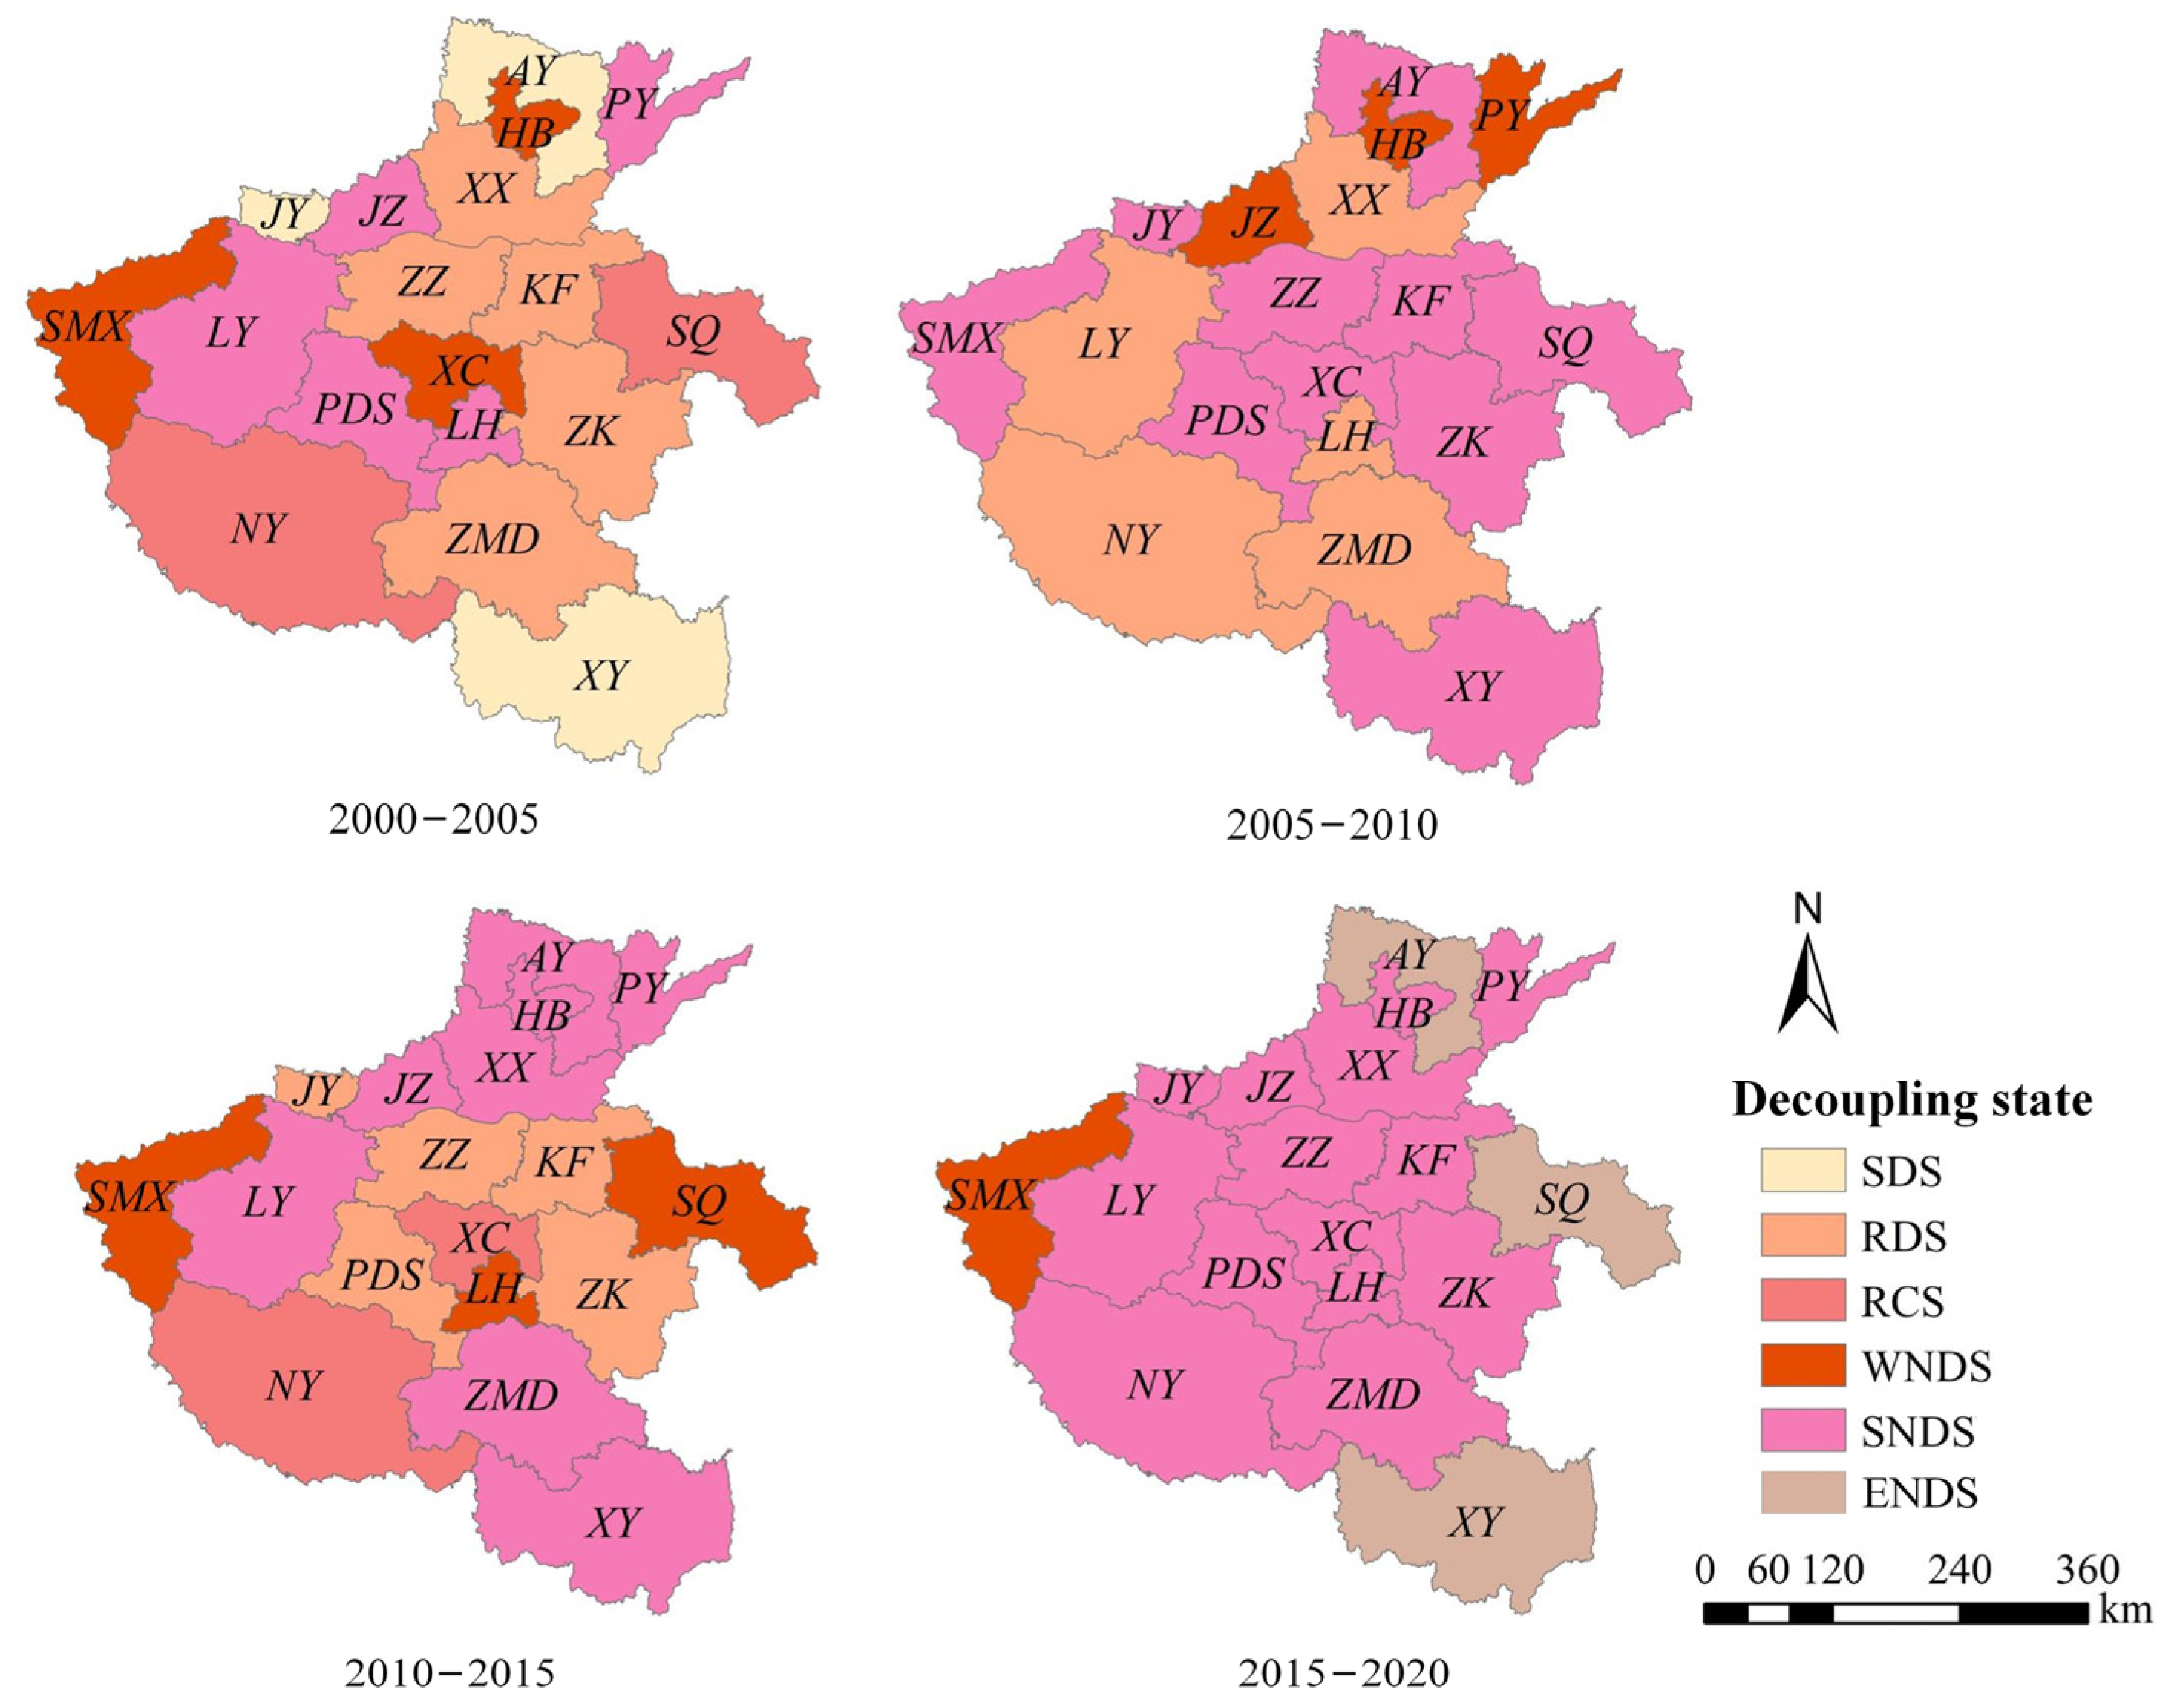
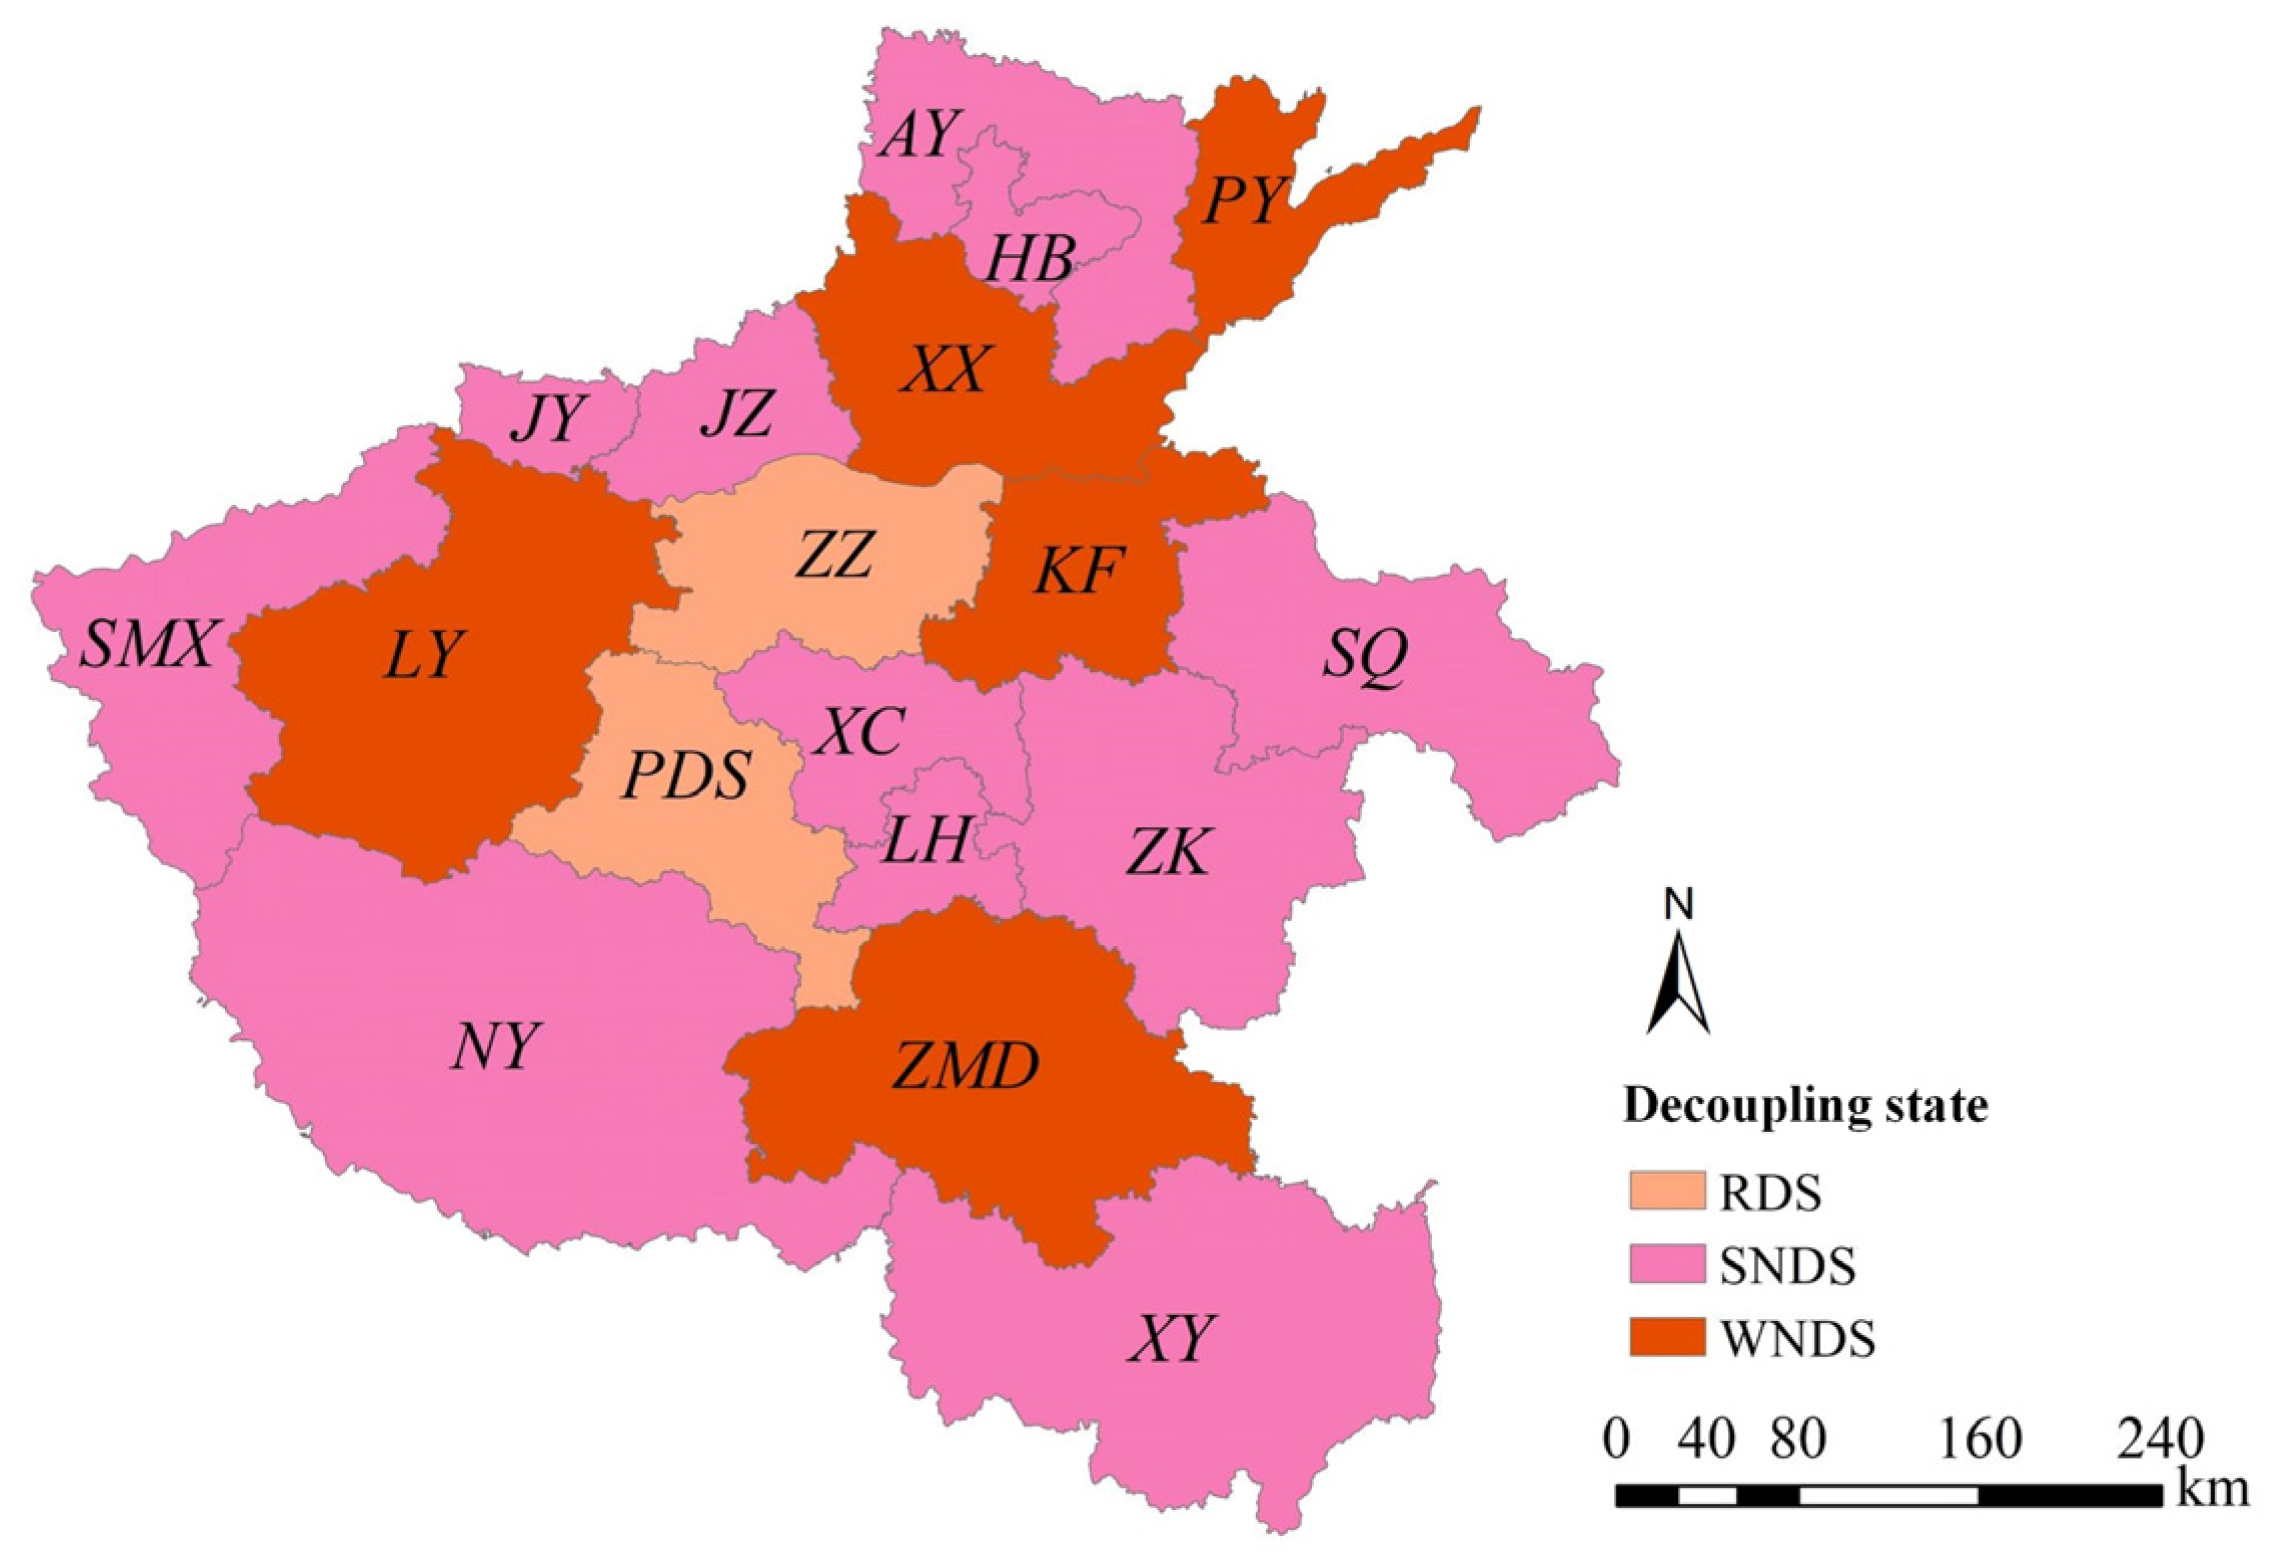
4.3.1. Decoupling Analysis of the WEUE and ERI

Considering that the land-use data have a period of 5 years, in order to reflect the real state of the study period as much as possible, the calculation of the decoupling index was carried out with a window width of 5 years (except for the first and last years). Then, the decoupling state of the whole study period was studied.
The decoupling state with a window width of 5 years is shown in Figure 10. It could be found that the decoupling state between WEUE and ERI in Henan Province had more obvious distributional characteristics. In the period of 2000–2005, there were two main states of SNDS and RDS, as well as three other states of decoupling: SDS, WNDS, and RCS. The areas of SNDS were mainly distributed in central and western Henan, and the areas of RDS were mainly distributed in northern and eastern Henan. In the period of 2005–2010, the districts with SNDS increased significantly, mainly distributed in the central and eastern Henan areas, and the areas with RDS shifted to the western and southern Henan areas. In the 2010–2015 time breadth, the number of districts with SNDS declined and shifted mainly to the north and south of Henan, and the districts with RDS were mainly concentrated in the districts of central Henan and east Henan. In the 2015–2020 time broadcast, decoupling states were divided into three main states: SNDS, ENDS, and WNDS, which were primarily dominated by SNDS, with a total of 14 districts. The district with WNDS was Sanmenxia, and the districts with ENDS were Anyang, Xinxiang, and Shangqiu. The spatial distribution of the decoupling states of WEUE and ERI for the whole study period is shown in Figure 11. It mainly showed three kinds of decoupling states: SNDS, WNDS, and RDS. Xinyang, Puyang, Kaifeng, Luoyang, and Zhumadian were RDS; Zhengzhou and Pingdingshan were WNDS; and the other districts were SNDS.
During the 2000–2005 period, the spatial distribution of the decoupling states in Henan Province was uneven. Henan’s economy was in the stage of rough development, and there were problems of the overconsumption of resources (e.g., water and energy) and ecological damage, so a variety of decoupling states of WEUE and ERI appeared. During the 2005–2010 period, the SNDS was mainly distributed in the faster and more developed districts of central and eastern Henan. Along with rapid economic development, they had begun to shift the focus of development in the direction of sustainable development. For instance, Zhengzhou had introduced a water resources tax system, implemented energy-saving and emission reduction targets, and promoted the strengthening of energy management in various industries, as well as enterprises and public institutions. During the 2010–2015 period, the two districts of northern and southern Henan actively strengthened their water resource management, water conservancy project construction, and other efforts to improve the utilization efficiency of water resources. Simultaneously, they actively pursued energy restructuring measures to enhance energy efficiency and minimize reliance on traditional energy sources. During the 2015–2020 period, districts actively practiced the Environmental Protection Law, improved the way water-energy resources were utilized, and guided the development of the eco-industry and green economy, promoting regional ecological environment status and the fitness relationship between WEUE and ERI.

4.3.2. Policy Implication

Currently, the scarcity of water resources and excessive energy consumption have emerged as significant constraints that impact the high-quality development of Henan Province’s economy and hinder ecologically sustainable growth. Based on the above-obtained results, the following relevant recommendations are put forward:
(1) There are regional differences in WEUE, which should be adapted to local conditions. During the journey towards high-quality economic development, it becomes imperative to consider the limits of water resources and energy while simultaneously striving for an approach that promotes intensive, cost-effective, and sustainable development and utilization. All districts should improve the utilization efficiency of water resources and energy, rationally control the degree of exploitation and utilization, and promote the virtuous cycle of water resources and energy to achieve the coordinated development of the two;
(2) Although the ER of Henan Province has been decreasing year over year, there is still a gap between the realization of sustainable development. There is a need to strengthen resource conservation and recycling, promote the development of environmental protection industries, facilitate the transformation of the low-carbon economy, and reduce the excessive development and consumption of natural resources. At the same time, it is necessary to strengthen education and publicity on ecological security, advocate green lifestyles, promote the concept of green consumption, and form a consensus among the whole society to maintain ecological security;
(3) Based on the WEUE and ERI decoupling states, improvements should be made in two ways. Firstly, districts that are in a state of WNDS and RDS at the present stage should integrate resource utilization and ecological security and pursue a development path in which exploitation, utilization, and protection are carried out simultaneously. Secondly, giving full play to the demonstration and positive guidance role of the areas with the best decoupling state (i.e., Xuchang, Zhoukou), they should integrate the high-quality resources, synergize their development, and optimize the development pattern of water resources, energy, and ecological protection.

5. Conclusions

In this study, the relationship between water-energy resource utilization and ecological security was investigated with an Assessment-Decoupling two-stage framework, and a real case of Henan Province, China, was conducted. Specifically, the WEUE was assessed by constructing an improved input-output indicator system and using the Super-SBM model, and the Tobit model was used to analyze the influencing factors of the WEUE. Then, the raster-scale ER was evaluated based on the land-use type. Ultimately, the Tapio model was employed to quantitatively assess the fitness relationship between WEUE and ER. Some valuable conclusions are as follows:
  • The WEUE of the study area showed a fluctuating trend, with a decreasing trend during 2000–2015 and a significant increase during 2015–2020, which was more pronounced in the central, western, and northern districts of Henan. However, the WEUE of Puyang, Nanyang, and Sanmenxia decreased as a whole, with Kaifeng experiencing the largest decrease at 0.262, followed by Anyang at 0.252;
  • The spatial differences in ER in Henan Province are quite obvious, with high-risk areas mainly concentrated in central, eastern, and southern Henan and low-risk areas mainly in western Henan. Between 2000 and 2020, the ERI generally showed a decreasing trend. By 2020, most of the cities were at higher risk levels, with Hebei having the largest change in ERI at 0.124, followed by Jiaozuo, and Jiyuan having the smallest change of 0.08;
  • There is significant spatial variation in the decoupling states of WEUE and ERI of the 18 districts in Henan Province, and the differences became more pronounced over the study period. The spatial distribution of districts with SNDS was inconsistent in each time window, while overall, the number of districts with SNDS increased continuously. A total of 14 districts reached SDNS in 2020.
However, there are still several limitations that need to be further addressed. The interaction between resource utilization and ecological security and the potential effects of numerous factors are all very complex. How to clarify the action mechanisms of the two systems can be the focus of future research. Meanwhile, the WEUE has a vast number of influences, and their driving mechanisms are complex, manifesting that the selection of indicators is significant for the obtained results. This study constructed a generalized indicator system; although it has some applicability, the indicators should be dynamically adjusted when applying the method to other areas.

Author Contributions

Data curation, methodology, software, visualization, writing—original draft, T.Z. and Q.W.; conceptualization, funding acquisition and project administration, supervision, Q.Z.; investigation, Q.W., T.Z., Z.Z. and J.M.; supervision, Q.Z. and J.M.; resources, Q.Z. and T.Z.; writing—review and editing, Q.Z., J.M., Q.W., Z.Z. and T.Z. All authors have read and agreed to the published version of the manuscript.

Funding

This research was funded by the Natural Science Foundation of China (no. 52279027) and the National Key Research and Development Program of China (no. 2021YFC3200201).

Data Availability Statement

Publicly available datasets were analyzed in this study. These data can be found and downloaded on relevant websites.

Conflicts of Interest

The authors declare no conflict of interest.

References

  1. Gozini, H.; Zahraie, B.; Ravar, Z. System Dynamics Modeling of Water-Energy Nexus for Resource-Saving Policy Assessment. Int. J. Environ. Res. 2021, 15, 349–367. [Google Scholar] [CrossRef]
  2. Shaad, K.; Souter, N.J.; Vollmer, D.; Regan, H.M.; Bezerra, M.O. Integrating Ecosystem Services Into Water Resource Management: An Indicator-Based Approach. Environ. Manag. 2022, 69, 752–767. [Google Scholar] [CrossRef]
  3. Speich, M.; Ulli-Beer, S. Applying an ecosystem lens to low-carbon energy transitions: A conceptual framework. J. Clean. Prod. 2023, 398, 136429. [Google Scholar] [CrossRef]
  4. Stewart, S.; Green, G. The Importance of Legislative Reform to Enable Adaptive Management of Water Resources in a Drying Climate. Water 2022, 14, 1404. [Google Scholar] [CrossRef]
  5. Kahouli, B.; Miled, K.; Aloui, Z. Do energy consumption, urbanization, and industrialization play a role in environmental degradation in the case of Saudi Arabia? Energy Strategy Rev. 2022, 40, 100814. [Google Scholar] [CrossRef]
  6. Algaba, M.H.P.; Huyghe, W.; Van Leeuwen, K.; Koop, S.; Eisenreich, S. Assessment and Actions to Support Integrated Water Resources Management of Seville (Spain). Environ. Dev. Sustain. 2023, 1–29. [Google Scholar] [CrossRef]
  7. Le, N.T.; Thinh, N.A.; Ha, N.T.V.; Tien, N.D.; Lam, N.D.; Hong, N.V.; Tuan, N.T.; Hanh, T.V.; Khanh, N.N.; Thanh, N.N.; et al. Measuring water resource use efficiency of the Dong Nai River Basin (Vietnam): An application of the two-stage data envelopment analysis (DEA). Environ. Dev. Sustain. 2022, 24, 12427–12445. [Google Scholar] [CrossRef]
  8. Mostafa, S.M.; Wahed, O.; El-Nashar, W.Y.; El-Marsafawy, S.M.; Zelenakova, M.; Abd-Elhamid, H.F. Potential Climate Change Impacts on Water Resources in Egypt. Water 2021, 13, 1715. [Google Scholar] [CrossRef]
  9. Fukuyama, H.; Hashimoto, A.; Weber, W.L. Environmental efficiency, energy efficiency and aggregate well-being of Japanese prefectures. J. Clean. Prod. 2020, 271, 122810. [Google Scholar] [CrossRef]
  10. Chen, C.; Hu, Y.; Karuppiah, M.; Kumar, P.M. Artificial intelligence on economic evaluation of energy efficiency and renewable energy technologies. Sustain. Energy Technol. Assess. 2021, 47, 101358. [Google Scholar] [CrossRef]
  11. Zhang, Q.; Suresh, L.; Liang, Q.; Zhang, Y.; Yang, L.; Paul, N.; Tan, S. Emerging Technologies for Green Energy Conversion and Storage. Adv. Sustain. Syst. 2021, 5, 2000152. [Google Scholar] [CrossRef]
  12. Okadera, T.; Chontanawat, J.; Gheewala, S.H. Water footprint for energy production and supply in Thailand. Energy 2014, 77, 49–56. [Google Scholar] [CrossRef]
  13. Venkatesh, G.; Brattebo, H. Energy consumption, costs and environmental impacts for urban water cycle services: Case study of Oslo (Norway). Energy 2011, 36, 792–800. [Google Scholar] [CrossRef]
  14. Shi, C.; Li, L.; Chiu, Y.; Pang, Q.; Zeng, X. Spatial differentiation of agricultural water resource utilization efficiency in the Yangtze River Economic Belt under changing environment. J. Clean. Prod. 2022, 346, 131200. [Google Scholar] [CrossRef]
  15. Kadir, M.O.; Deka, A.; Ozdeser, H.; Seraj, M.; Turuc, F. The impact of energy efficiency and renewable energy on GDP growth: New evidence from RALS-EG cointegration test and QARDL technique. Energy Effic. 2023, 16, 46. [Google Scholar] [CrossRef]
  16. Hunsaker, C.T.; Graham, R.L.; Suter, G.W.; Oneill, R.V.; Barnthouse, L.W.; Gardner, R.H. Assessing ecological risk on a regional scale. Environ. Manag. 1990, 14, 325–332. [Google Scholar] [CrossRef]
  17. Tannenbaum, L.V. Absent ecology in the terrestrial ecological risk assessment process and an absent need for assessment. Hum. Ecol. Risk Assess. 2022, 28, 1083–1104. [Google Scholar] [CrossRef]
  18. Chen, S.; Chen, B.; Fath, B.D. Ecological risk assessment on the system scale: A review of state-of-the-art models and future perspectives. Ecol. Model. 2013, 250, 25–33. [Google Scholar] [CrossRef]
  19. Hasanzadeh, M.; Malakootian, M.; Nasiri, A.; Conti, G.O.; Ferrante, M.; Faraji, M. Ecological and Probabilistic Health Risk Assessment of Heavy Metals in Topsoils, Southeast of Iran. Bull. Environ. Contam. Toxicol. 2022, 108, 737–744. [Google Scholar] [CrossRef]
  20. Hasan, M.R.; Anisuzzaman, M.; Choudhury, T.R.; Arai, T.; Yu, J.; Albeshr, M.F.; Hossain, M.B. Vertical distribution, contamination status and ecological risk assessment of heavy metals in core sediments from a mangrove-dominated tropical river. Mar. Pollut. Bull. 2023, 189, 114804. [Google Scholar] [CrossRef]
  21. Adikaram, M.; Pitawala, A.; Ishiga, H.; Jayawardana, D.; Eichler, C.M. An Ecological Risk Assessment of Sediments in a Developing Environment-Batticaloa Lagoon, Sri Lanka. J. Mar. Sci. Eng. 2021, 9, 73. [Google Scholar] [CrossRef]
  22. Varol, M.; Ustaoglu, F.; Tokatli, C. Ecological Risk Assessment of Metals in Sediments from Three Stagnant Water Bodies in Northern Turkey. Curr. Pollut. Rep. 2022, 8, 409–421. [Google Scholar] [CrossRef]
  23. Durdu, B.; Gurbuz, F.; Kocyigit, H.; Gurbuz, M. Urbanization-driven soil degradation; ecological risks and human health implications. Environ. Monit. Assess. 2023, 195, 1002. [Google Scholar] [CrossRef] [PubMed]
  24. Santos, P.; Ribeiro, J.; Marques, J.E.; Flores, D. Environmental and Health Risk Assessment of Soil Adjacent to a Self-Burning Waste Pile from an Abandoned Coal Mine in Northern Portugal. Environments 2023, 10, 53. [Google Scholar] [CrossRef]
  25. Ilic, P.; Ilic, S.; Neskovic Markic, D.; Stojanovic Bjelic, L.; Farooqi, Z.U.R.; Sole, B.; Adimalla, N. Source identification and ecological risk of polycyclic aromatic hydrocarbons in soils and groundwater. Ecol. Chem. Eng. 2021, 28, 355–363. [Google Scholar] [CrossRef]
  26. Rabieimesbah, A.; Sobhanardakani, S.; Cheraghi, M.; Lorestani, B. Concentrations, Source Identification and Potential Ecological and Human Health Risks Assessment of Polycyclic Aromatic Hydrocarbons (PAHs) in Agricultural Soils of Hamedan County, West of Iran. Soil Sediment Contam. 2023, 1–25. [Google Scholar] [CrossRef]
  27. Ngo, H.T.T.; Tran, L.A.T.; Nguyen, D.Q.; Nguyen, T.T.H.; Le, T.T.; Gao, Y. Metal Pollution and Bioaccumulation in the Nhue-Day River Basin, Vietnam: Potential Ecological and Human Health Risks. Int. J. Environ. Res. Public Health 2021, 18, 13425. [Google Scholar] [CrossRef]
  28. Li, W.; Kang, J.; Wang, Y. Spatiotemporal changes and driving forces of ecological security in the Chengdu-Chongqing urban agglomeration, China: Quantification using health-services-risk framework. J. Clean. Prod. 2023, 389, 136135. [Google Scholar] [CrossRef]
  29. Bai, J.; Guo, K.; Liu, M.; Jiang, T. Spatial variability, evolution, and agglomeration of eco-environmental risks in the Yangtze River Economic Belt, China. Ecol. Indic. 2023, 152, 110375. [Google Scholar] [CrossRef]
  30. Mondal, B.; Sharma, P.; Kundu, D.; Bansal, S. Spatio-temporal Assessment of Landscape Ecological Risk and Associated Drivers: A Case Study of Delhi. Environ. Urban. Asia 2021, 12, S85–S106. [Google Scholar] [CrossRef]
  31. Omar, H.; Cabral, P. Ecological Risk Assessment Based on Land Cover Changes: A Case of Zanzibar (Tanzania). Remote Sens. 2020, 12, 3114. [Google Scholar] [CrossRef]
  32. Cansino-Loeza, B.; Munguia-Lopez, A.D.; Ponce-Ortega, J.M. A water-energy-food security nexus framework based on optimal resource allocation. Environ. Sci. Policy 2022, 133, 1–16. [Google Scholar] [CrossRef]
  33. Liu, Y.; Chen, W.; Liu, X.; Shi, J.; Liu, N.; Ren, H.; Li, H.; Ulgiati, S. Multi-objective coordinated development paths for China’s steel industry chain based on “water-energy-economy” dependence. J. Clean. Prod. 2022, 370, 133421. [Google Scholar] [CrossRef]
  34. Akbar, H.; Nilsalab, P.; Silalertruksa, T.; Gheewala, S.H. An inclusive approach for integrated systems: Incorporation of climate in the water-food-energy-land nexus index. Sustain. Prod. Consum. 2023, 39, 42–52. [Google Scholar] [CrossRef]
  35. Roxani, A.; Zisos, A.; Sakki, G.K.; Efstratiadis, A. Multidimensional Role of Agrovoltaics in Era of EU Green Deal: Current Status and Analysis of Water-Energy-Food-Land Dependencies. Land 2023, 12, 1069. [Google Scholar] [CrossRef]
  36. Chamas, Z.; Abou Najm, M.; Al-Hindi, M.; Yassine, A.; Khattar, R. Sustainable resource optimization under water-energy-food-carbon nexus. J. Clean. Prod. 2021, 278, 123894. [Google Scholar] [CrossRef]
  37. Temel, P.; Kentel, E.; Alp, E. Development of a site selection methodology for run-of-river hydroelectric power plants within the water-energy-ecosystem nexus. Sci. Total Environ. 2023, 856, 159152. [Google Scholar] [CrossRef]
  38. Mikulcic, H.; Wang, X.; Duic, N.; Dewil, R. Environmental problems arising from the sustainable development of energy, water and environment system. J. Environ. Manag. 2020, 259, 109666. [Google Scholar] [CrossRef]
  39. Shahzad, M.W.; Burhan, M.; Ang, L.; Ng, K.C. Energy-water-environment nexus underpinning future desalination sustainability. Desalination 2017, 413, 52–64. [Google Scholar] [CrossRef]
  40. Zuo, Q.; Wu, Q.; Yu, L.; Li, Y.; Fan, Y. Optimization of uncertain agricultural management considering the framework of water, energy and food. Agric. Water Manag. 2021, 253, 106907. [Google Scholar] [CrossRef]
  41. Zhang, Y.; Zuo, Q.; Wu, Q.; Han, C.; Tao, J. An integrated diagnostic framework for water resource spatial equilibrium considering water-economy-ecology nexus. J. Clean. Prod. 2023, 414, 137592. [Google Scholar] [CrossRef]
  42. Luo, Z.; Zuo, Q. Evaluating the coordinated development of social economy, water, and ecology in a heavily disturbed basin based on the distributed hydrology model and the harmony theory. J. Hydrol. 2019, 574, 226–241. [Google Scholar] [CrossRef]
  43. TONE, K. A slacks-based measure of super-efficiency in data envelopment analysis. Eur. J. Oper. Res. 2002, 143, 32–41. [Google Scholar] [CrossRef]
  44. Khan, S.U.; Cui, Y.; Khan, A.A.; Ali, M.A.S.; Khan, A.; Xia, X.; Liu, G.; Zhao, M. Tracking sustainable development efficiency with human-environmental system relationship: An application of DPSIR and super efficiency SBM model. Sci. Total Environ. 2021, 783, 146959. [Google Scholar] [CrossRef]
  45. Wang, J.; Su, D.; Wu, Q.; Li, G.; Cao, Y. Study on eco-efficiency of cultivated land utilization based on the improvement of ecosystem services and emergy analysis. Sci. Total Environ. 2023, 882, 163489. [Google Scholar] [CrossRef]
  46. Zheng, H.; Wu, Y.; He, H.; Delang, C.O.; Qian, J.; Lu, J.; Yao, Z.; Li, G. Urban land use eco-efficiency and improvement in the western region of China. J. Clean. Prod. 2023, 412, 137385. [Google Scholar] [CrossRef]
  47. Ning, L.; Zheng, W.; Zeng, L.E. Research on China’s Carbon Dioxide Emissions Efficiency from 2007 to 2016: Based on Two Stage Super Efficiency SBM Model and Tobit Model. Acta Sci. Nat. Univ. Pekin. 2021, 57, 181–188. [Google Scholar]
  48. Zhou, C.; Shi, C.; Wang, S.; Zhang, G. Estimation of eco-efficiency and its influencing factors in Guangdong province based on Super-SBM and panel regression models. Ecol. Indic. 2018, 86, 67–80. [Google Scholar] [CrossRef]
  49. Dalei, N.N.; Joshi, J.M. Estimating technical efficiency of petroleum refineries using DEA and tobit model: An India perspective. Comput. Chem. Eng. 2020, 142, 107047. [Google Scholar] [CrossRef]
  50. Liang, X.; Li, J.; Guo, G.; Li, S.; Gong, Q. Evaluation for water resource system efficiency and influencing factors in western China: A two-stage network DEA-Tobit model. J. Clean. Prod. 2021, 328, 129674. [Google Scholar] [CrossRef]
  51. Gaber, R.; El-Din, M.N. Enhancement of Water Security by Decoupling Water use from Economic Development in Egypt. J. Al-Azhar Univ. Eng. Sect. 2021, 16, 565–578. [Google Scholar] [CrossRef]
  52. Hassan, M.; Afridi, M.K.; Khan, M.I. Energy policies and environmental security: A multi-criteria analysis of energy policies of Pakistan. Int. J. Green. Energy 2019, 16, 510–519. [Google Scholar] [CrossRef]
  53. Zhang, S.; Yu, Y.; Kharrazi, A.; Ren, H.T.; Ma, T. Quantifying the synergy and trade-offs among economy-energy-environment-social targets: A perspective of industrial restructuring. J. Environ. Manag. 2022, 316, 115285. [Google Scholar] [CrossRef]
  54. Muhirwa, F.; Shen, L.; Elshkaki, A.; Zhong, S.; Hu, S.H.; Hirwa, H.; Chiaka, J.C.; Umarishavu, F.; Mulinga, N. Ecological balance emerges in implementing the water-energy-food security nexus in well-developed countries in Africa. Sci. Total Environ. 2022, 833, 154999. [Google Scholar] [CrossRef] [PubMed]
  55. Wang, Y.; Liang, D.; Wang, J.; Zhang, Y.; Chen, F.; Ma, X. An analysis of regional carbon stock response under land use structure change and multi-scenario prediction, a case study of Hefei, China. Ecol. Indic. 2023, 151, 110293. [Google Scholar] [CrossRef]
  56. Schirpke, U.; Tasser, E.; Borsky, S.; Braun, M.; Eitzinger, J.; Gaube, V.; Getzner, M.; Glatzel, S.; Gschwantner, T.; Kirchner, M.; et al. Past and future impacts of land-use changes on ecosystem services in Austria. J. Environ. Manag. 2023, 345, 118728. [Google Scholar] [CrossRef]
  57. He, N.; Zhou, Y.; Wang, L.; Li, Q.; Zuo, Q.; Liu, J. Spatiotemporal differentiation and the coupling analysis of ecosystem service value with land use change in Hubei Province, China. Ecol. Indic. 2022, 145, 109693. [Google Scholar] [CrossRef]
  58. Qian, Y.; Dong, Z.; Yan, Y.; Tang, L. Ecological risk assessment models for simulating impacts of land use and landscape pattern on ecosystem services. Sci. Total Environ. 2022, 833, 155218. [Google Scholar] [CrossRef]
  59. Gan, L.; Halik, Ü.; Shi, L.; Welp, M. Multi-scenario dynamic prediction of ecological risk assessment in an arid area of northwest China. Ecol. Indic. 2023, 154, 110727. [Google Scholar] [CrossRef]
  60. Anagonou, S.P.G.; Ewemoje, T.A.; Toyi, S.S.M.; Olubode, O.S. Landscape ecological risk assessment and transformation processes in the Guinean-Congolese climate zone in Benin Republic. Remote Sens. Appl. Soc. Environ. 2023, 31, 100985. [Google Scholar] [CrossRef]
  61. Ran, P.; Hu, S.; Frazier, A.E.; Qu, S.; Yu, D.; Tong, L. Exploring changes in landscape ecological risk in the Yangtze River Economic Belt from a spatiotemporal perspective. Ecol. Indic. 2022, 137, 108744. [Google Scholar] [CrossRef]
  62. Du, L.; Dong, C.; Kang, X.; Qian, X.; Gu, L. Spatiotemporal evolution of land cover changes and landscape ecological risk assessment in the Yellow River Basin, 2015–2020. J. Environ. Manag. 2023, 332, 117149. [Google Scholar] [CrossRef] [PubMed]
  63. Lu, L.; Zhang, J.; Sun, C.; Wang, X.; Zheng, D. Landscapeecological risk assessment of Xi river Basin based on land-use change. Acta Ecol. Sin. 2018, 38, 5952–5960. [Google Scholar] [CrossRef]
  64. Tapio, P.; Banister, D.; Luukkanen, J.; Vehmas, J.; Willamo, R. Energy and transport in comparison: Immaterialisation, dematerialisation and decarbonisation in the EU15 between 1970 and 2000. Energy Policy 2007, 35, 433–451. [Google Scholar] [CrossRef]
  65. Tasbasi, A. A threefold empirical analysis of the relationship between regional income inequality and water equity using Tapio decoupling model, WPAT equation, and the local dissimilarity index: Evidence from Bulgaria. Environ. Sci. Pollut. Res. 2021, 28, 4352–4365. [Google Scholar] [CrossRef]
  66. Ozturk, I.; Majeed, M.T.; Khan, S. Decoupling and decomposition analysis of environmental impact from economic growth: A comparative analysis of Pakistan, India, and China. Environ. Ecol. Stat. 2021, 28, 793–820. [Google Scholar] [CrossRef]
  67. Duan, R.; Huang, G.; Zhou, X.; Lu, C.; Tian, C. Record-Breaking Heavy Rainfall Around Henan Province in 2021 and Future Projection of Extreme Conditions under Climate Change. J. Hydrol. 2023, 625, 130102. [Google Scholar] [CrossRef]
  68. Wu, P.; Clark, R.; Furtado, K.; Xiao, C.; Wang, Q.; Sun, R. A case study of the July 2021 Henan extreme rainfall event: From weather forecast to climate risks. Weather Clim. Extrem. 2023, 40, 100571. [Google Scholar] [CrossRef]
Figure 1. Schematic diagram of the Assessment-Decoupling two-stage framework.
Water 15 03377 g001
Figure 2. Criteria for defining decoupling states.
Water 15 03377 g002
Figure 3. The study area.
Water 15 03377 g003
Figure 4. Measured WEUE of 18 districts from 2000 to 2020.
Water 15 03377 g004
Figure 5. Changes in WEUE of 18 districts from 2000 to 2020.
Water 15 03377 g005
Figure 6. Changes in the spatial pattern of WEUE from 2000 to 2020.
Water 15 03377 g006
Figure 7. Transform of land-use types during 2000–2020.
Water 15 03377 g007
Figure 8. Changes in the spatial pattern of ER between 2000 and 2020.
Water 15 03377 g008
Figure 9. Changes in ERI during 2000–2020 ((a) represents the value of the ERI for each district, and (b) shows the change in the ERI for each district over the period 2000–2020).
Water 15 03377 g009
Figure 10. Decoupling states of WEUE and ERI at various periods.
Water 15 03377 g010
Figure 11. Decoupling states of WEUE and ERI from 2000 to 2020.
Water 15 03377 g011
Table 1. Input-output indicators system for WEUE assessment.
CategoryPrimary IndexSecondary IndexUnit
InputsResource inputsTotal water consumption100 million m3
Energy consumptiontons of standard coal
Capital inputsInvestment in fixed assetsCNY 100 million
Labor inputsEnd-of-year area practitionersperson
OutputsExpected outputsGross Regional ProductCNY 100 million
Undesirable outputsSewage discharge10,000 tons
CO2 emissionston
Table 2. Influencing factors of WEUE.
Correlation VariableExplanatory VariableIndex AbbreviationUnit
Economic developmentGross domestic productGDP100 million Yuan
Energy consumption per GDPECGtons of standard coal per 10,000 Yuan
Resource endowmentPer capita water resourcesPWRm3/person
Per capita energy productionPCPton/person
Industrial structureThe proportion of secondary industryPSI%
The proportion of agricultural water consumptionPAC%
Ecological environmentSewage treatment rateSTR%
Chemical oxygen demand emissionCODton
Table 3. Calculation results of the Tobit regression model.
Correlation VariableExplanatory VariableRegression CoefficientStandard Errorp
Economic developmentGDP1.5110 ***0.19830.002
ECG−0.0358 ***0.00310.001
Resource endowmentPWR0.0004 ***0.00010.001
PCP0.0396 ***0.00740.006
Industrial structurePSI−3.3799 ***0.40270.001
PAC1.3998 ***0.28350.008
Ecological environmentSTR0.0107 ***0.00170.003
COD−0.0003 **0.00010.010
Note: The superscripts ** and *** indicate 5% and 1% significance levels, respectively.
Table 4. Changes in land use dynamics in Henan Province.
Land-Use TypeArea (km2)Dynamic Index (%)
200020052010201520202000–20052005–20102010–20152015–2020
Arable Land108,516107,536107,187106,468103,526−0.18%−0.06%−0.13%−0.55%
Forest Land27,06127,01027,07327,05327,076−0.04%0.05%−0.01%0.02%
Grass Land94479387937493658952−0.13%−0.03%−0.02%−0.88%
Water Land351139784026404742502.66%0.24%0.10%1.00%
Built-up Land16,99217,64417,89618,62221,8130.77%0.29%0.81%3.43%
Unused Land8880757372−1.82%−1.25%−0.53%−0.27%
Disclaimer/Publisher’s Note: The statements, opinions and data contained in all publications are solely those of the individual author(s) and contributor(s) and not of MDPI and/or the editor(s). MDPI and/or the editor(s) disclaim responsibility for any injury to people or property resulting from any ideas, methods, instructions or products referred to in the content.

