Article

Effect of Hydraulic Loading Rate on Treatment Performance of a Pilot Wetland Roof Treating Greywater from a Household

1
Department Centre for Environmental Biotechnology (UBZ), Helmholtz Centre for Environmental Research—UFZ, Permoserstrasse 15, 04318 Leipzig, Germany
2
Department of Environmental Engineering (TUCHEM), Helmholtz Centre for Environmental Research—UFZ, Permoserstrasse 15, 04318 Leipzig, Germany
3
Blumberg Engineers, Gänsemarkt 10, 37120 Bovenden, Germany
4
Department of Environmental Informatics (ENVINF), Helmholtz Centre for Environmental Research—UFZ, Permoserstrasse 15, 04318 Leipzig, Germany
*
Author to whom correspondence should be addressed.
Water 2023, 15(19), 3375; https://doi.org/10.3390/w15193375
Submission received: 24 August 2023 / Revised: 19 September 2023 / Accepted: 22 September 2023 / Published: 26 September 2023

Abstract

:
To solve the upcoming environmental problems, sponge city concepts as well as new technologies are being developed these days. One of the future challenges is to reduce drinking water demand by using decentralized water recycling systems. This study aimed to investigate the performance of a specially designed pilot wetland roof (PWR) treating domestic greywater (GW) at ground level under outdoor conditions and to evaluate the effects of different hydraulic loading rates (HLRs) for a period of two years. The results showed highly efficient removal of typical greywater pollutants from the system, e.g., five-day biochemical oxygen demand (BOD5) > 96%, chemical oxygen demand (COD) > 93%, total suspended solids (TSS) >94%, anionic surfactants (AS) > 94%, ammonium-nitrogen (NH4-N) > 84%, total nitrogen (TN) > 71%, total phosphorous (TP) > 87%, and E. coli (1.86 ± 1.54 log-removal). The mean concentrations of the targeted parameters at the outflow were in compliance with the requirements for discharge to the environment and met reclaimed water quality standards for agricultural irrigation, except for E. coli. Statistically significant (p < 0.05) results of pollutant mass removal rate across different HLRs indicated the potential effect of HLR on treatment performance, and HLR in a range of 67–80 L m–2 d–1 contributed to a higher removal efficiency without compromising the limit values. A comparatively low HLR of 45 L m–2 d–1 should be applicable if pathogen removal is the most important requirement. Plant species showed good plant vitality and adapted well to the water storage mat. The higher the mean ambient air temperature, the greater runoff reduction (>50%) was observed due to high evapotranspiration. The results showed the system is a promising green technology for GW recycling and can be scaled up for application to urban buildings.

Graphical Abstract

1. Introduction

Due to rapid urbanization, climate change, and extreme weather conditions, the cities are facing a series of environmental problems, such as water resource shortages, inadequate water infrastructure, deteriorating urban water quality, frequent flood disasters, reduced vegetation cover, loss of biodiversity, and warming of the urban climate [1]. It is estimated that around 80% of municipal wastewater is released into the environment without any prior treatment [2]. Rapidly increasing stress on available freshwater sources worldwide has forced water providers to develop different wastewater management strategies and to place emphasis on wastewater recycling and reuse.
Wastewater from households can be classified into three categories: (i) greywater (GW), (ii) black water (BW), and (iii) yellow water (YW). BW is the wastewater generated from toilets; yellow water is pure urine; whereas GW includes all aqueous waste generated in domestic premises from kitchen sinks, dishwashers, washing machines, bathroom sinks, showers, and bathing, but excludes streams from toilets [3]. Although the effluents from kitchen sinks and dishwashers are also referred to as BW in some parts of the world [4]. Most often, these three types of wastewater are mixed and discharged into the sewer system. GW accounts for 16–200 L per capita per day, representing up to 75% of the total volume of wastewater generated in a residence [5]. The composition, volume, and physico-chemical characteristics of domestic GW are highly variable, and they depend on multiple factors like the population structures of the residents (age, gender, health condition), family size, lifestyle patterns, eating habits, hygiene, and cultural habits, purchasing power, detergents used, type of water infrastructure, the degree of water abundance, climatic conditions, etc. [6].
The main compounds in GW include carbohydrates (derived from food), fats and oils, proteins, glycerides, surfactants (anionic, cationic, and amphoteric from shampoo and detergents), and soap [7]. Given their widespread use, surfactants are among the main chemical contaminants in GW [8]. According to Ramprasad and Philip [9], even at low concentrations, these pollutants can cause severe health issues in humans and aquatic organisms. The most popular and widely used surfactants, anionic surfactants (AS), are commonly found in almost every cleaning product, like laundry detergents, soaps, kitchen cleaners, personal care products, body washes, etc. They are most effective at removing oily residues, but as the most potent surfactants, they can also cause skin irritation [10].
Due to generally low levels of pathogens and nitrogen, the reuse and recycling of GW is becoming increasingly interesting, especially to cope with water scarcity at the domestic level [11,12]. However, most existing urban sewage treatment methods involve the collection of both GW and BW and then transporting them to urban sewage treatment plants via sewerage networks [13]. Since the expansion of sewer systems is cost-intensive, decentralized GW treatment close to its generation and collection points can be an alternative and cost-effective solution for promoting sustainable water management in cities [14]. The source separation of GW can reduce the volume discharged to wastewater treatment plants and minimize the energy required for their treatment [15]. For some green buildings, GW and BW are collected separately via source separation technology [16]. However, due to the limited amount of available space in urban buildings, the design of the GW treatment and storage facilities in the inner and outer confines of a building presents a huge challenge.
Nature-based solutions (NBS) can be a powerful remedy for alleviating urban pressures in cities, achieving resilience to climate change, improving sustainability, and promoting sustainable economic growth [17]. Earlier research mainly focused on the treatment of GW using NBS like conventionally constructed wetlands (CWs) for the removal of organics, nutrients, and pathogenic microorganisms to assess the reuse of treated GW for irrigation purposes [18,19]. In recent years, various types of processes like filtration, membrane bioreactors, rotating biological contactors, sequencing batch reactors, up-flow anaerobic sludge blanket reactors, and multi-functional NBS have also been tested for GW treatment and reuse [12,20,21,22,23,24]. Several other GW treatment studies using innovative technologies like dual-mode biofilters [25], vegetated vermifilters [26], horizontal flow wetland integrated in a cascading vertical set-up [27], and green walls [28,29] with high removal efficiencies have been carried out very recently. One very promising approach in this regard is the decentralization of urban water management by using NBS such as green roofs and CWs [30,31].
Wetland roofs (WR) are multi-functional green roofs in combination with a water storage mat serving as a CW, where different marsh plant species (helophytes) are grown on the entire surface of a roof [31,32,33]. They are specially designed as a shallow horizontal subsurface flow CW without conventional substrate on a roof, thus saving weight and additional costs and helping to limit problems like nuisance odors and infectious diseases [34]. These special forms and adapted constructions of extensive roof greenery can also be used for GW treatment [32,33,35,36]. Hence, the WRs can be a potential solution as they inherit the benefits of both green roofs and shallow-bed CWs to solve growing problems in urban city landscapes such as urban heat islands, flood management, green coverage, and domestic GW or wastewater treatment [37]. WRs can be constructed on available roof surfaces so that the area used does not compete with other uses [38]. WR plant species are preferred to be perennials such that they are capable of regeneration in each season without the need for replanting, are easy to grow, can thrive in harsh climatic conditions, possess the ability to treat wastewater, offer aesthetics, are locally available, and can be purchased at a low cost [36,39]. A potential difference from a normal green roof is that the WRs may need to be watered on a daily basis. A pilot plant study by Zehnsdorf et al. [40] showed that a helophyte mat is capable of treating GW at hydraulic loading rates (HLRs) up to 15 L m–2 d–1. In a review of existing case studies, Boano et al. [11] also suggested hydraulic design criteria and the application of new integrated NBS (such as green roofs and green walls) for GW treatment and reuse. However, the literature lacks a critical and independent investigation of shallow-bed CWs of innovative designs like constructed WR, and little attention has been paid until now to investigating such WR systems for on-site treatment of domestic GW under different HLRs and climatic conditions.
The aim of this study was to close the described research gap and investigate decentralized GW treatment by using an innovative WR system under real-world conditions. To do so, a specially designed pilot wetland roof (PWR) segment was constructed for treating domestic GW generated from a single-family residential house and operated at different HLRs (low to high) under outdoor conditions. The main objectives of this study were, (i) to assess the treatment performance of a PWR system when treating domestic GW, and compare the effluent water quality with the regulatory requirements for discharge or agricultural reuse standards, (ii) to evaluate the influence of different HLRs on GW treatment performance, (iii) to investigate the evapotranspiration (EVT) on hot summer days, and (iv) to assess plant vitality on the PWR surface in different seasons of the year. The results of such a study on the PWR system demonstrate the possibilities to upscale and implement the technology for domestic GW treatment and reuse within urban settlements for urban water management practices. To the best of our knowledge, this is the first study on WR showing the system boundaries and possibilities over two annual cycles.

2. Materials and Methods

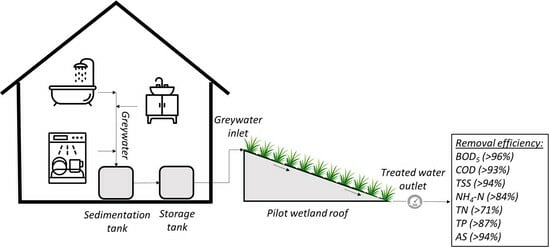
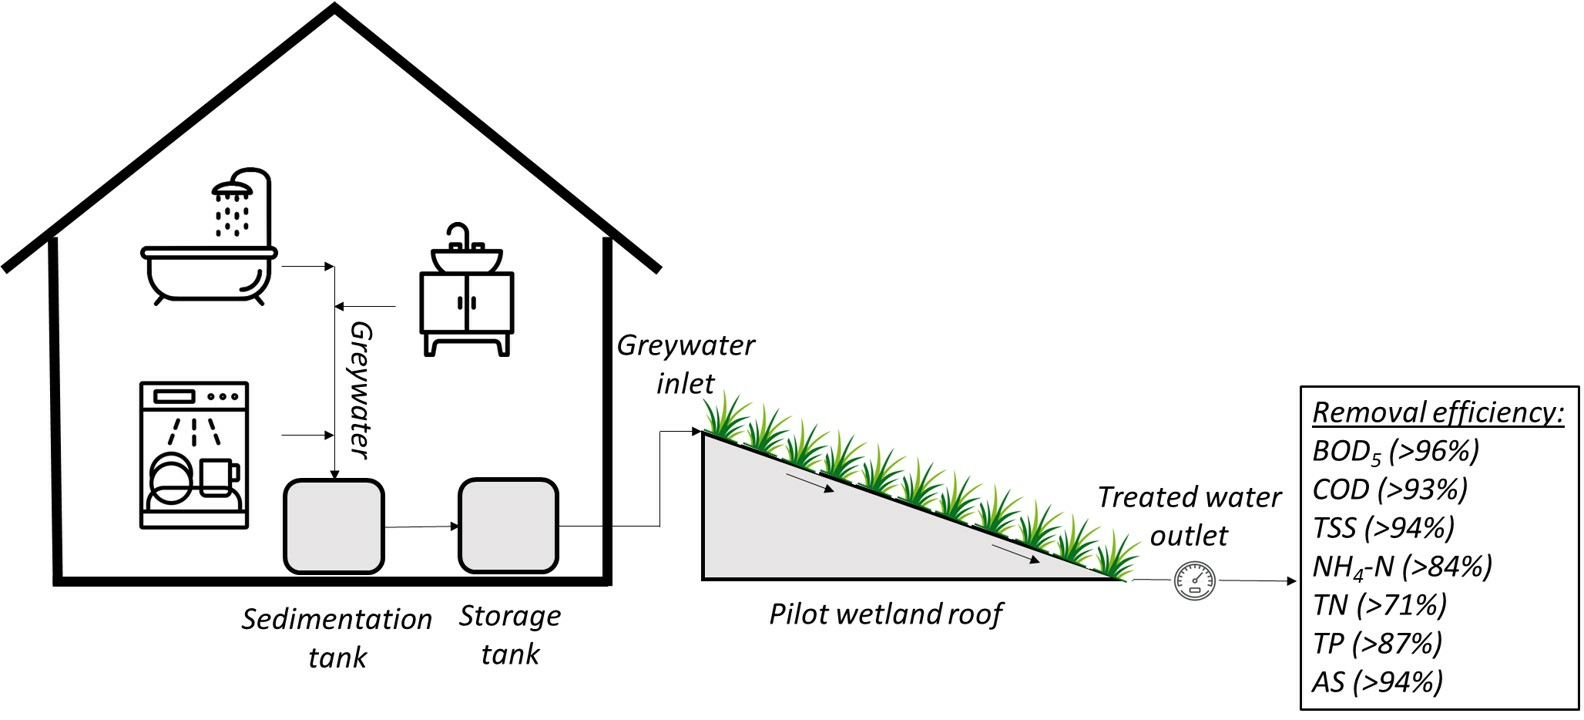
2.1. Experimental Set-Up: Pilot-Scale Plant

To make the experimental operation, sampling, and monitoring easier, the study was not conducted on a real roof. Instead, a close-to-realistic experimental set-up with a strip of wooden structure was used at ground level in a house backyard. The orientation of the wooden structure ensured an even distribution of the targeted GW flow from the inlet to the outlet across the entire width.
The diagram of the pilot-scale GW treatment plant structure and its flow direction from inlet to outlet are shown in Figure 1 and also in the graphical abstract.
The PWR had a wooden structure with a floor area of 3.60 m × 1.30 m and a slope of 15°. The wooden construction was covered with a geotextile (300 g m–2, bausep, Limbach, Germany) and a 1 mm thick PVC liner (Heissner, Lauterbach, Germany). A commercially available two-layer, non-rotting water storage and protection mat (WSM 150, ZinCo, Nürtingen, Germany) made of recycled synthetic fibers was used as an anchoring base for the marsh plant root growth and as a water reservoir. When unplanted, the 17-mm thick and 1 m wide mat had a water storage capacity of 12 L m–2. Four segments of the same size with a total area of 4.38 m2 (3.65 m × 1.20 m) were placed on the PVC liner. No additional substrate was used in this system.
The mat was planted with the following wetland plant species: 18 × Marsh Sedge (Carex acutiformis EHRH.), 4 × Acute sedge (Carex acuta L.), 4 × Common rush (Juncus effusus L.), 4 × Hard rush (Juncus inflexus L.), 4 × Purple loosestrife (Lythrum salicaria L.), 2 × Marsh marigold (Caltha palustris L.), 2 × Water dock (Rumex hydrolaphatum HUDS.), 2 × Water mint (Mentha aquatica L.) and 4 × Iris (Iris ssp.). The plants were bought from a nursery and placed directly on the water storage mat with their root balls. The mat was kept moist by loading it with domestic GW, which was also the source of the necessary nutrient supply for the plants [33]. During the subsequent three months, the wetland plants rooted on the mat and filled almost the entire surface. The progress of plant growth during the first three months at four segments A, B, C, and D (where A is the top and D is the bottom segment) is also shown in Figure 1. The dominant plant turned out to be the water mint, which inclines to overgrow. In the subsequent years, some additional plant species, such as common nettle (Urtica dioica L.) and plumeless thistle (Carduus acanthoides L.) appeared on the plant mat due to the wind transfer of their seeds.
The GW used in this study was produced in the kitchen and bathroom of a family of four (4 PE) in Leipzig, Germany. By bypassing the house sewage system, it was possible to obtain GW from the household for the long-term experiment. The domestic GW was collected in a sedimentation tank (150 L) followed by a storage tank (56 L), from which it was continuously loaded and evenly distributed over the entire width on top of the pilot-scale GW treatment plant (Figure 1). HLR was set up to values from 10 to 109 L m–2 d–1 by using a peristaltic pump (ISMATEC® ecoline, Ismatec SA Labortechnik-Analytik, Glattbrugg, Switzerland). The inflow rate was estimated by manually measuring the volume per minute prior to sampling, and the outflow rate was measured by using a tipping counter with a 100-mL-tilting tray (Umweltanalytische Produkte GmbH, Ibbenbüren, Germany). For the winter operation, the pipes were insulated and equipped with a heating cable (5 W m–1, A. Rak Wärmetechnik GmbH, Frankfurt, Germany). The loading was only interrupted by day temperatures below 0 °C and night temperatures below −4 °C, and at times of GW shortage. During vacation times, the water was recirculated in order to keep the plant mat moist. The duration of the investigation was 24 months under outdoor conditions, from April 2021 to April 2023.

2.2. Sampling and Water Quality Analysis

The treatment performance was monitored by collecting GW samples from the inlet (storage tank) and outlet of the PWR system on a weekly basis during the investigation period of two years and analyzed them in the laboratory (after a maximum storage time of 24 h at low temperatures) for the following parameters: pH (pH electrode Sentix® with gel electrolyte, WTW, Weilheim, Germany), redox potential (Eh) (SenTix® ORP, WTW), dissolved oxygen (DO) (ConOx®, WTW), electrical conductivity (ConOx®, WTW), five-day biochemical oxygen demand (BOD5) (DIN 38409 H52, WTW OxiTOP®), chemical oxygen demand (COD) (TNTplusTM 821/822, HR 20–1500 mg L–1 COD, HACH®), ammonium-nitrogen (NH4-N) [41], nitrate-nitrogen (NO3-N) [42], total nitrogen (TN) (TNTplus™ Vial Test TNT828, UHR 20-100 mg L–1 N, HACH®), total phosphorous (TP) [43], total suspended solids (TSS) (using vacuum filtration unit) and anionic surfactants (AS) (using a modified method discussed below). The spectrophotometer DR 2800 (Hach Lange, Duesseldorf, Germany) was used for standard water quality analysis. E. coli within the collected samples were also analyzed [44], Colilert-18 Quanti-TrayTM method (IDEXX, Westbrook, ME, USA)) to investigate the treatment performance of the technology and to assess the requirements for process optimization.
The removal efficiency of chemical parameters was calculated as mass reduction using Equation (1).
Removal   efficiency   ( % ) = ( c i n · F i n c o u t · F o u t ) c i n · F i n × 100
where cin is the concentration of the analyte in the influent [mg L–1], Fin is the inflow rate [L min–1], cout is the concentration of the analyte in the effluent, and Fout is the outflow rate [L min–1]. The difference between the inflow mass loading rate [g m–2 d–1] and outflow rate [g m–2 d–1] was calculated as the mass removal rate [g m–2 d–1] of the pollutants.
The assessment of AS started in January 2022. The AS concentrations were determined by using a modified analytical procedure according to the methylene blue active substances (MBAS) standard method [45]. In detail, 5 mL of filtrated inflow sample were mixed with 1.5 mL of methylene blue solution at 0.06 g L–1. To extract the ionic pairs formed by methylene blue and AS in the GW, 1 mL of dichloromethane (DCM) was used. After triplicate extraction, the extracted solvent was removed to a new vial, and another triplicate extraction by 0.8 mL DCM after the addition of 5 mL of washing solution was performed afterwards. The extracted solution was filled in a 5 mL volumetric flask and measured with a UV spectrophotometer at 650 nm. The workup of the samples from outflow was performed slightly differently by using 20 mL of filtrated outflow water and 2.5 mL of methylene blue solution; the follow-up of the other steps was the same. The calibration was carried out by using sodium dodecylbenzenesulfonate (SDBS) and adjusted to the surfactant concentration levels of the two sources of samples. The AS concentrations in the samples were calculated as SDBS equivalents. The removal of AS was also calculated according to the differences in AS mass between inflow and outflow (Equation (1)).
A weather station (Model PCE-FWS 20N, PCE Holding GmbH, Meschede, Germany) in front of the PWR was used to record the atmospheric air temperature (°C) and stormwater amount (mm).

2.3. Evapotranspiration

Evapotranspiration (EVT) was estimated as runoff reduction on seven hot days with a maximum air temperature of over 25 °C during the summer of 2022. The runoff reduction was calculated according to Equation (2).
RR = ( F i n F o u t ) F i n × 100  
where RR is the runoff reduction [%], Fin is the inflow rate [mL min–1] and Fout is the outflow rate [mL min–1].

2.4. Estimation of Plant Vitality

The vitality of the marsh plants was observed by measuring the mean chlorophyll content (UGT SPAD-502Plus Chlorophyll Meter, Konica Minolta Optics, Inc., Tokyo, Japan), stomatal conductance (SC-1 leaf porometer, Meter Group, Inc., Pullman, WA, USA), and plant height (in cm) of a total of 23 plants of C. acutiformis at four segments (A, B, C, and D; see Figure 1 for an overview) of the PWR in various seasons (summer, autumn, and spring) during two years of investigation in this study.

2.5. Statistical Analysis

The experiment results were statistically evaluated using the Microsoft Excel 2013 software (Product name and activation status: Microsoft Office Professional Plus 2013; Version: Microsoft® Excel® 2013 (15.0.5571.1000) MSO (15.0.5571.1000) 32-bit) package in this study. Differences between the pollutants mean values at the inflow and outflow as well as comparisons of mean removal rates under various HLRs were performed using a one-way analysis of variance (ANOVA) test with a 95% significance level of difference. The differences were considered statistically significant at p < 0.05.

3. Results and Discussion

3.1. Overall Treatment Performance of the PWR System

Mean concentrations of different physico-chemical parameters and microbial qualities at the inlet and outlet of the PWR system during the whole study and comparison with the recommended limit values for discharge and reclaimed water quality requirements for agricultural irrigation are shown in Table 1.
The mean mass loading rate of the pollutants, removal rate, and removal efficiencies are also shown in Table 2. The results achieved during the experimental operation period of two years are discussed in the following sections.

3.1.1. Measurement of pH, Eh, DO, and EC
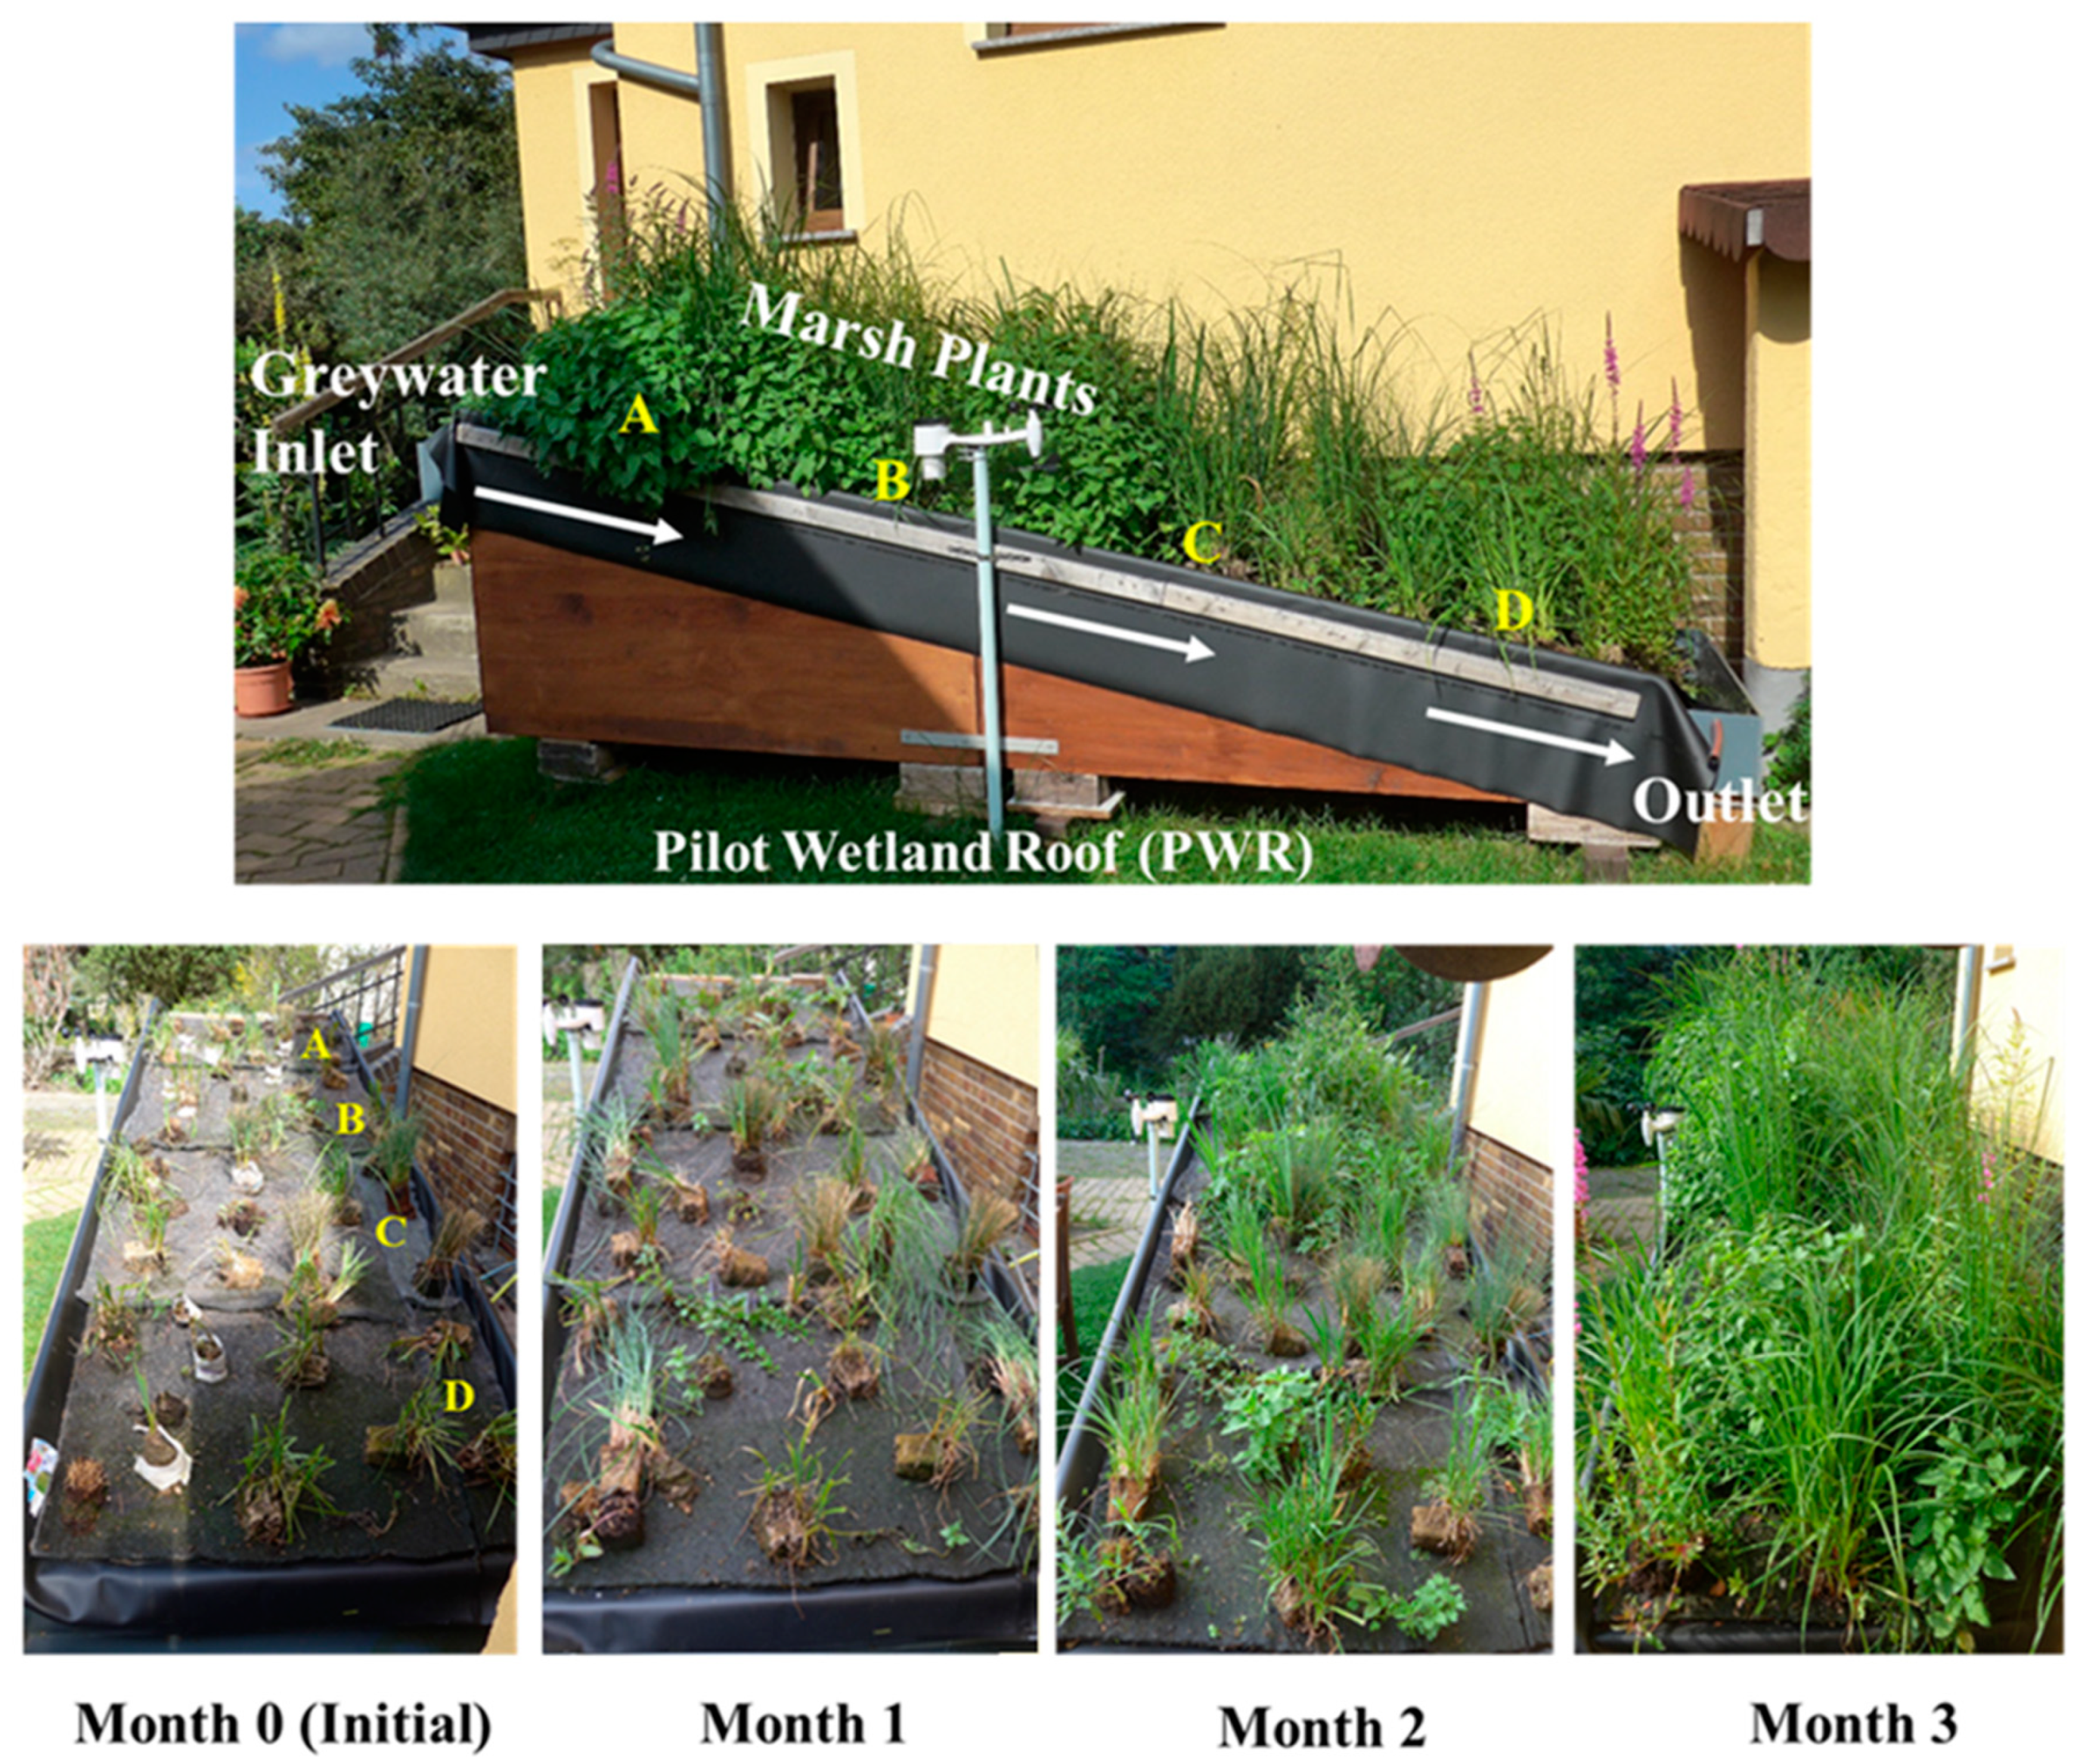
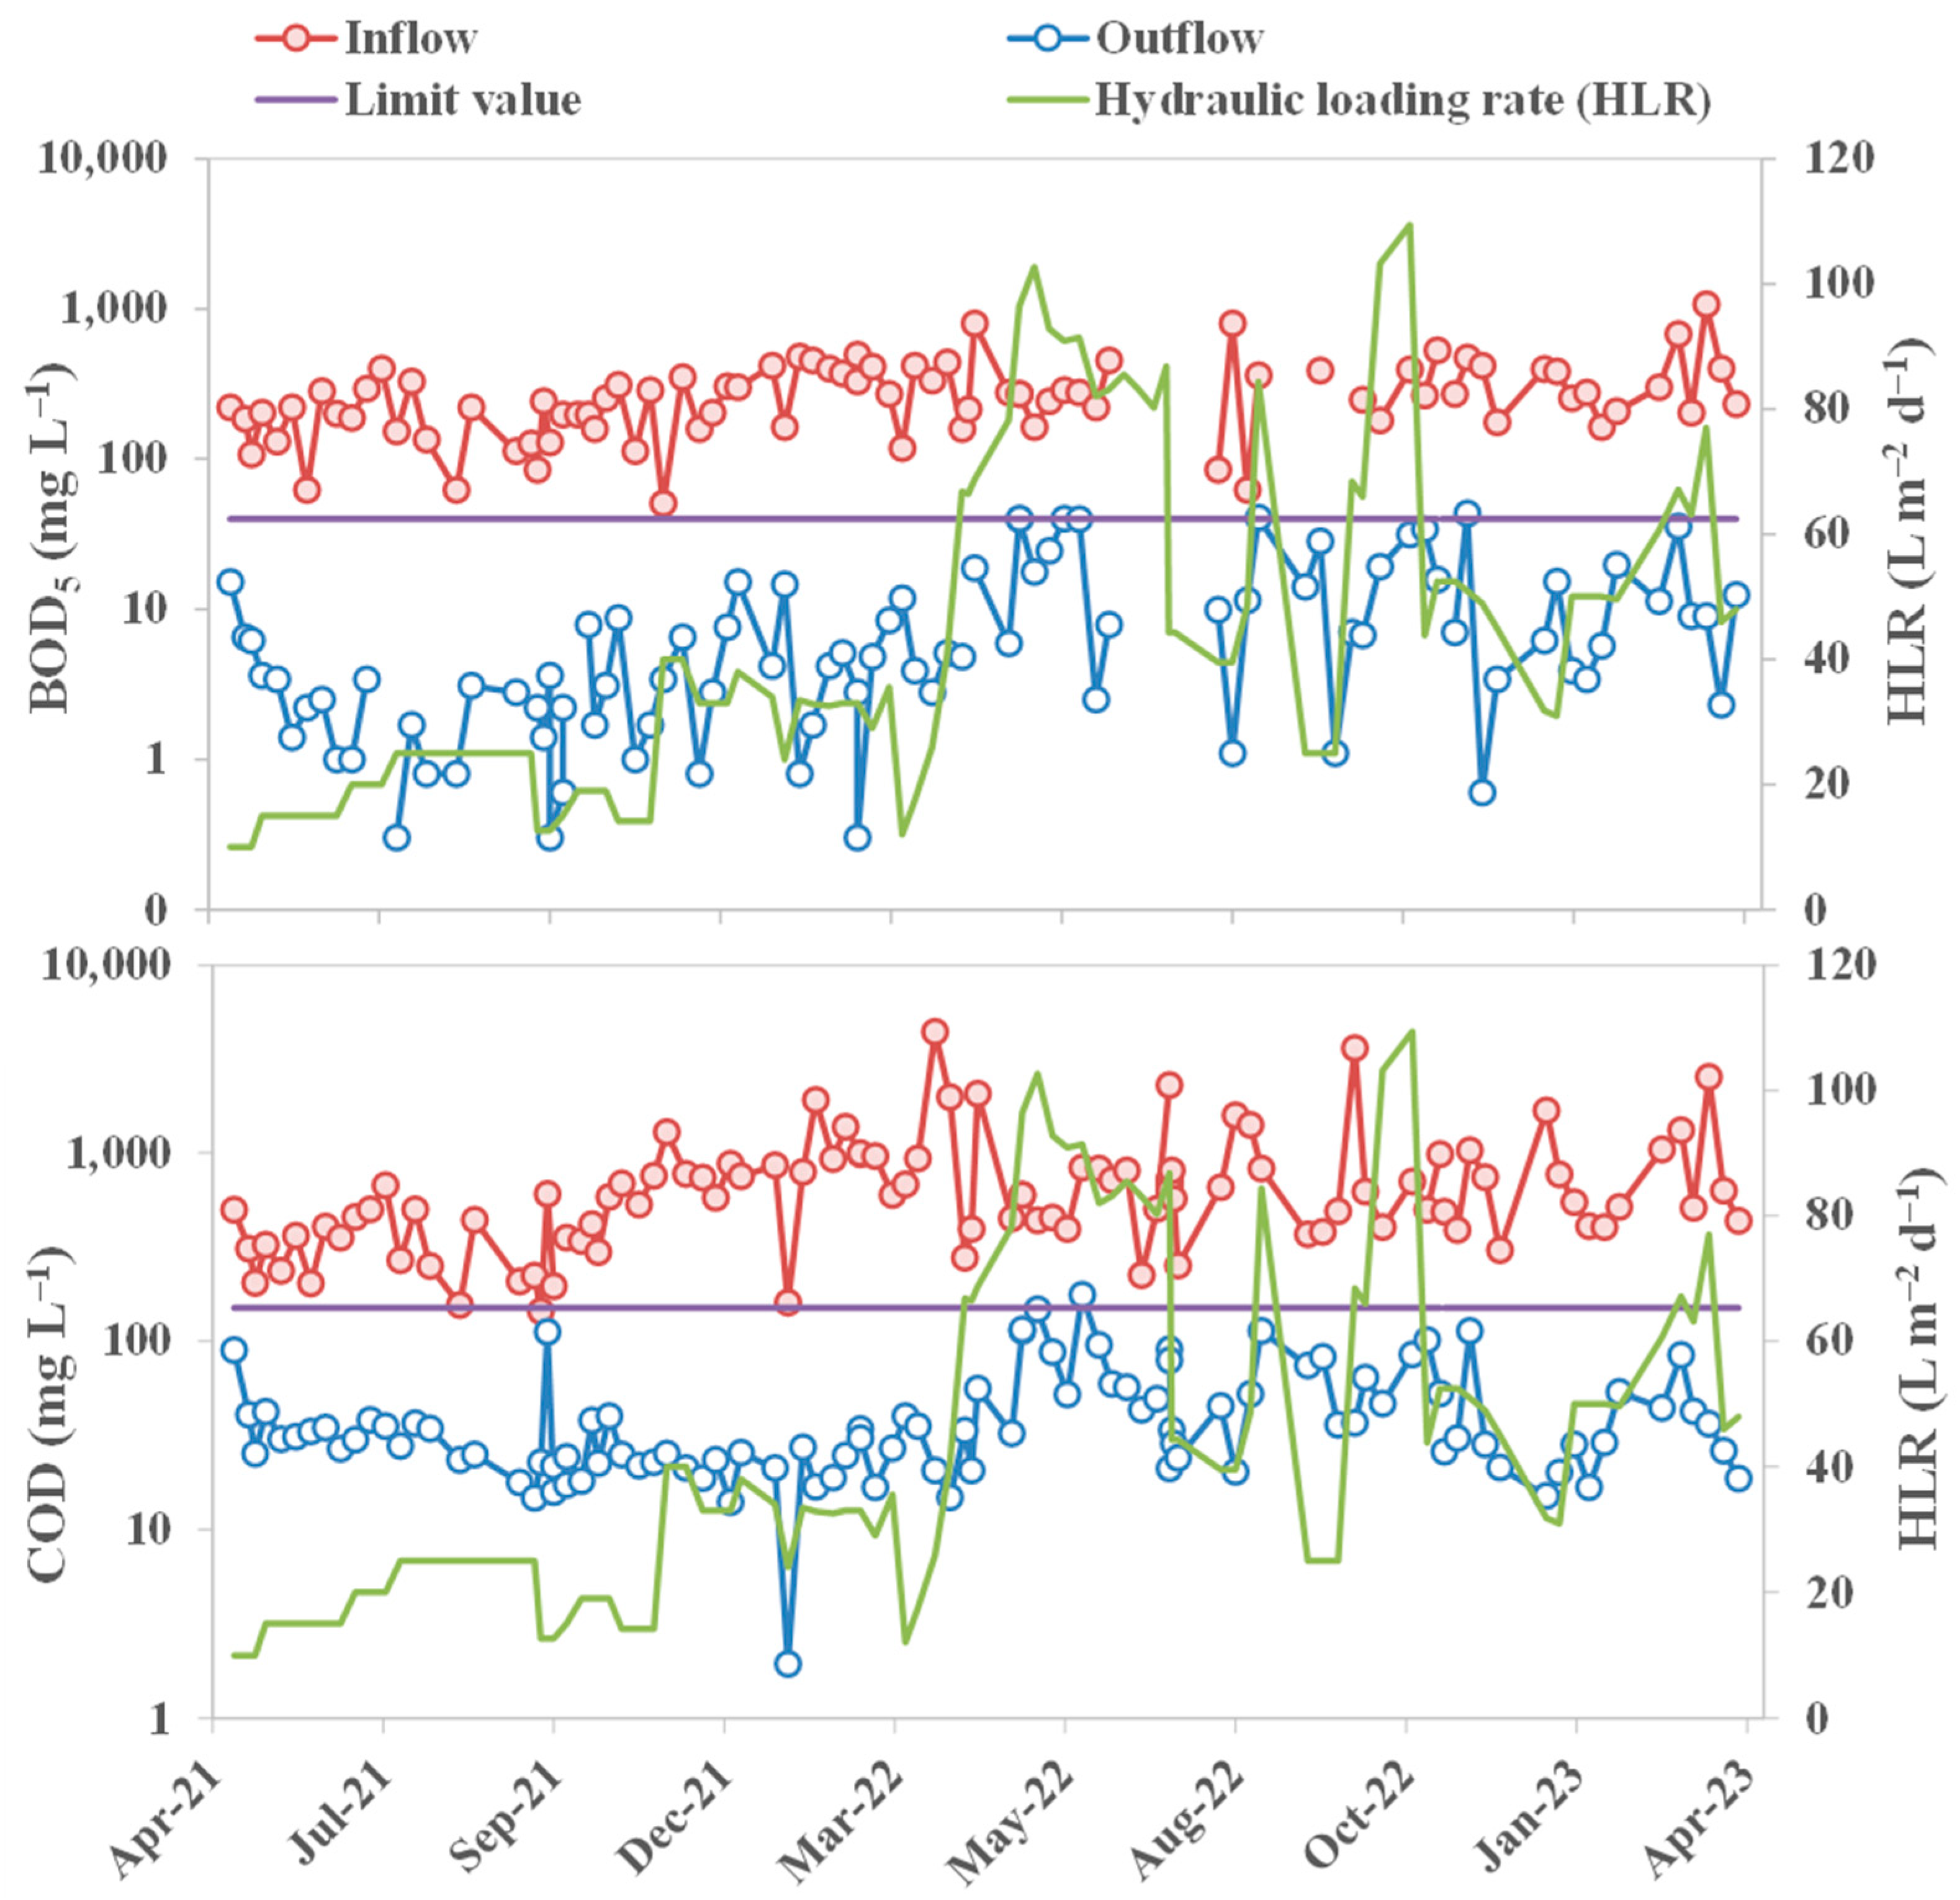
The results indicated significant changes (p < 0.05) in mean pH, Eh values, and DO concentrations from the inflow to the outflow of the PWR system. The pH of the inflow GW was recorded in the range of 5.8–7.5 with a mean value of 7.0 ± 0.4 throughout the study. A slightly higher pH in the range of 7.2–8.3 with a mean value of 7.7 ± 0.2 at the outflow was observed (Table 1). The system showed a stable pH at the outlet, even with the changing of HLRs throughout the study period.
Low Eh in the inflow GW in the range of −325 mV to −56 mV with a mean value of −246 ± 50 mV and an increasing tendency in the outflow with a mean value of 147 ± 43 mV were recorded. A general trend of increasing Eh from the inlet to the outlet during the experimental operation suggested that aerobic conditions prevailed within the PWR system. The increased redox potential at the PWR outlet was potentially due to the influence of marsh plant roots and a decrease in organic load [44].
Low DO in a range of 0.06–2.76 mg L–1 with a mean concentration of 0.8 ± 0.7 mg L–1 was recorded in the inflow GW in this study. DO concentrations increased substantially in the range of 2.71–16.95 mg L–1 in the outflow, with a mean DO concentration of 10.4 ± 3.2 mg L–1. High DO at the outlet clearly indicated an abundance of oxygen within the PWR system, hence favoring redox conditions for the oxidation of the GW pollutants.
The results recorded for EC, a common indicator of salinity, did not show any significant changes (p > 0.05) in the inflow and outflow samples throughout the study. Mean EC values in the inflow and outflow of the PWR system were recorded as 1054 ± 276 µS cm−1 and 1034 ± 239 µS cm−1, respectively.

3.1.2. BOD5 and COD

The dynamics of the BOD5 and COD concentrations observed in the inflow and outflow of the PWR system feeding with domestic GW under different HLRs and comparison with allowable limit values for discharge are shown in Figure 2.
The results of this study showed that both BOD5 and COD concentration dynamics in the outflow were fluctuating under different HLRs. However, the overall mean BOD5 concentration of 285 ± 169 mg L–1 in the inflow was decreased to a mean concentration of 9.0 ± 11 mg L–1 in the outflow. As compared to the inflow, a significant reduction (p < 0.05) of BOD5 concentration in the outflow was observed. BOD5 concentrations in the outflow met the discharge Class C guideline value of 40 mg L–1 according to DWA-A 221 [46], except for two measurements with values of 40.7 and 43.5 mg L–1. With the European Union’s (EU) water reuse directive [47], clear guidelines for the safe reuse of reclaimed water for agricultural irrigation are also provided (Table 1). The EU recommended Class A water quality (10 mg L–1) for agricultural reuse was met only in 75% of measured concentrations. In terms of BOD5 mass removal, overall mean BOD5 loading of 12.8 ± 12 g m–2 d–1 in the inlet and 0.5 ± 0.8 g m–2 d–1 in the outlet resulted in a highly efficient BOD5 mass removal efficiency (>96%) with a mean BOD5 mass removal rate of 11.8 ± 12 g m–2 d–1 from the system (Table 2).
Inflow COD concentrations with a mean value of 744 ± 653 mg L–1 also significantly reduced (p < 0.05) to a mean concentration of 42 ± 31 mg L–1 in the outflow. The outflow mean COD concentration was in compliance with the discharge Class C value of 150 mg L–1 for COD according to DWA-A 221 [46]. Standard values of COD in reclaimed water for agricultural irrigation purposes are still not provided or suggested by the EU (Table 1). Similar to BOD5, the dynamics of COD in the outflow showed higher fluctuations, potentially due to an increase in HLRs, and only one time the concentration (176 mg L–1) crossed over the COD limit value for discharge when applied HLR was at 91 L m–2 d–1 (Figure 2). In terms of mass removal, an overall mean COD loading of 36 ± 41 g m–2 d–1 in the inlet resulted in highly efficient COD mass removal (>93%) with a mean COD mass removal rate of 33.4 ± 39 g m–2 d–1 from the system (Table 2). Previous studies with other CW system for household GW treatment (without kitchen sink fraction) suggested that an inflow COD loading within 30–40 g m–2 d–1 can be applied to ensure >80% COD removal and that the system can cope with a HLR of 120 L m–2 d–1 without compromising the effluent quality [48]. An inflow COD mass loading of ≤20 g m–2 d–1 is described as the limiting load for vertical soil filters with a depth of 80–100 cm [49], whereas the PWR system with only a few cm filter thickness successfully showed a higher COD inflow mass loading rate in this study.
High availability of DO within the PWR system potentially facilitated aerobic biodegradation of organic matter and thereby a high removal efficiency and improved water quality as the outflow mean concentrations of both BOD5 and COD met the limit values for discharge or non-potable reuse of reclaimed water in this study [24,50]. Gross [51] investigated the performance of a horizontal-flow CW for GW treatment and observed that the effluent water quality improved if there was a pre-treatment of the GW. This might also be the case in this investigation, as a sedimentation tank and a storage tank were used as pre-treatments for the domestic GW before feeding to the PWR system.

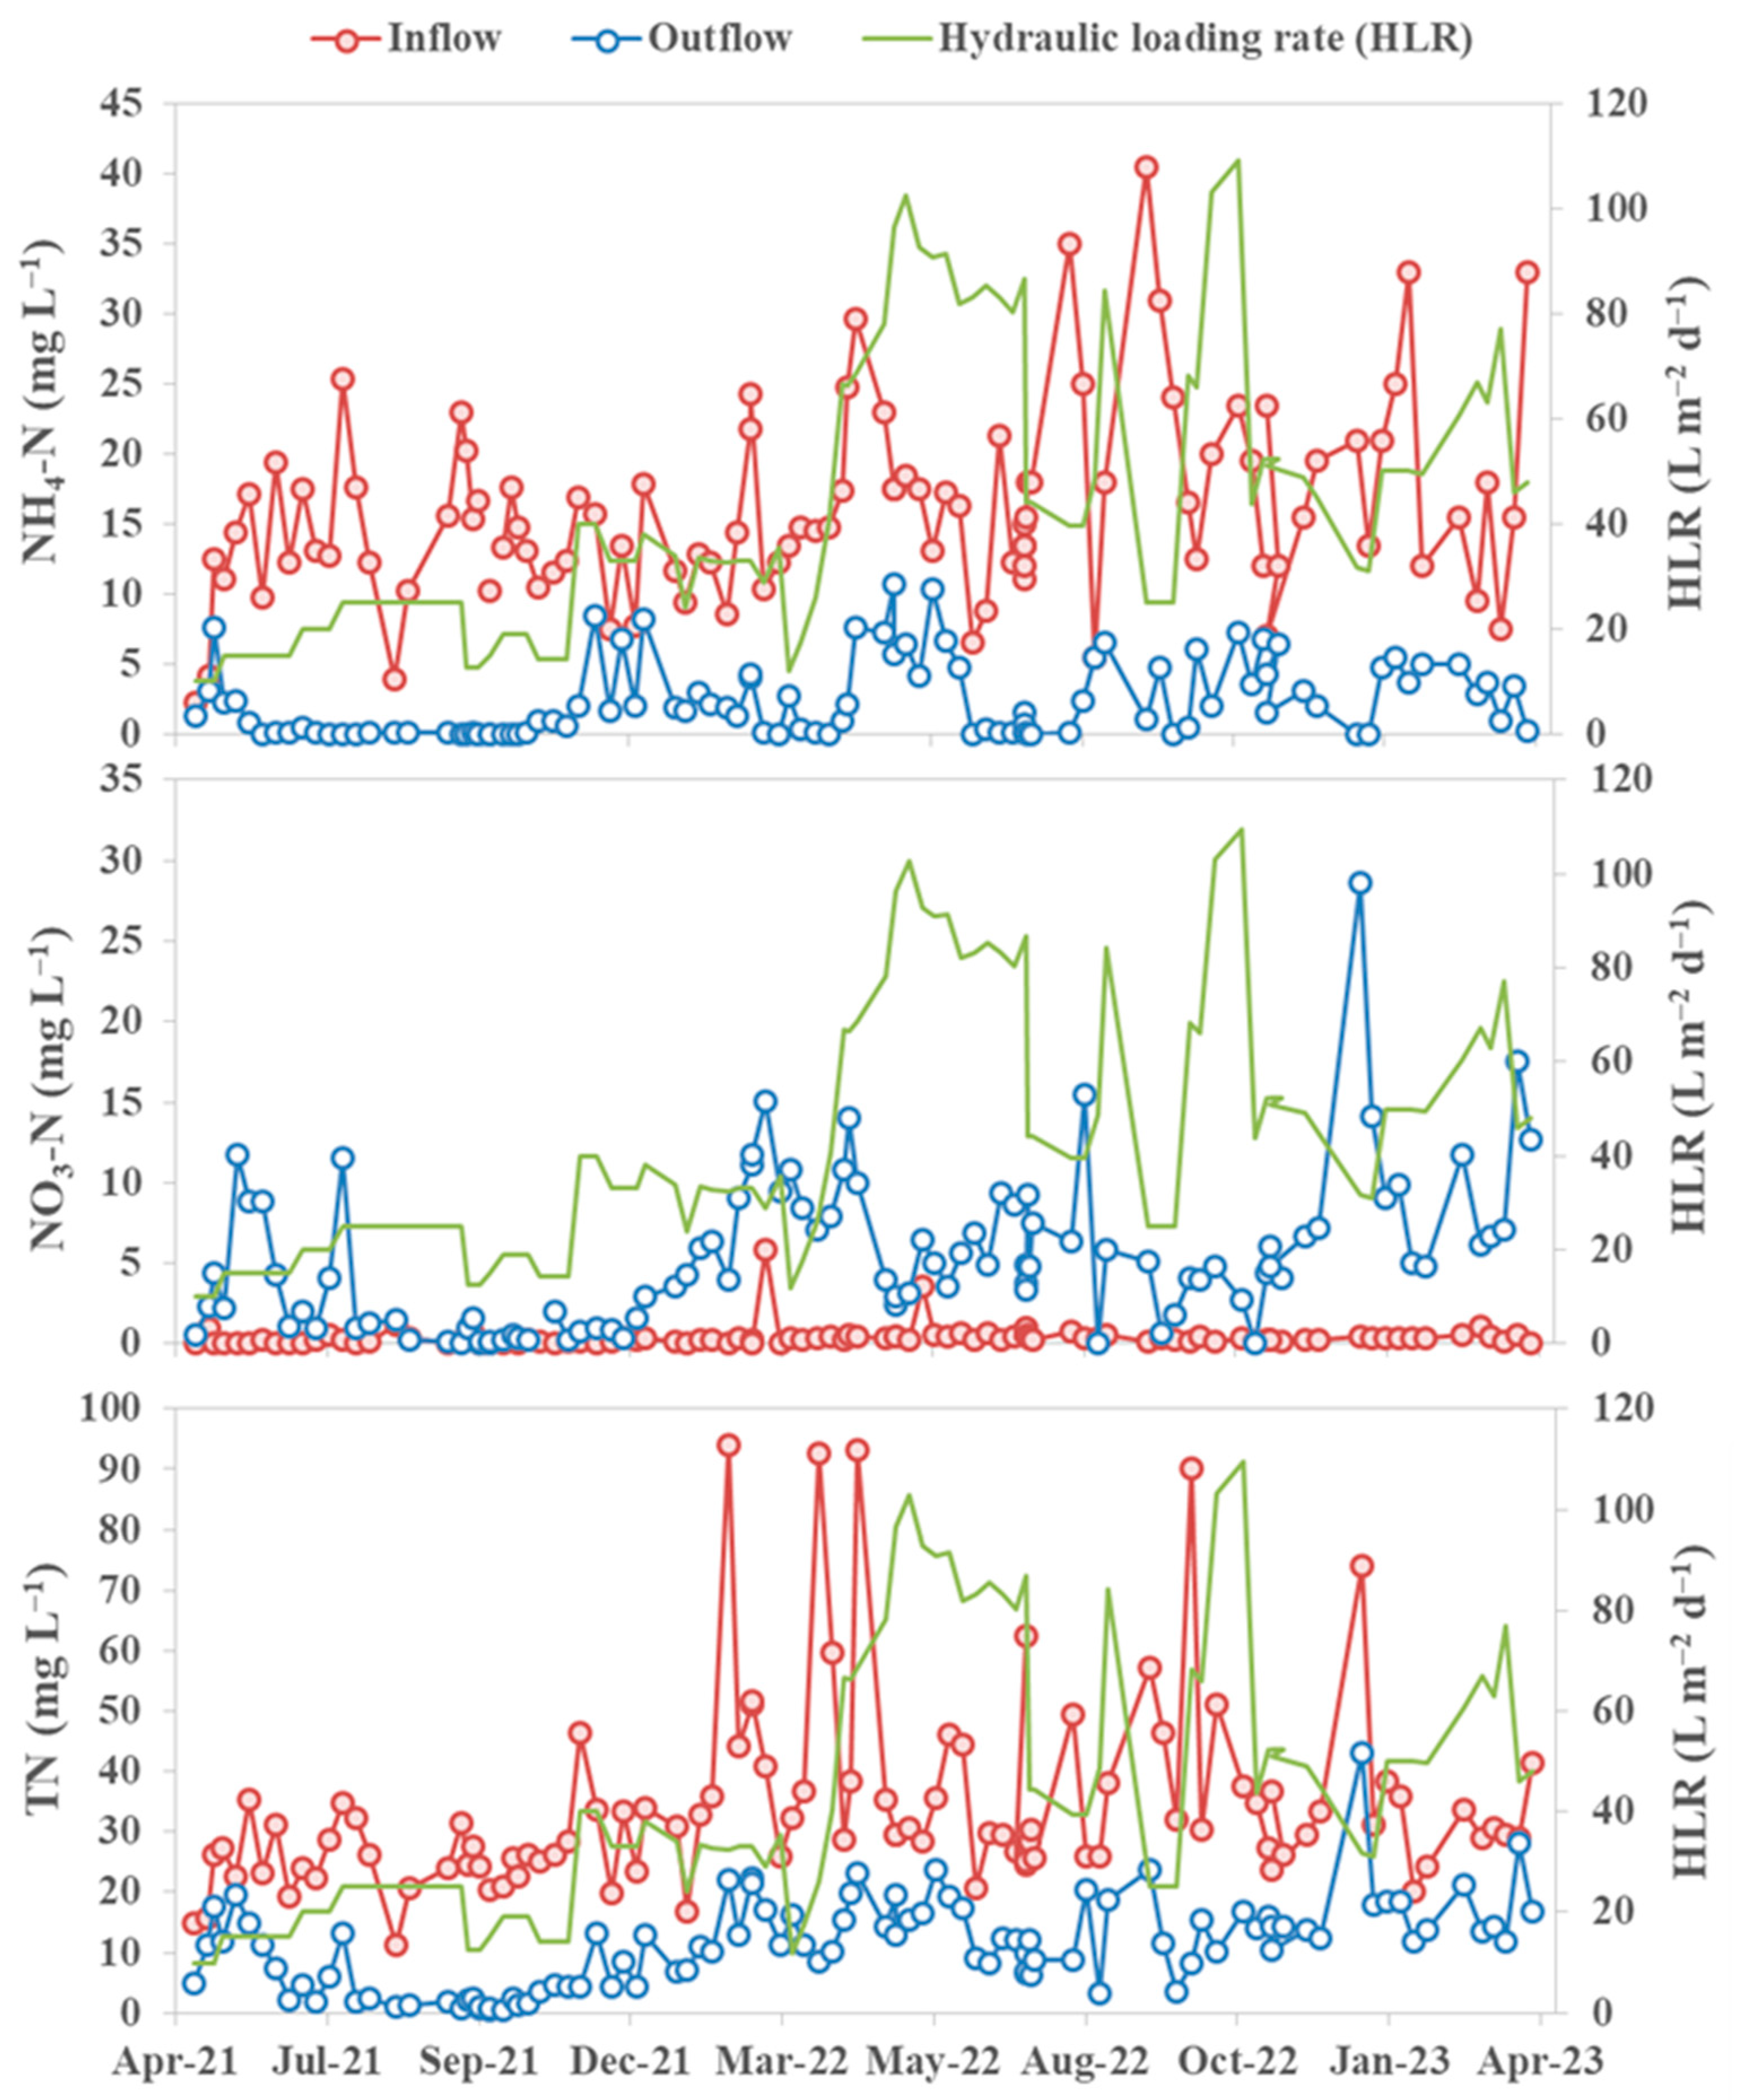
3.1.3. NH4-N, NO3-N and TN

Figure 3 shows the dynamics of NH4-N, NO3-N, and TN concentrations in the inflow and outflow of the PWR system under different HLRs.
Highly fluctuating inflow concentration dynamics and the changes in HLRs resulted in a fluctuating concentration of both NH4-N and TN in the outflow. An efficient removal of NH4-N was observed throughout the whole study. Overall, the mean inflow NH4-N concentration of 16 ± 7 mg L–1 significantly reduced (p < 0.05) to a mean concentration of 2.4 ± 2.7 mg L–1 in the outflow (Table 1). From a mean NH4-N mass loading of 0.73 ± 0.55 g m–2 d–1 in the inlet, a mean mass removal rate of 0.59 ± 0.49 g m–2 d–1 with a NH4-N mass removal efficiency of >84% was observed.
A highly fluctuating NO3-N concentration in the outflow dynamics with a mean value of 5.3 ± 4.7 mg L–1 was analyzed (Table 1). Relatively high DO mean concentration (10.4 ± 3.2 mg L–1) at the outlet presumably contributed to high nitrification or NO3-N production in this study. High DO content within the system might be due to the roots of the wetland plants that were providing oxygen to the root near the environment of the rhizosphere [52] and thereby potentially enhanced aerobic processes for nitrification and high organic matter removal in this study.
For TN, the mean concentration of 34 ± 16 mg L–1 in the inflow and 11 ± 7 mg L–1 in the outflow were analyzed. Overall, a mean TN mass removal rate of 1.10 ± 1.05 g m–2 d–1 resulted in a TN mass removal efficiency of 71% (Table 2). Colliver and Stephenson [53] showed that the presence of high oxygen content inhibits synthesis and activity of denitrification enzymes. The results with a high DO within the PWR system indicated a low denitrification process, and thereby less TN removal was observed in this study. Kitchen wastes are the primary source of nitrogen in GW and range between 4 and 74 mg L–1 [54]. Inflow TN concentrations in the domestic GW used in this study were relatively high and varied in the range between 11 and 94 mg L–1.

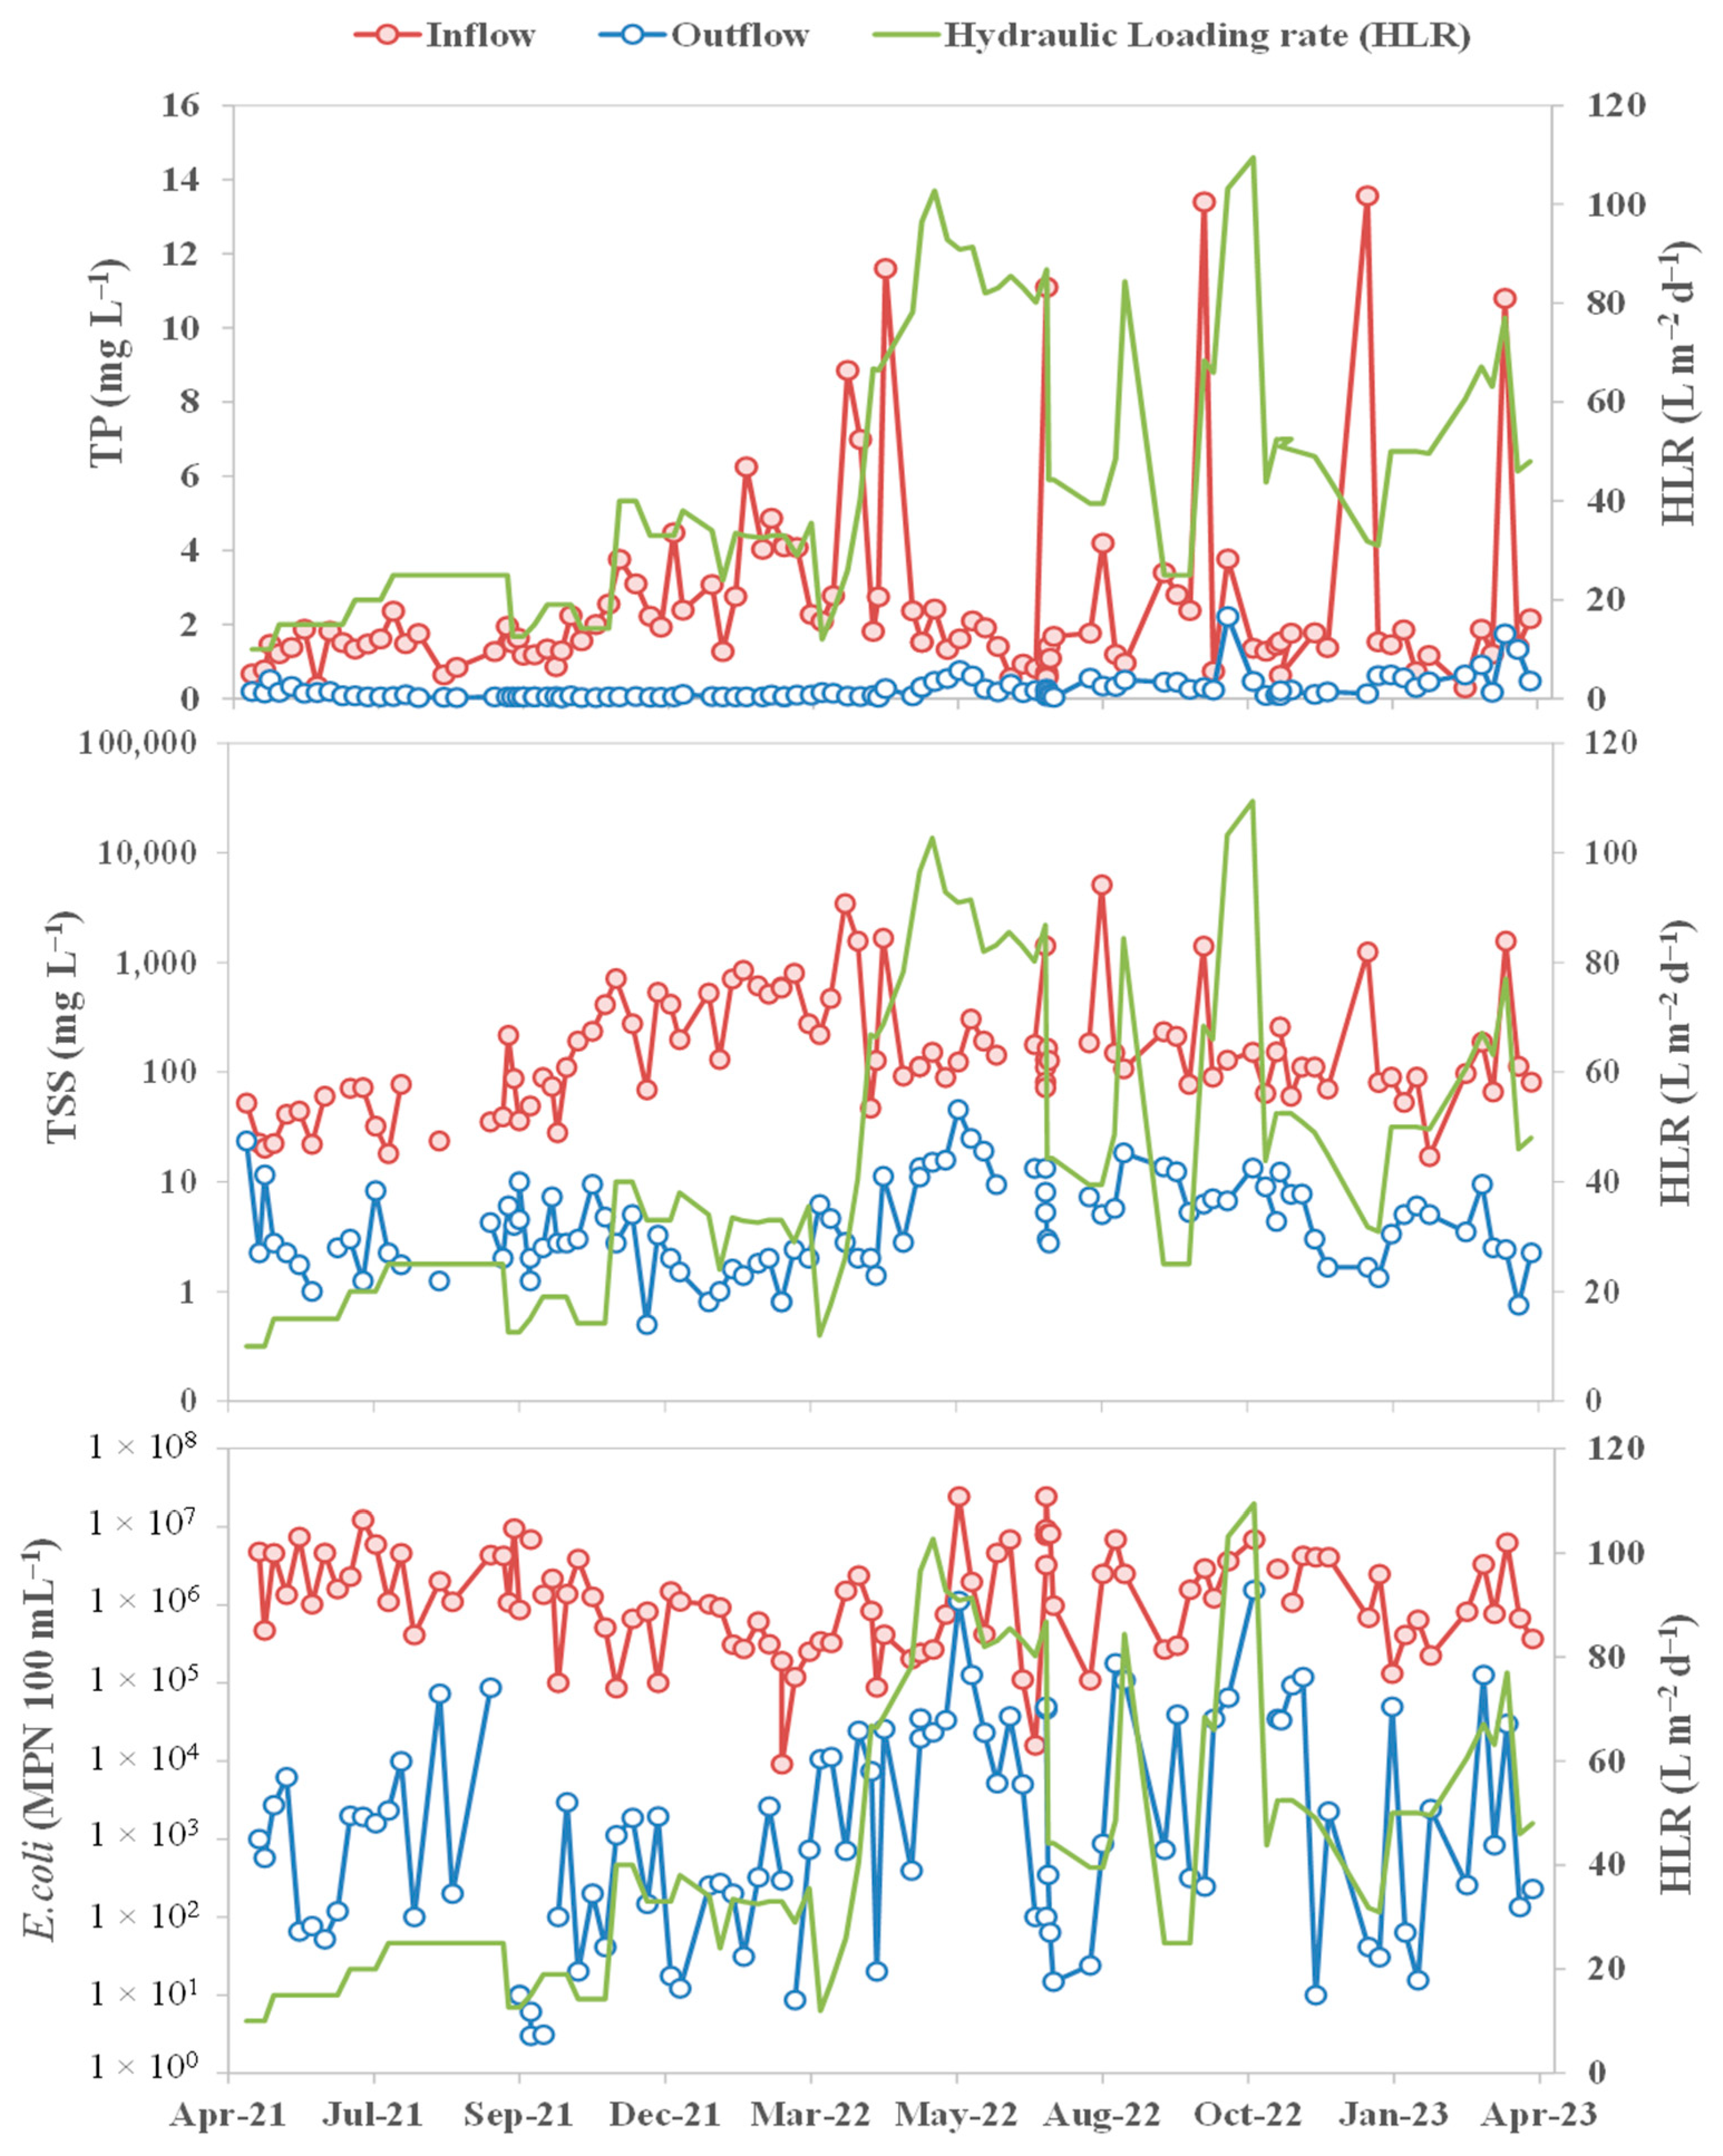
3.1.4. TP, TSS, and E. coli
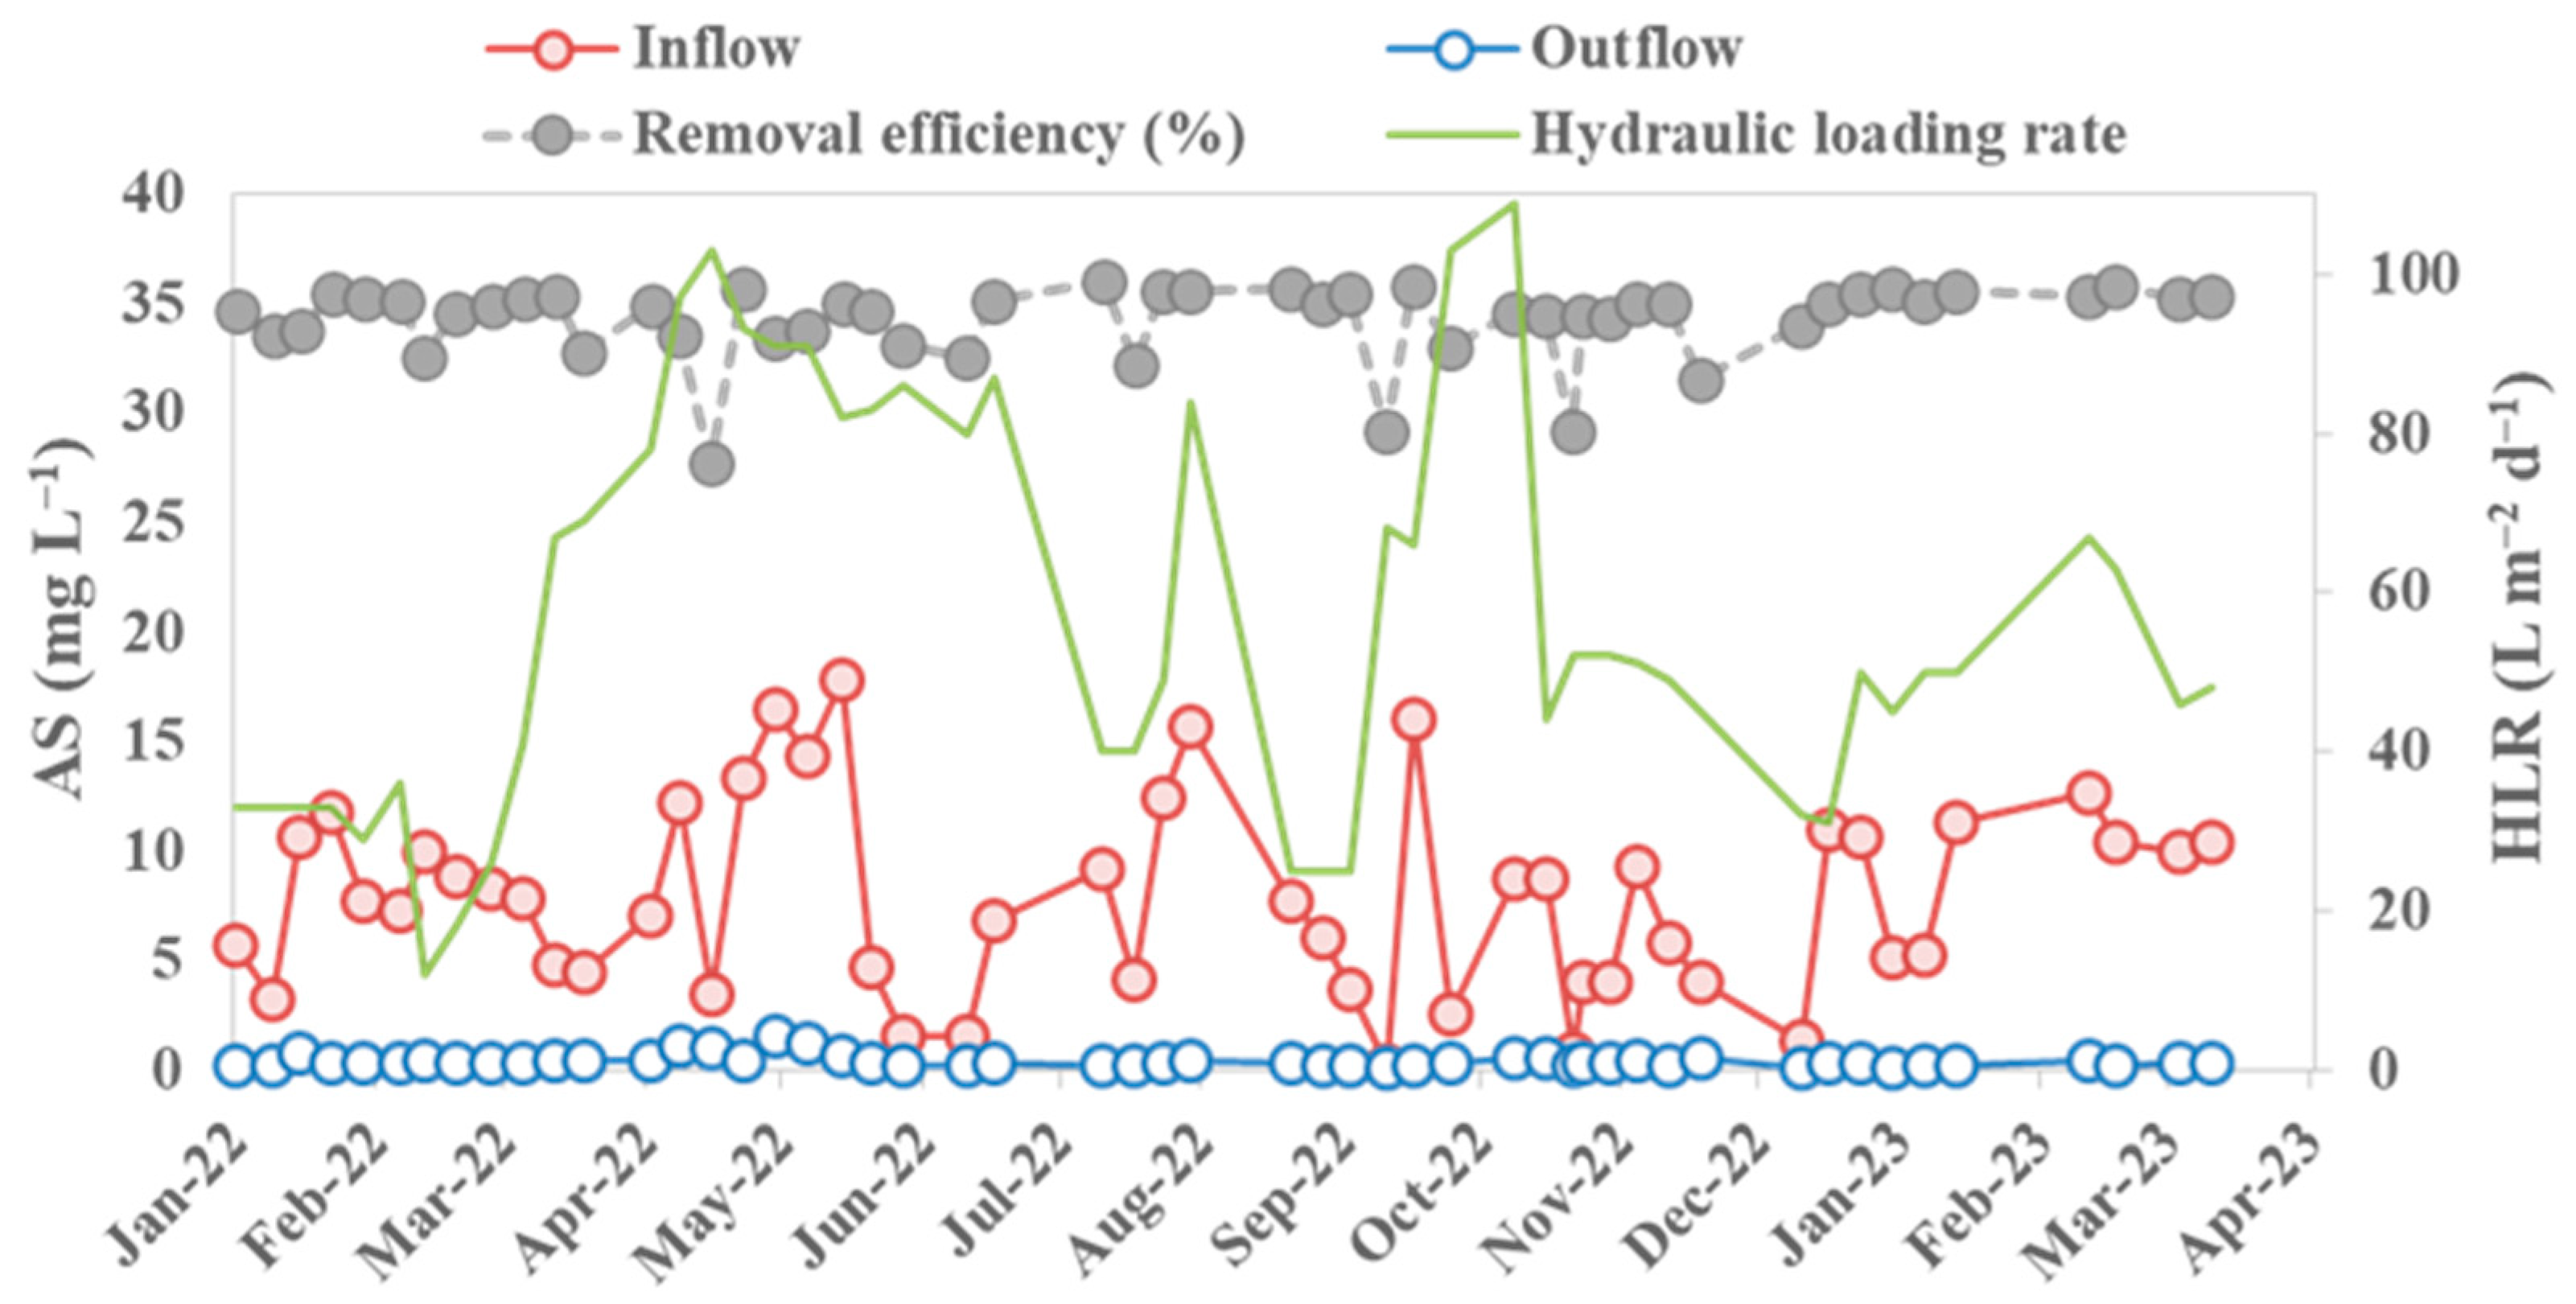
In the present study, the dynamics of TP at the outflow showed nearly no fluctuations as compared to the highly fluctuating TP concentrations at the inflow (Figure 4).
Overall, mean TP concentrations in the inflow and outflow were analyzed as 2.5 ± 2.6 mg L–1 and 0.24 ± 0.33 mg L–1, respectively (Table 1). In terms of mass removal, a mean TP mass removal rate of 0.10 ± 0.15 g m–2 d–1 with a high removal efficiency of >87% was observed (Table 2). Probable TP removal pathways might be dense marsh plant uptake and adsorption in this study. Washing detergents, due to the high fraction of laundry activities, are the primary source of phosphates found in GW and range between 4 and 14 mg L–1 [54]. TP concentrations in the domestic GW inflow in this study were relatively low and varied in the range between 0.3 and 13.6 mg L–1.
The dynamics of TSS concentration in the outflow showed a fluctuating trend, which was potentially due to high variations in the inflow concentrations and higher HLR application (Figure 4). The mean inflow TSS concentration of 344 ± 687 mg L–1 decreased down to a mean concentration of 6.0 ± 6.5 mg L–1 in the outflow, which resulted in a mean concentration reduction of >93%. The mean outflow TSS concentration was in compliance with the EU requirements for reclaimed water quality Class A standard of 10 mg L–1 (Table 1) [47]. However, the EU-guided Class A limit value of TSS exceeded 17 times out of 99 measurements at the outflow, which corresponds to 17% of the measured values. No guideline for TSS is provided for effluent discharge into the environment. Overall, with an inflow TSS loading of 15.2 ± 30 g m–2 d–1, a highly efficient TSS mass removal rate of 14.9 ± 30 g m–2 d–1 resulted in a removal efficiency of >94% (Table 2).
For E. coli, a highly fluctuating curve demonstrated the dynamics of outflow E. coli counts, specifically when the HLRs were increased (Figure 4). Mean E. coli were counted as 2.8 × 10⁶ ± 4.1 × 10⁶ MPN 100 mL–1 in the inflow and 4.4 × 10⁴ ± 1.9 × 10⁵ MPN 100 mL–1 in the outflow, which attributed to a mean E. coli reduction of 1.81 log reduction (Table 1). However, the EU recommended performance target is ≥5.0 log-reduction for reclaimed water quality class A for agricultural irrigation [47], and this study result showed low performance in terms of E. coli removal. An almost similar result for E. coli removal (1.86 log reduction) was obtained when the difference between the inflow loading rate (in MPN m–2 d–1) and the outflow rate (in MPN m–2 d–1) was calculated in this investigation (Table 2). The outflow water quality did not comply with the EU-recommended Class A standard of 10 MPN 100 mL–1 for reuse in agricultural irrigation purposes (Table 1). Several complex mechanisms related to the porous media of the protection mat made of synthetic fibres, root structure of the covered vegetation (marsh plants) and HLRs seem to affect E. coli removal in such NBS [55]. All these mechanisms might be the potential reasons for a low E. coli removal in this study. It is widely accepted that a disinfection unit must be installed in combination with an NBS in order to achieve treated GW quality for safe reuse [56]. Since the reclaimed GW should fulfill four criteria (hygienic safety, aesthetics, environmental tolerance, and economic feasibility) for reuse [57], an efficient disinfection unit can also be recommended in combination with the WR system as post-treatment to meet the reclaimed water reuse criteria.

3.1.5. AS

The source of AS in the inflow was mostly the detergent products used for cleaning and washing activities within the household in this study. Therefore, the total amount of water used on a daily basis could potentially lead to variations in the AS concentrations within the inflow. The concentration of AS in the domestic GW inflow varied in the range from 0.2 mg L–1 to 17.8 mg L–1, with a mean concentration of 7.9 ± 4.4 mg L–1. The AS concentration in the inflow was within the range in GW shown in the literature, ranging from 3 to 86 mg L–1 [58,59]. The AS concentrations in the outflow were significantly lower (p < 0.05) than those from the inflow and varied in the range from 0.05 mg L–1 to 1.56 mg L–1, with a mean AS concentration of 0.4 ± 0.3 mg L–1 and a mean concentration reduction of >93% (Figure 5 and Table 1).
No standard value for AS in the treated effluent is suggested for discharge Class C by DWA-A 221 [46] nor recommended by the EU for reclaimed water quality requirements yet. However, the mean AS concentration in the outflow met the recommended concentration (1.0 mg L–1) for reuse as irrigation water, where public access is infrequent and controlled [60], and also met Israeli standards (2.0 mg L–1) for unlimited irrigation with treated wastewater [61].
In terms of mass removal over the investigation period, the AS removal efficiency within the PWR system varied in the range of 76% to 99%, with a mean mass removal efficiency of >94%. A mean inflow AS loading of 0.45 ± 0.39 g m–2 d–1 resulted in a mean AS mass removal rate of 0.43 ± 0.38 g m–2 d–1 and contributed to a high (>94%) removal efficiency (Table 2). High AS removal performance indicated a high biodegradation within the PWR system, as compared to various physico-chemical technologies specifically designed for AS removal, such as coagulation or Fenton processes [62]. The biodegradability of AS in this system also surpassed biological treatment systems like a moving bed biofilm reactor treating synthetic GW and a multistage CW system treating real GW, with AS removal efficiency of only 30% and 43%, respectively [63].
Several studies showed that AS concentrations of >250 mg L–1 in GW could possess negative effects on plants with considerable sensitivity (e.g., lettuce) [64]. In this study, the maximum AS concentration in the GW inflow was <18 mg L–1, and this was comparatively lower than the concentrations usually considered toxic to the plants. Therefore, no such negative effects within the marsh plants were observed during this study.

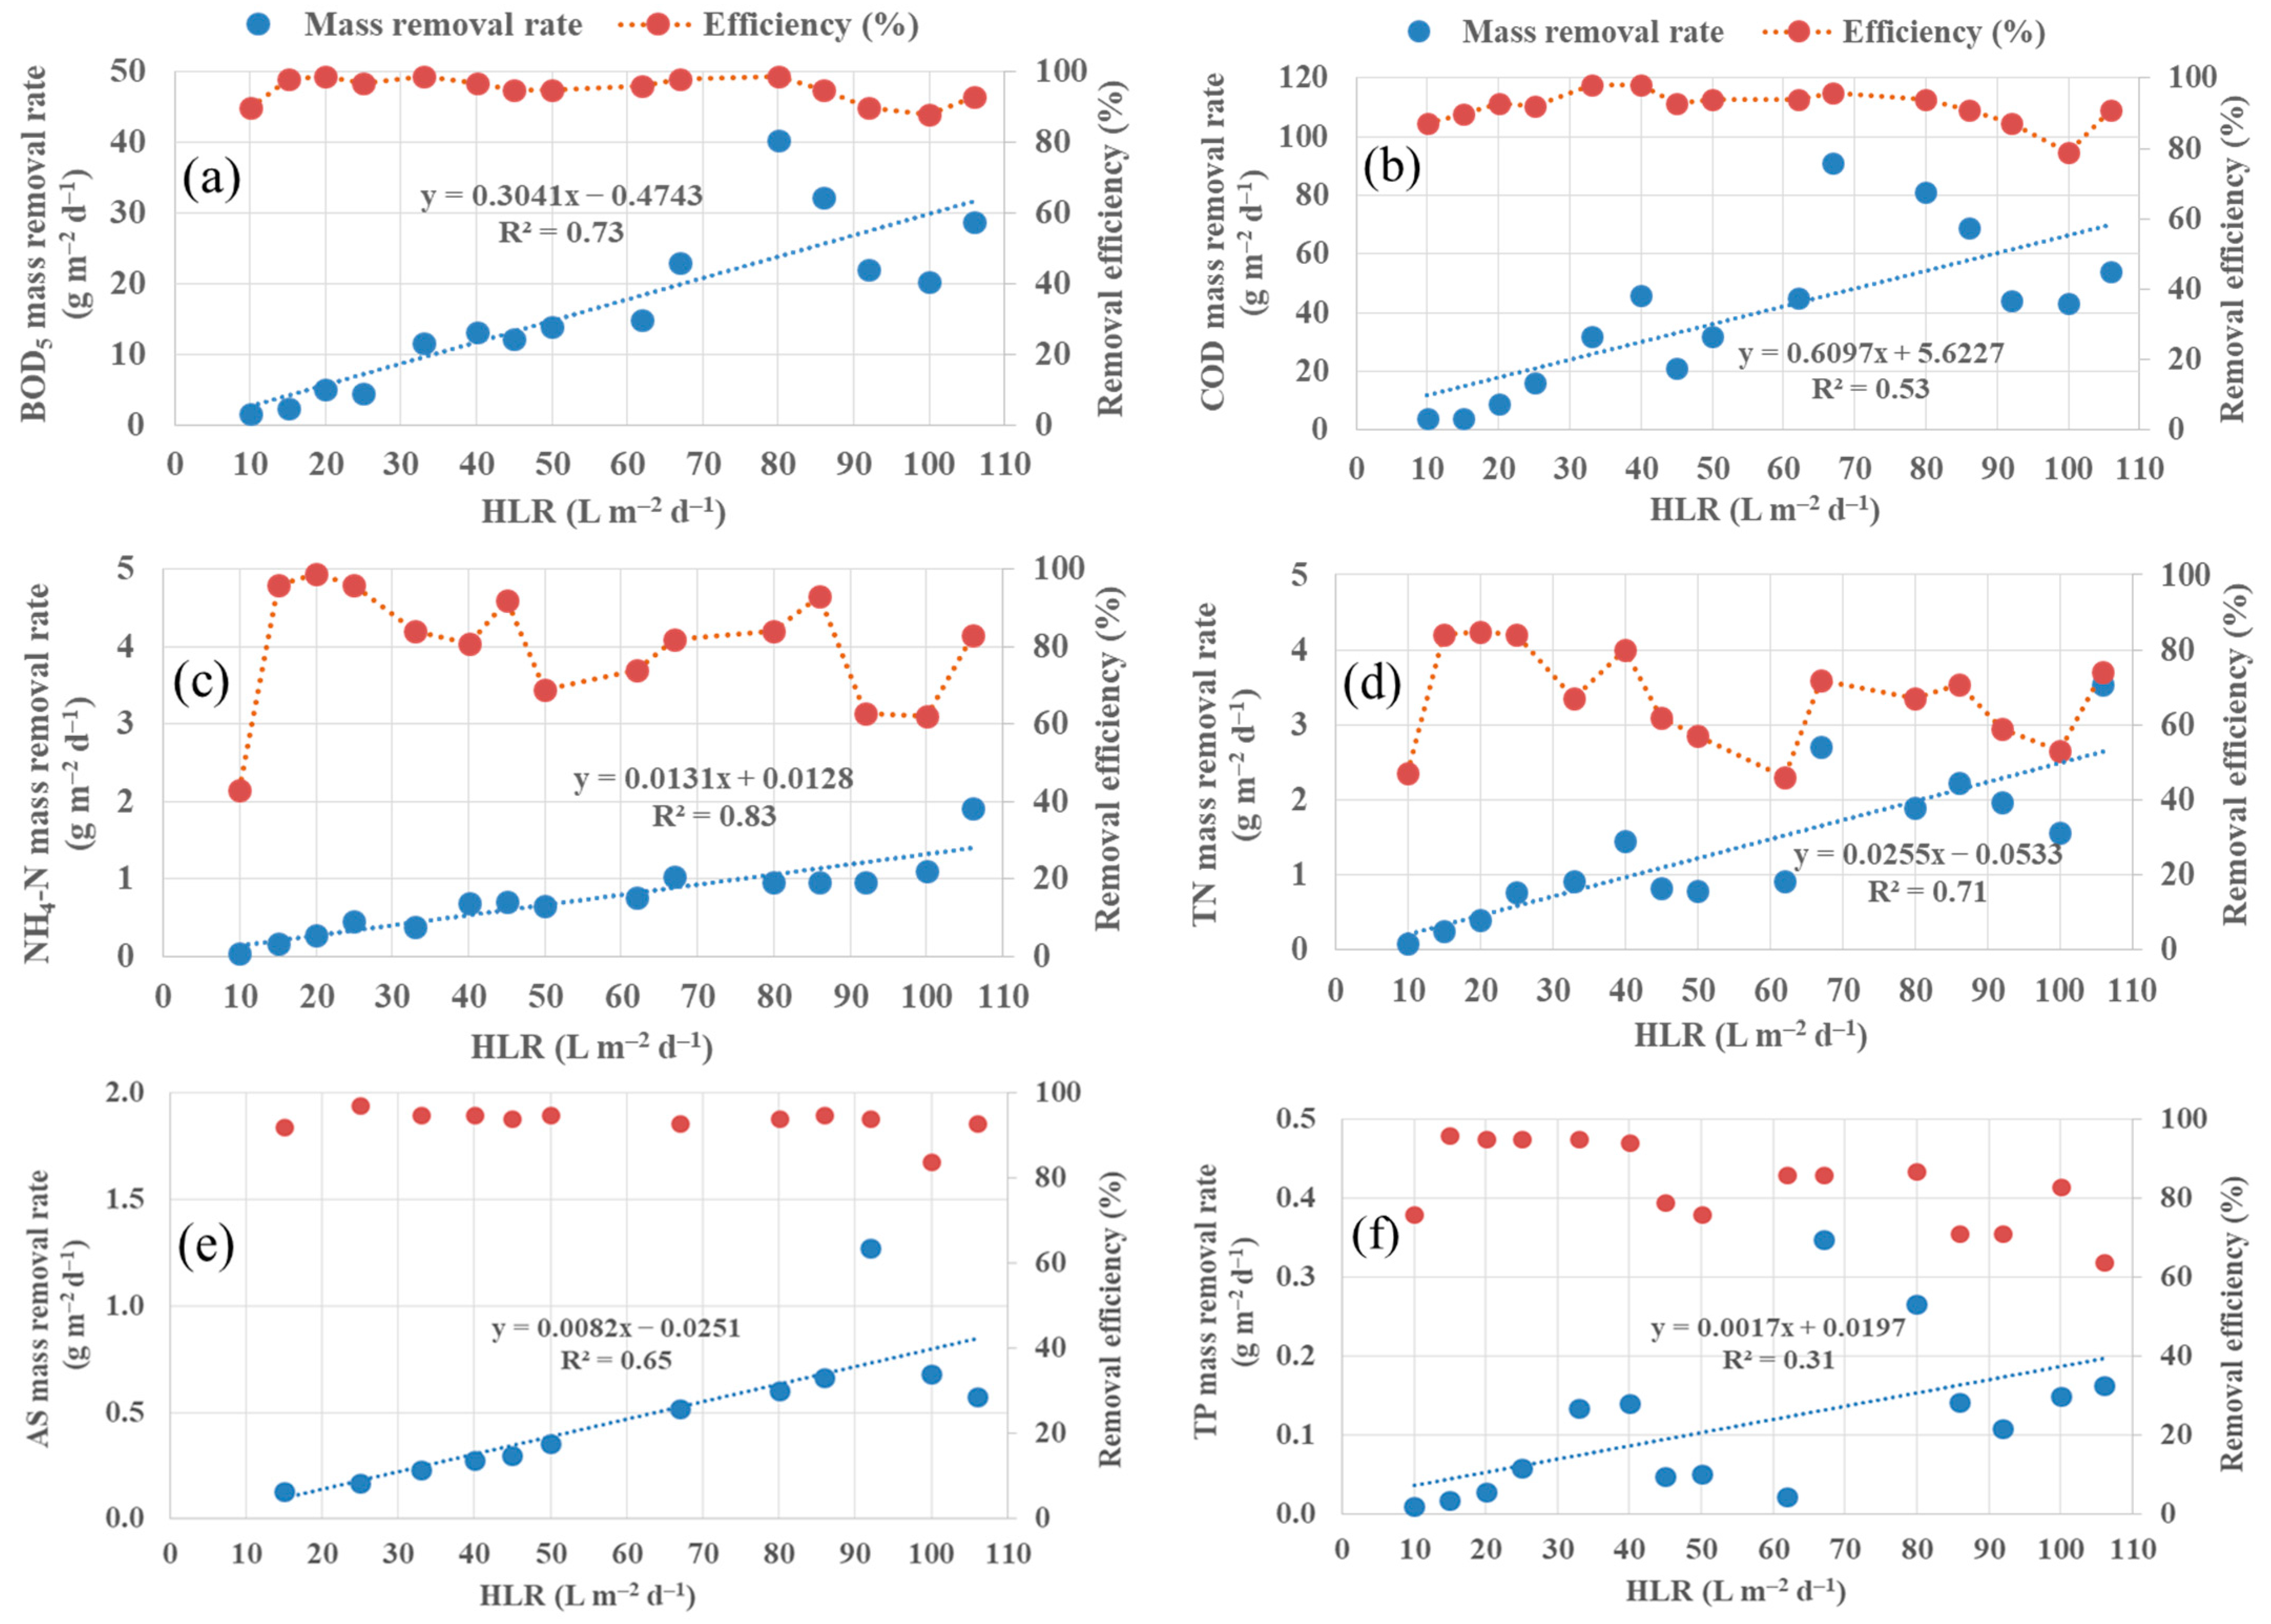
3.2. Effect of HLR on GW Treatment

Figure 6 shows the correlations between pollutants mass removal rates and applied HLRs, as well as the corresponding mass removal efficiencies (%).
Overall, statistically significant (p < 0.05) results of the mass removal rate of pollutants across different HLRs (low to high) were observed, which means that an effect of HLR on mass removal rate might exist. All the graphs in Figure 6 showed a linear correlation between the mass removal rate of pollutants and HLRs and good values for the coefficient of determination (R2). However, the graphs also demonstrated that, up to a certain HLR, the mass removal rate of pollutants significantly increased (p < 0.05) as HLR increased, and afterwards, the mass removal rate of pollutants showed a decreasing tendency with subsequent increases in HLRs.
A strong correlation (R2 = 0.73) between BOD5 mass removal rate and applied HLRs was shown in this study. The highest BOD5 mass removal rate of 40.3 ± 36 g m–2 d–1 and corresponding removal efficiency of >99% was observed at a mean HLR of 80 L m–2 d–1. Beyond this, further increases of HLR in the range of 80−109 L m–2 d–1 contributed to the decreasing BOD5 mass removal rate as well as removal efficiency (Figure 6a). Since higher HLR implies a smaller hydraulic retention time (HRT), which results in a higher outflow concentration and thereby a lower removal efficiency. The outflow mean BOD5 concentrations at HLR of 15 L m–2 d–1 and HLR of 80 L m–2 d–1 were analyzed as 2.4 ± 2.0 and 5.8 ± 3.3 mg L–1, respectively. On the other hand, higher HLRs of >80 L m–2 d–1 resulted in a sharp increase in BOD5 outflow concentrations, staying still below the recommended BOD5 limit value for discharge, which is 40 mg L–1, except for one outlier (Figure 2). Therefore, in order to achieve high BOD5 mass removal rate without compromising the limit value at the same time, a maximum HLR of 80 L m–2 d–1 can be applied to the PWR system.
For COD, a good correlation (R2 = 0.53) between COD mass removal rate and HLRs was also observed. The highest COD mass removal rate of 91 ± 88 g m–2 d–1 with a mean removal efficiency of >96% was observed when the mean HLR was 67 L m–2 d–1 and the mean COD mass loading was 94 ± 88 g m–2 d–1 at the inlet. Further increases in HLRs resulted in a decreasing trend in the COD mass removal rate and, thereby, a decreased removal efficiency (Figure 6b). The outflow mean COD concentrations at HLR of 15 L m–2 d–1 and HLR of 67 L m–2 d–1 were analyzed as 32 ± 23 and 49 ± 23 mg L–1, respectively. Beyond HLR of 67 L m–2 d–1, outflow COD concentration exhibited a progressive increase and at HLR of 91 L m–2 d–1, the outflow COD concentration of 176 mg L–1 exceeded the discharge limit value of 150 mg L–1 [46]. Therefore, an HLR in a range of 67 to 80 L m–2 d–1 can be permissible and applicable to achieve a higher COD mass removal rate without compromising the effluent water quality or the allowable limit value for discharge.
Hoffmann et al. [65] reported that organic load is the limiting factor, i.e., if the GW has a low organic load, a higher HLR can be applied. With the increase in HLRs in this study, a statistically significant difference (p < 0.05) in DO concentrations was observed. The outflow mean DO concentration decreased substantially in a range of 5–12 mg L–1 as HLR increased. This decreasing tendency of mean DO concentrations might also be a reason for the lower BOD5 and COD mass removal rates when HLRs were increasing. Organic matter is removed by microbial degradation, and an increase in HLRs attributes to a reduction of HRT, thereby resulting in a low microbial degradation of organic pollutants. However, the increased HLRs were not necessarily detrimental for BOD5 and COD removal efficiencies but for the outflow concentrations when they exceeded the allowable limit values for discharge or reclaimed water quality for agricultural reuse (Figure 2 and Figure 6a,b).
HLR also played a significant role in the cases of NH4-N and TN removal and showed strong correlations with mass removal rates. For NH4-N, the result showed a significant increase (p < 0.05) in mass removal rate with the increase of HLR up to 67 L m–2 d–1. Beyond this HLR, almost a steady NH4-N mass removal rate and a fluctuating mass removal efficiency were observed (Figure 6c). The results from TN also showed a significant increase (p < 0.05) in mass removal rates with the increase of HLR from 10 to 67 L m–2 d–1, with a mean TN mass removal rate of 2.71 ± 2.07 g m–2 d–1 at HLR of 67 L m–2 d–1. The corresponding mean TN mass removal efficiency was calculated as >72%. Beyond this HLR, a significant decrease (p < 0.05) in the TN mass removal rate and declining TN removal efficiency were observed in this study (Figure 6d). The results demonstrated that nitrogenous compounds require relatively lower HLR, i.e., higher HRT, for better mass removal as compared to carbonaceous organic matter. Moreover, a higher HLR may contribute to a higher TN concentration in the outflow (Figure 3).
For AS, a significant increase (p < 0.05) in the AS mass removal rate with the increase of HLRs was observed. At HLRs ranging from 10–92 L m–2 d–1, mean AS mass removal rate increased from 0.13 g m–2 d–1 to 1.27 g m–2 d–1 with a mean removal efficiency of >94% (Figure 6e). Beyond this HLR, with a mean value of 92 L m–2 d–1, the AS mass removal rate as well as removal efficiency decreased. However, a good correlation (R2 = 0.65) between AS mass removal rate and HLR was observed. Since the outflow AS concentration dynamics showed a relatively smooth and stable curve as compared to highly fluctuating inflow concentrations (Figure 5) and no AS limit value is still recommended for discharge, a higher HLR for better AS mass removal is possible. But it is not recommended since very high HLR application can be detrimental for the removal of other pollutants in GW, and the outflow concentrations can exceed their corresponding limit values for discharge or the recommended reclaimed water quality class for agricultural reuse.
In the case of TP, there was not a good correlation between mass removal rate and HLR, but a significant increase (p < 0.05) in the mean mass removal rate up to a mean HLR of 67 L m–2 d–1 was observed. The statistical analyses showed a significant difference (p < 0.05) in TP mass removal rates for HLR of 15 L m–2 d–1 and 67 L m–2 d–1. At HLR of 67 L m–2 d–1, the corresponding mean TP mass removal rate was 0.35 ± 0.34 g m–2 d–1, with a removal efficiency of >86% (Figure 6f). However, the outflow TP concentration dynamics did not show high fluctuation during the application of HLRs ranging from 67–109 L m–2 d–1.
The results of mean TSS mass removal rates under different HLRs were also statistically significant (p < 0.05) and demonstrated a very high mean removal efficiency (>94%), but did not show a good correlation with the increasing HLRs. Within the HLR range of 67–80 L m–2 d–1, the mean TSS mass removal rate increased up to 40 g m–2 d–1, with a mass removal efficiency of >96%. Beyond this range of HLRs, the mean mass removal rate decreased, and the outflow TSS concentration showed an increasing tendency.
E. coli results showed the highest E. coli removal rate of 3.77 log reduction at HLR of 45 L m–2 d–1. Beyond this HLR, the removal rate significantly decreased (p < 0.05) with the increase in HLRs. Only 1.15 log-reduction was observed at high HLRs in the range of 100–106 L m–2 d–1. High HLRs and thereby a relatively low HRT were not beneficial for high E. coli removal in this study. At HLR of 45 L m–2 d–1, mean inflow E. coli loading of 2.0 × 10⁹ ± 1.6 × 10⁹ MPN m–2 d–1 decreased to a mean value of 3.3 × 10⁵ ± 5.6 × 10⁵ MPN m–2 d–1 at the outlet, which resulted in an E. coli removal rate of 3.77 log-reduction. At this HLR of 45 L m–2 d–1, mean E. coli counts of 4.4 × 10⁶ ± 3.7 × 10⁶ MPN 100 mL–1 in the inflow and 5.6 × 10² ± 9.5 × 10² MPN 100 mL–1 in the outflow were also attributed to a similar E. coli reduction (3.9 log-reduction).
For WR systems treating domestic GW, inflow HLR is a very important parameter, as it allows for the calculation of the space required for the whole treatment system. The results of this study showed that a high HLR of <80 L m–2 d–1 contributed to a high mass removal rate as well as good removal efficiency without compromising the recommended limit values for discharge to the environment according to DWA-A 221 [46]. This information can be useful to the designers of the constructed wetland roof system to fix the required HLR and thereby HRT to get the desired treated GW effluent quality according to the allowable limit at the outlet.
From all the graphs, it is clearly seen that in all the seasons during the study, the outflow concentrations always showed sufficient removal of nutrients as well as AS.

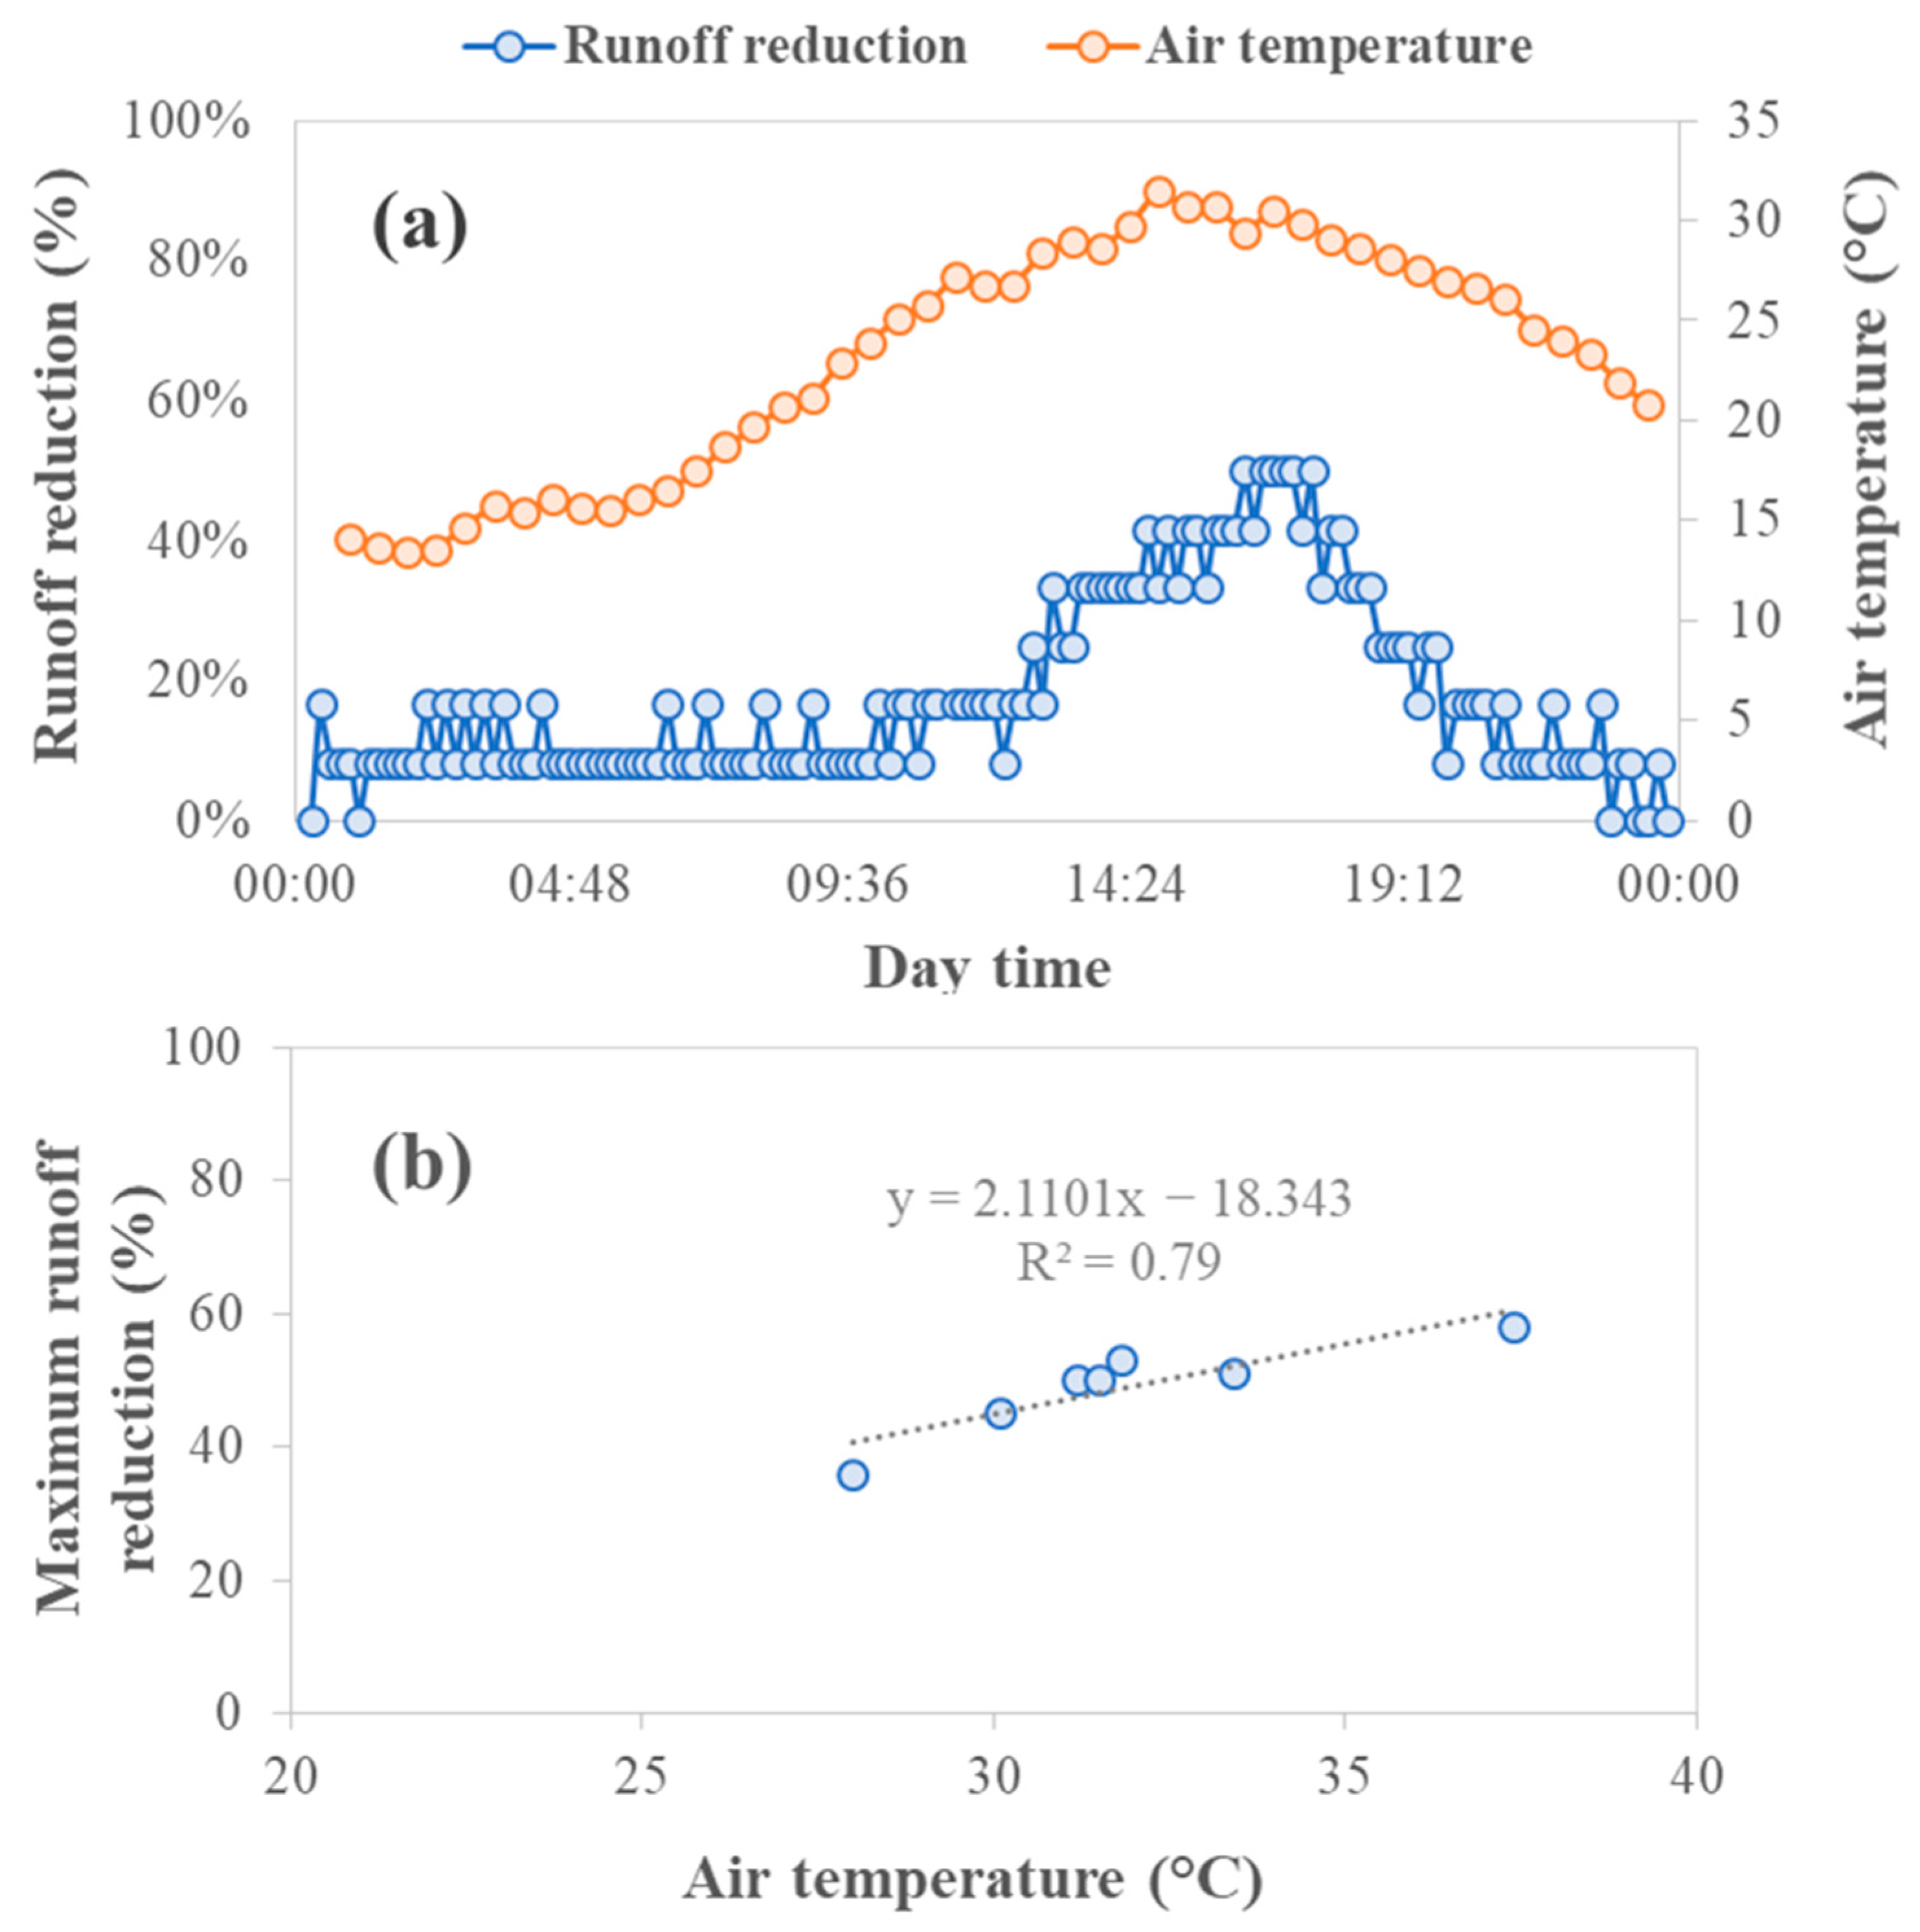
3.3. EVT during Hot Summer Days
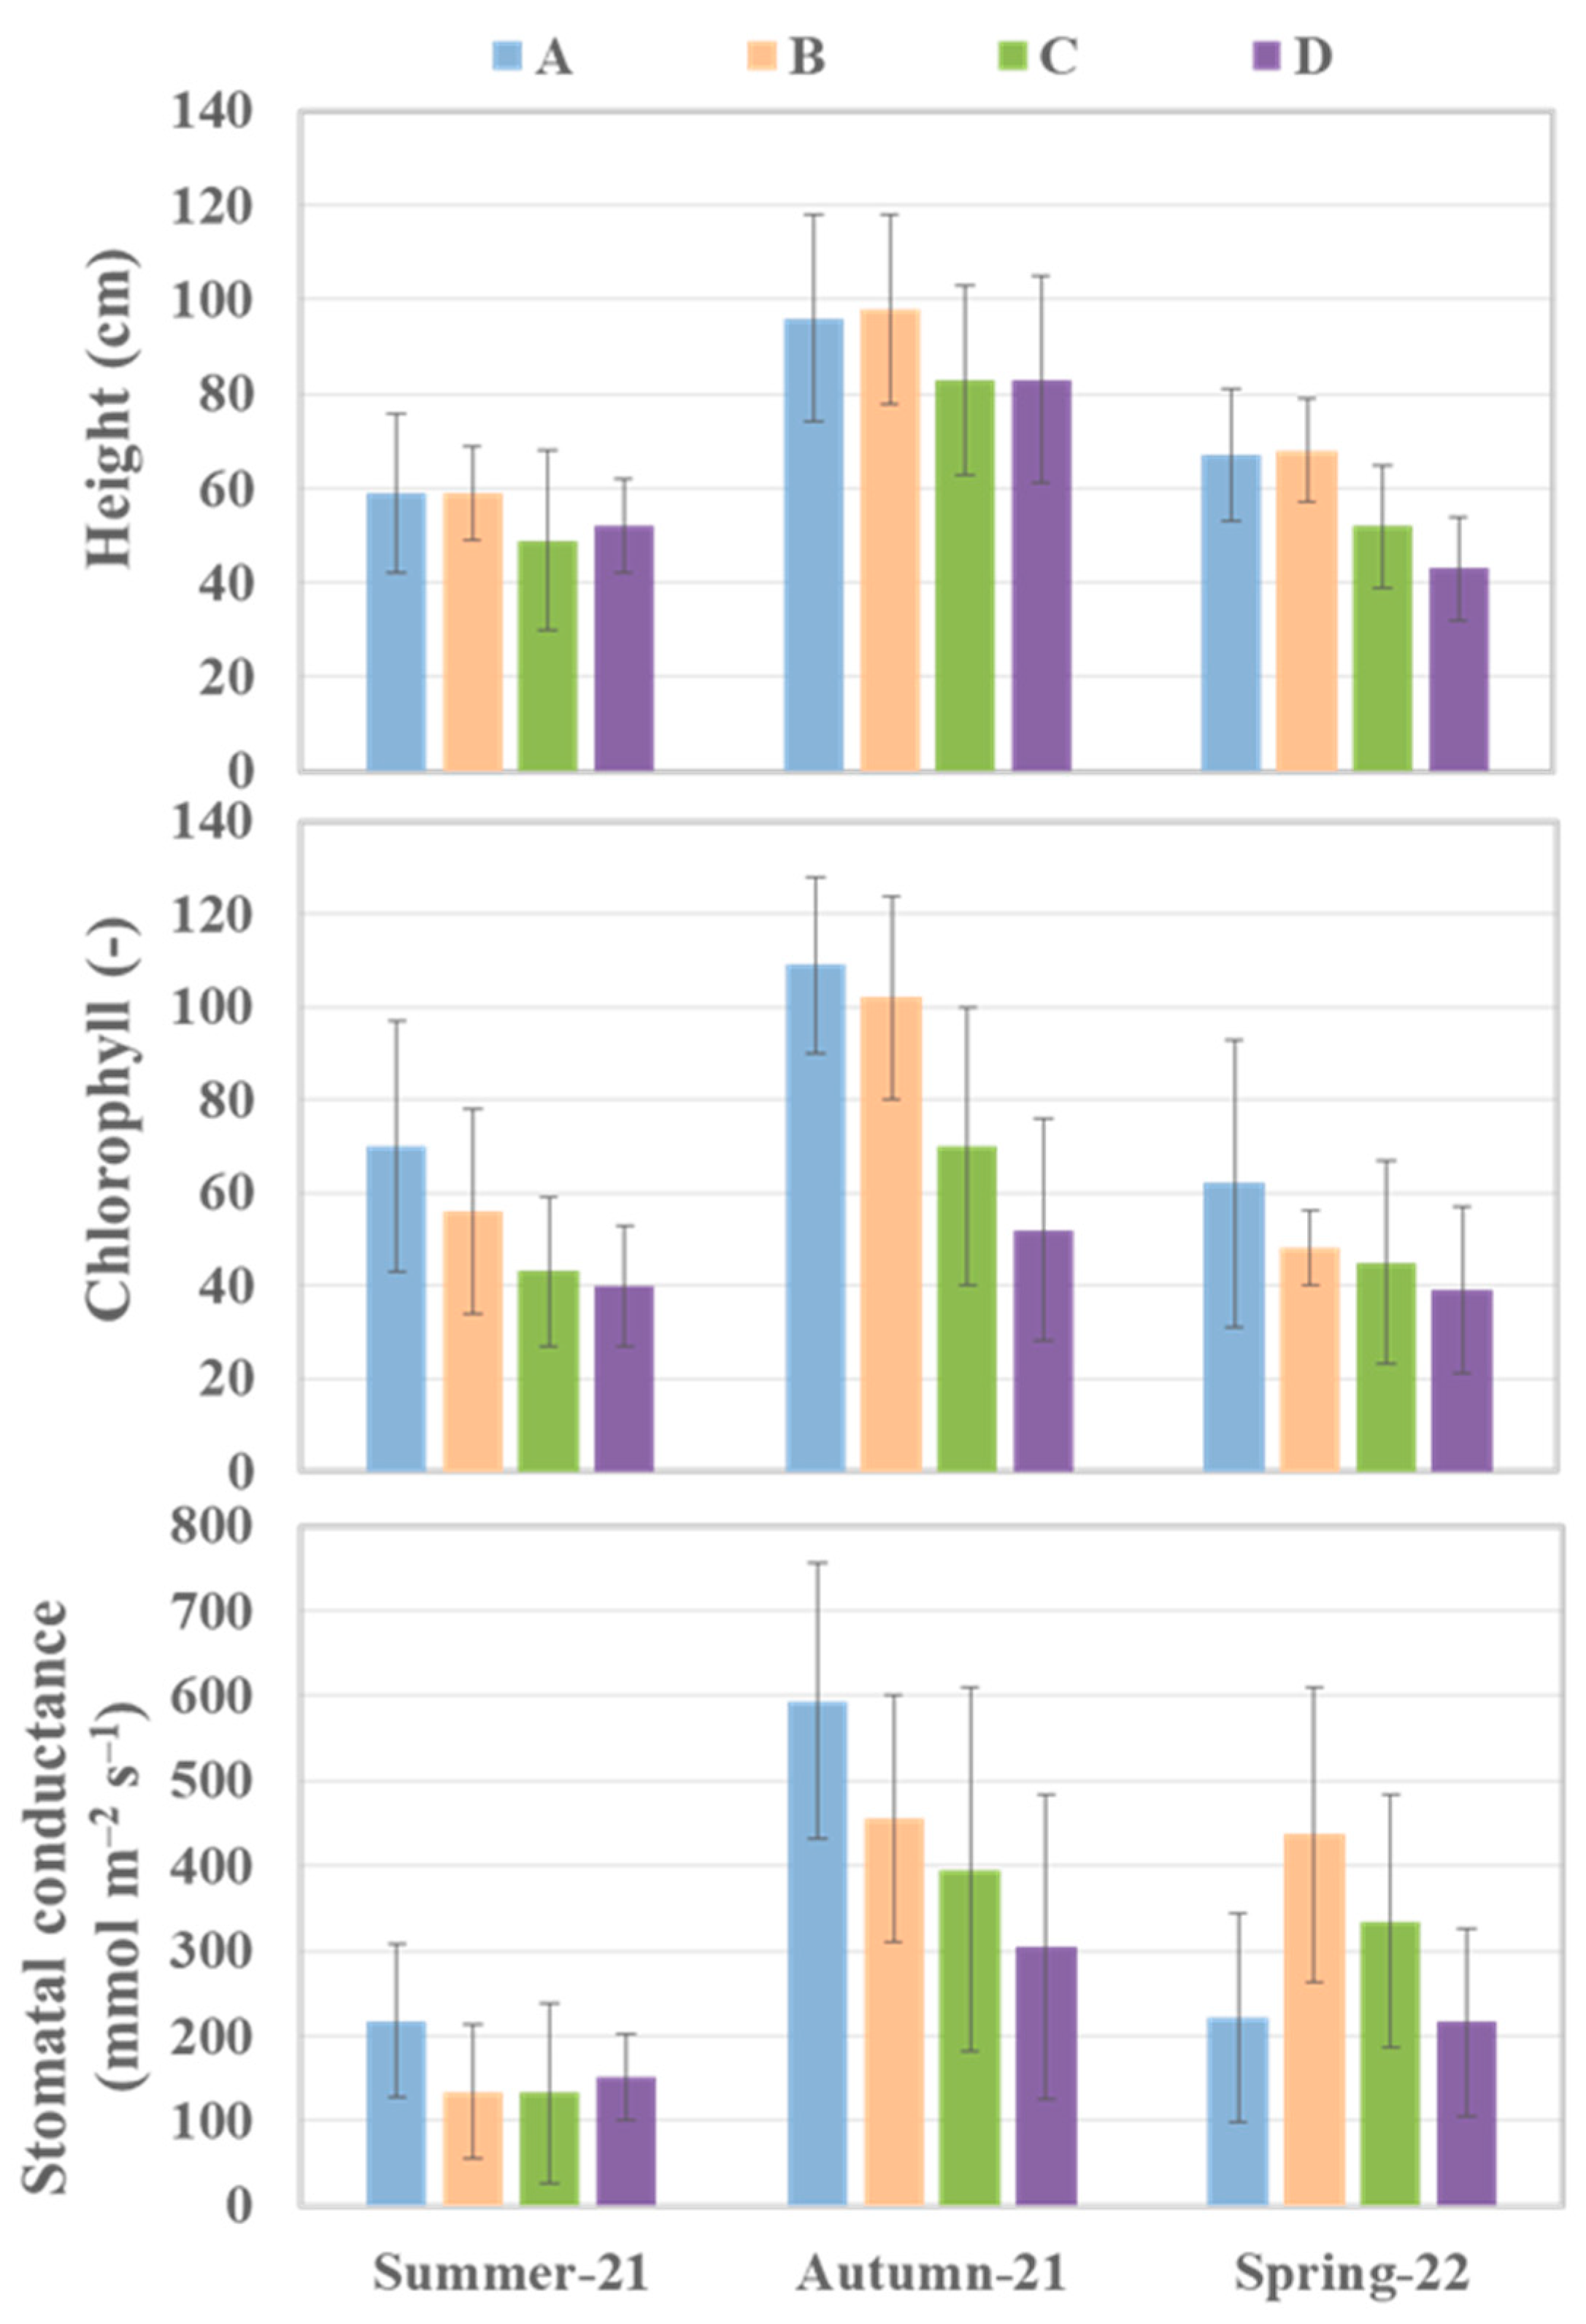
To assess the water loss due to EVT from the surface of the PWR system, the atmospheric air temperature in close proximity to the PWR was recorded. Water loss in terms of runoff reduction (RR in %) along the day with daily mean air temperature changes on a hot summer day (3 August 2022) during this study is shown in Figure 7a.
The highest temperature of 30.7 °C was recorded at the hour between 15:30 and 16:00 during the day, whereas the highest RR of 50% was estimated at subsequent hour between 16:30 and 17:30. In other words, 50% of GW was lost from the system due to EVT processes during the treatment in this time slot. In total, the EVT reached 7 L m–2 d–1 during this one particular day. The higher the mean ambient air temperature, the more RR (%) was observed. Maximum RR on seven hot days with a maximum air temperature of over 30 °C in the summer of 2022 (June–August) was also estimated and shown in Figure 7b. The results demonstrated that the maximum RR strongly correlated (R2 = 0.79) with the maximum air temperatures on a daily basis. A statistically significant effect (p < 0.05) of maximum air temperatures on maximum RR was also observed in this study. Helophytes can potentially transpire much more water than terrestrial plants that are usually used on conventional green roofs [32]. This might be the reason for the estimated high RR or water loss from the PWR system with marsh plants in this study.
Moreover, greater rates of water loss due to EVT may result in greater cooling effects as more heat is dissipated by the system in the form of water vapor [36]. The surrounding air temperature near the PWR system was slightly reduced (ca. 3–5 °C) on hot summer days in this study. This might be due to the high EVT rate of the wetland vegetation and the water storage mat used in the PWR system. The results indicated that the PWR has the potential to positively affect the microclimate and reduce the local air temperature within densely populated urban environments. Song et al. [39] and Thon et al. [66] also found that wetland roofs helped to reduce the temperature of the zone below the roof on hot days, which can contribute to improving urban microclimate and cooling down the heat effect by increasing air humidity (through high EVT). Other studies also demonstrated that wetland vegetation with a high EVT rate on a rooftop not only helps contribute to cooling down the roof underneath the building and absorbs CO2 through plant photosynthesis, but also increases green spaces and provides habitat for flora and fauna in urban areas [39,67,68]. The higher the EVT rate, the moister the produced air, and thereby the surrounding air temperature will be declining. The selection of marsh plants or helophytes is also an important factor in increasing the EVT rate from wetland roof surfaces. However, long-term investigations on the cooling effect of a WR and further optimizations are needed to be carried out.

3.4. Plant Vitality

While starting the experimental operation, the wetland plants rooted on the water storage mat showed high plant biomass growth during the initial three months and filled the entire surface (Figure 1). Most of the plant species adapted quite well under the PWR operating conditions at different HLRs of domestic GW. However, their growth rates tended to decrease gradually during this study.
The vitality of the marsh plants was observed by measuring the mean plant height, chlorophyll content, and stomatal conductance of Carex acutiformis at four segments (A, B, C, and D) on the PWR surface in subsequent seasons of the year (in summer, autumn, and spring) during the two-year study period (Figure 8).
The results demonstrated that in autumn 2021, the plants at segments A, B, C, and D with a mean height of 96 ± 22, 98 ± 20, 83 ± 20, and 83 ± 22 cm, respectively, were relatively higher than in summer 2021 (59 ± 17, 59 ± 10, 49 ± 19, and 52 ± 10 cm) and in spring 2022 (67 ± 14, 68 ± 11, 52 ± 13, and 43 ± 11 cm). This is not surprising because of the annual development of plants.
The leaf chlorophyll content and stomatal conductance data of the plants also followed the same trend, with significantly higher (p < 0.05) mean values in autumn as compared to summer and spring during the study. A relatively higher mean chlorophyll content of 109 ± 19, 102 ± 22, 70 ± 30, 52 ± 24 units and mean stomatal conductance of 594 ± 162, 455 ± 145, 396 ± 213, and 305 ± 180 mmol m–2 s–1 were recorded during autumn 2021 in segments A, B, C, and D, respectively (Figure 8).
A decreasing trend of these plant parameters from inlet to outlet zone, i.e., relatively higher values at the upper segment (A) as compared to the values at the lower segment (D) of the PWR, was also observed (Figure 8). A relatively higher nutrient availability at the inlet zone along the length (upper segment) might have facilitated higher plant growth biomass as compared to the outlet zone (lower segment) of the PWR system. The depletion in overall leaf chlorophyll content and reduction of stomatal conductance from a higher nutrient content area at the upper segment (A) to a lower nutrient content area at the lower segment (D) were observed in this study. Measurements of chlorophyll content provide insights into the photosynthesis process, and stomatal conductance is an indicator of a plant’s water status and physiological response to environmental conditions. Driesen et al. [69], in a review of existing case studies, summarized that stomatal openings regulate the exchange of water vapor and CO2 between the leaf and the air, i.e., they control both the water loss from plant leaves and the uptake of CO2 for photosynthesis. Therefore, the results of chlorophyll content in combination with stomatal conductance showed a complete picture of the overall plant physiology and health. Higher stomatal conductance in autumn suggested a higher rate of CO2 entering or higher water vapor exiting (water loss) through stomata. After two years of operation in this study, all plants were healthy and without any visible symptoms of nutrient deficiency. All plants received the necessary nutrients from domestic GW within their growth medium in order to accomplish their standard physiological functions.
During vacation times, the water was recirculated in order to keep the plant mat moist. Still, there was a very hot period with strong sunlight and high ambient temperatures during a vacation within this study. A part of the plants in segment D dried up during these hot summer days and only regenerated in the following spring. Leaf discoloration, defoliation of the plant species, and prolonged stress were also visible during the winter period, even though the PWR system continued to treat domestic GW on a regular basis during the whole winter. The exception was in winter 2021/2022 and in winter 2022/2023, when the system was not loaded due to frost for only 14 and 12 days, respectively.

4. Potential Application of the PWR System

A number of GW treatment and reuse schemes have already been implemented worldwide using both conventional and hybrid systems [12]. To make the experimental operation, monitoring, and maintenance easier, only a strip of wooden structure was used at ground level to demonstrate the PWR system in this study. Based on the treatment performance of the PWR, the potential application of such a system on a real roof for GW treatment on a household basis and the reuse of the treated effluent for irrigation purposes in a backyard garden is feasible and optimistic. Therefore, the application of such a constructed WR system can be on the roofs of residential houses, office buildings, school premises, hotels, etc. for treating GW in urban development as well as for passive cooling and habitat preservation. Where the roof statics may be critical for conventional green roofs, the low loads of such constructed wetland roofs due to the absence of sand or gravel (presence of a recycled synthetic fiber mat only) as water storage and plant carrier mat are of further advantage for the subsequent greening of existing buildings [40,70].
Marsh plants that can sustain stressful conditions like high temperatures, high winds, low humidity, high radiation, salinity, etc. can be grown on such constructed WR, and hence the application of such a system can be considered a very effective, attractive, ecological, and sustainable solution for urban water management. Vegetation has a high value for the city inhabitants, and a green infrastructure has positive effects on the quality of life in the urban climate. Aesthetically pleasant roofs with local plants and their associated fauna (insects and birds) can also provide high-quality living space for people remote from traffic noise and pollution [71].
However, many WRs are designed to not operate in winter months when temperatures drop below 2 °C, resulting in the freezing of wastewater within the system [38]. In this study, the PWR system was also not in operation during winter when temperatures went below −4 °C and the pumps were completely shut down (nearly two weeks under extreme winter with frost). The pipe networks were insulated to prevent freezing during the winter months, but the plant mat was completely frozen during very low temperature periods.
Future implementation of such constructed wetland roofs for GW or wastewater treatment and subsequent reuse applications will depend on the effluent quality to meet local reuse guidelines, which may be stricter based on the location and governance of implementation.

5. Conclusions

This study evaluated a prototype of a constructed WR on the treatment performance of domestic greywater under real conditions. The results from the PWR treating domestic GW in this study provided useful data on its overall treatment efficiency and the influence of HLRs on the treatment performance, as well as EVT (runoff reduction) on hot summer days and plant vitality. The COD and BOD5 values in the treated GW effluent were 42 ± 31 mg L–1 and 9 ± 11 mg L–1, respectively, and were in compliance with the recommended limit values for discharge to the environment. Nevertheless, the EU-suggested Class A standard of reclaimed water for agricultural irrigation was not sufficiently achieved for all recommended parameters. However, this PWR system was acting like a carbon sink, and the results also recommended the need for additional disinfection steps (e.g., a UV lamp) to meet strict and safe water reuse standards for E. coli, as the sanitization was not sufficient with 4.4 × 10⁴ ± 1.9 × 10⁵ MPN 100 mL–1 on average in the outflow. Plant species adapted well to the water storage mat under the PWR operating conditions with domestic GW in this study, but their growth rates tended to decrease gradually under extreme weather conditions like hot summers and prolonged winters. More research on the improvement of the treatment and temperature conditioning performance of such a constructed wetland roof system will be carried out in the near future.
In general, the results showed the PWR system as a promising green technology that is needed to be further investigated and scaled up in the future for urban buildings, as it is easy to maintain and feasible to use in urban water management systems where there is a huge lack of available spaces. The scaled-up system can be applied to existing buildings for GW management, and placing such ecological treatment facilities on roofs can potentially help mitigate the problems associated with excessive land use in urban settlements. To make a city more water resilient, GW recycling and reuse can be a sustainable option, as it can reduce the import of water into cities and reduce over-reliance on freshwater. From this perspective, constructed WR treating domestic GW can be a potential NBS for making sustainable and water-resilient cities. Further research could delve into the microclimate effects and long-term thermal benefits of such constructed WRs over larger spaces in urban landscapes.

Author Contributions

Writing—original draft preparation, K.Z.R.; Conceptualization, M.B.; methodology, M.B. and L.M.; formal analysis, K.Z.R. and L.M.; investigation, X.C., K.B. and L.M.; resources, K.B.; data curation, X.C. and L.M.; writing—review and editing, K.Z.R., X.C., M.B., K.M., R.T. and L.M.; visualization, L.M. and K.Z.R.; supervision, L.M.; project administration, R.A.M. and K.M.; funding acquisition, R.A.M. All authors have read and agreed to the published version of the manuscript.

Funding

This research was partly funded by the joint research project “Dachbiofilter” (Funding code: KK5081716BA3), which came from the budget of the German Federal Ministry for Economic Affairs and Climate Action (BMWK) on the basis of a decision by the German Federal Parliament (Bundestag) within the funding program “Central Innovation Program for SMEs (ZIM)”.

Data Availability Statement

The data presented in this study are available on request from the corresponding author.

Acknowledgments

The authors would like to acknowledge additional support and outstanding assistance from the Helmholtz Center for Environmental Research (UFZ), Leipzig, in the field of construction, operation, and chemical analysis in the laboratory (Steffen Kappe, Grit Weichert). This study was carried out as a part of the Integrated Platform Project “Technologies for Water and Heat Management in Urban Space (CityTech)” under the framework of the Helmholtz Center for Environmental Research - UFZ, Leipzig. The authors would also like to thank the joint research project sponsor, AiF-Projekt GmbH, Berlin, for supervising the project “Dachbiofilter”. We dedicate this article to the memory of the late Andreas Zehnsdorf †, who recognized the potential and improved the concept of such NBS for GW treatment on a household basis.

Conflicts of Interest

The authors declare no conflict of interest.

References

  1. Dadashpoor, H.; Azizi, P.; Moghadasi, M. Land use change, urbanization, and change in landscape pattern in a metropolitan area. Sci. Total Environ. 2019, 655, 707–719. [Google Scholar] [CrossRef] [PubMed]
  2. UNESCO. The United Nations World Water Development Report 2017. Wastewater: The Untapped Resource; The United Nations Educational, Scientific and Cultural Organization: Paris, France, 2017. [Google Scholar]
  3. Ding, A.; Liang, H.; Li, G.; Szivak, I.; Traber, J.; Pronk, W. A low energy gravity-driven membrane bioreactor system for grey water treatment: Permeability and removal performance of organics. J. Membr. Sci. 2017, 542, 408–417. [Google Scholar] [CrossRef]
  4. Noutsopoulos, C.; Andreadakis, A.; Kouris, N.; Charchousi, D.; Mendrinou, P.; Galani, A.; Mantziaras, I.; Koumaki, E. Greywater characterization and loadings—Physicochemical treatment to promote onsite reuse. J. Environ. Manag. 2018, 216, 337–346. [Google Scholar] [CrossRef] [PubMed]
  5. Vuppaladadiyam, A.K.; Merayo, N.; Prinsen, P.; Luque, R.; Blanco, A.; Zhao, M. A review on greywater reuse: Quality, risks, barriers and global scenarios. Rev. Environ. Sci. Biotechnol. 2019, 18, 77–99. [Google Scholar] [CrossRef]
  6. Alsulaili, A.D.; Hamoda, M.F. Quantification and characterization of greywater from schools. Water Sci. Technol. 2015, 72, 1973–1980. [Google Scholar] [CrossRef]
  7. Misra, R.K.; Sivongxay, A. Reuse of laundry greywater as affected by its interaction with saturated soil. J. Hydrol. 2009, 366, 55–61. [Google Scholar] [CrossRef]
  8. Mascoli, R., Jr.; Passoni, C.M.; Santos, F.M.; Bernardes, F.S.; Magalhães Filho, F.J.C.; Paulo, P.L. Assessment of Surfactant Removal Capacity and Microbial Community Diversity in a Greywater-Treating Constructed Wetland. Resources 2023, 12, 38. [Google Scholar] [CrossRef]
  9. Ramprasad, C.; Philip, L. Contributions of various processes to the removal of surfactants and personal care products in constructed wetland. Chem. Eng. J. 2018, 334, 322–333. [Google Scholar] [CrossRef]
  10. Johansson, I.; Somasundaran, P. Handbook for Cleaning/Decontamination of Surfaces; Johansson, I., Somasundaran, P., Eds.; Elsevier: Amsterdam, The Netherlands, 2007; ISBN 9780080555539. [Google Scholar]
  11. Boano, F.; Caruso, A.; Costamagna, E.; Ridolfi, L.; Fiore, S.; Demichelis, F.; Galvão, A.; Pisoeiro, J.; Rizzo, A.; Masi, F. A review of nature-based solutions for greywater treatment: Applications, hydraulic design, and environmental benefits. Sci. Total Environ. 2020, 711, 134731. [Google Scholar] [CrossRef]
  12. Oteng-Peprah, M.; Acheampong, M.A.; DeVries, N.K. Greywater characteristics, treatment systems, reuse strategies and user perception—A review. Water Air Soil Pollut. 2018, 229, 255. [Google Scholar] [CrossRef]
  13. Friedler, E.; Hadari, M. Economic feasibility of on-site greywater reuse in multi-storey buildings. Desalination 2006, 190, 221–234. [Google Scholar] [CrossRef]
  14. Lu, Z.; Mo, W.; Dilkina, B.; Gardner, K.; Stang, S.; Huang, J.-C.; Foreman, M.C. Decentralized water collection systems for households and communities: Household preferences in Atlanta and Boston. Water Res. 2019, 167, 115134. [Google Scholar] [CrossRef] [PubMed]
  15. Remy, C.A.; Jekel, M. Sustainable wastewater management: Life cycle assessment of conventional and source-separating urban sanitation systems. Water Sci. Technol. 2008, 58, 1555–1562. [Google Scholar] [CrossRef] [PubMed]
  16. Larsen, T.A.; Udert, K.M.; Lienert, J. Source Separation and Decentralization for Wastewater Management, Knowledge Unlatched (KU); IWA Publishing: London, UK, 2013; ISBN 9781780401072. [Google Scholar]
  17. Mendes, R.; Fidélis, T.; Roebeling, P.C.; Teles, F. The Institutionalization of Nature-Based Solutions—A Discourse Analysis of Emergent Literature. Resources 2020, 9, 6. [Google Scholar] [CrossRef]
  18. Gross, A.; Shmueli, O.; Ronen, Z.; Raveh, E. Recycled vertical flow constructed wetland (RVFCW)—A novel method of recycling greywater for irrigation in small communities and households. Chemosphere 2007, 66, 916–923. [Google Scholar] [CrossRef]
  19. Winward, G.P.; Avery, L.M.; Frazer-Williams, R.; Pidou, M.; Jeffrey, P.; Stephenson, T.; Jefferson, B. A study of the microbial quality of grey water and an evaluation of treatment technologies for reuse. Ecol. Eng. 2008, 32, 187–197. [Google Scholar] [CrossRef]
  20. Albalawneh, A.; Chang, T.-K.; Alshawabkeh, H. Greywater treatment by granular filtration system using volcanic tuff and gravel media. Water Sci. Technol. 2017, 75, 2331–2341. [Google Scholar] [CrossRef]
  21. Collivignarelli, M.C.; Miino, M.C.; Gomez, F.H.; Torretta, V.; Rada, E.C.; Sorlini, S. Horizontal Flow Constructed Wetland for Greywater Treatment and Reuse: An Experimental Case. Int. J. Environ. Res. Public Health 2020, 17, 2317. [Google Scholar] [CrossRef]
  22. Huelgas-Orbecido, A.; Funamizu, N. Membrane System for Gray Water. In Resource-Oriented Agro-Sanitation Systems; Springer: Tokyo, Japan, 2019; pp. 185–193. [Google Scholar]
  23. Rahman, K.Z.; Al Saadi, S.; Al Rawahi, M.; Knappe, J.; van Afferden, M.; Moeller, L.; Bernhard, K.; Müller, R.A. A multi-functional nature-based solution (NBS) for greywater treatment and reuse at the same plot. Ecol. Eng. 2023, 191, 106952. [Google Scholar] [CrossRef]
  24. Ramprasad, C.; Smith, C.S.; Memon, F.A.; Philip, L. Removal of chemical and microbial contaminants from greywater using a novel constructed wetland: GROW. Ecol. Eng. 2017, 106, 55–65. [Google Scholar] [CrossRef]
  25. Zhang, K.F.; Barron, N.J.; Zinger, Y.; Hatt, B.; Prodanovic, V.; Deletic, A. Pollutant removal performance of field scale dual-mode biofilters for stormwater, greywater, and groundwater treatment. Ecol. Eng. 2021, 163, 106192. [Google Scholar] [CrossRef]
  26. Patil, Y.M.; Patki, V.K.; Jahagirdar, S.; Karale, R.; Angathekar, V. Greywater treatment by vegetated vermifilter: A low cost material for rural sanitation in India. Mater Today-Proc. 2021, 45, 6946–6950. [Google Scholar] [CrossRef]
  27. Zraunig, A.; Estelrich, M.; Gattringer, H.; Kisser, J.; Langergraber, G.; Radtke, M.; Rodriguez-Roda, I.; Buttiglieri, G. Long term decentralized greywater treatment for water reuse purposes in a tourist facility by vertical ecosystem. Ecol. Eng. 2019, 138, 138–147. [Google Scholar] [CrossRef]
  28. Ferro, N.D.; De Mattia, C.; Gandini, M.A.; Maucieri, C.; Stevanato, P.; Squartini, A.; Borin, M. Green walls to treat kitchen greywater in urban areas: Performance from a pilot-scale experiment. Sci Total Environ. 2021, 757, 144189. [Google Scholar] [CrossRef] [PubMed]
  29. Pradhan, S.; Al-Ghamdi, S.G.; Mackey, H.R. Greywater treatment by ornamental plants and media for an integrated green wall system. Int. Biodeterior. Biodegrad. 2019, 145, 104792. [Google Scholar] [CrossRef]
  30. Knapp, S.; Schmauck, S.; Zehnsdorf, A. Biodiversity Impact of Green Roofs and Constructed Wetlands as Progressive Eco-Technologies in Urban Areas. Sustainability 2019, 11, 5846. [Google Scholar] [CrossRef]
  31. Nivala, J.; Zehnsdorf, A.; van Afferden, M.; Müller, R.A. Green Infrastructure for Increased Resource Efficiency in Urban Water Management. In Urban Transformations—Sustainable Urban Development through Resource Efficiency, Quality of Life and Resilience; Kabisch, S., Koch, F., Gawel, E., Haase, A., Knapp, S., Krellenberg, K., Nivala, J., Zehnsdorf, A., Eds.; Springer International Publishing: Cham, Switzerland, 2018; pp. 133–143. [Google Scholar]
  32. Blumberg, M. Sumpfpflanzendächer als Variante der Dachbegrünung. In Regewasserbewirtschaftung. GWF Praxiswissen (Marsh Plant Roofs as a Variant of Roof Greening, Gwf—The Gas and Water, Supply Practice); Ziegler, C., Ed.; Deutscher Industrieverlag: Munich, Germany, 2011; Volume 1. [Google Scholar]
  33. Zehnsdorf, A.; Blumberg, M.; Müller, R.A. Helophyte mats (wetland roofs) with high evapotranspiration rates as a tool for decentralised rainwater management—Process stability improved by simultaneous greywater treatment. Water Sci. Technol. Water Supply 2019, 19, 808–814. [Google Scholar] [CrossRef]
  34. Jácome, J.A.; Molina, J.; Suárez, J.; Mosqueira, G.; Torres, D. Performance of constructed wetland applied for domestic wastewater treatment: Case study at Boimorto (Galicia, Spain). Ecol. Eng. 2016, 95, 324–329. [Google Scholar] [CrossRef]
  35. Zapater-Pereyra, M.; Van Dien, F.; Van Bruggen, J.J.A.; Lens, P.N.L. Material selection for a constructed wetroof receiving pre-treated high strength domestic wastewater. Water Sci. Technol. 2013, 68, 2264–2270. [Google Scholar] [CrossRef]
  36. Zehnsdorf, A.; Willebrand, K.C.U.; Trabitzsch, R.; Knechtel, S.; Blumberg, M.; Müller, R.A. Wetland Roofs as an Attractive Option for Decentralized Water Management and Air Conditioning Enhancement in Growing Cities—A Review. Water 2019, 11, 1845. [Google Scholar] [CrossRef]
  37. Vo, T.-D.; Bui, X.-T.; Lin, C.; Nguyen, V.-T.; Hoang, T.-K.; Nguyen, H.-H.; Nguyen, P.-D.; Ngo, H.H.; Guo, W. A mini-review on shallow-bed constructed wetlands: A promising innovative green roof. Curr. Opin. Environ. Sci. Health 2019, 12, 38–47. [Google Scholar] [CrossRef]
  38. Zapater-Pereyra, M.; Lavrinc, S.; Van Dien, F.; Van Bruggen, J.J.A.; Lens, P.N.L. Constructed wetroofs: A novel approach for the treatment and reuse of domestic wastewater. Ecol. Eng. 2016, 94, 545–554. [Google Scholar] [CrossRef]
  39. Song, U.; Kim, E.; Bang, J.H.; Son, D.J.; Waldmann, B.; Lee, E.J. Wetlands are an effective green roof system. Build. Environ. 2013, 66, 141–147. [Google Scholar] [CrossRef]
  40. Zehnsdorf, A.; Stock, N.; Richter, J.; Blumberg, M.; Müller, R.A. Grauwasserreinigung mit einer Sumpfpflanzenmatte unter Praxisbedingungen. Chem. Ing. Technol. 2016, 88, 1138–1144. (In German) [Google Scholar] [CrossRef]
  41. EN ISO 11732; Water Quality—Determination of Ammonium Nitrogen—Method by Flow Analysis (CFA and FIA) and Spectrometric Detection. ISO: London, UK, 2005.
  42. EN ISO 10304-1; Water Quality—Determination of Dissolved Anions by Liquid Chromatography of Ions—Part 1: Determination of Bromide, Chloride, Fluoride, Nitrate, Nitrite, Phosphate and Sulfate. ISO: London, UK, 2007.
  43. EN ISO 15681-1; Water Quality—Determination of Orthophosphate and Total Phosphorus Contents by Flow Analysis (FIA and CFA)—Part 1: Method by Flow Injection Analysis (FIA). ISO: London, UK, 2003.
  44. ISO 9308-2; Water Quality—Enumeration of Escherichia coli and Coliform Bacteria—Part 2: Most Probable Number Method. ISO: London, UK, 2012.
  45. Jurado, E.; Fernández-Serrano, M.; Nunez-Olea, J.; Luzon, G.; Lechuga, M. Simplified spectrophotometric method using methylene blue for determining anionic surfactants: Applications to the study of primary biodegradation in aerobic screening tests. Chemosphere 2006, 65, 278–285. [Google Scholar] [CrossRef] [PubMed]
  46. DWA-A 221; Principles for the Use of Small Sewage Treatment Plants; DWA Set of Rules. The German Association for Water, Wastewater and Waste (DWA): Hennef, Germany, 2019; ISBN 978-3-88721-911-6.
  47. European Union. Regulation (EU) 2020/741 of the European Parliament and of the council 25 May 2020 on Minimum Requirements for Water Reuse. Off. J. Eur. Union 2020, OJ L 177, 32–55. Available online: https://eur-lex.europa.eu/legal-content/EN/TXT/PDF/?uri=CELEX:32020R0741&from=EN (accessed on 15 August 2023).
  48. Magalhães Filho, F.J.C.; Sobrinho, T.A.; Steffen, J.L.; Arias, C.A.; Paulo, P.L. Hydraulic and hydrological aspects of an evapotranspiration–constructed wetland combined system for household greywater treatment. J. Environ. Sci. Health A 2018, 53, 493–500. [Google Scholar] [CrossRef] [PubMed]
  49. Standard DWA-A 262E; Principles for Dimensioning, Construction and Operation of Wastewater Treatment Plants with Planted and Unplanted Filters for Treatment of Domestic and Municipal Wastewater. The German Association for Water, Wastewater and Waste (DWA): Hennef, Germany, 2017; (Translated from German and Published in English).
  50. Saeed, T.; Sun, G. A review on nitrogen and organics removal mechanisms in subsurface flow constructed wetlands: Dependency on environmental parameters, operating conditions and supporting media. J. Environ. Manag. 2012, 112, 429–448. [Google Scholar] [CrossRef]
  51. Gross, A.; Wiel-Shafran, A.; Bondarenko, N.; Ronen, Z. Reliability of small scale greywater treatment systems and the impact of its effluent on soil properties. Int. J. Environ. Stud. 2008, 65, 41–50. [Google Scholar] [CrossRef]
  52. Randerson, P.F.; Moran, C.; Andrzej, B. Oxygen transfer capacity of willow (Salix viminalis L.). Biomass Bioenergy 2011, 35, 2306–2309. [Google Scholar] [CrossRef]
  53. Colliver, B.B.; Stephenson, T. Production of nitrogen oxide and dinitrogen oxide by autotrophic nitrifiers. Biotechnol. Adv. 2000, 18, 219–232. [Google Scholar] [CrossRef]
  54. Boyjoo, Y.; Pareek, V.K.; Ang, M. A review of greywater characteristics and treatment processes. Water Sci. Technol. 2013, 67, 1403–1424. [Google Scholar] [CrossRef] [PubMed]
  55. Wu, S.; Carvalho, P.N.; Muller, J.A.; Manoj, V.R.; Dong, R. Sanitation in constructed wetlands: A review on the removal of human pathogens and fecal indicators. Sci. Total Environ. 2016, 541, 8–22. [Google Scholar] [CrossRef] [PubMed]
  56. Arden, S.; Ma, X. Constructed wetlands for greywater recycle and reuse: A review. Sci. Total Environ. 2018, 630, 587–599. [Google Scholar] [CrossRef]
  57. Nolde, E. Greywater reuse systems for toilet flushing in multi-storey buildings–over ten years experience in Berlin. Urban Water 2000, 1, 275–284. [Google Scholar] [CrossRef]
  58. Chaillou, K.; Gérente, C.; Andrès, Y.; Wolbert, D. Bathroom greywater characterization and potential treatments for reuse. Water Air Soil Pollut. 2011, 215, 31–42. [Google Scholar] [CrossRef]
  59. Hernández Leal, L.; Temmink, H.; Zeeman, G.; Buisman, C.J.N. Characterization and anaerobic biodegradability of grey water. Desalination 2011, 270, 111–115. [Google Scholar] [CrossRef]
  60. Li, F.; Wichmann, K.; Otterpohl, R. Review of the technological approaches for grey water treatment and reuses. Sci. Total Environ. 2009, 407, 3439–3449. [Google Scholar] [CrossRef]
  61. Inbar, Y. New Standards for Treated Wastewater Reuse in Israel. In Wastewater Reuse—Risk Assessment, Decision-Making and Environmental Security; Zaidi, M.K., Ed.; NATO Science for Peace and Security Series; Springer: Berlin/Heidelberg, Germany, 2007; pp. 291–296. [Google Scholar]
  62. Badmus, S.O.; Amusa, H.K.; Oyehan, T.A.; Saleh, T.A. Environmental risks and toxicity of surfactants: Overview of analysis, assessment, and remediation techniques. Environ. Sci. Pollut. Res. 2021, 28, 62085–62104. [Google Scholar] [CrossRef]
  63. Chrispim, M.C.; Nolasco, M.A. Greywater treatment using a moving bed biofilm reactor at a university campus in Brazil. J. Clean. Prod. 2017, 142, 290–296. [Google Scholar] [CrossRef]
  64. Garland, J.L.; Levine, L.H.; Yorio, N.C.; Adams, J.L.; Hummerick, M.E. Response of greywater recycling systems based on hydroponic plant growth to three classes of surfactants. Water Res. 2004, 38, 1952–1962. [Google Scholar] [CrossRef]
  65. Hoffmann, H.C.; Platzer, M.; Winker, E.; von Muench, E. Technology Review of Constructed Wetlands—Subsurface Flow Constructed Wetlands for Greywater and Domestic Wastewater Treatment; Deutsche Gesellschaft fur Internationale Zusammenarbeit (GIZ) GmbH: Eschborn, Germany, 2011. [Google Scholar]
  66. Thon, A.; Kircher, W.; Thon, I. Constructed Wetlands on Roofs as a Module of Sanitary Environmental Engineering to Improve Urban Climate and Benefit of the On Site Thermal Effects. Miestu Zeldynu Formavimas 2010, 1, 191–196. [Google Scholar]
  67. Rosenzweig, M.L. Green roofs: New ecosystems to defend species diversity. Isr. J. Ecol. Evol. 2016, 62, 7–14. [Google Scholar] [CrossRef]
  68. Sailor, D.; Elley, T.B.; Gibson, M. Exploring the building energy impacts of green roof design decisions—A modeling study of buildings in four distinct climates. J. Build. Phys. 2011, 35, 372–391. [Google Scholar] [CrossRef]
  69. Driesen, E.; Van den Ende, W.; De Proft, M.; Saeys, W. Influence of Environmental Factors Light, CO2, Temperature, and Relative Humidity on Stomatal Opening and Development: A Review. Agronomy 2020, 10, 1975. [Google Scholar] [CrossRef]
  70. Blumberg, M. Wetland Roofs—A Multifunctional Green Roof Type—Basics and Perspectives from Engineering Practice. In Proceedings of the Closed Cycles and the Circular Society Conference, Wädenswil, Switzerland, 2–4 June 2020. [Google Scholar]
  71. Semeraro, T.; Scarano, A.; Buccolieri, R.; Santino, A.; Aarrevaara, E. Planning of Urban Green Spaces: An Ecological Perspective on Human Benefits. Land 2021, 10, 105. [Google Scholar] [CrossRef]
Figure 1. Diagram of a close-to-realistic PWR for domestic GW treatment that was used in this study and the progress of plant growth on it during the first three months (A, B, C, and D stand for four segments, where A is the top and D is the bottom segment).
Water 15 03375 g001
Figure 2. The BOD5 and COD concentrations observed in the inflow and outflow in the PWR system under different HLRs and compared with the limit value for discharge to the environment.
Water 15 03375 g002
Figure 3. The dynamics of NH4-N, NO3-N, and TN concentrations in the inflow and outflow of the PWR system observed under different HLRs.
Water 15 03375 g003
Figure 4. TP, TSS concentrations, and E. coli were counted in the greywater inflow and outflow of the PWR system with increasing HLRs.
Water 15 03375 g004
Figure 5. Dynamics of the AS concentrations in the inflow, outflow, and removal efficiency of the PWR system treating domestic greywater under different HLRs.
Water 15 03375 g005
Figure 6. Correlations between HLRs and mass removal rates of (a) BOD5; (b) COD; (c) NH4-N; (d) TN; (e) AS; (f) TP as a function of HLR that were observed during the whole investigation period of two years.
Water 15 03375 g006
Figure 7. Water loss due to EVT: (a) along the day with the daily mean temperature changes near the PWR investigated in a day of this study; (b) dependency of the maximum water loss on the maximum air temperature investigated in seven hot days.
Water 15 03375 g007
Figure 8. Vitality of the marsh plants, which were observed by measuring mean plant height, chlorophyll content, and stomatal conductance at four segments (A, B, C, and D) of the PWR in subsequent seasons (summer, autumn, spring) during this study.
Water 15 03375 g008
Table 1. Characteristics of mean inflow and treated GW mean outflow concentrations (mean ± SD) at the outlet of the PWR system in comparison with discharge guidelines and reclaimed water quality for agricultural irrigation (based on random sampling; samples collected during the experimental operation period of two years from April 2021 to April 2023, except where noted; n.p.: not provided).
ParametersUnitTreatment PerformanceDischarge Guidelines according to DWA-A 221 [46] dReclaimed Water Quality Requirements for Agricultural Irrigation according to the EU [47]
Inflow
(Mean ± SD)
Outflow
(Mean ± SD)
Reduction
(%)
N a
BOD5mg L–1285 ± 1699.0 ± 1196884010 e/25 f/25 g/25 h
CODmg L–1744 ± 65342 ± 3192103150n.p.
TSSmg L–1344 ± 6876.0 ± 6.59399n.p.10 e/35 f/35 g/35 h
NH4-Nmg L–116 ± 72.4 ± 2.783103n.p.n.p.
NO3-Nmg L–10.4 ± 0.75.3 ± 4.7-103n.p.n.p.
TNmg L–134 ± 1611 ± 766104n.p.n.p.
TPmg L–12.5 ± 2.60.24 ± 0.3385103n.p.n.p.
ASmg L–17.9 ± 4.40.4 ± 0.39351 bn.p.n.p.
E. coliMPN 100 mL–12.8 × 10⁶ ± 4.1 × 1064.4 × 104 ± 1.9 × 1051.81 c100n.p.10 e/100 f/1000 g/10,000 h
pH-7.0 ± 0.47.7 ± 0.2-102n.p.n.p.
DOmg L–10.8 ± 0.710.4 ± 3.2-102n.p.n.p.
EhmV−246 ± 50147 ± 43-102n.p.n.p.
ECµS cm–11054 ± 2761034 ± 239-102n.p.n.p.
Notes: a Number of samples; b Sampling started from January 2022; c Log-removal; d Discharge Class C; e Minimum reclaimed water quality Class A for all food crops, including root crops consumed raw and food crops where the edible portion is in direct contact with reclaimed water (all irrigation methods allowed); f Minimum reclaimed water quality Class B for food crops consumed raw where the edible portion is produced above ground and is not in direct contact with reclaimed water, processed food crops and nonfood crops, including crops to feed milk- or meat-producing animals (all irrigation methods allowed); g Minimum reclaimed water quality Class C for food crops consumed raw where the edible portion is produced above ground and is not in direct contact with reclaimed water, processed food crops and nonfood crops including crops to feed milk or meat-producing animals (drip irrigation or other irrigation methods); h Minimum reclaimed water quality Class D for industrial reuse, energy reuse, and seeded crops (all irrigation methods allowed).
Table 2. Pollutants mean mass loading rate, removal rate, and removal efficiency of the PWR system that were observed during the whole study period of two years.
ParametersMass Loading and Removal Rate
Loading Rate
(g m–2 d–1)
Removal Rate
(g m–2 d–1)
Efficiency
(%)
N a
BOD512.8 ± 1211.8 ± 12 9692
COD36 ± 4133.4 ± 3993 105
TSS15.2 ± 3014.9 ± 30 9499
NH4-N0.73 ± 0.550.59 ± 0.4784103
NO3-N0.02 ± 0.03--103
TN1.53 ± 1.31.10 ± 1.0571102
TP0.11 ± 0.160.10 ± 0.1587103
AS0.45 ± 0.390.43 ± 0.389451 b
E. coli1.48 × 109 c2.02 × 107 d1.86 e97
Notes: a Number of samples; b Sampling started from January 2022; c Inflow (MPN m–2 d–1); d Outflow (MPN m–2 d–1); e Log-removal.
Disclaimer/Publisher’s Note: The statements, opinions and data contained in all publications are solely those of the individual author(s) and contributor(s) and not of MDPI and/or the editor(s). MDPI and/or the editor(s) disclaim responsibility for any injury to people or property resulting from any ideas, methods, instructions or products referred to in the content.

