
Ecohydrological Footprint and Climate Trends in Lotic Ecosystems of Central Western Ghats


1
Energy and Wetland Research Group, Centre for Ecological Sciences, Indian Institute of Science, Bengaluru 560012, India
2
Centre for Sustainable Technology (Astra), Indian Institute of Science, Bengaluru 560012, India
3
Centre for Infrastructure, Sustainable Transportation and Urban Planning (CiSTUP), Indian Institute of Science, Bengaluru 560012, India
4
Department of Civil Engineering, Alva’s Institute of Engineering and Technology, Moodbidri 574227, India
*
Author to whom correspondence should be addressed.
Water 2023, 15(18), 3169; https://doi.org/10.3390/w15183169
Submission received: 6 July 2023
/
Revised: 27 August 2023
/
Accepted: 30 August 2023
/
Published: 5 September 2023
(This article belongs to the Section Water and Climate Change)
Abstract
:An ecohydrological assessment of lotic ecosystems would provide insights into understanding the symbiotic interactions of hydrological and ecological processes for sustainable catchment management to ensure water security and achieve sustainable development goals (SDG). Global monitoring reveals changing climate patterns due to the unabated anthropogenic activities altering the ecohydrological behavior of waterscapes and thus affecting the sustenance of natural resources. The current research investigates the ecohydrological footprint using a modified water balance method by accounting for climatic and land-use trends across three river catchments in the northern portion of the Central Western Ghats. Assessment of landscape dynamics using temporal remote sensing data indicates the reduction in forest cover in Mahadayi, Ghataprabha, and Malaprabha river basins with increased anthropogenic activities. Evaluation of climate trends shows rising temperatures over 0.4 °C in the last century with increasing rainfall. The consequence of enhanced rainfall is increased overland flows to the extent of 35–80% in all river basins. Water availability in streams during all seasons is evident in the catchment dominated by native forest cover, while streams are intermittent and seasonal at the transition zone and plains. Analyses of temperature and rainfall in the last century indicate higher spatial variations directly influencing surface and subsurface hydrology. The reduced native forest cover has directly affected the variations in the local temperatures and precipitation patterns. This highlights the need for maintaining the ecological integrity of watersheds with native vegetation cover for sustaining the natural resources (water, etc.) that support the livelihood of farmers with socio-economic benefits.
1. Introduction
Ecohydrology provides insights into the understanding of relationships between hydrological and biological processes for prudent management to improve water security and sustain biodiversity with opportunities by lessening the ecological footprint while maintaining balance within catchment processes [1]. The hydrological potential of waterscape and regional weather conditions are altered significantly with climate change [2,3]. Unplanned anthropogenic activities have triggered climate change, thereby increasing hydrological extremes. Additionally, with increasing instances of mismanagement of natural resources, there has been an escalation of vulnerabilities to the ecosystem and its habitants [4]. The ecosystems are being compromised globally, leading to deforestation with the decline and extinction of endemic species [5]. In the recent past, the conservation and management of ecosystems and natural resources have been advocated through global initiatives such as SEEA (System of Environmental-Economic Accounting) [6], MEA (Millennium Ecosystem Assessment) [7], SDG (Sustainable Development Goals) [8], etc. The SEEA framework integrates ecological, environmental, and economic datasets spatially and statistically to provide holistic multi-perspective interrelationships that are essential to protect the natural resources, understand the changing stocks of assets, etc., necessary to sustain society and their well-being. The MEA, i.e., preceding SEEA, provided a framework focused on the influence of anthropogenic activities on the regional ecosystems and their services, and vice-versa, i.e., how the alteration in ecosystem services has influenced human well-being. SDG provides a blueprint through specific goals for sustaining the planet. Of the seventeen SDGs, about seven SDGs such as: (i) zero hunger, (ii) good health and well-being, (iii) clean water and sanitation, (iv) responsible consumption and production, (v) climate change, (vi) life below water, and (vii) life on land, can be partly accomplished by prudent management of the water resources at watershed levels by realizing the potential of ecohydrological processes, considering the water resources and their variability across space and time.
The ecohydrological process is complex [9] due to the heterogenous landscapes with intricate weather patterns, distributions of rainfall, vegetation characteristics, topography, cropping patterns, and land management. Mismanagement leading to land degradation and deforestation has resulted in floods, droughts, crop failures, etc. The ecohydrological process being a part of the waterscape, is responsible for the evolution of habitat, species diversity, ecosystem arrangement, moderation, and sustenance of life forms. By 2025, about 1.8 million people will witness acute water stress, while agricultural and other societal water demands will escalate [10]. This makes it essential to ensure that beyond the societal factors, other water users need to be considered [11], recognizing the dynamics and variability of hydrological regimes in maintaining biodiversity and ecological processes [12]. This is supported by the National Water Policy of India 2012 [13], which states, “water is essential for sustenance of ecosystem, and therefore, minimum ecological needs should be given due consideration”. The honorable National Green Tribunal of India [14] emphasizes a minimum flow of 10 to 20% needs to be maintained across the rivers to sustain the ecological and hydrological services effectively.
Understanding spatial and temporal variations in water availability and demand across the waterscape is necessary for evaluating the ecohydrological process. In most cases, precipitation is the primary water source, followed by groundwater abstraction. The variation in the seasonal rainfall patterns influences the water availability in the catchment [15], and the landscape dynamics define the precipitation, surface storage, subsurface storage, and other hydrological cycle components [16,17,18,19]. Typically, the water demands in agriculture, domestic, industrial, potable, energy applications, etc., are generalized as blue and green water demand [10,20]. Blue waters are directly used by humans, from the surface or subsurface, and are stored in lentic or lotic systems. Blue water needs typically include domestic, industrial, irrigation, and power generation services. Over-exploitation of blue waters (surface and subsurface waters) would alter the hydrological regime, affecting the environmental flows [21,22]. Green water needs include water consumed by the natural environment, such as evapotranspiration from forests and water bodies. Studies in the Western Ghats, India, indicate that the ecohydrological process depends on the regional vegetation (native species), its maturity [16,23], and other processes. Safeguarding these natural ecosystems would ensure the sustenance of resources and significantly contribute to the regional economy against a degraded waterscape. Evaluating the spatiotemporal distribution of water availability and blue–green water demands aids in assessing the ecohydrological potential of the waterscape. Advancements in spatial technologies, coupled with the landscape ecology principles (including (i) time and space, (ii) heterogeneity, (iii) connectivity), have aided in evaluating the regional resource potential [24,25,26,27,28,29].
The Western Ghats, with numerous perennial rivers and a repository of rich biodiversity, have been ensuring water and food security in peninsular India [30,31,32,33]. However, alterations in the land cover [34] and changes in the climate leading to alterations in the spatial and temporal patterns of rainfall and temperature [35] have directly influenced the hydrological regime in the riverscape. Changing climatic patterns evident from recurring instances of higher intensity precipitation and a decline in rainy days have accentuated the severity of natural disasters such as floods, droughts, etc. Accounting for the hydrological regime dynamics with climate trends in a river basin is quintessential for prudent watershed management, which would help to achieve the sustainable development goals (SDGs) such as zero hunger (goal 2), climate change (goal 13), and life on land (goal 15). The current study evaluates the ecohydrological footprint using a modified water balance method by integrating climatic variations through geospatial tools in three river basins (Mahadayi, Malaprabha, and Ghataprabha). The selected rivers originate in the Central Western Ghats, of which two are east-flowing while the other is west-flowing. Ecohydrological assessment with land-use dynamics across the three river basins provides information on the linkages of the hydrologic regime with the catchment integrity through the basin-wide ecological and social characteristics linked to scenarios of different land-use regimes.
The novelty of the current study is the application of an integrated approach involving the application of geoinformatics for hydraulic and hydrological assessments while accounting for climatic variability. Spatial assessments highlight that flow hydraulics directly depend on the catchment integrity and habitat conditions. Validation through field investigations of hydraulic assessment highlights the need to maintain at least 22–24% of mean lean season flow in the streams to sustain dependent aquatic biota. Evaluating the sufficiency of the environmental flow helps in the decision-making process for prudent management of river basins by maintaining the ecosystem integrity in catchments and also aids in meeting the blue water demand. This study would aid in the decision-making process to develop sustainable management policies that support the livelihoods of dependent populations without compromising ecological requirements.
2. Study Area
Karnataka state hosts rich biodiversity, complex landscapes, varied climate, and undulating topography distributed among the ten agroclimatic zones [30,36,37]. The diverse physiological and climatic conditions have led to numerous east- and west-flowing rivers originating from the Western Ghats [38], a global biodiversity hotspot. Most rivers are managed considering only societal needs such as irrigation, power, etc., while compromising the ecological requirements. The alterations are influencing the flow regime in the landscapes, as the native forests have reduced to a considerable extent due to unplanned developmental activities involving large-scale land cover changes and management strategies [39,40,41]. Figure 1 and Table 1 provide details of the study region in riverscapes of Ghataprabha, Malaprabha, and Mahadayi (or Mandovi) chosen to understand the ecohydrological processes.
3. Methods
Figure 2 outlines the method adopted to assess the ecohydrological potential across the three basins based on the water balance principle. The technique involved: (i) data collation and preprocessing, (ii) land-use analyses, (iii) appraisal of climatic patterns, and (iv) assessment of ecohydrological footprint.
3.1. Data Collation and Preprocessing
The data used includes both spatial and non-spatial data. Spatial data collection involves collating multi-temporal satellite data, climate data, demographics, livestock, cropping patterns, crop water requirements, etc. Multi-temporal remote sensing data for the years 1972–1973 and 2018 were downloaded from the USGS portal (Landsat series of satellites) [47] to determine the variations in land use in the last 45 years. Radar data, i.e., SRTM, was acquired to understand the topography of the catchments and delineate catchments. Forest maps of south India procured from the French Institute [48] were used to identify the forest types. Virtual earth databases (Google Earth [49], Bhuvan [50]) were effectively used to geo-rectify the satellite data and classify it into nine land-use classes. Population demographics at the village level were acquired from the Census of India for the last three decades, which essentially indicate the variations and aid in deriving the domestic water demand in the catchment. Livestock data such as census [51] and water requirements (from field investigations) were used to assess livestock water demands. Data on agriculture, such as crop water demand, crop type, cropping pattern, etc., were obtained through public interviews using structured questionnaires and agriculture portals [52,53,54,55,56]. Climatic data such as extra-terrestrial solar radiation, precipitation, and temperature at spatial and temporal scales were acquired from the Indian Metrological Department [57], Princeton University Hydrology Database [58], Regional Climate Change Portal [59], NASA Power portal [60], and WorldCLIM [43] data portals.
3.2. Land-Use Analyses
Multi-resolution remote sensing data from 1973 and 2018 were resampled to a common resolution of 30 m. Training polygons were digitized with the help of virtual earth data and supplemented through field investigations and forest maps. A supervised classifier based on the Gaussian maximum likelihood algorithm [61] was used to classify the remote sensing data into nine land-use classes. Accuracy assessment of land-use information was done through kappa statistics. Multi-temporal land uses aided in understating changes in land use across the two timeframes.
3.3. Analysis of Climatic Patterns and Trends
Long-term climate data on a 0.25-degree grid from 1950 and 2022 for three catchments were assessed to understand the spatiotemporal variability of temperature, precipitation, and rainy days. The climate trends were evaluated by linear regression across the spatial grids.
3.4. Ecohydrological Footprint
The ecohydrological footprint was assessed through an integrated approach involving geoinformatics for hydraulic and hydrological assessments, while accounting for climatic variability. The ecohydrological footprint provides insights into the variability of natural resources, which are crucial for developing plans toward sustainable resource management considering both anthropogenic and environmental needs. The potential of the catchment hydrological process to cater to the regional requirement is evaluated based on the demand and supply water footprints. The hydrological footprint is assessed spatially by considering the blue water demand (domestic, agriculture, irrigation, environmental flows), green water demand (evapotranspiration from forested landscapes), regional climatic conditions, green water availability (soil moisture (intermediate vadose zone waters)), and blue water availability (overland flow, subsurface (pipe/channel) flow, base flow, water stored in reservoirs).
The water availability in any catchment depends on the local long-term average rainfall and behavior of flow patterns, which include direct runoff, soil moisture, and subsurface runoff. The water demand in the region is classified into blue and green. Blue water consists of all waters managed for societal benefits (irrigation, domestic, livestock, etc.) and the environmental flows are essential for the other users [11,14,62,63]. Forest water requirements, i.e., evapotranspiration from forests, are considered for green water demand.
Overland flows were evaluated for three river basins by modifying empirical equations [15], and [64] using localized factors to match the local flow regimes. Krishna Rao’s Equation was used to evaluate the potential groundwater [65]:
where R is groundwater recharge, P is annual precipitation.
Net rainfall in the catchment contributing to river flows was evaluated by considering the surface storage rates and interception. In the Indian context, interception rates range up to 30% [19]. Groundwater and lateral flow in the catchments were evaluated based on the specific yield and porosity of the soil substrata and geological stratum. Green water (evapotranspiration) was estimated through the Hargreaves method considering long-term mean monthly temperatures and solar radiation to estimate. Agriculture water needs in the catchment were determined considering crop type, spatial extent, and water requirement per crop and according to the growth phase. Domestic water requirements were considered in the range of 85 to 150 lpcd (liters per capita per day), varying across seasons; likewise, livestock water requirements depended on animal type and season (Table 2). Environmental water demand was estimated based on the Tennant Montana method, which accounts for 20% to 30% of low-flow conditions to sustain the biotic elements in the lotic aquatic ecosystem. This is comparable to earlier studies in the Western Ghats (Karnataka) [1,66,67] and the Honorable NGT (National Green Tribunal) strictures [14].
The ecohydrological status of a river basin was computed as a relative function of water availability to that of water demand.
4. Results and Discussion
4.1. Land Use
Land-use analyses of Ghataprabha, Malaprabha, and Mahadayi river basins were carried out through a supervised classifier based on the Gaussian maximum likelihood algorithm for 1972–1973 and 2018, as depicted in Figure 3.
Temporal land-use assessments indicated agricultural activities dominated the Ghataprabha river catchment. The deciduous forests have declined to 7.08%, and scrub jungles have reduced to 6.8% due to anthropogenic activities, evident from the relative increase in built-up, horticulture, agriculture, and water bodies. Construction of reservoirs such as Alamatti, Hidkal, Shirur, Rakashop, and Jangamhatti after the 1980s led to an increase in surface water storage over twofold with an escalation in cultivation activities. In the upstream, particularly toward Kolhapur, about 50% of evergreen forests at the Ghats have transformed into horticulture and croplands in the last 45 years. Built-up areas have increased over 200 times and can be observed in the taluks of Belagavi, Mudhol, and Bagalkot. The temporal land-use assessments in the Malaprabha river catchment indicate increasing built-up areas due to the policy implementation of a smart city project in Hubli and industrial developments in Gadag. Large-scale agricultural activity increases were observed during the last 4.5 decades, particularly in the Deccan plateau. The area under agriculture (croplands and horticulture) has increased from 73.6% to 83.2% at the cost of open spaces, scrub jungles, and grasslands. The Mahadayi river catchment has become distinctly different compared to the Ghataprabha and Malaprabha river catchments. The catchment was predominantly covered with native forests of over 70% in the 1970s and has now declined to less than 50%. The native evergreen forests are intact due to the stringent forest conservation norms (The Forest Conservation Act, 1980 and Wildlife Protection Act, 1972, Government of India). In contrast, deciduous forest cover has reduced by a considerable extent from 25.2% to 7.9% due to the escalation in horticultural activities from 4.5% to 29.%, and croplands have increased from 6.0% to 9.2%.
4.2. Climatic Trends
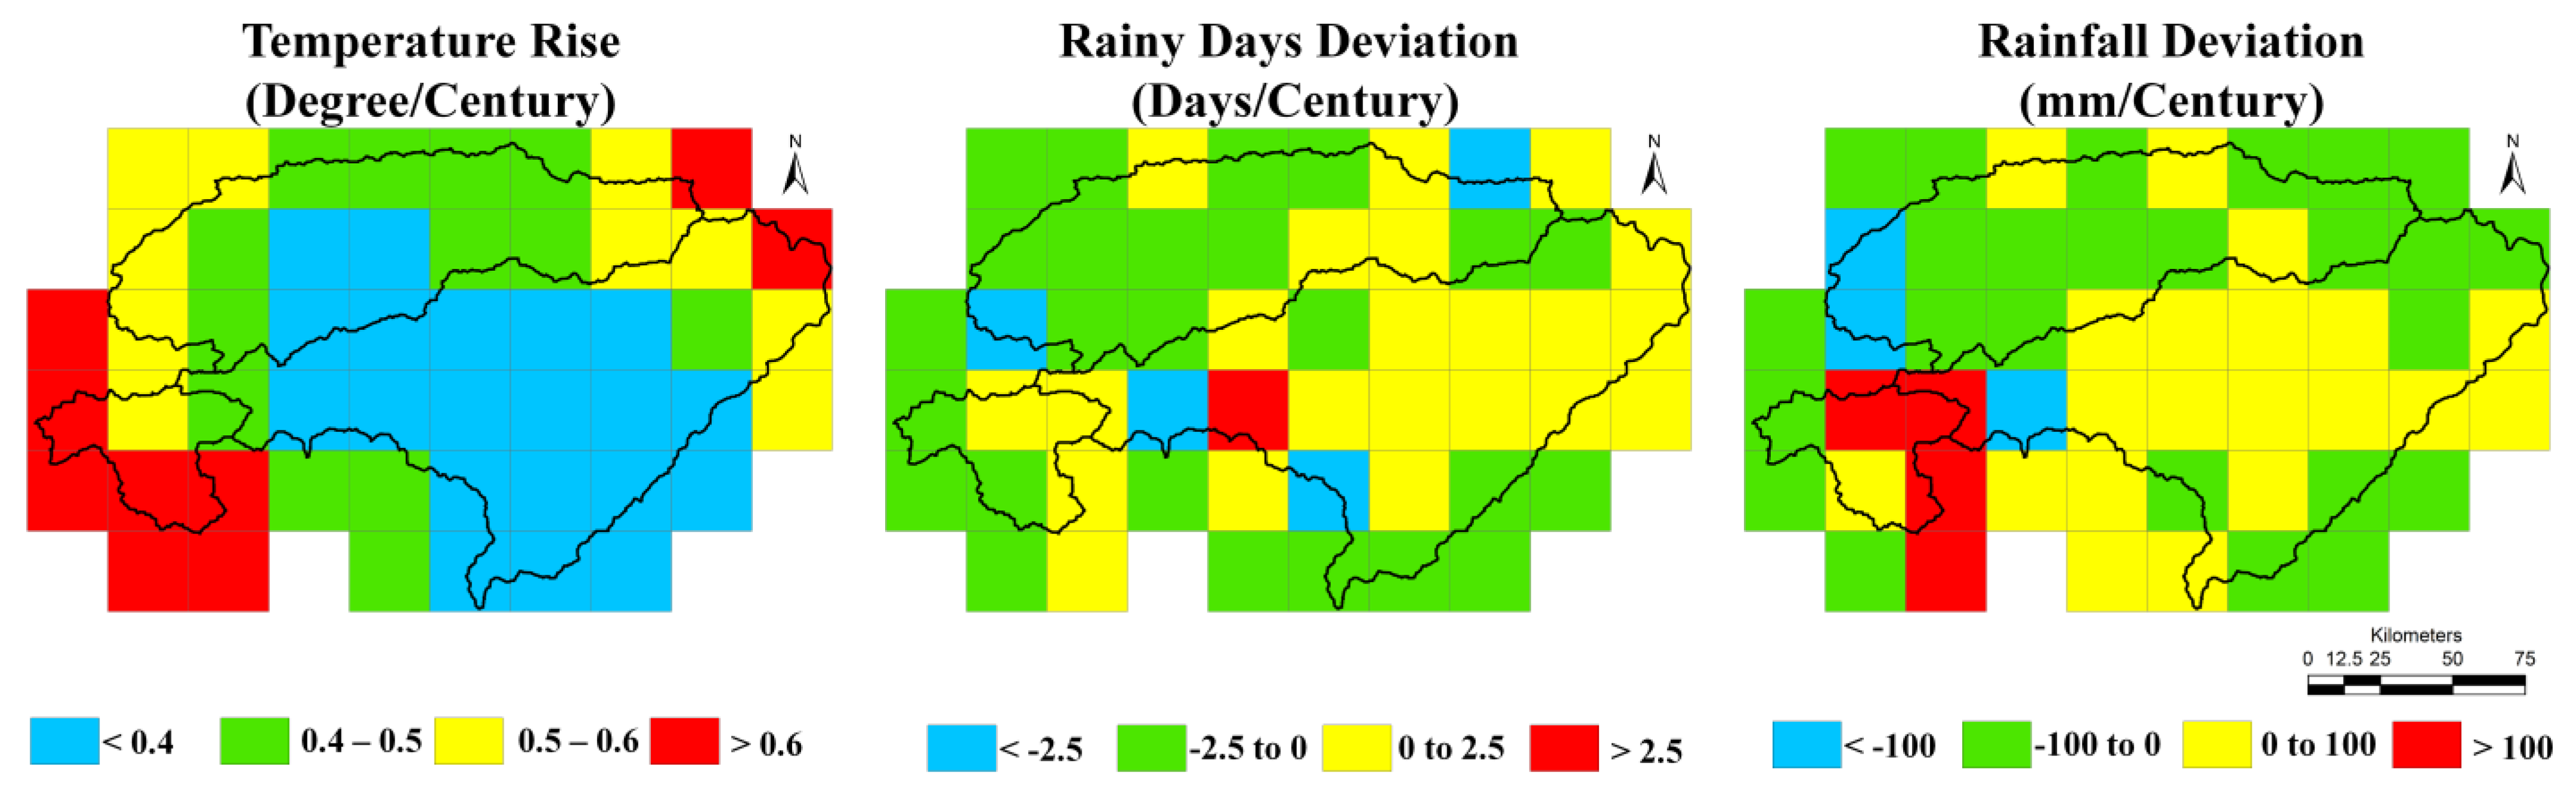
Figure 4 depicts the spatiotemporal variation of climatic parameters such as temperature, rainy days, and precipitation, which highlight significant changes in climatic conditions with changes in the structure of landscapes, evident from an increase in the temperature by 0.6 °C per century with the loss of native vegetation in the Mahadayi river catchment. Similarly, the number of rainy days has decreased to 2.5 days, while rainfall has reduced to 100 mm and over 100 mm in the coastal transition zones. Compared to this, in the Mahadayi Ghats, the temperature has risen by 0.4 and 0.6 °C per century. In contrast, positive trends are noticed, with rainfall increasing by over 100 mm and rainy days increasing by 2.5 days, and this may be due to the loss of aerodynamics caused by the decline of native forests with tall trees in the southern and central regions of the Western Ghats [67].
Temperature variations in the Malaprabha catchment range from 0.3 to just over 0.6 °C per century; on average, the rate of temperature increase is less than 0.4 °C per century. In regions where native forest cover has been lost, particularly in the northeast of the catchment, the temperature increase has reached 0.6 °C with increased precipitation up to 100 mm and an increase in rainy days by 2.5 days. A similar situation prevails in the Ghataprabha catchment, where temperatures have risen between 0.4 and 0.6 °C due to the decline of heat sinks (vegetation cover) in the Ghats and transition zones and have decreased to <0.4 °C with the construction of the Hidkal dam. As a result of the loss of forests in the eastern regions along the catchment, temperatures have risen by >0.5 °C. The loss of forests in the central and upstream areas of Ghataprabha has compelled the movement of precipitation-bearing clouds, resulting in a decline in the number of rainy days and precipitation in the catchment.
4.3. Hydrological Regime and Ecological Footprint
Figure 5 depicts the river-basin-wide hydrological footprint assessed spatially by considering the blue water demand, green water demand, regional climatic conditions, green water availability, and blue water availability. Large-scale changes were observed in land uses across the catchments, and ecohydrological analyses indicate increases in water demands with a transition to agrarian landscapes coupled with inappropriate cropping (water-intensive crops) and inefficient water management.
Precipitation in the Western Ghats is relatively higher, and the landscape with native vegetation is porous (and permeable), aiding in the infiltration of rainwater to groundwater and vadose zones, i.e., acting like a subsurface reservoir with controlled release of water for sustaining the regional hydrological needs during the post-monsoon. Water availability during the post-monsoon period in streams of the Ghats regions with the native vegetation cover, followed by the transition zones and plains in the studied three river basins, highlight the role of native forests in sustaining water. The transition regions in Malaprabha and Ghataprabha have water availability for up to 7 to 8 months (monsoon and four months post-monsoon). In comparison, the plains have acute water scarcity of over 7 to 9 months. The loss of natural forests to burgeoning horticultural practices has led to water deficiency in the Ghats and coastal plains of the Mahadayi basin. The presence of reservoirs in the plain regions have improved the situation, with the regulated water availability for a longer duration as per the demand in the command areas, which promotes food security. However, acute rainfall in recent years has aggravated water scarcity. Prudent management of native forests in the catchment areas of the reservoirs and the Ghats with location-specific climate resilient crops and improvements in the water-use efficiency would aid in the attainment of the SDGs at the regional scale, which includes zero hunger, good health and well-being, clean water, sanitation, responsible consumption and usage, etc.
Temporal assessment of the ecohydrological regime highlights the influence of alterations in the landscape structure on regional hydrology. In all the catchments, the decline in native forest cover has enhanced runoff during monsoon seasons and lowered infiltration, resulting in decreased water in the substrata (vadose and groundwater zones) with acute water scarcity during the post-monsoon period. Assessment of water demand shows reducing green water demand with an increasing blue water demand in the degraded catchment (Table 3). Evaluation of the hydrologic regime in the Ghataprabha river basin reveals a 82% increase in surface runoff (during monsoon), an escalation in water demand in the agricultural and domestic sectors by 15% and 45%, respectively, while water availability in the vadose has declined by 26%. Reduction in forest cover has led to a decrease in green water (44%). Similarly, in the Malaprabha river basin, runoff and agricultural demands have increased by 8% and 14%, respectively, reduction in subsurface waters by 16%, and a reduction in transpiration by 10%. Mahadayi is one of the most dynamic catchments, with catchment degradation resulting in a 35% increase in the surface runoff, 23% reduction in the infiltration of rainwater to the vadose zone, 34% increase in evaporation with an increase in the regional temperature, and a simultaneous increase in the blue water demand by 12-fold due to the escalated agricultural (horticulture and croplands) activities.
Assessment of regional hydrology with the catchment integrity indicates that the large-scale alteration in the land cover leading to the decline in native forests has resulted in perennial streams transitioning to intermittent streams (6 to 8 months of water availability) in the Western Ghats. In contrast, most streams in the plains are seasonal.
Spatial assessment highlights that flow hydraulics directly depend on the catchment integrity and habitat conditions. Catchment integrity plays a decisive role in sustaining the water, evident from the presence of streams with 12 months of water availability in the catchment dominated by vegetation (>60%) of native species. Infiltration of 55 to 60% of precipitation is important as the soil is porous with the presence of native species and diverse soil microorganisms. Analyses of soil samples from the catchments of perennial, intermittent streams reveal that soils in the perennial streams’ catchment have the highest moisture content (>60%), higher nutrients (C, N, and K), and lower bulk density (0.48 to 0.52 g/cc). Compared to this, the catchment of intermittent and seasonal streams had a higher bulk density (0.87–1.53 g/cc) and relatively lower nutrients. Due to this, water infiltrates in the porous or permeable soil, and fills the underlying namely saturated zone and vadose zones in the catchments of perennial streams [1,65]. Monsoon precipitation in this region lasts for about 4 months and the surface runoff during the monsoon is due to the precipitation (after saturation of underlying regions). After the monsoon recedes, the water stored in the vadose regions and saturated zones flows laterally towards the stream for about 6–8 months (as pipe flow in the post-monsoon period of 4 months and base flow during summer). Water infiltration allows water storage in the saturated and vadose zones, which is crucial for the sustenance of water in the streams during lean seasons. This emphasizes that native vegetation helps in retarding the water flow in the catchment by allowing the infiltration of >60% of water. Contiguous forests of native species moderate the local climate (through transpiration) and also act as sponges by retaining the water, which is slowly released to the streams during the lean seasons, thereby sustaining the water availability in the catchment to meet biotic needs throughout the year [1,65]. Streams in the catchment dominated by a single species (monoculture plantations) had adequate flow for 6–8 months. This is mainly due to lowered infiltration due to the higher bulk density of soil and also litter from monoculture plants requires a longer time for degradation. Water availability for 4 months is observed in the streams of the degraded catchment with vegetation cover less than 30%. Field investigations coupled with hydraulic assessment through geoinformatics highlight the need to maintain at least 22–24% of mean lean season flow in the streams to sustain dependent aquatic biota, comparable to the earlier study [65].
Alterations in the land cover coupled with changing climatic patterns have contributed to: (i) higher instream flows in the monsoon season, (ii) declined infiltration and recharge of groundwater resulting in the conversion of erstwhile perennial streams to either intermittent or seasonal streams, impacting the sustenance of water. In addition to land-use moderation, climate changes at local and global levels would hamper the water cycle causing hydrological extremes such as drought and floods, which would affect regional food security, water availability, and sanitation, etc., necessitating appropriate strategies to improve the landscape integrity to sustain the ecohydrological processes and achieve the sustainable development goals (SDGs) at the regional scale. Improvements in the ecohydrological process can be partially achieved through adaptive strategies by improving the regional native vegetation cover (which enhances vadose water and groundwater storage), through infiltration or water recharge pits, precision agriculture, and changing cropping type and pattern at a micro watershed level.
Assessment of the ecohydrological status confirms the role of forests with the native species in retaining the water (in the catchment), which is available to meet the demands throughout the year.
4.4. Limitation of the Approach
The limitation of the approach is the availability of appropriate information on the habitat suitability of endemic taxa for habitat analyses and that it requires long-term ecological monitoring.
4.5. Scope for Further Research
The current work assessed the ecohydrologic footprint of river basins, considering land-use dynamics with climate trends. Land-use dynamics leading to land degradation and deforestation in the watershed alter the hydrologic processes, converting perennial streams to intermittent or seasonal streams. Considering the imminent threat due to changes in the climate with global warming and the need for adopting climate resilient strategies requires prior information on land cover dynamics with climate patterns, which entails the integration of validated climatic models with land-use and hydrologic models.
5. Conclusions
Aquatic (lentic or lotic) ecosystems with numerous services sustain the water requirement of the environment and society. However, unplanned developmental activities have compromised the integrity of ecosystems, evident from the decline of native forests (with abundant and diverse native species) along riverscapes coupled with an increase in the blue water demand, which has contributed to the acute water crisis. The loss of native forest cover has altered the climatic regime, evident from an increase in the temperatures of >0.5 °C, and the precipitation patterns with a relative decline in rainy days and precipitation in the Southern and Central Western Ghats. The blue water demand for agriculture (croplands and horticulture) activities has increased by 14 and 15% in Malaprabha and Ghataprabha, respectively, while in Mahadayi, it has increased by 12-fold.
Assessment of the ecohydrological potential across the sub-catchments depicts that native forests in the catchment would sustain water during all seasons (perennial supply) while meeting blue water demands. However, alternations in catchment integrity due to changes in the native land cover, inappropriate crops, and inefficient water management have contributed to water-scarce conditions in the watersheds of the transition zones, plain, and coastal areas. Alterations in the landscape integrity have given impetus to changes in the climate, impacting the hydrologic regime. Modifications in the hydrologic regime are evident from the conversion of perennial streams to intermittent or seasonal streams, which would seriously affect the livelihood of farmers due to water and food insecurity, with frequent conflicts in society. Hence, sustaining the hydrologic regime through restoring the degraded catchment with novel and innovative watershed management approaches and promoting climate resilient and less water-demanding crops (such as millets, pulses, etc.) is quintessential. Evaluating blue and green water at disaggregated watershed levels provided vital insights for the prudent management of natural resources (land and water) to achieve the SDGs.
Author Contributions
Conceptualization, development of methods, soft computing, field investigation, validation, writing, formatting, and reviewing were carried out by both authors. All authors have read and agreed to the published version of the manuscript.
Funding
Field research is funded by the EIACP (ENVIS) division, the Ministry of Environment, Forests and Climate Change, Government of India, and infrastructure support is provided by the Indian Institute of Science.
Data Availability Statement
Data are archived at our data portal https://wgbis.ces.iisc.ac.in. Research page URL of Indian Institute of Science can be found at: https://wgbis.ces.iisc.ac.in/energy/.
Acknowledgments
We thank Omkari for her assistance during the field data collection and spatial analyses.
Conflicts of Interest
The authors declare no conflict of interest.
References
- Ramachandra, T.V.; Vinay, S.; Bharath, S.; Shashishankar, A. Eco-Hydrological Footprint of a River Basin in Western Ghats. Yale J. Biol. Med. 2018, 91, 431–444. [Google Scholar]
- Su, R.; Sun, R. Impact of climate change on the hydrological cycle. J. Water Clim. Change 2021, 12, V. [Google Scholar] [CrossRef]
- Kundzewicz, Z.W. Climate change impacts on the hydrological cycle. Ecohydrol. Hydrobiol. 2008, 8, 195–203. [Google Scholar] [CrossRef]
- Watson, R.; Baste, I.; Larigauderie, A.; Leadley, P.; Pascual, U.; Baptiste, B.; Demissew, S.; Dziba, L.; Erpul, G.; Fazel, A.; et al. Summary for Policymakers of the Global Assessment Report on Biodiversity and Ecosystem Services of the Intergovernmental Science-Policy Platform on Biodiversity and Ecosystem Services; IBPES: Bonn, Germany, 2019. [Google Scholar]
- Verones, F.; Saner, D.; Pfister, S.; Baisero, D.; Rondinini, C.; Hellweg, S. Effects of consumptive water use on biodiversity in wetlands of international importance. Environ. Sci. Technol. 2013, 47, 12248–12257. [Google Scholar] [CrossRef]
- System of Environmental-Economic Accounting 2012—Central Framework. In White Cover Publication; Food and Agricultural Organization: Rome, Italy, 2012; Available online: https://unstats.un.org/unsd/envaccounting/seearev/seea_cf_final_en.pdf (accessed on 20 January 2023).
- Millenium Ecosystem Assessment. In Ecosystems and Human Well-Being: A Framework for Assessment; Island Press: Washington, DC, USA, 2005; Available online: https://www.millenniumassessment.org/documents/document.356.aspx.pdf (accessed on 20 January 2023).
- UNDESA. Sustainable Development Goals. Division for Sustainable Development Goals. 2022. Available online: https://sdgs.un.org/ (accessed on 20 January 2023).
- Xu, Z.X.; Li, L.; Zhao, J. A distributed eco-hydrological model and its application. Water Sci. Eng. 2017, 10, 257–264. [Google Scholar] [CrossRef]
- Veettil, A.V.; Mishra, A.K. Water security assessment using blue and green water footprint concepts. J. Hydrol. 2016, 542, 589–602. [Google Scholar] [CrossRef]
- Gopal, B. Environmental Flows: An Introduction for Water Resources Managers; National Institute of Ecology: Delhi, India, 2013. [Google Scholar]
- Poff, N.L.; Allan, J.D.; Bain, M.B.; Karr, J.R.; Prestegaard, K.L.; Richter, B.D.; Sparks, R.E.; Stromberg, J.C. The Natural Flow Regime. BioScience 1997, 47, 769–784. [Google Scholar] [CrossRef]
- Central Water Commission. National Water Policy. Available online: http://cwc.gov.in/sites/default/files/nwauser/nwp-lectnote6.pdf (accessed on 20 January 2023).
- National Green Tribunal. Environmental/Minimum Flow of the Rivers Despite Hydro Projects; National Green Tribunal: New Delhi, India, 2023; Volume 628. [Google Scholar]
- Mutreja, K.N. Applied Hydrology; Tata McGraw-Hill: New Delhi, India, 1995. [Google Scholar]
- Ramachandra, T.V.; Vinay, S.; Bharath, S.; Chandran, M.D.S.; Bharath, H. Aithal. Insights into riverscape dynamics with the hydrological, ecological and social dimensions for water sustenance. Curr. Sci. 2020, 118, 1379–1393. [Google Scholar] [CrossRef]
- Bruijnzeel, L.A. Forest Hydrology. In The Forests Handbook; Evans, J., Ed.; Blackwell Science Ltd.: Oxfod, UK, 2001; pp. 301–343. [Google Scholar] [CrossRef]
- Pereira, H.C. Hydrology of moist tropical forests and effects of conversion: A state of knowledge review. J. Hydrol. 1991, 129, 397–399. [Google Scholar] [CrossRef]
- Putty, M.R.Y.; Prasad, R. Understanding runoff processes using a watershed model—A case study in the Western Ghats in South India. J. Hydrol. 2000, 228, 215–227. [Google Scholar] [CrossRef]
- Wu, J.; Deng, G.; Zhou, D.; Zhu, X.; Ma, J.; Cen, G.; Jin, Y.; Zhang, J. Effects of climate change and land-use changes on spatiotemporal distributions of blue water and green water in Ningxia, Northwest China. J. Arid Land 2021, 13, 674–687. [Google Scholar] [CrossRef]
- Acreman, M. Environmental flows—Basics for novices. Interdiscip. Rev. Water 2016, 3, 622–628. [Google Scholar] [CrossRef]
- Richter, B.D. Re-thinking environmental flows: From allocations and reserves to sustainability boundaries. River. Res. Appl. 2009, 26, 1052–1063. [Google Scholar] [CrossRef]
- Hewlett, J.D. Principles of Forest Hydrology. EOS 1983, 64, 572. [Google Scholar] [CrossRef]
- Risser, P.G. Landscape ecology: State of the art. In Landscape Heterogeneity and Disturbance; Springer: New York, NY, USA, 1983; pp. 3–14. [Google Scholar]
- Bormann, F.H. Landscape ecology and air pollution. In Landscape Heterogeneity and Disturbance; Springer: New York, NY, USA, 1983; pp. 37–57. [Google Scholar]
- Forman, R.T.T. Some general principles of landscape and regional ecology. Landsc. Ecol. 1995, 10, 133–142. [Google Scholar] [CrossRef]
- Harris, L.D. The Fragmented Forest: Island Biogeography Theory and the Preservation of Biotic Diversity; University of Chicago Press: Chicago, IL, USA, 1984. [Google Scholar]
- Gregory, S.; Ashkenas, L. Riparian management guide—Willamette National Forest; USDA Forest Service, Willamette National Forest: Eugene, OR, USA, 1990. [Google Scholar]
- Turner, M.G. Landscape Ecology: The Effect of Pattern on Process. Annu. Rev. Ecol. Syst. 1989, 20, 171–197. [Google Scholar] [CrossRef]
- Daniels, R.R.J.; Venkatesan, J. Western Ghats-Biodiversity, People, Conservation; Rupa & Company: New Delhi, India, 2008. [Google Scholar]
- India Water Portal. Western Ghats: The Green Gold of India. Available online: http://www.indiawaterportal.org/articles/western-ghats-green-gold-india (accessed on 12 December 2022).
- India Biodiversity Portal. The Western Ghats. Available online: https://thewesternghats.indiabiodiversity.org/ (accessed on 12 December 2022).
- Ray, R.; Subash Chandran, M.D.; Ramachandra, T.V. Hydrological importance of sacredforest fragments in Central Western Ghats of India. Trop. Ecol. 2015, 56, 87–99. [Google Scholar]
- Ramachandra, T.V.; Bharath, S. Global Warming Mitigation Through Carbon Sequestrations in the Central Western Ghats. Remote Sens. Earth Syst. Sci. 2019, 2, 39–63. [Google Scholar] [CrossRef]
- Lindsey, R.; Dahlman, L. Climate Change: Global Temperature. Climate Watch Magazine NOAA Climate.org. 2020. Available online: https://www.climate.gov/news-features/understanding-climate/climate-change-global-temperature (accessed on 10 May 2020).
- EMPRI. Agroclimatic Zones of Karnataka. ENVIS Centre Karnataka. 2013. Available online: https://empri.karnataka.gov.in/uploads/media_to_upload1682581208.pdf (accessed on 13 August 2021).
- Shankar, R.K. Digital Flora of Karnataka. Herbarium JCB, IISc. 2016. Available online: http://florakarnataka.ces.iisc.ac.in/hjcb2/contact.php (accessed on 13 August 2021).
- Ramachandra, T.V.; Vinay, S.; Bharath, S.; Bharath, H.A. Profile of Rivers in Karnataka; Sahyadri Concervation Series 71; ENVIS Technical Report 129; Indian Institute of Science: Bangalore, India, 2017. [Google Scholar]
- Ramachandra, T.V.; Bharath, S.; Nimish, G. Modelling landscape dynamics with LST in protected areas of Western Ghats, Karnataka. J. Environ. Manag. 2018, 206, 1253–1262. [Google Scholar] [CrossRef]
- Ramachandra, T.V.; Bharath, S. Geoinformatics based Valuation of Forest Landscape Dynamics in Central Western Ghats, India. J. Remote Sens. GIS 2018, 7, 1000227. [Google Scholar]
- Ramachandra, T.V.; Bharath, S.; Vinay, S.; Bharath, H.A. Ecosystem Extent Account for Karnataka State, India—Report on NCAVES Project; NCAVES: Southern Pines, NC, USA, 2021. [Google Scholar]
- Office of the Registrar General & Census Commissioner. Census of India 2011. Ministry of Home Affairs, Government of India. Available online: http://www.censusindia.gov.in (accessed on 13 August 2020).
- Hijmans, R.J.; Cameron, S.E.; Parra, J.L.; Jones, P.G.; Jarvis, A. WorldClim Version 1.4. Available online: http://www.worldclim.org (accessed on 13 August 2020).
- Jarvis, A.; Reuter, H.I.; Nelson, A.; Guevara, E. SRTM 90m Digital Elevation Database v4.1. Cgiar-Csi. Available online: https://csidotinfo.wordpress.com/data/srtm-90m-digital-elevation-database-v4-1/ (accessed on 22 June 2021).
- Central Ground Water Board. Watershed Atlas of India. Ministry of Water Resources, Government of India. Available online: http://cgwb.gov.in/sites/default/files/MainLinks/Karnataka_State_Report_Resource_2020.pdf (accessed on 12 September 2021).
- National Bureau of Soil Survey and Land Use Planning. ICAR-NBSS&LUP. Available online: https://www.nbsslup.in/ (accessed on 10 October 2021).
- U.S. Geological Survey. Earthexplorer. Available online: https://earthexplorer.usgs.gov (accessed on 31 January 2022).
- Pascal, J.P. Explanatory Booklet on the Forest Map of South India; French Institute of Pondicherry: Puducherry, France, 1986. [Google Scholar]
- Google Earth. Available online: https://www.google.com/intl/en_in/earth/ (accessed on 7 June 2022).
- National Remote Sensing Centre. Bhuvan. Indian Space Research Organisation, Government of India. Available online: http://bhuvan.nrsc.gov.in/ (accessed on 6 June 2022).
- Department of Animal Husbandry and Veterinary Services. Livestock Census. Government of Karnataka. Available online: http://www.ahvs.kar.nic.in/en-reportsstat.html (accessed on 2 June 2022).
- Department of Economics and Statistics. Agriculture. Available online: www.tn.gov.in/deptst/agriculture.pdf (accessed on 2 June 2022).
- My Agriculture Information Bank. AgriInfo. Available online: http://www.agriinfo.in/ (accessed on 1 June 2022).
- Karnataka State Department of Agriculture. Profile of Agriculture Statistics-Karnataka State. Available online: http://raitamitra.kar.nic.in/KAN/Document/agriprop.pdf (accessed on 1 June 2022).
- Food and Agriculture Organisation. Crop Water Needs; Food and Agriculture Organisation: Rome, Italy; Available online: http://www.fao.org/docrep/S2022E/s2022e07.htm (accessed on 10 June 2022).
- Karnataka State Department of Agriculture. Raitamitra. Available online: http://raitamitra.kar.nic.in (accessed on 12 July 2022).
- Indian Meterological Department. Hydrometerological Services; Ministry of Earth Sciences Government of India: New Delhi, India. Available online: https://mausam.imd.gov.in/responsive/servicesHydrological.php (accessed on 1 June 2022).
- Terrestrial Hydrology Research Group. Global Meteorological Forcing Dataset for Land Surface Modeling; Princeton University: Princeton, NJ, USA; Available online: https://data.ucar.edu/dataset/global-meteorological-forcing-dataset-for-land-surface-modeling (accessed on 25 January 2021).
- Berkeley Earth. Regional Climate Change: Global Data. Available online: http://berkeleyearth.org/ (accessed on 25 June 2021).
- NASA. NASA Prediction of World Energy Resources. The Power Project. Available online: https://power.larc.nasa.gov/data-access-viewer/ (accessed on 20 June 2022).
- Lillesand, T.M.; Kiefer, R.W.; Chipman, J.W. Remote Sensing and Image Interpretation; Wiley: New York, NY, USA, 2004. [Google Scholar]
- International Water Centre. The Brisbane Declaration. Available online: http://www.watercentre.org/news/declaration (accessed on 28 January 2023).
- Raghunath, H.M. Hydrology-Principles, Analysis and Design; Wiley Eastern Limited: New Delhi, India, 1985. [Google Scholar]
- Ramachandra, T.V. Integrated Ecological Carrying Capacity of Uttara Kannada District, Karnataka; Sahyadri Conservation Series 47; ENVIS Technical Report 87; Indian Institute of Science: Bangalore, India, 2014. [Google Scholar]
- Ramachandra, T.V.; Vinay, S.; Bharath, S.; Subash Chandran, M.D.; Bharath, H.A. Eco-Hydrological Footprint of Sharavathi River Basin. In Proceedings of the Lake 2018: Conference on Conservation and Sustainable Management of Riverine Ecosystems, Bangalore, India, 22–25 November 2018. [Google Scholar]
- Vinay, S.; Vishnu, D.M.; Srikanth, N.; Chandran, M.D.S.; Bharath, S.; Shashishankar, A.; Ramachandra, T.V. Landscapes and Hydrological Regime Linkages: Case Study of Chandiholé, Aghanashini. In Proceedings of National Seminar for Research Scholars, Coimbatore; Indian Institute of Science: Bangalore, India, 2017. [Google Scholar]
- Ramachandra, T.V.; Bharath, S. Carbon Sequestration Potential of the Forest Ecosystems in the Western Ghats, a Global Biodiversity Hotspot. Nat. Resour. Res. 2019, 29, 2753–2771. [Google Scholar] [CrossRef]
Figure 1.
Study area: Malaprabha, Ghataprabha, and Mahadayi river basins, Karnataka, India.

Figure 2.
Method for evaluating the ecohydrological potential.

Figure 3.
Land-use dynamics in Malaprabha, Ghataprabha, and Mahadayi river basins.

Figure 4.
Spatial climatic patterns across waterscapes.

Figure 5.
Forest cover and ecohydrological footprint across the river basins.


| Sl.no | Description | Ghataprabha | Malaprabha | Mahadayi |
|---|---|---|---|---|
| 1 | Direction of Flow | East | East | West |
| 2 | Basin | Krishna | Krishna | Mahadayi |
| 3 | Catchment Area | 8771 km2 | 12,480 km2 | 2007 km2 |
| 4 | Flow Length | 283 km | 306 km | 87 km |
| 5 | Tributaries | Hiranyakesi, Markandeya | Bennihalla, Hirehalla, Tuparihalla, Alurhalla, Sasivehalla, Saraswathihalla, | Kotrachi nadi, Surla nadi, Ragada nadi |
| 6 | Origin | Maharashtra | Karnataka | Karnataka |
| 7 | Demography | 14.14% increase between 2001 and 2011 | 13.4% increase between 2001 and 2011 | 7.1% increase between 2001 and 2011 |
| 8 | Precipitation | 650 mm (Plains) to 3000 mm (Ghats) | Average 3200 mm | |
| 9 | Temperature | 15.34 °C December to 34.6 °C April | 17.84 °C December to 32.51 °C April | |
| 10 | Soil | Lateritic, black, and red soils | Lateritic, medium black, red sandy, red loamy, mixed soils | Lateritic |
| 11 | Lithology | Gneiss, Granite, Quartzite, Schist, Laterite, Basalt, Alluvium | Granite, gneiss, Deccan trap, schists, and limestone | Gneiss, Granite, Schist, Laterite |
| 12 | Topography | 450 m to 1050 m AMSL | 0 m to 1024 m AMSL | |
| 13 | Forests | Evergreen—GhatsDeciduous and Scrub Jungles—Transition and Plains | Evergreen, Moist Deciduous | |
| 14 | Sanctuaries and National Parks | Bhimgad wildlife sanctuary, Ghataprabha bird sanctuary | Bhimgad wildlife sanctuary | Mhadei Wildlife, Mollem National Park, and Bhagwan Mahavir Wildlife Sanctuary |
| 15 | Major Crops | Maize, groundnut, sunflower, chickpea, tomatoes, brinjal, potato, cotton, sugarcane | Groundnut, sorghum, maize, paddy, pearl millet, soybean, green gram, horse gram, cotton, sugarcane, and tobacco | Paddy, sugarcane, banana, areca nut, coconut, cashew nut, mango |
| 16 | Others | Joins Alamatti Reservoir | Joins Krishna at Koodalsangama | Joins Arabian Sea |
Table 2.
Blue water demand.
| Crop Water Demand | |||||||||
|---|---|---|---|---|---|---|---|---|---|
| Crop | Delta (mm) | Crop | Delta (mm) | Crop | Delta (mm) | ||||
| Paddy | 900–2500 | Wheat | 400–450 | Cotton | 600–700 | ||||
| Jowar | 200–300 | Other Millets | 400–450 | Coconut | 1500–2000 | ||||
| Bajra | 300–400 | Pulses | 250–300 | Arecanut | 1800–2200 | ||||
| Maize | 400–600 | Fruits/Vegetables | 2000–3000 | Sugarcane | 1400–3000 | ||||
| Ragi | 250–300 | Oil Seed | 400–500 | Tobacco | 400–500 | ||||
| Water Requirement in Liters per Animal per Day | Domestic Demand lpcd | ||||||||
| Season/Animal | Cattle | Buffalo | Sheep | Goat | Pigs | Rabbits | Dogs | Poultry | |
| Monsoon | 20–25 | 25–30 | 4–6 | 4–6 | 6–8 | 0.3–0.35 | 2–6 | 0.2–0.25 | 85 |
| Summer | 30–35 | 35–40 | 6–8 | 6–8 | 9–12 | 0.5–0.6 | 6–8 | 0.3–0.35 | 135 |
| Winter | 25–30 | 30–35 | 6–8 | 6–8 | 8–10 | 0.4–0.45 | 2–6 | 0.25–0.3 | 100 |
Note. lpcd: liters per capita per day.
Table 3.
Temporal variability of blue and green waters (all units in Million Cum).
| Catchment | Year | Runoff | Vadose | Evapotranspiration | Agriculture | Domestic |
|---|---|---|---|---|---|---|
| Ghataprabha | 1972 | 2500.87 | 2125.48 | 1300 | 4433.75 | 98.23 |
| 2018 | 4542.77 | 1564.55 | 731 | 5091.57 | 142.76 | |
| Malaprabha | 1972 | 4128.37 | 1982.07 | 1093.52 | 4794.42 | 119.39 |
| 2018 | 4442.54 | 1655.29 | 986.67 | 5455.91 | 174.99 | |
| Mahadayi | 1972 | 1138.15 | 1236.77 | 937.92 | 113.58 | 18.24 |
| 2018 | 1534.59 | 946.80 | 620.71 | 1483.15 | 22.08 |
Disclaimer/Publisher’s Note: The statements, opinions and data contained in all publications are solely those of the individual author(s) and contributor(s) and not of MDPI and/or the editor(s). MDPI and/or the editor(s) disclaim responsibility for any injury to people or property resulting from any ideas, methods, instructions or products referred to in the content. |
© 2023 by the authors. Licensee MDPI, Basel, Switzerland. This article is an open access article distributed under the terms and conditions of the Creative Commons Attribution (CC BY) license (https://creativecommons.org/licenses/by/4.0/).
Share and Cite
MDPI and ACS Style
Ramachandra, T.V.; Shivamurthy, V. Ecohydrological Footprint and Climate Trends in Lotic Ecosystems of Central Western Ghats. Water 2023, 15, 3169. https://doi.org/10.3390/w15183169
AMA Style
Ramachandra TV, Shivamurthy V. Ecohydrological Footprint and Climate Trends in Lotic Ecosystems of Central Western Ghats. Water. 2023; 15(18):3169. https://doi.org/10.3390/w15183169
Chicago/Turabian StyleRamachandra, T. V., and Vinay Shivamurthy. 2023. "Ecohydrological Footprint and Climate Trends in Lotic Ecosystems of Central Western Ghats" Water 15, no. 18: 3169. https://doi.org/10.3390/w15183169
Note that from the first issue of 2016, this journal uses article numbers instead of page numbers. See further details here.