
Multibranch Modelling of Flow and Water Quality in the Dhaka River System, Bangladesh: Impacts of Future Development Plans and Climate Change
 , , and
Abstract
:1. Introduction
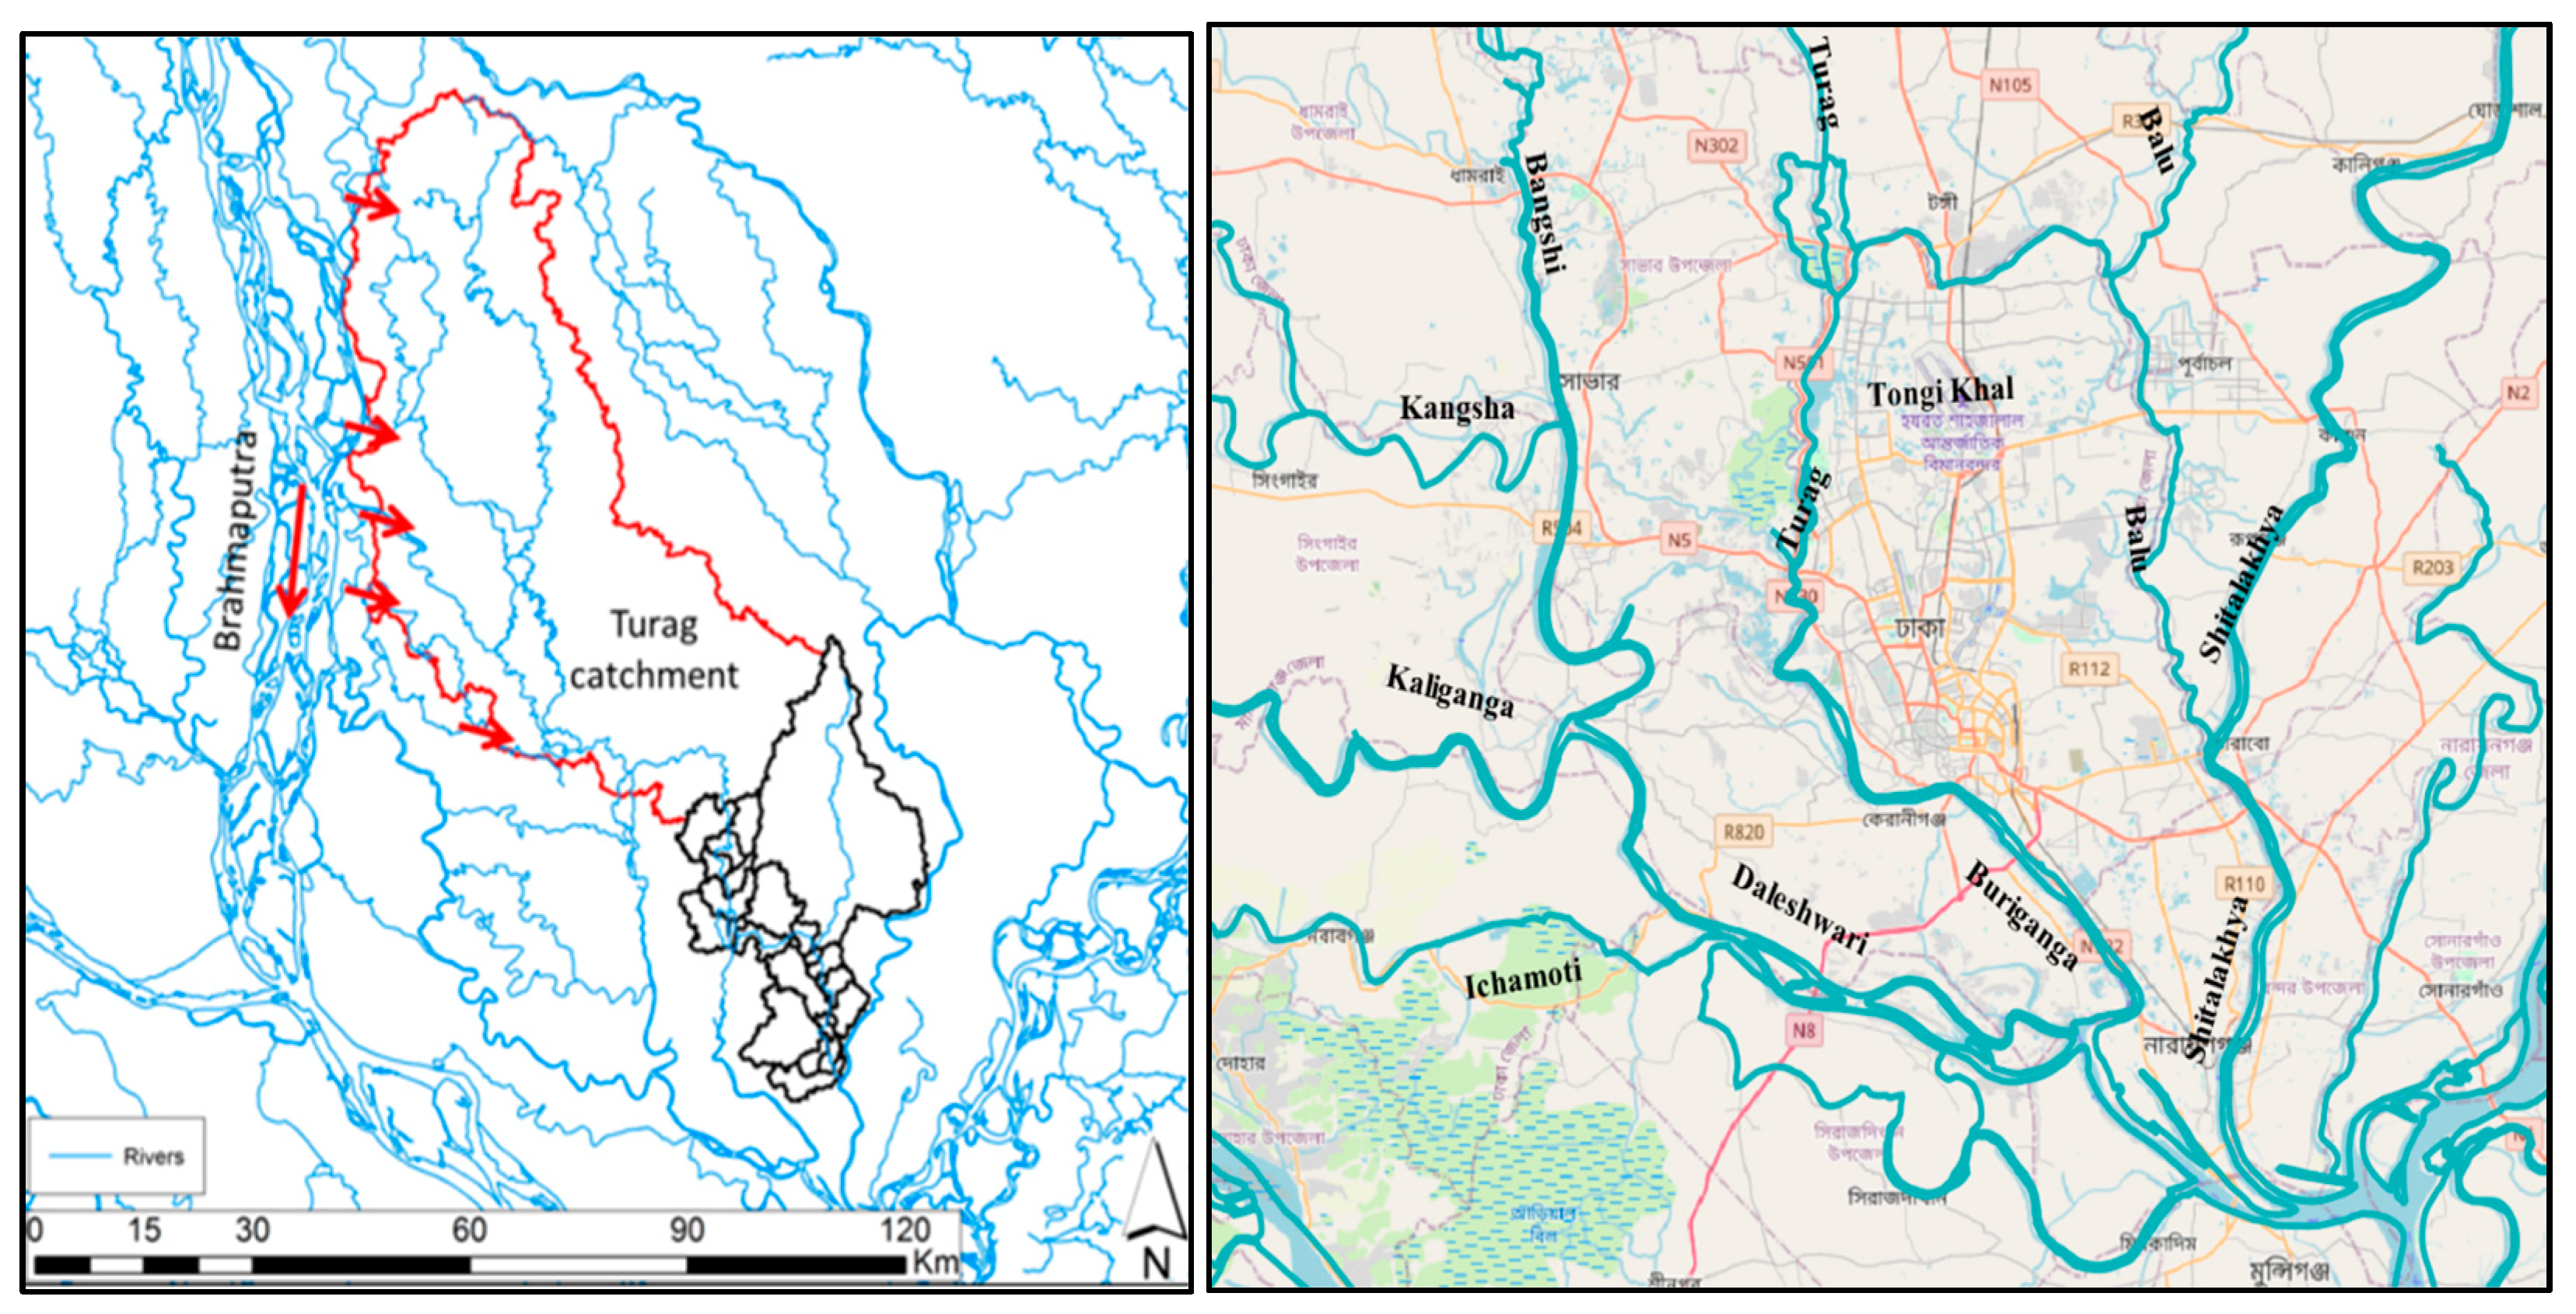
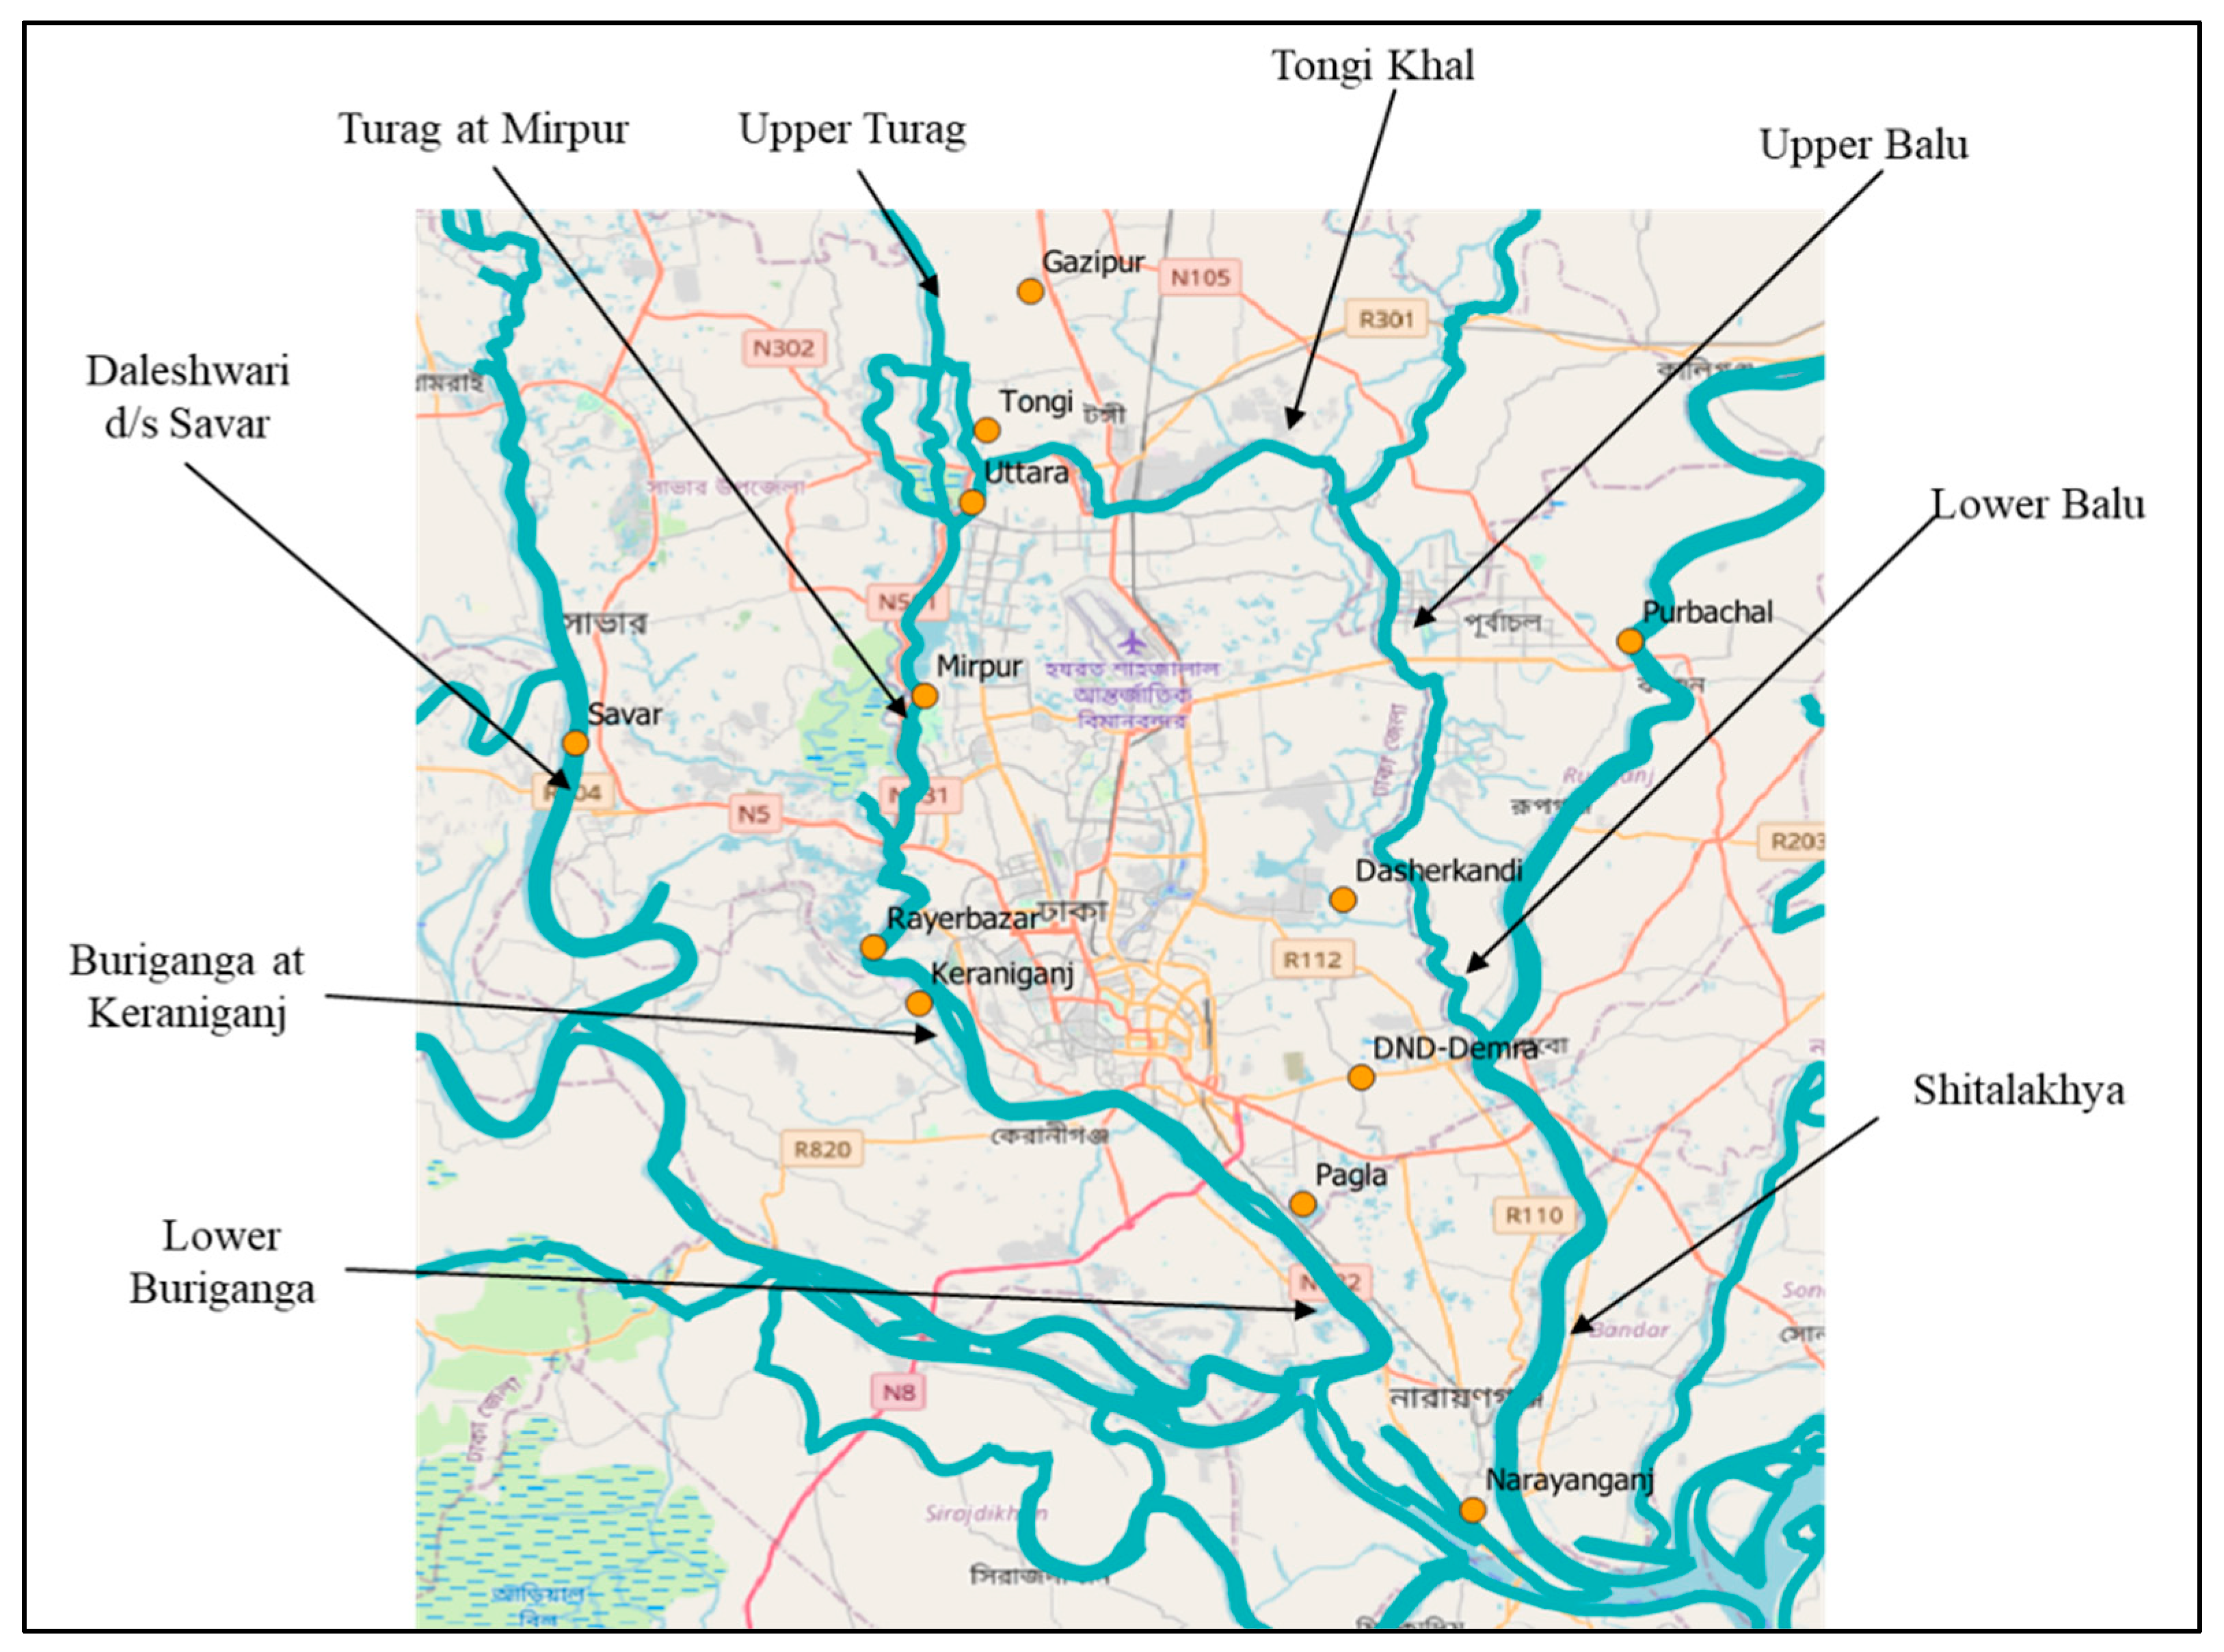
2. Study Area
3. Methods
3.1. Data
3.2. INCA Model
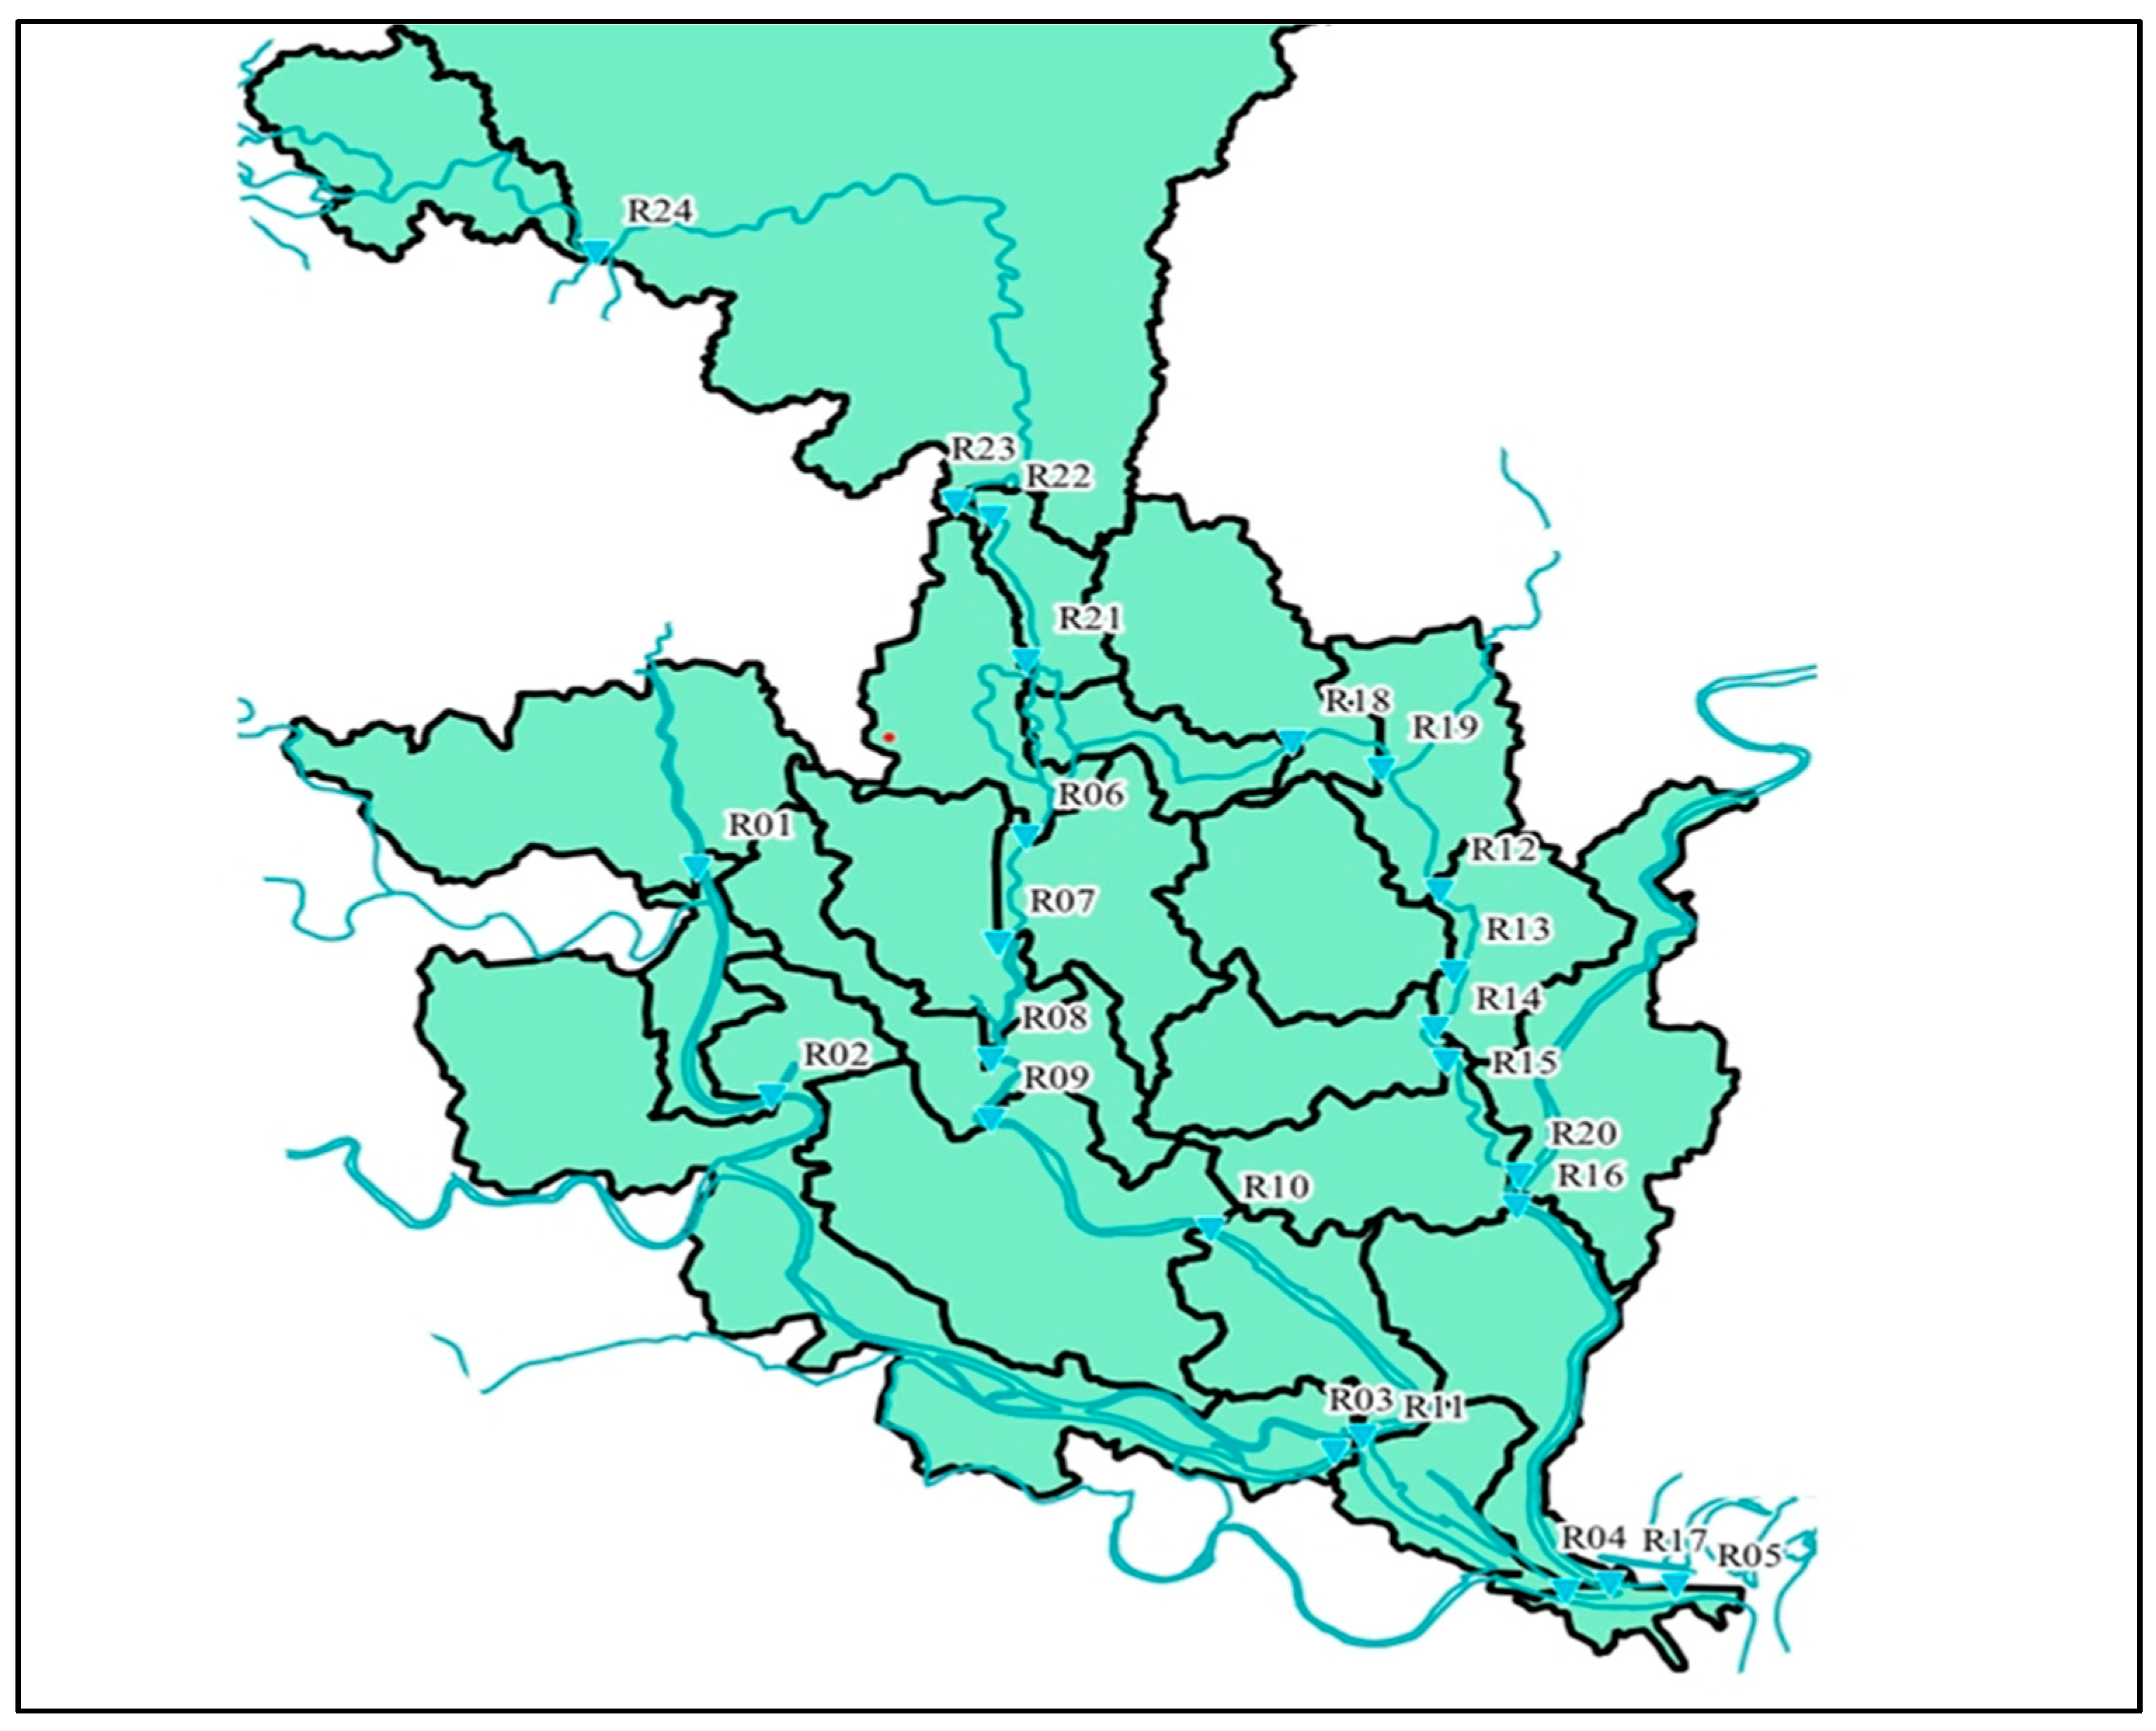
3.3. Model Set-Up
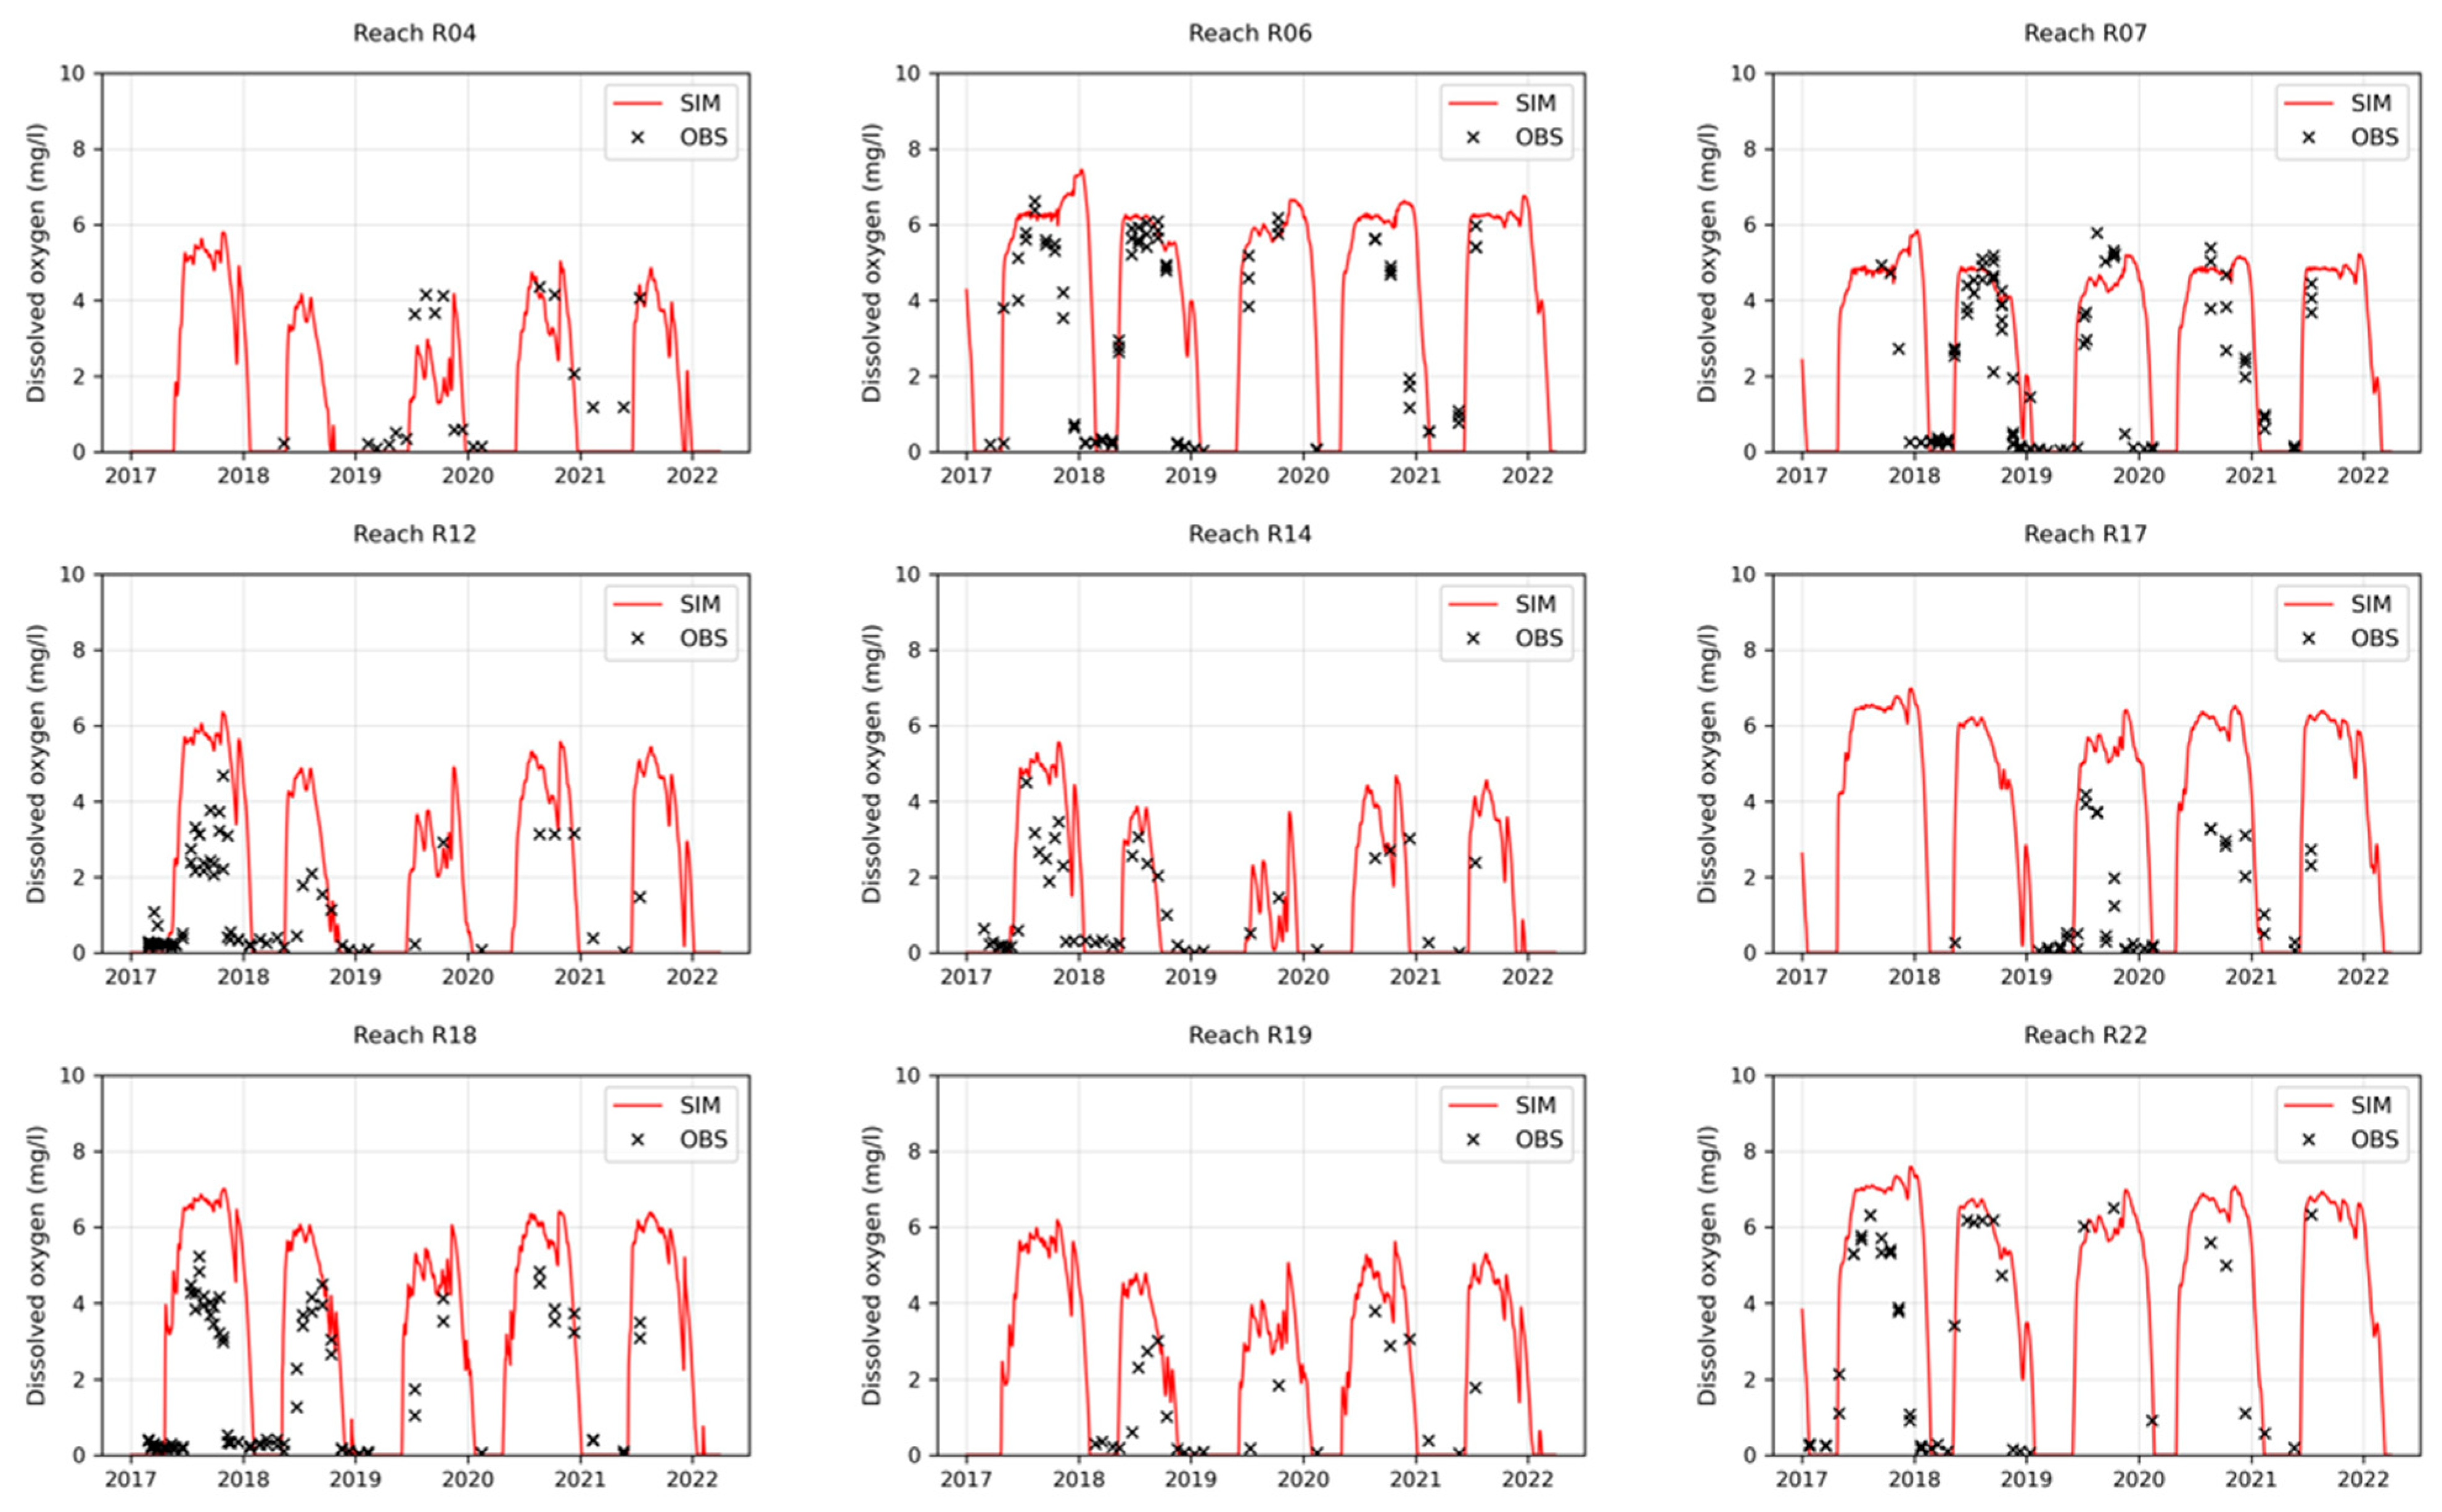
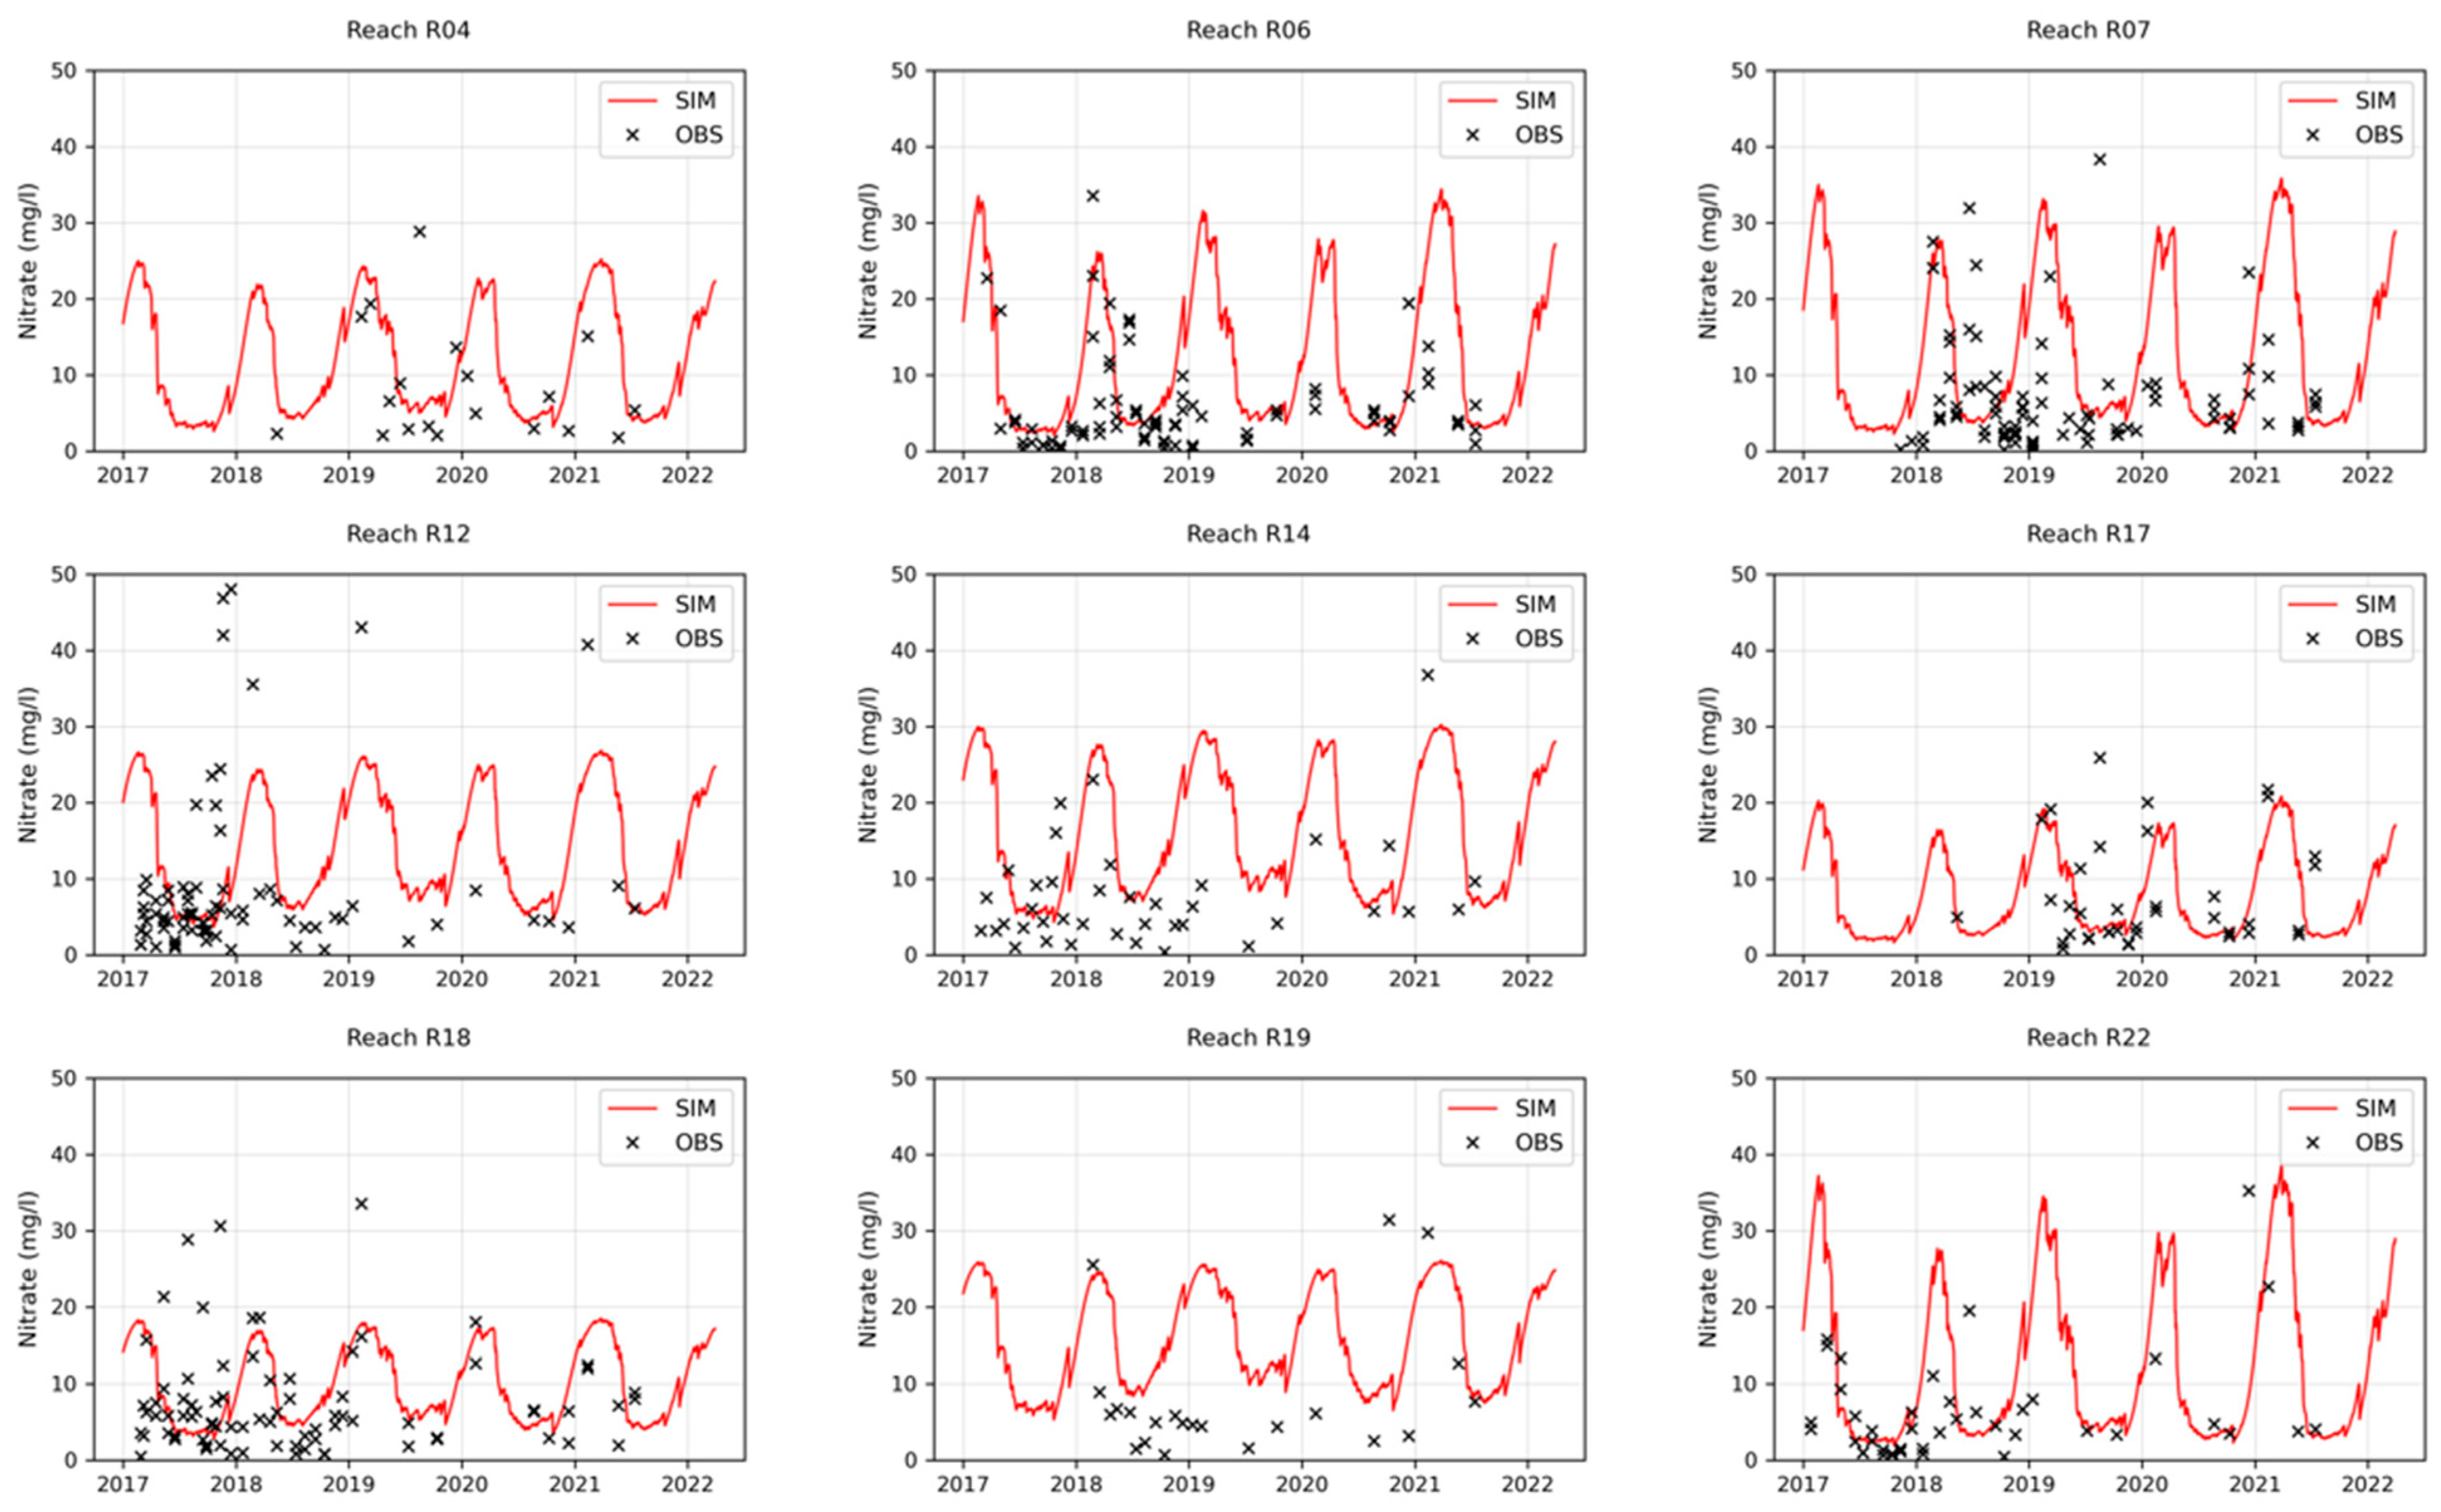
4. Results
5. Discussion
6. Conclusions
- Install P stripping reductions at all STPs to help reduce phosphorus concentrations, restore ecology, and to control eutrophication going forward.
- Bring forward the building of the Tonge Khal STP so that there is an earlier impact, i.e., by 2030 instead of 2041.
- Ask the industry to match government efforts to improve effluent treatment at their factories.
- Increase dilution and flushing in low flow periods via canal transfers from Brahmaputra.
- Increase monitoring of chemistry and ecology so that the government can observe improvements over time and install some automatic water quality monitoring systems in the river to enhance understanding and control.
- Restore and expand the Savar tannery treatment STPs so it can treat all the waste from the tanneries.
- Devise ways to remove contaminated sediments from the Buriganga, Tongi Khal, Turag, and Dhaleswari, followed by safe disposal of such waste to ensure reduced legacy. This will ensure a more effective clean up result from the planned STPs.
Author Contributions
Funding
Data Availability Statement
Acknowledgments
Conflicts of Interest
References
- Martínez-Santos, P. Does 91% of the World’s Population Really Have “Sustainable Access to Safe Drinking Water”? Int. J. Water Resour. Dev. 2017, 33, 514–533. [Google Scholar] [CrossRef]
- Hák, T.; Janoušková, S.; Moldan, B. Sustainable Development Goals: A Need for Relevant Indicators. Ecol. Indic. 2016, 60, 565–573. [Google Scholar] [CrossRef]
- Guppy, L.; Mehta, P.; Qadir, M. Sustainable Development Goal 6: Two Gaps in the Race for Indicators. Sustain. Sci. 2019, 14, 501–513. [Google Scholar] [CrossRef]
- Hoque, S.F.; Peters, R.; Whitehead, P.; Hope, R.; Hossain, M.A. River Pollution and Social Inequalities in Dhaka, Bangladesh. Environ. Res. Commun. 2021, 3, 095003. [Google Scholar] [CrossRef]
- Azharul Haq, K. Water Management in Dhaka. Int. J. Water Resour. Dev. 2006, 22, 291–311. [Google Scholar] [CrossRef]
- Whitehead, P.G.; Bussi, G.; Hossain, M.A.; Dolk, M.; Das, P.; Comber, S.; Peters, R.; Charles, K.J.; Hope, R.; Hossain, S. Restoring Water Quality in the Polluted Turag-Tongi-Balu River System, Dhaka: Modelling Nutrient and Total Coliform Intervention Strategies. Sci. Total Environ. 2018, 631–632, 223–232. [Google Scholar] [CrossRef] [PubMed]
- Hossain, M.A.; Hashimoto, M.; Shawal, S.; Kawaike, K.; Yoneyama, N.; Matsuyama, A.; Khalequzzaman, M. Flood Season Spreading of Pollutants to Floodplains of Tongi Khal—Exposure and Health Concerns in Uttarkhan of Dhaka. In Proceedings of the Proceedings of 12th ISE, Tokyo, Japan, 19–24 August 2018. [Google Scholar]
- Bashar, T.; Fung, I.W.H. Water Pollution in a Densely Populated Megapolis, Dhaka. Water 2020, 12, 2124. [Google Scholar] [CrossRef]
- Uddin, M.J.; Jeong, Y.-K. Urban River Pollution in Bangladesh during Last 40 Years: Potential Public Health and Ecological Risk, Present Policy, and Future Prospects toward Smart Water Management. Heliyon 2021, 7, e06107. [Google Scholar] [CrossRef] [PubMed]
- Whitehead, P.G.; Bussi, G.; Peters, R.; Hossain, M.A.; Softley, L.; Shawal, S.; Jin, L.; Rampley, C.P.N.; Holdship, P.; Hope, R.; et al. Modelling Heavy Metals in the Buriganga River System, Dhaka, Bangladesh: Impacts of Tannery Pollution Control. Sci. Total Environ. 2019, 697, 134090. [Google Scholar] [CrossRef]
- Das, M.; Ahmed, M.K.; Islam, M.S.; Islam, M.M.; Akter, M.S. Heavy Metals in Industrial Effluents (Tannery and Textile) and Adjacent Rivers of Dhaka City, Bangladesh. Terr. Aquat. Environ. Toxicol. 2011, 5, 8–13. [Google Scholar]
- DWASA Dhaka Sewerage Master Plan Project (Package DS-1A). Available online: http://Dwasa.Portal.Gov.Bd/Sites/Default/Files/Files/Dwasa.Portal.Gov.Bd/Page/A7539482_676a_483a_b3d0_06c4a950e016/2021-01-17-16-54-Efc40b4e53a82bae3513972a0dbc5c69.Pdf (accessed on 25 May 2022).
- Whitehead, P.G.; Wilson, E.; Butterfield, D. A Semi-Distributed Integrated Nitrogen Model for Multiple Source Assessment in Catchments (INCA): Part I—Model Structure and Process Equations. Sci. Total Environ. 1998, 210–211, 547–558. [Google Scholar] [CrossRef]
- Whitehead, P.G.; Wilson, E.; Butterfield, D.; Seed, K. A Semi-Distributed Integrated Flow and Nitrogen Model for Multiple Source Assessment in Catchments (INCA): Part II—Application to Large River Basins in South Wales and Eastern England. Sci. Total Environ. 1998, 210–211, 559–583. [Google Scholar] [CrossRef]
- Wade, A.J.; Whitehead, P.G.; Butterfield, D. The Integrated Catchments Model of Phosphorus Dynamics (INCA-P), a New Approach for Multiple Source Assessment in Heterogeneous River Systems: Model Structure and Equations. Hydrol. Earth Syst. Sci. 2002, 6, 583–606. [Google Scholar] [CrossRef]
- Crossman, J.; Bussi, G.; Whitehead, P.G.; Butterfield, D.; Lannergård, E.; Futter, M.N. A New, Catchment-Scale Integrated Water Quality Model of Phosphorus, Dissolved Oxygen, Biochemical Oxygen Demand and Phytoplankton: INCA-Phosphorus Ecology (PEco). Water 2021, 13, 723. [Google Scholar] [CrossRef]
- Bussi, G.; Dadson, S.J.; Prudhomme, C.; Whitehead, P.G.; Prudhomme, C. Modelling the Future Impacts of Climate and Land-Use Change on Suspended Sediment Transport in the River Thames (UK). J. Hydrol. 2016, 542, 357–372. [Google Scholar] [CrossRef]
- Bussi, G.; Whitehead, P.G.; Bowes, M.J.; Read, D.S.; Prudhomme, C.; Dadson, S.J. Impacts of Climate Change, Land-Use Change and Phosphorus Reduction on Phytoplankton in the River Thames (UK). Sci. Total Environ. 2016, 572, 1507–1519. [Google Scholar] [CrossRef] [PubMed]
- Whitehead, P.G.; Sarkar, S.; Jin, L.; Futter, M.N.; Caesar, J.; Barbour, E.; Butterfield, D.; Sinha, R.; Nicholls, R.; Hutton, C.; et al. Dynamic Modeling of the Ganga River System: Impacts of Future Climate and Socio-Economic Change on Flows and Nitrogen Fluxes in India and Bangladesh. Environ. Sci. Process. Impacts 2015, 17, 1082–1097. [Google Scholar] [CrossRef]
- Whitehead, P.G.; Mimouni, Z.; Butterfield, D.; Bussi, G.; Hossain, M.A.; Peters, R.; Shawal, S.; Holdship, P.; Rampley, C.P.N.; Jin, L.; et al. A New Multibranch Model for Metals in River Systems: Impacts and Control of Tannery Wastes in Bangladesh. Sustainability 2021, 13, 3556. [Google Scholar] [CrossRef]
- Sharma, B.M.; Bharat, G.K.; Tayal, S.; Larssen, T.; Becanová, J.; Karásková, P.; Whitehead, P.G.; Futter, M.N.; Butterfield, D.; Nizzetto, L. Perfluoroalkyl substances (PFAS) in river and ground/drinking water of the Ganges River basin: Emissions and implications for human exposure. Environ. Pollut. 2016, 208, 704–713. [Google Scholar] [CrossRef]
- Rampley, C.P.N.; Whitehead, P.G.; Softley, L.; Hossain, M.A.; Jin, L.; David, J.; Shawal, S.; Das, P.; Thompson, I.P.; Huang, W.E.; et al. River Toxicity Assessment Using Molecular Biosensors: Heavy Metal Contamination in the Turag-Balu-Buriganga River Systems, Dhaka, Bangladesh. Sci. Total Environ. 2020, 703, 134760. [Google Scholar] [CrossRef]
- Yin, H.; Islam, M.S.; Ju, M. Urban River Pollution in the Densely Populated City of Dhaka, Bangladesh: Big Picture and Rehabilitation Experience from Other Developing Countries. J. Clean. Prod. 2021, 321, 129040. [Google Scholar] [CrossRef]
- Brouwer, R.; Dilruba, F.S.; Elliott, S.; Liu, J.; Khan, M.R. Costs and Benefits of Improving Water and Sanitation in Slums and Non-Slum Neighborhoods in Dhaka, a Fast-Growing Mega-City. Ecol. Econ. 2023, 207, 107763. [Google Scholar] [CrossRef]
- World Bank Dhaka Sanitation Improvement Project (P161432). Combined Project Information Documents/Integrated Safeguards Datasheet (PID/ISDS). 2019. Available online: https://projects.worldbank.org/en/projects-operations/project-detail/P161432 (accessed on 14 August 2023).
- Arefin, M.A.; Mallik, A. Sources and Causes of Water Pollution in Bangladesh: A Technical Overview. Bibechana 2017, 15, 97–112. [Google Scholar] [CrossRef]
- Islam, M.S.; Uddin, M.K.; Tareq, S.M.; Shammi, M.; Kamal, A.K.I.; Sugano, T.; Kurasaki, M.; Saito, T.; Tanaka, S.; Kuramitz, H. Alteration of Water Pollution Level with the Seasonal Changes in Mean Daily Discharge in Three Main Rivers around Dhaka City, Bangladesh. Environments 2015, 2, 280–294. [Google Scholar] [CrossRef]
- Muñoz-Sabater, J.; Dutra, E.; Agustí-Panareda, A.; Albergel, C.; Arduini, G.; Balsamo, G.; Boussetta, S.; Choulga, M.; Harrigan, S.; Hersbach, H.; et al. ERA5-Land: A State-of-the-Art Global Reanalysis Dataset for Land Applications. Earth Syst. Sci. Data Discuss. 2021, 13, 4349–4383. [Google Scholar] [CrossRef]
- Buchhorn, M.; Lesiv, M.; Tsendbazar, N.-E.; Herold, M.; Bertels, L.; Smets, B. Copernicus Global Land Cover Layers—Collection 2. Remote Sens. 2020, 12, 1044. [Google Scholar] [CrossRef]
- Dentener, F.J. Global Maps of Atmospheric Nitrogen Deposition 1860, 1993, and 2050, Data Set; Oak Ridge National Laboratory Distributed Active Archive Center: Oak Ridge, TN, USA, 2006. [Google Scholar]
- CIESIN University, Center for International Earth Science Information Network—CIESIN—Columbia. Documentation for the Gridded Population of the World, Version 4 (GPWv4); NASA Socioeconomic Data and Applications Center (SEDAC): Palisades NY, USA, 2016. [Google Scholar]
- Sagris, T.; Abbot, J. An Analysis of Industrial Water Use in Bangladesh with a Focus on the Textile and Leather Industries; 2030 Water Resources Group: Washington, DC, USA, 2015. [Google Scholar]
- 2030 WRG. Rapid Assessment of Hydrology, Morphology and Pollution of Rivers and Canals Around Dhaka: Task 2 River Pollution Study; 2030 Water Resources Group; The World Bank Group: Washington, DC, USA, 2021. [Google Scholar]
- Islam, M.S. Understanding Dhaka’s Water Crisis: What Can We Do Sustain Our Water Usage? Dhaka Tribune. Available online: https://Archive.Dhakatribune.Com/Bangladesh/Development/2019/10/24/Understanding-Dhaka-s-Water-Crisis-What-Can-We-Do-Sustain-Our-Water-Usage (accessed on 1 June 2022).
- ZDHC. Textile Industry Wastewater Discharge Quality Standards: Literature Review; Leaders in Advancing Environmental Responsibility; ZDHC: Amsterdam, The Netherlands, 2015. [Google Scholar]
- Hossain, L.; Sarker, S.K.; Khan, M.S. Evaluation of Present and Future Wastewater Impacts of Textile Dyeing Industries in Bangladesh. Environ. Dev. 2018, 26, 23–33. [Google Scholar] [CrossRef]
- Shibli, M.S.S.; Islam, M.T. In Bangladesh, Tanneries in Trouble. Available online: https://Asiafoundation.Org/2020/05/27/in-Bangladesh-Tanneries-in-Trouble/ (accessed on 5 May 2020).
- RMG Bangladesh Tanneries Now Polluting Dhaleswari in Savar. Available online: http://Rmgbd.Net/2018/05/Tanneries-Now-Polluting-Dhaleswari-in-Savar/ (accessed on 11 November 2018).
- Department of Environment. Environmental Impact Study of Two Tannery Estates on the Buriganga and the Dhaleswari Rivers; Department of Environment: Dhaka, Bangladesh, 2018. [Google Scholar]
- World Steel Association Water Management in the Steel Industry. Available online: https://Worldsteel.Org/Wp-Content/Uploads/Water-Management-in-the-Steel-Industry.Pdf (accessed on 6 July 2020).
- Chakma, J. Steel Sector Still in a Shakeout. The Daily Star. Available online: https://Www.Thedailystar.Net/Business/News/Steel-Sector-Still-Shakeout-2025153 (accessed on 17 September 2021).
- Teichmann, C.; Jacob, D.; Remedio, A.R.; Remke, T.; Buntemeyer, L.; Hoffmann, P.; Kriegsmann, A.; Lierhammer, L.; Bülow, K.; Weber, T.; et al. Assessing Mean Climate Change Signals in the Global CORDEX-CORE Ensemble. Clim. Dyn. 2021, 57, 1269–1292. [Google Scholar] [CrossRef]
- Moss, R.H.; Edmonds, J.A.; Hibbard, K.A.; Manning, M.R.; Rose, S.K.; van Vuuren, D.P.; Carter, T.R.; Emori, S.; Kainuma, M.; Kram, T.; et al. The next Generation of Scenarios for Climate Change Research and Assessment. Nature 2010, 463, 747–756. [Google Scholar] [CrossRef]
- Hausfather, Z.; Peters, G.P. RCP8.5 Is a Problematic Scenario for near-Term Emissions. Proc. Natl. Acad. Sci. USA 2020, 117, 27791–27792. [Google Scholar] [CrossRef]
- Wade, A.J.; Durand, P.; Beaujouan, V.; Wessel, W.; Raat, K.J.; Whitehead, P.G.; Butterfield, D.; Rankinen, K.; Lepisto, A. A Nitrogen Model for European Catchments: INCA, New Model Structure and Equations. Hydrol. Earth Syst. Sci. 2002, 6, 559–582. [Google Scholar] [CrossRef]
- Lázár, A.N.; Butterfield, D.; Futter, M.N.; Rankinen, K.; Thouvenot-Korppoo, M.; Jarritt, N.P.; Lawrence, D.S.L.; Wade, A.J.; Whitehead, P.G. An Assessment of the Fine Sediment Dynamics in an Upland River System: INCA-Sed Modifications and Implications for Fisheries. Sci. Total Environ. 2010, 408, 2555–2566. [Google Scholar] [CrossRef]
- Whitehead, P.G.; Jin, L.; Macadam, I.; Janes, T.; Sarkar, S.; Rodda, H.J.E.; Sinha, R.; Nicholls, R.J. Modelling Impacts of Climate Change and Socio-Economic Change on the Ganga, Brahmaputra, Meghna, Hooghly and Mahanadi River Systems in India and Bangladesh. Sci. Total Environ. 2018, 636, 1362–1372. [Google Scholar] [CrossRef] [PubMed]
- Jin, L.; Whitehead, P.G.; Sarkar, S.; Sinha, R.; Futter, M.N.; Butterfield, D.; Caesar, J.; Crossman, J. Assessing the Impacts of Climate Change and Socio-Economic Changes on Flow and Phosphorus Flux in the Ganga River System. Environ. Sci. Process. Impacts 2015, 17, 1098–1110. [Google Scholar] [CrossRef] [PubMed]
- Whitehead, P.G.; Jin, L.; Bussi, G.; Voepel, H.E.; Darby, S.E.; Vasilopoulos, G.; Manley, R.; Rodda, H.; Hutton, C.; Hackney, C.; et al. Water Quality Modelling of the Mekong River Basin: Climate Change and Socioeconomics Drive Flow and Nutrient Flux Changes to the Mekong Delta. Sci. Total Environ. 2019, 673, 218–229. [Google Scholar] [CrossRef] [PubMed]
- Bussi, G.; Darby, S.E.; Whitehead, P.G.; Jin, L.; Dadson, S.J.S.J.; Voepel, H.E.H.E.; Vasilopoulos, G.; Hackney, C.R.; Hutton, C.; Berchoux, T.; et al. Impact of Dams and Climate Change on Suspended Sediment Flux to the Mekong Delta. Sci. Total Environ. 2021, 755, 142468. [Google Scholar] [CrossRef]
- Futter, M.N.; Erlandsson, M.A.; Butterfield, D.; Whitehead, P.G.; Oni, S.K.; Wade, A.J. PERSiST: A Flexible Rainfall-Runoff Modelling Toolkit for Use with the INCA Family of Models. Hydrol. Earth Syst. Sci. 2014, 18, 855–873. [Google Scholar] [CrossRef]
- Yamazaki, D.; Ikeshima, D.; Sosa, J.; Bates, P.D.; Allen, G.; Pavelsky, T. MERIT Hydro: A High-resolution Global Hydrography Map Based on Latest Topography Datasets. Water Resour. Res. 2019, 55, 5053–5073. [Google Scholar] [CrossRef]
- Lafon, T.; Dadson, S.J.; Buys, G.; Prudhomme, C. Bias Correction of Daily Precipitation Simulated by a Regional Climate Model: A Comparison of Methods. Int. J. Climatol. 2013, 33, 1367–1381. [Google Scholar] [CrossRef]
- Gain, A.K.; Immerzeel, W.W.; Sperna Weiland, F.C.; Bierkens, M.F.P. Impact of Climate Change on the Stream Flow of the Lower Brahmaputra: Trends in High and Low Flows Based on Discharge-Weighted Ensemble Modelling. Hydrol. Earth Syst. Sci. 2011, 15, 1537–1545. [Google Scholar] [CrossRef]
- Immerzeel, W.W.; van Beek, L.P.H.; Bierkens, M.F.P. Climate Change Will Affect the Asian Water Towers. Science 2010, 328, 1382–1385. [Google Scholar] [CrossRef] [PubMed]
- Saiful Islam, A.K.M.; Mohammed, K.; Tarekul Islam, G.M. Assessment of Climate Change Impacts on Floods and Low Flows of the Brahmaputra River. In Environmental Change in South Asia; Springer International Publishing: Cham, Switzerland; Berlin, Germany, 2022; pp. 19–27. [Google Scholar]
- Gupta, H.V.; Kling, H.; Yilmaz, K.K.; Martinez, G.F. Decomposition of the Mean Squared Error and NSE Performance Criteria: Implications for Improving Hydrological Modelling. J. Hydrol. 2009, 377, 80–91. [Google Scholar] [CrossRef]
- Prime Minister’s Office, Government of Bangladesh (GoB). PMO River Master Plan 2019; Prime Minister’s Office, Government of Bangladesh (GoB): Dhaka, Bangladesh, 2019. [Google Scholar]
- Bussi, G.; Janes, V.; Whitehead, P.G.; Dadson, S.J.; Holman, I.P. Dynamic Response of Land Use and River Nutrient Concentration to Long-Term Climatic Changes. Sci. Total Environ. 2017, 590–591, 818–831. [Google Scholar] [CrossRef]
- Whitehead, P.G.; Wade, A.J.; Butterfield, D. Potential Impacts of Climate Change on Water Quality and Ecology in Six UK Rivers. Hydrol. Res. 2009, 40, 113–122. [Google Scholar] [CrossRef]
- Piniewski, M.; Marcinkowski, P.; Koskiaho, J.; Tattari, S. The Effect of Sampling Frequency and Strategy on Water Quality Modelling Driven by High-Frequency Monitoring Data in a Boreal Catchment. J. Hydrol. 2019, 579, 124186. [Google Scholar] [CrossRef]
- Zhang, Z.; Huang, J.; Duan, S.; Huang, Y.; Cai, J.; Bian, J. Use of Interpretable Machine Learning to Identify the Factors Influencing the Nonlinear Linkage between Land Use and River Water Quality in the Chesapeake Bay Watershed. Ecol. Indic. 2022, 140, 108977. [Google Scholar] [CrossRef]
- MoEFCC. National Environmental Policy 2018; Ministry of Environment, Forest and Climate Change, Government of the Peopoples Republic of Bangladesh: Dhaka, Bangladesh, 2018. [Google Scholar]


| Name | Completed/Planned | Capacity (M Litres per Day) |
|---|---|---|
| Savar | Planned (medium term) | 46 |
| Narayanganj | Planned (medium term) | 161 |
| Uttara | Planned (short term) | 184 |
| Mirpur | Planned (short term) | 322 |
| Rayerbazar | Planned (short term) | 184 |
| Keraniganj | Planned (medium term) | 46 |
| Pagla | Completed | 200 (current), 400 (short term), 600 (medium term) |
| Dasherkandi | Completed | 400 (short term), 500 (medium term) |
| DND-Demra | Planned (medium term) | 103.5 |
| Tongi | Planned (medium term) | 92 |
| Gazipur | Planned (medium term) | 46 |
| Purbachal | Planned (medium term) | 57.5 |
| River | Length (km) | Length within Dhaka Urban Area (km) | Average Width (m) | Surrounding Landcover/Land Use |
|---|---|---|---|---|
| Balu | 44 | 23 | 79 | Mainly rural setup, urbanisation started and likely will accelerate |
| Bangshi | 239 | 22 | 49 | Semi-urban setup at upstream and downstream, rest rural setup |
| Bangshi | 13 | 13 | 73 | Semi-urban setup |
| Buriganga | 29 | 29 | 302 | Highly urbanised |
| Dhaleswari | 292 | 60 | 144 | Mainly rural setup with several industries and brickfields at different locations |
| Shitalakhya | 108 | 60 | 228 | Upstream urban setup, downstream highly urbanised |
| Tongi Khal | 15 | 15 | 55 | Highly urbanised |
| Turag | 62 | 50 | 82 | Upstream urban setup, downstream highly urbanised |
| Kaliganga | 78 | 11 | 242 | Rural settlements and croplands |
| Ichamoti | 129 | 7.5 | 72 | Rural settlements and croplands, with few brickfields |
| Reach ID | River | Long;Lat | Drainage Area (km2) | Arable % | Forest % | Grassland % | Urban % | Water % |
|---|---|---|---|---|---|---|---|---|
| R01 | Dhaleswari | 90.242;23.835 | 100.81 | 96.03 | 0.00 | 0.52 | 2.33 | 1.12 |
| R02 | Dhaleswari | 90.267;23.758 | 25.96 | 88.97 | 1.67 | 3.01 | 0.00 | 6.35 |
| R03 | Dhaleswari | 90.453;23.618 | 205.11 | 93.04 | 0.34 | 2.99 | 0.00 | 3.63 |
| R04 | Dhaleswari | 90.52;23.568 | 32.55 | 39.18 | 0.54 | 8.65 | 35.68 | 15.95 |
| R05 | Dhaleswari | 90.575;23.569 | 11.27 | 43.75 | 1.56 | 17.19 | 0.00 | 37.50 |
| R06 | Turag | 90.348;23.858 | 67.72 | 90.35 | 0.27 | 8.97 | 0.41 | 0.00 |
| R07 | Turag | 90.339;23.817 | 54.14 | 8.22 | 0.00 | 3.70 | 88.08 | 0.00 |
| R08 | Turag | 90.335;23.769 | 54.57 | 64.10 | 4.33 | 20.35 | 11.22 | 0.00 |
| R09 | Turag | 90.337;23.749 | 58.71 | 58.90 | 0.30 | 4.75 | 36.05 | 0.00 |
| R10 | Turag | 90.407;23.707 | 120.44 | 76.02 | 0.14 | 1.38 | 20.43 | 2.03 |
| R11 | Turag | 90.455;23.627 | 49.55 | 35.56 | 0.00 | 7.75 | 50.70 | 5.99 |
| R12 | Balu | 90.462;23.847 | 48.17 | 90.55 | 0.00 | 9.09 | 0.36 | 0.00 |
| R13 | Balu | 90.482;23.807 | 61.13 | 10.44 | 1.14 | 9.71 | 78.57 | 0.14 |
| R14 | Balu | 90.478;23.784 | 38.20 | 74.43 | 2.49 | 23.08 | 0.00 | 0.00 |
| R15 | Balu | 90.481;23.761 | 43.64 | 6.50 | 0.00 | 5.31 | 88.19 | 0.00 |
| R16 | Balu | 90.504;23.716 | 49.36 | 3.72 | 0.00 | 0.35 | 95.40 | 0.53 |
| R17 | Balu | 90.534;23.571 | 66.58 | 1.19 | 0.00 | 0.26 | 92.62 | 5.93 |
| R18 | Tongi | 90.433;23.894 | 25.23 | 34.75 | 0.71 | 5.32 | 59.22 | 0.00 |
| R19 | Tongi | 90.46;23.877 | 64.26 | 44.79 | 0.14 | 1.62 | 53.45 | 0.00 |
| R20 | Lakhya | 90.502;23.722 | 84.97 | 59.88 | 0.20 | 2.56 | 32.34 | 5.02 |
| R21 | Turag | 90.348;23.926 | 23.05 | 97.02 | 0.00 | 2.61 | 0.37 | 0.00 |
| R22 | Turag | 90.338;23.98 | 5.00 | 100.00 | 0.00 | 0.00 | 0.00 | 0.00 |
| R23 | Turag | 90.326;23.987 | 815.17 | 97.55 | 0.06 | 0.40 | 1.74 | 0.25 |
| R24 | Turag | 90.211;24.082 | 57.53 | 99.70 | 0.00 | 0.30 | 0.00 | 0.00 |
| Scenario | Reference Year | STPs | Climate | Population |
|---|---|---|---|---|
| Current | 2020 | Pagla (200 ML/d) Dasherkandi (400 ML/d) | Current, from ERA5-Land | Current |
| Short-term | 2027 | Pagla (400 ML/d) Uttara Mirpur Rayerbazar Dasherkandi (500 ML/d) | Current, from ERA5-Land | Current |
| Medium-term | 2041 | Savar Narayanganj Uttara Mirpur Rayerbazar Keraniganj Pagla (500 ML/d) Dasherkandi (500 ML/d) DND-Demra Tongi Gazipur Purbachal | Future: ERA5-Land climatology modified based on climate change scenarios for 2026–2055 and RCPs 2.6 and 8.5 Inflows modified based on literature studies on the impacts of climate change on the Brahmaputra River | Future (based on UN population prospects for 2041) |
| Variable | Value (mg/L) |
|---|---|
| Suspended sediment | 100 |
| Phosphorus | 2 |
| Dissolved oxygen | 5 |
| BOD | 35 |
| Nitrate | 12 |
| Ammonium | 5 |
| Reach | Phosphorus | Dissolved Oxygen | Ammonium |
|---|---|---|---|
| R04 | 0.47 | 0.72 | 0.68 |
| R07 | 0.41 | 0.25 | 0.23 |
| R11 | 0.66 | 0.23 | 0.37 |
| R12 | 0.60 | 0.55 | 0.54 |
| R13 | 0.56 | 0.18 | 0.55 |
| R14 | 0.50 | 0.66 | 0.49 |
| R17 | 0.59 | 0.66 | 0.47 |
| R18 | 0.35 | 0.35 | 0.45 |
| R19 | 0.68 | 0.35 | 0.46 |
| Values in mg/L Referred to the Dry Season (November to March) | |||||||
|---|---|---|---|---|---|---|---|
| Water Quality Parameter | Reach | 2020 (Median Value) | 2027 (Median Value Delta Change) | 2041 (Median Value Delta Change) | 2020 (90th Percentile) | 2041 (90th Percentile Delta Change) | 2027 (90th Percentile Delta Change) |
| mg/L | mg/L | mg/L | mg/L | mg/L | mg/L | ||
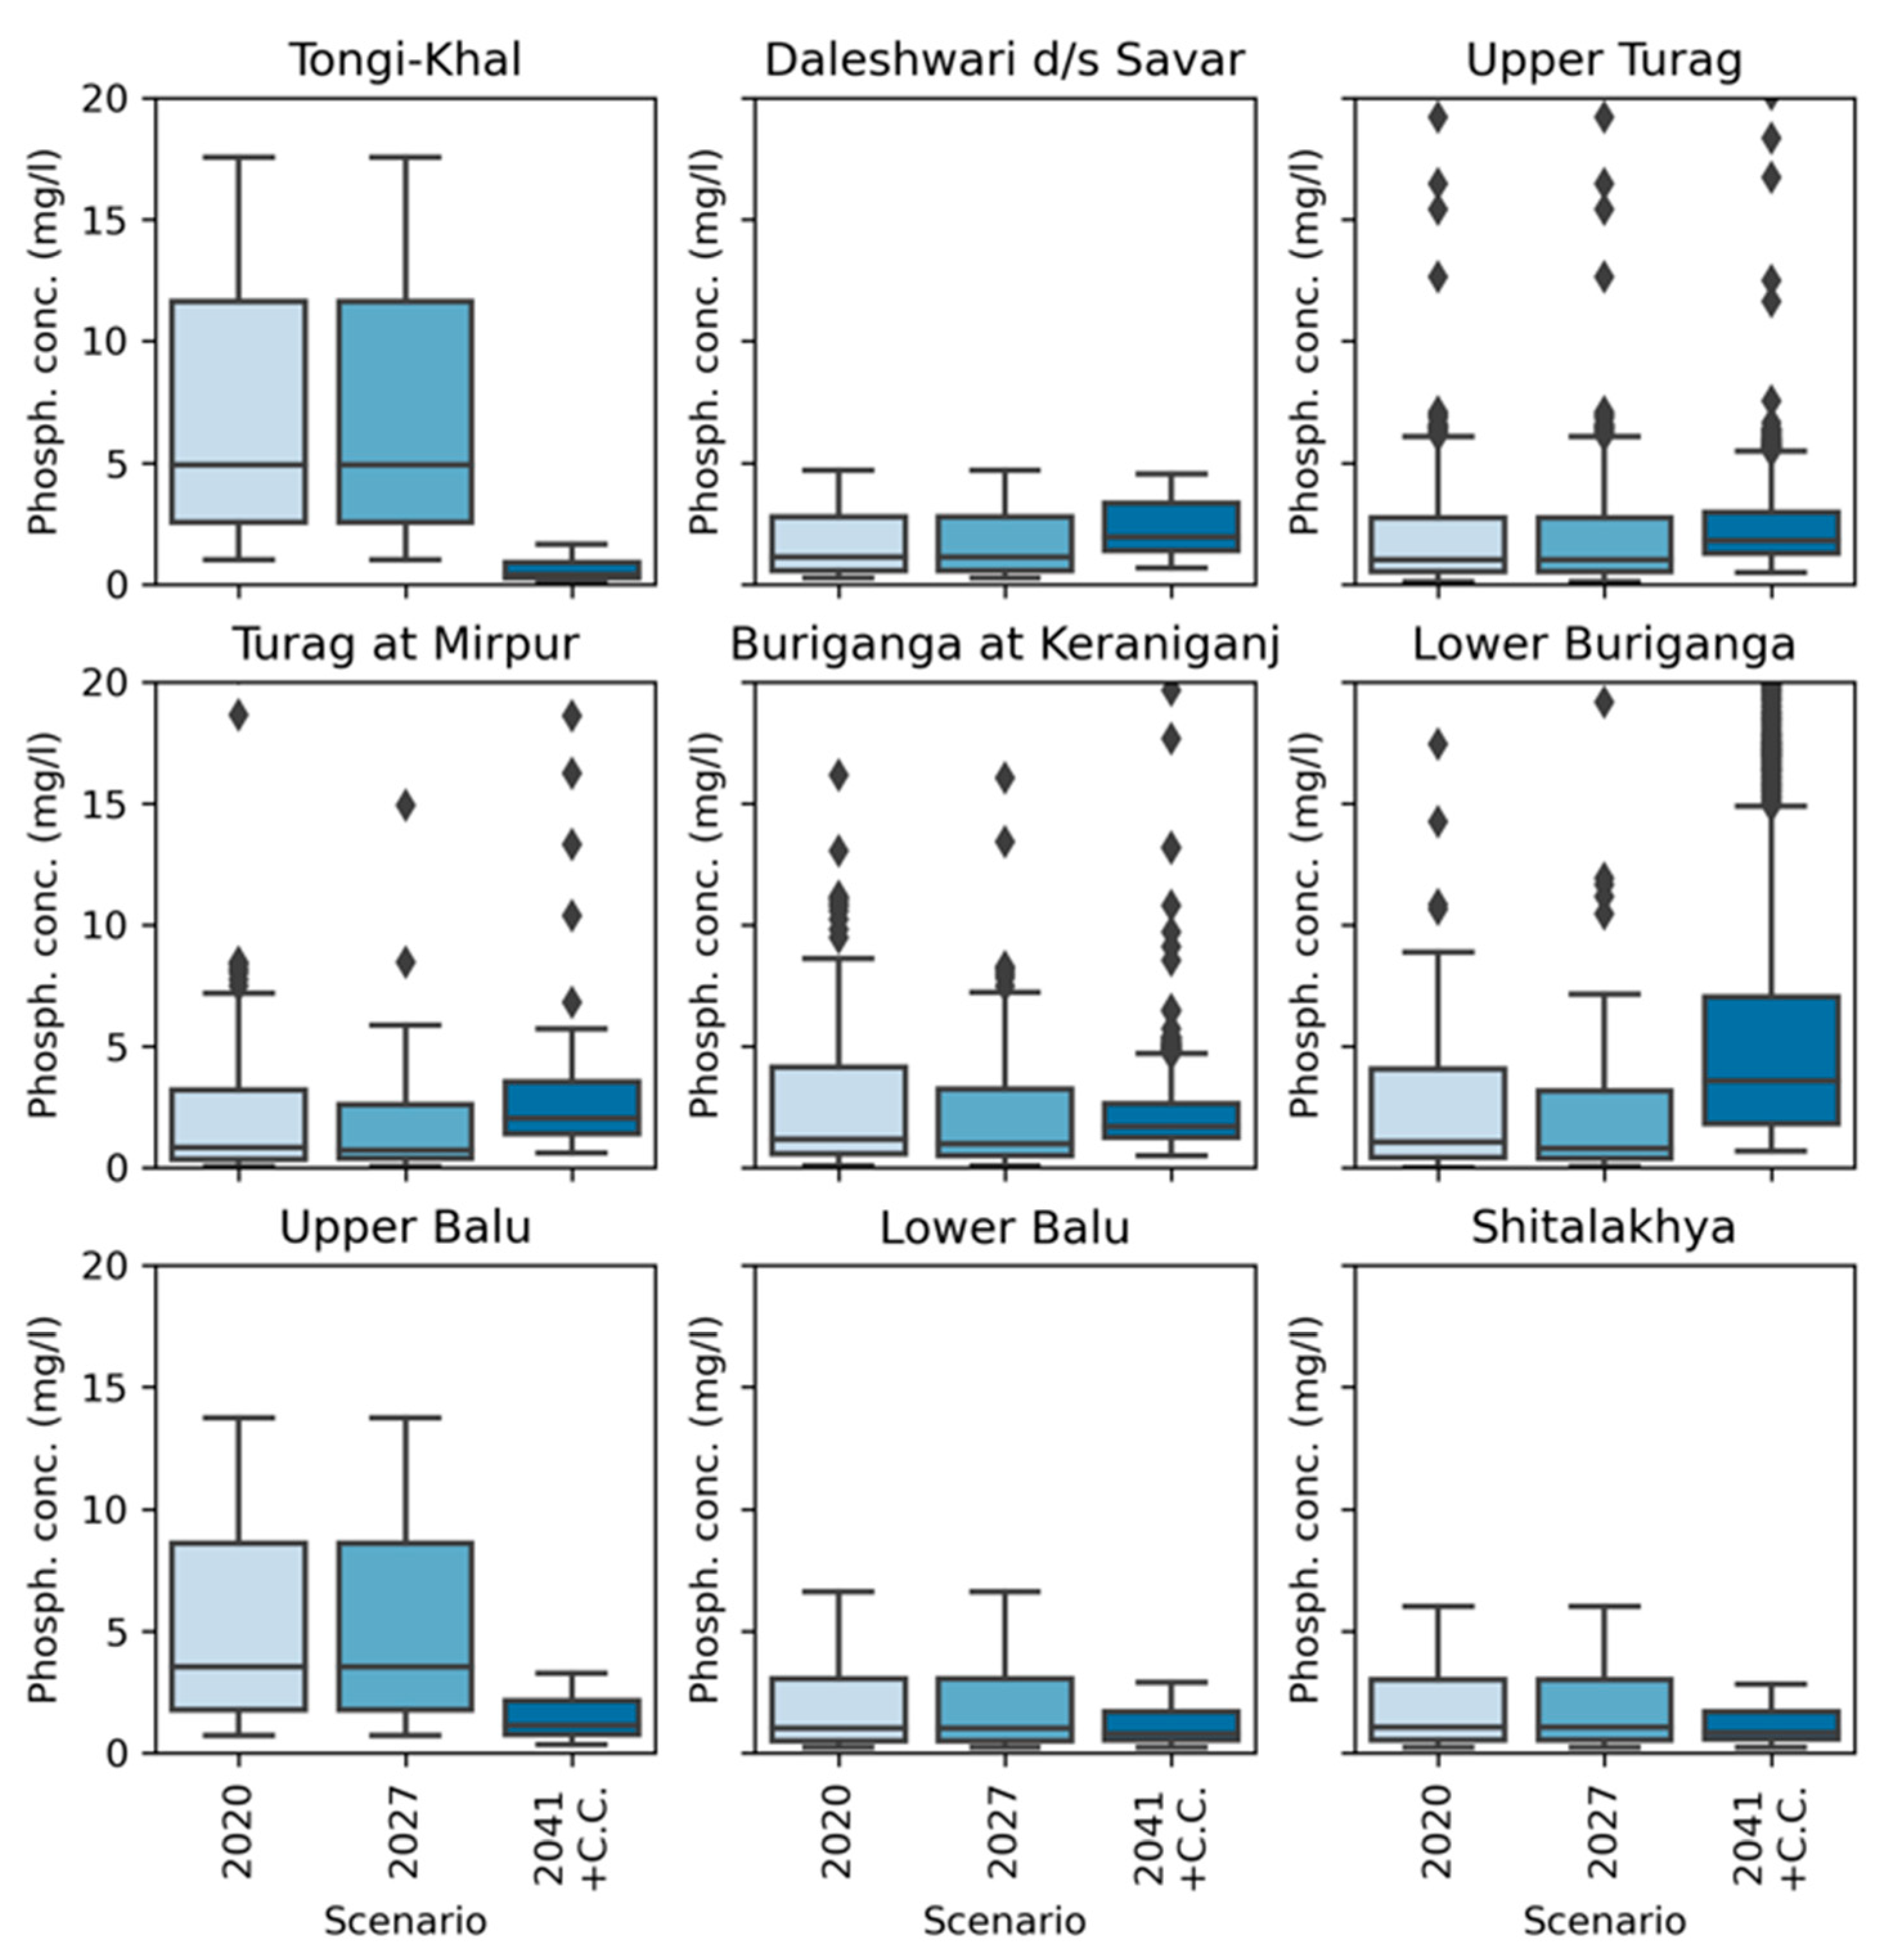
| Phosph. Conc. (mg/L) | Buriganga at Keraniganj | 2.6 | −0.6 | 0.5 | 6.8 | −1.5 | −1.2 |
| Dhaleswari d/s Savar | 2.4 | 0.0 | 0.8 | 3.8 | 0.0 | 0.3 | |
| Lower Balu | 2.6 | 0.0 | −1.0 | 4.7 | 0.0 | −2.3 | |
| Lower Buriganga | 2.5 | −0.6 | 2.6 | 6.5 | −1.5 | 16.6 | |
| Shitalakhya | 2.5 | 0.0 | −1.0 | 4.4 | 0.0 | −2.1 | |
| Tongi-Khal | 11.0 | 0.0 | −10.1 | 15.1 | 0.0 | −13.8 | |
| Turag at Mirpur | 1.9 | −0.1 | 1.4 | 5.5 | −1.0 | 0.2 | |
| Upper Balu | 7.4 | 0.0 | −5.4 | 11.3 | 0.0 | −8.4 | |
| Upper Turag | 2.2 | 0.0 | 0.6 | 4.8 | 0.0 | 0.0 | |
| BOD5 (mg/L) | Buriganga at Keraniganj | 15.9 | −5.4 | −8.4 | 27.7 | −9.9 | −13.4 |
| Dhaleswari d/s Savar | 41.3 | 0.0 | 201.6 | 176.8 | 0.0 | 219.4 | |
| Lower Balu | 48.8 | 0.0 | −5.2 | 70.2 | 0.0 | 35.6 | |
| Lower Buriganga | 3.4 | −0.6 | −1.5 | 9.1 | −2.7 | −4.1 | |
| Shitalakhya | 5.6 | 0.0 | −2.6 | 8.6 | 0.0 | −2.5 | |
| Tongi-Khal | 46.6 | 0.0 | −45.9 | 112.5 | 0.0 | −111.7 | |
| Turag at Mirpur | 8.0 | −5.0 | 0.6 | 17.4 | −10.7 | −0.2 | |
| Upper Balu | 23.4 | 0.0 | −15.4 | 75.6 | 0.0 | −63.8 | |
| Upper Turag | 4.7 | 0.0 | −1.1 | 18.7 | 0.0 | −6.9 | |
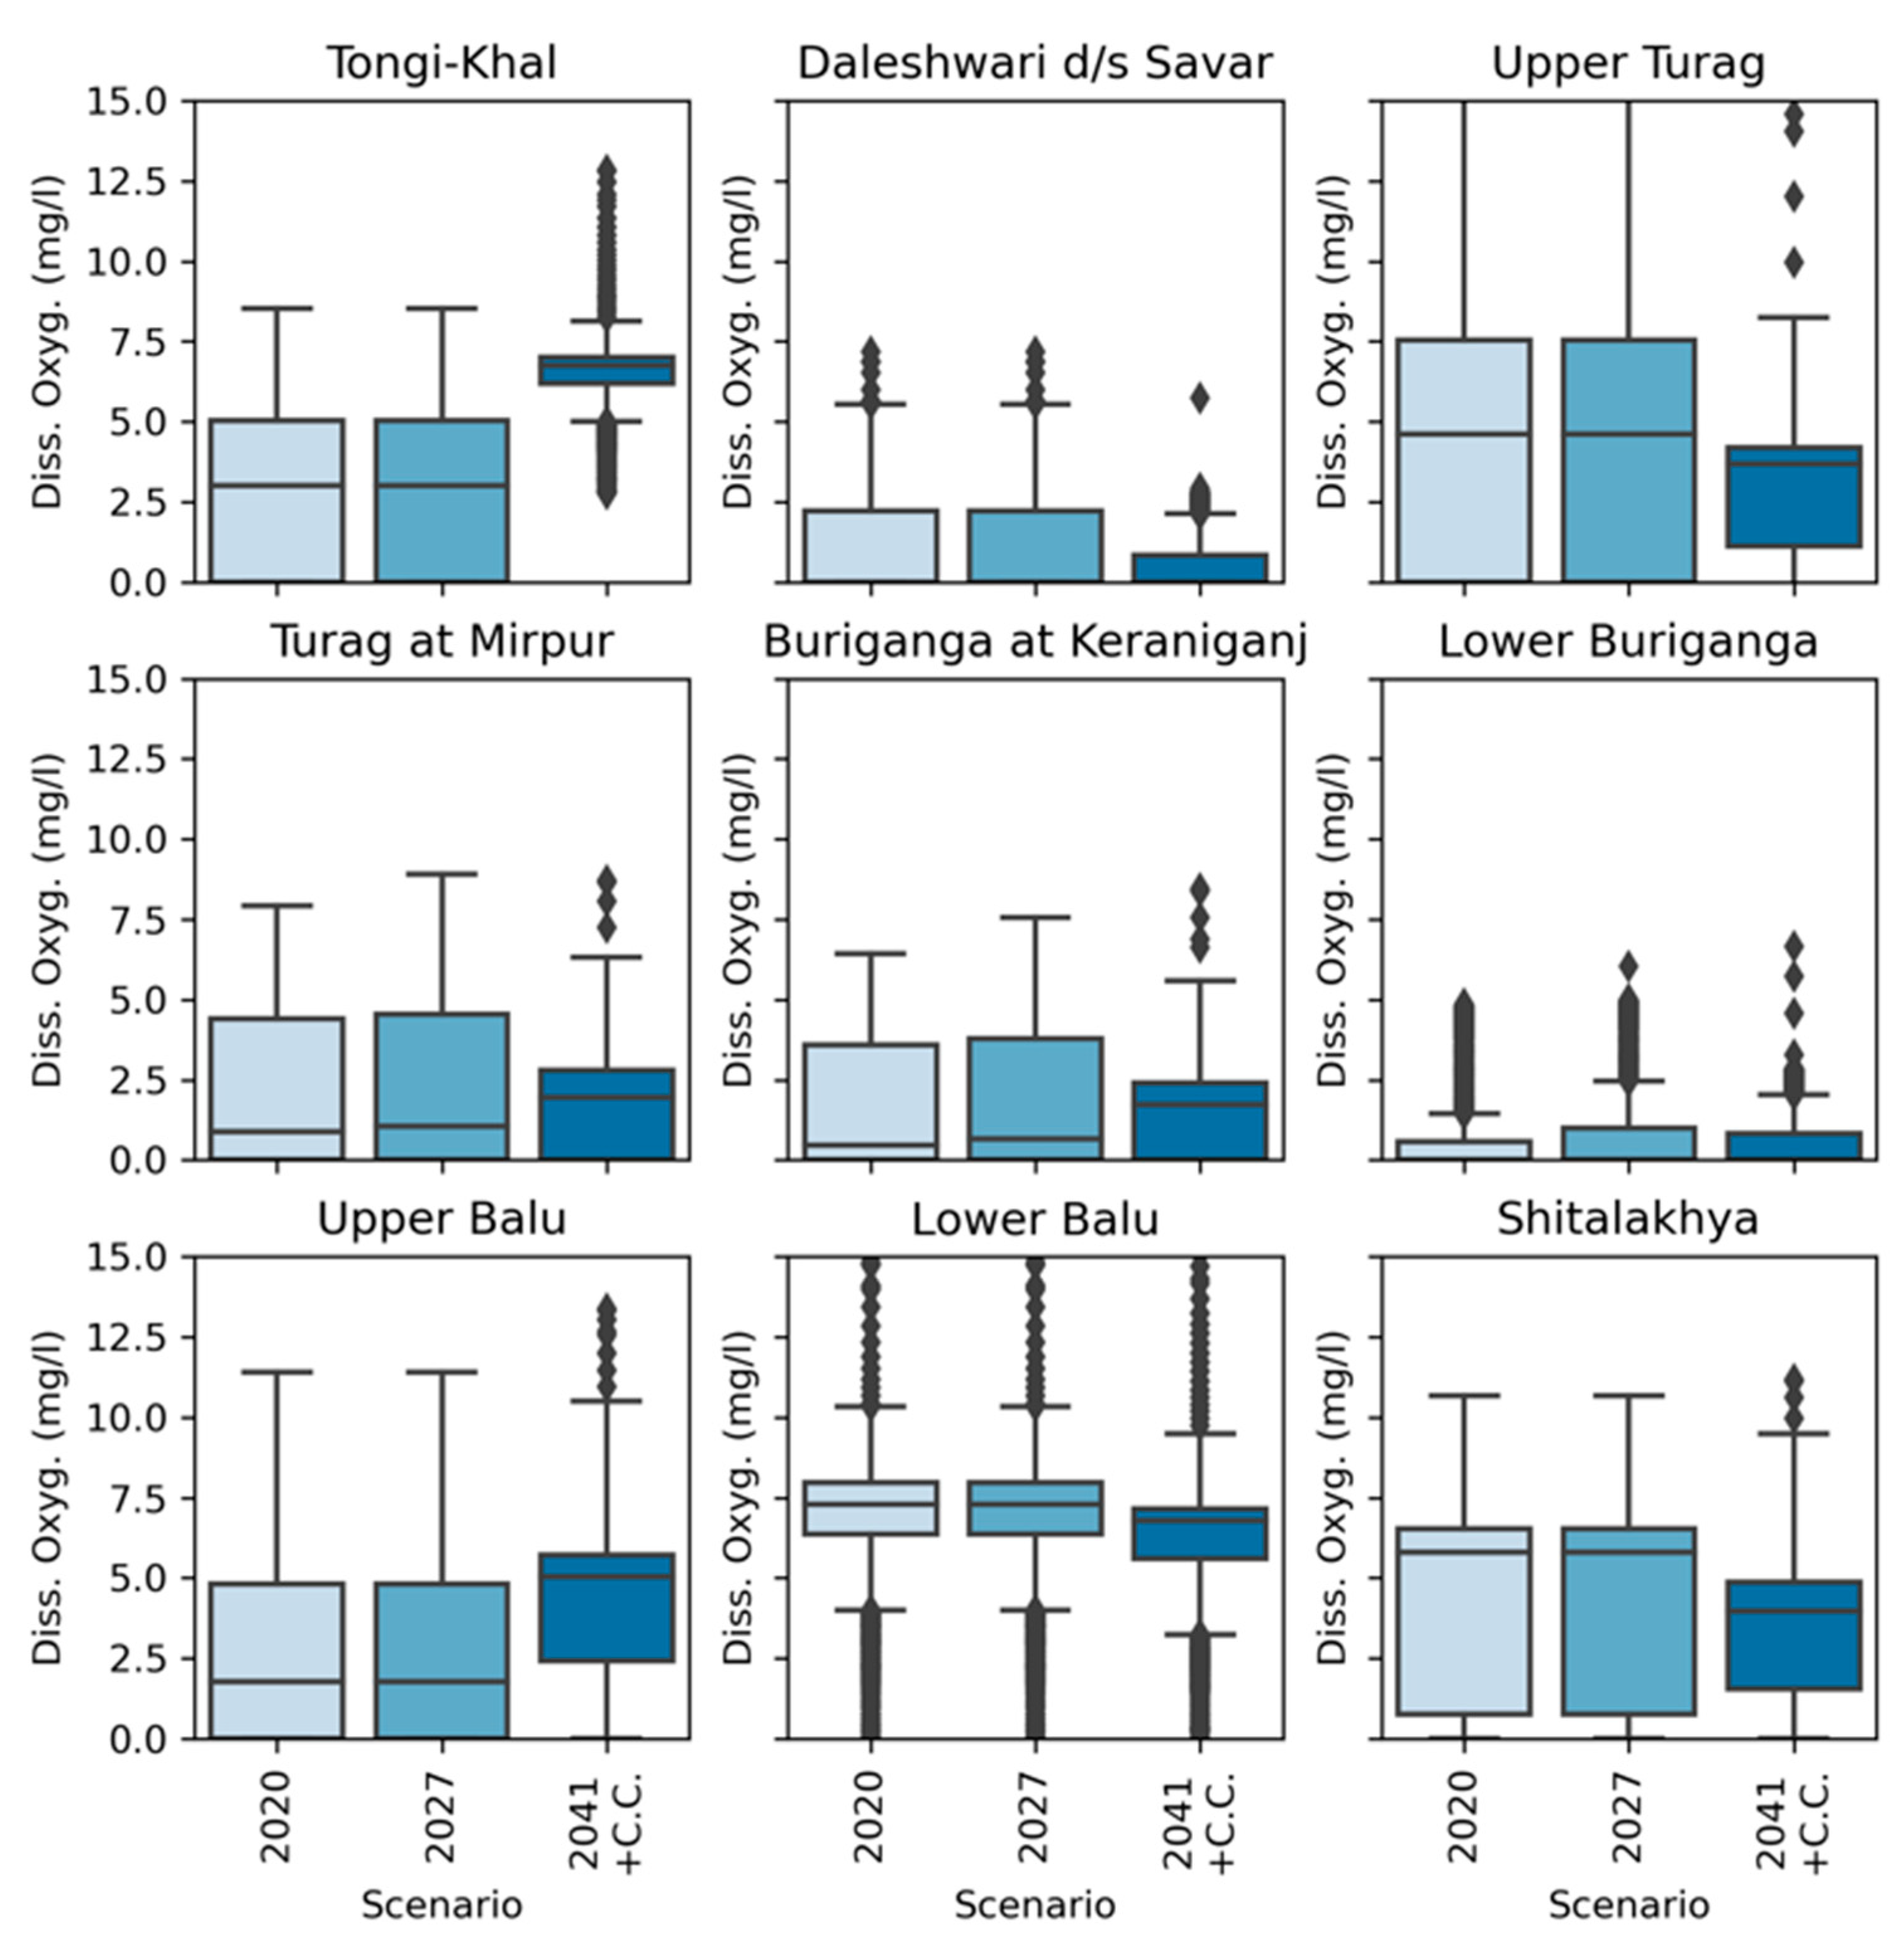
| Diss. Oxyg. (mg/L) | Buriganga at Keraniganj | 0.0 | 0.0 | 0.0 | 0.0 | 0.0 | 0.0 |
| Dhaleswari d/s Savar | 0.0 | 0.0 | 0.0 | 0.0 | 0.0 | 0.0 | |
| Lower Balu | 8.1 | 0.0 | −1.3 | 3.6 | 0.0 | −1.2 | |
| Lower Buriganga | 0.0 | 0.0 | 0.0 | 0.0 | 0.0 | 0.0 | |
| Shitalakhya | 4.0 | 0.0 | −1.3 | 0.0 | 0.0 | 0.0 | |
| Tongi-Khal | 0.0 | 0.0 | 6.9 | 0.0 | 0.0 | 5.0 | |
| Turag at Mirpur | 0.0 | 0.0 | 0.0 | 0.0 | 0.0 | 0.0 | |
| Upper Balu | 0.0 | 0.0 | 4.4 | 0.0 | 0.0 | 0.8 | |
| Upper Turag | 0.7 | 0.0 | 1.5 | 0.0 | 0.0 | 0.0 | |
| Nitrate (mg/L) | Buriganga at Keraniganj | 18.0 | −3.1 | 1.9 | 25.7 | −4.2 | −0.3 |
| Dhaleswari d/s Savar | 13.0 | 0.0 | 2.3 | 18.4 | 0.0 | 0.3 | |
| Lower Balu | 6.8 | 0.0 | −1.1 | 10.9 | 0.0 | −3.1 | |
| Lower Buriganga | 17.7 | −3.1 | 1.7 | 25.0 | −4.2 | −0.5 | |
| Shitalakhya | 7.8 | 0.0 | −1.8 | 12.0 | 0.0 | −3.9 | |
| Tongi-Khal | 15.1 | 0.0 | −7.8 | 18.0 | 0.0 | −8.7 | |
| Turag at Mirpur | 15.3 | −2.0 | 4.0 | 22.8 | −2.8 | 2.1 | |
| Upper Balu | 15.9 | 0.0 | 1.3 | 20.5 | 0.0 | 1.4 | |
| Upper Turag | 13.5 | 0.0 | 4.6 | 21.2 | 0.0 | 2.6 | |
| Ammon. (mg/L) | Buriganga at Keraniganj | 5.7 | −1.6 | −0.2 | 8.2 | −2.3 | −1.0 |
| Dhaleswari d/s Savar | 5.5 | 0.0 | 1.2 | 7.8 | 0.0 | 0.4 | |
| Lower Balu | 3.7 | 0.0 | −1.4 | 6.1 | 0.0 | −2.9 | |
| Lower Buriganga | 5.6 | −1.6 | −0.2 | 8.0 | −2.2 | −1.0 | |
| Shitalakhya | 4.3 | 0.0 | −1.8 | 6.9 | 0.0 | −3.3 | |
| Tongi-Khal | 13.3 | 0.0 | −10.5 | 15.9 | 0.0 | −12.3 | |
| Turag at Mirpur | 3.9 | −1.0 | 0.9 | 5.8 | −1.4 | 0.5 | |
| Upper Balu | 11.6 | 0.0 | −3.2 | 15.0 | 0.0 | −4.3 | |
| Upper Turag | 2.6 | 0.0 | 0.9 | 4.2 | 0.0 | 0.5 | |
Disclaimer/Publisher’s Note: The statements, opinions and data contained in all publications are solely those of the individual author(s) and contributor(s) and not of MDPI and/or the editor(s). MDPI and/or the editor(s) disclaim responsibility for any injury to people or property resulting from any ideas, methods, instructions or products referred to in the content. |
© 2023 by the authors. Licensee MDPI, Basel, Switzerland. This article is an open access article distributed under the terms and conditions of the Creative Commons Attribution (CC BY) license (https://creativecommons.org/licenses/by/4.0/).
Share and Cite
Bussi, G.; Shawal, S.; Hossain, M.A.; Whitehead, P.G.; Jin, L. Multibranch Modelling of Flow and Water Quality in the Dhaka River System, Bangladesh: Impacts of Future Development Plans and Climate Change. Water 2023, 15, 3027. https://doi.org/10.3390/w15173027
Bussi G, Shawal S, Hossain MA, Whitehead PG, Jin L. Multibranch Modelling of Flow and Water Quality in the Dhaka River System, Bangladesh: Impacts of Future Development Plans and Climate Change. Water. 2023; 15(17):3027. https://doi.org/10.3390/w15173027
Chicago/Turabian StyleBussi, Gianbattista, Shammi Shawal, Mohammed Abed Hossain, Paul G. Whitehead, and Li Jin. 2023. "Multibranch Modelling of Flow and Water Quality in the Dhaka River System, Bangladesh: Impacts of Future Development Plans and Climate Change" Water 15, no. 17: 3027. https://doi.org/10.3390/w15173027