
Water Quality Influences Self-Purification in the Cihawuk and Majalaya Segments Upstream of the Citarum River, West Java, Indonesia


1
Department of Environmental Science, Graduate School, Universitas Padjadjaran, Jl. Dipati Ukur No. 35, Coblong, Bandung 40132, Indonesia
2
Department of Chemistry, Faculty of Mathematics and Natural Science, Universitas Padjadjaran, Jl. Raya Bandung-Sumedang KM. 21 Jatinangor, Sumedang 45363, Indonesia
3
Department of Trandisiplinary Science, Graduate School, Universitas Padjadjaran, Jl. Dipati Ukur No. 35, Coblong, Bandung 40132, Indonesia
*
Author to whom correspondence should be addressed.
Water 2023, 15(16), 2998; https://doi.org/10.3390/w15162998
Submission received: 12 July 2023
/
Revised: 17 August 2023
/
Accepted: 18 August 2023
/
Published: 20 August 2023
(This article belongs to the Section Water Quality and Contamination)
Abstract
:Self-purification plays an important role in water regulating ecosystem services aimed at protecting river water quality from pollutant inputs. The Citarum River is the longest river in West Java, Indonesia where the water quality has declined due to pollutant inputs from domestic and non-domestic activities. This study aims to investigate the status of self-purification ecosystem services and the influence of water quality in the upstream of the Citarum River, in the Cihawuk and Majalaya segments, which are rural and urban areas. The self-purification status was determined by the deoxygenation rate using Thomas’s slope method, and by the reaeration rate according to O’Connor and Dobbins’ method. The polynomial component regression (PCR) was performed to determine the significance of the influence of physicochemical factors on self-purification. The deoxygenation rates (k1) in the rural and urban areas upstream of the Citarum River were 0.044 per day and 0.058 per day, respectively, while the reaeration rates (k2) in the rural and urban areas were 0.196 per day and 0.156 per day, respectively. These deoxygenation and reaeration rates indicate that the self-purification status upstream of the Citarum River has been disturbed. This result also indicates that chemical factors have a significant influence on the deoxygenation process, while the reaeration process is most significantly influenced by physical factors. The deterioration of self-purification in the Citarum River poses a risk to the long-term availability of water resources. Therefore, this research encourages the reduction in the input of organic pollutants and develops a strategic plan for river management.
1. Introduction
West Java’s longest national strategic river, the Citarum River, has a basin length of 297 km and a watershed area of 6614 km2 [1]. It serves as a vital lifeline for the economies of local communities in West Java and Jakarta, fulfilling diverse roles such as providing raw water, supporting irrigation, fisheries, agricultural support, and hydroelectric power generation for Java and Bali, and providing industrial resources and facilitating various other activities [2,3]. As an aquatic ecosystem, the Citarum River provides services such as provisioning, regulating, maintaining culture, and supporting the ecosystem [4]. Rivers can provide products and services optimally because of their role in regulating and supporting services [5]. Population growth has resulted in increased anthropogenic activities within the Citarum watershed, leading to the problems of pollution and environmental damage [6]. The pollution and degradation of the Citarum River is primarily caused by pollution from industrial, agricultural, livestock, fishery, and domestic waste, including both domestic wastewater and garbage [7,8,9]. The complexity of the damage and pollution issues is so severe that the Citarum River has gained the notorious distinction of being labeled the dirtiest river in the world [7].
The degradation of the Citarum River has led to disruption and damage caused by an excessive exposure to pollutants, which has profound implications for its ecosystem services [10]. The impacts of this degradation on the ecosystem services of the Citarum River include a reduction in both the quantity and quality of drinking and non-consumable raw water, rendering it unsuitable for use as a source of water for drinking, fisheries, and agriculture. Additionally, there has been a decline in fish populations [11], a disruption of the transportation system, a disturbance to reservoirs and hydropower generation, and negative effects on tourism and recreational activities, as well as a loss of the river’s aesthetic and spiritual values [11,12]. The degradation further contributes to uncontrolled flooding, river siltation, declining groundwater quality, and public health problems [6].
This problem occurs because the regulating and supporting services can no longer accommodate the existing pollutant load [13]. Regulating services are ecosystem services that affect the flow and function of other ecosystem services [4]. The disruption of regulating services causes a decrease in provider and cultural services [14], meaning that some human needs will not be met. The critical issue facing the Citarum River is the problem of poor water quality, but this has led to various other problems. According to Dunca [15], river water quality is important because all living things need water resources, and their existence has become critical. This point is strongly related to the sixth United Nations Sustainable Development Goal (SDG), which is to provide clean water and proper sanitation for all people.
The primary regulatory ecosystem service responsible for river water quality is self-purification [16]. Self-purification is the ability of a water body to purify pollutants that enter it at concentrations that are not excessive; the impact of these pollutants can therefore be minimized or even avoided [17] by reducing, eliminating, repairing, and purifying aquatic conditions if there is a natural input of pollutants from outside [18]. Water quality plays an important role in determining the self-purification ability of rivers [19]. The efficiency of the self-purification process depends on the water quality. For instance, low water quality means less oxygen for the microorganisms that decompose organic matter, while high water quality means less nutrients for the plants that absorb pollutants. Therefore, water quality influences and is influenced by self-purification. The deterioration of this service impacts various environmental, economic, social, and health sectors. Environmental damage problems related to water quality prevent water consumption needs from being fulfilled and can lead to a decrease in population income, thus negatively impacting human well-being [13].
Several previous studies on self-purification in the tributaries upstream of the Citarum River have been undertaken. Yustiani [20] studied Citepus River in Bandung in the dry season and found deoxygenation rates ranging from 0.0309 to 0.0328 per day. Yustiani [21] studied the same river in the rainy season and found deoxygenation rates ranging from 0.095 to 0.9 per day. Yustiani [22] found deoxygenation rates in the Cikapundung River in Bandung ranging from 0.001 to 0.370 per day. Yustiani [23] found deoxygenation rates in the Cicadas River ranging from 0.01 to 0.17 per day. These results show that the deoxygenation values of the tributaries upstream of the Citarum River can be categorized as low. While previous research has made significant strides in understanding the deoxygenation coefficient of the Citarum River, there is a notable research gap that requires further exploration. Specifically, there is a lack of comprehensive studies examining the interplay between various physicochemical factors, such as nutrient levels, temperature, and pollutant loads, and their collective influence on the self-purification capacity of the Citarum River. Addressing these research gaps can provide important insights into the mechanisms and status underlying the self-purification processes (deoxygenation and reaeration) and provide a comprehensive discussion of the influence of physicochemical parameters on the self-purification process.
The problems occurring in the Citarum River can be moderated by building ecological resilience through paying greater attention to regulating ecosystem services. Regulating ecosystem services represent the capacity of ecosystems to cope with and adapt to different types of disturbances [24]. Thus, the maintenance and enhancement of regulating ecosystem services is an important form of insurance for the environment as it adapts to accelerating ecological change [25]. The objective of this study is to investigate the self-purification capacity of the Citarum River and to assess the factors affecting its efficiency in removing pollutants. Specifically, this study aims to analyze self-purification and other physicochemical parameters along different river sections. The rationale behind this study is to fulfill the urgent need for a comprehensive understanding of the self-purification process in the Citarum River, which has been severely affected by industrial and domestic waste discharges. By identifying the key factors that influence the self-purification process, this study will make a valuable contribution to water quality management and restoration efforts. The findings of this study will assist policy makers and environmental stakeholders in formulating targeted strategies to improve the ecological health of the river and promote sustainable water resource management practices in the region.
This study will be conducted on the capacity for river self-purification and the influence of water quality parameters on self-purification ecosystem services in rural and urban areas upstream of the Citarum River. The purpose of this study is to contribute information on the self-purification ecosystem service to the literature and applicable to sustainable river management. In addition, this study will enable more effective planning of strategies to mitigate water quality degradation and restore the ecological health of critically important river systems are topics that are addressed in this research.
2. Materials and Methods
2.1. Determination of Sampling Method
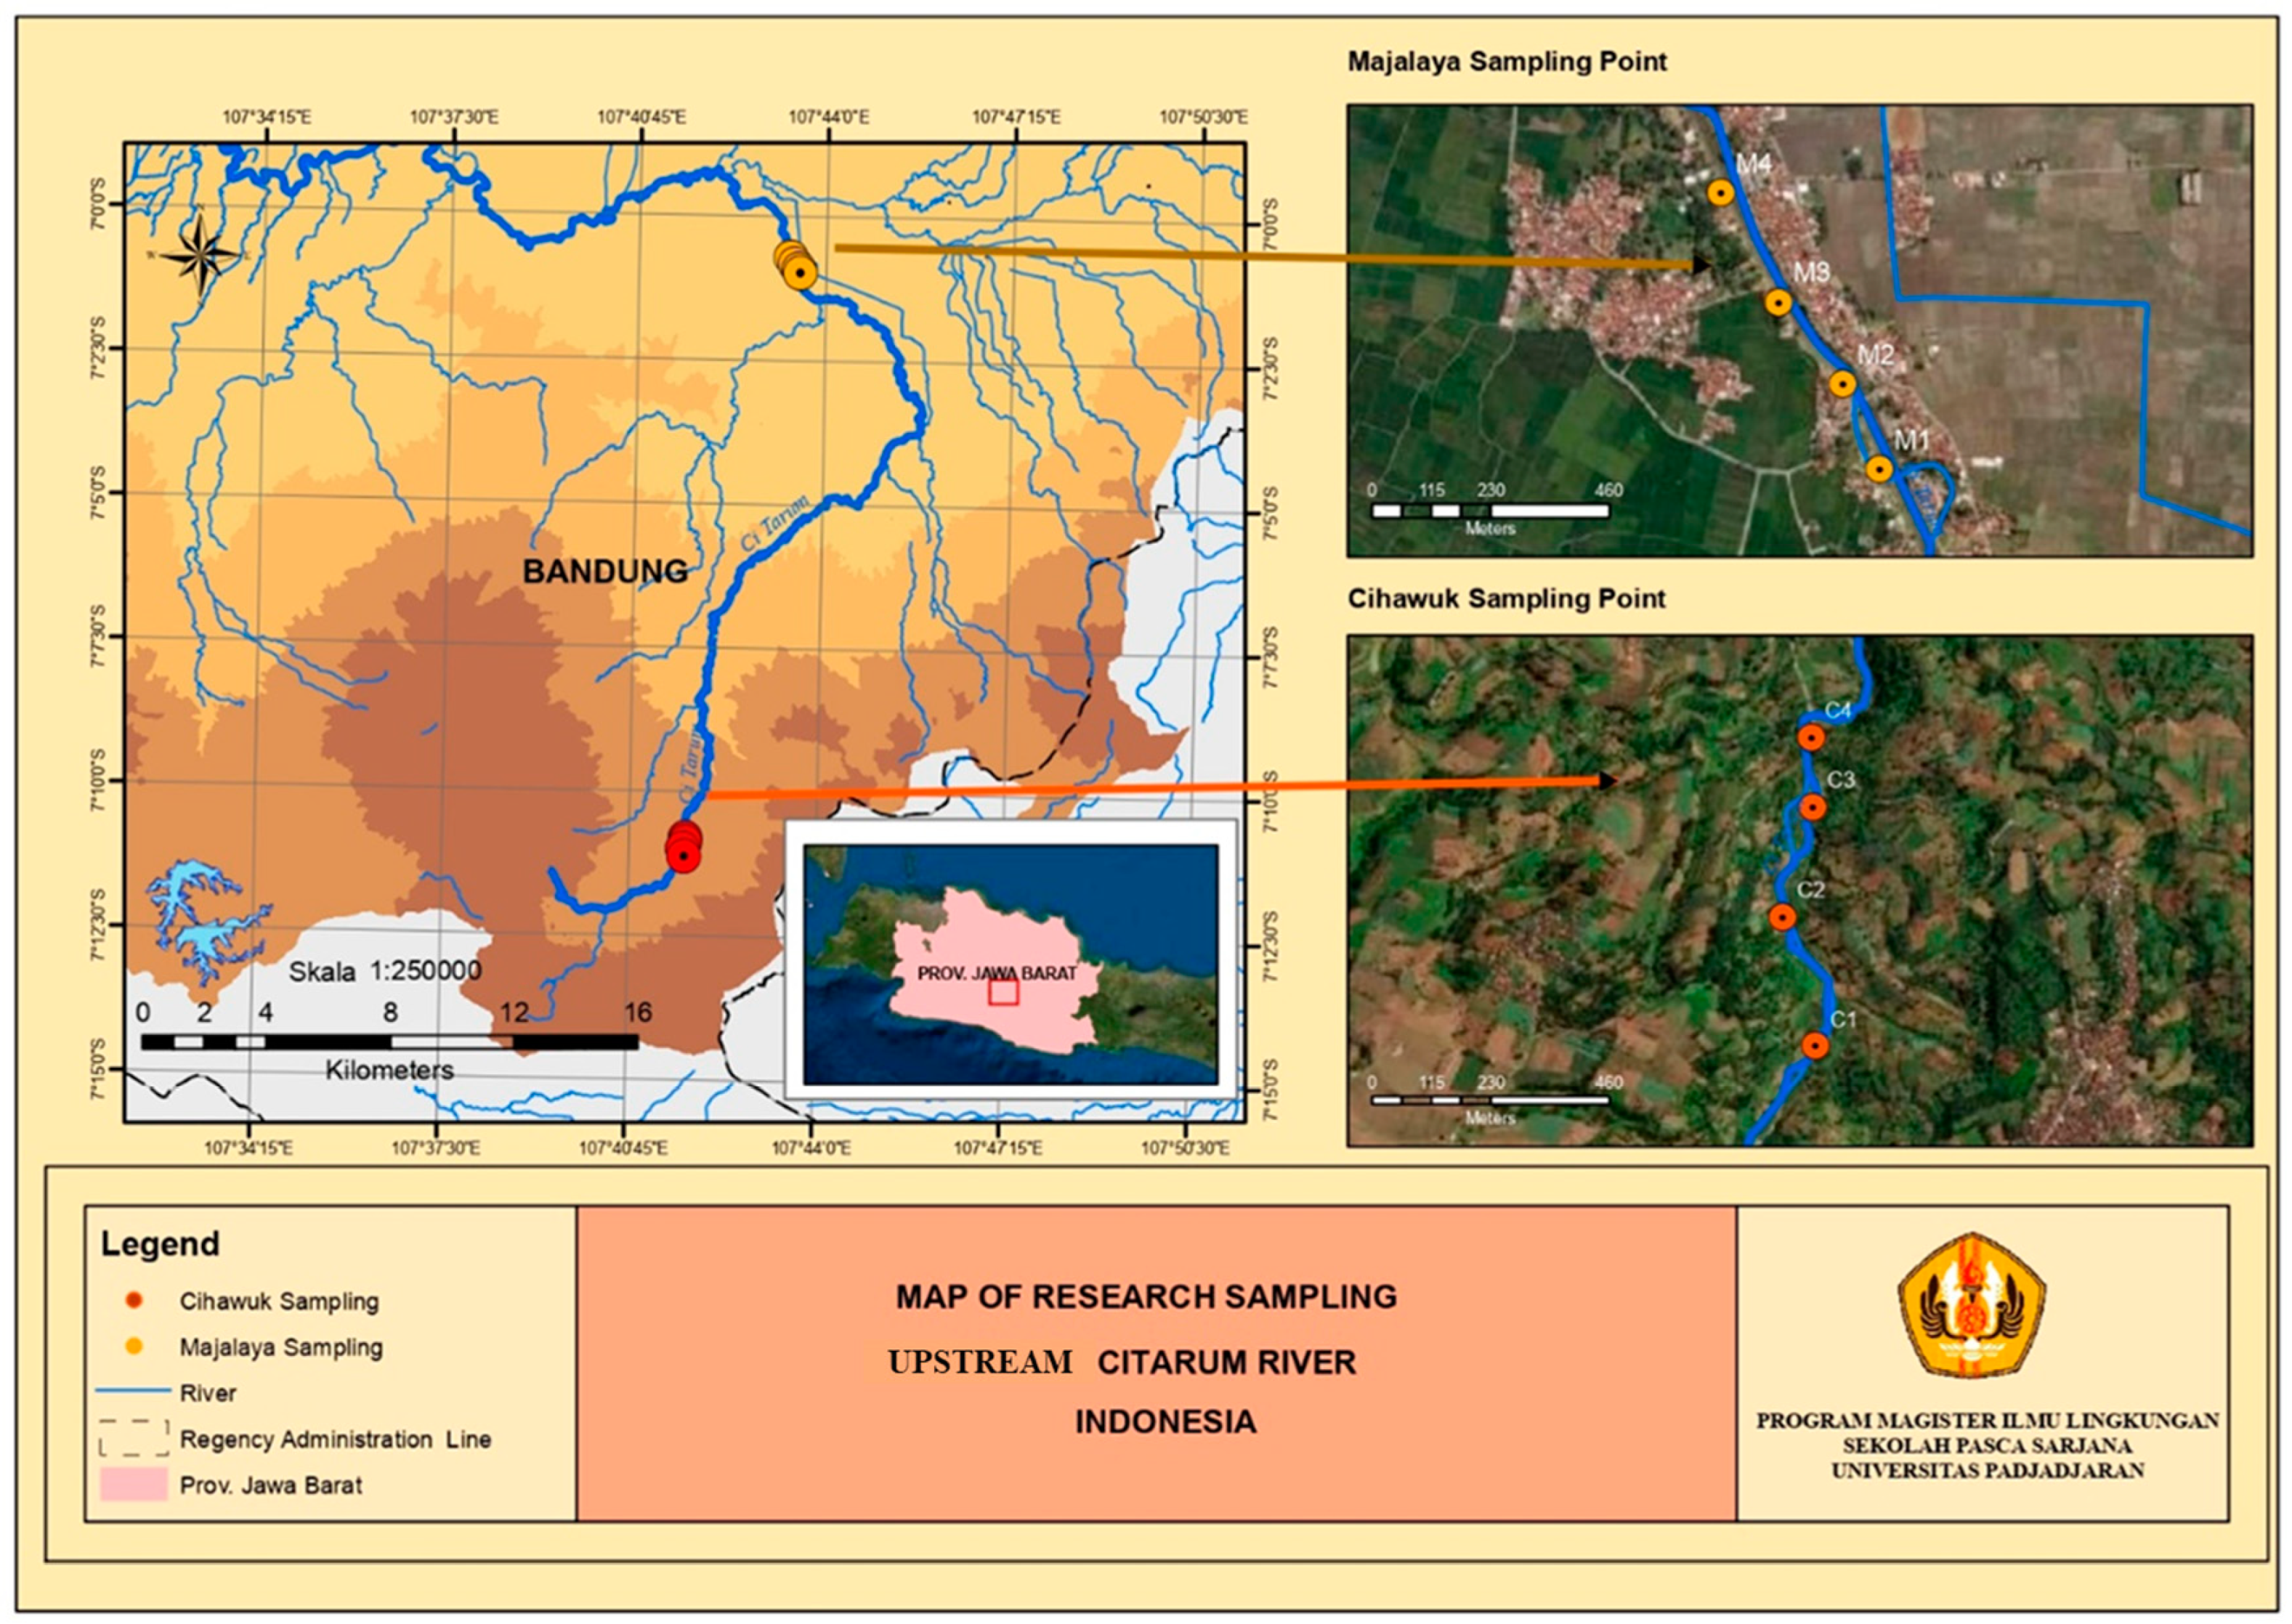
The sampling location for this study was the upstream segment of the Citarum River. The Citarum River has been identified as one of the most polluted rivers in the world due to the impact of manufacturing industries, timber activities, the rubber industry, urbanization, untreated domestic wastewater, and animal waste. Sample sites were selected in both rural (Cihawuk) and urban (Majalaya) areas. Determination of the sample sites was based on the purposive sampling method; sample sites were chosen on the basis of the research objectives and ease of access where, along the stream, only one tributary input is found as the starting point. Four sample sites were selected for each segment. The rural area is located in the Cihawuk segment (code C), which is dominated by horticultural agriculture and settlements. Sample sites in the rural area were located at coordinates 7°11′7.87″ S 107°41′42.14″ E (C1), 7°10′59.78″ S 107°41′40.08″ E (C2), 7°10′52.88″ S 107°41′41.93″ E (C3), and 7°10′48.50″ S 107°41′41.82″ E (C4). Meanwhile, the urban area in the Majalaya segment (code M) is dominated by settlements, factories, and rice fields, which all cause pollution. The urban sample sites were located at coordinates 7°0′59.56″ S 107°43′31.58″ E (M1), 7°0′54.32″ S 107°43′29.17″ E (M2), 7°0′49.26″ S 107°43′25.07″ E (M3), and 7°0′42.51″ S 107°43′21.34″ E (M4). A map of the study area in the Upstream Citarum River is shown in Figure 1.
2.2. Water Sampling
The water samples were collected in August 2022 during the dry season. The grab sampling method was used at each sample site. In this method, a sample is taken immediately at a specific location [26]. Water sampling at each sample site was carried out at three distance points from the riverbank at 1/4, 1/2, and 3/4 of the river’s width, with each sample at a depth of 0.2, 0.5, or 0.8, respectively, from the surface, and then in composite. After the appropriate procedures were used to collect the water samples, water quality checks were conducted at a laboratory. Samples were stored in sample bottles and kept in a cool box while on the way to the laboratory, and when they arrived, they were stored in a cooler at ±4 °C for the duration of the research.
2.3. River Hydrogeometry Measurements
Hydrogeometric measurements of the river included measurements of the river’s dimensions and flow discharge. Measurement of the river’s dimensions was performed by dividing the width of the river by the same interval distance to obtain a value for the cross-sectional area of the river by calculating the trapezoidal area. Discharge was measured by measuring the speed, depth, and width of the river’s flow and calculating the river discharge using the cross-sectional area in accordance with the relevant guidelines [27]. Flow velocity measurements were carried out using a current meter at depths of 0.2 depth and 0.8 depth for 10 seconds [27] and were repeated three times.
2.4. Water Quality Assessment
The physicochemical water variables were measured at the same sites that the samples were taken from. The following physicochemical attributes were used in the self-purification database: water temperature (T), dissolved oxygen (DO), pH, transparency (TP), conductivity (CD), total dissolved solids (TDSs), total suspended solids (TSSs), biological oxygen demand (BOD5), chemical oxygen demand (COD), and total organic matter (TOM). We chose physicochemical parameters based on references that can influence the self-purification process, namely deoxygenation and reaeration [28]. Water quality significantly influences the self-purification capacity of natural water bodies, including streams [28,29,30]. The quality of water in a stream is closely linked to its ability to support these self-purification mechanisms [28].
In situ water temperature and DO were measured using a Lutron series portable DO meter (DO-5510, Lutron, Taiwan) [31]. pH and CD were measured using a Lutron series portable pH meter (pH-207, Lutron, Taiwan) and a portable conductivity meter (CD-4301, Lutron, Taiwan) at 25 °C [31]. Transparency was measured using a Secchi disk. The total suspended solids (TSSs) and total dissolved solids (TDSs) were separated by filtering the water through 0.45 μm filter paper and determined according to standard procedures of the APHA [31]. The sampling, preservation, and analytical procedures for the measurement of BOD, COD, and TOM were conducted following APHA’s Standard Method [31].
2.5. Self-Purification Measurement
The self-purification status of the Citarum River was assessed using deoxygenation and reaeration analysis. The water samples were collected in one rural (Cihawuk) and one urban area (Majalaya). The deoxygenation rate range was determined through the laboratory analysis of the oxygen uptake of the river water samples. The water samples were then placed in an incubator at 20 °C. Analysis of DO concentration was undertaken using the Winkler method; DO concentrations were measured daily for 10 days to estimate the rate of deoxygenation. The accumulated DO loss generated of each sample was used to calculate of the deoxygenation rate, and a Cartesian coordinate graph was plotted to show the DO loss versus time curve. The deoxygenation rate was calculated using the slope method developed by Thomas, which gives the BOD constant via the least square treatment of the basic form of the first-order reaction [32]. The reason for using Thomas’s slope method in this study is its widespread popularity as the preferred method for calculating deoxygenation rates. This method determines the deoxygenation rate on the basis of the similarity of two functions, and can be represented as follows [32]:
where dy is the increase in BOD per unit time t, k1 is the deoxygenation rate coefficient constant (per day), La is the first stage of ultimate BOD (mg/L), and y is the BOD exerted in time t (mg/L). Equation (1) is a linear correlation between dy/dt and y. Consider y′ = dy/dt as the BOD change rate, and n as the number of BOD measurements minus one. The two equations used to determine k1 and La are presented in Equations (2) and (3).
dy/dt = k1(La − y) = k1La − k1y
Solving Equations (2) and (3) yields the values of a and b, from which k1 and La can be determined directly by the following relations, i.e., Equations (4) and (5):
O’Connor and Dobbins’ method of calculating the reaeration rate is considered the most accurate and is widely used. In this method, the reaeration coefficient is calculated using the rate of oxygen input into the water body, as represented by Equation (6):
where k2 is the reaeration rate coefficient, Do is the air diffusion coefficient (17.6 × 10⁻⁵ m2/day at 20 °C), H is the depth of the water (m), and U is the stream velocity (m/s).
2.6. Statistical Analysis
Studies of physicochemical parameters in connection to water have extensively used correlation analysis. Correlation coefficient values that are close to +1 or −1 imply that there is a good chance that the variables x and y have a linear relationship. In this study, a correlation matrix was calculated using the Pearson correlation test (p < 0.05; p < 0.01). Principle component analysis (PCA) is a multivariate analysis tool used to transform a large dataset of correlated parameters into a much smaller dataset of uncorrelated polynomial components (PCs) [33]. The PCs acquired by multiplying the original correlated parameters by the eigenvectors (loadings) can provide information on the most meaningful parameters that describe a whole dataset, allowing for data reduction with minimal loss of original information [34]. In this study, the sample data were separated into physical and chemical categories, the five water variables in each group were compressed into two eigenvectors by applying a PCA, and they were used in the linear models. Self-purification (deoxygenation and reaeration) was estimated using a multivariate polynomial component regression (PCR) linear mixed analysis as a function of physicochemical parameters including physical variables (PhysPC1 and PhysPC2) and chemical variables (ChemPC1 and ChemPC2). PCR is a method of dealing with multicollinearity problems in data. This regression analysis was combined with PCA to determine the relationship between independent and control variables. A t-test (p < 0.05) was used to analyze the differences in the process of self-purification in rural and urban areas of the river. All statistical analyses were conducted using Statistical Packages for Science (SPSS Version 25).
3. Results
3.1. Physicochemical Properties of Citarum River
The following physicochemical parameters were measured: temperature, conductivity, transparency, TDS, TSS, pH, DO, BOD, COD, and TOM. The water temperature in the Majalaya area (T = 26 °C) is higher than in the Cihawuk area (T = 21.75 °C) (Table 1). In the Majalaya area, as conductivity increases, TDS also increases. The conductivity of water is associated with the particles dissolved in the water (TDS), so that the two parameters can be measured simultaneously. In Cihawuk, the DO concentration is higher than in Majalaya (Table 1). The DO concentration in Majalaya is very low at 1.367 mg/L, which already exceeds the national quality standard. The BOD and COD concentrations for both Cihawuk and Majalaya exceed the Indonesia Quality Standard (IQS) [35]. The TOM was found to be higher in Majalaya than in Cihawuk, at 24.41 mg/L (Table 1).
3.2. Hydrogeometry of Upstream Citarum River
The hydrogeometry of the Citarum River varies between the Cihawuk and Majalaya areas due to geographical and topographic factors. The Cihawuk area has an agricultural topography with high slopes. Meanwhile, Majalaya has a relatively flat topography, dominated by settlements and factories. The sloping topography affects the river’s velocity in the Cihawuk area (0.618 m/s), which is much higher than in Majalaya (0.48 m/s) (Table 2). The Majalaya segment of the river has a depth of 0.40–0.46 m and a discharge of 3.41–3.42 m3/s (Table 2). The Majalaya area of the river is much wider (16.55 m compared to the Cihawuk area’s 4.13 m). The Majalaya area experiences a significantly higher water discharge rate, emphasizing the substantial difference in flow between the two locations.
3.3. Self-Purification Upstream of the Citarum River
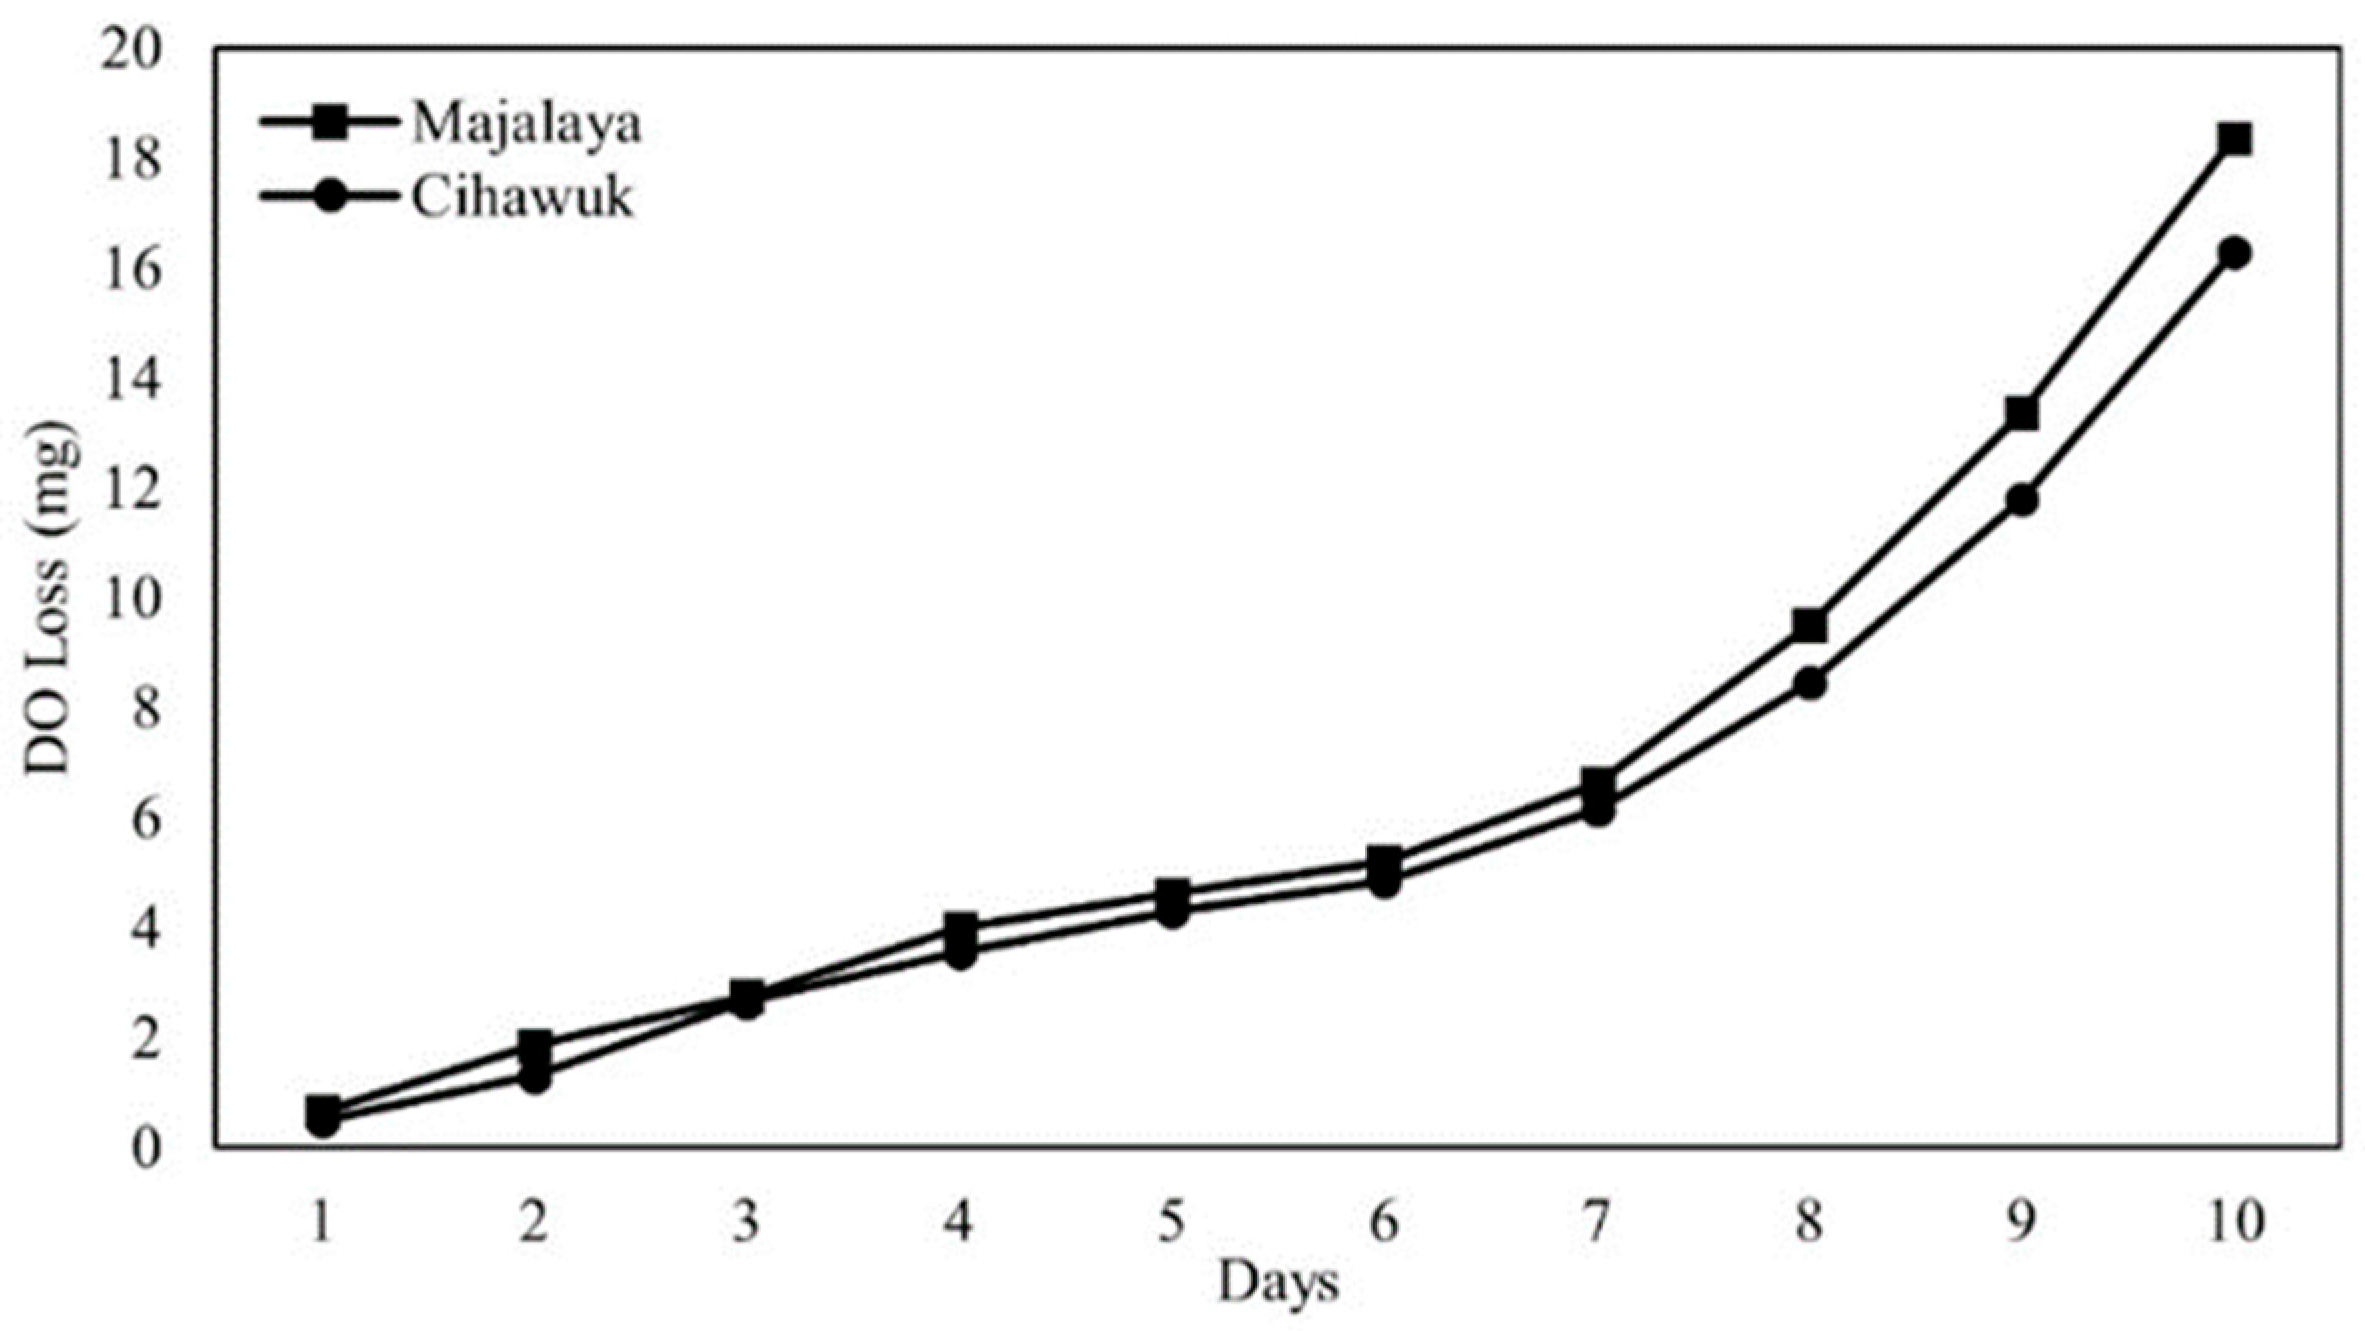
The DO loss represents the amount of oxygen required by microbes to decompose organic matter. The dissolved oxygen (DO) loss values in Cihawuk and Majalaya were 16.3 mg and 18.37 mg, respectively. Thus, in Majalaya, the river needs more oxygen than in Cihawuk (Figure 2). Figure 2 illustrates the graph representing the cumulative utilization of dissolved oxygen (DO) over a period of 10 days, considering a predetermined testing time lag for water samples taken at the upstream point. Oxygen is consistently utilized for the decomposition of organic matter that is present in the water sample. The graph demonstrates a continuous consumption of oxygen, indicating the ongoing decomposition of organic matter that is present in the water samples.
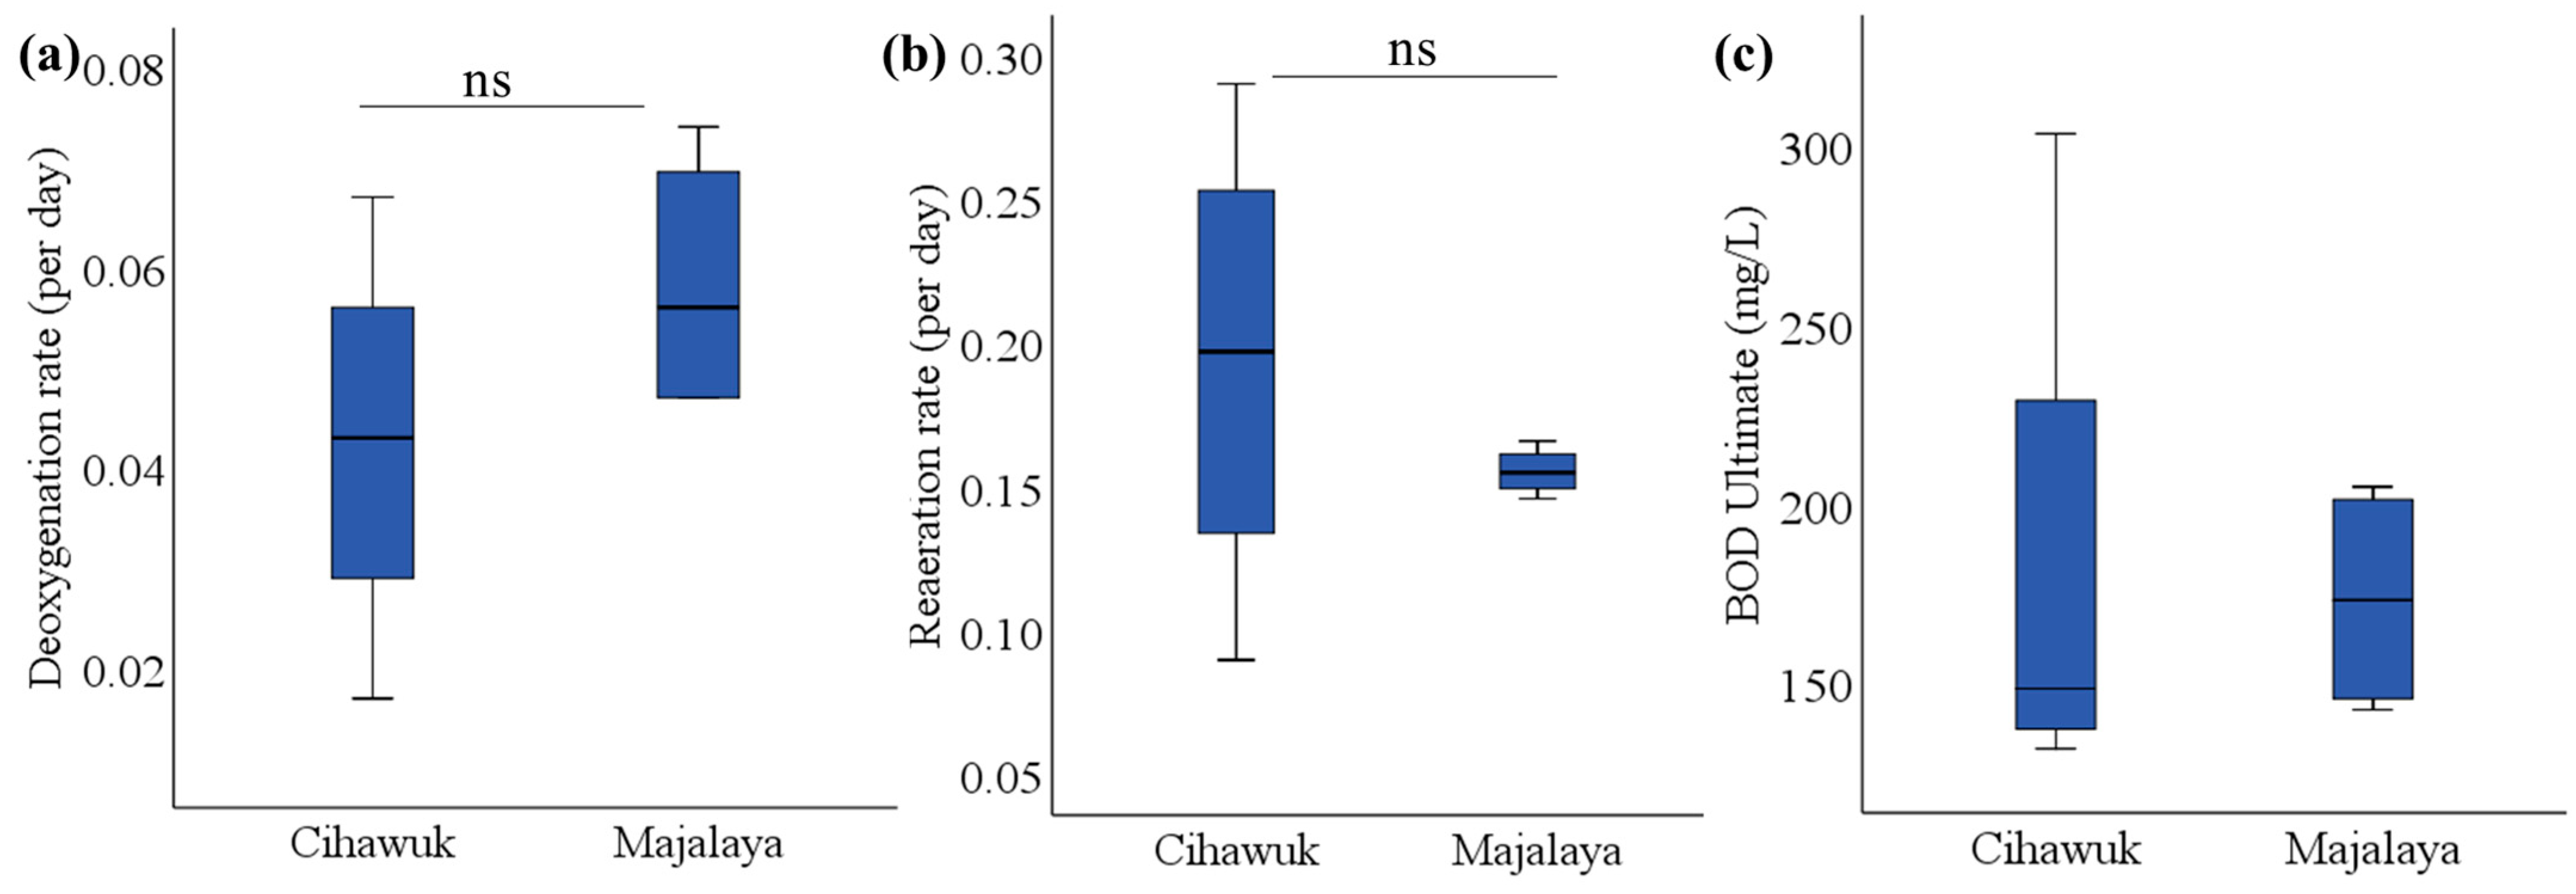
The deoxygenation rate in the Cihawuk area was found to range from 0.017 to 0.067 per day. However, the deoxygenation rate in the Majalaya area was 0.047–0.074 per day, relatively (Figure 3). The deoxygenation rate in Majalaya is higher than in Cihawuk, indicating that the decomposition process is faster and more effective in Majalaya. The average reaeration rates in the Cihawuk and Majalaya segments were 0.193 per day and 0.156 per day, respectively. The higher reaeration rate found in the Cihawuk area is due to faster current velocities than in Majalaya. The t-test indicated that the deoxygenation and reaeration rates in Cihawuk and Majalaya were not significantly different. The Thomas’ slope method calculation obtained the ultimate BOD values, or the total amount of organic matter contained in the water samples. The ultimate BOD values in the Cihawuk segment of the river (131.79–303.11 mg/L) are higher than those in the Majalaya segment (142.60–204.70 mg/L) (Figure 3).
3.4. Correlation Matrix of Physicochemical Water Properties Upstream of the Citarum River
Some physicochemical water properties were positively or negatively correlated with each other. The T was strongly significantly correlated with CD (R = 0.88, p < 0.05), TP (R = 0.87, p < 0.05), TDS (R = 0.89, p < 0.05), TSS (R = −0.85, p < 0.05), pH (R = −0.94, p < 0.01), and DO (R = −0.91, p < 0.05) (Table 3). The T was also strongly, but not significantly, correlated with BOD (R = 0.58), COD (R = −0.75), and TOM (R = 0.75). The DO was significantly and negatively correlated with T (R = −0.91, p < 0.05), CD (R = −0.99, p < 0.01), TP (R = −0.99, p < 0.01), TDS (R = −0.99, p < 0.01), and TOM (R = −0.88, p < 0.05) (Table 3). The physical variables were all significantly negatively or positively correlated with each other.
3.5. Polynomial Component Regression (PCR)
The physicochemical variables explained 97.6% of the total variation of the physical water parameters and 93.5% of the chemical water parameters (Table 4 and Table 5). CD, TP, and TDS are highly correlated and positively influenced on the first axis (PC1) in terms of physical variation. The T value was positive and the TSS value was negative on the second axis (PC2) (Table 4). As for chemical variation, the pH, DO, and COD were strongly loaded on PC1, while the BOD and TOM were strongly loaded on PC2 (Table 5).
PhysPC1, PhysPC2, and ChemPC1 had positive effects on self-purification, especially the deoxygenation process (Table 6). In addition, ChemPC2 was the sole factor that significantly negatively influenced the deoxygenation process. PhysPC1 and PhysPC2 had significant negative and positive effects on self-purification, respectively, and especially on the reaeration process (Table 6). PhysPC1 and PhysPC2 had favorable effects on reaeration. PhysPC1 had a marginally negative effect on the reaeration process. Meanwhile, PhysPC2 had a marginally positive effect on the reaeration process. However, ChemPC1 and ChemPC2 had no significant effect on the reaeration process. The reaeration process was more significantly influenced by the physical parameters than the chemical parameters.
4. Discussion
4.1. Deoxygenation and Reaeration Rates
Maintaining the water quality upstream of the Citarum River is crucial for maintaining the downstream water quality. The increasing population and the development of areas around the river have resulted in changes in human activities that impact pollution. Pollutants in the upstream of the Citarum River result from anthropogenic sources such as agriculture, households, sanitation, industry, livestock manure, and garbage. Pollution that exceeds the river’s capacity results in the deterioration of self-purification services, which impacts humans directly through the global sanitation crisis. Pollution problems in upstream rivers have a widespread impact on humans because pollutants are transported throughout the river network [36].
The deoxygenation was calculated using Thomas’s slope method with water that was incubated for ten days. Ten days of DO measurement data for each sample point was graphed to obtain the DO loss curve over time. Figure 2 shows the graph of the daily accumulation of DO loss for the Cihawuk and Majalaya water samples. Considering the high concentration of the initial DO concentration, the accumulated DO uptake in the rural water sample appears to be lower than in the urban sample. DO loss is an indicator of organic pollutants, as it measures the decrease in the amount of oxygen needed by microorganisms during the decomposition of organic matter [22]. This situation suggests that the self-purification process is still ongoing. In qualitative terms, the curve also indicates a slow deoxygenation rate. Based on the observations from Figure 2, it is evident that the Majalaya segment exhibits the highest deoxygenation rate, whereas the Cihawuk segment shows the slowest rate. Despite the low curve of accumulated oxygen usage in the Cihawuk segment, this may be attributed to the presence of a high organic matter content, indicating that the self-purification process has not yet reached an almost complete stage [37]. The consumption of dissolved oxygen (DO) continued beyond the 10th day due to the presence of the nitrogenous oxygen demand process (N-BOD) [38]. The substrate is assimilated by bacteria under aerobic conditions during the first phase of the BOD process, and a large amount of the substrate is transformed into biomass.
The deoxygenation rate in the rural area was lower than in the urban area. The standard deoxygenation rate for surface water is 0.10–0. 23 per day [39]. The water from the Majalaya area is thus closer to typical deoxygenation conditions than the water from Cihawuk. Majalaya has a high deoxygenation value, which can occur due to the activity of decomposition microorganisms, which takes place quickly even though the level of pollution is high. Meanwhile, at Cihawuk, the deoxygenation rate is not as high as it is at Majalaya. This indicates that the microbial activity in decomposing organic matter is relatively sluggish. The lower value can be attributed to suboptimal microorganisms, which lead to a less efficient decomposition of the organic matter that is present in the river water [21]. However, both are still below the standard deoxygenation rate for surface water. Other research has suggested that the deoxygenation rates in urban rivers in Indonesia are particularly low [22].
The Cihawuk and Majalaya segments of the Citarum River are characterized by high levels of organic matter, measured as the BOD, COD, and TOM (Table 1). The BOD and TOM levels in the Majalaya segment are higher than in Cihawuk. The BOD levels of both areas exceed the national quality standard [35], indicating that the river is polluted. The high BOD and TOM levels in the urban area are due to organic waste from settlements, agriculture, and industry. The high BOD concentration in the urban area indicates that the organic waste is easily decomposed. Meanwhile, the Cihawuk segment of the river has a higher COD concentration than in Majalaya. The COD is the consumption of oxygen by the organic matter that is difficult to decompose. The highest COD concentration was found in the Cihawuk segment at 52.26 mg/L (Table 1). This COD concentration exceeds the quality standard [35]. The high concentration of COD in the rural area is due to agricultural waste and run-off (fertilizers and pesticides) that is difficult to decompose, requiring more oxygen [40].
The concentration of oxygen required to decompose all organic matter is called the ultimate BOD (La). The ultimate BOD is derived using Thomas’s slope method. The maximum ultimate BOD values in Cihawuk and Majalaya were found to be 303.11 mg/L and 204.7 mg/L, respectively. The ultimate BOD was higher in the rural area than in the urban area. The results indicate that the Cihawuk segment has greater concentrations of both decomposed and undecomposed organic matter, and here, the river needs more oxygen to decompose the organic matter. The decomposition of organic matter in water bodies occurs in several stages, moving towards equilibrium in the aquatic ecosystem. The decomposition process of aquatic organic matter has two stages, which are carbonaceous and nitrogenous oxidation [41]. Under aerobic conditions, the biochemical oxidation of organic pollutants produces products from bacterial action, which forms enzyme intermediates. Organic matter is stabilized by an oxidation–reduction process whereby organic matter is oxidized (as an electron donor), while dissolved oxygen is reduced (as an electron acceptor) [42]. The process of decomposition of organic matter, namely the oxidation of carbonaceous and nitrogenous organic matter. Degradation and remediation microorganisms with only 8 mg of CH2O can fully consume oxygen in one liter of saturated water at 25 °C [41,43]. Carbonaceous organic matter will be oxidized to carbon dioxide and water together with a small amount of humus with the help of aerobic heterotroph bacteria [43]. Carbonaceous matter can be lost or added due to factors such as scouring, sedimentation, flocculation, and volatilization. Nitrogenous oxidation process is related to the conversion of ammonia to nitrite and the conversion of nitrite to nitrate, which is known as the nitrification process [44]. The microorganisms involved in this process are a type of chemoautotroph bacteria, and the fact that nitrifying bacteria have a slower growth rate compared to heterotrophic bacteria means that the nitrification process takes longer [45].
A high concentration of organic matter will result in a high deoxygenation rate. The problem is that the upstream of the Citarum River has high concentrations of organic matter but a low deoxygenation rate. A low deoxygenation rate indicates a slow stabilization rate, resulting in a high ultimate BOD. The deoxygenation rate measures the activity of microorganisms using oxygen to degrade different organic substances. A low deoxygenation rate indicates that the water is in an unhealthy condition because the self-purification process is obstructed [23]. This condition may be affected by toxic or chemical compounds, which inhibit the degradation process carried out by the microorganisms in the river; these compounds may include pesticides, phenols, surfactants, heavy metals, persistent organic compounds, etc. These wastes are persistent substances that are decomposed in natural water conditions, and so they continue to accumulate in water bodies. Ultimately, the growth and performance of decomposer microorganisms is disrupted, and the self-purification process is inhibited [22].
The reaeration rate was found to be higher in the rural area than in the urban area. The reaeration rate in the Cihawuk segment is influenced by the topography and hydrogeometry of the river, which supports turbulence, wind, and low temperatures. In streams, turbulence from the wind shear at the water’s surface yields a shallower effective mixing depth and lower gas transfer rates [46,47,48]. Meanwhile, the Majalaya segment is influenced by temperature and discharge. The topography of the Majalaya segment is dominated by residential and industrial areas, so the hydrogeometry of the river is insufficient to affect water turbulence. The reaeration process plays a vital role in the self-purification process because the decomposition of organic matter requires sufficient oxygen. When oxygen is lacking, the decomposition process is not optimal and can even produce toxins due to anaerobic processes.
The local characteristics of a river have a great influence on its self-purification mechanism. The morphological shape of a river and its velocity influence its self-discharge value. In our case, the Cihawuk segment is deeper than the Majalaya segment. Depth affects reaeration because it decreases transparency; this means that the reaeration process cannot work optimally. Decreased transparency reduces the amount of oxygen that can be transferred from the water surface to the total water volume, and thus reduces the efficiency of natural atmospheric reaeration [49]. The velocity and discharge are also influenced by the river geometry. In summary, the hydrogeometry of a river can affect self-purification processes, especially reaeration.
Overall, the self-purification processes in rural and urban areas upstream of the Citarum River basin are not significantly different. This is because the segments of the river in these two areas are still in the same upstream stream, so their characteristics are similar. However, in the rural area, the self-purification process of deoxygenation is slower, even with sufficient oxygen availability, due to the type of organic matter present in the river. Moreover, each segment’s deoxygenation and reaeration processes are significantly different; both processes have different regulating factors and final results.
The studies conducted by Yustiani [20,21,22,23] in the tributary Citarum River reported deoxygenation rates in varying ranges during different seasons. In the Citepus River, the deoxygenation rates were found to be relatively low during the dry season, ranging from 0.06 to 0.48 per day [20]. However, during the rainy season, the deoxygenation rates in the same river increased significantly, ranging from 0.095 to 0.917 per day [21]. Similarly, in the Cikapundung River, the deoxygenation rates were generally low, ranging from 0.001 to 0.370 per day [22]. In the Cicadas River, the deoxygenation rates also remained relatively low, ranging from 0.010 to 0.170 per day [23]. Overall, the studies consistently show that the deoxygenation rates in these rivers are relatively low, regardless of the river and season.
In the past, studies on the deoxygenation of the Citarum River consistently reported low dissolved oxygen levels, indicating significant impairments in its self-purification capacity. These findings are alarming and highlight the detrimental impact of pollution and anthropogenic activities on the river’s ecological health. However, the current research on deoxygenation and reaeration in the Citarum River continues to reveal similarly low dissolved oxygen concentrations, despite efforts to address water quality issues. This recurring pattern underscores the persistent challenges faced by this critical waterway in maintaining adequate oxygen levels that are necessary for sustaining aquatic life and natural self-purification processes. These findings highlight the importance of monitoring and managing water quality to maintain sufficient oxygen levels in these aquatic ecosystems and protect the well-being of the organisms relying on them. The parallel findings of low deoxygenation and reaeration rates in recent studies raise important questions about the effectiveness of the current mitigation strategies and the need for more comprehensive measures to restore the river’s self-purification capacity. It emphasizes the urgency of integrated and targeted approaches in combating pollution sources, enhancing reaeration, and promoting ecosystem-based solutions to revitalize the Citarum River and safeguard its ecological integrity for future generations.
4.2. Correlations between Physicochemical Parameters
Finding correlations between physicochemical parameters can be a useful step in the management of surface water quality. A correlation analysis between the physicochemical parameters showed that TDS was maximally positively correlated with CD (R = 1. p < 0.05) and with TP (R = 0.99, p < 0.05). This positive correlation indicates a synergistic role between the CD and TDS parameters, which are interrelated because high conductivity is due to high concentrations of dissolved particles. The DO parameter was maximally negatively correlated with TDS (R = −0.99, p < 0.01). This negative correlation indicates that high concentrations of dissolved particles will reduce the availability of dissolved oxygen. The physicochemical parameters are interrelated, as indicated by the correlation and entanglement between them. The self-purification process operates concurrently, making it challenging to establish the impact of each parameter on the self-purification process.
4.3. Effect of Physicochemical Variables on Self-Purification
The reaeration rate in the upstream of the Citarum River is significantly influenced by physical parameters (i.e., PhysPC1 and PhysPC2) (Table 1). The rate of reaeration may be enhanced by the physical and hydrological characteristic of the river [50]. Physical water parameters (PhysPC1 and PhysPC2) such as water temperature, conductivity, transparency, TDS, and TSS strongly influence the reaeration process. The factors of temperature and transparency positively influence the reaeration rate in water bodies, and this means that temperature and transparency have synergistic effects on the reaeration rate. Meanwhile, the conductivity, TDS, and TSS factors have negative effects on the reaeration rate.
Temperature, TDS, TSS, conductivity, and transparency have different impacts on the reaeration rate. Aquatic ecosystems are sensitive to the influence of temperature [51]. One of the primary mechanisms of this influence is the increase in the gas transfer coefficient at higher temperatures [52]. The rate of atmospheric oxygen absorption at the air–water interface increases with increasing temperatures due to decreases in the viscosity, density, and surface tension [53]. Elmore and West [53] found that the reaeration rate increases geometrically with the increasing temperature. This leads to an increased transfer of oxygen from the atmosphere into the water, resulting in a higher reaeration rate. Additionally, higher temperatures can enhance the molecular diffusion of oxygen. As temperatures rise, the kinetic energy of oxygen molecules increases, resulting in accelerated rates of diffusion [54]. This facilitates the transfer of oxygen across the air–water interface, further contributing to a higher reaeration rate.
Total dissolved solid (TDS) contaminants were found in the urban area at a concentration of 424.67 mg/L. Majalaya is an urban area with settlements and industry, so much of the waste produced is dissolved in the water. The TDS value has also been correlated with conductivity. TDS and conductivity can affect reaeration rates in water bodies through increased ionic strength and a decrease in the diffusion coefficients of gases [55]. High TDS and conductivity levels result in higher concentrations of dissolved ions, making it harder for gases like oxygen to dissolve into the water [55,56]. This decreased solubility limits the reaeration process, reducing the overall reaeration rate. Additionally, certain dissolved substances associated with a high conductivity can undergo electrochemical reactions that consume dissolved oxygen, further impeding reaeration.
The land around the Cihawuk segment is a horticultural area with a high slope and no barrier between it and the river. Agricultural activities such as watering, fertilizer or pesticide application, along with rain, cause runoff from the land, which results in particles rapidly entering the water body and remaining in suspension in the water. Suspended particles (TSS) can cause water to become turbid and can decrease transparency, as was evident in the Cihawuk segment. The attenuation of light penetration limits the photosynthetic activity of aquatic plants [57,58] and can thus impact the reaeration rate; the decrease in photosynthesis leads to a lower oxygen production, which directly affects the reaeration rate [59]. Moreover, suspended solids can settle and be deposited on the riverbed, forming layers that hinder gas exchange with the atmosphere. This deposition reduces the available surface area for reaeration, further decreasing the reaeration rate.
Based on our PCR calculation, deoxygenation in the upstream of the Citarum River waters is only influenced by chemical parameters (i.e., ChemPC2). The deoxygenation process is simultaneously influenced by physical, chemical, and biological parameters. However, this study is limited to measuring the physicochemical parameters only. Therefore, of the parameters considered in this study, only the ChemPC2 factor was found to influence self-purification during the PCR process. The ChemPC2 factor significantly affects the deoxygenation process through BOD and TOM, which were found to have significant negative impacts on the deoxygenation rate in the Citarum River. High BOD and TOM concentrations are related to the presence of increased concentrations of biodegradable organic matter, which leads to increased microbial activity and, consequently, increased oxygen consumption, resulting in a higher deoxygenation rate.
In the case of the upstream of the Citarum River, the BOD and TOM concentrations have an antagonistic effect on the deoxygenation rate. It is important to consider that the specific impact of BOD and TOM on the deoxygenation rate can vary depending on factors such as the composition and quality of the organic matter, microbial activity, oxygen availability, environmental conditions, and other factors and processes in the water body. The deoxygenation rate in the Cihawuk segment is low, despite physicochemical factors such as high oxygen concentrations. This is due to the composition and quality of organic materials in this segment of the river, which cannot be easily decomposed, and is also due to environmental conditions related to the non-point diffusion of agricultural pollutants that affect the deoxygenation rate. Meanwhile, the deoxygenation rate in the Majalaya segment is relatively low because oxygen availability is quite low in that segment. The low oxygen availability is due to a high organic matter content in the industrial and domestic pollutants entering the river, which inhibits the decomposition process.
5. Conclusions
The self-purification ecosystem service plays a crucial role in regulating and improving the water quality upstream of the Citarum River. The deteriorating water quality in the upstream of the Citarum River has heightened the urgency of protecting and enhancing the self-purification ecosystem service, as it plays a pivotal role in mitigating pollution and ensuring the ecological balance of the river system. This study presents evidence that the disruption of the self-purification service in the upstream Citarum River has resulted in the suboptimal decomposition of organic matter. In addition to the disturbance caused by a high organic matter content and low decomposition capacity, the deoxygenation process in the upstream of the Citarum River is significantly influenced by chemical factors such as BOD and TOM, while physical factors including temperature, conductivity, transparency, TDS, and TSS influence the reaeration process.
The weakness of this study is that the sampling points are still limited due to the large number of river inputs, and there are no biological parameters. This study shows that the self-purification capacity upstream of the Citarum River is compromised, indicating that the ecosystem service is in a disturbed condition. This study concludes that proactive measures are needed to reduce the flow of organic pollutants into the river from residential, agricultural, and industrial sources. Efforts to restore and enhance the self-purification ecosystem service of the upstream Citarum River are vital for addressing the pressing issue of water quality and ensuring a sustainable and healthy aquatic environment for the surrounding communities.
Author Contributions
Conceptualization, D.P., D.S. and S.S.; methodology, D.P.; software, D.P.; formal analysis, D.P.; investigation, D.P.; writing—original draft preparation, D.P.; writing—review and editing, D.P., D.S., D.O. and S.S. All authors have read and agreed to the published version of the manuscript.
Funding
This research was funded by the Ministry of Education and Culture with the PMDSU program (grant no. 094/E5/PG.02.00.PT/2022).
Data Availability Statement
Data will be made available upon request.
Acknowledgments
We would like to express our gratitude to Pak Aeb for sharing valuable information from their perspective, and would like to extend our appreciation to our aquatic team members Jerry, Ismail, and Rahma for their collaboration and assistance in field techniques.
Conflicts of Interest
The authors declare no conflict of interest.
References
- Pambudi, A.S. Balancing infrastructure, ecosystem conservation, and community approaches on integrated development planning of Citarum Watershed. Indones. J. Appl. Environ. Stud. 2022, 3, 34–41. [Google Scholar] [CrossRef]
- Tampubolon, R.; Sanim, B.; Saeni, M.S.; Boer, R. Analysis of Changes in Environmental Quality of the West Java Citarum River Watershed and its Effect on Production Costs of Hydropower and PDAM (Case Study of Saguling Hydroelectric Power Plant, Cirata Hydroelectric Power Plant, Jatiluhur Hydroelectric Po. J. Tanah dan Iklim 2007, 47–62. [Google Scholar]
- Khan, I.; Lei, H.; Ali, G.; Ali, S.; Zhao, M. Public attitudes, preferences and willingness to pay for river ecosystem services. Int. J. Environ. Res. Public Health 2019, 16, 3707. [Google Scholar] [CrossRef] [PubMed]
- MEA. Ecosystem and Human Well-Being; MEA: Washington, DC, USA, 2005. [Google Scholar] [CrossRef]
- MEA. Ecosystems and Human Well-Being: A Framework for Assessment; MEA: Washington, DC, USA, 2003; Available online: https://www.millenniumassessment.org/documents/document.754.aspx.pdf (accessed on 1 October 2021).
- Puslitbang SDA. Restoration of Upper Citarum; Realizing a Healthy Citarum River for Community Welfare; ITB Press: Bandung, Indonesia, 2018; ISBN 9788578110796. [Google Scholar]
- Permatasari, P.A.; Amalo, L.F.; Pangestu, R.; Putra, M.D. Pollution Load Capacity in the Downstream Citarum Watershed: 4 years after Citarum Harum Program. J. Pengelolaan Sumberd. Alam dan Lingkung. 2022, 12, 706–719. [Google Scholar] [CrossRef]
- Herudjito, A.S. The Controlling Acceleration of Watershed Damage and Water Quality in Citarum River on The Performance IR. H. Djuanda Dam. In Proceedings of the ICOLD Symposium on Sustainable Development of Dams and River Basins, New Delhi, India, 24–27 February 2021; pp. 1–10. [Google Scholar]
- Malik Sadat Idris, A.; Sukmara Christian Permadi, A.; Insan Kamil, A.; Rahmat Wananda, B.; Riski Taufani, A. Citarum Harum Project: A Restoration Model of River Basin. J. Perenc. Pembang. Indones. J. Dev. Plan. 2019, 3, 310–324. [Google Scholar] [CrossRef]
- Chen, X.; Chen, Y.; Shimizu, T.; Niu, J.; Nakagami, K.; Qian, X.; Jia, B.; Nakajima, J.; Han, J.; Li, J. Water resources management in the urban agglomeration of the Lake Biwa region, Japan: An ecosystem services-based sustainability assessment. Sci. Total Environ. 2017, 586, 174–187. [Google Scholar] [CrossRef]
- Haryani, G.; Triyanto, T. Impact of Anthropogenic Activities on Fish Diversity in the Citarum River; Proceedings of the Scientific Meeting of the Indonesian Limnological Society; IOP Publishing: Bristol, UK, 2017. [Google Scholar]
- Zairin. Environmental Damage and Ecosystem Services. J. Georafflesia 2016, 1, 38–49. [Google Scholar]
- Kosmus, M.; Renner, I.; Ullrich, S. Integrating Services Ecosystem into Development Planning: A Step-by-Step Approach for Practitioners Based on TEEB Approach; Metzger Druck, Obrigheim/Baden: Eschborn, Germany, 2012. [Google Scholar]
- Gutierrez-Arellano, C.; Mulligan, M. A review of regulation ecosystem services and disservices from faunal populations and potential impacts of agriculturalisation on their provision, globally. Nat. Conserv. 2018, 30, 1–39. [Google Scholar] [CrossRef]
- Dunca, A.M. Water pollution and water quality assessment of major transboundary rivers from Banat (Romania). J. Chem. 2018, 2018, 9073763. [Google Scholar] [CrossRef]
- Šaulys, V.; Survil, O.; Stankevi, R. An Assessment of Self-Purification in Streams. Water 2020, 12, 87. [Google Scholar] [CrossRef]
- Ain, C.; Rudiyanti, S.; Sari, H.P. Purification Capacity and Oxygen Sag in Sringin River, Semarang. Int. J. Appl. Environ. Sci. 2019, 14, 1–16. [Google Scholar]
- Arbie, R.; Nugraha, W. Sudarsono Study of Self Purification Ability in Progo River in Terms of Organic Parameters Do and Bod (Point Source: Waste from Tofu Center in Tuksono Village, Sentolo Sub-District, Kulon Progo District, Yogyakarta Province. J. Tek. Lingkung. 2015, 4, 1–11. [Google Scholar] [CrossRef]
- González, S.O.; Almeida, C.A.; Calderón, M.; Mallea, M.A.; González, P. Assessment of the water self-purification capacity on a river affected by organic pollution: Application of chemometrics in spatial and temporal variations. Environ. Sci. Pollut. Res. 2014, 21, 10583–10593. [Google Scholar] [CrossRef] [PubMed]
- Yustiani, Y.M.; Mulyatna, L.; Pranata, F. The deoxygenation rate determination based on physical condition of river body, case study of Citepus River. AIP Conf. Proc. 2013, 1554, 281–284. [Google Scholar] [CrossRef]
- Yustiani, Y.M.; Nurkanti, M.; Tarigan, F.K.; Sudarjanto, G. Determination of Deoxygenation Rate of Urban River Using Modification Methods for Citepus River Water, Bandung, Indonesia. Indones. J. Urban Environ. Technol. 2021, 5, 1–13. [Google Scholar] [CrossRef]
- Yustiani, Y.M.; Nurkanti, M.; Suliasih, N.; Novantri, A. Influencing parameter of self purification process in The urban area of Cikapundung River, Indonesia. Int. J. Geomate 2018, 14, 50–54. [Google Scholar] [CrossRef]
- Yustiani, Y.M.; Wahyuni, S.; Kadir, A.A.A. Identification of Deoxygenation Rate Values in Densely Populated Areas (Case Study of Cicadas River, Bandung). J. Community Based Environ. Eng. Manag. 2019, 3, 9. [Google Scholar] [CrossRef]
- Carpenter, S.R.; Bennett, E.M.; Peterson, G.D. Scenarios for ecosystem services: An overview. Ecol. Soc. 2006, 11, 29. [Google Scholar] [CrossRef]
- Bherwani, H.; Nair, M.; Kapley, A.; Kumar, R. Valuation of Ecosystem Services and Environmental Damages: An Imperative Tool for Decision Making and Sustainability. Eur. J. Sustain. Dev. Res. 2020, 4, em0133. [Google Scholar] [CrossRef]
- SNI. Water and Waste Water—Section 58: Water Sampling Methods; Badan Standardisasi Nasional: Jakarta, Indonesia, 2008.
- SNI. Procedure for Measuring River Flow Discharge and Open Channels Using Current Measuring Instruments and Floats; Badan Standardisasi Nasional: Jakarta, Indonesia, 2015.
- Ghangrekar, M.M. Wastewater to Water; Springer: Singapore, 2022. [Google Scholar] [CrossRef]
- Milišić, H.; Hadžić, E.; Šuvalija, S. Modelling of Water Self-Purification in River. In International Symposium on Innovative and Interdisciplinary Applications of Advanced Technologies; Advanced Technologies, Systems, and Applications VII; Springer: Cham, Switzerland, 2022; pp. 103–121. [Google Scholar]
- Nugraha, W.D.; Sarminingsih, A.; Alfisya, B. The Study of Self Purification Capacity Based on Biological Oxygen Demand (BOD) and Dissolved Oxygen (DO) Parameters. IOP Conf. Ser. Earth Environ. Sci. 2020, 448, 012105. [Google Scholar] [CrossRef]
- APHA. Standard Methods for the Examination of Water and Wastewater, 23rd ed.; American Public Health Association: Washington DC, USA, 2017. [Google Scholar]
- Lin, S. Water Wastewater Calculation Manual, 2nd ed.; Mc Graw Hill: New York, NY, USA, 2007. [Google Scholar]
- Zhang, Y.; El Ghaoui, L. Large-scale Sparse Principal Component Analysis with application to text data. In Advances in Neural Information Processing Systems 24 (NIPS 2011), Proceedings of the 25th Annual Conference on Neural Information Processing Systems 2011, Granada, Spain, 12–15 December 2011; Morgan Kaufmann Publishers, Inc.: Burlington, MA, USA, 2021; pp. 1–8. [Google Scholar]
- Selle, B.; Schwientek, M.; Lischeid, G. Understanding Process Governig Water Quality in Catchment Using Principal Component Scores. J. Hydrol. 2013, 486, 31–38. [Google Scholar] [CrossRef]
- Government Regulation Republic Indonesia. Number 22: Implementation of Environmental Protection and Management: National Water Quality Standards; Indonesia, 2021.
- Nelson, K.L.; Murray, A. Sanitation for Unserved Populations: Technologies, Implementation Challenges, and Opportunities. Annu. Rev. Environ. Resour. 2008, 33, 119–151. [Google Scholar] [CrossRef]
- Zubaidah, T.; Karnaningroem, N.; Slamet, A. The Self-Purification Ability in the Rivers of Banjarmasin, Indonesia. J. Ecol. Eng. 2019, 20, 177–182. [Google Scholar] [CrossRef]
- Haider, H.; Ali, W.; Haydar, S. Evaluation of various relationships of reaeration rate coefficient for modelling dissolved oxygen in a river with extreame flow variation in Pakistan. Hydrol. Process 2012, 27, 3949–3963. [Google Scholar] [CrossRef]
- Peavy, H.; Rowe, D.; Tchobanoglous, G. Environmental Engineering; Mc Graw Hill: New York, NY, USA, 1985. [Google Scholar]
- Lee, A.; Nikraz, H. BOD: COD ratio as an Indicator for River Pollution. Int. Proceeding Chem. Biol. Environ. Eng. 2015, 88, 89–94. [Google Scholar]
- Barthélémy, N.; Sarremejane, R.; Datry, T. Aquatic organic matter decomposition in the terrestrial environments of an intermittent headwater stream. Aquat. Sci. 2022, 84, 45. [Google Scholar] [CrossRef]
- Zogorski, J.S.; Faust, S.D. Atmospheric Reaeration Capacity of Streams Part I Critical Review of Methods Available to Measure and To Calculate the Atmospheric Reaeration Rate Constant. Environ. Lett. 1973, 4, 35–59. [Google Scholar] [CrossRef]
- Manahan, S. Environmental Chemistry, 6th ed.; Lewis Publisher CRC Press: London, UK, 1994. [Google Scholar]
- Daims, H.; Lebedeva, E.V.; Pjevac, P.; Han, P.; Herbold, C.; Albertsen, M.; Jehmlich, N.; Palatinszky, M.; Vierheilig, J.; Bulaev, A.; et al. Complete nitrification by Nitrospira bacteria. Nature 2015, 528, 504–509. [Google Scholar] [CrossRef]
- Yang, L.; Ren, Y.X.; Zhao, S.Q.; Liang, X.; Wang, J. ping Isolation and characterization of three heterotrophic nitrifying-aerobic denitrifying bacteria from a sequencing batch reactor. Ann. Microbiol. 2016, 66, 737–747. [Google Scholar] [CrossRef]
- Lorke, A.; Peeters, F. Toward a unified scaling relation for interfacial fluxes. J. Phys. Oceanogr. 2006, 36, 955–961. [Google Scholar] [CrossRef]
- Zappa, C.J.; McGillis, W.R.; Raymond, P.A.; Edson, J.B.; Hintsa, E.J.; Zemmelink, H.J.; Dacey, J.W.H.; Ho, D.T. Environmental turbulent mixing controls on air-water gas exchange in marine and aquatic systems. Geophys. Res. Lett. 2007, 34, 1–6. [Google Scholar] [CrossRef]
- Alin, S.R.; Rasera, M.D.F.F.L.; Salimon, C.I.; Richey, J.E.; Holtgrieve, G.W.; Krusche, A.V.; Snidvongs, A. Physical controls on carbon dioxide transfer velocity and flux in low-gradient river systems and implications for regional carbon budgets. J. Geophys. Res. Biogeosci. 2011, 116. [Google Scholar] [CrossRef]
- Rouf, M.A.; Islam, M.J.; Roknuzzaman, M.; Siddique, M.N.; Golder, M.R. Vertical profile of dissolved oxygen and associated water variables in the Pasur-Rupsha estuary of Bangladesh. Heliyon 2022, 8, e10935. [Google Scholar] [CrossRef] [PubMed]
- Ugbebor, J.N.; Agunwamba, J.C.; Amah, V.E. Determination of Reaeration Coefficient K 2 for Polluted Stream As a Function of Depth, Hydraulic Radius, Temperature and Velocity. Niger. J. Technol. 2012, 31, 174–180. [Google Scholar]
- Yvon-Durocher, G.; Caffrey, J.M.; Cescatti, A.; Dossena, M.; Del Giorgio, P.; Gasol, J.M.; Montoya, J.M.; Pumpanen, J.; Staehr, P.A.; Trimmer, M.; et al. Reconciling the temperature dependence of respiration across timescales and ecosystem types. Nature 2012, 487, 472–476. [Google Scholar] [CrossRef]
- Becker, A.; Kirchesch, V.; Baumert, H.; Fischer, H.; Schol, A. Modelling the Effect of Thermal Stratification on the Oxygen Budget of An Impounded River. River Res. Appl. 2010, 26, 572–588. [Google Scholar] [CrossRef]
- Elmore, H.; West, W. Effect of Water Temperature on Stream Reaeration. J. Sanit. Eng. Div. 1961, 87, 59–71. [Google Scholar]
- Demars, B.O.L.; Manson, J.R. Temperature dependence of stream aeration coefficients and the effect of water turbulence: A critical review. Water Res. 2013, 47, 1–15. [Google Scholar] [CrossRef]
- Rusydi, A.F. Correlation between conductivity and total dissolved solid in various type of water: A review. IOP Conf. Ser. Earth Environ. Sci. 2018, 118, 012019. [Google Scholar] [CrossRef]
- Schladow, S.G.; Lee, M.; Hürzeler, B.E.; Kelly, P.B. Oxygen transfer across the air-water interface by natural convection in lakes. Limnol. Oceanogr. 2002, 47, 1394–1404. [Google Scholar] [CrossRef]
- Johnson, K.S.; Fang, Y.; Chang, T. Effects of season and waterbody on transparency tube estimates of suspended sediment in large rivers. J. Appl. Sci. Environ. Manag. 2018, 22, 1585. [Google Scholar] [CrossRef]
- Nurdin, J.; Safitri, V.; Nofrita, Z.A.N. Phytoplankton chlorophyll-a content and its relationship with water quality in the Gulf of Kabung and small islands, Padang City, Indonesia. AACL Bioflux 2023, 16, 579–590. [Google Scholar]
- Padilla-Mendoza, C.; Torres-Bejarano, F.; Campo-Daza, G.; González-Márquez, L.C. Potential of Sentinel Images to Evaluate Physicochemical Parameters Concentrations in Water Bodies—Application in a Wetlands System in Northern Colombia. Water 2023, 15, 789. [Google Scholar] [CrossRef]
Figure 1.
Map of research in upstream of Citarum River.

Figure 2.
Comparison of DO loss value between the Cihawuk and Majalaya segments of the Citarum River.
Figure 2.
Comparison of DO loss value between the Cihawuk and Majalaya segments of the Citarum River.

Figure 3.
(a,b) Boxplots and t-tests for deoxygenation and reaeration rates; (c) ultimate BOD upstream of the Citarum River.
Figure 3.
(a,b) Boxplots and t-tests for deoxygenation and reaeration rates; (c) ultimate BOD upstream of the Citarum River.


Table 1.
Physicochemical properties upstream of the Citarum River.
| Parameters | Units | Cihawuk | Majalaya | IQS | ||
|---|---|---|---|---|---|---|
| Range | Mean | Range | Mean | Class 2 | ||
| Physical | ||||||
| T | °C | 20.00–23.00 | 21.75 ± 1.26 | 25.00–27.00 | 26.25 ± 0.96 | AT ± 3 |
| CD | µmhos/cm | 186.05–204.00 | 192.41 ± 8.26 | 888.00–966.00 | 917.00 ± 37.43 | |
| TP | m | 0.06–0.09 | 0.08 ± 0.02 | 0.31–0.33 | 0.32 ± 0.01 | |
| TDS | mg/L | 83.30–85.30 | 84.37 ± 1.00 | 414.00–439.00 | 424.67 ± 12.90 | 1000 |
| TSS | mg/L | 102.67–417.20 | 253.29 ± 157.69 | 15.20–42.67 | 26.18 ± 14.54 | 50 |
| Chemical | ||||||
| pH | pH units | 7.76–8.06 | 7.91 ± 0.16 | 7.27–7.29 | 7.28 ± 0.01 | 6–9 |
| DO | mg/L | 5.70 | 5.70 ± 0.00 | 1.10–1.60 | 1.33 ± 0.22 | 4 |
| BOD | mg/L | 40.00–48.10 | 43.03 ± 3.87 | 42.00–50.10 | 46.08 ± 3.69 | 3 |
| COD | mg/L | 31.36–62.72 | 52.27 ± 18.10 | 23.52–39.20 | 28.75 ± 9.05 | 25 |
| TOM | mg/L | 13.76–14.60 | 13.94 ± 0.59 | 21.96–29.31 | 24.41 ± 4.24 | |
Notes: Abbreviations are defined as follows: T = temperature; CD = conductivity; TP = transparency; TDS = total dissolved solid; TSS = total suspended solid; DO = dissolved oxygen; BOD = biological oxygen demand; COD = chemical oxygen demand; TOM = total organic matter.
Table 2.
Hydrogeometry of the Citarum River.
| River Station | Width (m) | Depth (m) | Velocity (m/s) | Discharge (m3/s) |
|---|---|---|---|---|
| C1 | 2.90 | 0.58 | 0.56 | 1.11 |
| C2 | 4.50 | 0.69 | 0.70 | 0.97 |
| C3 | 3.80 | 0.40 | 0.67 | 0.96 |
| C4 | 5.30 | 0.33 | 0.54 | 0.97 |
| M1 | 17.50 | 0.40 | 0.43 | 3.41 |
| M2 | 17.50 | 0.42 | 0.48 | 3.41 |
| M3 | 13.80 | 0.46 | 0.53 | 3.42 |
| M4 | 17.50 | 0.40 | 0.48 | 3.42 |
Table 3.
Correlation matrix between physicochemical properties of water in the Citarum River. Significance level: * p < 0.05; ** p < 0.01.
Table 3.
Correlation matrix between physicochemical properties of water in the Citarum River. Significance level: * p < 0.05; ** p < 0.01.
| Correlation | T | CD | TP | TDS | TSS | pH | BOD | DO | COD | TOM |
|---|---|---|---|---|---|---|---|---|---|---|
| T | 1 | |||||||||
| CD | 0.88 * | 1 | ||||||||
| TP | 0.87 * | 0.99 * | 1 | |||||||
| TDS | 0.89 * | 1.00 * | 0.99 * | 1 | ||||||
| TSS | −0.85 * | −0.78 | −0.78 * | −0.78 * | 1 | |||||
| pH | −0.94 ** | −0.96 ** | −0.95 ** | −0.96 ** | 0.78 | 1 | ||||
| BOD | 0.58 | 0.49 | 0.44 | 0.49 | −0.40 | −0.63 | 1 | |||
| DO | −0.91 * | −0.99 ** | −0.99 ** | −0.99 ** | 0.77 | 0.96 * | −0.48 | 1 | ||
| COD | −0.75 | −0.70 | −0.72 | −0.69 | 0.87 * | 0.62 | −0.12 | 0.73 | 1 | |
| TOM | 0.75 | 0.93 ** | 0.91 * | 0.9 2 * | −0.89 * | −0.89 * | 0.89 * | −0.88 * | −0.98 | 1 |
Notes: Abbreviations are defined as follows: T = temperature; CD = conductivity; TP = transparency; TDS = total dissolved solid; TSS = total suspended solid; DO = dissolved oxygen; BOD = biological oxygen demand; COD = chemical oxygen demand; TOM = total organic matter.
Table 4.
Principle component analysis (PCA) of physical parameters.
| Physical Parameter | PC1 (90.8%) | PC2 (6.8%) |
|---|---|---|
| T | 0.643 | 0.706 |
| CD | 0.885 | 0.462 |
| TP | 0.890 | 0.449 |
| TDS | 0.887 | 0.460 |
| TSS | −0.407 | −0.899 |
Notes: Abbreviations are defined as follows: T = temperature; CD = conductivity; TP = transparency; TDS = total dissolved solid; TSS = total suspended solid. The numbers in bold type indicate the values of influence for the PC1 and PC2 axes, respectively.
Table 5.
Principle component analysis (PCA) of chemical parameters.
| Chemical Parameter | PC1 (72.9%) | PC2 (20.6%) |
|---|---|---|
| pH | 0.705 | 0.705 |
| BOD | 0.013 | 0.013 |
| DO | 0.823 | 0.823 |
| COD | 0.960 | 0.960 |
| TOM | −0.595 | −0.595 |
Notes: Abbreviations are defined as follows: DO = dissolved oxygen; BOD = biological oxygen demand; COD = chemical oxygen demand; TOM = total organic matter. The numbers in bold type indicate the values of influence for the PC1 and PC2 axes, respectively.
Table 6.
Beta coefficient of physicochemical parameters and the self-purification process in the Citarum River based on linear regression relationships. Significance level: ns, p > 0.1; # p < 0.1; ** p < 0.01.
Table 6.
Beta coefficient of physicochemical parameters and the self-purification process in the Citarum River based on linear regression relationships. Significance level: ns, p > 0.1; # p < 0.1; ** p < 0.01.
| Variable | Self-Purification | |||
|---|---|---|---|---|
| Deoxygenation | Reaeration | |||
| SE | SE | |||
| PhysPC1 | 0.163 ns | 0.064 | −0.050 ** | 0.008 |
| PhysPC2 | 0.120 ns | 0.050 | 0.045 ** | 0.008 |
| ChemPC1 | 0.169 ns | 0.068 | 0.001 ns | 0.038 |
| ChemPC2 | −0.093 # | 0.044 | −0.021 ns | 0.038 |
Disclaimer/Publisher’s Note: The statements, opinions and data contained in all publications are solely those of the individual author(s) and contributor(s) and not of MDPI and/or the editor(s). MDPI and/or the editor(s) disclaim responsibility for any injury to people or property resulting from any ideas, methods, instructions or products referred to in the content. |
© 2023 by the authors. Licensee MDPI, Basel, Switzerland. This article is an open access article distributed under the terms and conditions of the Creative Commons Attribution (CC BY) license (https://creativecommons.org/licenses/by/4.0/).
Share and Cite
MDPI and ACS Style
Pratiwi, D.; Sumiarsa, D.; Oktavia, D.; Sunardi, S. Water Quality Influences Self-Purification in the Cihawuk and Majalaya Segments Upstream of the Citarum River, West Java, Indonesia. Water 2023, 15, 2998. https://doi.org/10.3390/w15162998
AMA Style
Pratiwi D, Sumiarsa D, Oktavia D, Sunardi S. Water Quality Influences Self-Purification in the Cihawuk and Majalaya Segments Upstream of the Citarum River, West Java, Indonesia. Water. 2023; 15(16):2998. https://doi.org/10.3390/w15162998
Chicago/Turabian StylePratiwi, Desty, Dadan Sumiarsa, Dina Oktavia, and Sunardi Sunardi. 2023. "Water Quality Influences Self-Purification in the Cihawuk and Majalaya Segments Upstream of the Citarum River, West Java, Indonesia" Water 15, no. 16: 2998. https://doi.org/10.3390/w15162998
Note that from the first issue of 2016, this journal uses article numbers instead of page numbers. See further details here.