
Harbour Hydro-Morphodynamics and Freshwater Discharges: The La Spezia Arsenale Case

Department of Civil Engineering and Architecture (DICEA), Università Politecnica delle Marche (UNIVPM), 60131 Ancona, Italy
*
Author to whom correspondence should be addressed.
Water 2023, 15(16), 2865; https://doi.org/10.3390/w15162865
Submission received: 21 June 2023
/
Revised: 3 August 2023
/
Accepted: 4 August 2023
/
Published: 8 August 2023
(This article belongs to the Topic Aquatic Environment Research for Sustainable Development)
Abstract
:The hydrodynamics and sediment transport at the microtidal harbour of La Spezia Arsenale (Liguria, Italy) were studied through a numerical approach, with the objective of providing useful information for: (1) the understanding of the hydro-morphodynamics of microtidal harbour settings and (2) the operation management and planning for the Arsenale, the pivotal harbour for the Italian Navy. Three different scenarios were used to parametrically gain knowledge on the role of extreme (100-year return period) meteomarine forcing. FUNWAVE and Delft3D were used to simulate, respectively, the wave propagation from the open sea toward the Arsenale and the influence of two freshwater streams on the basin circulation. The first scenario was aimed at understanding the effect of wind waves and swell on the basin dynamics; the second scenario was set up to inspect the role of the rivers’ discharges on the Arsenale hydro-morphodynamics; the third scenario combined all of the above forcings. All the simulations also included the tidal forcing and were run under two different wind directions. We found that the hydrodynamics inside the Arsenale were mainly influenced by the tide and the wind; the former caused the water to enter/exit the basin during the flood/ebb phases, respectively, and the latter influenced the circulation cell, whose sense of rotation depended on the wind direction. In addition, the discharge of the Lagora stream, debouching into the sea close to the Arsenale entrance, partially entered the basin and created an eddy whenever its direction was opposite to that of the wind-forced circulation cell, while the Caporacca stream, flowing directly into the Arsenale, mainly fed the dominant circulation without altering it. On the other hand, the morphodynamics were strongly affected by the rivers’ discharges, which were solely responsible for the supply of sediment to the basin. Also, the major influence on the sediment transport was exerted by the rivers and the wind forcing. Small sedimentation rates were observed in the Arsenale close to the rivers’ mouths, particularly after the occurrence of the rivers’ discharges, while no siltation due to waves took place. This study evaluated for the first time the influence of freshwater streams flowing nearby/into the Arsenale, representative of semi-enclosed microtidal ports located in the vicinity of rivers. It was found that the contribution of the rivers to the hydro-morphodynamics of the Arsenale cannot be neglected; indeed, it represents one of the main forcings of the harbour dynamics and should, therefore, be considered from a management viewpoint.
1. Introduction
The management and maintenance of harbour facilities are largely influenced by sedimentation processes, for which detailed knowledge is essential [1]. In particular, sediment erosion/deposition can influence the depth of both navigation channels and harbour entrances [2]. The filling of a harbour entrance due to fine sediment is usually referred to as harbour siltation, a problem that predominantly affects the fundamental function of the facility, which is to create a sheltered environment [2]. In fact, sediment resuspended from the bed by the action of waves and currents can be transported into the harbours, where the transport capacity rapidly reduces due to a decrease in wave height; this causes local deposition and siltation.
The siltation is mainly due to net sediment transport through the entrance and into the harbour. Hence, many studies were conducted to investigate all the possible processes which can induce the water exchange between the harbour and the open sea.
In accordance with the literature [2,3], the mechanisms through which the fluid can enter and leave a basin are essentially generated by: (1) horizontal entrainment; (2) tidal filling and emptying; and (3) density currents; these are better described in the following paragraphs.
The horizontal entrainment is the main mechanism that occurs in harbours placed along water streams, like rivers and channels. It is caused by the horizontal shear between the river flow and the basin. The river flow separates at the upstream corner of the basin, generating an eddy between the harbour basin and the river itself. The strength of the turbulence is governed by the geometry of the upstream corner and the stagnation behaviour at the downstream corner. The amount of exchanged water depends on the river velocity, the cross-sectional area of the harbour entrance, and the angle between the river and the harbour entrance [4,5].
As far as the tidal filling and emptying is concerned, the water exchange flow rate caused by the tidal action is such that the water can be effectively advected into the basin entrance at rising tide (tidal filling) and advected outside the basin at falling tide, leading to tidal emptying. In tide-dominated environments, these mechanisms also trigger the intake and removal of sediment [6].
Regarding the third mechanism, density currents can be generated by either salinity or temperature gradients and can cause significant flow exchange. Furthermore, Winterwerp stated that strong density currents can also be induced by low suspended sediment concentration. Such currents increase the sediment fluxes into the harbours and significantly augment the trapping efficiency within them.
In addition to the above-mentioned mechanisms, other authors (e.g., [7,8]) noted that in particular configurations, like microtidal shallow basins, the interaction of tidal currents with the wind- and wave-induced currents could make an important contribution to erosion processes. Obviously, all these mechanisms can act simultaneously or one of them can dominate the others, depending on the forcings and the environments in which the basins are placed.
In this regard, a valuable classification of the different water exchange mechanisms that can occur in harbours was provided by Winterwerp [3]. With reference to the processes, Winterwerp identified those that could take place in stagnant water and riverine, tidal, and estuarine systems. This distinction is useful for a preliminary prediction of the main processes responsible for the water exchanges in a specific location.
More detailed investigations of the flow patterns generated by such mechanisms, which evolve both inside and outside of the harbours, can be conducted by means of both laboratory (scaled-down) and numerical models.
Laboratory tests are more appropriate when analysing the turbulence at the entrance of a basin, while numerical modelling (e.g., MIKE21, Delft3D) has been extensively used in recent years for the investigation of hydro-morphodynamical processes, thanks to the reasonable computational time and effort required for studying wide and complex areas under multiple scenarios. Many numerical models considering port areas and sedimentation issues have been developed, due to the relevance of such infrastructures in the trading system and the costs associated with their maintenance through dredging operations. Some interesting examples of peculiar sites are reported here. The numerical modelling for the Marine Wharf in the Saint John Harbour, proposed by Leys [9], is characterized by a very large tidal range and strong river discharge. Also, the study conducted by Carniello et al. [6] examined the morphodynamics induced by the combined action of the tidal currents and wind waves in the shallow microtidal basin of the Venice Lagoon. An interesting numerical modelling set up by means of Delft3D was presented by Lojek et al. [10]; it provided a useful study of the design of a harbour, showing the impacts of some modifications in the layout of the harbour itself on the sedimentation rates. A study performed with the MIKE package on the Nowshahr port in the Caspian Sea [11] confirmed the capabilities of numerical modelling in capturing the hydro-morphodynamic mechanisms; the study identified the fact that wind-induced circulation was responsible for the carrying of sediments at the port entrance.
The present study, which was prompted by the needs of the Italian Navy, was motivated by the wish to understand whether the sediment transport evolving at the inlets and inside the semi-enclosed La Spezia Arsenale military basin in La Spezia (Italy) could lead to harbour siltation and to determine what measures might be implemented to control this phenomenon and mitigate its impacts. In particular, we evaluated, through the parametric analysis of three scenarios, all the potential hydrodynamic forcings of sediment transport, seabed erosion, and sedimentation developing within the Arsenale. Much attention was given to the understanding of the hydrodynamic circulation typical of semi-enclosed basins, with the wind mainly governing the flow. The focus was on the specific hydrodynamic and sedimentological role played by two freshwater streams around the harbour: the Lagora, which binds the basin on its eastern side, and the Caporacca, which directly debouches into the basin on its western side. The results, which are specific to a microtidal setting, are discussed by comparing/contrasting them with the findings obtained for micro- and meso-macrotidal harbour environments. Our analysis relies on the extensive use of the Delft3D numerical modelling suite, which, beyond being employed for certified modelling activities of coastal processes, also has a long tradition of use for harbour sedimentation issues, for which it has been extensively validated, thus confirming its reliability in such applications (a.o., [12,13]).
The paper is structured as follows: details of the field site, the available data, and the modelling approach are given in Section 2. The results of the numerical investigation are then provided in Section 3 for the three scenarios of interest and are further discussed in Section 4. Finally, the conclusions are presented in Section 5.
2. Materials and Methods
2.1. Field Site
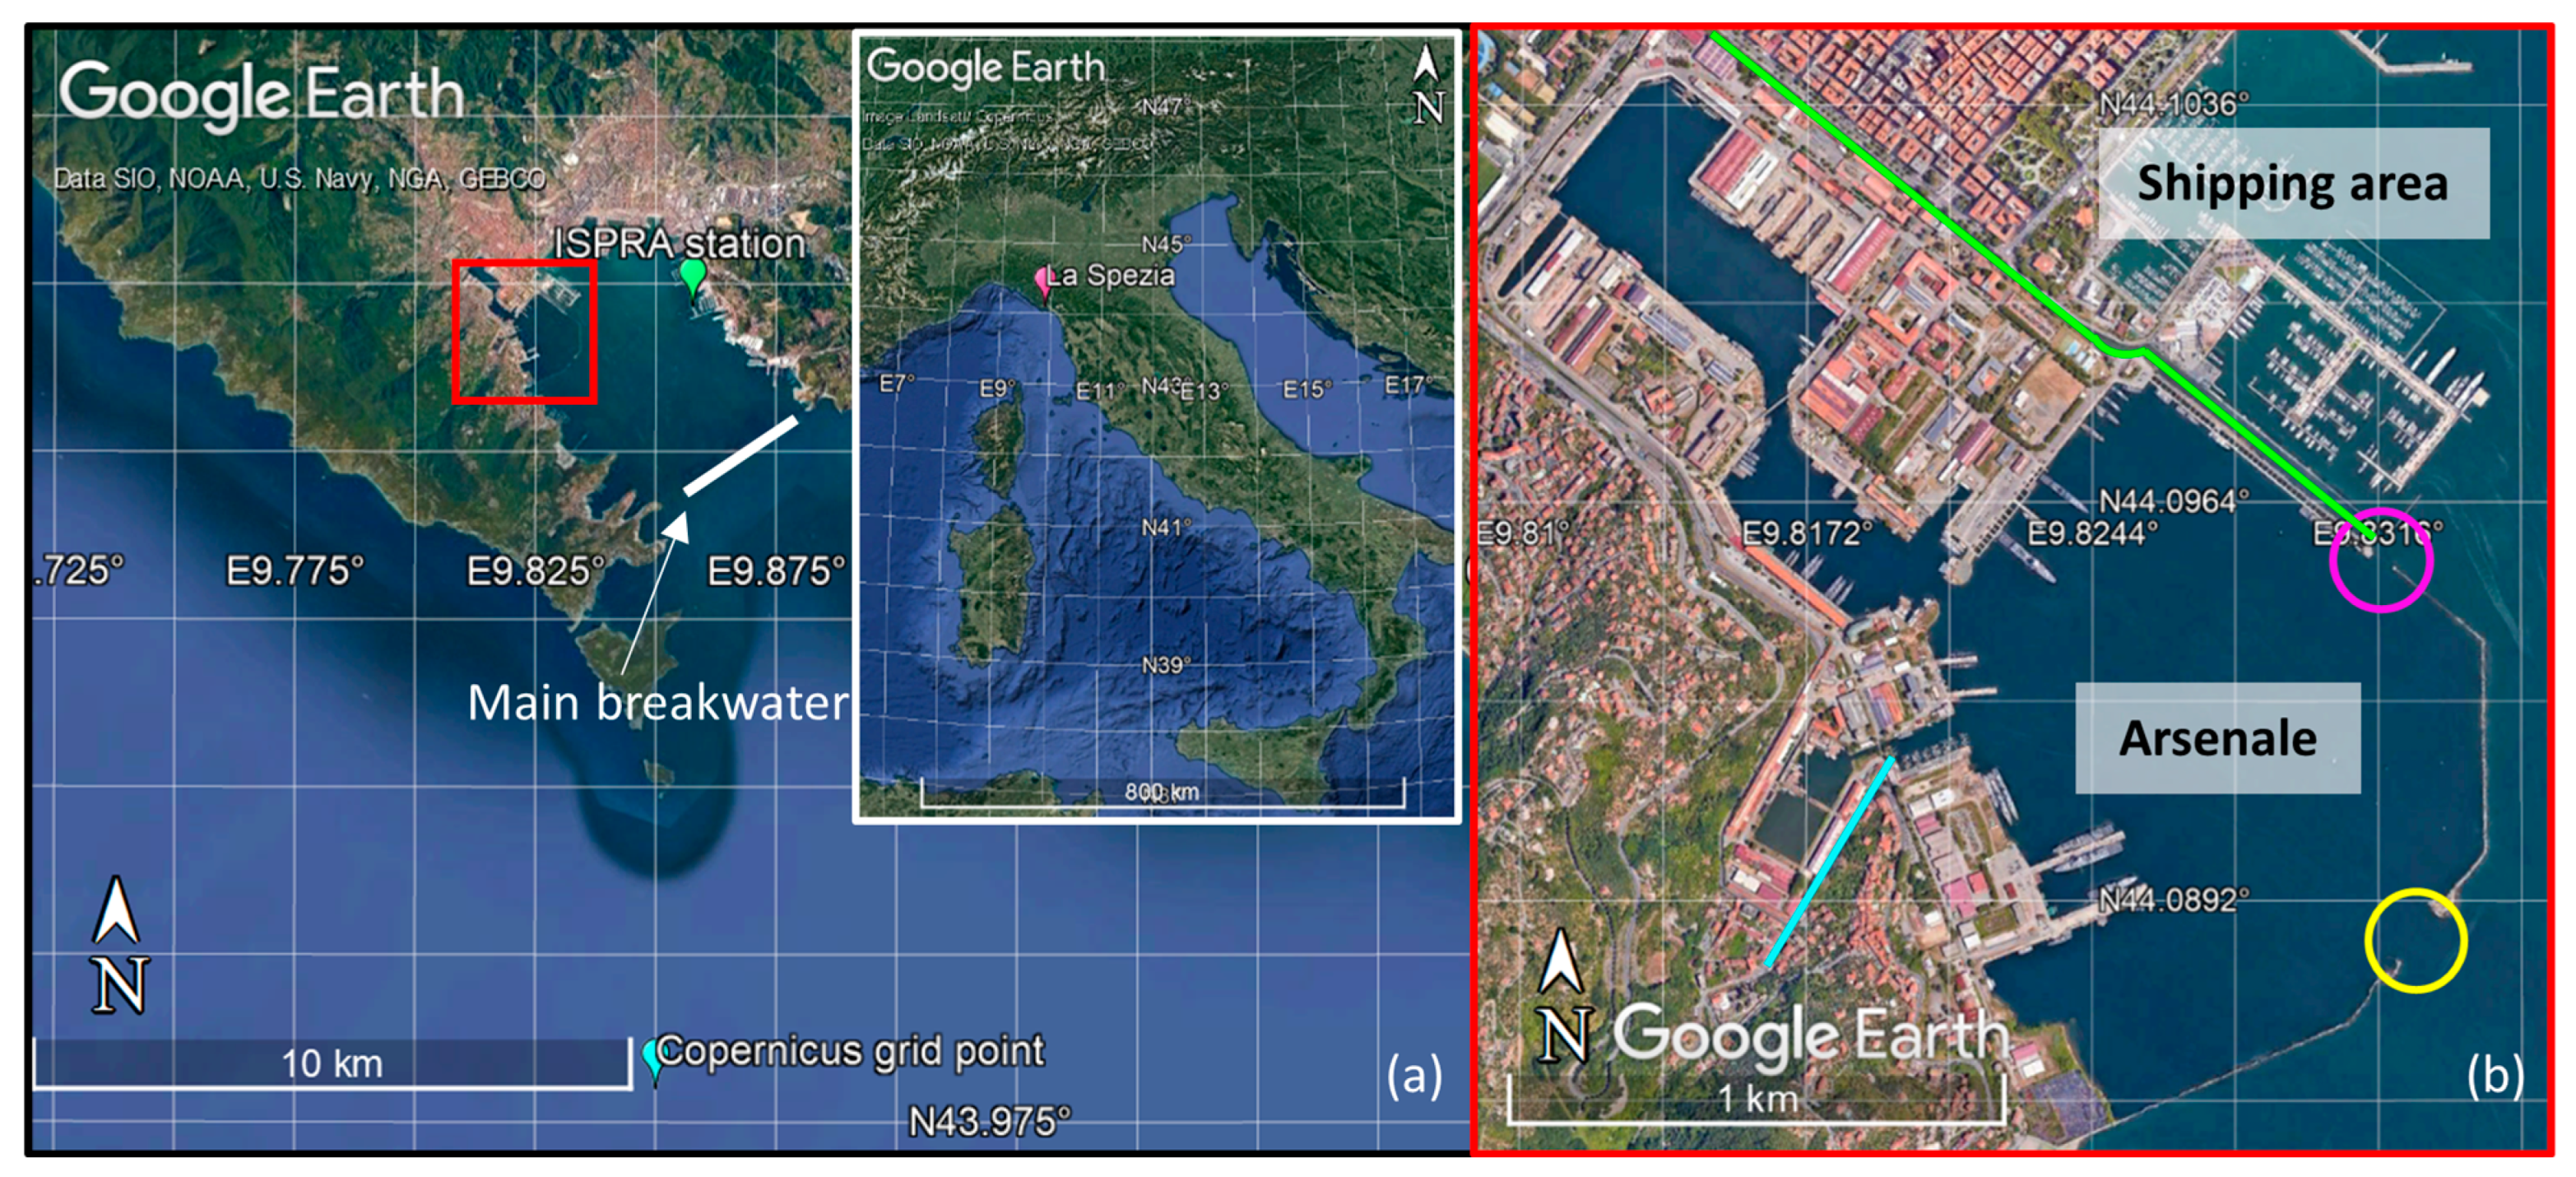
The La Spezia harbour (see Figure 1a), located in the gulf of the same name within the Ligurian Sea, is one of the most important ports in northern Italy. Sheltered by a very large, main breakwater, it hosts a shipping area and the “Arsenale” military harbour of the Italian Navy in the northwest and northeast regions of the harbour, respectively.
The Arsenale covers an area of 2 km2, extending 1.5 km in the northern direction and 1.2 km in the eastern direction. It is delimited by breakwaters and connected to the rest of the gulf through two entrances. The southern main entrance (yellow circle in Figure 1b) is characterized by a water depth of about 12 m and a width of around 120 m, and it is reserved for military vessels. The northeastern mouth (magenta circle in Figure 1b), which is about 60 m wide and 6 m deep, connects the Arsenale to the shipping area. Here, the passing by of ships is not allowed. The average water depth inside the Arsenale is about 12 m.
The La Spezia gulf is located in a microtidal environment, characterized by tidal ranges smaller than 1 m in winter and even lower ranges, about 0.30–0.40 m, in summer and spring (https://www.mareografico.it, accessed on 15 May 2023).
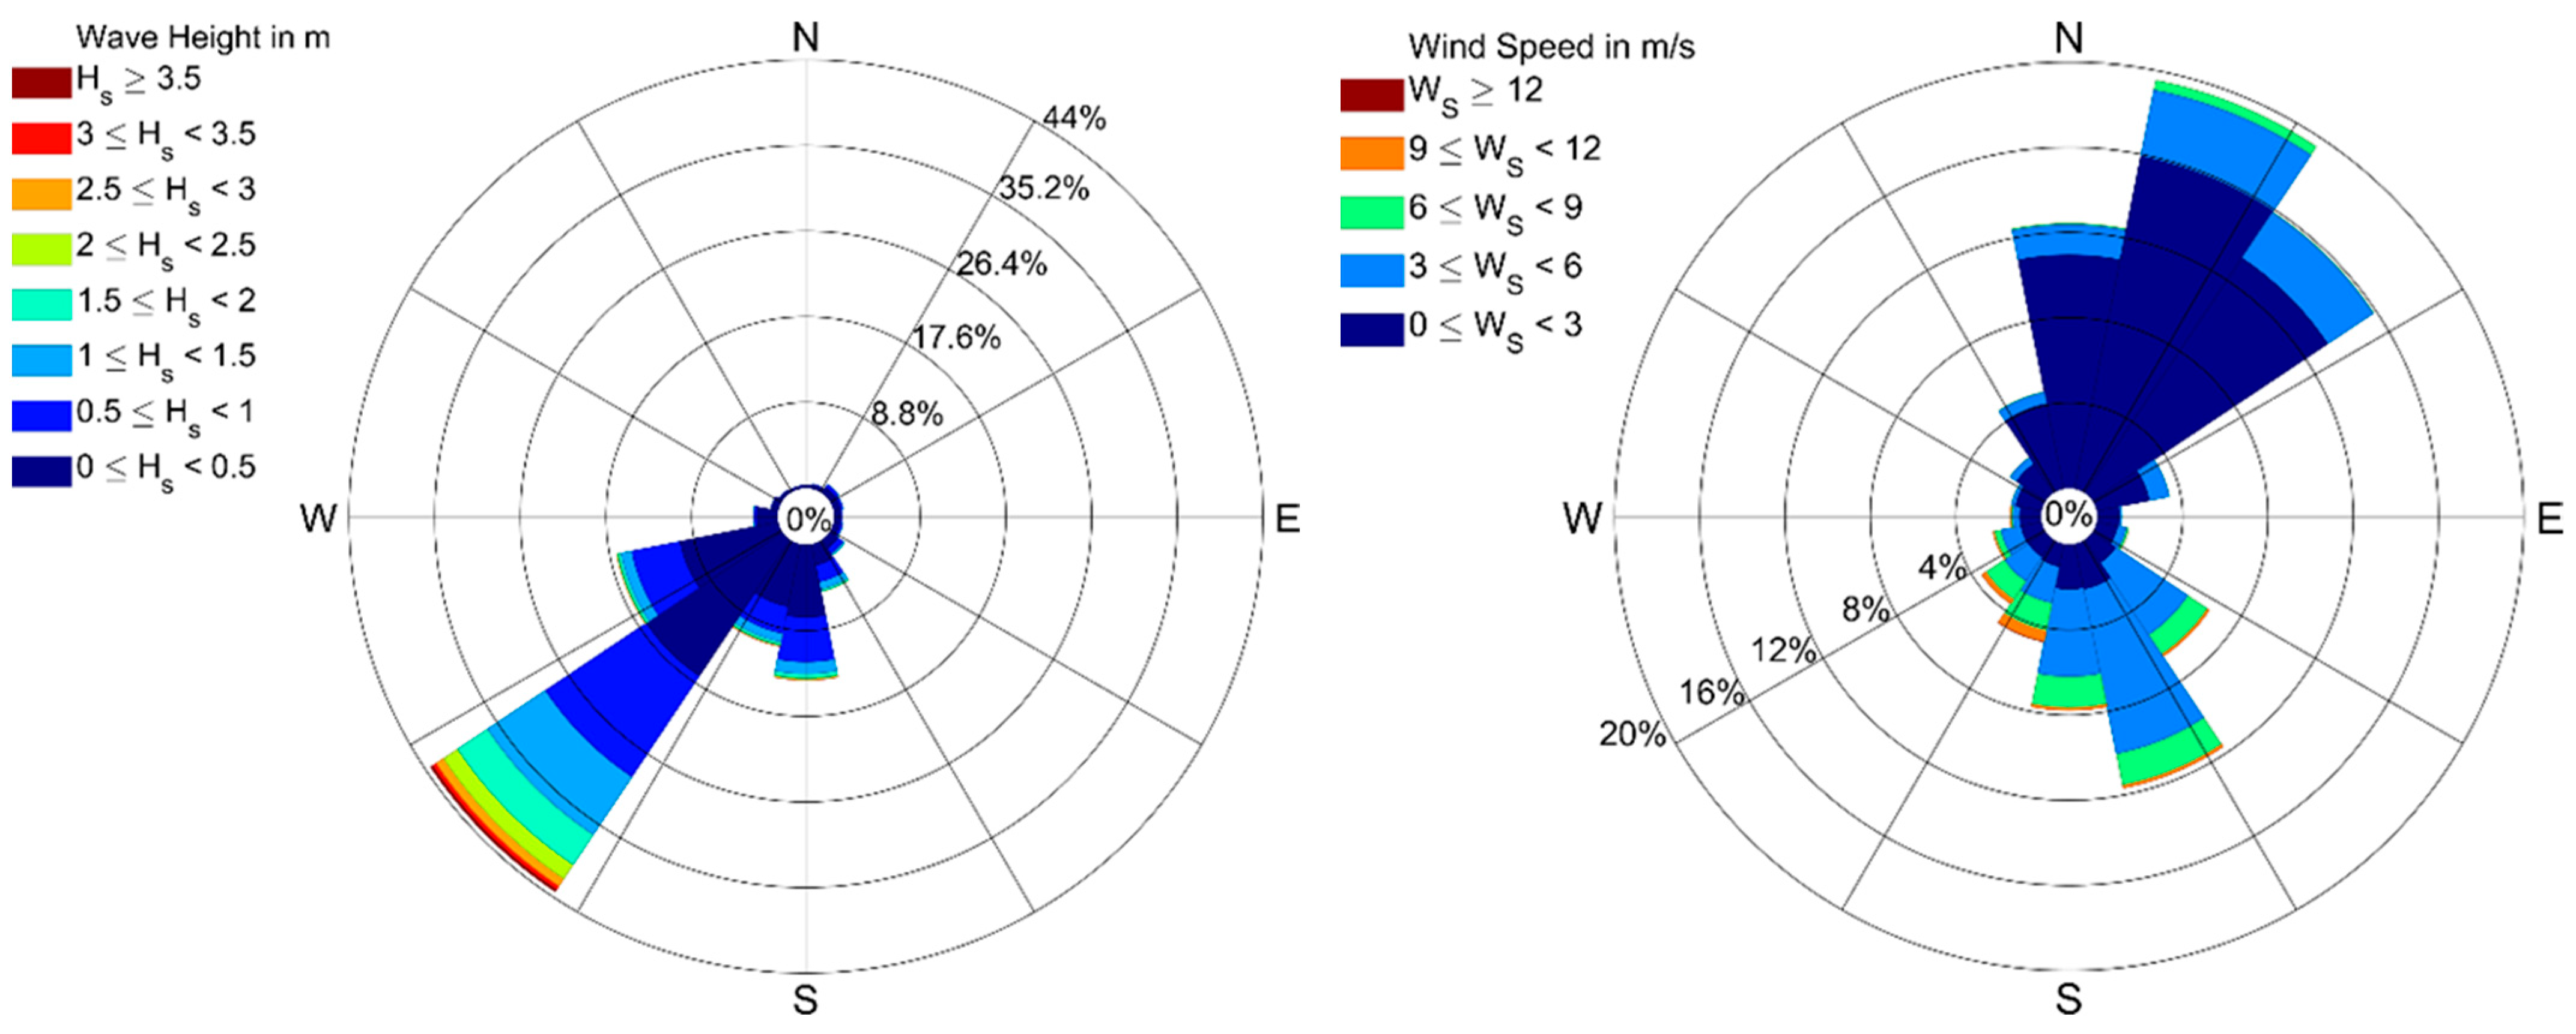
Figure 2 shows the wave and wind roses for the study site for last year (2022). The prevailing wind, i.e., the most frequent one, is from the NNE, while the dominant wind, which is the one with the highest speed, comes from the SSE. The yearly and directional average wind velocity is 3.02 m/s. The wave climate over the gulf is characterized by waves from the SW, forced by the Libeccio wind, which is prevailing and dominant. The mean annual significant height is 0.68 m, while the mean annual peak period is 6.2 s.
In situ samplings showed that the bed stratigraphy in the La Spezia area is predominantly composed of silt and sand [14]. Inside the basin, the sediment mixture consists mainly of cohesive material, mainly silt and clay (about 42% and 28%, respectively), with a lower amount of sand (nearly 30%).
The harbour is characterized by the presence of two main freshwater streams, the Lagora and the Caporacca (hereinafter, LR and CR, respectively). The hydrographic basin areas are, respectively, 17 km2 for the LR and 2.95 km2 for the CR. The last stretch of the LR (green line in Figure 1b) flows between the Arsenale and the shipping area before debouching into the sea in the area of the northeastern mouth. Here, the LR width and the depth are, respectively, around 35 m and 8 m. The CR is buried in its final reach, which is around 12 m wide and around 3.5 m deep, and flows directly into the Arsenale (cyan line in Figure 1b).
The water discharges associated with the return periods of 50, 200, and 500 years are, respectively, 171.02 m3/s, 247.41 m3/s, and 297.98 m3/s for the LR, while they are 52.78 m3/s, 76.36 m3/s, and 91.88 m3/s for the CR [15]. The sediment concentrations were computed from the annual average sediment load and the annual average water discharge. The annual average sediment loads are equal to 4022 kg yr−1 and 1200 kg yr−1, respectively, for the LR and CR, while the annual average water discharges are 0.2476 m3/s for the LR and 0.038 m3/s for the CR [15].
2.2. Data Collection
For the purposes of this study, an “extreme value” analysis was conducted to define the wave and wind parameters associated with a 100-year return period.
The wave data, i.e., significant wave height, peak period, and direction, covering a 26-year-long period from 1993 to 2019, were provided by the multiyear wave product of the Mediterranean Sea Waves forecasting system [16], downloadable from the Copernicus Marine Service. The dataset spatial and temporal resolutions are, respectively, 1/24° and 1 h. We extracted data for the location at the coordinates 43.98° N, 9.85° E, as shown in Figure 1a.
Both the seawater level and the wind speed and direction, with a temporal resolution of 10 min, were derived from the ISPRA station of La Spezia, managed by the Rete Mareografica Nazionale (https://www.mareografico.it, accessed on 15 May 2023), whose location is shown in Figure 1a.
The data related to the bed stratigraphy were obtained from a geognostic campaign, commissioned by the “Direzione del Genio Militare per la Marina di La Spezia” [14] and the studies of the Molo Ravano by DHI Italia [17]. As reported above, the sediment load data and the CR and LR flood discharges, associated with different return periods, were derived from the analyses by Hydrodata [15], while the annual average water discharges were downloaded from the online geoportal of Liguria Region (https://geoportal.regione.liguria.it/catalogo/mappe.html, accessed on 15 May 2023).
2.3. Numerical Simulations
Several numerical simulations, which provided the support for a scenario-based parametric analysis, were run to properly define the forcing affecting the hydrodynamic and the sediment transport inside the Arsenale when stressed with extreme conditions. First, the offshore wave propagation (Copernicus point in Figure 1a) toward the military harbour was computed using the widely used wave-resolving, Boussinesq-type model FUNWAVE [18] to appropriately model the interactions of the waves with obstacles, i.e., the main breakwater (see Figure 1a).
The results obtained from FUNWAVE, in terms of water level and velocity time series, were used as one of the forcings of a more refined Delft3D simulation. Delft3D was chosen because, unlike FUNWAVE, it is flexible enough to allow for the inclusion of a number of point sources, used here to describe riverine inputs (e.g., the LR and CR freshwater discharges). Tide and wind were also accounted for among the forcing actions, and three different scenarios were simulated to understand the role of the waves (W), tide (T), rivers’ discharges (R), and winds on the hydrodynamics and sediment transport inside the Arsenale.
2.3.1. Wave Propagation
An “extreme value” analysis was conducted, using the Copernicus data, to define the 100-year return period wave characteristics (wave height, period, and direction), to force the FUNWAVE model, and to observe the wave propagation within the La Spezia gulf.
Wave propagation was performed to the best standards, i.e., by preferring the use of a wave-resolving model to wave-averaging approaches; the former provides, by construction, better performances than the latter in relation to those processes that characterize the evolution of the wave field over a complex topography.
In particular, the Boussinesq-type FUNWAVE model was chosen because of its good handling of wave–wave interactions, refraction, diffraction, wave–structure interaction, and wave breaking. Diffraction and reflection, which are usually poorly resolved by wave-averaging models, become particularly important when approaching coastal structures and harbour basins. The use of FUNWAVE for the wave propagation is also supported by the values of the frequency dispersion parameter kh, which vary from 0.66 (offshore region of the domain) to 0.76 (Arsenale area), i.e., the standard range of applicability of Boussinesq-type models (e.g., [19]).
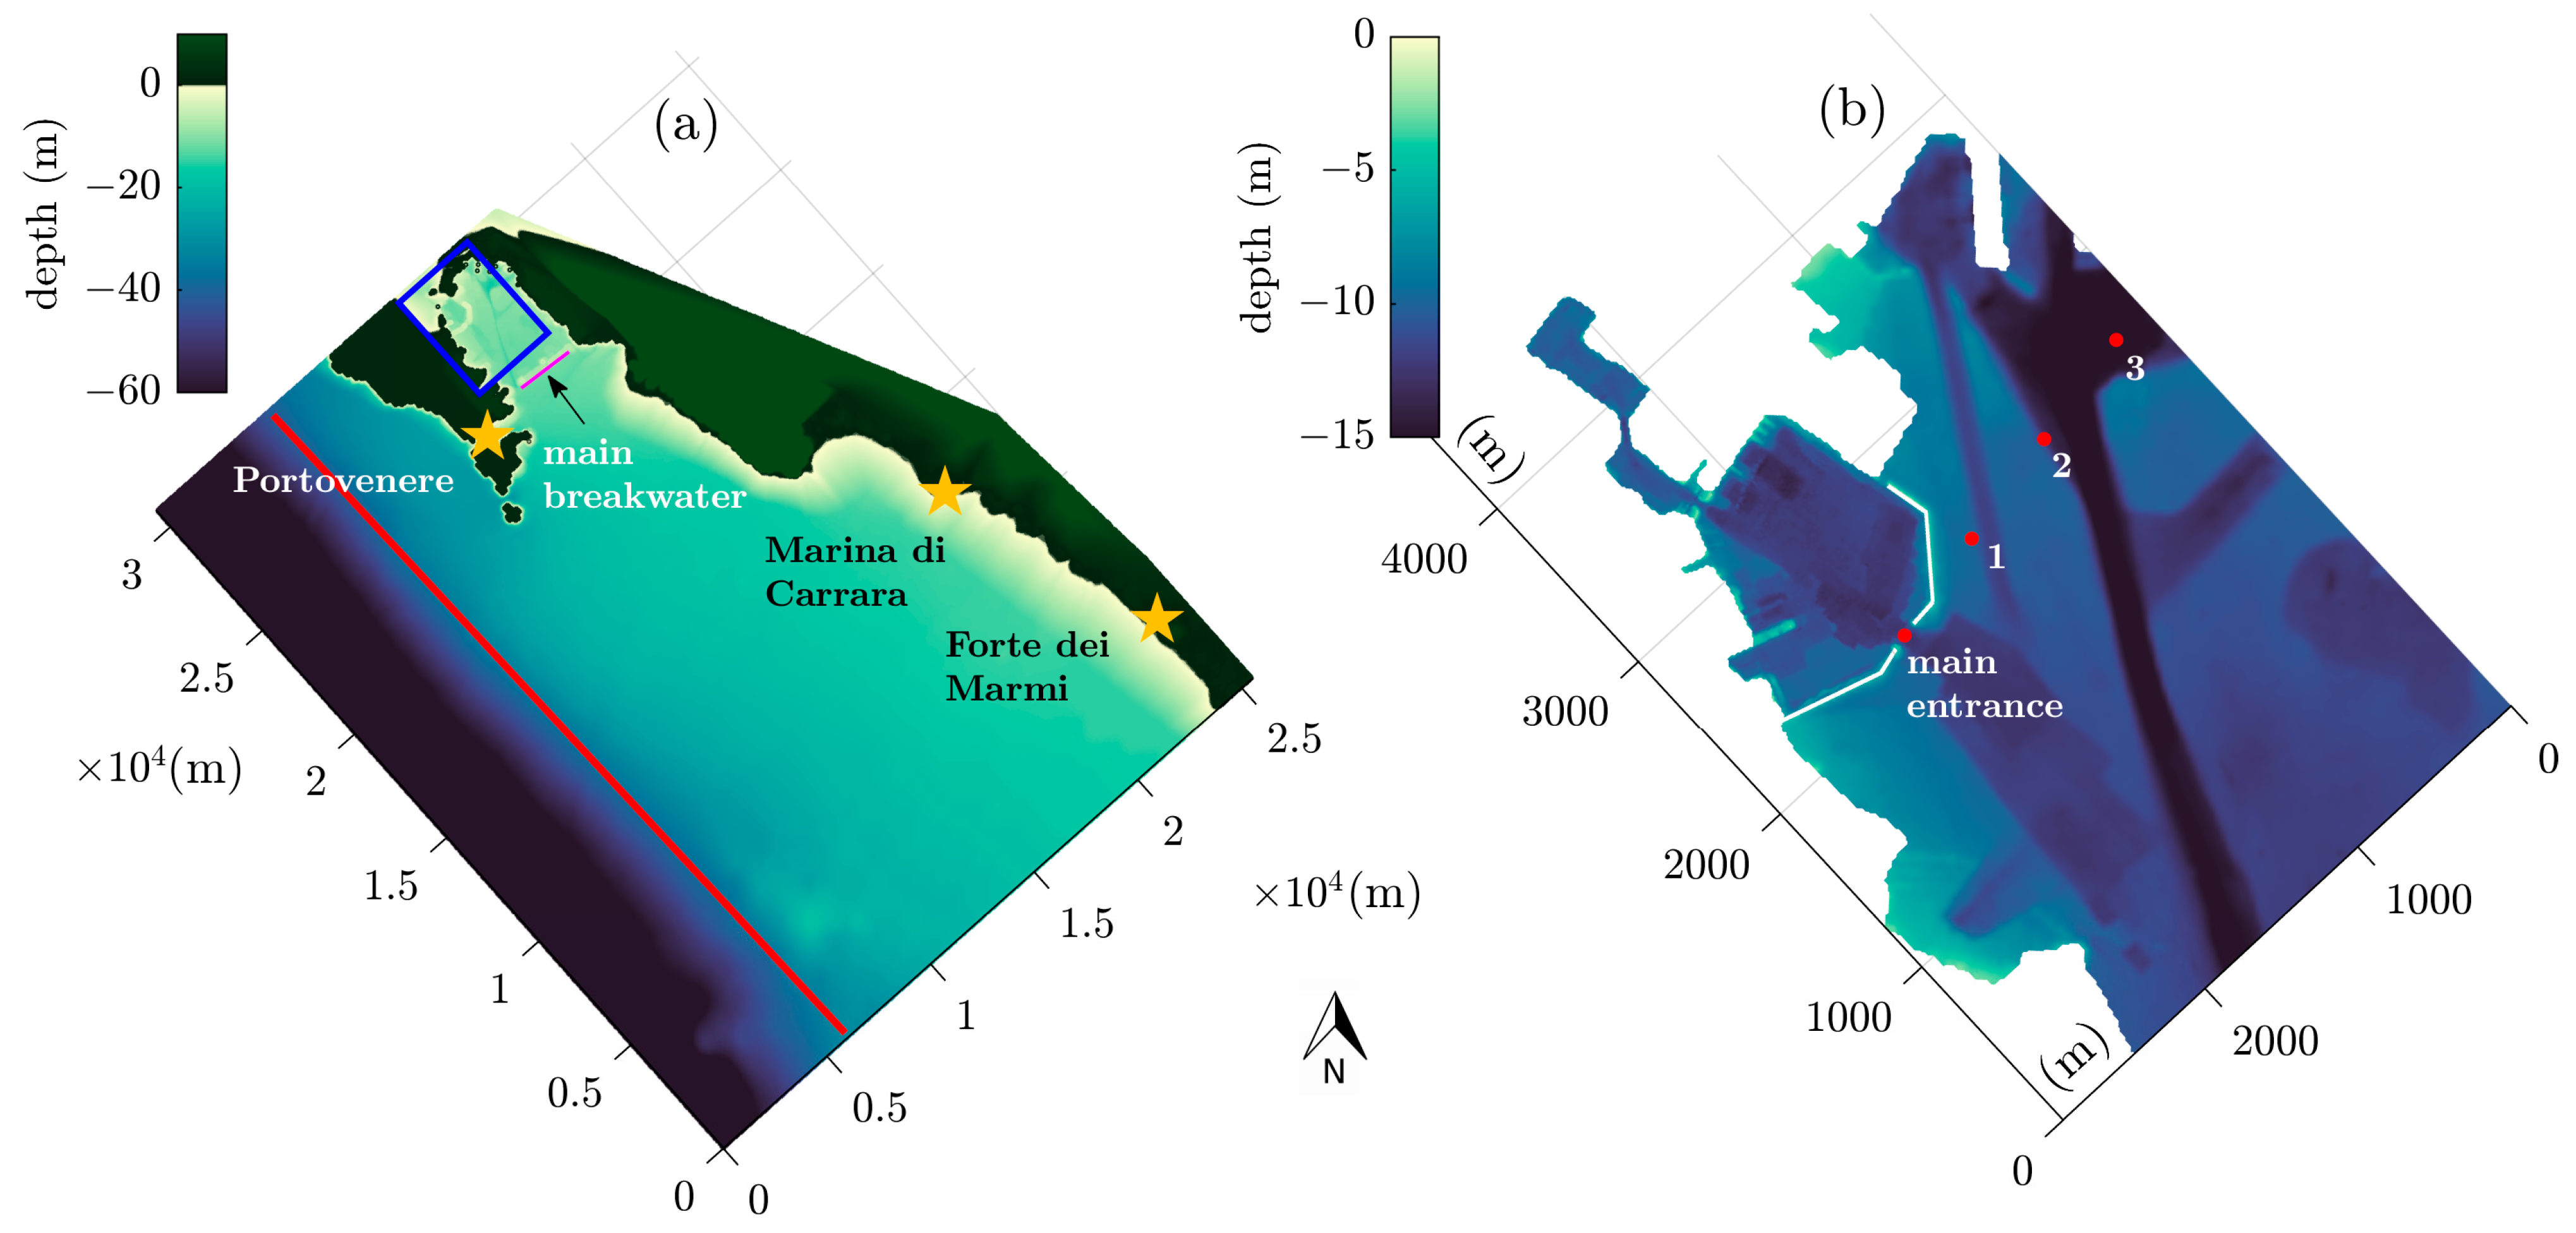
Two computational domains were set up. The first (outer) domain, as shown in Figure 3a, was characterized by a spatial resolution of 5 m × 5 m and extended 30 km in the longshore direction and 25 km in the cross-shore direction, from Riomaggiore (north) to Forte dei Marmi (south). It was used to run a large-scale simulation to propagate the waves from a 30 m water depth (red line in Figure 3a, where the input waves were forced) to the La Spezia gulf. The model was forced with a Jonswap-type spectrum characterized by a wave of significant height Hs = 6.93 m, peak period Tp = 13 s, and peak direction Dp = 230° N.
Then, a second inner model, as shown in Figure 3b, was realized to define the wave agitation inside the basin. This domain extended from the area immediately shoreward of the main breakwater to the Arsenale and had a finer spatial resolution, about 2.5 m × 2.5 m. It was forced with the results provided by the outer model with a Jonswap spectrum, characterized by Hs = 0.25 m and the same peak period of the previous spectrum, i.e., Tp = 13 s. Regarding the direction, the waves for the inner model were input perpendicularly to the boundary. Observe that the wave parameters for the inner model are far smaller than those for the outer model due to the significant wave refraction from the wave generation (wave direction Dp = 230° N) to the main breakwater of the La Spezia harbour (normal direction of 146° N); to the diffraction induced by the islands; and to the strong damping of offshore waves by the main breakwater.
In both models, the breakwaters at the entrance of La Spezia gulf and those delimiting the Arsenale were modelled as impermeable and reflective structures.
2.3.2. Hydrodynamic and Sediment Transport Modelling
Hydrodynamic and sediment transport modelling within the Arsenale was conducted with Delft3D, a fully integrated software suite for a multidisciplinary approach and 3D computations for coastal, river, and estuarine areas. The Delft3D suite is composed of several modules, which are grouped around a mutual interface while being capable of interacting with one another. The main module is Delft3D-FLOW [20], a multidimensional (2D or 3D) hydrodynamic (and transport) simulation program that calculates the non-steady flow and transport phenomena resulting from tidal and meteorological forcing on a rectilinear or a curvilinear boundary-fitted grid. When used in the 2D mode, Delft3D-FLOW solves the Navier–Stokes equations under shallow water and the Boussinesq assumptions and provides depth-averaged quantities.
For this specific case study, for which we are interested in the overall hydro-morphodynamics of the basin, rather than on local details about sediment transport and deposition, we resorted to a 2D, depth-averaged approach. The validity of this approach is confirmed by our results, which show how short waves have little influence on the hydro-morphodynamics: the water currents within the Arsenale can be effectively described by 2D models. Finally, our choice was also due to the lack of field data, due to the fact that Arsenale is a military area. However, the aim of this preliminary study was mainly to gain an in-depth knowledge on the processes governing the hydro-morphodynamics; therefore, we preferred to limit the assumptions on the missing data and to further improve the numerical modelling when more accurate measurements become available.
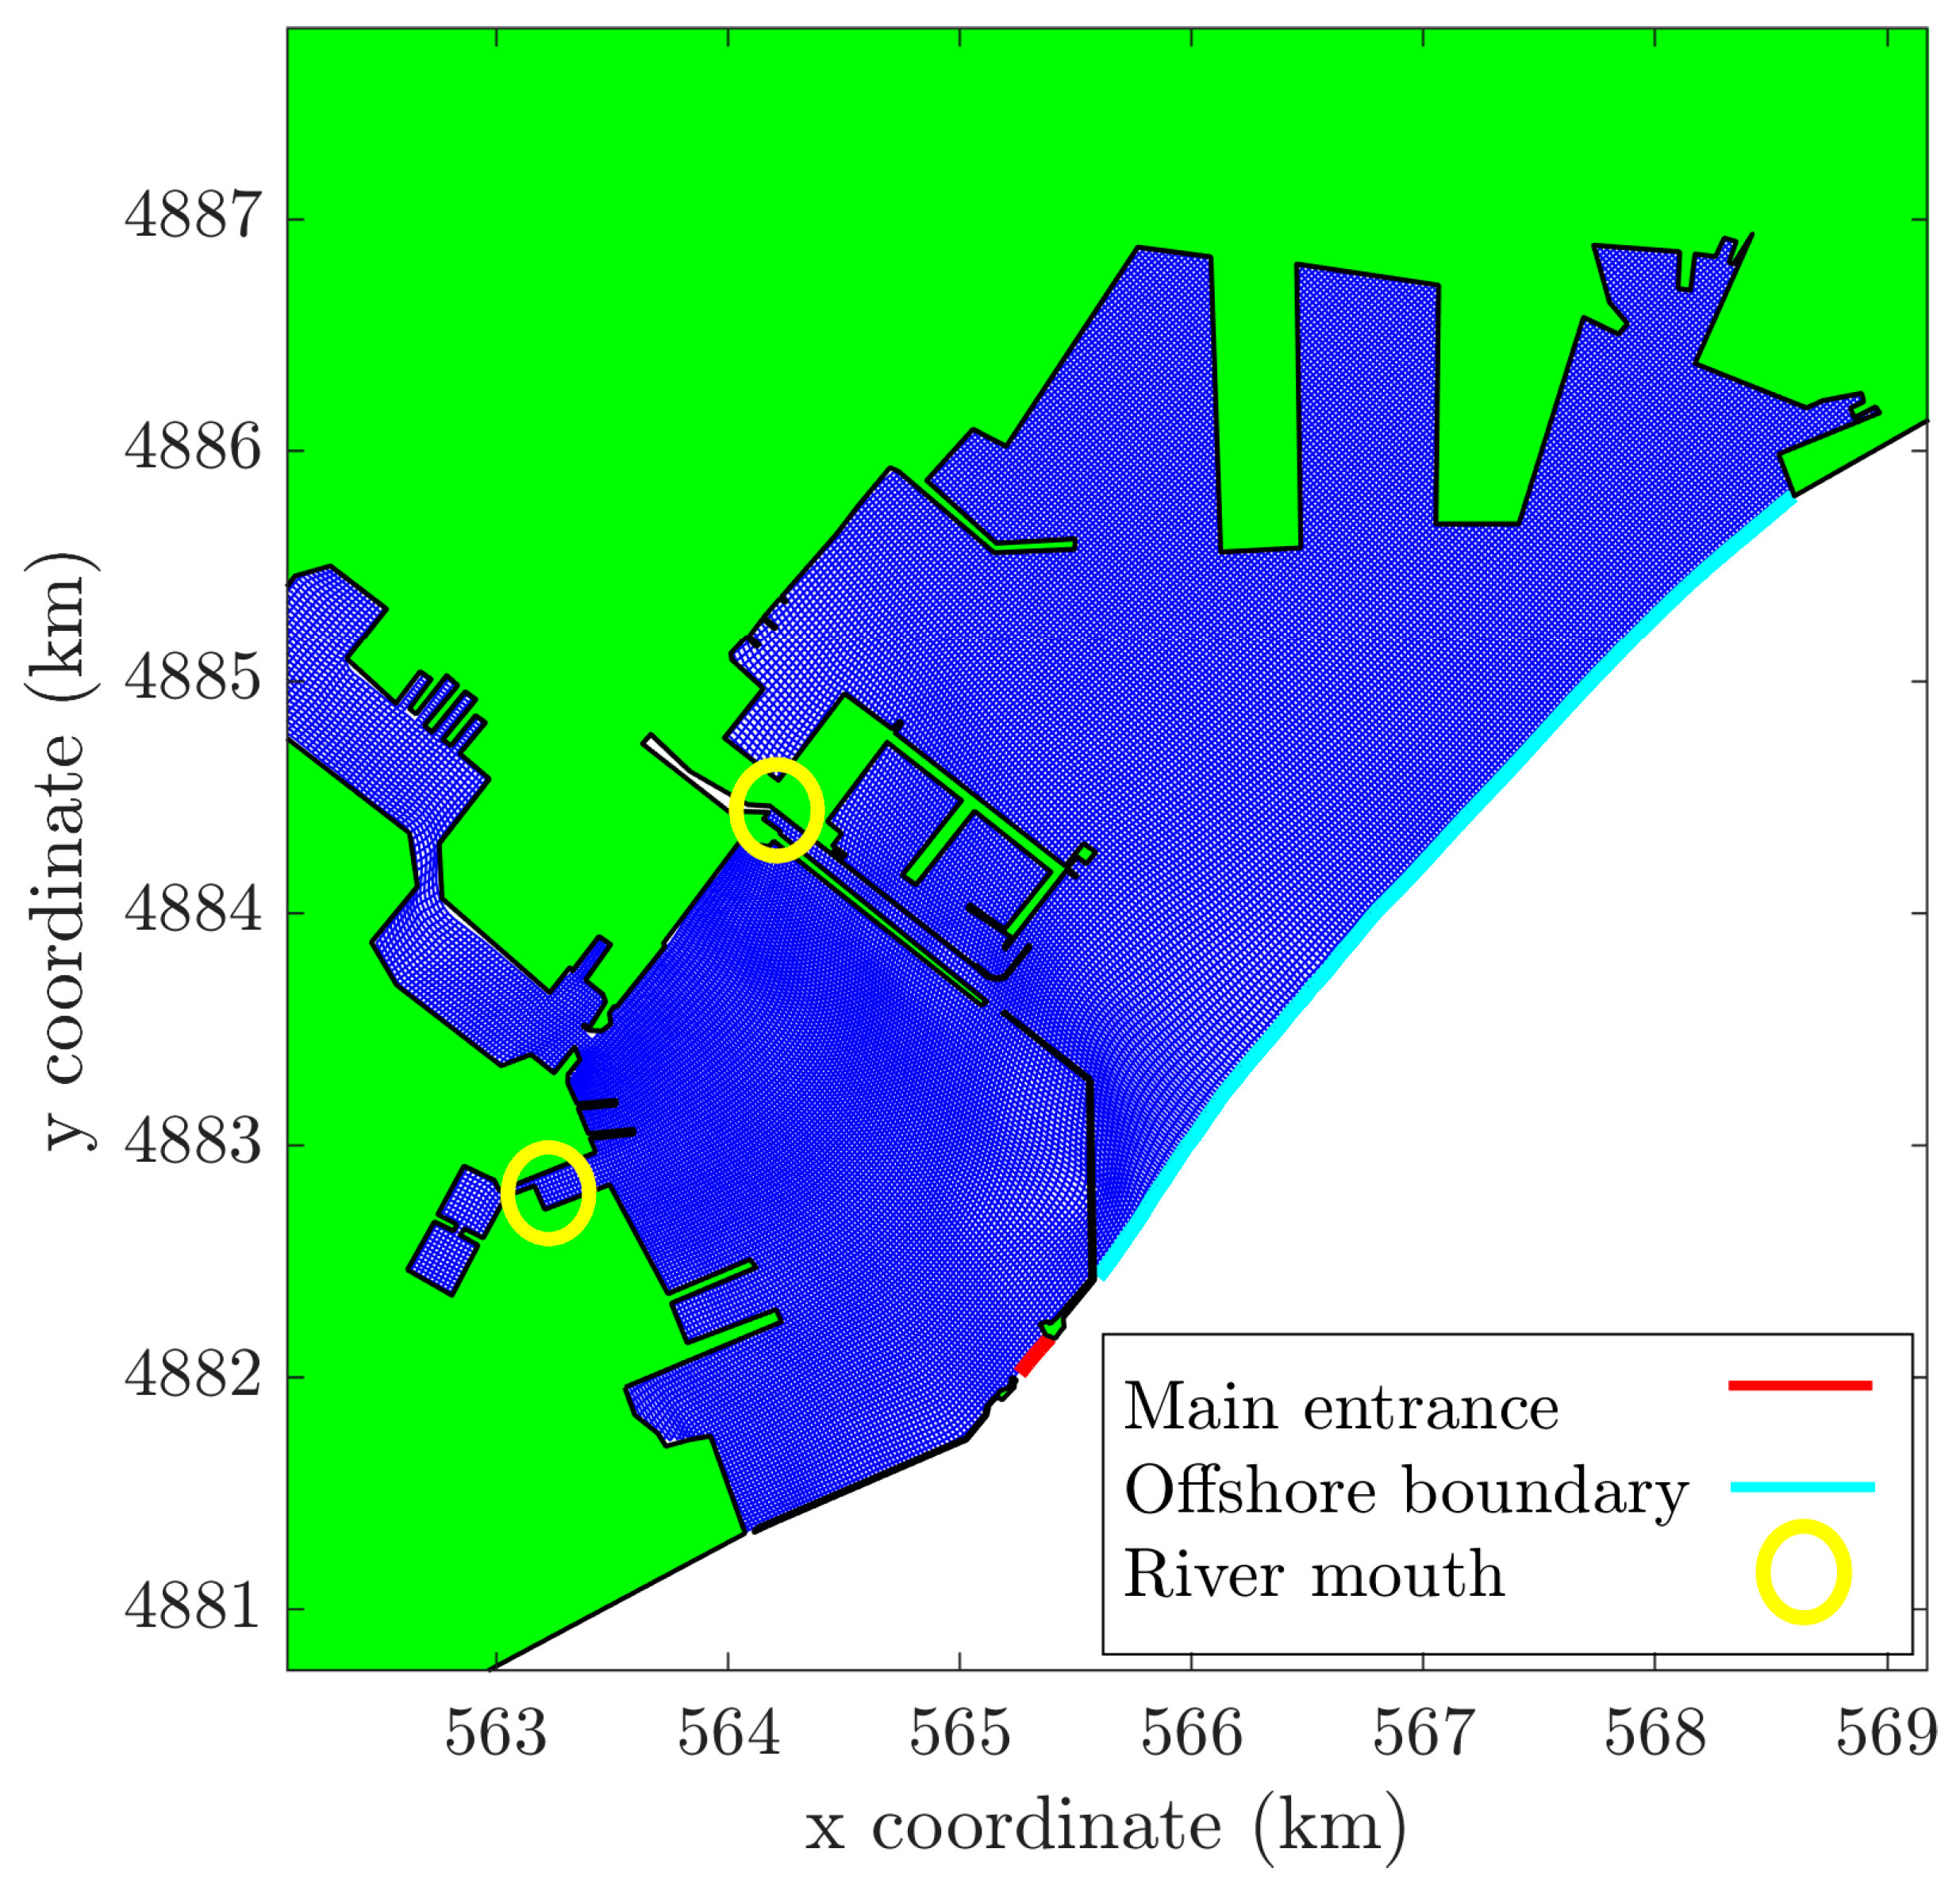
The regular grid, created with the Delft3D-RGFGRID module and shown in Figure 4, covered both the military and the shipping areas. It extended about 2.3 km in the offshore direction and 3.5 km in the alongshore direction, with a spatial resolution between 5 and 10 m. The grid, in WGS 84—UTM 32N coordinates, was rotated about 45° to better adapt to the orientation of the gulf. The grid lines were curved along the land boundaries, obstacles, and channels so that the “staircase boundary effect” [21], which could induce artificial diffusion, was avoided. The chosen domain setup allowed us to bypass the notorious problems that Delft3D encounters when resolving wave diffraction. In fact, we used FUNWAVE to bring the wave signal directly to the Arsenale main entrance (red line in Figure 4) so that it was not necessary to model the wave diffraction with the Delft3D-WAVE module [22]. It is worth mentioning that at the LR Arsenale entrance the wind waves are so small that they can be assumed to be negligible. Figure 4 also shows all the boundaries, in different colours; these are detailed below in the descriptions of the scenarios.
The bathymetries of the Arsenale and surrounding areas shown in Figure 3 were created using a bathymetric survey carried out in 2016 by the Istituto Idrografico della Marina for the areas up to the main breakwater, while the outside depth values from the EMODnet bathymetry domain were interpolated at the grid cell corners. The survey has a spatial resolution of 2 m for the Arsenale and 25 m for the rest of the domain, which involves the coastal region of the La Spezia gulf up to the main breakwater, while the EMODnet dataset has a resolution of about 80 m.
Based on data from in situ samplings, the seabed was modelled as one single layer, uniformly mixed and characterized by both cohesive (mixture of clay and silt) and non-cohesive (sands with median diameter of 200 µm) sediments in different percentages, inside and outside the Arsenale. The sand distribution was assumed to be about 30% and 70%, respectively, within and outside the Arsenale, and vice versa for the cohesive fraction. The initial, space-varying sediment thickness was defined in terms of the dry bed densities and volume fractions of the sediments implemented.
For the characterization of the cohesive sediment inside the Arsenale area, no field or laboratory data were available. Therefore, we performed a sensitivity analysis to assess the effect of the main calibration parameters on the sedimentation inside the Arsenale. The most dominant calibration coefficients are the dry bed density CDryB, the erosion parameter M, the critical erosion/deposition shear stresses (τcr,e, τcr,d), and the settling velocity ws [23]. Table 1 reports the ranges within which the parameters were varied and the values used in the simulations. Sensitivity tests revealed that the factors most affecting the sedimentation inside the basin were the dry bed density, the critical shear stress for deposition, and the settling velocity. Although the relative deposition changes between the tested values were significant, the absolute difference was of the order of a few centimetres, with a maximum amount of sedimentation that remained smaller than 1 dm. The effects of the erosion parameter and the critical shear stress for erosion were manifested almost only along the rivers, without altering the deposition inside the Arsenale. Considering the obtained results, we chose reasonable values according to what were generally used in previous modelling studies [10,24,25,26,27] and to the Van Rijn formulation for mud–sand mixtures [28].
Numerical simulations were undertaken to evaluate the overall Arsenale hydrodynamic circulation and related sedimentation mechanisms. Such information is of fundamental importance for managing purposes (e.g., mitigation of sedimentation processes, localized dredging, etc.). As mentioned above, we ran three scenarios, characterized by different flow–sediment transport forcing, to inspect the role of various forcing combinations (Table 2). For the present analysis of the main characteristics of the hydro-morphodynamic circulation, we neglected the effects induced by temperature and salinity, assuming a negligible difference between the freshwater streams and the water inside the basin. The duration of each simulation was 48 h.
2.3.2.1. Scenario 1 (TW): Tide, Waves, and Wind Implementation
The first scenario was run to understand the effect of waves and tide on the Arsenale dynamics, while neglecting the contribution of riverine flows (Table 2). Two simulations were performed to account for two different uniform wind fields, with speeds of 15 m/s from 30° N (NNE wind) and 20 m/s from 150° N (SSE wind), respectively. These values are associated with a return period of 100 years, derived from an extreme value analysis of the available data extracted from the La Spezia ISPRA station.
We imposed a Riemann-type condition at the offshore boundary and at the main entrance of the Arsenale to account for both wave and tide actions. The incoming Riemann variable is , where U is the normal-to-boundary velocity component of the flow, while H is the total water depth, and g is gravity acceleration. The Riemann boundary condition was implemented by Delft3D through the following linearized relation:
where ζ is the water level, d is the water depth, and t is time. The velocity component of the flow and the water level due to the waves were extracted from the 2 h FUNWAVE simulation at the locations depicted in red in Figure 3b, with a time resolution of 1 s. The FUNWAVE time series were repeated to match the duration of the Delft3D simulations of 48 h. The water level time series ζ(t) was obtained by adding the water level due to the wave propagation, as modelled by FUNWAVE and described in Section 2.3.1, to the water level recorded by the La Spezia tide gauge during a spring tide (the maximum tidal excursion was equal to 0.3 m) so that the effect of the tide was enhanced. The mean value of water depth for each section of the boundary was derived from the bathymetry and kept constant since no significant changes in the seabed were expected at the offshore boundary.
To better implement the Riemann-type boundary condition, we discretized the offshore boundary (cyan line in Figure 4) into 3 sections, centred at the probes 1, 2, and 3 (see Figure 3b). For each boundary section, a Riemann time series was computed with wave input coming from the respective FUNWAVE probe and then imposed on the initial and last part of the respective section, linearly interpolating the intermediate values along the stretch.
2.3.2.2. Scenario 2 (TR): Tide, Rivers’ Discharges, and Wind Implementation
In the second scenario, we neglected the influence of the waves to analyse the effect of the freshwater streams and the tide on the hydrodynamics and the sediment transport processes. To model the rivers’ discharges, total discharge boundary conditions were applied at the points representing the rivers’ mouths (shown as yellow circles in Figure 4). Both discharge and sediment concentration time series were required; for this purpose, a triangular hydrograph lasting 24 h was created to represent the time evolution of the water discharges, with peaks of 209.48 m3/s and 64.64 m3/s for the LR and CR, respectively. Such values represent the 100-year return period of the rivers’ discharges. Sediment concentrations were taken as constant and equal to 2.65 kg/m3 for the LR and 1.36 kg/m3 for the CR, respectively. To complete the analysis, the offshore boundary was forced with a water level time series of tidal oscillations only, and the wind field was implemented as already described in Section 2.3.2.1.
2.3.2.3. Scenario 3 (TWR): Tide, Waves, Rivers’ Discharges, and Wind Implementation
In the third scenario, we superposed the forces implemented in Scenarios 1 and 2, i.e., the tide, the wave action, the wind, and the freshwater streams, to account for all the possible forcing acting at the Arsenale.
The boundary conditions were applied in a similar manner to those of the previous scenarios. Again, two total discharge boundary conditions were applied at the rivers’ sections, and the sediment flux time series were the same as those of Scenario 2. The Riemann-type boundary condition imposed at the offshore boundary was modified to let the rivers’ discharges leave the domain at the open boundaries.
3. Results
3.1. Wave Propagation
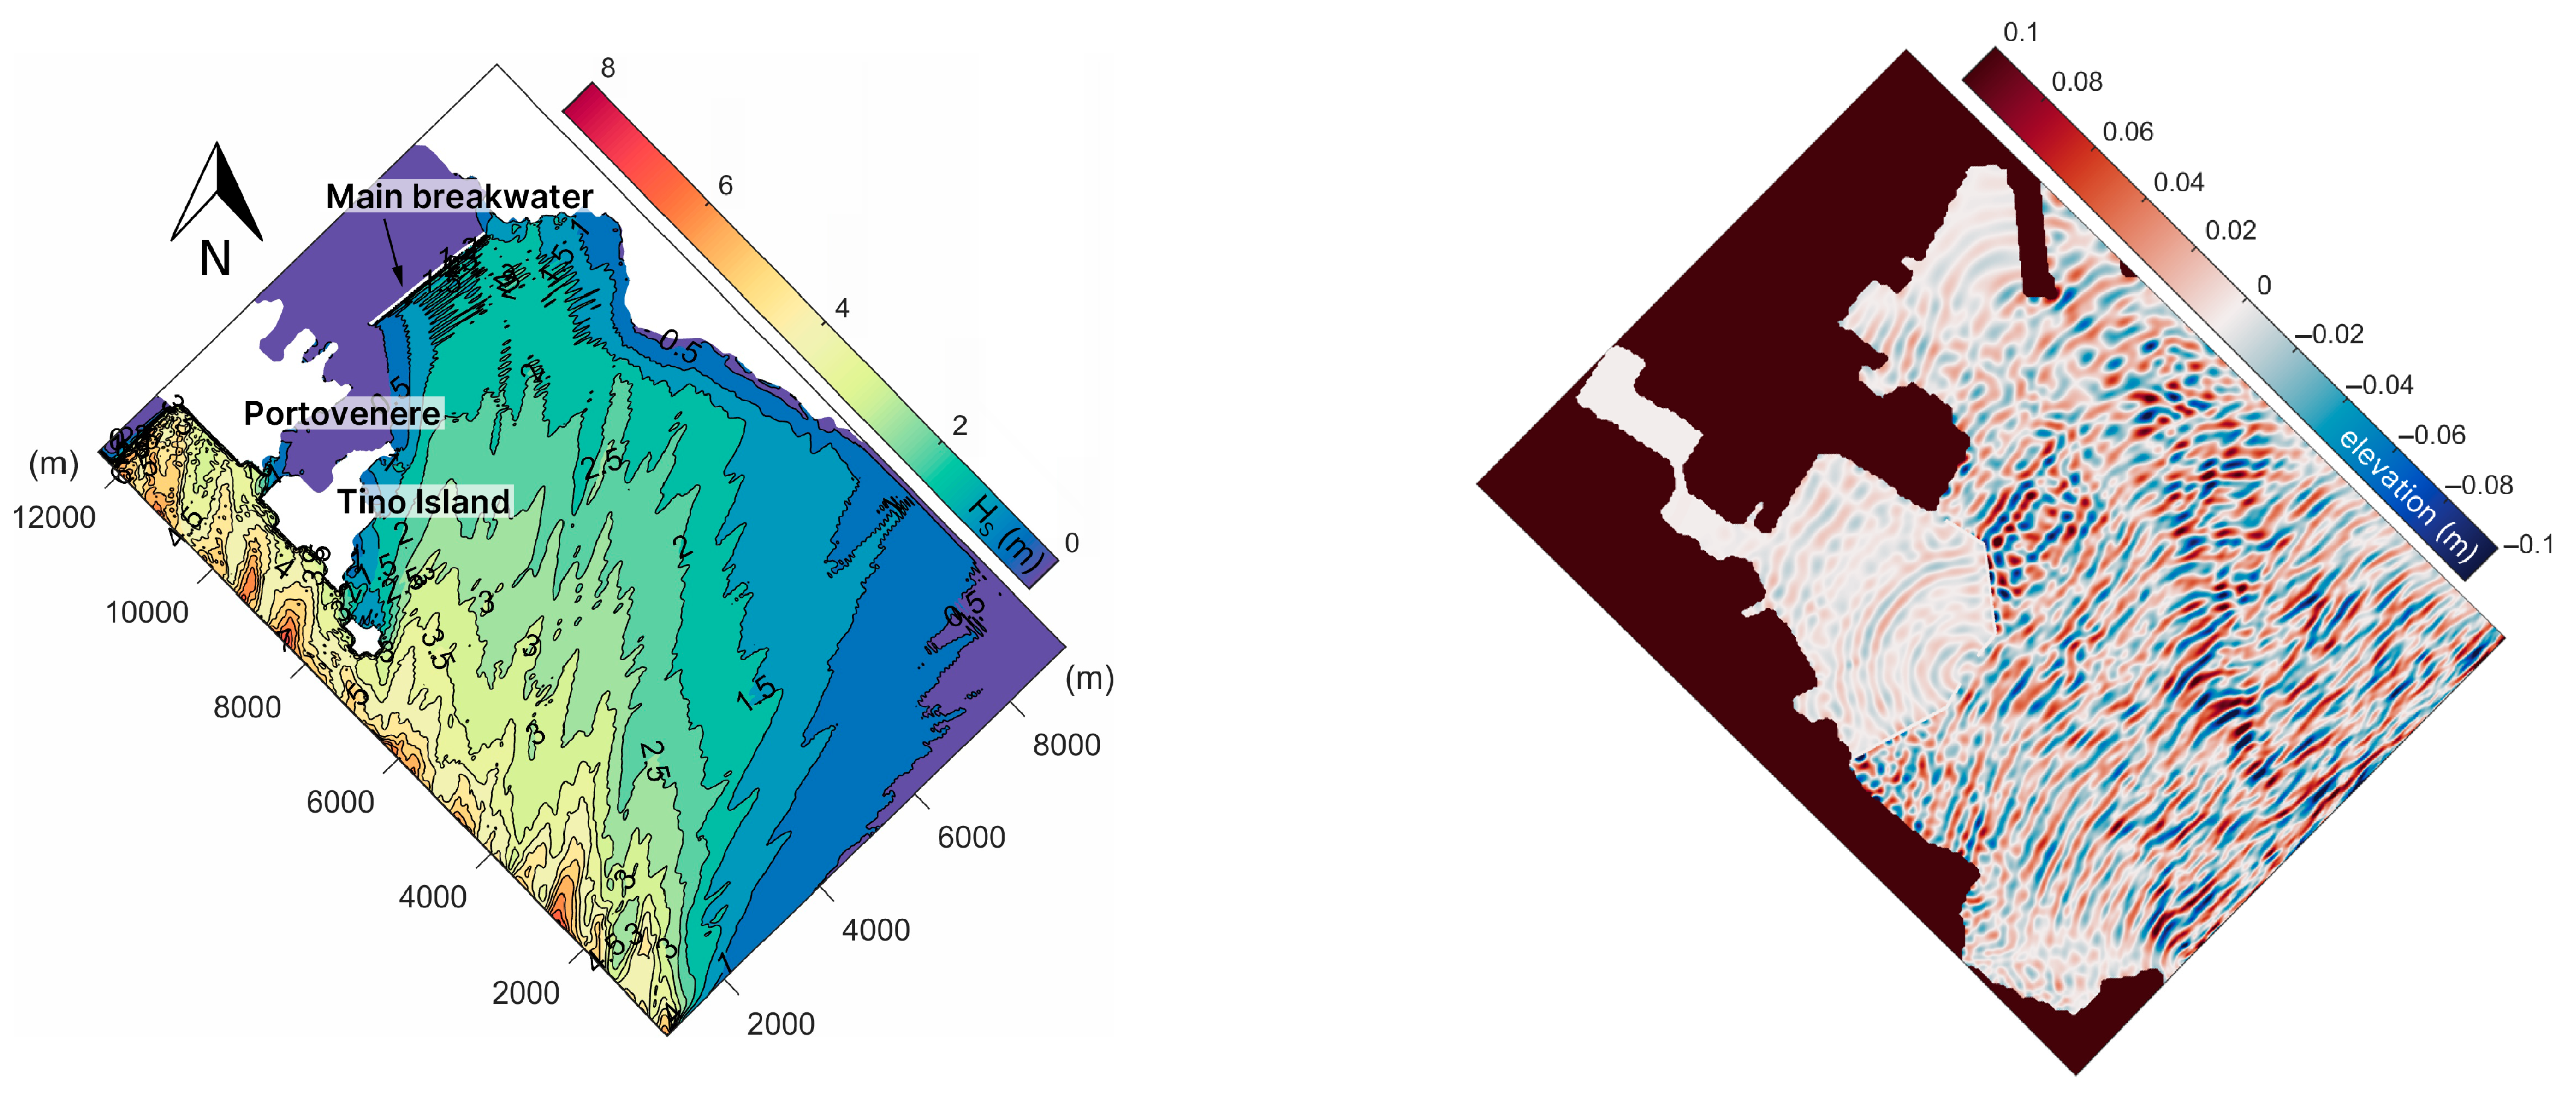
The results of the numerical simulations of the wave propagation with FUNWAVE showed that the offshore waves were significantly reduced due to the presence of the Portovenere and Palmaria and Tino Islands, which protected the gulf area. The maximum values of the wave height were found to be about 1.5 m close to the main breakwater (left panel of Figure 5).
The waves were slightly rotated by diffraction and refraction and approached the main breakwater almost perpendicularly. Such a structure strongly damped the waves, with the wave height being reduced to 0.25 m inshore of the breakwater. Then, the waves propagated inside the Arsenale, being further reduced by the emerged breakwaters surrounding it. As shown in the right panel of Figure 5, the resulting wave agitation inside the military harbour was very mild, with water elevations smaller than 0.03 m.
3.2. Hydrodynamic and Sediment Transport Modelling
3.2.1. Scenario 1 (TW): Tide, Waves, and Wind Implementation
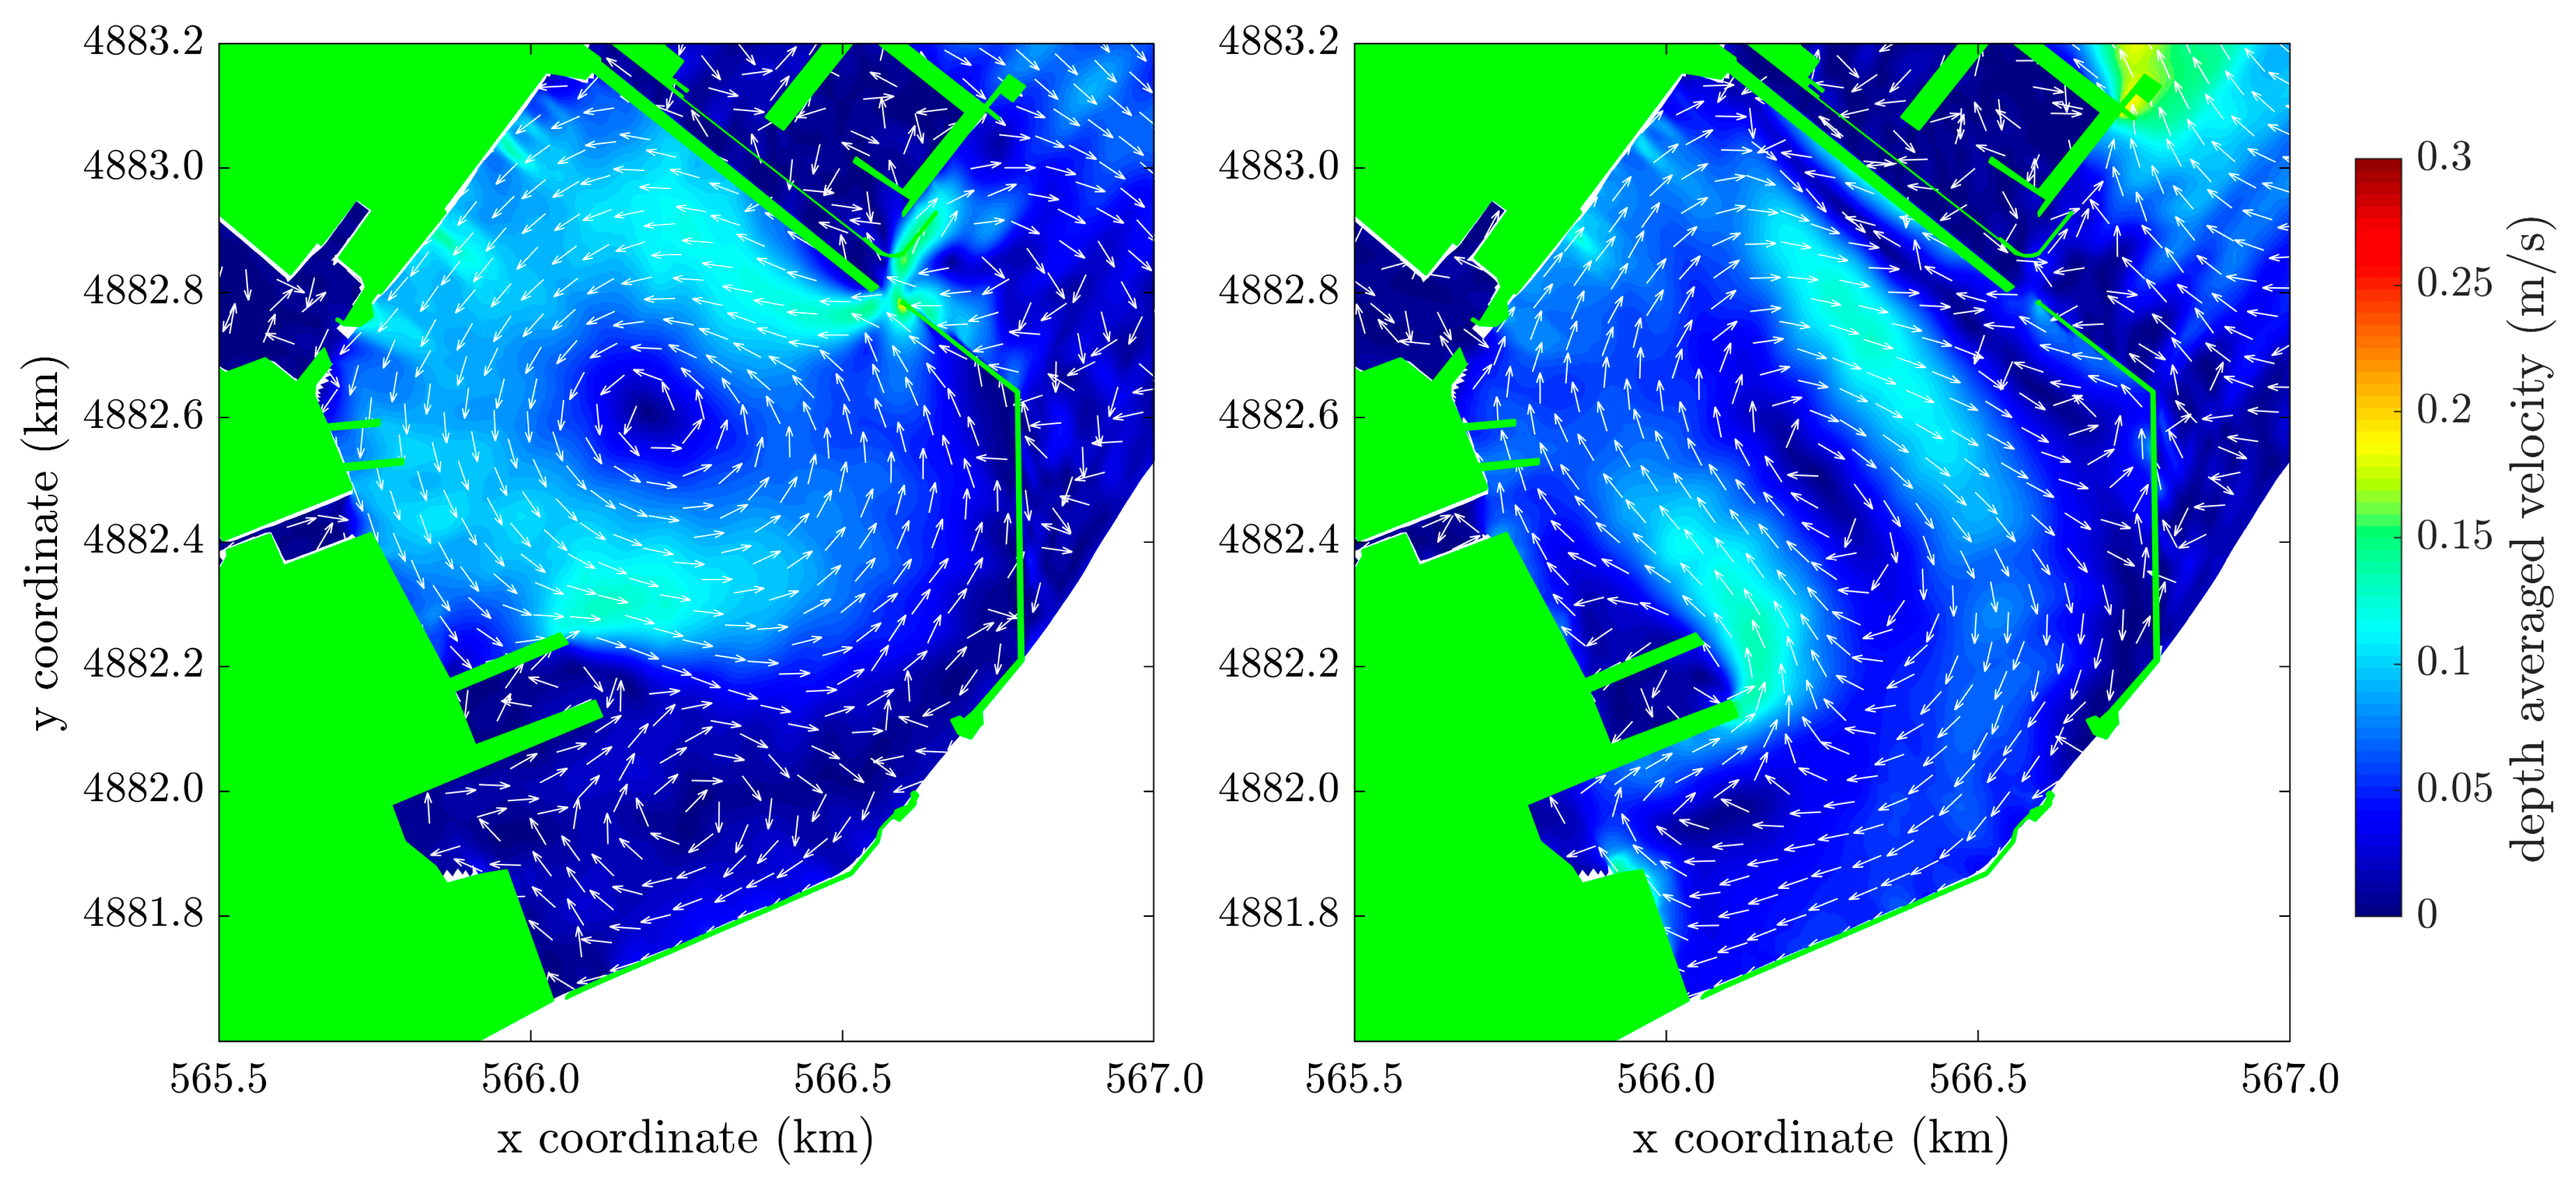
In Scenario 1, the actions of tide, waves, and wind were simultaneously activated. The results showed that the overall water level oscillation inside the Arsenale was similar to that of the tidal range, around 0.35 m, confirming that the wave effect was not relevant due to very small wave heights (right panel of Figure 5). The tide was thus the main actor in defining the flow patterns, determining the fluctuations of both the water level and the velocities. During the flood phase, the water entered the Arsenale through the mouths, while tidal emptying occurred during the ebb phase. The maximum velocities were reached in the area of the LR entrance, due to the narrowing of the section, in relation to the falling tide. Here, the critical bed shear stress for erosion was exceeded rarely and briefly, during the receding of the ebb tide (see Supplementary Materials). This implied that the modelled forcing actions were not intense enough to resuspend the sediments on the seabed and to generate the sediment transport processes. In fact, the modelled sediment suspended concentration (SSC) and sedimentation patterns confirmed that no variation of the bed took place during the simulation. Additionally, it was observed that the effect exerted by the wind, from both the NNE and SSE, strongly affected the rotation and the intensity of the circulation inside the basin: the NNE winds generated an anticlockwise circulation (left panel of Figure 6), while the SSE winds determined a clockwise velocity field (right panel of Figure 6).
3.2.2. Scenario 2 (TR): Tide, Rivers’ Discharges and Wind Implementation
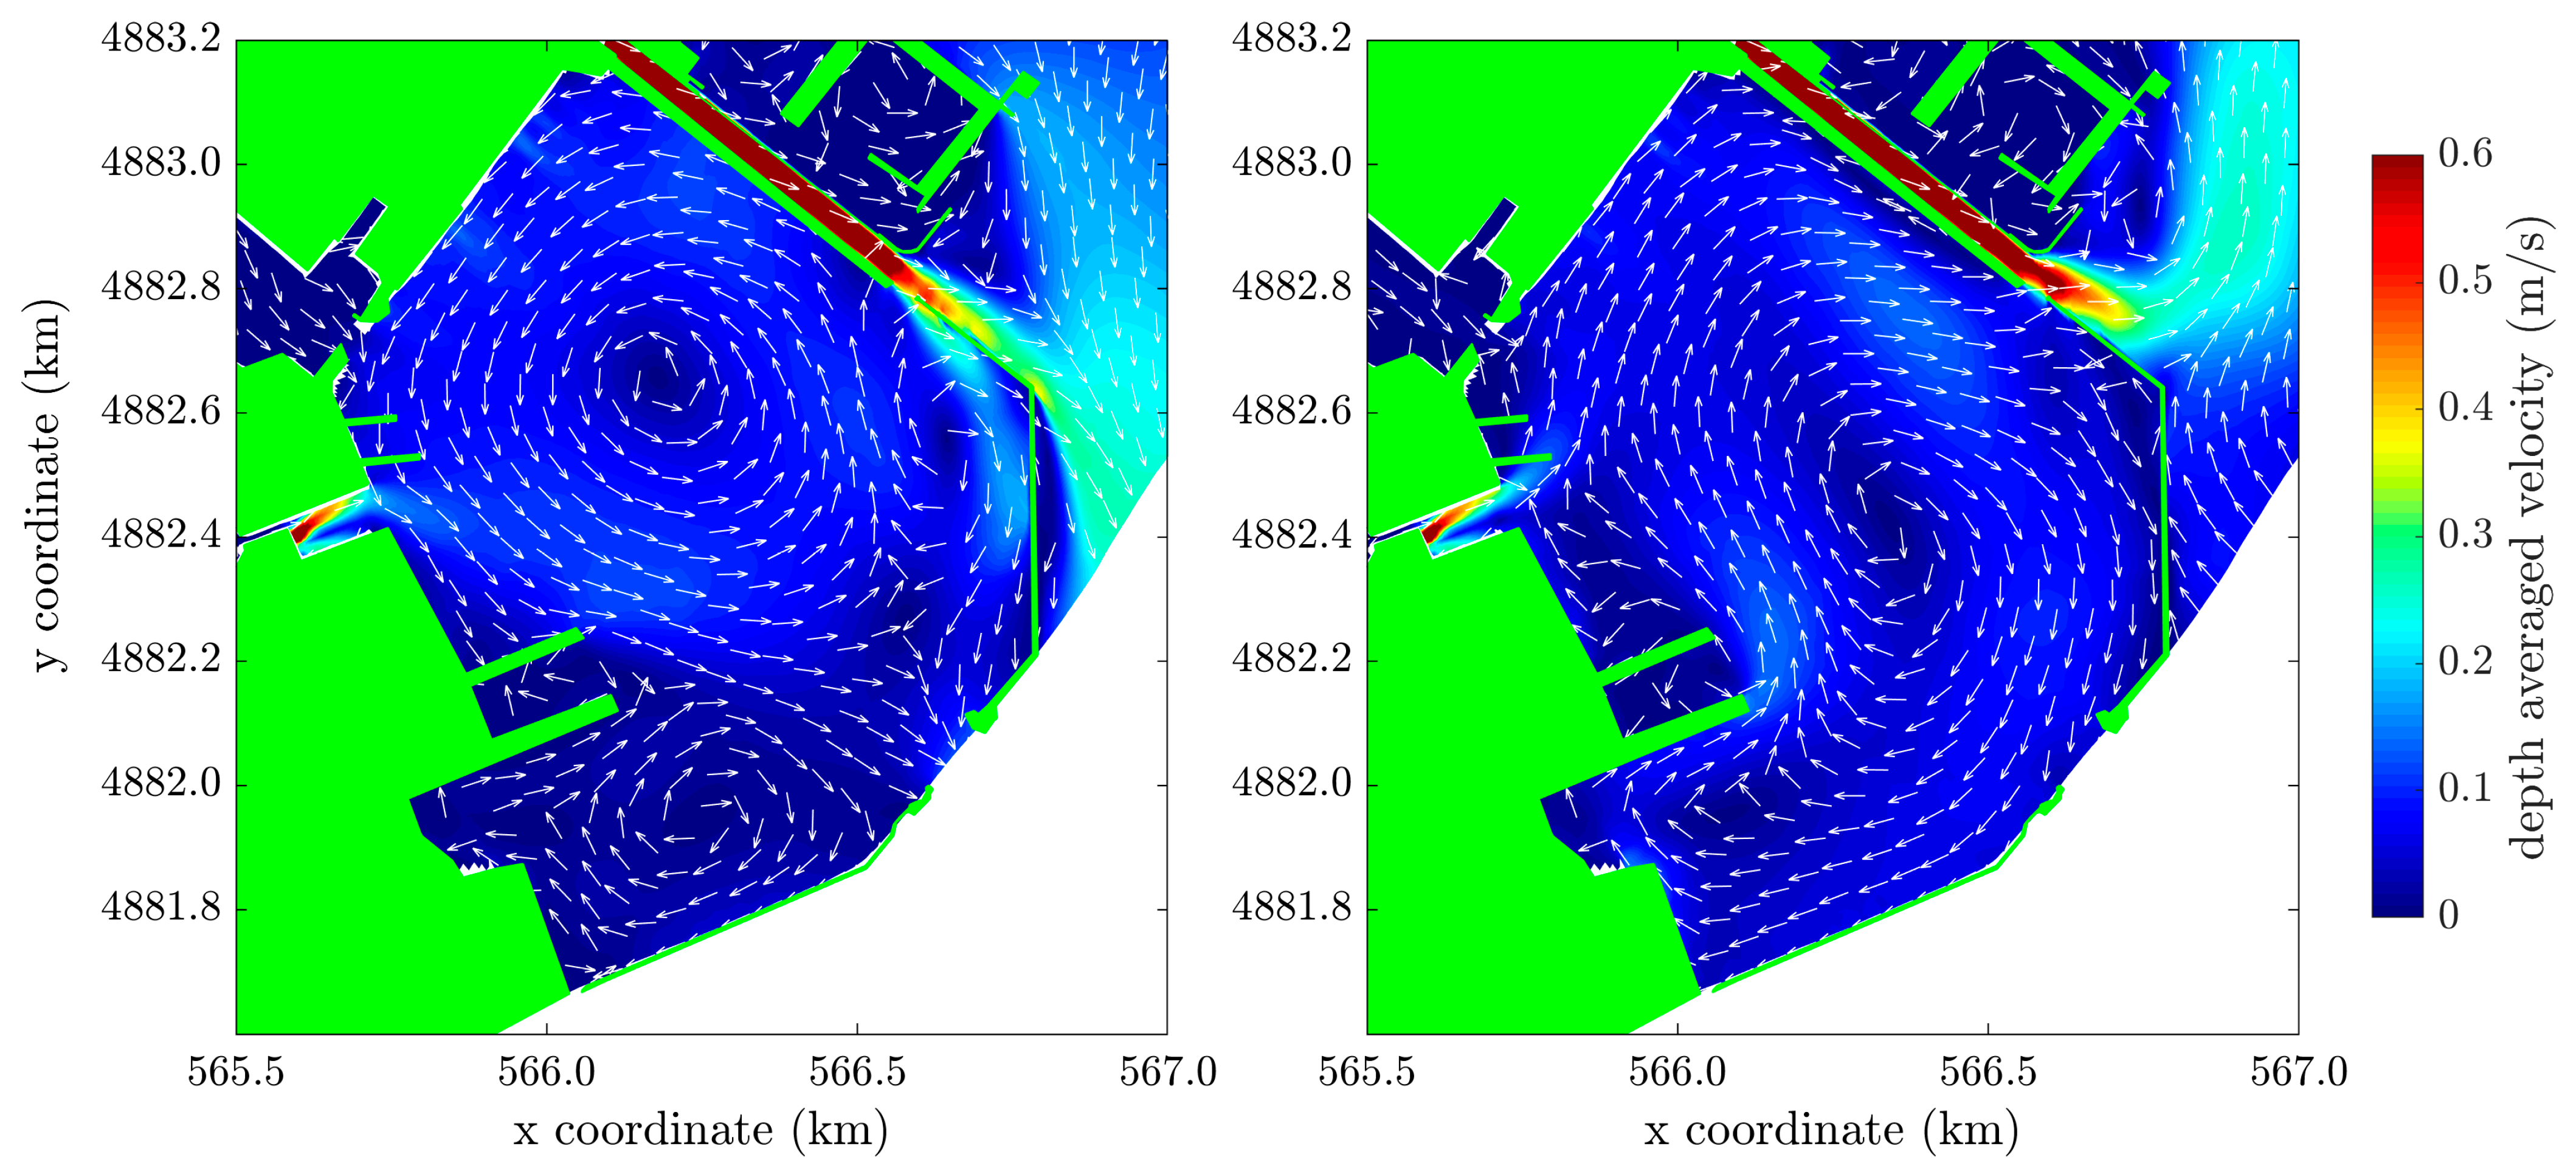
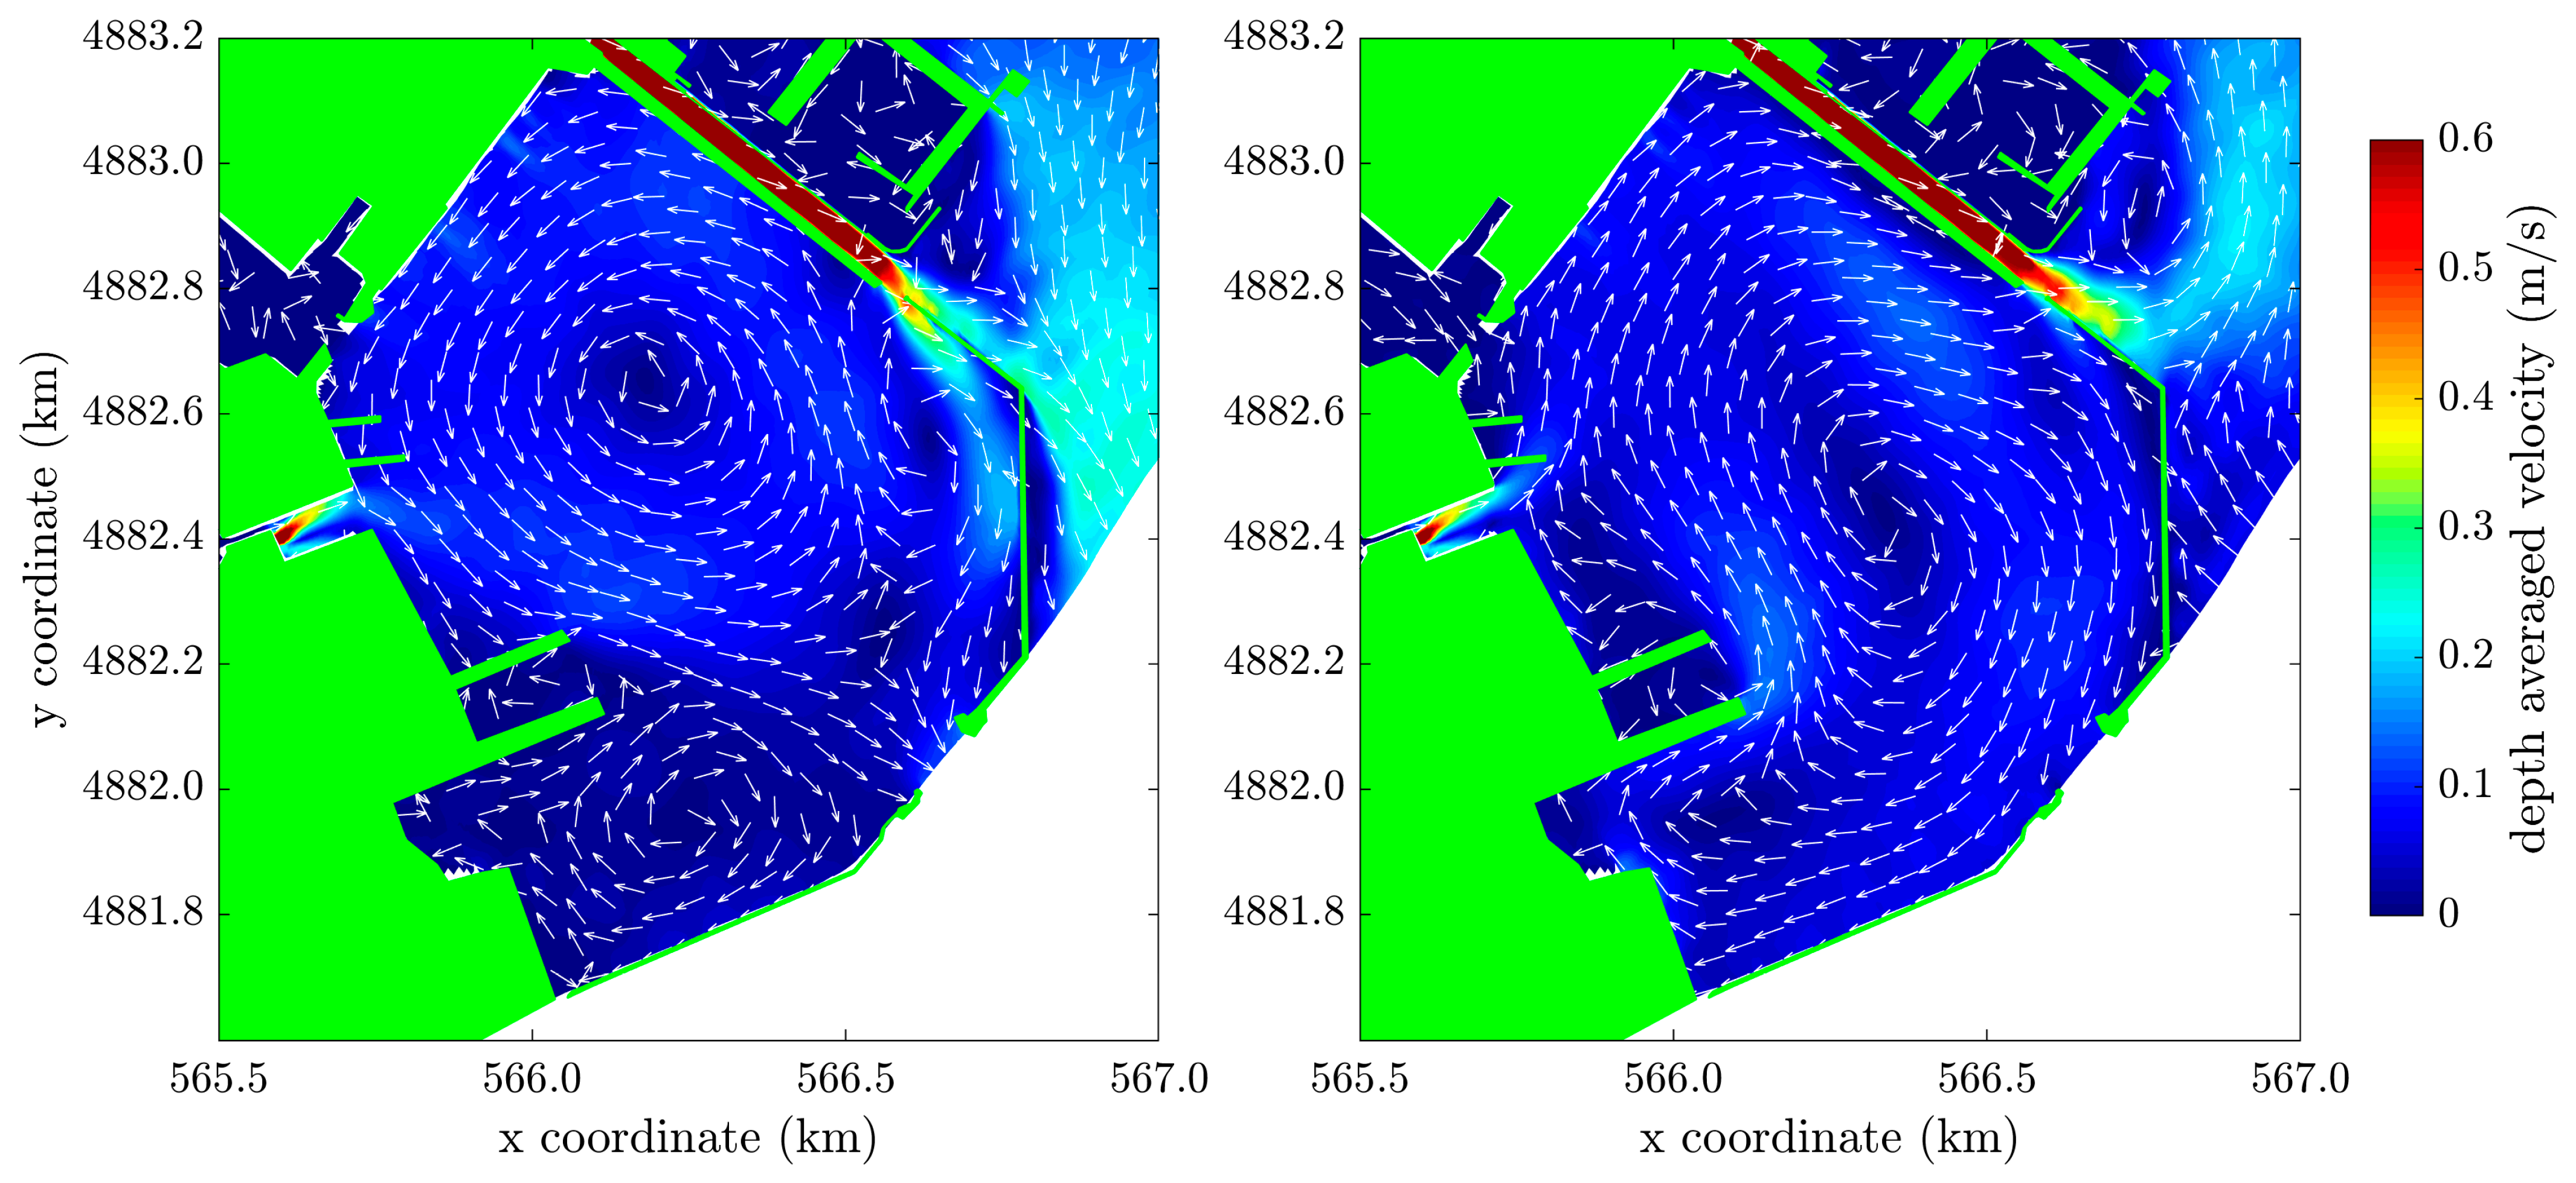
In Scenario 2, the effect of the waves is turned off and the effect of the rivers’ discharges is included. Comparing the results of the TW and TR scenarios in terms of water levels, the only slight difference was due to the wave contribution, while the freshwater streams did not significantly alter the water level inside the basin. The flow circulation was comparable to that of the TW scenario before the occurrence of the rivers’ discharges, underlining the dominant role of the tide and wind. During the rising phase of the rivers’ discharges, some differences could be observed due to the wind direction. In the case of the NNE wind, the LR discharge was partially pushed into the Arsenale, generating a clockwise vortex (left panel of Figure 7). This vortex increased in size and moved toward the south as the river discharge increased; then, it reduced and retreated toward the entrance at the fall of the river discharge. Conversely, under the SSE winds, the LR discharge bent toward the NE, only slightly entering the Arsenale (right panel of Figure 7). The CR discharge, directly debouching into the Arsenale, followed the wind-forced general circulation and contributed to its intensity.
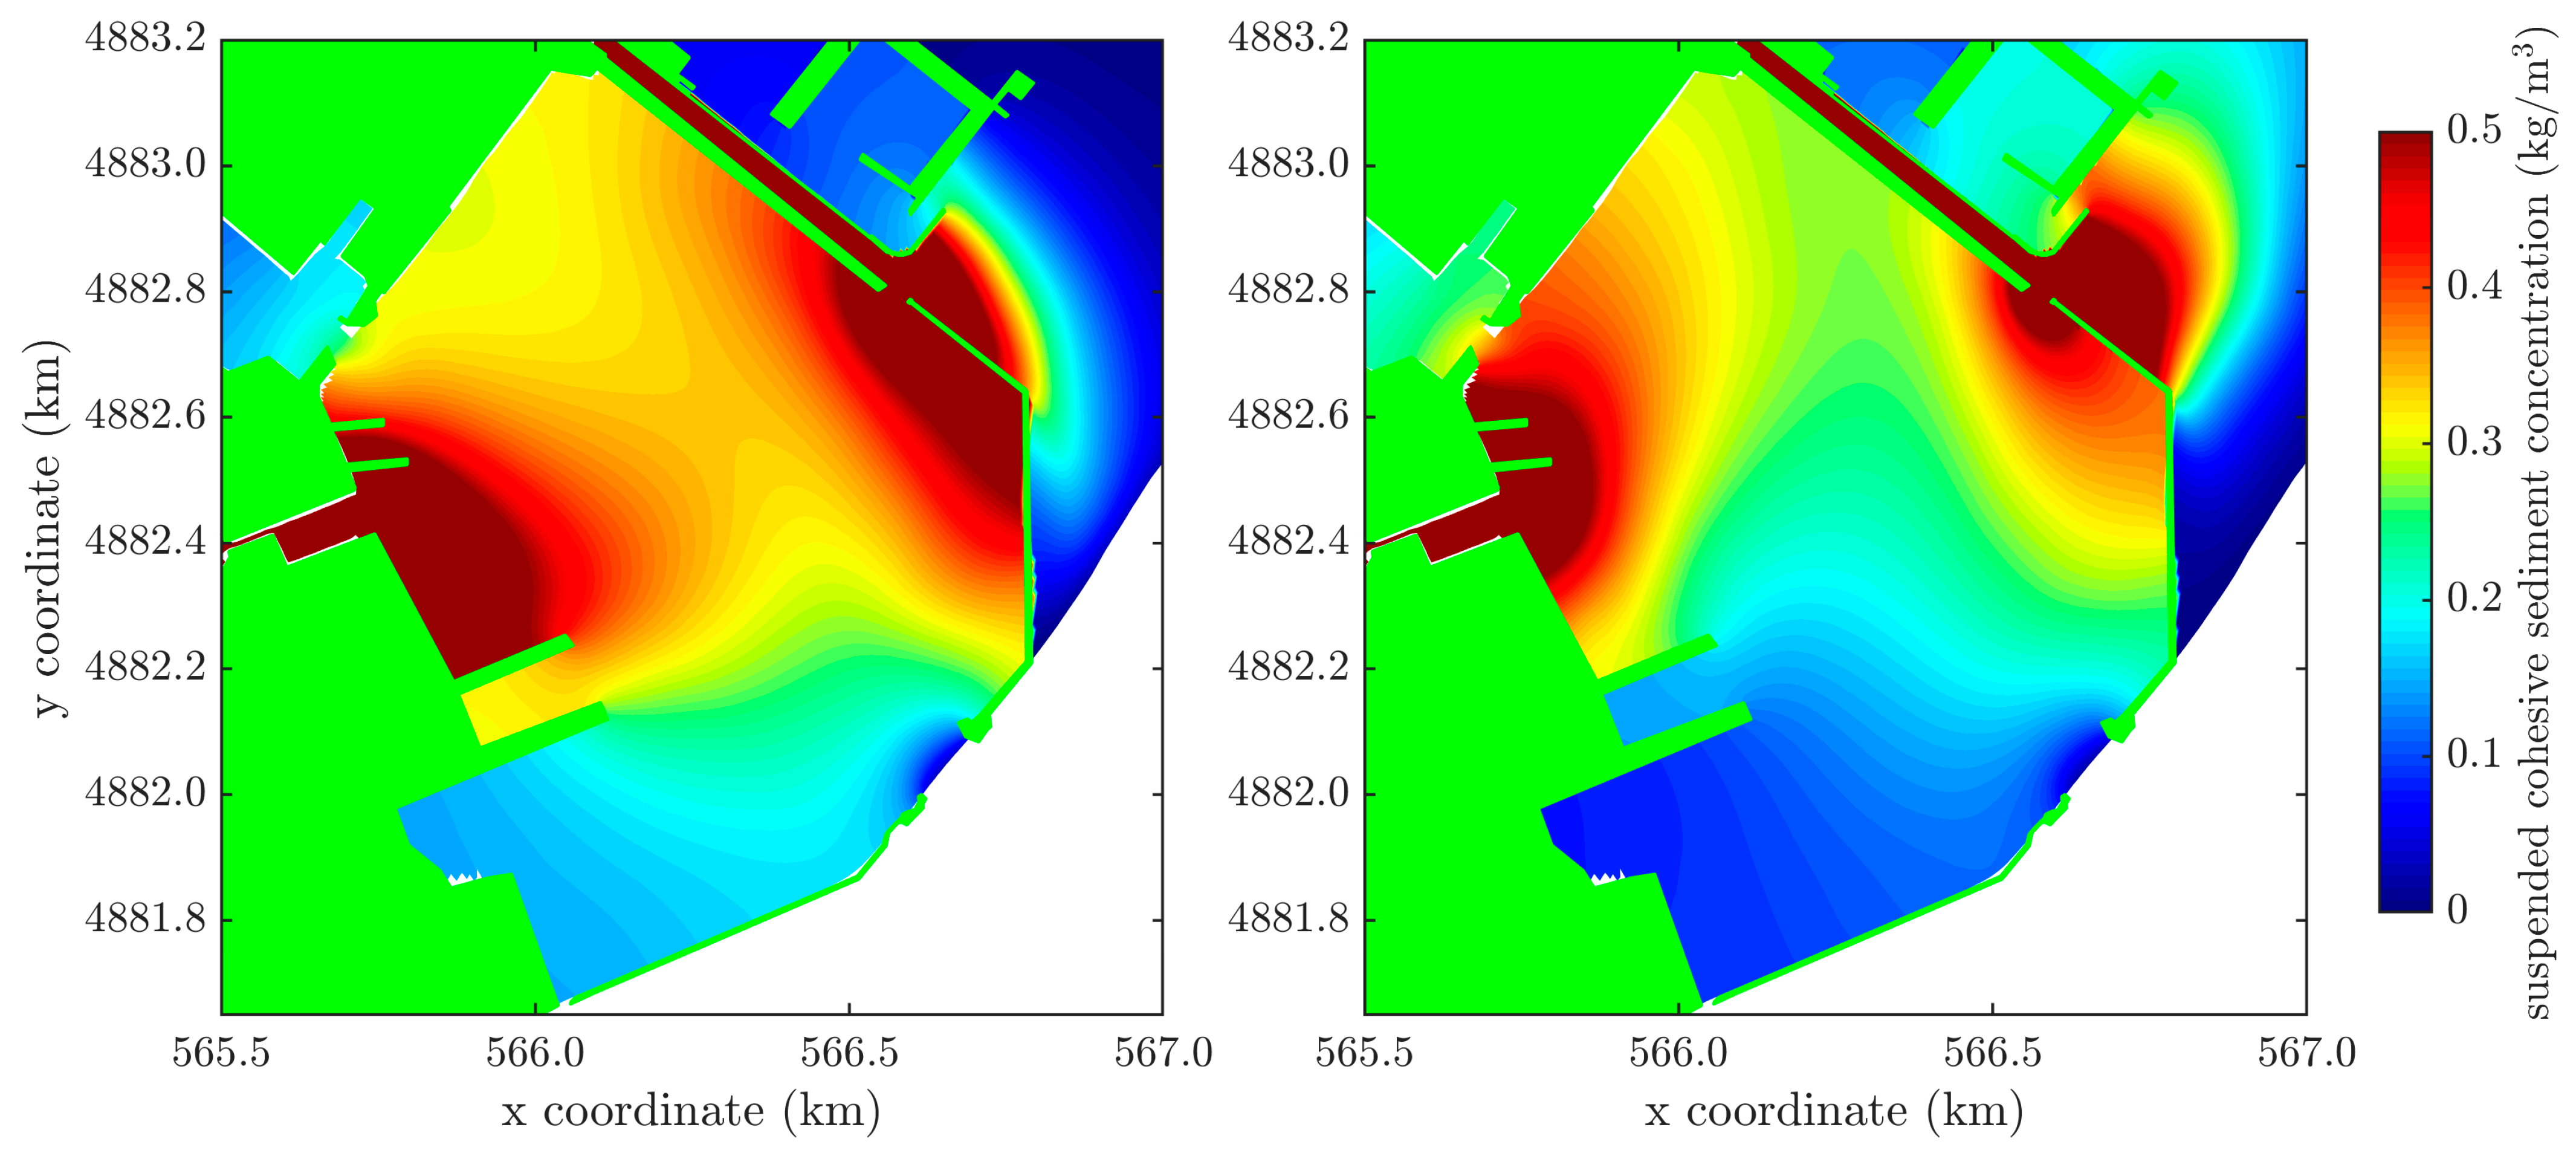
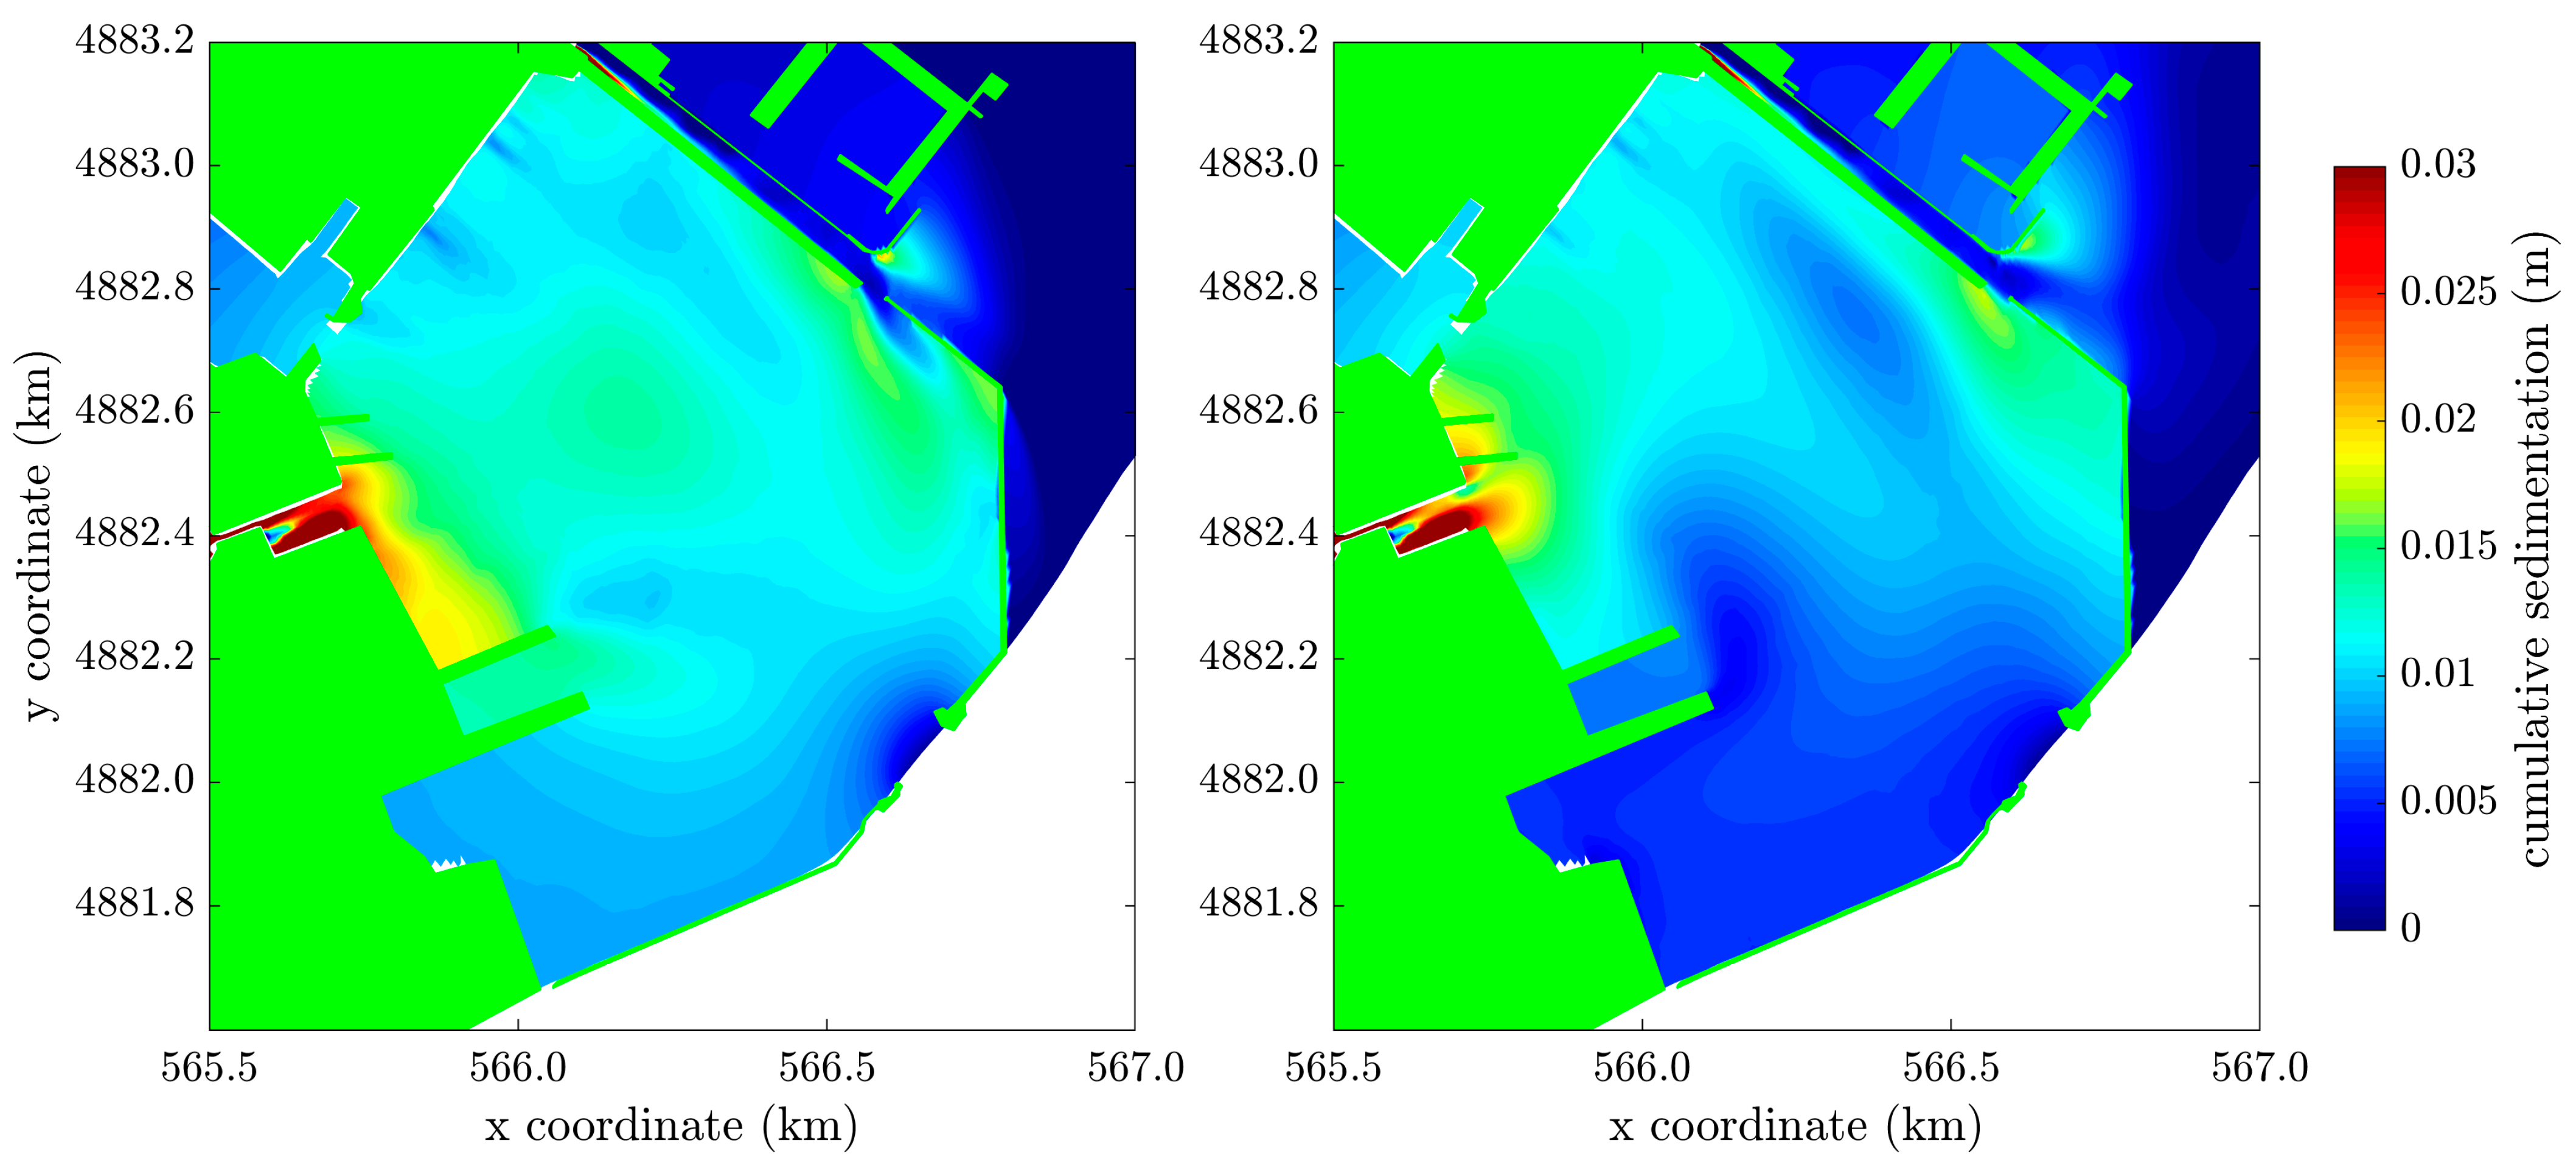
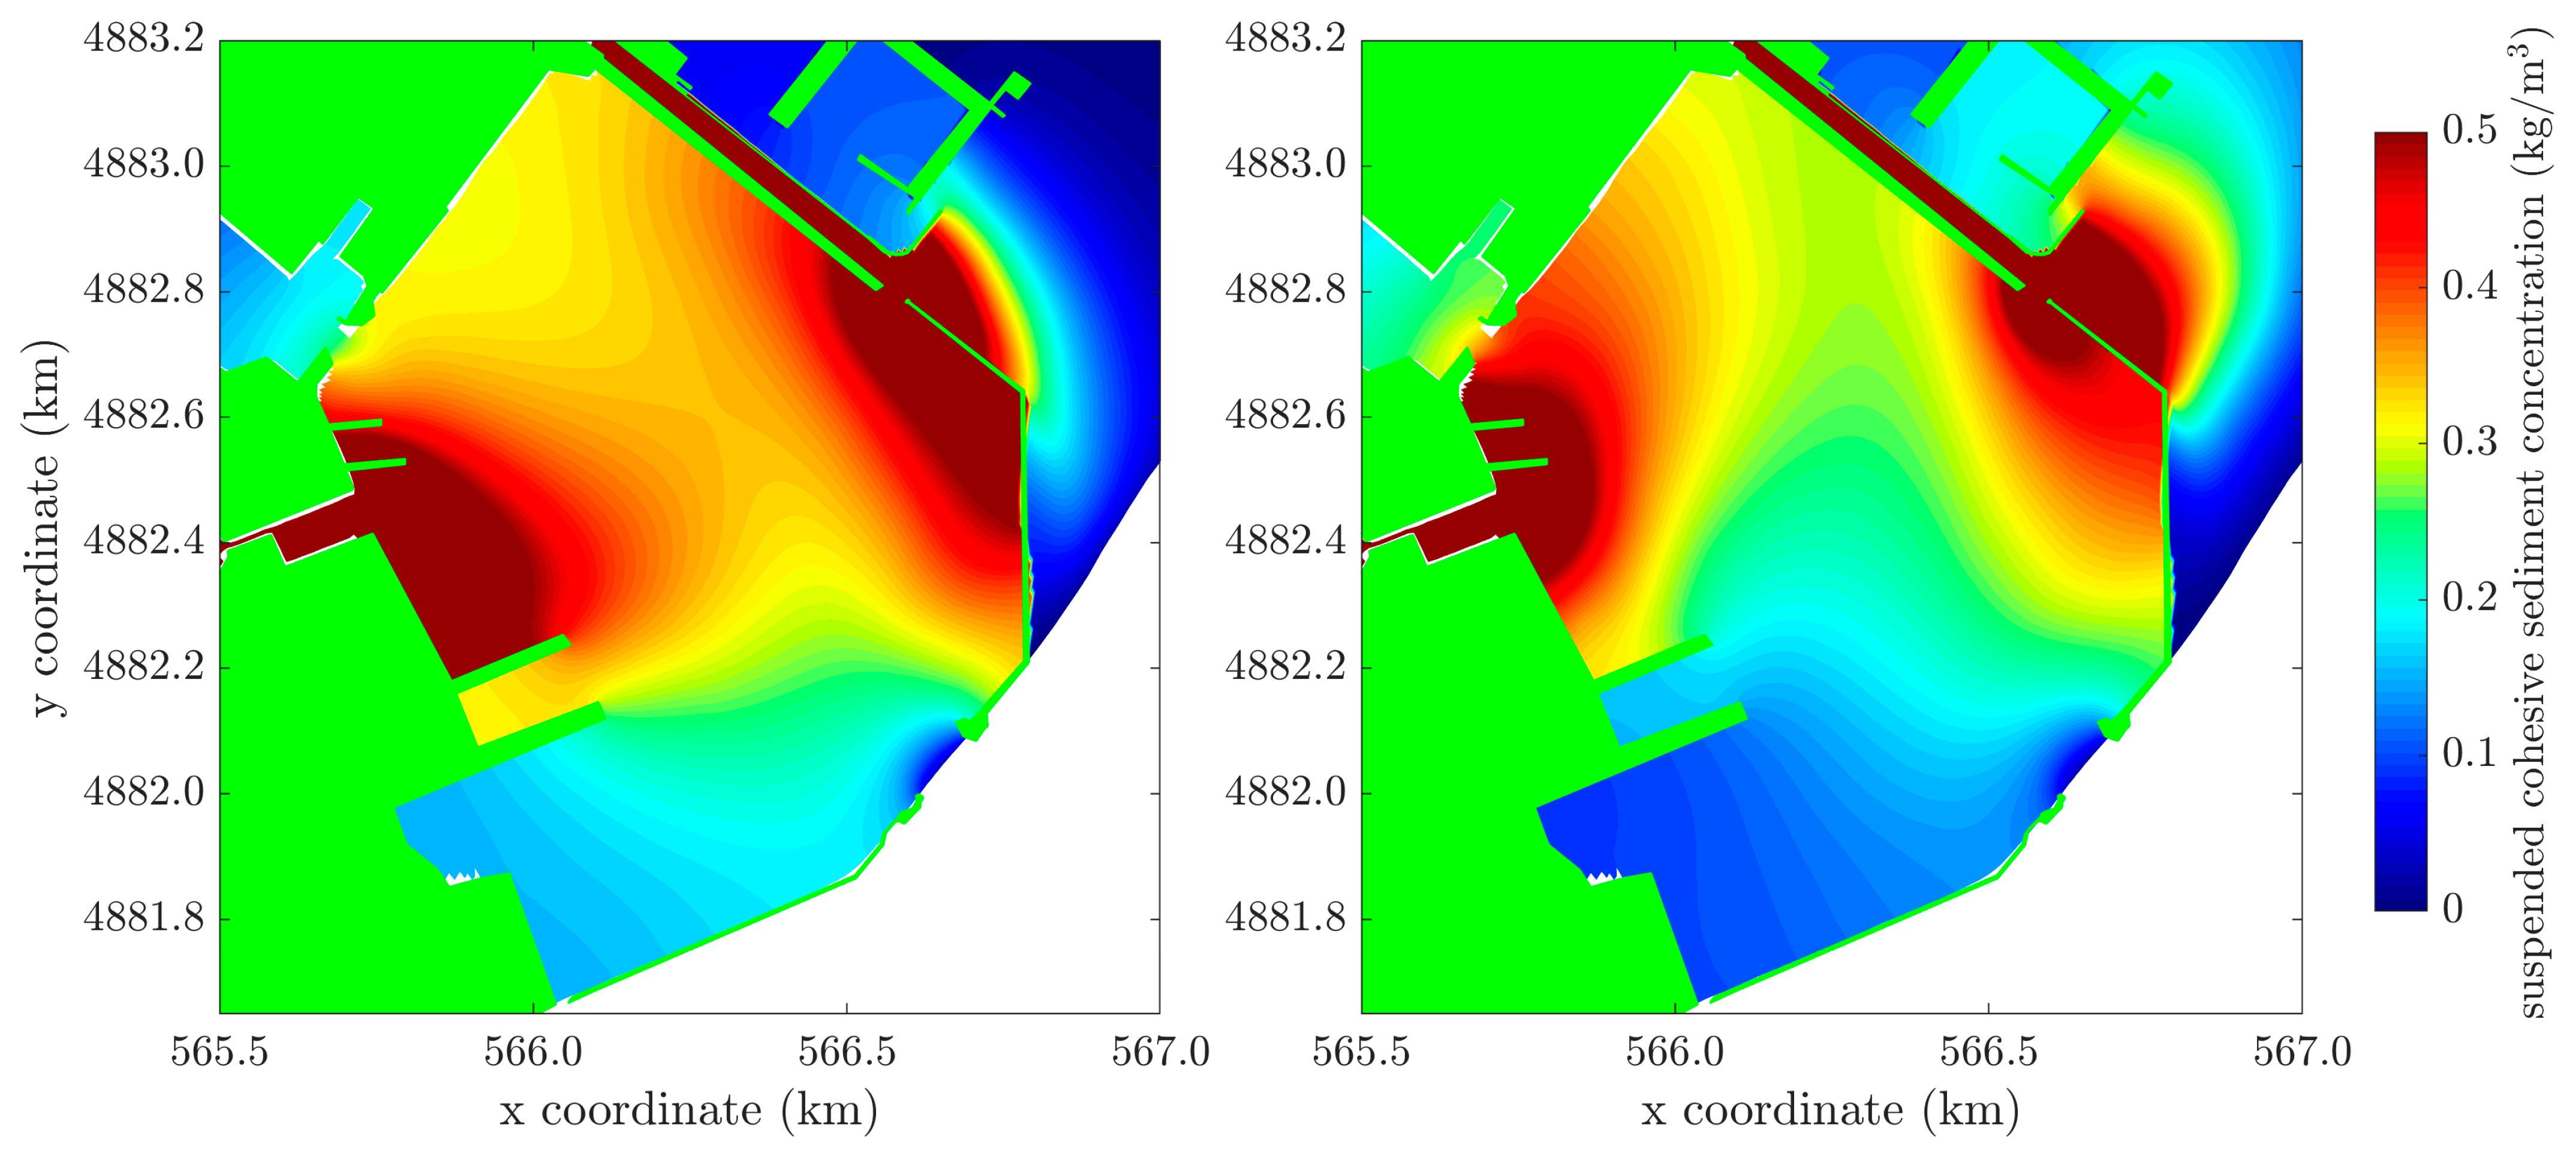
Figure 8 shows that the CR and LR supplied cohesive material into the basin and triggered its suspension when peak discharges were reached. During the discharge fall stage, the input sediment tended to deposit, mainly in the areas of the rivers’ mouths. However, despite the large amount of sediment released in the Arsenale, the sedimentation maps, as shown in Figure 9, showed very low deposition rates of a maximum of 3 cm near the CR mouth. In addition, the different wind directions affected the sediment spreading, with the SSE wind pushing the sediments more to the northeastern side of the basin than the NNE wind.
3.2.3. Scenario 3 (TWR): Tide, Waves, Rivers’ Discharges, and Wind Implementation Scenario
The results of the TWR scenario were very similar to those of the TR scenario, confirming that the wave contribution was not very significant for the velocity field (Figure 10) and the suspension of the cohesive material (Figure 11). Figure 10 showed that the circulation patterns were the same as those of the TR scenario, but a weaker velocity was found in the area of the LR entrance, independently of the wind direction and the occurrence of the rivers’ discharges.
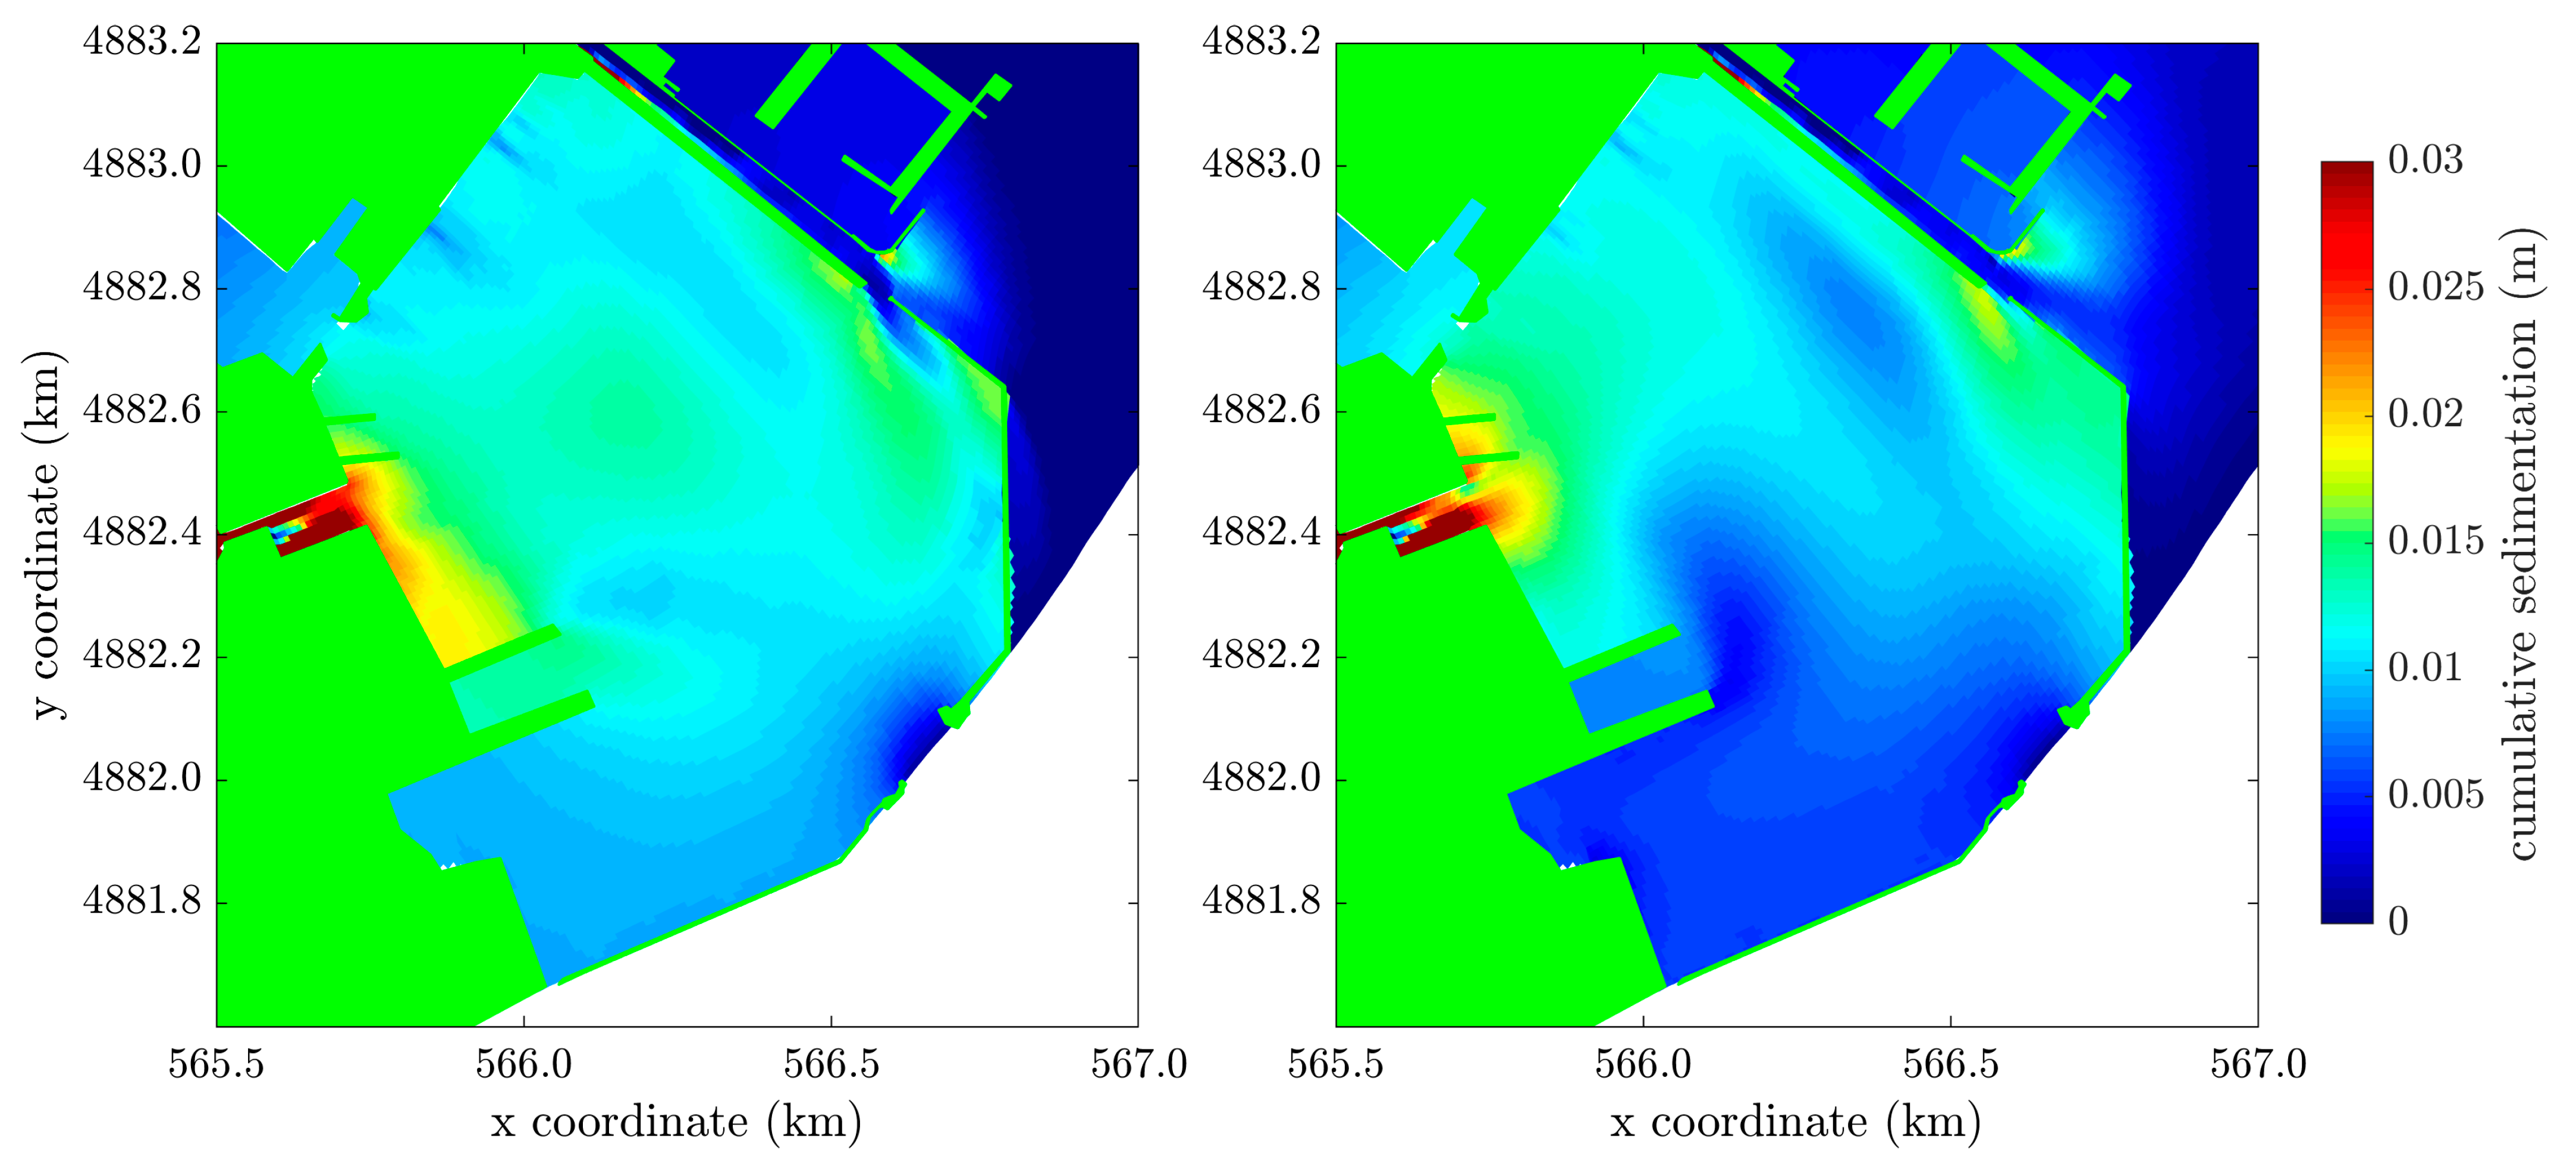
As for the TR scenario, the sedimentation maps, shown in Figure 12, highlighted a major deposition close to the rivers’ mouths, particularly at the CR mouth, and in the northern part of the Arsenale basin.
4. Discussion
The Arsenale represents a unique case study for many reasons. Firstly, it is located in the La Spezia gulf, an area sheltered by its natural shape and also protected by the outer breakwater. In addition, some breakwaters separate the military area of the Arsenale from the commercial and touristic zone, delimiting a closed basin. Secondly, another peculiarity of this site is the presence of two freshwater inlets, i.e., the LR, flowing close to the northern gate, and the CR, debouching directly into the basin; these ensure the water exchange between the sea and the basin. Thirdly, it is characterized by deep waters. For all these reasons, the water system the Arsenale harbour is placed in cannot be easily placed into the existing literature classification [3]. Hence, our work was addressed at comprehending the interaction of the different mechanisms induced by all the forcings occurring in such a complex environment.
Numerical simulations have confirmed that the main forcings responsible for the water and sediment circulation and exchanges at the Arsenale inlets are: (1) the wind, (2) the freshwater stream-induced flows, and (3) the tidal filling and emptying. Each of these forcings, as well as their related effects, are described and discussed in the following.
4.1. Wave Effect
The FUNWAVE simulations clearly showed that, despite the fact that the outer domain was forced by extreme wind waves associated with a 100-year return period, the wave heights in the Arsenale were very low due to the natural shape of the gulf of La Spezia and the breakwaters, which sheltered the area. Therefore, as expected, the influence of the waves was very weak compared to the other forcing analysed. The effect exerted by the waves could be clearly distinguished by comparing the TR and TWR scenarios, which differed only with regard to the wave implementation (which was neglected in the TR scenario). The flow patterns revealed that the velocities around the LR entrance and that of the LR jet were smaller in the TWR scenario (compare Figure 7 with Figure 10). The waves, albeit minimally, tended to oppose the LR discharge, slowing down its offshore spreading and favouring its propagation into the Arsenale.
Although the Arsenale configuration might be similar to that of an enclosed basin, and thus unlike that of stagnant waters or shallow lakes, here the effect of wind waves was found to be very weak. In shallow lakes, like the two marinas in Lake Loosdrecth studied by Winterwerp [3], or lagoons, like the Marano and Grado Lagoon [29] or the Venice Lagoon, which are characterized by stagnant and shallow waters, waves can resuspend sediments on the seabed in calm weather conditions. Conversely, in the Arsenale the sediment transport, in terms of resuspension and deposition, was not affected by the waves. This is due to the evolution of very small waves inside the basin as a result of the limited fetch of La Spezia Bay and of the Arsenale itself, which is constrained by the presence of the breakwaters, and also to the higher water depths characterizing the area. In fact, the TW scenario showed how the critical bed shear stress for erosion, due to tidal and wave forcing, was exceeded rarely and briefly, following the maximum velocities induced by the narrowing of the section of the LR entrance, in relation to the ebb tide (see Supplementary Materials). This implied that the forcing was not intense enough to stir up sediments on the seabed and to induce sediment transport processes.
4.2. Wind Effect
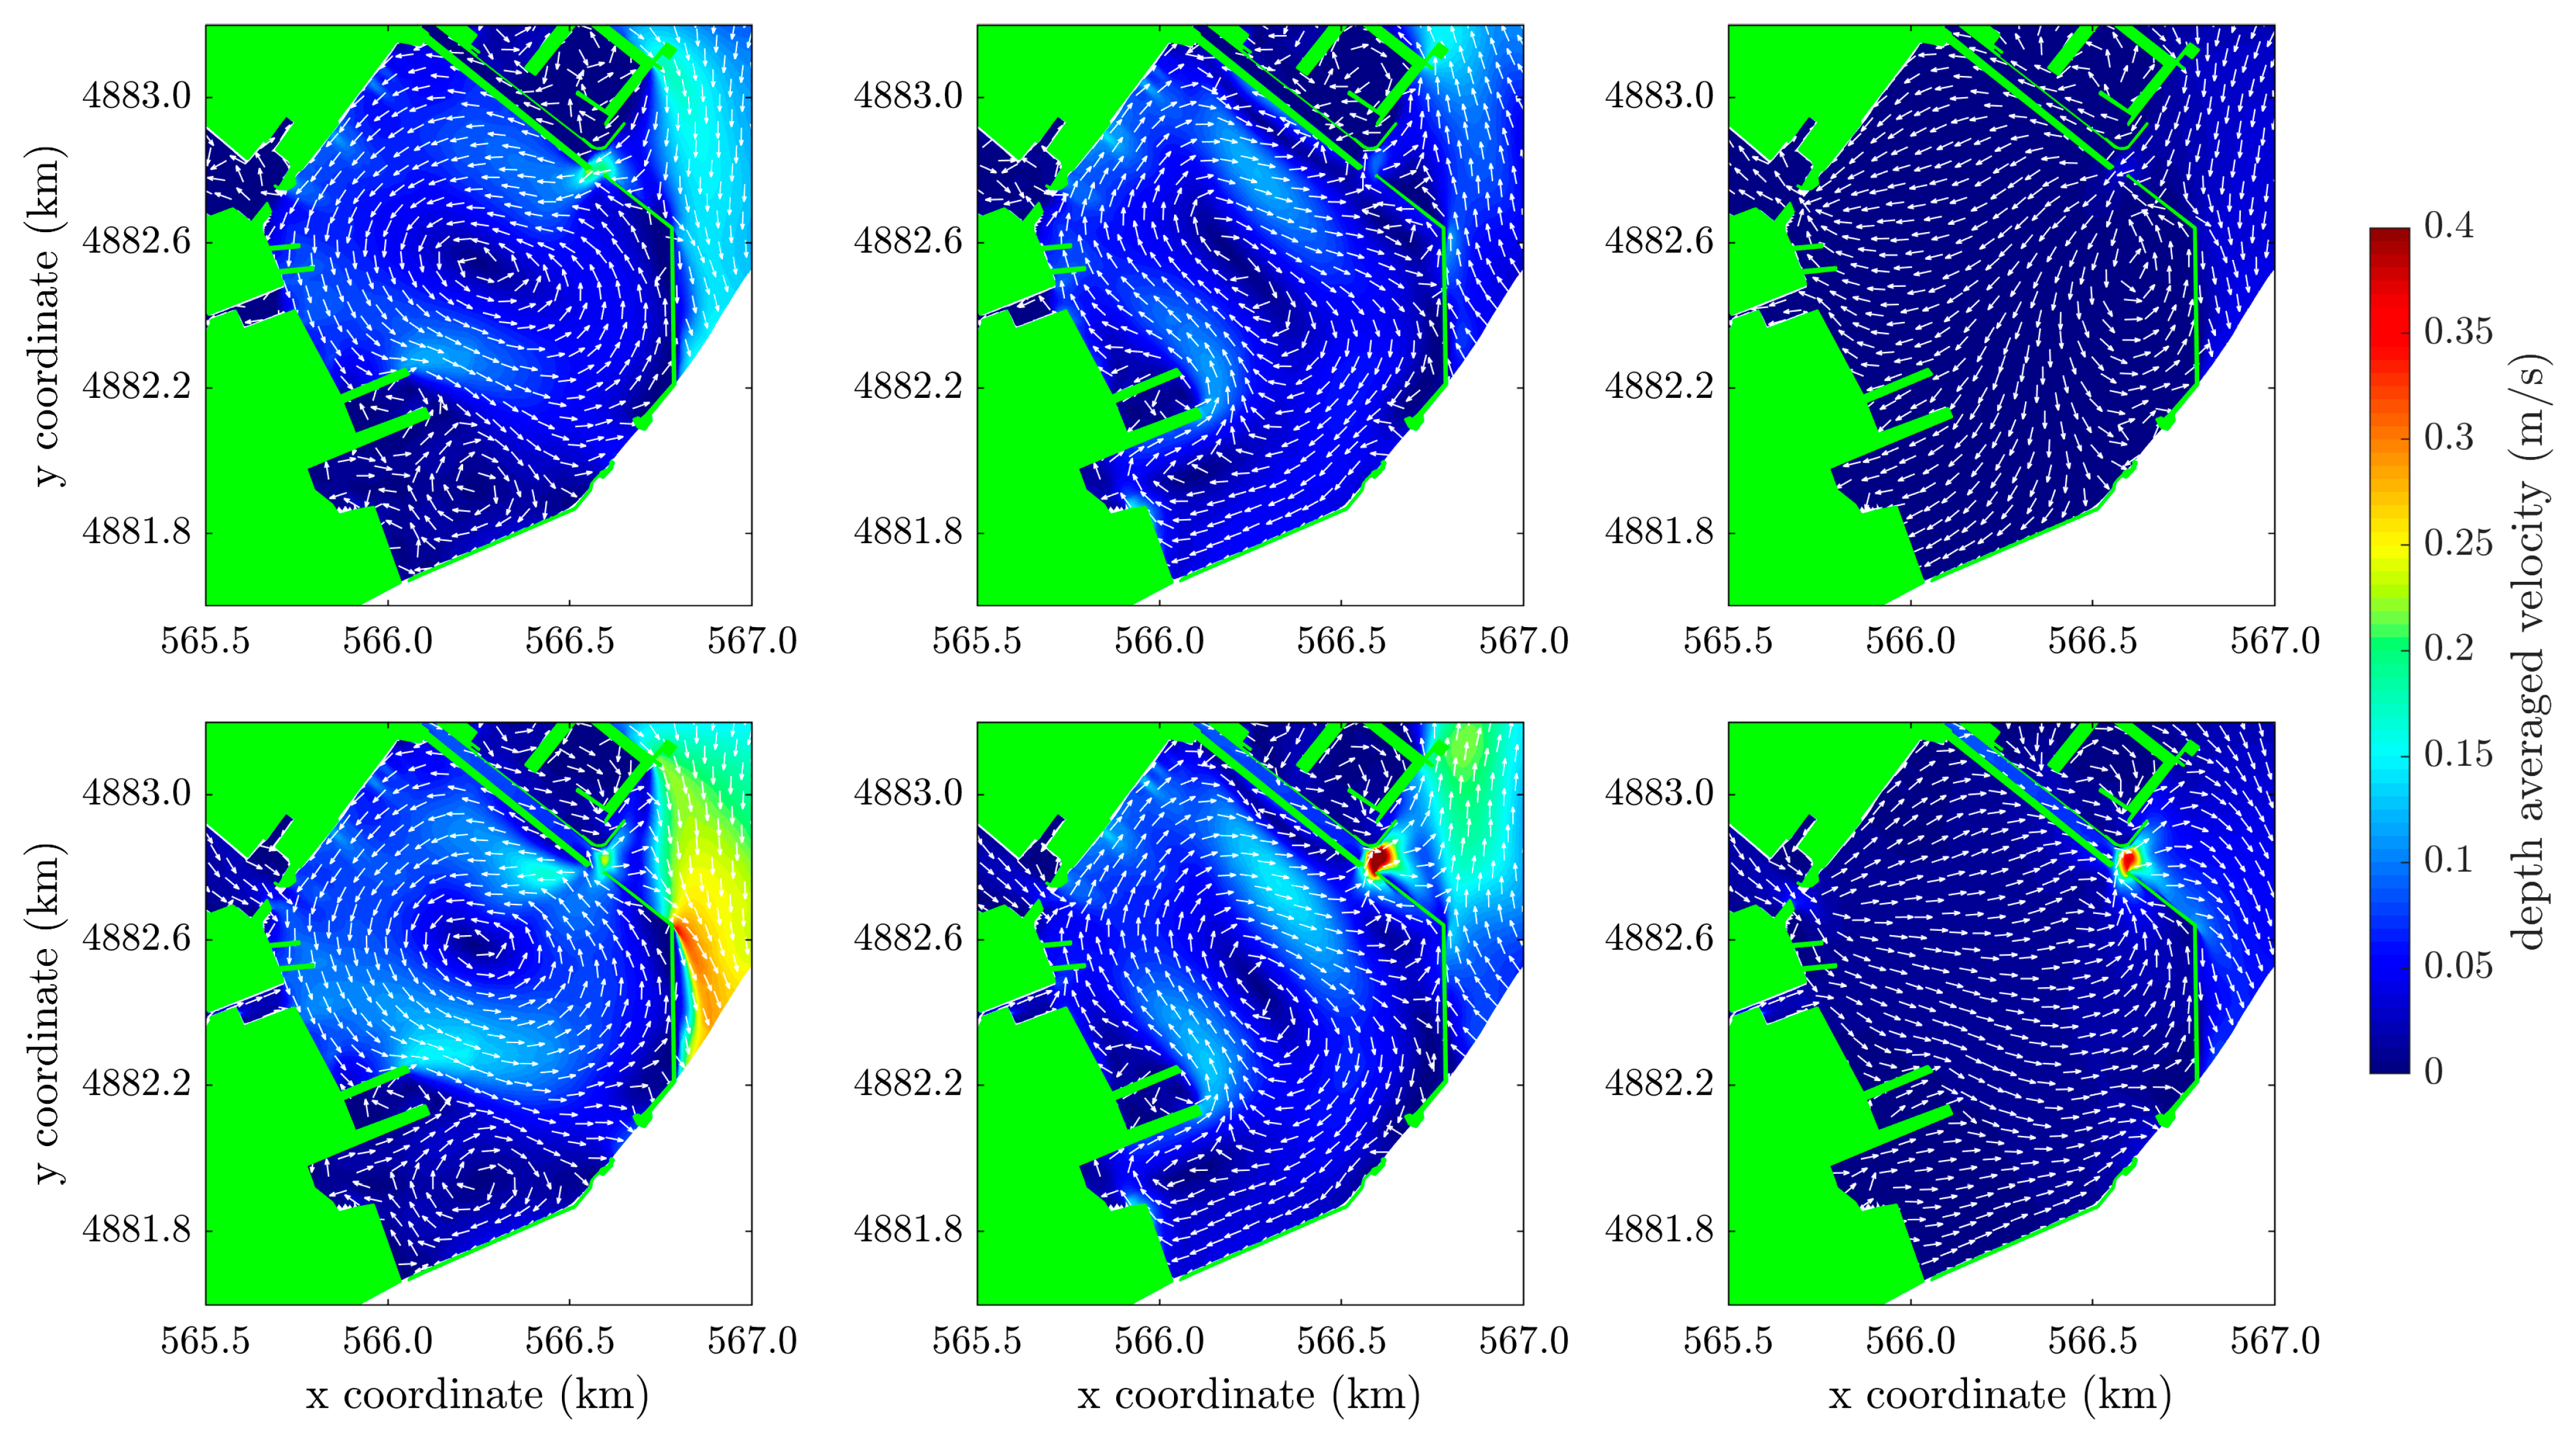
The results of the TW scenario plainly highlighted the role of the tide and the wind in a microtidal environment that is sheltered and characterized by a weak wave agitation. In closed basins, like shallow lakes or a lagoon harbour, the wind strongly affects the hydrodynamics [3,30]. We also observed that a semi-enclosed basin, protected by breakwaters like the Arsenale and characterized by higher water depths, had similar behaviour. To further confirm this, we ran an additional numerical simulation with no wind, forced only by the rivers’ discharges and tide. We did not include the waves since they had a secondary role in the observed processes. The results of this additional scenario confirmed the primary role of the wind: when no wind was blowing into the basin, no circulation cell appeared (third column of Figure 13). Moreover, the wind direction influenced the rotation of the main circulation: northeasterly winds generated a counterclockwise eddy, whilst a clockwise eddy developed under southeasterly winds (in first and second columns of Figure 13, respectively). As expected, the velocities inside the basin were one order of magnitude stronger in the presence of the wind forcing with a return period of 100 years. Neglecting it, the flow pattern was only influenced by the tide, with velocities directed toward the WSW/ESE, respectively, when the tide entered/exited the Arsenale. The top row of Figure 13 shows the circulation inside the Arsenale during the tidal filling. The tide entering the basin tended to create an anticlockwise vortex. As the circulation was already counterclockwise, as forced by the NNE wind, the vortex did not develop. When the tide decreased (bottom row of Figure 13), the water flowed out of the basin and the velocities increased, reaching maximum values at the LR entrance. Similar findings were also observed by De Marchis et al. [31] in the Augusta harbour (Sicily), which has a configuration very similar to that of the Arsenale, being sheltered by three breakwaters and connected to the open sea through two entrances.
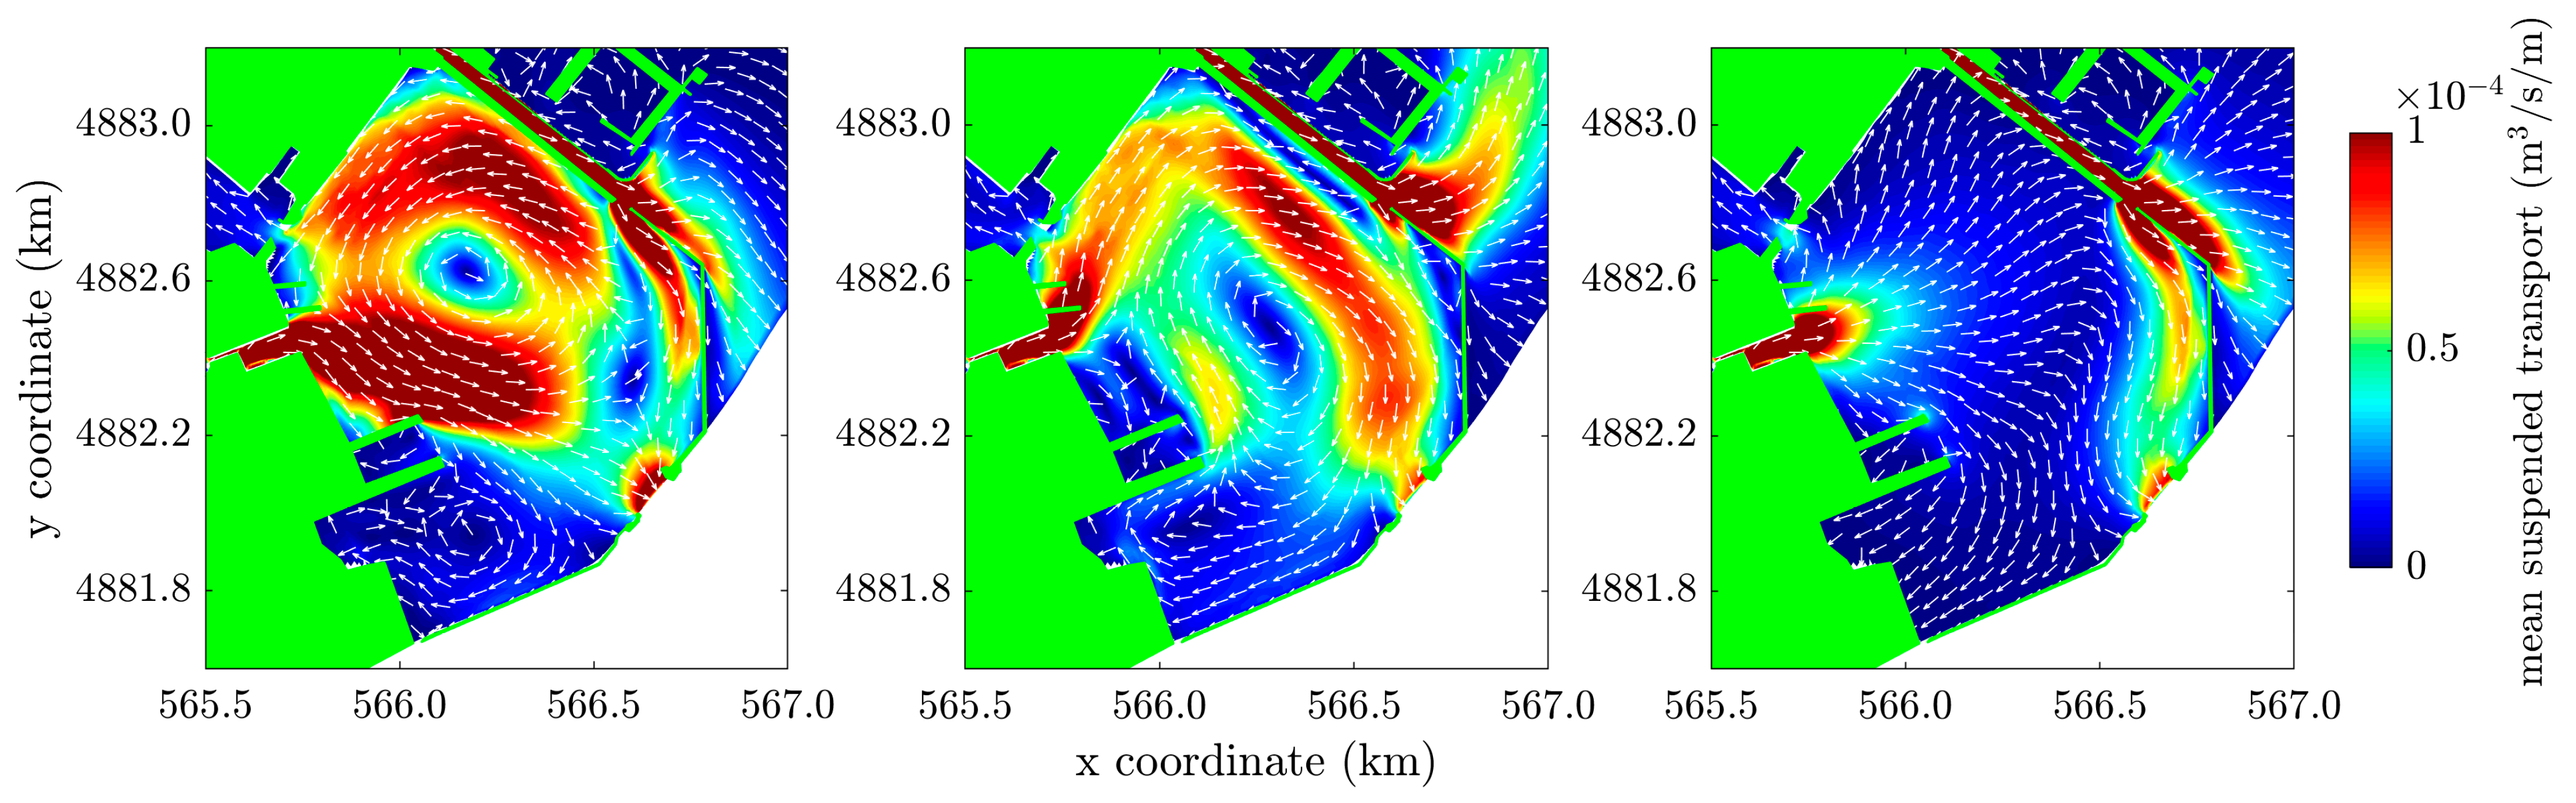
The mean suspended sediment transport, as shown in Figure 14, generally matched the hydrodynamic patterns triggered by the wind, i.e., the circulation cell (first and second panels). In addition, the influence of the two freshwater streams was clear and caused the largest sediment transport intensities. The NNE wind pushed the LR discharge inside the Arsenale more than the SSE wind, thus causing a larger sediment transport. For the case without wind, the sediments either flowed out of the main entrance of the Arsenale or deposited just outside of the CR (third panel of Figure 14). Moreover, all the panels of Figure 14 show that at the southern mouth of the Arsenale the sediment transport was large and directed toward the sea. This means that part of the sediment escaped the Arsenale, and this is the likely reason for the reduced amount of sedimentation. The deposition patterns were affected by the direction, with the SSE winds causing larger sediment accumulation in the northeastern part of the basin (compare, for example, the right and left panels of Figure 12).
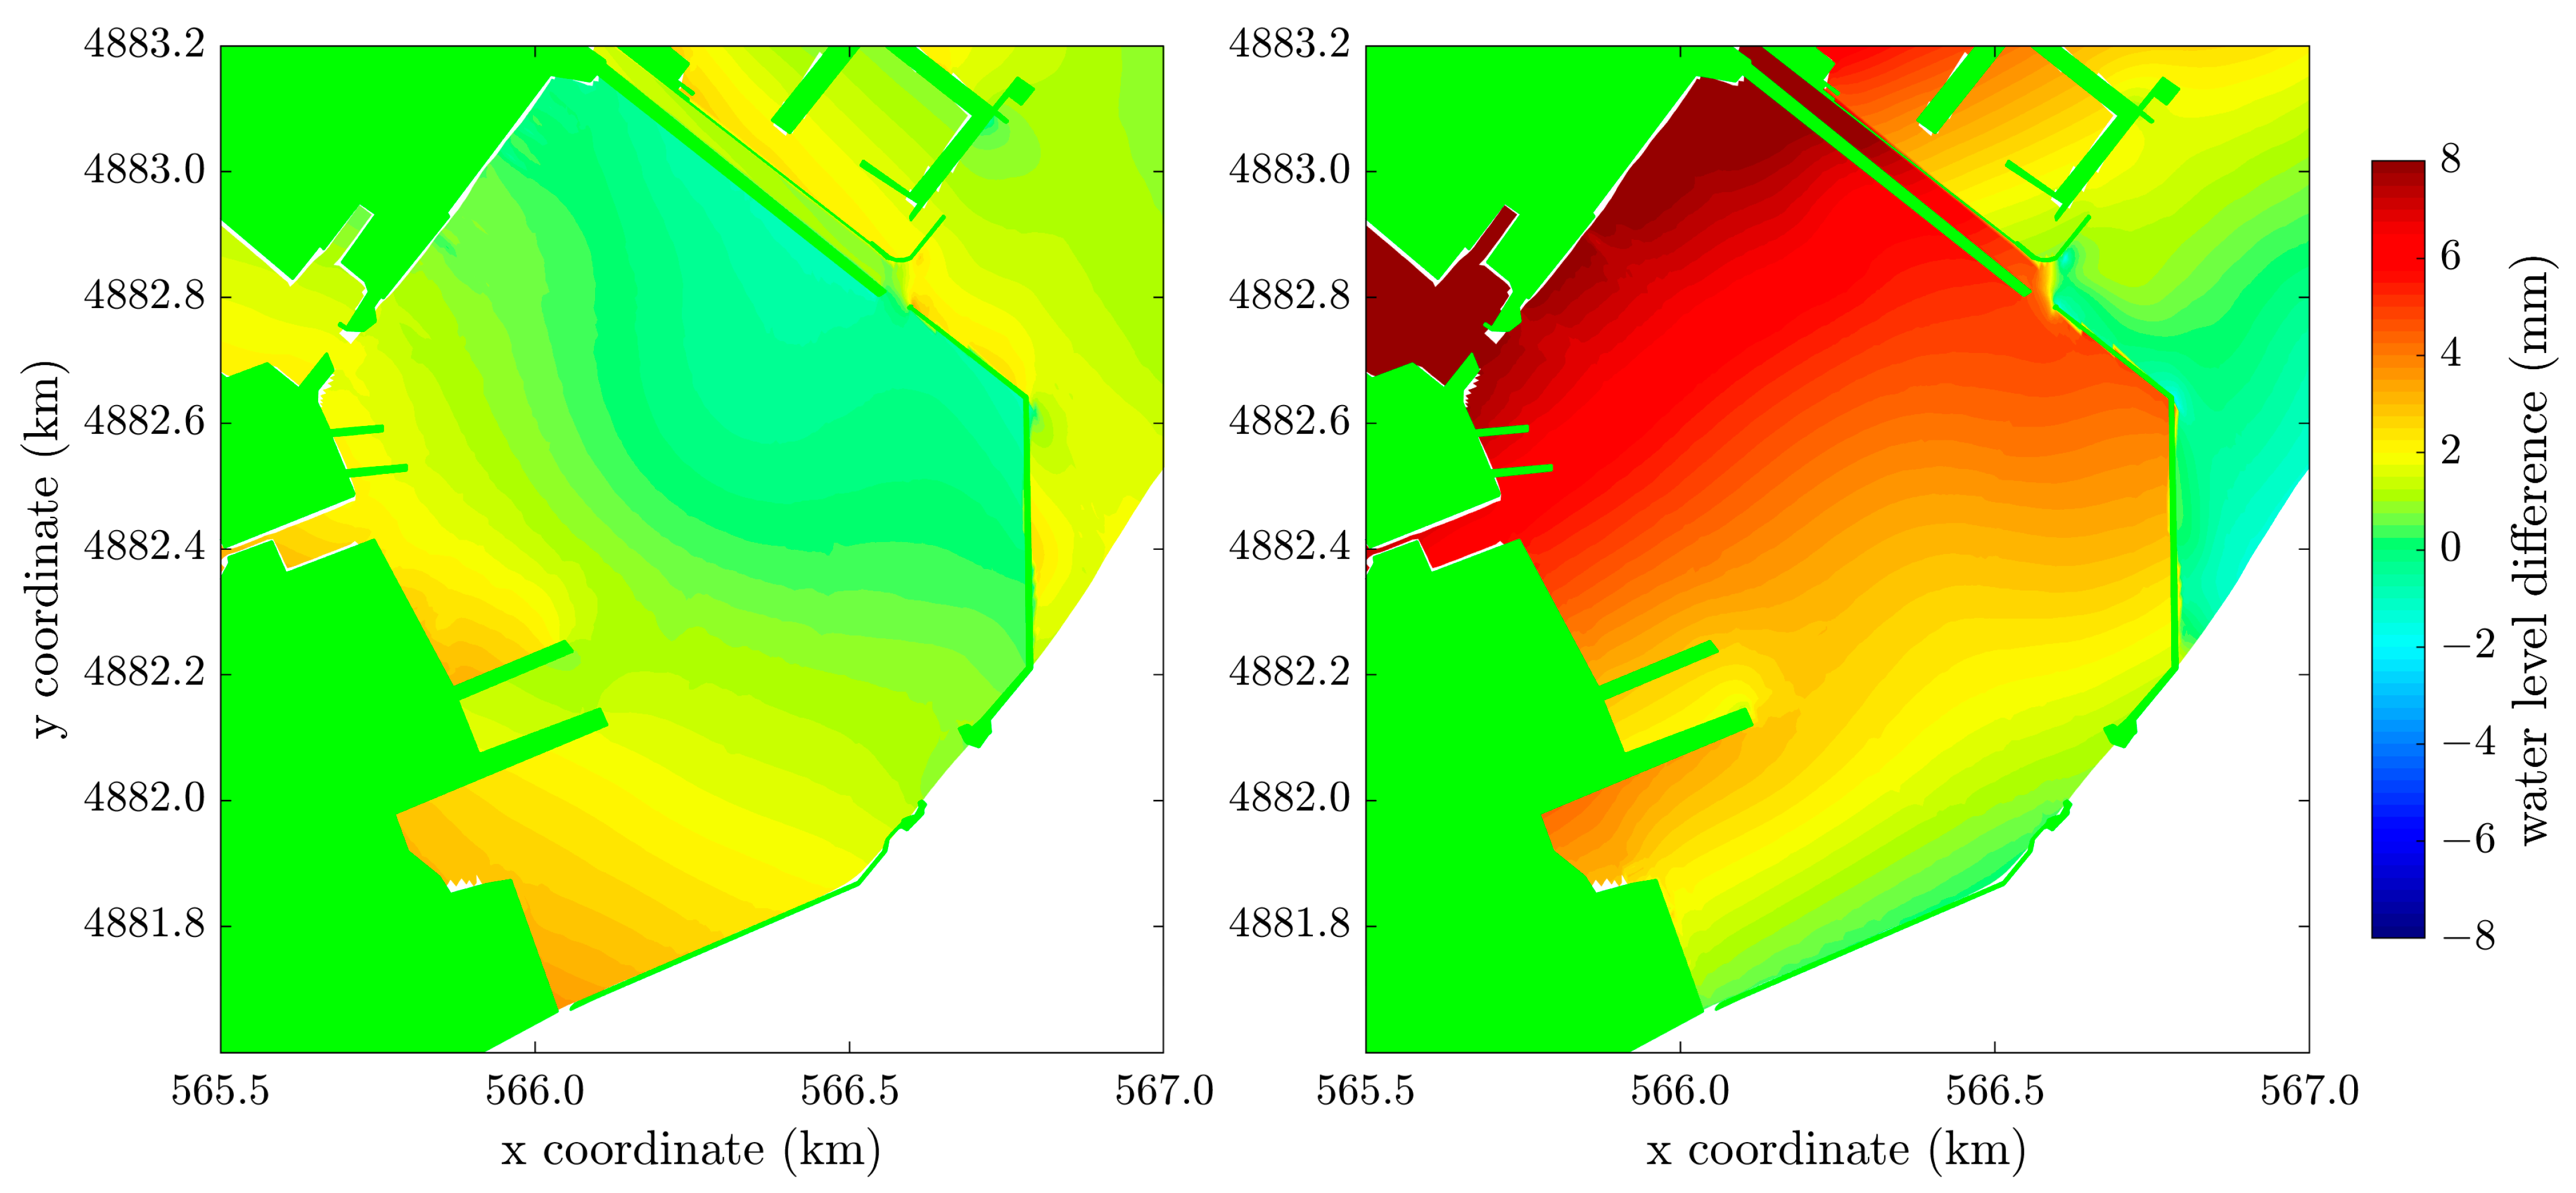
The water level range was also affected by the wind forcing. Figure 15 shows the water level difference between the scenarios carried out with and without wind, after 8 h of simulations, when the wind field was fully developed. Depending on the wind direction, an increase in water level was noticed in different areas of the Arsenale: a surge in the southwestern and northeastern part of the Arsenale was observed for the wind blowing from the NNE and SSE, respectively. The surge was larger for the SSE wind, both because of the higher wind speed and because the water was pushed to the northeast area of the Arsenale, where it tended to accumulate. Conversely, the NNE wind gave a smaller surge because the water could flow out of the main Arsenale mouth. Similar findings were also observed in the Venice Lagoon, which presented set-up and set-down values of 0.55 m and −0.45 m, respectively, under a strong northeast wind [32]. The surge amount for the Venice Lagoon was large because the wind blew along the major axis of the basin, which extends for around 50 km. Conversely, the Arsenale extends for about 1.5 km and 1.2 km in the north and east directions, respectively, thus limiting the fetch and wind effects. Moreover, the Lagoon is shallower than the Arsenale, with water depths of around 1 m, thus making the environment more subject to the wind action. Even though it was small, the surge created by the wind inside the Arsenale contributed to the global circulation cell, which was continuously fed by the steady wind action.
4.3. Tide Effect
When neglecting the contribution of external sources, i.e., the LR and CR freshwater discharges, the water exchange between the sea and the Arsenale was due mainly to the tidal cyclic pumping. During the flood flow, the water entered the Arsenale basin due to rising of the water level. Conversely, during the ebb flow, the water left the Arsenale basin because of the lowering of the water level.
When the contribution of the freshwater streams was included, the tidal currents interacted with the discharges, particularly with the LR. The simulations showed that the tidal filling of the basin enhanced the development of the LR-generated eddy at the entrance, while, conversely, the emptying of the basin retarded or impeded its generation. This behaviour was also observed in some laboratory experiments performed by Langedoen et al. [5].
The tide also determined the velocity oscillations, reflecting the tidal ebb and flood. After the tidal filling, the ebb phase forced the water inside the Arsenale basin to pass through the LR entrance, where, as a result of the section width reduction, maximum velocities were reached. At the LR entrance, even before the increasing of the rivers’ discharges, i.e., when the tide was the main forcing action, the bed shear stress exceeded the critical value for erosion, but for very short periods of time (see Supplementary Materials). This was not enough to force seabed sediment resuspension; therefore, the tide did not generate any sediment transport, probably due to the large ratio between the water depth in the Arsenale and the tidal excursion. Conversely, in very shallow microtidal environments, like that of the Venice Lagoon, where such a ratio is smaller, Carniello et al. [6] observed that the tide action caused sediment resuspension, with turbidity peaks occurring simultaneously with the ebb tide. Moreover, the author pointed out that the sediment that left the lagoon during the ebb phase of the tide did not enter again during the flood phase. Such tidal asymmetry was also observed in tidally dominated embayments, like that of the Boston harbour [33]: the velocity with which water and sediment leave the basin during the ebb phase is larger than the speed with which they enter at the flood phase, causing the flushing of the harbour. We also observed some “flushing”, but it was caused by the geometrical characteristics of the Arsenale: some of the sediment, released inside the basin by the rivers, escapes from the main entrance; this is probably one of the reasons for the small sedimentation rate modelled by the simulations.
4.4. Freshwater Stream Effect
The results of the TR and TWR scenarios were very similar and highlighted the contribution of the rivers’ discharges to the exchange mechanisms that characterize the Arsenale hydrodynamics.
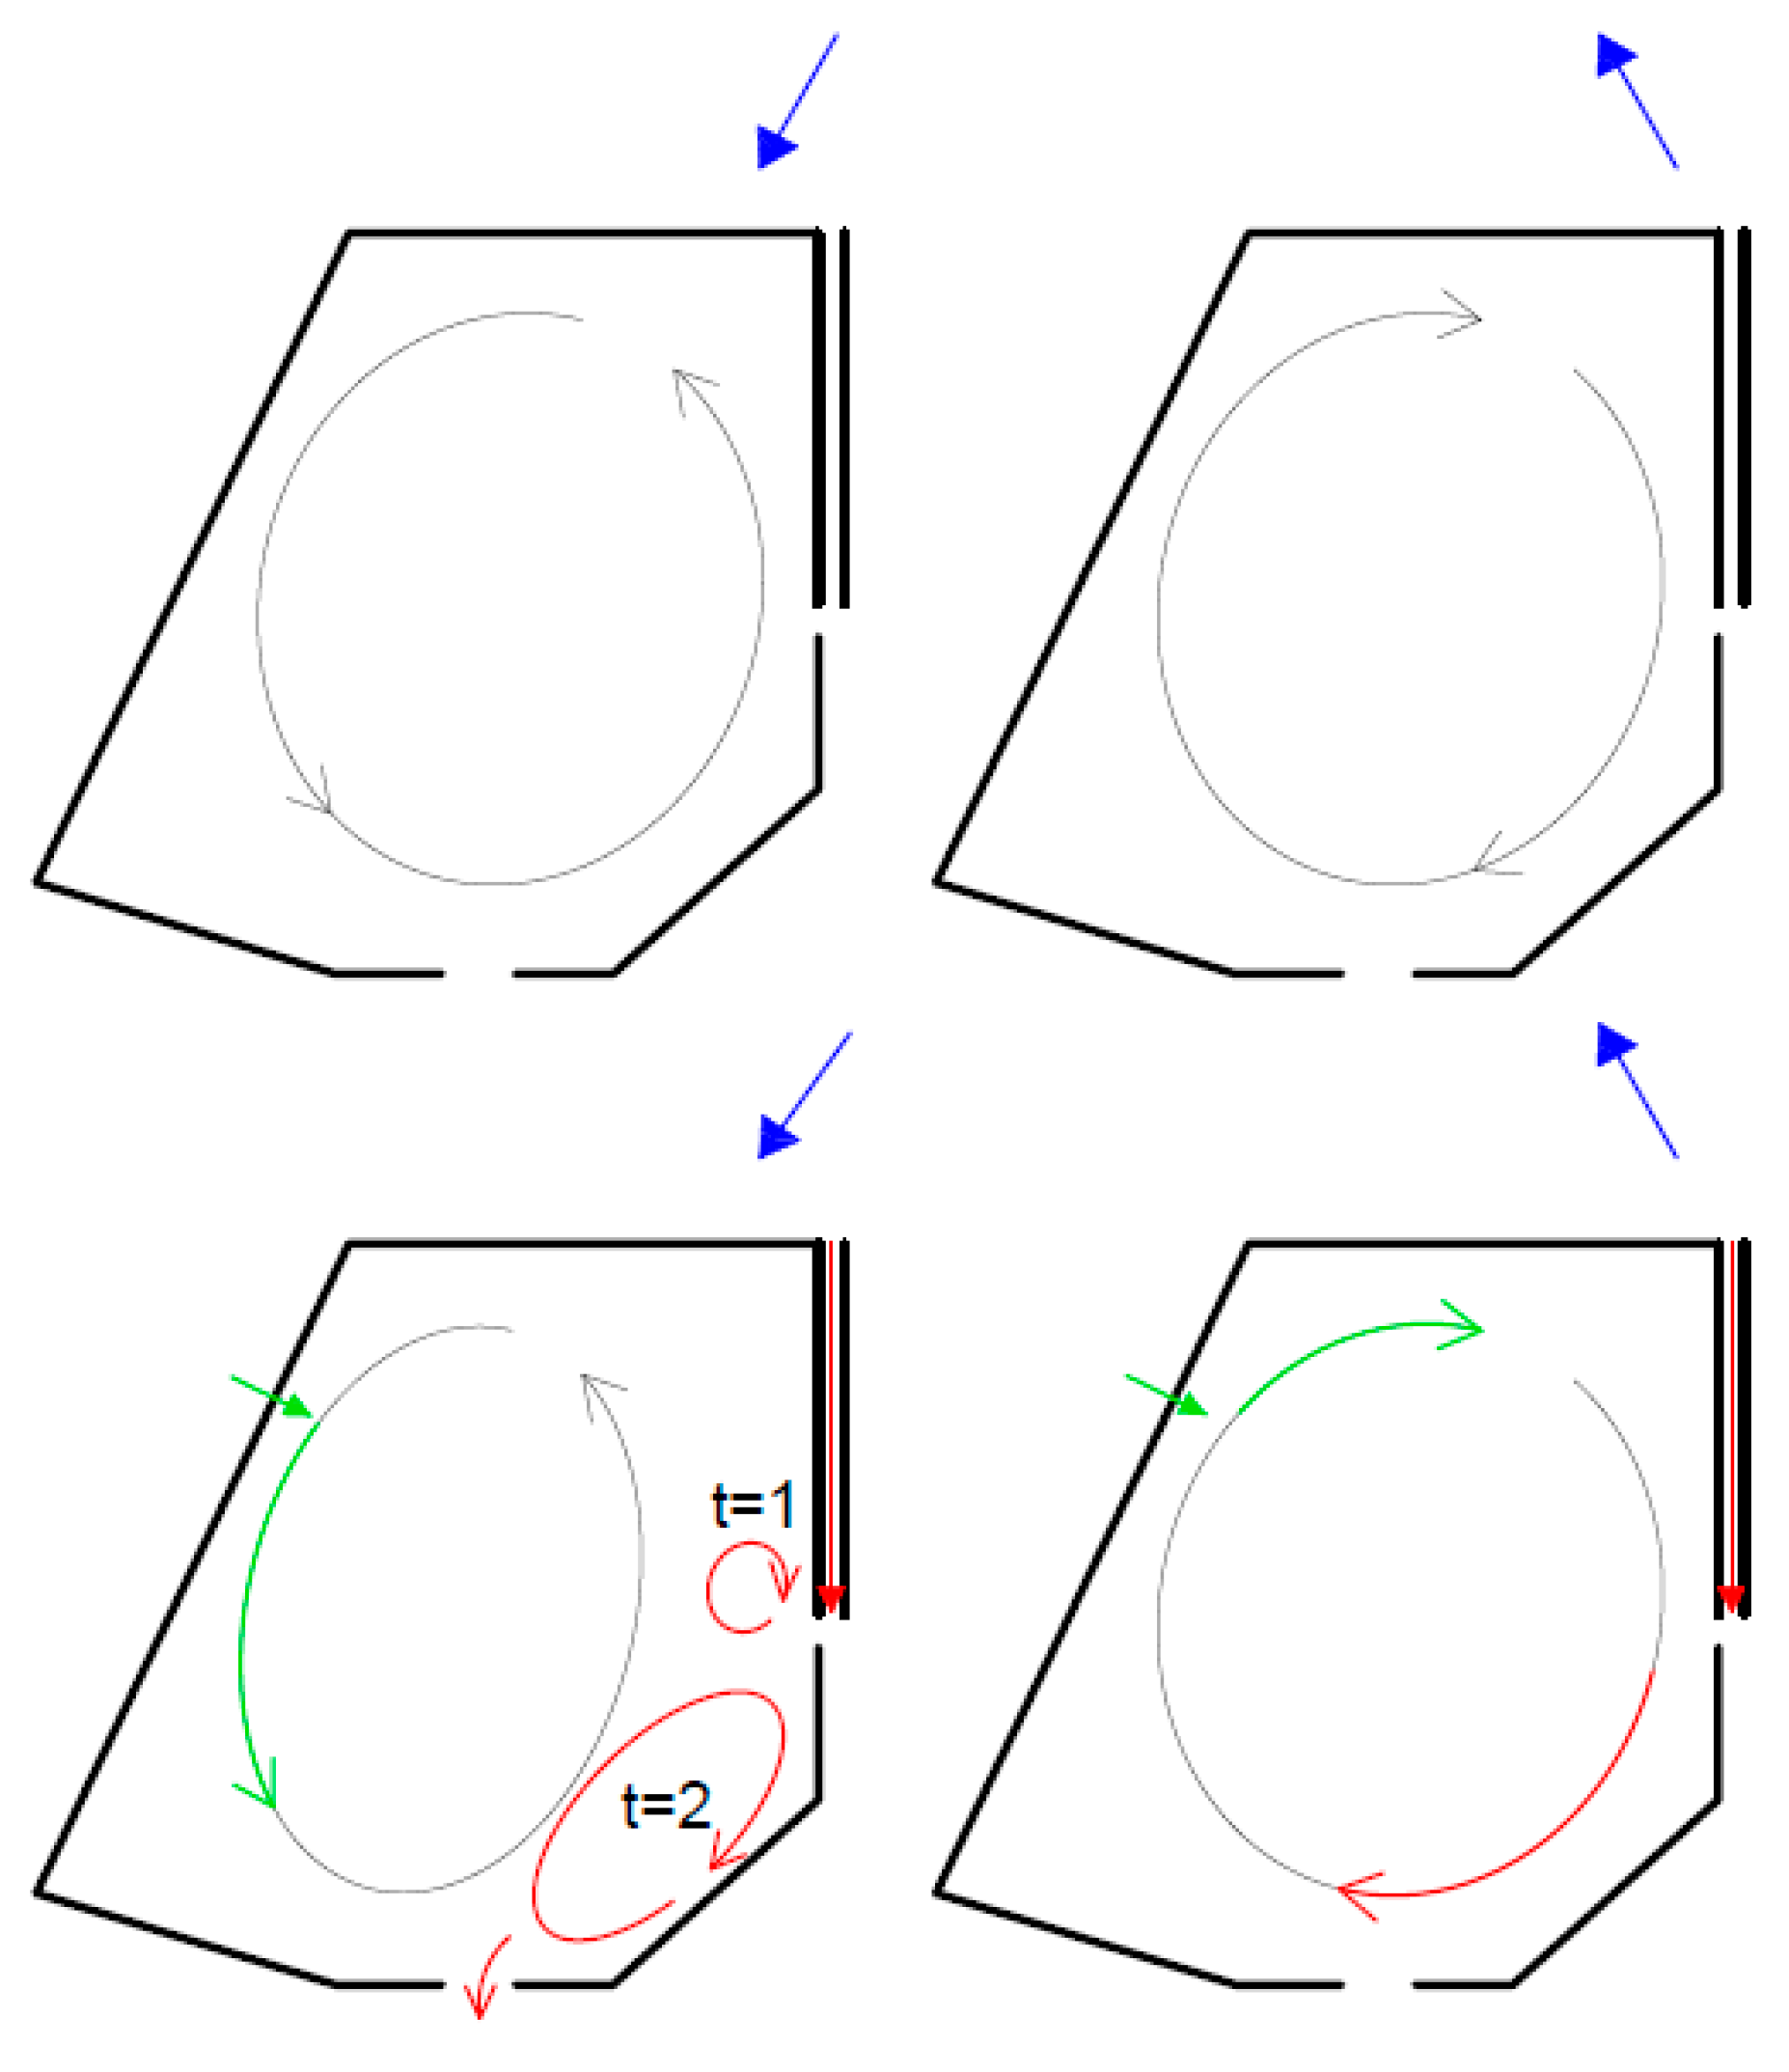
The LR significantly contributed to the horizontal entrainment process. The inflow angle between the river and the LR entrance is 90°. As already observed, before the occurrence of the river discharge, the NNE wind forced a large counterclockwise, quasi-steady eddy in the domain (upper left panel of Figure 16). During the LR discharge rise phase, which is a result of the shearing between the Arsenale and the LR flow (thus giving a clear mixing layer), a recirculating flow was driven. An eddy was generated at the upstream corner of the LR entrance, growing in size in the direction parallel to the river flow, reaching its maximum dimension at the discharge peak, while its centre was pushed to the southwestern part of the harbour. There, part of the flux was dispersed, flowing out through the southwestern mouth (red lines in bottom left panel of Figure 16). A similar evolution of the eddy was also observed in the work of Langedoen et al. [5] for a square closed basin, characterized by a ratio between the width of the harbour mouth and the harbour length of 2, with the river flowing along the harbour entrance. Then, the fall of the river discharge restored the initial situation. The CR, however, flowing directly into the Arsenale, contributed to the wind-induced circulation (green lines in the bottom left panel of Figure 16).
The SSE wind, on the other hand, induced a clockwise quasi-steady vortex extending to the whole domain (upper right panel of Figure 16). In contrast to the previous case, the increase in the rivers’ discharges did not generate eddies. In fact, both the LR and the CR joined the general circulation cell, contributing to its intensity (bottom right panel of Figure 16). Moreover, the SSE wind limited the entrance of LR flow into the Arsenale.
Our numerical simulations proved that the sediments were carried into the Arsenale by the rivers and advected by the rivers’ flows. Therefore, we can safely claim that the riverine inlets were mainly responsible for the supply of fine, cohesive material within the Arsenale basin. This trend was also confirmed in the work on the siltation of the Nowshahr port [11]. Here, the wind-driven circulation was so intense that it carried the sediments from the rivers’ mouths towards the entrance of Nowshahr port.
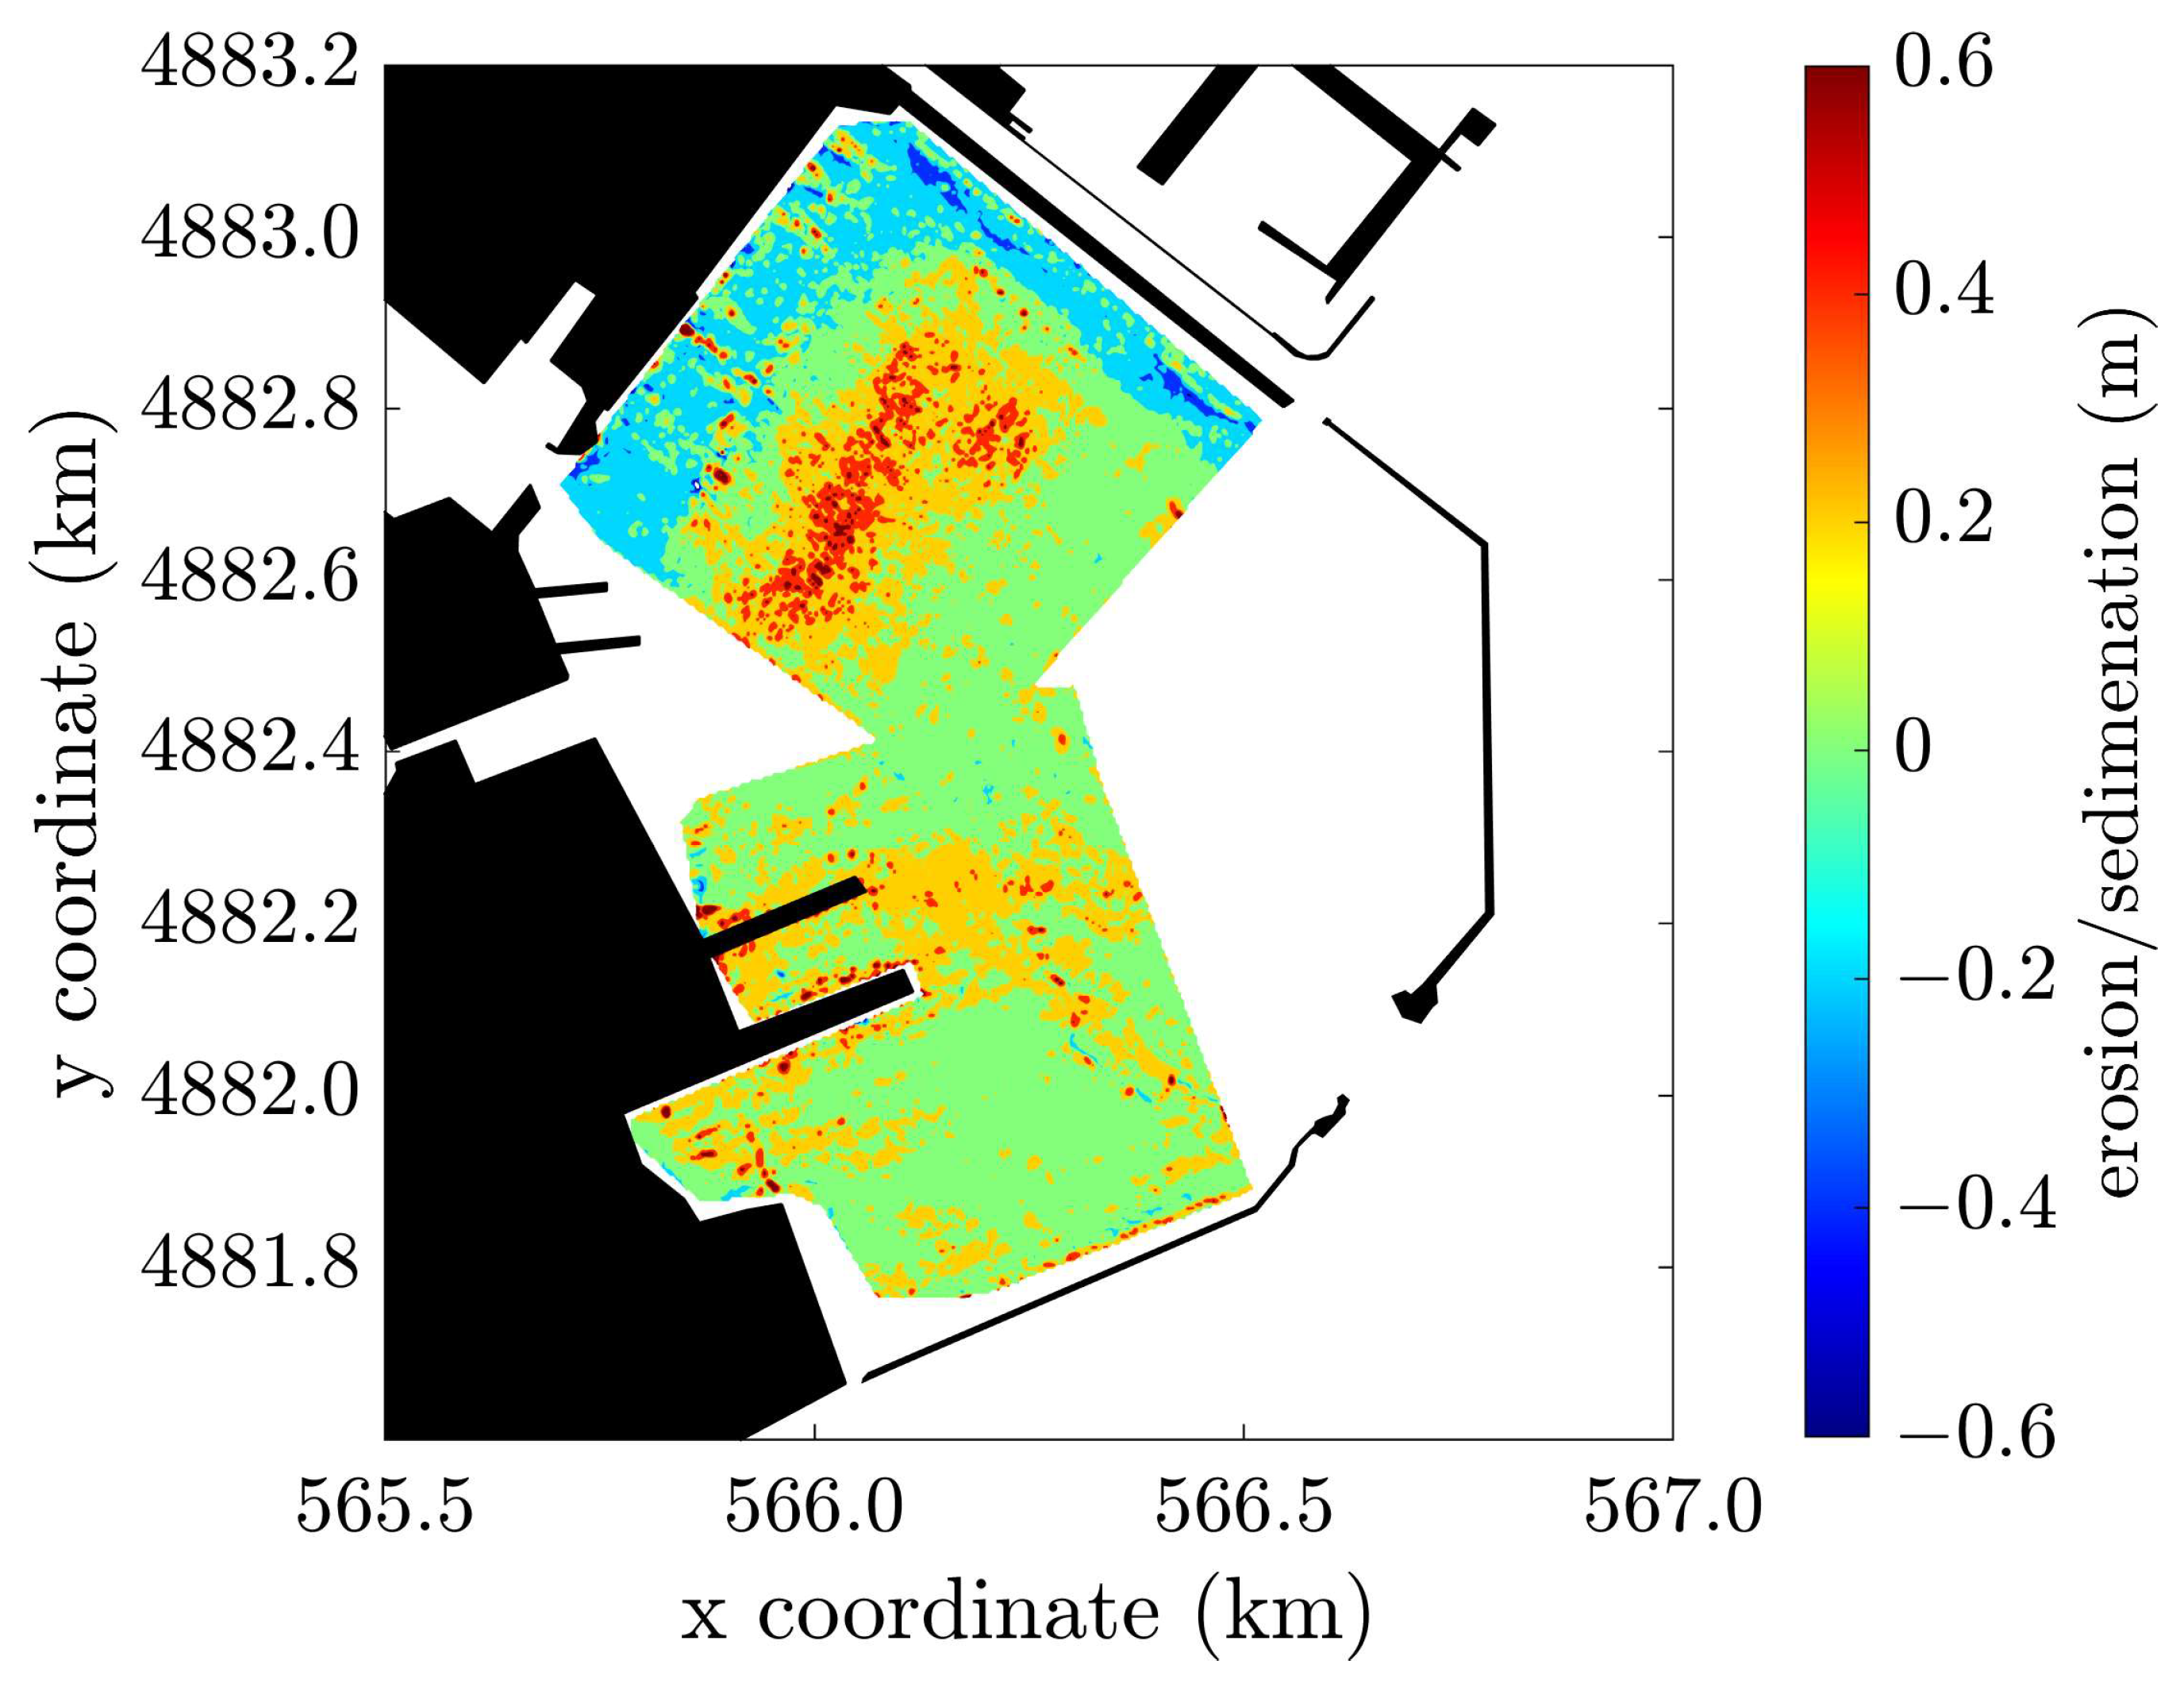
Unlike macrotidal harbour settings, where the largest amount of sediment could be brought into the basin by the flood tide [9], or wave-dominated environments, where wave-driven currents may cause sediment resuspension [7] and transport inside the harbour [8] in the Arsenale microtidal basin protected from waves, neither the tide nor the waves are capable of triggering sediment resuspension. The only forcing that erodes the riverbed and mobilizes the sediments is the river discharge. In fact, along the LR channel and in the area of the CR mouth, the critical bed shear stress for erosion progressively increased in response to the intensification of the rivers’ discharges (see Supplementary Materials). Despite the supply of sediment from the rivers, we found that the sedimentation rate in the Arsenale was not significant, reaching 3 cm at the most during the events analysed because a considerable portion of suspended sediments left the basin through the southern, main entrance. The comparison between two surveys carried out in 2013 and 2016 (Figure 17) confirmed that the deposition inside the Arsenale area is not so large, reaching 50 cm only at some locations in the innermost part of the basin, where the modelled sedimentation also occurred. The amount of accumulation that occurred in three years corresponds to an average of 15 cm per year, which is reasonably consistent with our simulation results, which showed a 3 cm deposition following a 100-year return period event.
5. Conclusions
We investigated the hydro-morphodynamic processes inside the Arsenale of La Spezia, one the most important military bases of the Italian Navy, by means of dedicated numerical simulations. The primary objective of this work was to assess how the physical processes evolving in the such an area, i.e., waves, tide, wind, and rivers’ discharges, could affect the hydro-morphodynamics of the Arsenale. In view of the strategic importance of the site, the results of this work are also useful in evaluating the risk of harbour siltation, which reduces the appropriate depth of the navigation channels and could affect the required full operativity of the harbour.
FUNWAVE and Delft3D numerical models were used, respectively, to describe the wave propagation from offshore to the Arsenale and for the study of the internal circulation and the sediment transport. The FUNWAVE results showed that extreme waves, characterized by a 100-year return period, were strongly damped by the concurrent presence of coastal islands and the large breakwater at the entrance of the gulf. Both of them were effective in sheltering the harbour area. As a result, the maximum modelled wave height inside the Arsenale was approximately around 0.03 m.
We then analysed three different scenarios to parametrically inspect the roles played by the different physical forcings, i.e., waves, the rivers’ actions, and their concurrent role. All the cases were forced by the tide and the typical winds occurring in this area, from the NNE and SSE.
The results revealed that the main forcing affecting the hydrodynamics inside the Arsenale was the wind, which generated some water surges in the northwestern or southwestern areas of the Arsenale for the NNE or SSE winds, respectively. This contributed to the formation of a circulation cell, whose sense of rotation depended on the wind direction. The discharges of the LR and CR modified the wind-induced velocity. The CR, debouching directly in the Arsenale, helped to increase the wind-driven eddy. On the other hand, the mixing layer at the LR entrance, triggered by the difference in the velocities inside the Arsenale and the LR current, determined the generation of an eddy, whose evolution matched the increase in and decay of the freshwater discharge. Moreover, its development was enhanced by the flood tide, whereas it was retarded during the ebb phase. Hence, the tide modulated the velocity field forced by the wind. Instead, the short waves had a very modest influence on the hydrodynamics.
The morphodynamics were largely controlled by the freshwater streams, which were fundamental in supplying sediments to the Arsenale, while the waves and tide were not strong enough to resuspend the seabed sediments. As for the hydrodynamic circulation, the sediment transport was also affected by the wind forcing, resulting in different deposition patterns between the NNE and SSE winds. Despite the small entity of sediment accumulation, the deposition patterns represent a helpful source of information for the definition of the areas where siltation is more likely to occur. Finally, the waves and the tide played a marginal role in both sediment transport and deposition. Therefore, this work suggested that, even when considering the combination of all the extreme forcings acting within the military basin, the Arsenale might not be affected by significant siltation. Further studies on local phenomena caused by anthropological factors, such as structural consolidation on the quays or vessel actions in low bed clearance conditions, in terms of propeller-induced scour, should be conducted to guarantee that the operativity of the basin is completely preserved.
To the best of the authors’ knowledge, the present study is one of the first to be specifically devoted to investigating the dynamics of flow and sediments in a unique semi-enclosed basin in an embayed, microtidal setting, and to also consider the role of freshwater streams. As embayed coastlines are rather common features in coastal microtidal contexts where marine actions (tide, waves) have moderate to low energy, the findings presented and discussed here may be applicable to harbours or sheltered coasts with similar environmental conditions. A more complete characterization of the exchange processes between the basin and its surrounding features, moreover, can be achieved by considering the physical and chemical processes that were neglected here due to the lack of data on for example, salinity-driven currents and the related sedimentation processes.
Supplementary Materials
The following supporting information can be downloaded at: https://www.mdpi.com/article/10.3390/w15162865/s1, Video S1: shear_NE.avi, Video S2: shear_SE.avi.
Author Contributions
C.C.: conceptualization, methodology, formal analysis, investigation, writing—original draft, visualization; A.B.: conceptualization, methodology, formal analysis, writing—review and editing, visualization; L.M.: conceptualization, methodology, writing—review and editing; S.C.: conceptualization, writing—review and editing, M.B.: conceptualization, writing—review and editing, supervision, funding acquisition. All authors have read and agreed to the published version of the manuscript.
Funding
This research was funded by the Italian Navy (Agreement No. 520 signed in date 16 June 2020).
Data Availability Statement
Not applicable.
Acknowledgments
This study was carried out during the PhD training at UNIVPM of Lieutenant Carola Colangeli. The Italian Navy is gratefully acknowledged for sponsoring such PhD training, in particular the Istituto Idrografico della Marina (IIM) and the Direzione del Genio Militare per la Marina of La Spezia, which have provided constant support to the related research activities. The authors would like also to thank the La Spezia Municipality and the Liguria Region for their contribution in offering valuable data.
Conflicts of Interest
The authors declare no conflict of interest.
References
- Van Schijndel, S.A.; Kranenburg, C. Reducing the siltation of a river harbour. J. Hydraul. Res. 1998, 36, 803–814. [Google Scholar] [CrossRef]
- Van Rijn, L.C. Harbour Siltation and Control Measures. 2016. Available online: http://www.leovanrijn-sediment.com/papers/Harboursiltation2012.pdf (accessed on 15 May 2023).
- Winterwerp, J.C. Reducing harbour siltation. I: Methodology. J. Waterw. Port Coast. Ocean Eng. 2005, 131, 258–266. [Google Scholar] [CrossRef]
- Booij, R. Metingen van Uitwisselingen Tussen Rivier en Haven; Rapport 9-86 voor Gemeentewerken; Rotterdam. 1986. Available online: http://resolver.tudelft.nl/uuid:9592f55b-f352-4b5d-9b81-9d2060a9c626 (accessed on 15 May 2023).
- Langendoen, E.J.; Kranenburg, C.; Booij, R. Flow patterns and exchange of matter in tidal harbours. J. Hydraul. Res. 1994, 32, 259–270. [Google Scholar] [CrossRef]
- Carniello, L.; Defina, A.; D’Alpaos, L. Modeling sand-mud transport induced by tidal currents and wind waves in shallow microtidal basins: Application to the Venice Lagoon (Italy). Estuar. Coast. Shelf Sci. 2012, 102, 105–115. [Google Scholar] [CrossRef]
- D’Alpaos, A.; Carniello, L.; Rinaldo, A. Statistical mechanics of wind wave-induced erosion in shallow tidal basins: Inferences from the Venice Lagoon. Geophys. Res. Lett. 2013, 40, 3402–3407. [Google Scholar] [CrossRef] [Green Version]
- Moghaddam, E.I.; Allahdadi, M.N.; Hamedi, A.; Nasrollahi, A. Wave-induced currents in the northern Gulf of Oman: A numerical study for Ramin Port along the Iranian coast. Am. J. Fluid Dyn. 2018, 8, 30–39. [Google Scholar] [CrossRef]
- Leys, V. 3D flow and sediment transport modelling at the reversing falls-Saint John Harbour, New Brunswick. In Proceedings of the OCEANS 2007, Vancouver, BC, Canada, 29 September–4 October 2007; IEEE: Piscataway, NJ, USA, 2007; pp. 1–16. [Google Scholar] [CrossRef]
- Lojek, O.; Goseberg, N.; Schlurmann, T. Projecting Hydro-Morphodynamic Impacts of Planned Layout Changes for a Coastal Harbor. J. Waterw. Port Coast. Ocean Eng. 2021, 147, 05021013. [Google Scholar] [CrossRef]
- Mahmoodi, A.; Lashteh Neshaei, M.A.; Mansouri, A.; Shafai Bejestan, M. Study of current-and wave-induced sediment transport in the Nowshahr Port entrance channel by using numerical modeling and field measurements. J. Mar. Sci. Eng. 2020, 8, 284. [Google Scholar] [CrossRef] [Green Version]
- Dunn, R.J.; Zigic, S.; Burling, M.; Lin, H.H. Hydrodynamic and sediment modelling within a macro tidal estuary: Port Curtis Estuary, Australia. J. Mar. Sci. Eng. 2015, 3, 720–744. [Google Scholar] [CrossRef] [Green Version]
- Van Maren, D.S.; Winterwerp, J.C.; Decrop, B.; Wang, Z.B.; Vanlede, J. Predicting the effect of a current deflecting wall on harbour siltation. Cont. Shelf Res. 2011, 31, S182–S198. [Google Scholar] [CrossRef]
- Biochemie Lab, S.r.L.; PH, S.r.L.; Polaris, S.r.L. Intervento di Caratterizzazione Ambientale dei Fondali Presso Specchi Acquei in uso alla M.M.–La Spezia. 2005. [Google Scholar]
- Hydrodata, S.p.A. Studio Idrologico e Idraulico per la Definizione delle Fasce di Esondazione dei Principali Torrenti, Fossi e Canali Ricadenti nel Comune della Spezia. 2021. [Google Scholar]
- Korres, G.; Ravdas, M.; Zacharioudaki, A.; Denaxa, D.; Sotiropoulou, M. Mediterranean Sea Waves Reanalysis (CMEMS Med-Waves, MedWAM3 System) (Version 1) Set; Copernicus Monitoring Environment Marine Service (CMEMS): Ramonville-Saint-Agne, France, 2021. [Google Scholar] [CrossRef]
- Consorzio Intecno—DHI. Integrazioni del 17/07/2015—Studi di Idrodinamica nel Golfo della Spezia—Studio Idrodinamico e dei Processi Diffusivi e Dispersivi nello Specchio Acqueo Interno al Golfo della Spezia—Rapporto Tecnico. 2015. Available online: https://va.mite.gov.it/File/Documento/139154 (accessed on 15 May 2023).
- Shi, F.; Kirby, J.T.; Harris, J.C.; Geiman, J.D.; Grilli, S.T. A high-order adaptive time-stepping TVD solver for Boussinesq modeling of breaking waves and coastal inundation. Ocean Model. 2012, 43, 36–51. [Google Scholar] [CrossRef]
- Brocchini, M. A reasoned overview on Boussinesq-type models: The interplay between physics, mathematics and numerics. Proc. R. Soc. A Math. Phys. Eng. Sci. 2013, 469, 20130496. [Google Scholar] [CrossRef] [PubMed]
- Deltares. Delft3D-FLOW User Manual. Deltares, The Netherlands. 2023. Available online: https://oss.deltares.nl/(deltares.nl) (accessed on 15 May 2023).
- De Goede, E.D. Historical overview of 2D and 3D hydrodynamic modelling of shallow water flows in the Netherlands. Ocean Dyn. 2020, 70, 521–539. [Google Scholar] [CrossRef]
- Deltares. Delft3D-WAVE User Manual. Deltares, The Netherlands. 2023. Available online: https://oss.deltares.nl/ (accessed on 15 May 2023).
- Van der Wegen, M. Modeling Morphodynamic Evolution in Alluvial Estuaries; CRC Press: Boca Raton, FL, USA, 2010. [Google Scholar]
- Guan, W.B.; Wolanski, E.; Dong, L.X. Cohesive sediment transport in the Jiaojiang River estuary, China. Estuar. Coast. Shelf Sci. 1998, 46, 861–871. [Google Scholar] [CrossRef]
- Lopes, J.F.; Dias, J.M.; Dekeyser, I. Numerical modelling of cohesive sediments transport in the Ria de Aveiro lagoon, Portugal. J. Hydrol. 2006, 319, 176–198. [Google Scholar] [CrossRef]
- Lumborg, U.; Pejrup, M. Modelling of cohesive sediment transport in a tidal lagoon—An annual budget. Mar. Geol. 2005, 218, 1–16. [Google Scholar] [CrossRef]
- Pan, C.; Huang, W. Numerical modelling of suspended sediment transport affected by tidal bore in Qiantang Estuary. J. Coast. Res. 2010, 26, 1123–1132. [Google Scholar] [CrossRef]
- Van Rijn, L.C. Literature Review of Critical Bed-Shear Stresses for Mud-Sand Mixtures. Technical Note. 2020. Available online: www.leovanrijn-sediment.com (accessed on 15 May 2023).
- Petti, M.; Bosa, S.; Pascolo, S. Lagoon sediment dynamics: A coupled model to study a medium-term silting of tidal channels. Water 2018, 10, 569. [Google Scholar] [CrossRef] [Green Version]
- Bosa, S.; Petti, M.; Pascolo, S. Improvement in the sediment management of a lagoon harbor: The case of Marano lagunare, Italy. Water 2021, 13, 3074. [Google Scholar] [CrossRef]
- De Marchis, M.; Freni, G.; Napoli, E. Three-dimensional numerical simulations on wind-and tide-induced currents: The case of Augusta Harbour (Italy). Comput. Geosci. 2014, 72, 65–75. [Google Scholar] [CrossRef] [Green Version]
- Zecchetto, S.; Umgiesser, G.; Brocchini, M. Hindcast of a storm surge induced by local real wind fields in the Venice Lagoon. Cont. Shelf Res. 1997, 17, 1513–1538. [Google Scholar] [CrossRef]
- Signell, R.P.; Butman, B. Modeling tidal exchange and dispersion in Boston Harbor. J. Geophys. Res. Ocean 1992, 97, 15591–15606. [Google Scholar] [CrossRef]
Figure 1.
(a) La Spezia gulf with the following indicated: the Copernicus grid point for wave data (cyan pin); the ISPRA station for tide and wind data (green pin); the Arsenale and the shipping area (red square) and the main breakwater. The box in the top-right corner shows the location of La Spezia in Italy. (b) Close-up view of the Arsenale and the shipping area, with the yellow and magenta circles identifying the southern and northeastern entrances, respectively, and the green and cyan lines representing the Lagora and Caporacca rivers.

Figure 2.
Wave rose for the significant wave height ((left) panel) and wind rose ((right) panel).

Figure 3.
(a) Outer FUNWAVE domain; the red line represents the boundary where the waves were imposed; the blue rectangle highlights the inner domain shown in panel (b). The red dots represent the probes at which local modelled wave time series were extracted.
Figure 3.
(a) Outer FUNWAVE domain; the red line represents the boundary where the waves were imposed; the blue rectangle highlights the inner domain shown in panel (b). The red dots represent the probes at which local modelled wave time series were extracted.

Figure 4.
The computational domain of the Arsenale and shipping areas, used for the Delft3D simulations.
Figure 4.
The computational domain of the Arsenale and shipping areas, used for the Delft3D simulations.

Figure 5.
Wave propagation in the outer FUNWAVE model ((left) panel); water elevation in the inner FUNWAVE model ((right) panel).
Figure 5.
Wave propagation in the outer FUNWAVE model ((left) panel); water elevation in the inner FUNWAVE model ((right) panel).

Figure 6.
Modelled hydrodynamic circulation forced by NNE wind ((left) panel) and SSE wind ((right) panel). The arrows give the velocity direction, while the intensity is given by the colormap.
Figure 6.
Modelled hydrodynamic circulation forced by NNE wind ((left) panel) and SSE wind ((right) panel). The arrows give the velocity direction, while the intensity is given by the colormap.

Figure 7.
Modelled hydrodynamic circulation under NNE wind ((left) panel) and SSE wind ((right) panel) at the peak of the rivers’ discharges for the TR scenario. The arrows only indicate the velocities’ direction, while the intensity is given by the colormap.
Figure 7.
Modelled hydrodynamic circulation under NNE wind ((left) panel) and SSE wind ((right) panel) at the peak of the rivers’ discharges for the TR scenario. The arrows only indicate the velocities’ direction, while the intensity is given by the colormap.

Figure 8.
Modelled suspended sediment concentration for NNE ((left) panel) and SSE ((right) panel) winds at the peak of the rivers’ discharges for the TR scenario.
Figure 8.
Modelled suspended sediment concentration for NNE ((left) panel) and SSE ((right) panel) winds at the peak of the rivers’ discharges for the TR scenario.

Figure 9.
Modelled sedimentation patterns for NNE ((left) panel) and SSE ((right) panel) winds for the TR scenario.
Figure 9.
Modelled sedimentation patterns for NNE ((left) panel) and SSE ((right) panel) winds for the TR scenario.

Figure 10.
Modelled hydrodynamic circulation under NNE wind ((left) panel) and SSE wind ((right) panel) at the peak of the rivers’ discharges for the TWR scenario. The arrows only indicate the velocities’ direction, while the intensity is given by the colormap.
Figure 10.
Modelled hydrodynamic circulation under NNE wind ((left) panel) and SSE wind ((right) panel) at the peak of the rivers’ discharges for the TWR scenario. The arrows only indicate the velocities’ direction, while the intensity is given by the colormap.

Figure 11.
Modelled suspended sediment concentration for NNE ((left) panel) and SSE ((right) panel) winds at the peak of the rivers’ discharges for the TWR scenario.
Figure 11.
Modelled suspended sediment concentration for NNE ((left) panel) and SSE ((right) panel) winds at the peak of the rivers’ discharges for the TWR scenario.

Figure 12.
Modelled sedimentation patterns for NNE ((left) panel) and SSE ((right) panel) winds for the TWR scenario.
Figure 12.
Modelled sedimentation patterns for NNE ((left) panel) and SSE ((right) panel) winds for the TWR scenario.

Figure 13.
Modelled depth-averaged velocities for NNE wind ((first) column), SSE wind ((second) column), and no wind ((third) column) at tidal filling ((top) row) and emptying ((bottom) row).
Figure 13.
Modelled depth-averaged velocities for NNE wind ((first) column), SSE wind ((second) column), and no wind ((third) column) at tidal filling ((top) row) and emptying ((bottom) row).

Figure 14.
Mean suspended sediment transport for the TR scenario in case of NNE wind ((first) panel), SSE wind ((second) panel), and no wind ((third) panel). The intensity is given by the colour bar, while the direction is represented by the arrows.
Figure 14.
Mean suspended sediment transport for the TR scenario in case of NNE wind ((first) panel), SSE wind ((second) panel), and no wind ((third) panel). The intensity is given by the colour bar, while the direction is represented by the arrows.

Figure 15.
Water level differences between the cases with NNE wind and no wind ((left) panel) and the cases with SSE wind and no wind ((right) panel).
Figure 15.
Water level differences between the cases with NNE wind and no wind ((left) panel) and the cases with SSE wind and no wind ((right) panel).

Figure 16.
Sketch of the circulation for NNE wind ((left) panels) and for SSE wind ((right) panels), before and after the occurrence of the river discharges ((upper) and (bottom) rows), respectively. The blue, green, and red arrows indicate the wind direction, the CR flow, and the LR flow, respectively.

Figure 17.
Difference between the surveys performed within the Arsenale in 2013 and 2016. Negative and positive values represent erosion and deposition, respectively.
Figure 17.
Difference between the surveys performed within the Arsenale in 2013 and 2016. Negative and positive values represent erosion and deposition, respectively.


Table 1.
Parameters used for the simulations.
| Parameter (Unit Measure) | Range | Used Value |
|---|---|---|
| CDryB (kg/m3) | 200–500 | 500 |
| M (kg/m2/s) | 10−5–10−2 | 10−4 |
| τcr,e (N/m2) | 0.1–0.97 | 0.97 |
| τcr,d (N/m2) | 0.01–100 | 0.1 |
| ws (mm/s) | 0.025–0.25 | 0.25 |
Table 2.
Overview of the three scenarios and forcing actions activated in each.
| Tide (T) | Waves (W) | Rivers’ Discharges (R) | Wind | |
|---|---|---|---|---|
| Scenario 1 (TW) | Time series | Time series | From 30° N, V = 15 m/s and 150° N, V = 20 m/s | |
| Scenario 2 (TR) | Time series | Time series | From 30° N, V = 15 m/s and 150° N, V = 20 m/s | |
| Scenario 3 (TWR) | Time series | Time series | Time series | From 30° N, V = 15 m/s and 150° N, V = 20 m/s |
Disclaimer/Publisher’s Note: The statements, opinions and data contained in all publications are solely those of the individual author(s) and contributor(s) and not of MDPI and/or the editor(s). MDPI and/or the editor(s) disclaim responsibility for any injury to people or property resulting from any ideas, methods, instructions or products referred to in the content. |
© 2023 by the authors. Licensee MDPI, Basel, Switzerland. This article is an open access article distributed under the terms and conditions of the Creative Commons Attribution (CC BY) license (https://creativecommons.org/licenses/by/4.0/).
Share and Cite
MDPI and ACS Style
Colangeli, C.; Baldoni, A.; Melito, L.; Corvaro, S.; Brocchini, M. Harbour Hydro-Morphodynamics and Freshwater Discharges: The La Spezia Arsenale Case. Water 2023, 15, 2865. https://doi.org/10.3390/w15162865
AMA Style
Colangeli C, Baldoni A, Melito L, Corvaro S, Brocchini M. Harbour Hydro-Morphodynamics and Freshwater Discharges: The La Spezia Arsenale Case. Water. 2023; 15(16):2865. https://doi.org/10.3390/w15162865
Chicago/Turabian StyleColangeli, Carola, Agnese Baldoni, Lorenzo Melito, Sara Corvaro, and Maurizio Brocchini. 2023. "Harbour Hydro-Morphodynamics and Freshwater Discharges: The La Spezia Arsenale Case" Water 15, no. 16: 2865. https://doi.org/10.3390/w15162865
Note that from the first issue of 2016, this journal uses article numbers instead of page numbers. See further details here.