
Risk Assessment and Mapping of Flash Flood Vulnerable Zones in Arid Region, Fujairah City, UAE-Using Remote Sensing and GIS-Based Analysis
 , , ,
, , ,
Abstract
:1. Introduction
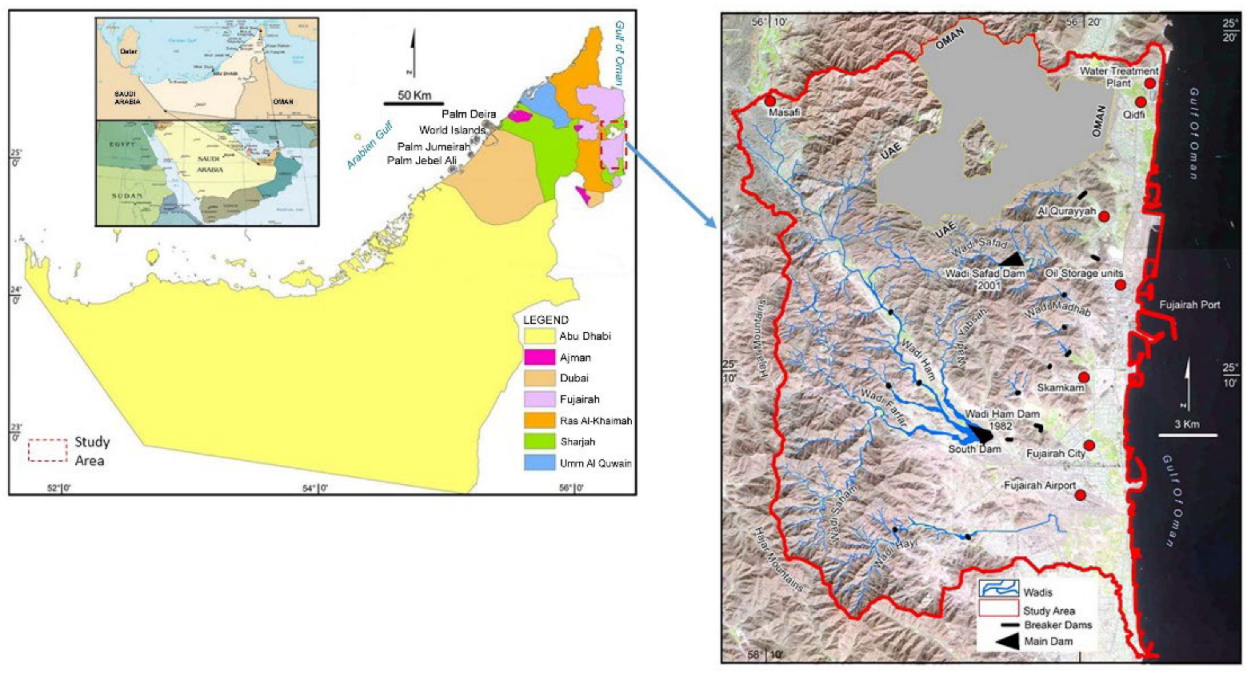
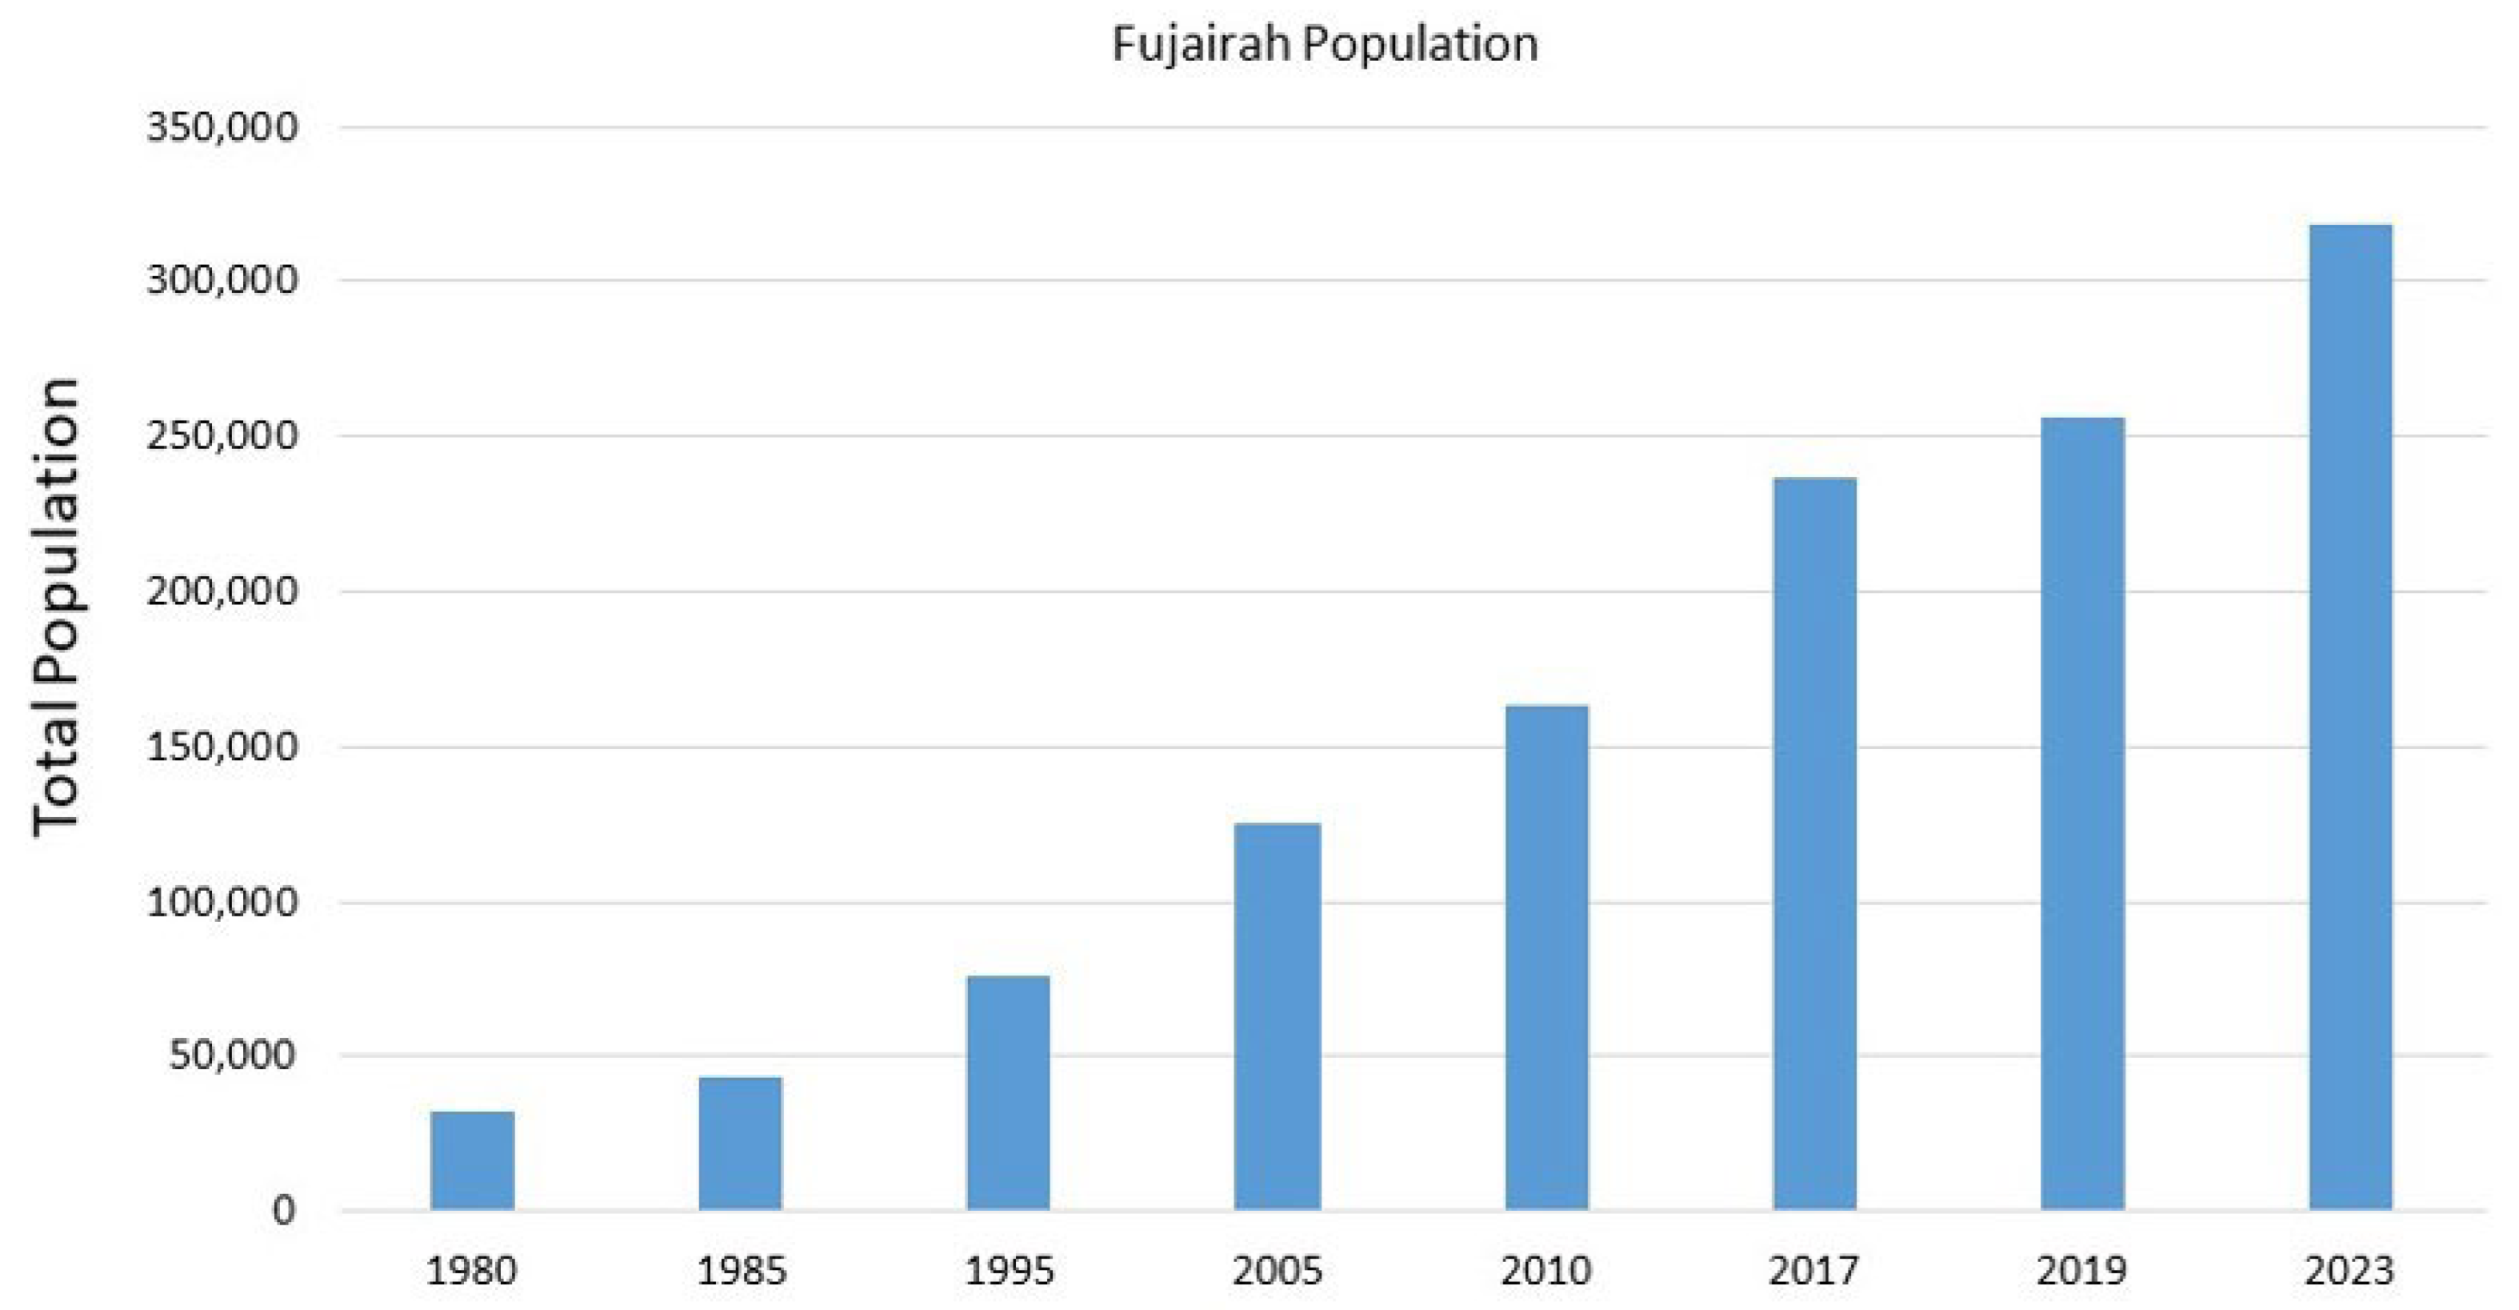
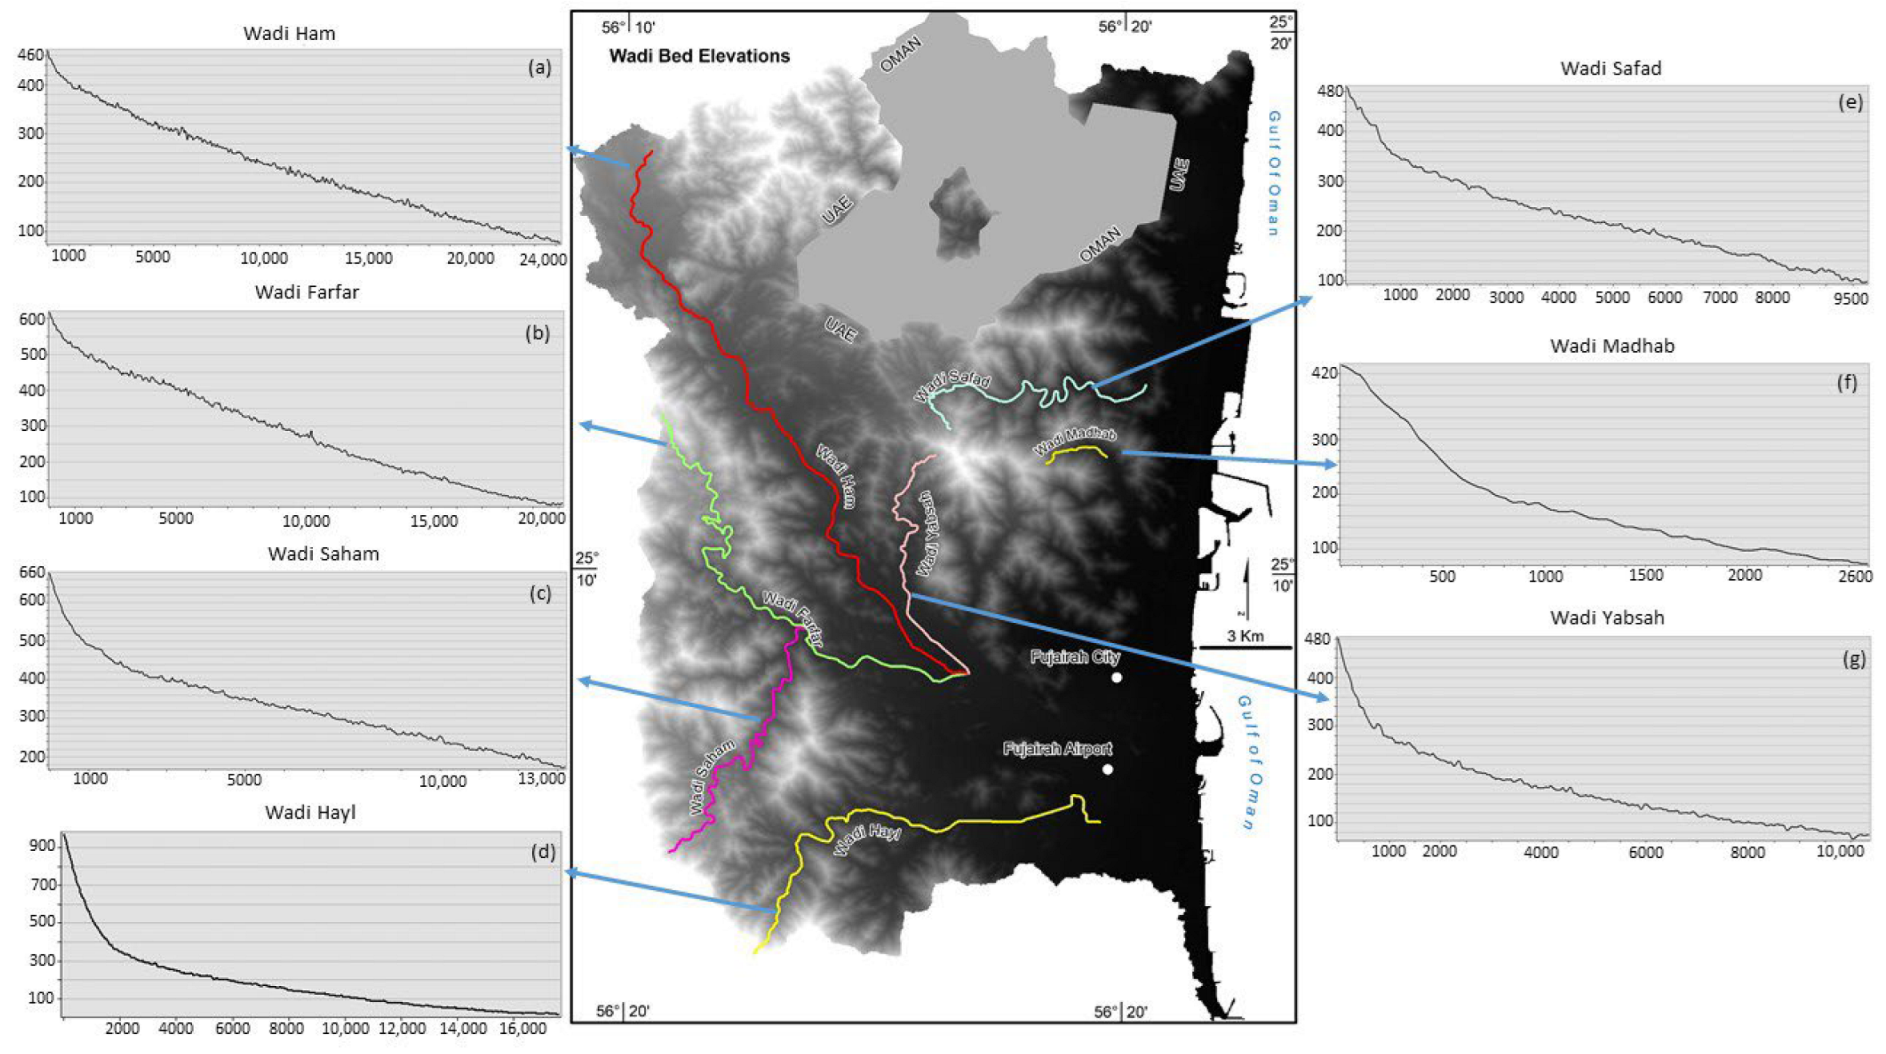
2. Study Area
3. Factors Leading to Study and Mapping the Flash Flood Vulnerable Zones in Fujairah City
4. Materials and Methods
4.1. Parameters Responsible for Flash Floods
4.1.1. Rainfall
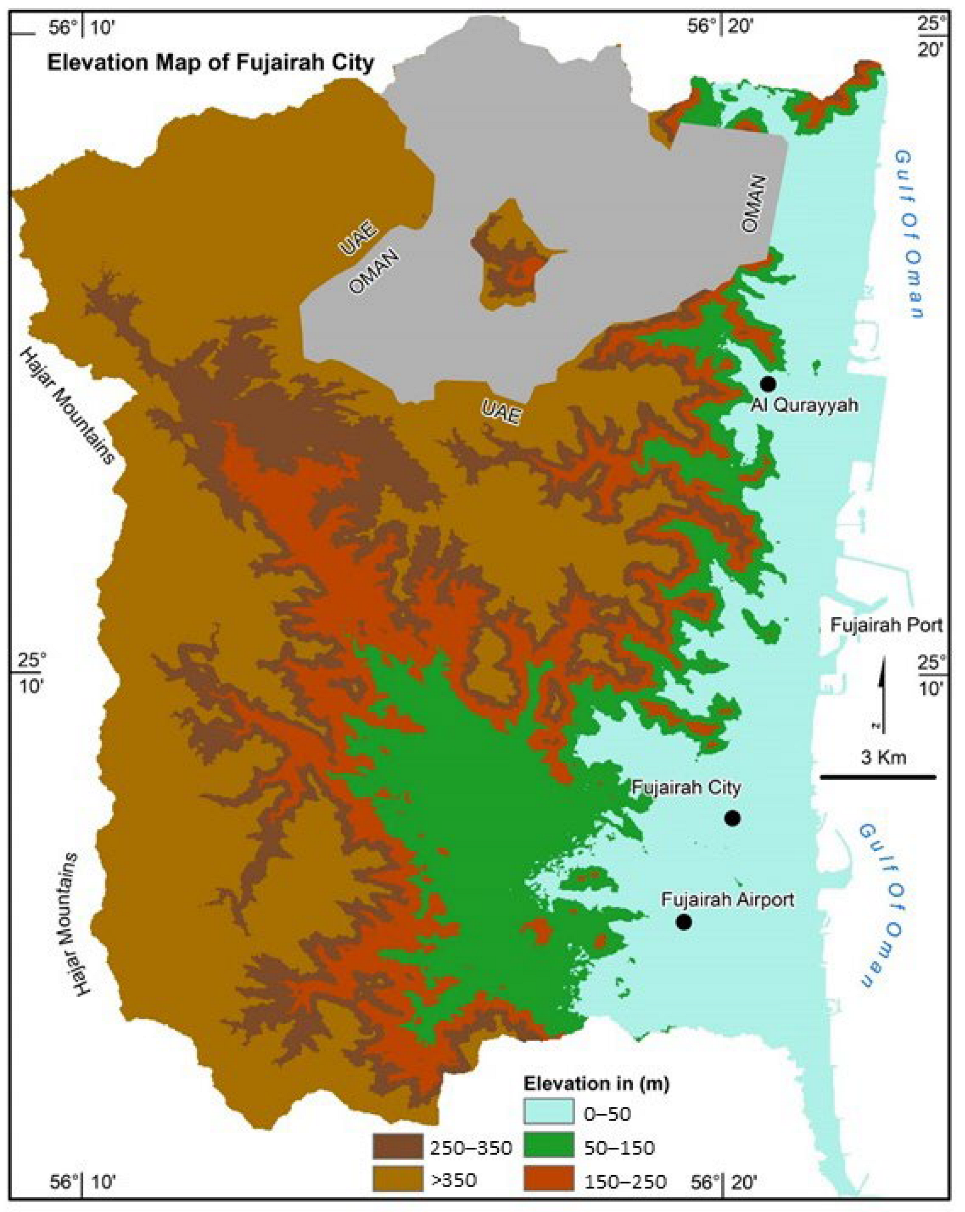
4.1.2. Elevation
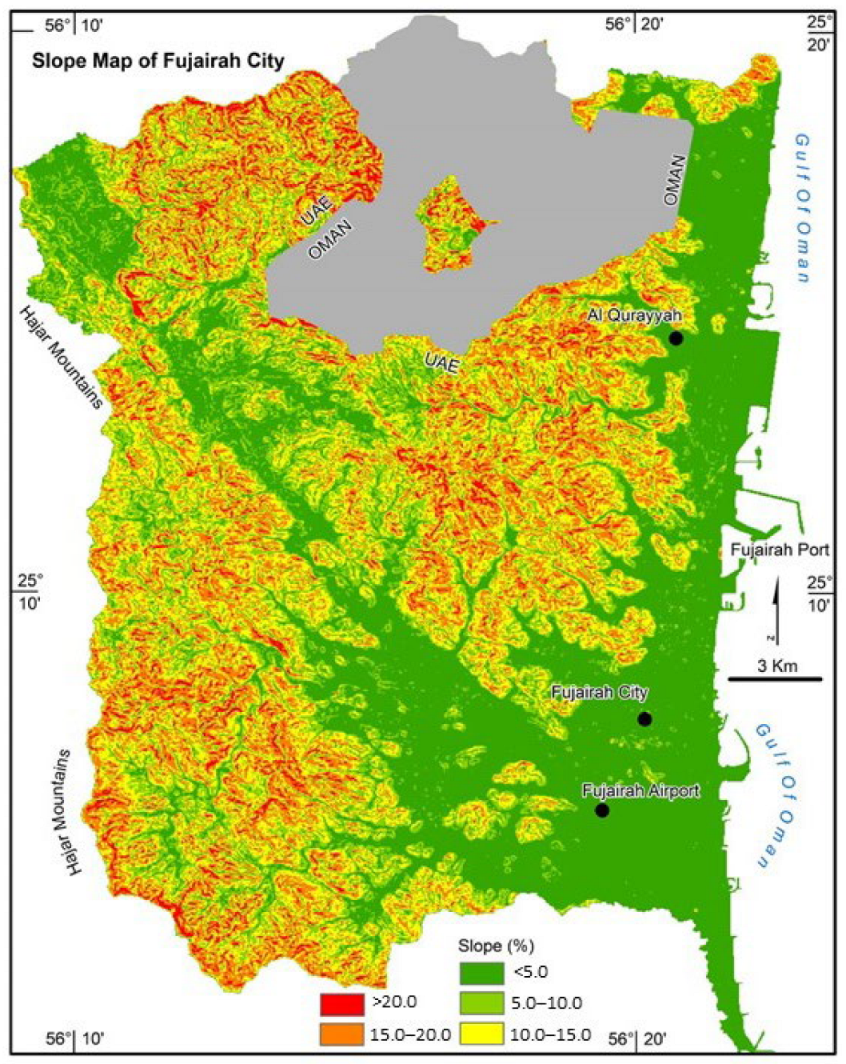
4.1.3. Slope
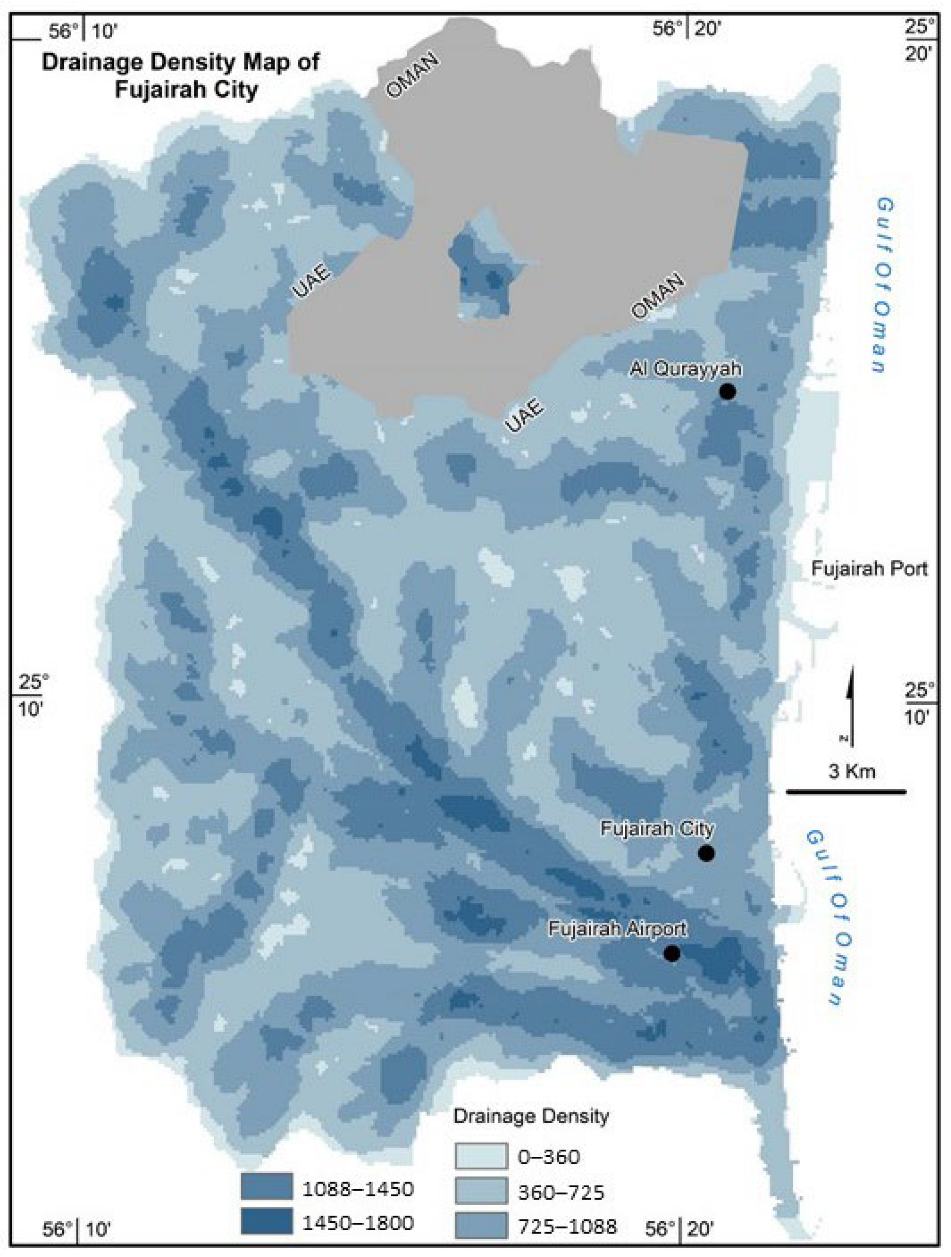
4.1.4. Drainage Density
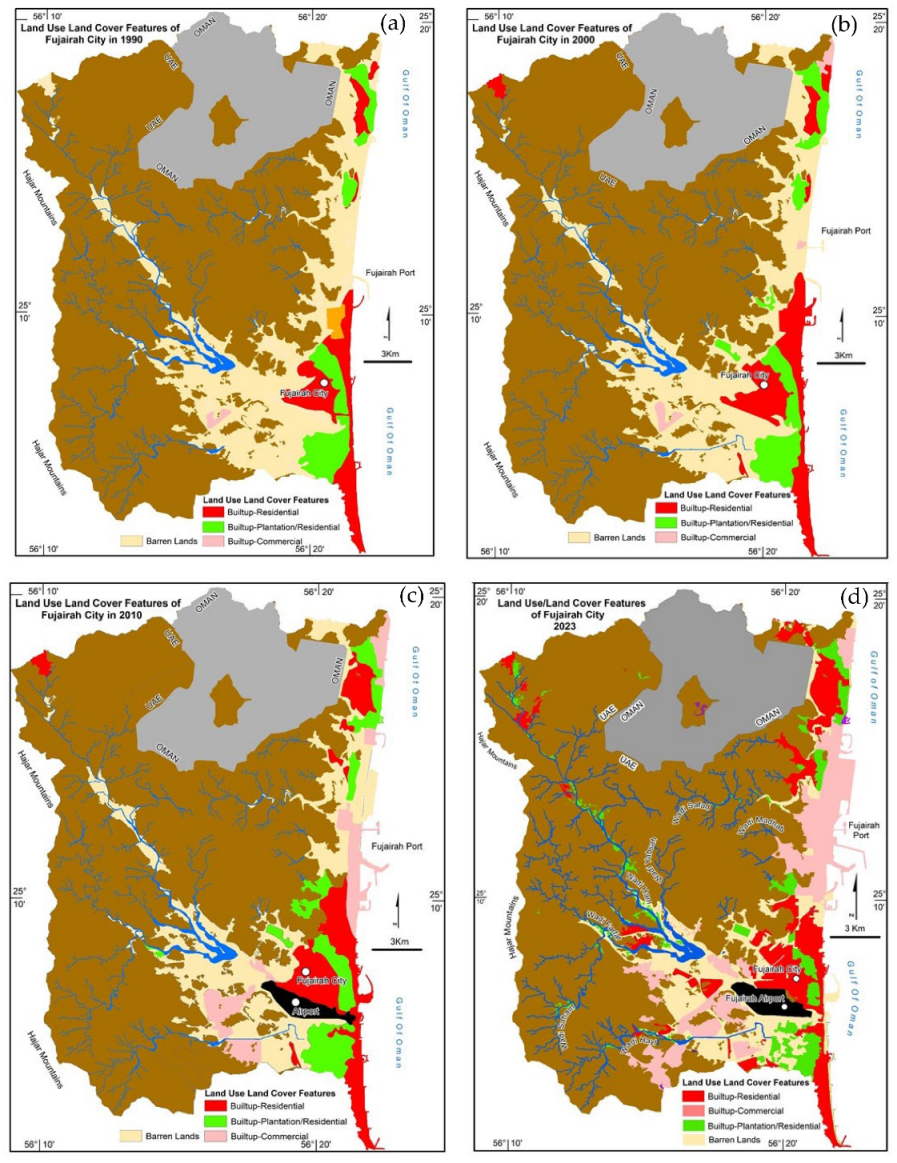
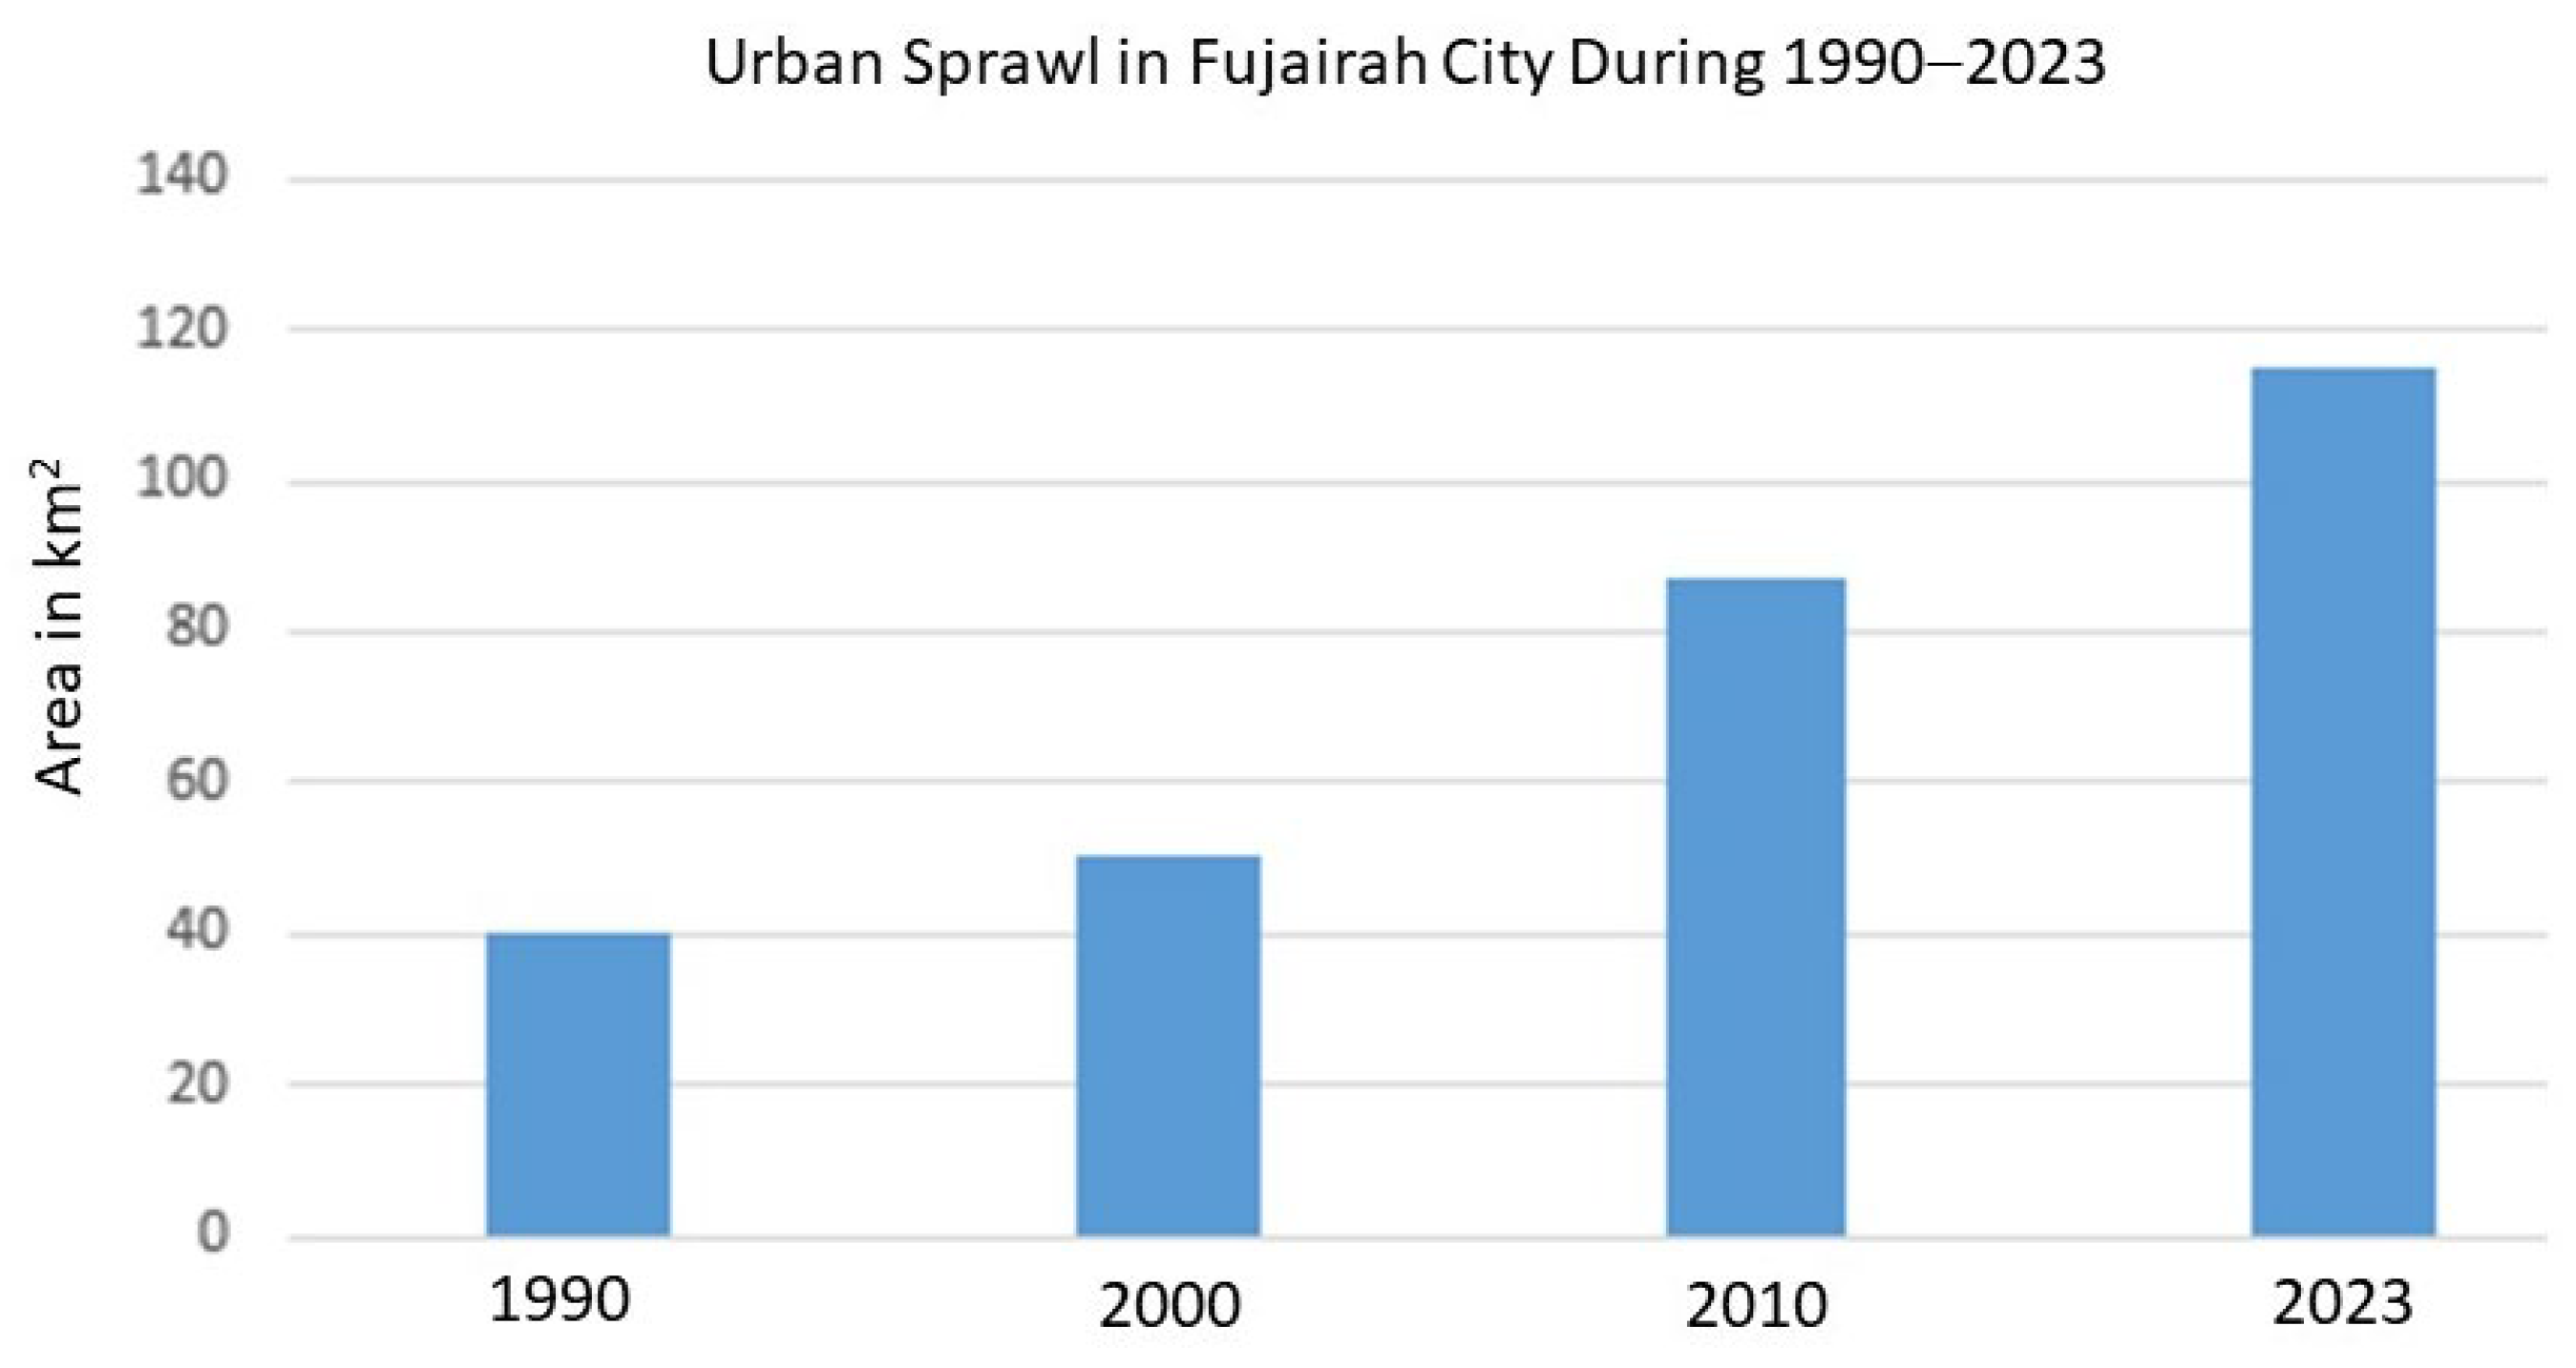
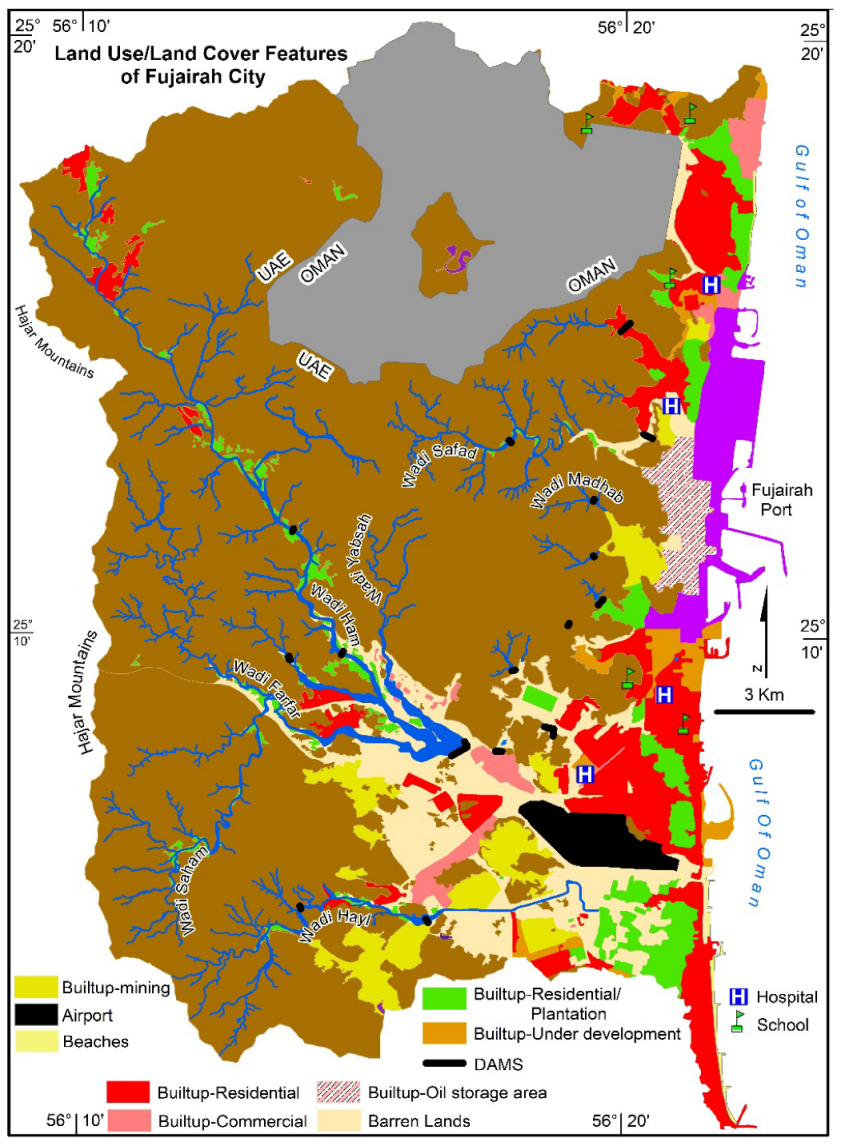
4.1.5. Land Use/Land Cover
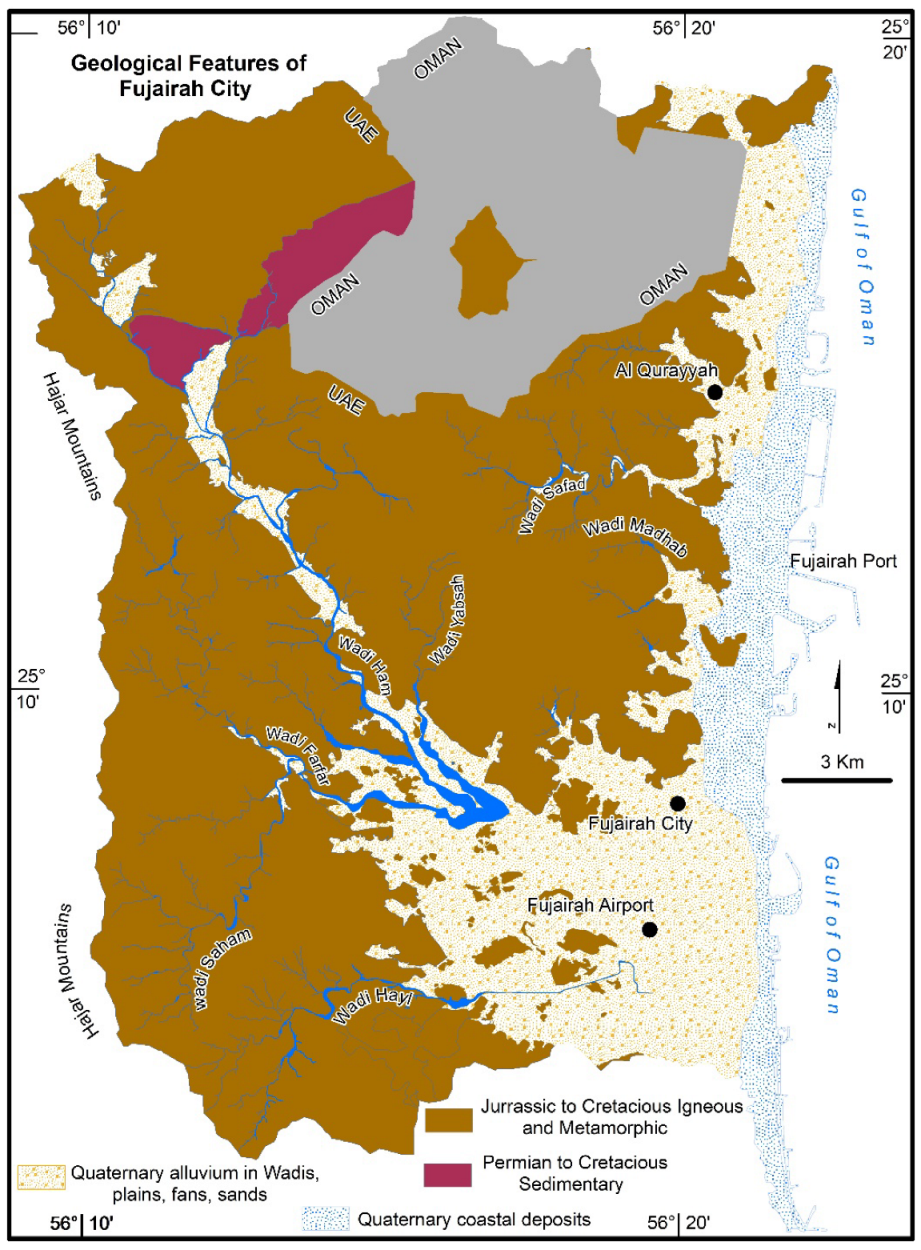
4.1.6. Geology
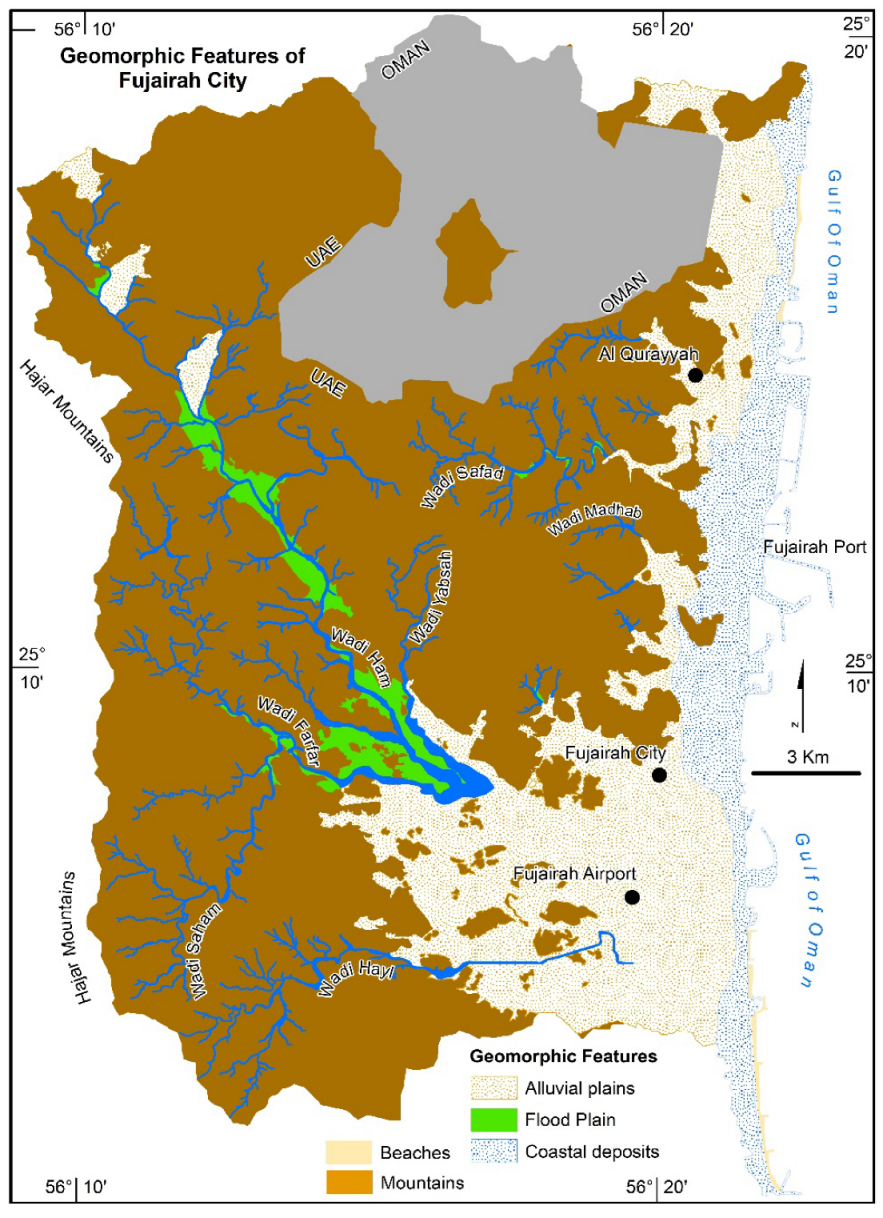
4.1.7. Geomorphology
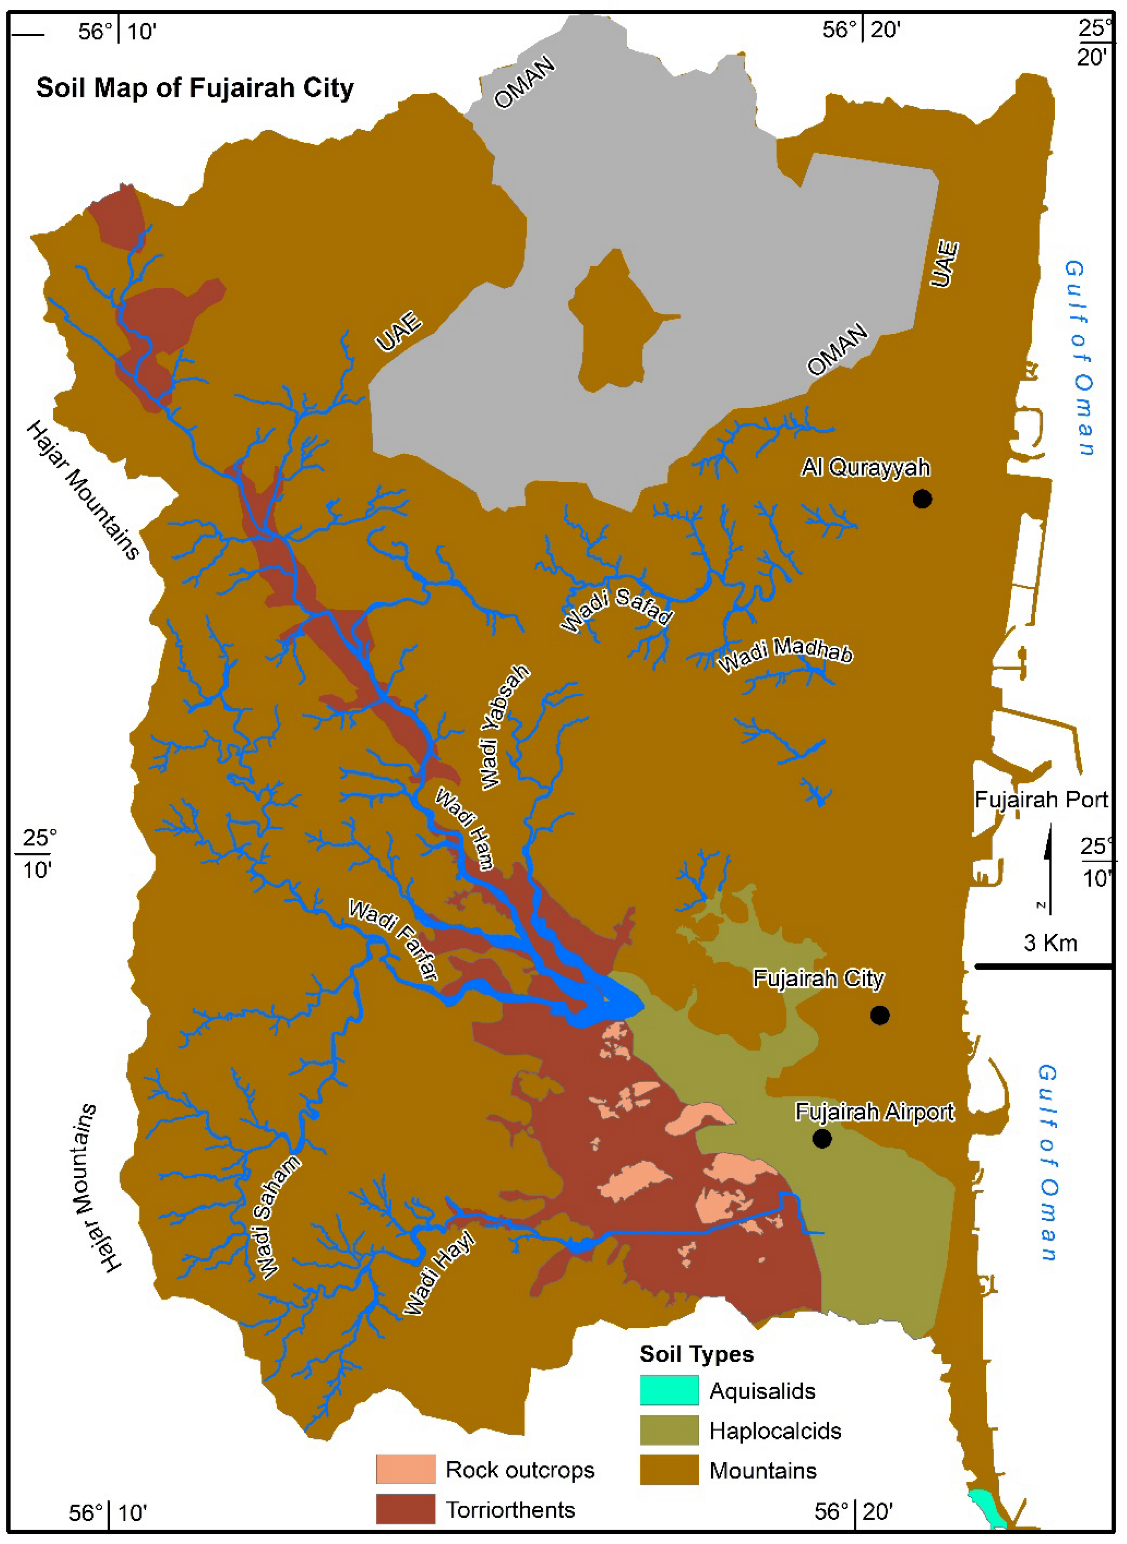
4.1.8. Soil
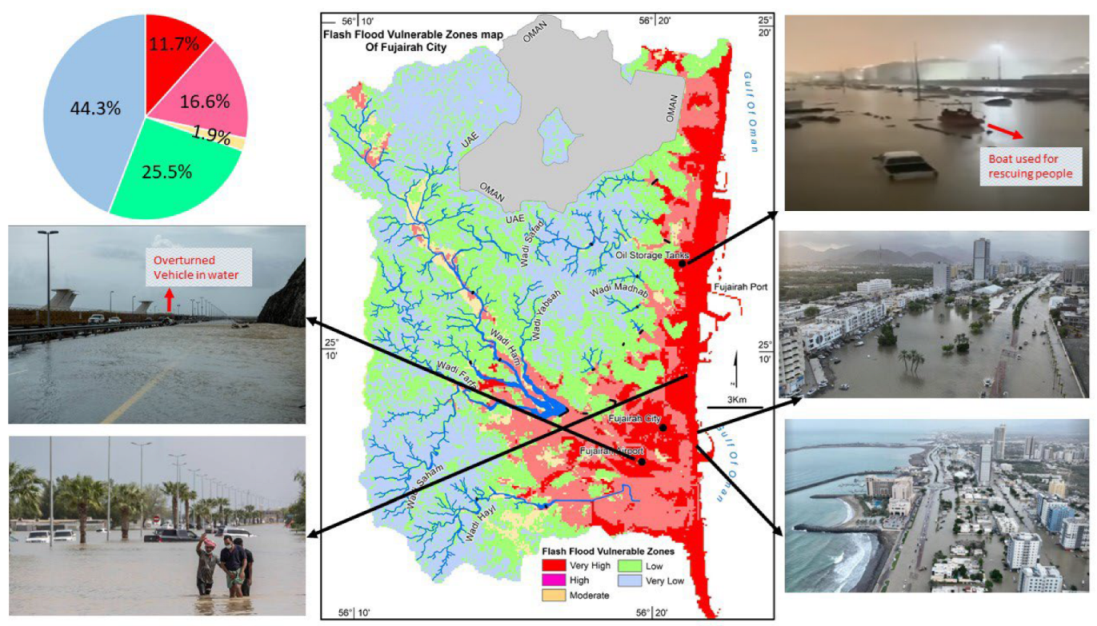
5. Results
Evaluation of Probable Flash Flood Vulnerable Zones
6. Discussion
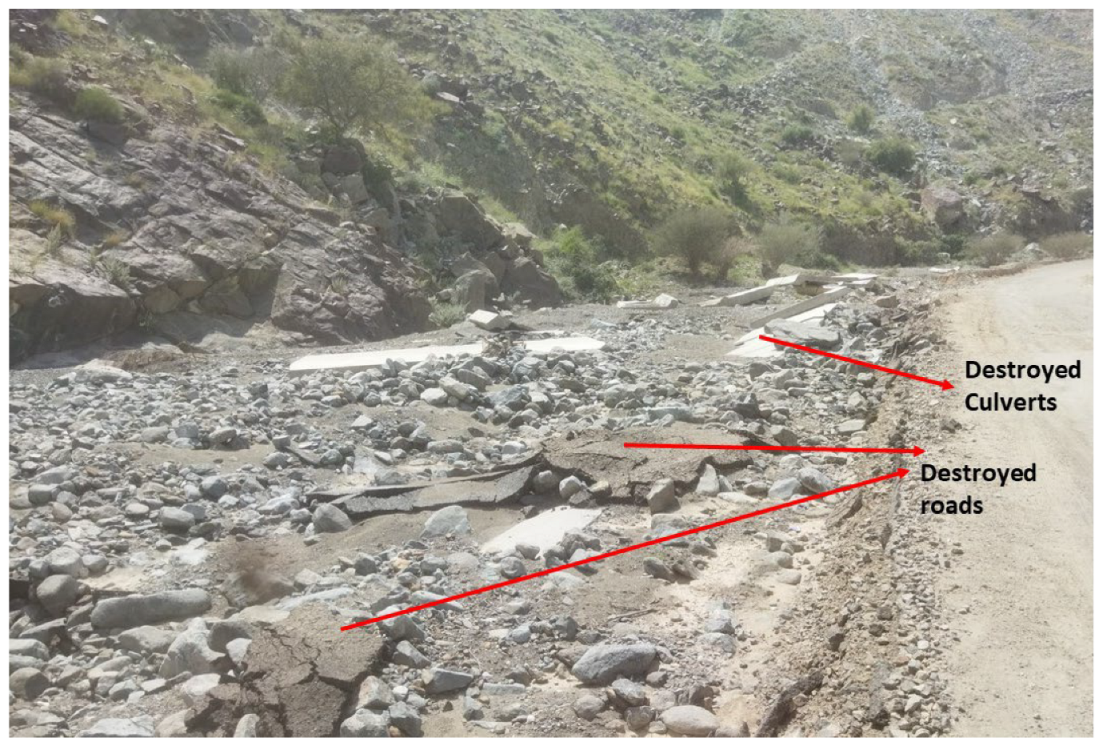
6.1. Hazard Management, Field Observations and Recommendations
6.2. Essential Physical Structural Procedures
6.3. Necessary Solutions without Any Physical Structures
7. Conclusions
Author Contributions
Funding
Data Availability Statement
Conflicts of Interest
References
- Abdelkareem, M. Targeting flash flood potential areas using remotely sensed data and GIS techniques. Nat. Hazards 2017, 85, 19–37. [Google Scholar] [CrossRef]
- Pham, T.; Avand, M.; Janizadeh, S.; Phong, T.V.; Al-Ansari, N.; Ho, L.S.; Das, S.; Le, H.V.; Amini, A.; Bozchaloei, S.K.; et al. GIS Based Hybrid Computational Approaches for Flash Flood Susceptibility Assessment Binh. Water 2020, 12, 683. [Google Scholar] [CrossRef] [Green Version]
- Waqas, H.; Lu, L.; Tariq, A.; Li, Q.; Baqa, M.F.; Xing, J.; Sajjad, A. Flash flood susceptibility assessment and zonation using an integrating analytic hierarchy process and frequency ratio model for the Chitral District, Khyber Pakhtunkhwa, Pakistan. Water 2021, 13, 1650. [Google Scholar] [CrossRef]
- Elmahdy, S.; Ali, T.; Mohamed, M. Flash flood Susceptibility Modeling and Magnitude Index using Machine Learning and Geohydrological Models: A Modified Hybrid Approach. Remote Sens. 2020, 12, 2695. [Google Scholar] [CrossRef]
- Taylor, J.; Man, L.K.; Davies, M.; Clifton, D.; Ridley, I.; Biddulph, P. Flood management: Prediction of microbial contamination in large-scale floods in urban environments. J. Environ. Int. 2011, 37, 1019–1029. [Google Scholar] [CrossRef]
- Oruonye, E.D. Socio-economic impact assessment of flash flood in Jalingo metropolis, Taraba State, Nigeria. Int. J. Environ. Sci. 2012, 1, 135–140. [Google Scholar]
- Zhang, D.; Quan, J.; Zhang, H.; Wang, F.; Wang, H.; He, X. Flash flood hazard mapping: A pilot case study in Xiapu River Basin, China. Water Sci. Eng. 2015, 8, 195–204. [Google Scholar] [CrossRef] [Green Version]
- Abdelkareem, M.; El-Baz, F. Analyses of optical images and radar data reveal structural features and predict groundwater accumulations in the central Eastern Desert of Egypt. Arab. J. Geosci. 2015, 8, 2653–2666. [Google Scholar] [CrossRef]
- Abdelkareem, M.; Al-Arifi, N. The use of remotely sensed data to reveal geologic, structural, and hydrologic features and predict potential areas of water resources in arid regions. Arab. J. Geosci. 2021, 14, 704. [Google Scholar] [CrossRef]
- Mansour, A.M.; El-Sadek, M.S. Risk Assessment of Climate Change on the Coastal area of Quseir, Red Sea, Egypt. In Climate Change Management through Adaptation and Mitigation; Privitera, R., La Rosa, D., Pappalardo, V., Martinico, F., Eds.; Open Access Creative Commons license CC BY-NC-ND 4.0 International Attribution; Maggioli Editore: Santarcangelo di Romagna, Italy, 2021; pp. 64–69. [Google Scholar]
- Kron, W. Keynote lecture: Flood risk = hazard × exposure × vulnerability. In Flood Defence 2002; Science Press Ltd.: New York, NY, USA, 2002; pp. 82–97. [Google Scholar]
- Yin, J.; Yu, D.; Yin, Z.; Liu, M.; He, Q. Evaluating the impact and risk of pluvial flash flood on intra-urban road network: A case study in the city center of Shanghai, China. J. Hydrol. 2016, 537, 138–145. [Google Scholar] [CrossRef] [Green Version]
- Bui, D.T.; Panahi, M.; Shahabi, H.; Singh, V.P.; Shirzadi, A.; Chapi, K.; Khosravi, K.; Chen, W.; Panahi, S.; Li, S.; et al. Novel Hybrid Evolutionary Algorithms for Spatial Prediction of Floods. Sci. Rep. 2018, 8, 15364. [Google Scholar] [CrossRef] [Green Version]
- Tehrany, M.S.; Pradhan, B.; Jebur, M.N. Flood susceptibility analysis and its verification using a novel ensemble support vector machine and frequency ratio method. Stoch. Environ. Res. Risk Assess 2015, 29, 1149–1165. [Google Scholar] [CrossRef]
- Jackson, J.A.; Bates, R. Glossary of Geology: Alexandria; American Geological Institute: Alexandria, VA, USA, 1997; p. 769. [Google Scholar]
- Sen, Z. Wadi Hydrology; CRC Press: New York, NY, USA, 2008. [Google Scholar]
- Khan, Q.; Kalbus, E.; Zaki, N.; Mohamed, M.M. Utilization of social media in floods assessment using data mining techniques. PLoS ONE 2022, 17, e0267079. [Google Scholar] [CrossRef] [PubMed]
- Subraelu, P.; Sefelnasr, A.; Yagoub, M.M.; Sherif, M.; Ebraheem, A.A.; Raj Sekhar, A.; Nageswara Rao, K. Global warming cli-mate change and sea level rise: Impact on land use land cover features along UAE coast through remote sensing and GIS. J. Ecosyst. Ecography 2022, 12, 329. [Google Scholar]
- El Bastawesy, M.; White, K.; Nasr, A. Integration of remote sensing and GIS for modelling flash floods in Wadi Hudain catchment, Egypt. Hydrol. Process. 2009, 23, 1359–1368. [Google Scholar] [CrossRef]
- UNISDR. Terminologies on Disaster Risk Reduction—United Nations International Strategy for Disaster Reduction Geneva, Switzerland; UNISDR: Geneva, Switzerland, 2009. [Google Scholar]
- Guha-Sapir, D.; Below, R.; Hoyois, P. EM-DAT: The CRED/OFDA International Disaster Database. 2016. Available online: https://www.emdat.be/ (accessed on 17 April 2023).
- De Vries, A.J.; Ouwersloot, H.G. Identification of tropical-extratropical interactions and extreme precipitation events in the Middle East based on potential vorticity and moisture transport. J. Geophys. Res. Atmos. 2018, 123, 861–881. [Google Scholar] [CrossRef] [Green Version]
- Al Khatry, A.; Helmi, T. The effect of Gonu cyclone on recharging groundwater aquifers—Sultanate of Oman. In Proceedings of the 1st International Conference on Water Resources and Climate Change in the MENA Region, Muscat, The Sultanate of Oman, 2–4 November 2008; Available online: https://www.researchgate.net/publication/329034781_The_Effect_of_Gonu_Cyclone_on_Recharging_Groundwater_Aquifers_-_Sultanate_of_Oman (accessed on 21 July 2023).
- Al Barwani, A. Flash flood mitigation and harvesting Oman case study. In Proceedings of the 1st International Symposium on Flash Floods (ISFF), Kyoto, Japan, 14–15 October 2015. [Google Scholar]
- Abdeldayem, O.M.; Eldaghar, O.; Mostafa, M.K.; Habashy, M.M.; Hassan, A.A.; Mahmoud, H.; Morsy, K.M.; Abdelrady, A.; Peters, R.W. Mitigation Plan and Water Harvesting of Flashflood in Arid Rural Communities Using Modelling Approach: A Case Study in Afouna Village, Egypt. Water 2020, 12, 2565. [Google Scholar] [CrossRef]
- Aly, M.M.; Refay, N.H.; Elattar, H.; Morsy, K.M.; Bandala, E.R.; Zein, S.A.; Mostafa, M.K. Ecohydrology and flood risk management under climate vulnerability in relation to the sustainable development goals (SDGs): A case study in Nagaa Mobarak Village, Egypt. Nat. Hazards 2022, 112, 1107–1135. [Google Scholar] [CrossRef]
- Murata, M.; Ozawa, H. Post Aswan High Dam flash floods in Egypt: Causes, consequences and mitigation strategies. Bull. Cent. Collab. Community Naruto Univ. Educ. 2015, 29, 173–186. [Google Scholar]
- Abdel-Fattah, M.; Kantoush, S.A. Rainfall-runoff modeling for extreme flash floods in Wadi Samail, Oman. J. Jpn Soc. Civ. Eng. Ser. B1 Hydraul. Eng. 2018, 74, I_691–I_696. [Google Scholar] [CrossRef]
- Jordan: Flash Floods Kill 12 and Force Tourists to Flee. 2018. Available online: https://www.theguardian.com/world/2018/nov/10/jordan-flash-floods-kill-eleven-and-forced-tourists-to-flee (accessed on 18 May 2023).
- Al-Qudah, K.A. Floods as water resource and as a hazard in arid regions: A case study in southern Jordan. Jordan J. Civ. Eng. 2011, 5, 148–161. [Google Scholar]
- Youssef, A.M.; Sefry, S.A.; Pradhan, B.; Alfadail, E.A. Analysis oncauses of flash flood in Jeddah city (Kingdom of Saudi Arabia) of 2009 and 2011 using multi-sensor remote sensing data and GIS. Geomat. Nat. Hazards Risk 2016, 7, 1018–1042. [Google Scholar] [CrossRef]
- Yagoub, M.M.; Alsereidi, A.A.; Mohamed, E.A.; Periyasamy, P.; Alameri, R.; Aldarmaki, S.; Alhashmi, Y. Newspapers as a validation proxy for GIS modeling in Fujairah, United Arab Emirates: Identifying flood prone areas. Nat. Hazards 2020, 104, 111–141. [Google Scholar] [CrossRef]
- Flossmann, A.I.; Manton, M.; Abshaev, A.; Bruintjes, R.; Murakami, M.; Prabhakaran, T.; Yao, Z. Review of advances in precipitation enhancement research. Bull. Am. Meteorol. Soc. 2019, 100, 1465–1480. [Google Scholar] [CrossRef]
- Malik, S.; Bano, H.; Rather, R.A.; Ahmad, S. Cloud Seeding; Its Prospects and Concerns in the ModernWorld-A Review. Int. J. Pure App. Biosci. 2018, 6, 791–796. [Google Scholar] [CrossRef]
- Mazroui, A.A.; Farrah, S. The UAE Seeks Leading Position in Global Rain Enhancement Research. J. Weather Modif. 2017, 49, 54–55. [Google Scholar] [CrossRef]
- Almheiri, K.B.; Rustum, R.; Wright, G.; Adeloye, A.J. Study of Impact of Cloud-Seeding on Intensity-Duration-Frequency (IDF) Curves of Sharjah City, the United Arab Emirates. Water 2021, 13, 3363. [Google Scholar] [CrossRef]
- Jin, H.; Liang, R.; Wang, Y.; Tumula, P. Flood—Runoff in semiarid and sub-humid regions, a case study: A simulation of Jianghe Watershed in Northern China. Water 2015, 7, 5155–5172. [Google Scholar] [CrossRef] [Green Version]
- Tehrany, M.S.; Kumar, L.; Jebur, M.N.; Shabani, F. Evaluating the application of the statistical index method in flood susceptibility mapping and its comparison with frequency ratio and logistic regression methods. Geomat. Nat Hazards 2019, 10, 79–101. [Google Scholar] [CrossRef] [Green Version]
- Yariyan, P.; Avand, M.; Abbaspour, R.A.; Haghighi, T.A.; Costache, R.; Ghorbanzadeh, O.; Janizadeh, S.; Blaschke, T. Flood susceptibility mapping using an improved analytic network process with statistical models. Geomat. Nat. Hazards Risk 2020, 11, 2282–2314. [Google Scholar] [CrossRef]
- Chen, N.; Zhang, Y.; Wu, J.; Dong, W.; Zou, Y.; Xu, X. The trend in the risk of flash flood hazards with regional development in the Guanshan River Basin China. Water 2020, 12, 1815. [Google Scholar] [CrossRef]
- Vivekanandan, N. Comparison of probability distributions in extreme value analysis of rainfall and temperature data. Environ. Earth Sci. 2018, 77, 201. [Google Scholar] [CrossRef]
- Monsef, H.A.E. A mitigation strategy for reducing flood risk to highways in arid regions: A case study of the El-Quseir–Qena highway in Egypt. J. Flood Risk Manag. 2018, 11, S158–S172. [Google Scholar] [CrossRef]
- Sujatha, E.R.; Selvakumar, R.; Rajasimman, U.A.B.; Victor, R.G. Morphometric analysis of subwatershed in parts of Western Ghats, South India using ASTER DEM. Geomat. Nat. Hazard Risk 2013, 6, 326–341. [Google Scholar] [CrossRef] [Green Version]
- Bhatt, S.; Ahmed, S.A. Morphometric analysis to determine floods in the Upper Krishna Basin using Cartosat DEM. J. Geocarto Int. 2014, 29, 878–894. [Google Scholar] [CrossRef]
- Abdel-Fattah, M.; Kantoush, S.; Sumi, T. Integrated management of flash flood in wadi system of Egypt: Disaster prevention and water harvesting. In Proceedings of the 1st International Symposium on Flash Floods in Wadi System—Disaster Risk Reduction and Water Harvesting of Flash Floods in the Arab Regions, Kyoto, Japan, 14–15 October 2015; Available online: https://repository.kulib.kyoto-u.ac.jp/dspace/bitstream/2433/210044/1/a58b0p54.pdf (accessed on 22 July 2023).
- Farhan, Y.; Anaba, O.; Salim, A. Morphometric Analysis and flashfloods assessment for drainage basins of the RasEnNaqb Area South Jordan Using GIS. J. Geosci. Environ. Protect. 2016, 4. [Google Scholar] [CrossRef] [Green Version]
- Szewrański, S.; Kazak, J.; Szkaradkiewicz, M.; Sasik, J. Flood Risk Factors in Suburban Area in the Context of Climate Change Adaptation Policies—Case Study of Wroclaw, Poland. J. Ecol. Eng. 2015, 16, 13–18. [Google Scholar] [CrossRef]
- Recanatesi, F.; Petroselli, A.; Ripa, M.N.; Leone, A. Assessment of storm water runoff management practices and BMPs under soil sealing: A study case in a peri-urban watershed of the metropolitan area of Rome (Italy). J. Environ. Manag. 2017, 201, 6–18. [Google Scholar] [CrossRef]
- El-Rawy, M.; Elsadek, W.M.; De Smedt, F. Flash flood susceptibility mapping in Sinai, Egypt using hydromorphic data, principal component analysis and logistic regression. Water 2022, 14, 2434. [Google Scholar] [CrossRef]
- Zhao, G.; Pang, B.; Xu, Z.; Peng, D.; Xu, L. Assessment of urban flood susceptibility using semi-supervised machine learning model. Sci. Total Environ. 2019, 659, 940–949. [Google Scholar] [CrossRef]
- Periyasamy, P.; Yagoub, M.M.; Sudalaimuthu, M. Flood vulnerable zones in the rural blocks of Thiruvallur districts, South India. Geoenviron. Disasters 2018, 5, 21. [Google Scholar]
- Vojtek, M.; Vojtekov, J. Flood hazard and flood risk assessment at the local spatial scale: A case study. Geomat. Nat Hazards Risk 2016, 7, 19731992. [Google Scholar] [CrossRef] [Green Version]
- Arabameri, A.; Saha, S.; Mukherjee, K.; Blaschke, T.; Chen, W.; Ngo, P.T.T.; Band, S.S. Modeling Spatial Flood using Novel Ensemble Artificial Intelligence Approaches in Northern Iran. Remote. Sens. 2020, 12, 3423. [Google Scholar] [CrossRef]
- Forkuo, E.K. Flood hazard mapping using Aster image data with GIS. Int. J. Geomat. Geosci. 2011, 1, 932–950. Available online: https://www.ipublishing.co.in/jggsvol1no12010/EIJGGS2051.pdf (accessed on 20 June 2023).
- Quirós, E.; Gagnon, A.S. Validation of flood risk maps using open source optical and radar satellite imagery. Trans. GIS 2020, 24, 1208–1226. [Google Scholar] [CrossRef]
- Getahun, Y.S.; Gebre, S.L. Flood hazard assessment and mapping of flood inundation area of the Awash River Basin in Ethiopia using GIS and HEC-GeoRAS/HEC-RAS Model. J. Civil. Environ. Eng. 2015, 5, 179. Available online: https://www.omicsonline.org/open-access/flood-hazard-assessment-and-mapping-offloodinundation-area-of-the-awash-river-basin-in-ethiopia-using-gis-and-hecgeorashecras–model-2165-784X-1000179.php?aid=57721 (accessed on 19 May 2023).
- Samanta, S.; Koloa, C.; Pal, D.K.; Palsamanta, B. Flood risk analysis in lower part of Markham River based on multi-criteria decision approach (MCDA). Hydrology 2016, 3, 29. [Google Scholar] [CrossRef] [Green Version]
- Kelly, M.; Schwarz, I.; Ziegelaar, M.; Watkins, A.B.; Kuleshov, Y. Flood Risk Assessment and Mapping: A Case Study from Australia’s Hawkesbury-Nepean Catchment. Hydrology 2023, 10, 26. [Google Scholar] [CrossRef]
- Sefelnasr, A.; Ebraheem, A.A.; Faiz, M.A.; Shi, X.; Alghafli, K.; Baig, F.; Al-Rashed, M.; Alshamsi, D.; Ahamed, M.B.; Sherif, M. Enhancement of Groundwater Recharge from Wadi Al Bih Dam, UAE. Water 2022, 14, 3448. [Google Scholar] [CrossRef]
- Sherif, M.; Sefelnasr, A.; Al Rashed, M.; Alshamsi, D.; Zaidi, F.K.; Alghafli, K.; Baig, F.; Al-Turbak, A.; Alfaifi, H.; Loni, O.A.; et al. A Review of Managed Aquifer Recharge Potential in the Middle East and North Africa Region with Examples from the Kingdom of Saudi Arabia and the United Arab Emirates. Water 2023, 15, 742. [Google Scholar] [CrossRef]
- Al-Dogom, D.; Al-Ruzouq, R.; Kalantar, B.; Schuckman, K.; Al-Mansoori, S.; Mukherjee, S.; Al-Ahmad, H.; Ueda, N. Geospatial Multicriteria Analysis for Earthquake Risk Assessment: Case Study of Fujairah City in the UAE. J. Sensors 2021, 2021, 6638316. [Google Scholar] [CrossRef]
- Subraelu, P.; Yagoub, M.M.; Sefelnasr, A.; Nageswara, K.; Allamsatti, R.S.; Ebraheem, A.A.; Sherif, M. Sea-level Rise and Coastal Vulnerability: A preliminary Assessment of UAE Coast through Remote Sensing and GIS. J. Coast. Zone Mang. 2021, 24, 477–480. [Google Scholar]
- Elmahdy, S.I.; Mohamed, M.M.; Ali, T. Land Use/Land Cover Changes Impact on Groundwater Level and Quality in the Northern Part of the United Arab Emirates. Remote Sens. 2020, 12, 1715. [Google Scholar] [CrossRef]
- Al-Rashed, M.F.; Sherif, M.M. Water Resources in the GCC Countries: An Overview. Water Resour. Manag. 2000, 14, 59–75. [Google Scholar] [CrossRef]
- Sherif, M.; Almulla, M.; Shetty, A.; Chowdhury, R. Analysis of rainfall, PMP and drought in the United Arab Emirates. Int. J. Clim. 2014, 34, 1318–1328. [Google Scholar] [CrossRef]
- Ghazanfar, S.A.; Fisher, M. (Eds.) Vegetation of the Arabian Peninsula; Springer: Berlin/Heidelberg, Germany, 1998. [Google Scholar] [CrossRef] [Green Version]
- Sherif, M.; Mohamed, M.; Kacimov, A.; Shetty, A. Assessment of groundwater quality in the northeastern coastal area of UAE as precursor for desalination. Desalination 2011, 273, 436–446. [Google Scholar] [CrossRef]
- Subraelu, P.; Ebraheem, A.A.; Sherif, M.; Sefelnasr, A.; Yagoub, M.M.; Rao, K.N. Land in Water: The Study of Land Reclamation and Artificial Islands Formation in the UAE Coastal Zone: A Remote Sensing and GIS Perspective. Land 2022, 11, 2024. [Google Scholar] [CrossRef]
- Sengupta, D.; Chen, R.; Meadows, M.E. Building beyond land:An overview of coastal land reclamation in16 global megacities. Appl. Geogr. 2018, 90, 229–238. [Google Scholar] [CrossRef]
- Shah, S.M.H.; Mustaffa, Z.; Teo, F.Y.; Imam, M.A.H.; Yusof, K.W.; Al-Qadami, E.H.H. A review of the flood hazard and risk management in the South Asian Region, particularly Pakistan. Sci. Afr. 2020, 10, e00651. [Google Scholar] [CrossRef]
- Gan, B.R.; Liu, X.N.; Yang, X.G.; Wang, X.K.; Zhoua, J.W. The impact of human activities on the occurrence of mountain flood hazards: Lessons from the 17 August 2015 flash flood/debris flow event in Xuyong County, South-Western China. Geomat. Nat. Hazards Risk 2018, 9, 816–840. [Google Scholar] [CrossRef] [Green Version]
- Gulf Today. Fujairah’s Flood. 2022. Available online: https://www.gulftoday.ae/news/2022/07/29/at-least-six-dead-due-to-uae-floods (accessed on 22 July 2023).
- The National News. 2022. Available online: https://www.thenationalnews.com/uae/2022/07/29/water-was-up-to-my-shoulders-fujairah-residents-recall-aftermath-of-major-floods (accessed on 22 July 2023).
- Aliyev, E. Fujairah Bunker Ops Remain Disrupted after Flood. 2022. Available online: https://www.argusmedia.com/en/news/2355927-fujairahbunker-ops-remain-disrupted-after-flood (accessed on 22 July 2023).
- Alhefeiti FR, M.O.; Alblooshi MA, M.; Abdalla RY YY, A.; Kalathingal MS, H.; Mirza, S.B.; Ridouane, F.L. Investigation of the effects of heavy rain and flood in Emirates of Fujairah–UAE and Construction and Compilation of Flood Map and Elevation Chart Using State of the Art GIS Technologies. Int. J. Dev. Res. 2022, 12, 58827–58831. [Google Scholar]
- Kursah, M.B. Application of GIS in flood detection for road infrastructure planning in north-eastern corridor of northern Ghana. Int. J. Appl. Sci. Technol. 2013, 3, 94–106. [Google Scholar]
- Goel, N.K.; Kurothe, R.S.; Mathur, B.S.; Vogel, R.M. A derived flood frequency distribution for correlated rainfall intensity and duration. J. Hydrol. 2000, 228, 56–67. [Google Scholar] [CrossRef]
- Zhang, Y.; Smith, J.A. Space–time variability of rainfall and extreme flood response in the Menomonee River Basin, Wisconsin. J. Hydrometeorol. 2003, 4, 506–517. [Google Scholar] [CrossRef]
- Rozalis, S.; Morin, E.; Yair, Y.; Price, C. Flash flood prediction using an uncalibrated hydrological model and radar rainfall data in a Mediterranean watershed under changing hydrological conditions. J. Hydrol. 2010, 394, 245–255. [Google Scholar] [CrossRef]
- Hong, H.; Panahi, M.; Shirzadi, A.; Ma, T.; Liu, J.; Zhu, A.; Chen, W.; Kougias, I.; Kazakis, N. Flood susceptibility assessment in Hengfeng area coupling adaptive neuro-fuzzy inference system with genetic algorithm and differential evolution. Sci. Total. Environ. 2018, 621, 1124–1141. [Google Scholar] [CrossRef]
- Zhao, G.; Pang, B.; Xu, Z.; Yue, J.; Tu, T. Mapping flood susceptibility in mountainous areas on a national scale in China. Sci. Total Environ. 2018, 615, 1133–1142. [Google Scholar] [CrossRef]
- Kay, A.L.; Jones, R.G.; Reynard, N.S. RCM rainfall for UK flood frequency estimation. II. Climate change results. J. Hydrol. 2006, 318, 163–172. [Google Scholar]
- Segond, M.L.; Wheater, H.S.; Onof, C. The significance of spatial rainfall representation for flood runoff estimation: A numerical evaluation based on the Lee catchment, UK. J. Hydrol. 2007, 347, 116–131. [Google Scholar] [CrossRef]
- Tehrany, M.S.; Pradhan, B.; Jebur, M.N. Spatial prediction of flood susceptible areas using rule based decision tree (DT) and a novel ensemble bivariate and multivariate statistical models in GIS. J. Hydrol. 2013, 504, 69–79. [Google Scholar] [CrossRef]
- Tehrany, M.S.; Pradhan, B.; Mansor, S.; Ahmad, N. Flood susceptibility assessment using GIS-based support vector machine model with different kernel types. Catena 2015, 125, 91–101. [Google Scholar] [CrossRef]
- Bui, D.T.; Pradhan, B.; Nampak, H.; Bui, Q.T.; Tran, Q.A.; Nguyen, Q.P. Hybrid artificial intelligence approach based on neural fuzzy inference model and metaheuristic optimization for flood susceptibility modeling in a high-frequency tropical cyclone area using GIS. J. Hydrol. 2016, 540, 317–330. [Google Scholar]
- Sherif, M.M.; Mohamed, M.M.; Shetty, A.; Almulla, M. Rainfall-Runoff Modeling of Three Wadis in the Northern Area of UAE. J. Hydrol. Eng. 2011, 16, 10–20. [Google Scholar] [CrossRef] [Green Version]
- Pradhan, B. Flood Susceptible mapping and risk area delineation using logistic regression, GIS and remote sensing. J. Spat. Hydrol. 2009, 9, 1–18. [Google Scholar]
- Botzen, W.J.W.; Aerts, J.C.J.H.; Bergh, J.C.J.M.v.D. Individual preferences for reducing flood risk to near zero through elevation. Mitig. Adapt. Strat. Glob. Chang. 2012, 18, 229–244. [Google Scholar] [CrossRef] [Green Version]
- Mojaddadi, H.; Pradhan, B.; Nampak, H.; Ahmad, N.; Ghazali, A.H.B. Ensemble machine learning-based geospatial approach for flood risk assessment using multi-sensor remote sensing data and GIS. Geomat. Nat. Hazard Risk 2017, 8, 1080–1102. [Google Scholar] [CrossRef] [Green Version]
- Fernandez, D.S.; Lutz, M.A. Urban flood hazard zoning in Tucuman Province, Argentina, using GIS and multicriteria decision analysis. Eng. Geol. 2010, 111, 90–98. [Google Scholar] [CrossRef]
- Dahri, N.; Habib, A. Monte Carlo simulation-aided analytical hierarchy process (AHP) for flood susceptibility mapping in Gabes Basin (southeastern Tunisia). Environ. Earth Sci. 2017, 76, 302. [Google Scholar] [CrossRef]
- Das, S.; Pardeshi, S.D.; Kulkarni, P.P.; Doke, A. Extraction of lineaments from different azimuth angles using geospatial techniques: A case study of Pravara basin, Maharashtra, India. Arab. J. Geosci. 2018, 11, 160. [Google Scholar] [CrossRef]
- Das, S.; Pardeshi, S.D. Integration of different influencing factors in GIS to delineate groundwater potential areas using IF and FR techniques: A study of Pravara basin, Maharashtra, India. Appl. Water Sci. 2018, 8, 197. [Google Scholar] [CrossRef] [Green Version]
- Li, K.; Wu, S.; Dai, E.; Xu, Z. Flood loss analysis and quantitative risk assessment in China. Nat. Hazards 2012, 63, 737–760. [Google Scholar] [CrossRef]
- Zhu, Q.; Abdelkareem, M. Mapping groundwater potential zones using a knowledge-driven approach and GIS analysis. Water 2021, 13, 579. [Google Scholar] [CrossRef]
- Çelik, H.E.; Coskun, G.; Cigizoglu, H.K.; Ağıralioğlu, N.; Aydın, A.; Esin, A.İ. The analysis of 2004 flood on Kozdere Stream in Istanbul. Nat. Hazards 2012, 63, 461–477. [Google Scholar] [CrossRef]
- Rimba, A.B.; Setiawati, M.D.; Sambah, A.B.; Miura, F. Physical Flood Vulnerability Mapping Applying Geospatial Techniques in Okazaki City, Aichi Prefecture, Japan. Urban Sci. 2017, 1, 7. [Google Scholar] [CrossRef] [Green Version]
- Kumar, P.K.; Gopinath, G.; Seralathan, P. Application of remote sensing and GIS for the demarcation of groundwater potential zones of a river basin in Kerala, southwest coast of India. Int. J. Remote. Sens. 2007, 28, 5583–5601. [Google Scholar] [CrossRef]
- Ogden, F.L.; Raj Pradhan, N.; Downer, C.W.; Zahner, J.A. Relative importance of impervious area, drainage density, width function, and subsurface storm drainage on flood runoff from an urbanized catchment. Water Resour. Res. 2011, 47. [Google Scholar] [CrossRef] [Green Version]
- Mahmoud, S.H.; Gan, T.Y. Multi-criteria approach to develop flood susceptibility maps in arid regions of Middle East. J. Clean. Prod. 2018, 196, 216–229. [Google Scholar] [CrossRef]
- Benito, G.; Rico, M.; Sánchez-Moya, Y.; Sopeña, A.; Thorndycraft, V.R.; Barriendos, M. The impact of late Holocene climatic variability and land use change on the flood hydrology of the Guadalentín River, southeast Spain. Glob. Planet. Chang. 2010, 70, 53–63. [Google Scholar] [CrossRef] [Green Version]
- García-Ruiz, J.M.; Regüés, D.; Alvera, B.; Lana-Renault, N.; Serrano-Muela, P.; Nadal-Romero, E. Flood generation and sediment transport in experimental catchments affected by land use changes in the central Pyrenees. J. Hydrol. 2008, 356, 245–260. [Google Scholar] [CrossRef] [Green Version]
- Beckers, A.; Dewals, B.; Erpicum, S.; Dujardin, S.; Detrembleur, S.; Teller, J. Contribution of land use changes to future flood damage along the river Meuse in the Walloon region. Nat. Hazards Earth Syst. Sci. 2013, 13, 2301–2318. [Google Scholar] [CrossRef]
- Reneau, S.L. Stream incision and terrace development in Frijoles Canyon, Bandelier National Monument, New Mexico, and the influence of lithology and climate. Geomorphology 2000, 32, 171–193. [Google Scholar] [CrossRef]
- Xu, Y.; Chung, S.L.; Jahn, B.M.; Wu, G. Petrologic and geochemical constraints on the petrogenesis of Permian–Triassic Emeishan flood basalts in southwestern China. Lithos 2001, 58, 145–168. [Google Scholar] [CrossRef]
- Kazakis, N.; Kougias, I.; Patsialis, T. Assessment of flood hazard areas at a regional scale using an index-based approach and Analytical Hierarchy Process: Application in Rhodope-Evros region, Greece. Sci. Tot. Environ. 2015, 538, 555–563. [Google Scholar] [CrossRef] [PubMed]
- He, B.; Xu, Y.G.; Huang, X.L.; Luo, Z.Y.; Shi, Y.R.; Yang, Q.J.; Yu, S.Y. Age and duration of the Emeishan flood volcanism, SW China: Geochemistry and SHRIMP zircon U–Pb dating of silicic ignimbrites, post-volcanic Xuanwei Formation and clay tuff at the Chaotian section. Earth Planet. Sci. Lett. 2007, 255, 306–323. [Google Scholar] [CrossRef]
- Pain, C.F.; Abdelfattah, M.A. Landform evolution in the arid northern United Arab Emirates: Impacts of tectonics, sea level changes and climate. Catena 2015, 134, 14–29. [Google Scholar] [CrossRef]
- Sherif, M.; Sefelnasr, A.; Ebraheem, A.A.; Mulla, M.A.; Alzaabi, M.; Alghafli, K. Spatial and Temporal Changes of Groundwater Storage in the Quaternary Aquifer, UAE. Water 2021, 13, 864. [Google Scholar] [CrossRef]
- Bullard, J.E.; Livingstone, I. Interactions between aeolian and fluvial systems in dryland environments. Area 2002, 34, 8–16. [Google Scholar] [CrossRef]
- Nash, D.J. Arid geomorphology. Prog. Phys. Geogr. Earth Environ. 2000, 24, 425–443. [Google Scholar] [CrossRef]
- Murad, A.; Hussein, S.; Arman, H.; Gabr, A.; Al Dhuhoori, A. The Aquifer Recharge Potential by Infiltration Tests in Arid Region, Ras Al Khaimah, United Arab Emirates. IOP Conf. Series Earth Environ. Sci. 2019, 362, 012017. [Google Scholar] [CrossRef]
- Nicholls, N.; Wong, K.K. Dependence of rainfall variability on mean rainfall, latitude, and the Southern Oscillation. J. Climate. 1990, 3, 163–170. [Google Scholar] [CrossRef]
- Abdelfattah, M.A.; Pain, C. Unifying regional soil maps at different scales to generate a national soil map for the United Arab Emirates applying digital soil mapping techniques. J. Maps 2012, 8, 392–405. [Google Scholar] [CrossRef]
- Nyarko, B.K. Application of a rational model in GIS for flood risk assessment in Accra. J. Spat. Hydrology. 2002, 2, 1–14. [Google Scholar]
- Lowery, B.; Hickey, W.J.; Arshad, M.A.; Lal, R. Soil water parameters and soil quality. In Methods for Assessing Soil Quality; Doran, J.W., Jones, A.J., Eds.; Reprint Soil Science Society of America: Madison, WI, USA, 1996. [Google Scholar]
- Yagoub, M.M. Spatio—Temporal and hazard mapping of earthquake in UAE (1984–2012): Remote sensing and GIS application. Geoenviron. Disasters 2015, 2, 1–14. [Google Scholar] [CrossRef]
- Al Abdouli, K.; Hussein, K.; Ghebreyesus, D.; Sharif, H.O. Coastal Runoff in the United Arab Emirates—The Hazard and Opportunity. Sustainability 2019, 11, 5406. [Google Scholar] [CrossRef] [Green Version]
- Rizk, Z.S.; Al Sharhan, A.S. Water Resources Perspectives: Evaluation, Management and Policy; Alsharhan, A.S., Wood, W.W., Eds.; Elsevier Science: Amsterdam, The Netherlands, 2003; pp. 245–264. [Google Scholar]
- Ministry of Energy, United Arab Emirates. The United Arab Emirates: Initial National Communication to the United Nations Framework Convention on Climate Change; Ministry of Energy, United Arab Emirates, 2006. Available online: https://unfccc.int/resource/docs/natc/arenc1.pdf (accessed on 5 April 2023).
- Isma’il, M.; Saanyol, I.O. Application of Remote Sensing (RS) and Geographic Information Systems (GIS) in flood vulnerability mapping: Case study of River Kaduna. Int. J. Geomat. Geosci. 2013, 3, 618–627. Available online: https://citeseerx.ist.psu.edu/viewdoc/download?doi=10.1.1.421.8578&rep=rep1&type=pdf (accessed on 19 April 2023).
- Legates, D.R. Real-time calibration of radar precipitation estimates. Prof. Geogr. 2000, 52, 235–246. [Google Scholar] [CrossRef]
- Schumann, G.J.-P.; Bates, P.D.; Apel, H.; Aronica, G.T. (Eds.) Global Flood Hazard: Applications in Modeling, Mapping, and Forecasting; American Geophysical Union-Standards Information Network: Washington, DC, USA, 2018. [Google Scholar]
- Wehbe, Y.; Ghebreyesusa, D.; Temimia, M.; Milewskib, A.; Al Mandousc, A. Assessment of the consistency among global precipitation products over the United Arab Emirates. J. Hydrol. Reg. Stud. 2017, 12, 122–135. [Google Scholar] [CrossRef]
- Ogato, G.S.; Bantider, A.; Abebe, K.; Geneletti, D. Geographic Information System (GIS)-Based Multicriteria Analysis of Flooding Hazard and Risk in Ambo Town and Its Watershed, West Shoa Zone, Oromia Regional State, Ethiopia. J. Hydrol. Reg. Stud. 2020, 27, 100659. [Google Scholar] [CrossRef]
- Danumah, J.H.; Odai, S.N.; Saley, B.M.; Szarzynski, J.; Thiel, M.; Kwaku, A.; Kouame, F.K.; Akpa, L.Y. Flood risk assessment and mapping in Abidjan district using multi-criteria analysis (AHP) model and geoinformation techniques, (Cote d’Ivoire). Geoenviron. Disasters 2016, 3, 1. [Google Scholar] [CrossRef] [Green Version]
- Kocsis, I.; Bilașco, Ș.; Irimuș, I.A.; Dohotar, V.; Rusu, R.; Roșca, S. Flash Flood Vulnerability Mapping Based on FFPI Using GIS Spatial Analysis Case Study: Valea Rea Catchment Area, Romania. Sensors 2022, 22, 3573. [Google Scholar] [CrossRef]
- Adlyansah, A.L. Analysis Of Flood Hazard Zones Using Overlay Method With Figused-Based Scoring Based On Geographic Information Systems: Case Study In Parepare City South Sulawesi Province. IOP Conf. Ser. Earth Environ. Sci. 2019, 280, 012003. [Google Scholar]
- Hagos, Y.G.; Andualem, T.G.; Yibeltal, M.; Mengie, M.A. Flood hazard assessment and mapping using GIS integrated with multi-criteria decision analysis in upper Awash River basin, Ethiopia. Appl. Water Sci. 2022, 12, 148. [Google Scholar] [CrossRef]
- Dano, U.L. An AHP-Based Assessment of Flood Triggering Factors to Enhance Resiliency in Dammam, Saudi Arabia. GeoJournal 2022, 87, 1945–1960. [Google Scholar] [CrossRef]
- Dano, U.L. Flash Flood Impact Assessment in Jeddah City: An Analytic Hierarchy Process Approach. Hydrology 2020, 7, 10. [Google Scholar] [CrossRef] [Green Version]
- Souissi, D.; Zouhri, L.; Hammami, S.; Msaddek, M.H.; Zghibi, A.; Dlala, M. GIS-Based MCDM—AHP Modeling for Flood Susceptibility Mapping of Arid Areas, Southeastern Tunisia. Geocarto Int. 2020, 35, 991–1017. [Google Scholar] [CrossRef]
- Heidari, A. Structural master plan of flood mitigation measures. Nat. Hazards Earth Syst. Sci. 2009, 9, 61–75. [Google Scholar] [CrossRef]
- Hansson, K.; Danielson, M. A framework for evaluation of flood management strategies. J. Environ. Manag. 2008, 86, 465–480. [Google Scholar] [CrossRef] [PubMed]
- Shah, M.A.R.; Rahman, A.; Chowdhury, S.H. Challenges for achieving sustainable flood risk management. J. Flood Risk Manag. 2015, 11, S352–S358. [Google Scholar] [CrossRef] [Green Version]
- Ho, M.; Lall, U.; Allaire, M.; Devineni, N.; Kwon, H.H.; Pal, I.; Raff, D.; Wegner, D. The future role of dams in the United States of America. Water Resour. Res. 2017, 53, 982–998. [Google Scholar] [CrossRef]
- Al Rashed, M.; Sefelnasr, A.; Sherif, M.; Murad, A.; Alshamsi, D.; Aliewi, A.; Ebraheem, A.A. Novel concept for water scarcity quantification considering nonconventional and virtual water resources in arid countries: Application in Gulf Cooperation Council countries. Sci. Total Environ. 2023, 882, 163473. [Google Scholar] [CrossRef]
- HEC-FDA. Flood Damage Reduction Analysis: HEC-FDA User’s Manual; HEC: Davis, CA, USA, 1998; Volume 72. [Google Scholar]
- Andoh, R.Y.G.; Declerck, C. A cost effective approach to stormwater management? Source control and distributed storage. Water Sci. Technol. 1997, 36, 307–311. [Google Scholar] [CrossRef]
- Montaldo, N.; Mancini, M.; Rosso, R. Flood hydrograph attenuation induced by a reservoir system: Analysis with a distributed rainfall-runoff model. Hydrol. Process. 2004, 18, 545–563. [Google Scholar] [CrossRef]
- Emerson, C.H.; Welty, C.; Traver, R.G. Watershed-Scale Evaluation of a System of Storm Water Detention Basins. J. Hydrol. Eng. 2005, 10, 237–242. [Google Scholar] [CrossRef]
- Kurz, B.; Wang, X.; Silva, L.D.; Hanson, S.K.; Kurz, M.D.; Peck, W.D.; Simonsen, T.K.; Steadman, E.N. An Evaluation of Basinwide, Distributed Storage in the Red River Basin: The Waffle® Concept; Energy & Environmental Research Center, University of North Dakota: Grand Forks, ND, USA, 20 June 2007; Volume 23. [Google Scholar]
- Ravazzani, G.; Gianoli, P.; Meucci, S.; Mancini, M. Assessing downstream impacts of detention basins in urbanized river basins using a distributed hydrological model. Water Resour. Manag. 2014, 28, 1033–1044. [Google Scholar] [CrossRef]
- Thomas, N.W. Simulating the Hydrologic Impact of Distributed Flood Mitigation Practices, Tile Drainage, and Terraces in an Agricultural Catchment. Ph.D. Thesis, The Graduate College, Iowa, The University of Iowa, Iowa City, IA, USA, 2015. [Google Scholar]
- Tapsell, S.M.; Penning-Rowsell, E.C.; Tunstall, S.M.; Wilson, T.L. Vulnerability to flooding: Health and social dimensions. Philos. Trans. R. Soc. A Math. Phys. Eng. Sci. 2002, 360, 1511–1525. [Google Scholar] [CrossRef] [PubMed]
- White, I.; Richards, J. Planning policy and flood risk: The translation of national guidance into local policy. Plan. Pr. Res. 2007, 22, 513–534. [Google Scholar] [CrossRef]
- Richards, J.; White, I.; Carter, J. Local planning practice and flood risk management in England: Is there a collective implementation deficit? Environ. Urbain 2008, 2, 11–20. [Google Scholar] [CrossRef] [Green Version]
- Dawson, R.J.; Ball, T.; Werritty, J.; Werritty, A.; Hall, J.W.; Roche, N. Assessing the effectiveness of non-structural flood management measures in the Thames Estuary under conditions of socio-economic and environmental change. Glob. Environ. Change 2011, 21, 628–646. [Google Scholar] [CrossRef]
- Kundzewicz, Z.W. Non-structural flood protection and sustainability. Water Int. 2002, 27, 3–13. [Google Scholar] [CrossRef] [Green Version]
- Finn, H. Dam failure and inundation modeling: Test case for Ham Dam. In Summary Report, Project Conducted by “DHI Gulf” for UAE Ministry of Environment & Water; UAE Ministry of Environment & Water: Dubai, United Arab Emirates, 2008. [Google Scholar]
- FEMA. Risk Mapping, Assessment and Planning (Risk MAP). 2019. Available online: https://www.fema.gov/risk-mappingassessment-and-planning-risk-map (accessed on 20 July 2023).


| S. No | Map Layer | Data Used—Source |
|---|---|---|
| 1 | Rainfall | CHRS RainSphere (http://chrs.web.uci.edu) (accessed on 18 May 2023) |
| 2 | DEM | USGS-Earth Explorer website, 30 m resolution, (https://earthexplorer.usgs.gov/) (accessed on 25 April 2023) |
| 3 | Drainage Density | Derived from DEM |
| 4 | Elevation | Derived from DEM |
| 5 | Slope | Derived from DEM |
| 6 | Land use / Land cover | Sentinel-2 Satellite Image (2023), 20 m spatial resolution; dated 8 March 2023 Landsat 5 TM (1990) 30 m, spatial resolution; dated 19 Dec 1990 Landsat 5 TM (2000) 30 m, spatial resolution; dated 28 May 2000 Landsat 7 ETM (2010) 30 m, spatial resolution; dated 20 Sep 2010 |
| 7 | Geology | Sentinel-2 satellite Image 20 m spatial resolution |
| 8 | Geomorphology | Sentinel-2 satellite Image 20 m spatial resolution |
| 9 | Soil | UAE—Soil Museum, https://www.emiratessoilmuseum.org (accessed on 18 May 2023) |
| S. No | Land Use/Land Cover Class | Area (Km2) |
|---|---|---|
| 1 | Builtup-Residential | 31.54 |
| 2 | Builtup-Commercial | 6.48 |
| 3 | Builtup-Residential/Plantation | 20.76 |
| 4 | Builtup-Under development | 6.06 |
| 5 | Builtup-Mining | 14.26 |
| 6 | Barren Lands | 40.20 |
| 7 | Builtup-Oil storage areas | 5.79 |
| 8 | Airport | 5.9 |
| 9 | Beaches | 0.91 |
| 10 | Fujairah Port | 11.7 |
| 11 | Hajar Mountains | 403.82 |
| S. No | Map Layer | Classes | Rank | Weightage (%) |
|---|---|---|---|---|
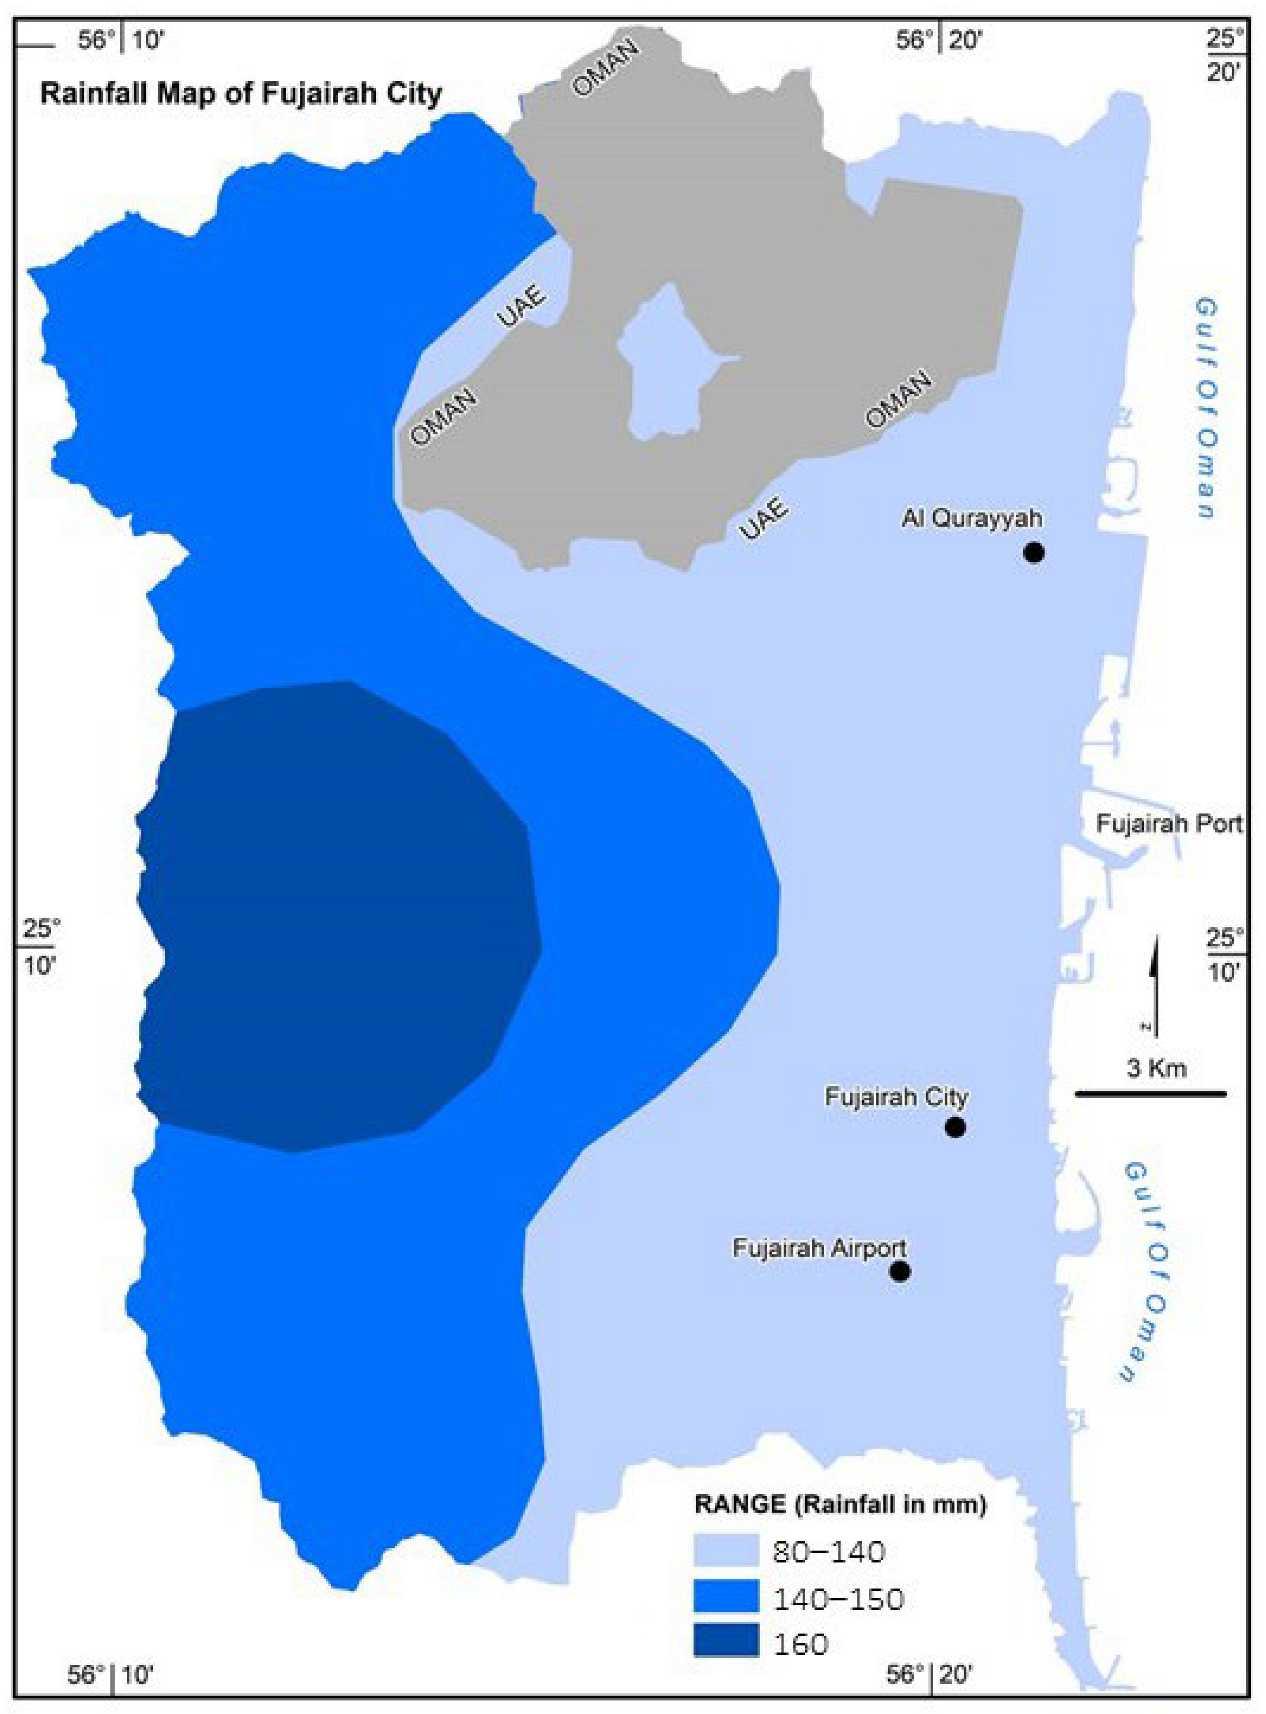
| 1 | Rainfall in mm | 80–140 | 3 | 18.4 |
| 140–150 | 4 | |||
| 160> | 5 | |||
| 2 | Drainage Density | 0–360 | 5 | 14.3 |
| 360–725 | 4 | |||
| 725–1088 | 3 | |||
| 1088–1450 | 2 | |||
| 1450–1800 | 1 | |||
| 3 | Elevation in M | 0–50 | 5 | 12.2 |
| 50–150 | 4 | |||
| 150–250 | 3 | |||
| 250–350 | 2 | |||
| >350 | 1 | |||
| 4 | Slope in (%) | <5 | 5 | 13.4 |
| 5–10 | 4 | |||
| 10–15 | 3 | |||
| 15–20 | 2 | |||
| >20 | 1 | |||
| 5 | Geology | Igneous and Metamorphic | 2 | 10.1 |
| Permian to Cretacious Sedimentary | 2 | |||
| Quaternary Alluvium in Wadis, Plains, Sands | 4 | |||
| Quaternary Coastal deposits | 5 | |||
| 6 | Geomorphology | Alluvial Plains | 4 | 9.0 |
| Coastal Plains | 5 | |||
| Flood Plain | 4 | |||
| Beaches | 5 | |||
| Mountains | 1 | |||
| 7 | Land Use and Land Cover | Builtup-Residential | 5 | 14.5 |
| Builtup-Commercial | 5 | |||
| Builtup-Residential/Plantation | 4 | |||
| Builtup-Under development | 4 | |||
| Builtup-Mining | 3 | |||
| Barren Lands | 2 | |||
| Builtup-Oil storage areas | 5 | |||
| Airport | 5 | |||
| Beaches | 5 | |||
| Fujairah Port | 5 | |||
| Hajar Mountains | 1 | |||
| 8 | Soil | Aquisalids | 5 | 8.1 |
| Haplocalcids | 4 | |||
| Torriorthents | 3 | |||
| Rock outcrops | 2 | |||
| Mountains | 1 |
Disclaimer/Publisher’s Note: The statements, opinions and data contained in all publications are solely those of the individual author(s) and contributor(s) and not of MDPI and/or the editor(s). MDPI and/or the editor(s) disclaim responsibility for any injury to people or property resulting from any ideas, methods, instructions or products referred to in the content. |
© 2023 by the authors. Licensee MDPI, Basel, Switzerland. This article is an open access article distributed under the terms and conditions of the Creative Commons Attribution (CC BY) license (https://creativecommons.org/licenses/by/4.0/).
Share and Cite
Subraelu, P.; Ahmed, A.; Ebraheem, A.A.; Sherif, M.; Mirza, S.B.; Ridouane, F.L.; Sefelnasr, A. Risk Assessment and Mapping of Flash Flood Vulnerable Zones in Arid Region, Fujairah City, UAE-Using Remote Sensing and GIS-Based Analysis. Water 2023, 15, 2802. https://doi.org/10.3390/w15152802
Subraelu P, Ahmed A, Ebraheem AA, Sherif M, Mirza SB, Ridouane FL, Sefelnasr A. Risk Assessment and Mapping of Flash Flood Vulnerable Zones in Arid Region, Fujairah City, UAE-Using Remote Sensing and GIS-Based Analysis. Water. 2023; 15(15):2802. https://doi.org/10.3390/w15152802
Chicago/Turabian StyleSubraelu, P., Alaa Ahmed, Abdel Azim Ebraheem, Mohsen Sherif, Shaher Bano Mirza, Fouad Lamghari Ridouane, and Ahmed Sefelnasr. 2023. "Risk Assessment and Mapping of Flash Flood Vulnerable Zones in Arid Region, Fujairah City, UAE-Using Remote Sensing and GIS-Based Analysis" Water 15, no. 15: 2802. https://doi.org/10.3390/w15152802