Article

Assessing the Movements, Habitat Use, and Site Fidelity of the Giant Freshwater Whipray (Urogymnus polylepis) with Acoustic Telemetry in the Maeklong River, Thailand

by
Thanida Haetrakul
1,2,
Teresa Campbell
3,
Chayanis Daochai
2,4,*,
Nitiwadee Keschumras
2,
Tanatporn Tantiveerakul
2,
Zeb Hogan
5,* and
Nantarika Chansue
2
1
Faculty of Veterinary Science, Chulalongkorn University, Bangkok 10330, Thailand
2
Veterinary Medical Aquatic Animal Research Center of Excellence, Chulalongkorn University, Bangkok 10330, Thailand
3
McGinley and Associates, 6995 Sierra Center Pkwy, Reno, NV 89511, USA
4
Faculty of Veterinary Science, Prince of Songkla University, Songkla 90110, Thailand
5
Department of Biology and Global Water Center, University of Nevada, 1664 N Virginia St, Reno, NV 89557, USA
*
Authors to whom correspondence should be addressed.
Water 2023, 15(13), 2311; https://doi.org/10.3390/w15132311
Submission received: 3 May 2023 / Revised: 16 June 2023 / Accepted: 16 June 2023 / Published: 21 June 2023

Abstract

:
We used acoustic telemetry to assess site fidelity, movement patterns, and habitat use within the lower Maeklong River, Thailand, by 22 giant freshwater whipray Urogymnus polylepis. This study is the first of its kind for this rare, endangered species, and it begins to fill critical information gaps about its ecology and life history. Study animals were tagged subcutaneously in the dorsal area with acoustic transmitters and tracked for 12 months using a fixed array of eight receivers. Receivers were positioned within an 18 rkm section of the Maeklong, starting approximately 4 rkm upstream from the mouth. We calculated individual residency indices, tracked longitudinal movements, and assessed annual and seasonal patterns of site use. We also investigated spatial use patterns, diel activity patterns, and relationships of temperature and site fidelity. We detected 86% of our tagged whiprays, 53% of which were detected for the majority of the study period. Whiprays exhibited high site fidelity across seasons. Individuals made long longitudinal movements within the site for much of the study period but seemed to remain closer to the estuary during the second half of the rainy season and early winter. All receivers had large numbers of detections, but upstream receivers were visited for longer time durations than downstream receivers. A receiver in the middle of the study area had the highest detection rate, but low detection durations, suggesting that this receiver is in a migration corridor. A mix of immature and mature males and females was present in the site throughout the study period, suggesting that this area is not exclusively a breeding or nursery site. However, the high site fidelity suggests that this is an important aggregation site for the species. Effective conservation measures may include conservation zones and a shrimp reintroduction program upstream, ensuring fish passage through the middle of the site, and regulating traffic and pollution downstream. We found acoustic telemetry to be an effective study method and encourage its use to improve understanding of the giant freshwater whipray.

1. Introduction

The giant freshwater whipray Urogymnus polylepis is a large-bodied stingray native to waters of eastern India and Southeast Asia [1]. Range wide, the species is listed as endangered by the International Union for Conservation of Nature (IUCN), and the Thailand population is listed as critically endangered [2,3]. It is well known for its large size (fishers report individuals as large as 600 kg [4]), and has received recent media attention from a record-breaking specimen caught and released in Cambodia in June 2022 that was officially recognized as the world’s largest freshwater fish [5]. Despite this, almost nothing is known about its biology, ecology, or life-history traits [1]. Mounting evidence suggests that multiple populations across its range are in a severe state of decline [1]. The whipray faces a variety of threats, including fishing, pollution, habitat destruction, and lack of legal protection [1]. Therefore, research is urgently needed to fill knowledge gaps and inform management strategies and conservation priorities. An urgent priority is to identify critical habitats and population strongholds that should be given immediate protection.
In Thailand, the giant freshwater whipray received protection in 2018 under the Wildlife Preservation and Protection Act. The species occurs in multiple rivers throughout the country, but no information exists on its population density, abundance, habitat use, or movement and residency patterns [1]. The Maeklong River in the southwest corner of central Thailand may hold the most robust population, as evidenced by large sample sizes, news reports of large individuals [1], and regular catches of mature individuals by recreational catch-and-release anglers (N. Chansue, pers. comm.). As such, this river and its population of giant freshwater whipray are deserving of research attention and protection.
To help determine the importance of the Maeklong River to Thailand’s giant freshwater whipray population, we studied movement and residency patterns within an 18-river-kilometer (rkm) portion of the lower Maeklong River where it empties into the Bay of Bangkok. Animal movements often reflect ecologically important behaviors, such as food acquisition, predation avoidance, mating, and locating nursery areas [6]. These movements can also be influenced by environmental factors [7]. Acoustic telemetry is recognized as a useful tool for defining home range, habitat use, and distribution [8], but very few studies have been conducted with batoid elasmobranchs (skates and rays) [9,10,11,12,13]. One study of a closely related species, the freshwater whipray Urogymnus dalyensis, in Australia found high site fidelity to a small part of the Wenlock River and that whipray movements were influenced by both the diel and lunar cycles [9]. These types of insights are important for defining protected areas and seasonal fishing closures.
The objectives of our research were to (1) describe spatio-temporal trends in the giant freshwater whipray’s use of the lower Maeklong River by assessing site fidelity, movement patterns, and habitat use, (2) assess diel patterns of presence events, and (3) examine the relationship between site fidelity and water temperature. We used acoustic telemetry to determine areas of high use in the lower Maeklong River, how long the whiprays remained in this area throughout the year, and whether measured environmental parameters were correlated with residency patterns. This work will help to inform conservation and management practices in the Maeklong and for the broader population of giant freshwater whipray throughout Thailand, as well as Southeast Asia. This research is the first study of its kind for this species, and we hope it will pave the way for more ecological work and important steps toward conservation.

2. Materials and Methods

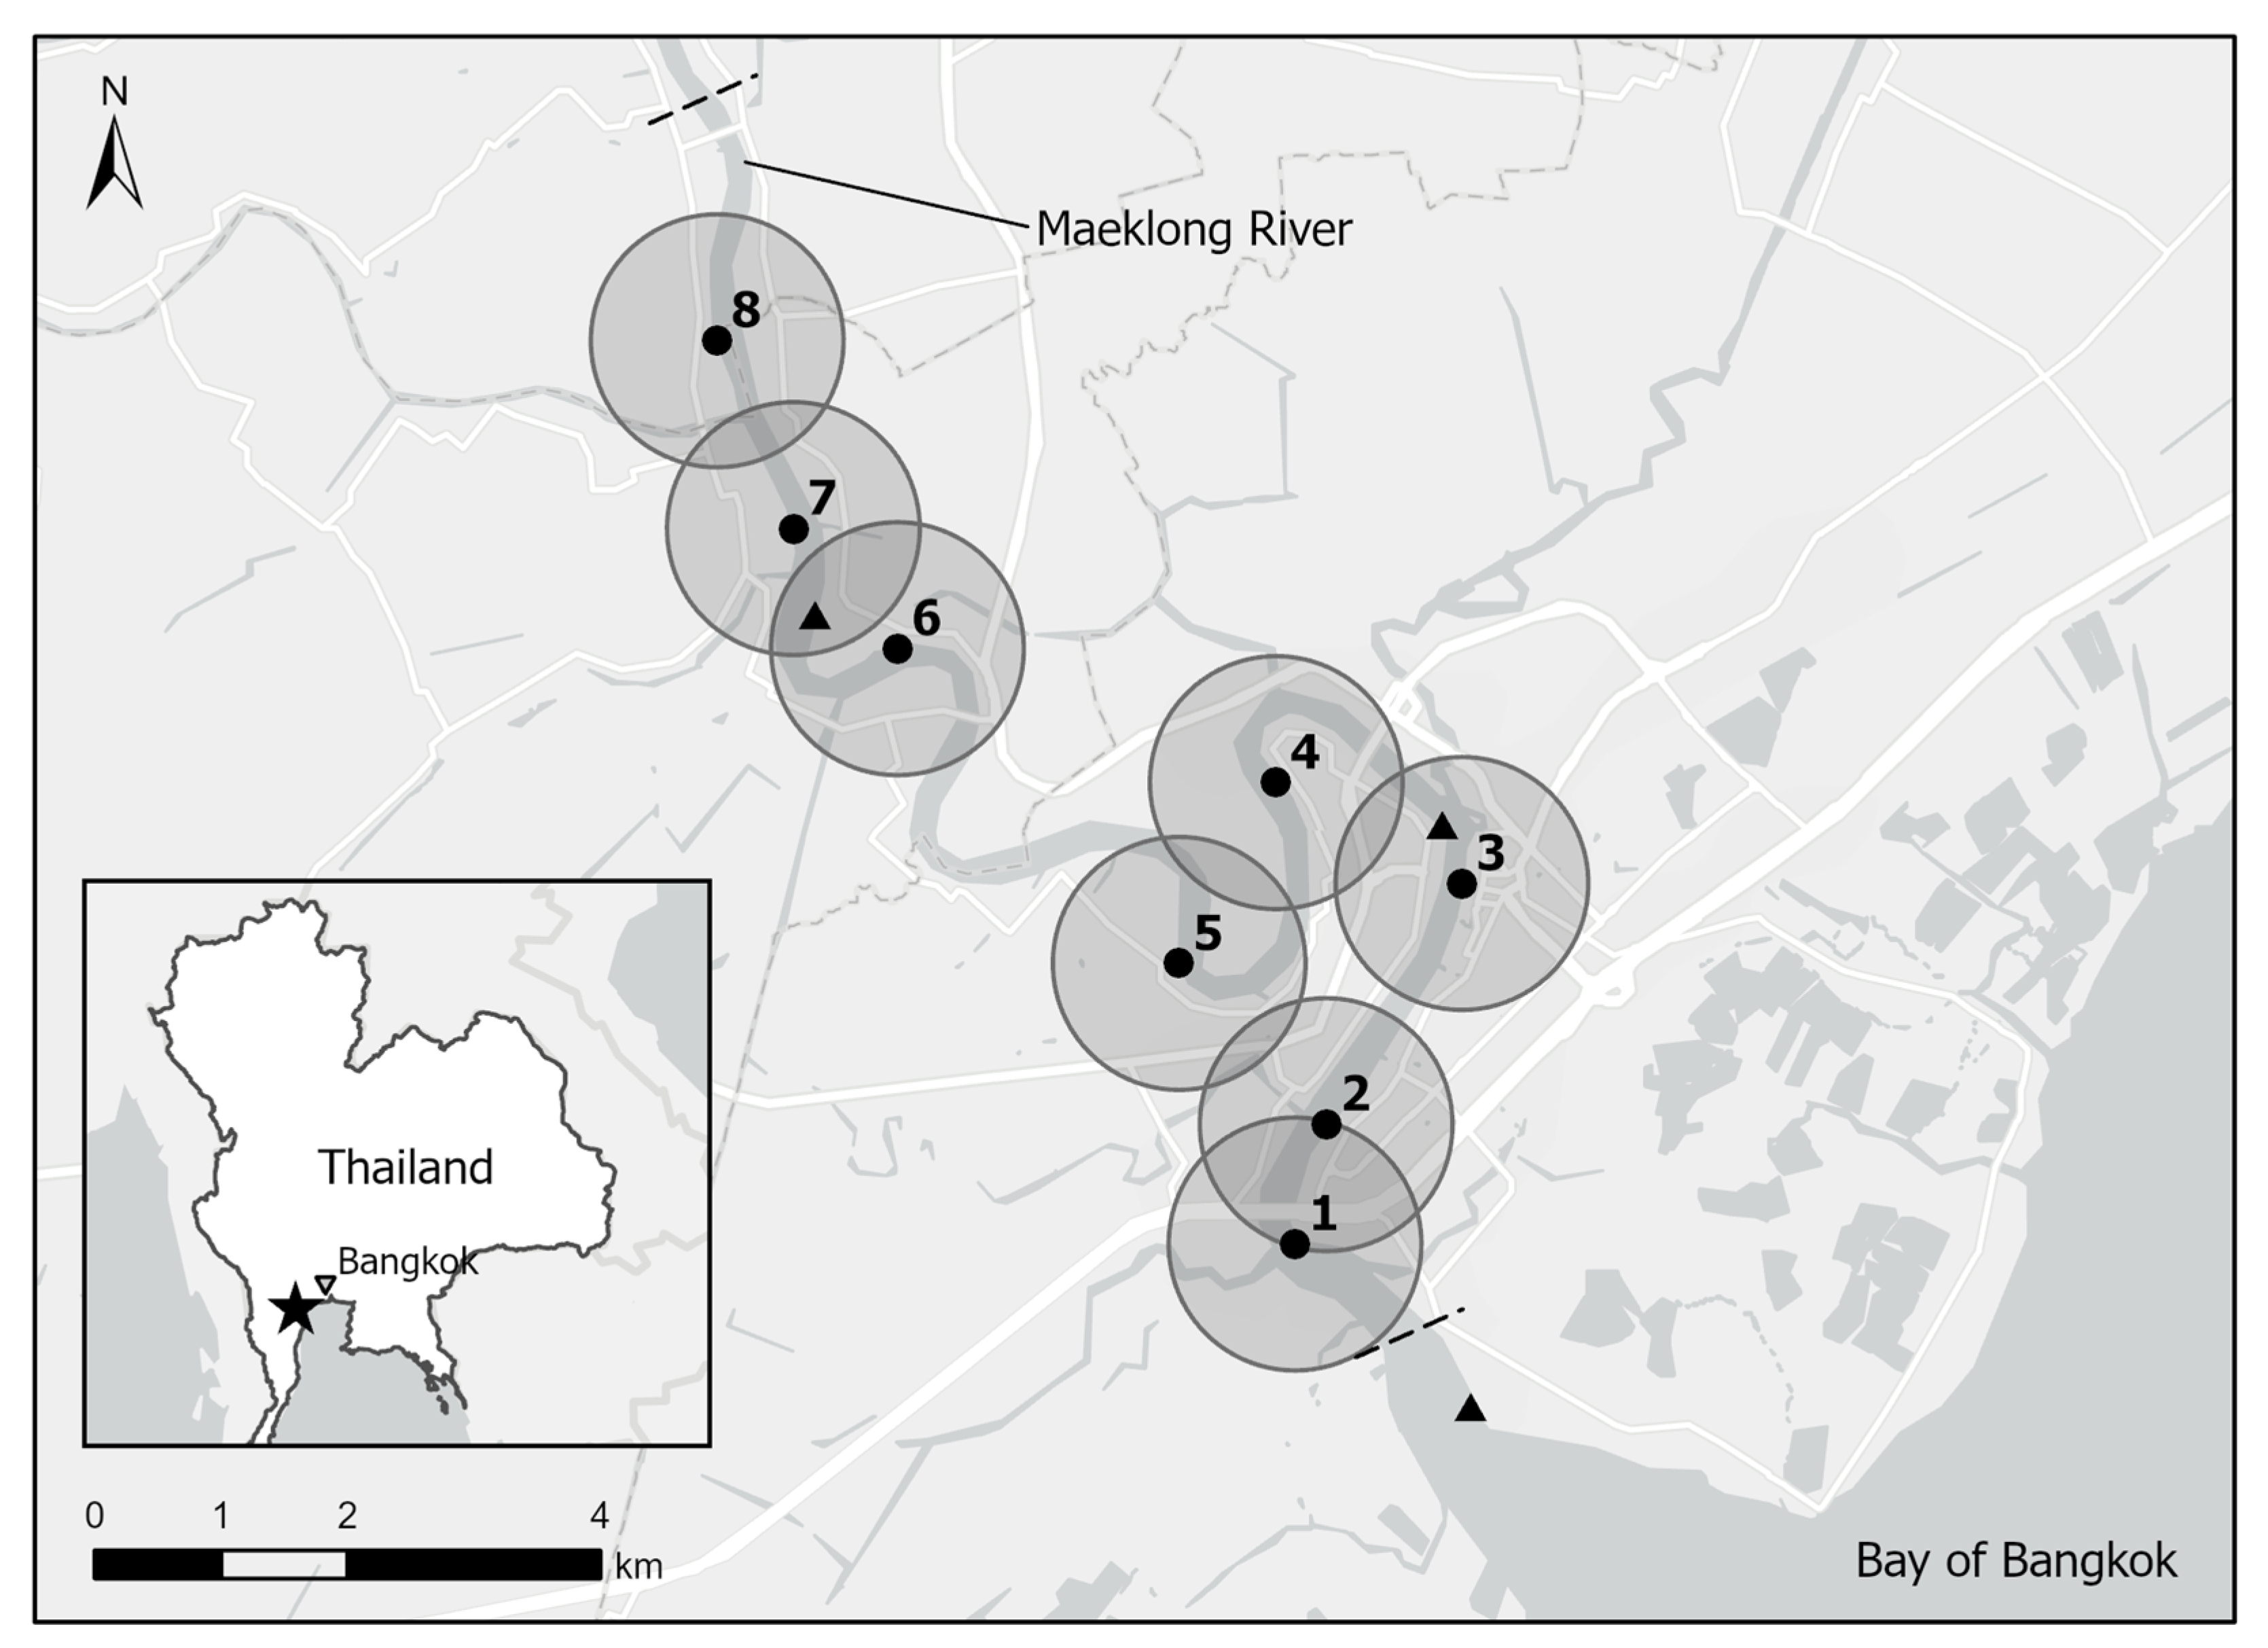
2.1. Study Site and Receiver Deployment

The research was conducted in the Maeklong River, Thailand. The Maeklong is located in southwestern central Thailand. It originates at the confluence of the Khwae Noi and Khwae Yai rivers in Kanchanaburi and flows 130 km into the Bay of Bangkok. The receivers were deployed in an 18 rkm stretch of the lower part of the river in Samutsongkram, Thailand (Figure 1). This part of the river has multiple uses, including for recreation, ecotourism, and aquaculture and as a harbor for fishing vessels and public use. Near the estuary, the primary use is as a harbor, while upstream, aquaculture, recreation, and ecotourism become more important (Figure 1; Table 1). Near the estuary, boat traffic is more concentrated, and the riverside areas are more developed with residences, businesses, factories, and shipyards. Contamination from toxic chemicals and heavy metals may be more prevalent in this area, which could be problematic for the giant freshwater whipray [14]. The upstream portion of our study site has been selected for a shrimp reintroduction program, which may benefit the giant freshwater whipray as shrimp is a key prey item [15].
The acoustic receiver array was made up of eight receivers. We used VEMCO VR2W acoustic receivers (VEMCO VR2W-180 kHz, Nova Scotia, Canada). The first receiver was deployed approximately 4 rkm upstream from the river mouth, and the last approximately 22 rkm upstream from the mouth (Figure 1). Each receiver was deployed 1–5 rkm away from each other in strategic locations throughout the river (Figure 1, Table 1). Depending on the type of tag used and environmental conditions, the receivers had a stated detection distance of 1000–2000 m, and so the array was monitoring approximately 20–22 rkm (Figure 1). Although range testing was not conducted for this study, other range testing studies have found that the detection range of these receivers can vary with environmental conditions [16] but also that they can reliably detect tags at 1000 m [17]. If 1000 m is taken as the maximum detection range, then a small gap in the middle of the study area would not be covered (Figure 1). However, we do not expect this to impact the implications of this study. The width of the river in the study area was typically less than 200 m, making the chance of receivers missing tagged whiprays as they passed by very low. River depths have not been measured in the study area, but unpublished data suggest Maeklong River depths range from 5 to 60 m, and fishers in this area describe depths from 5 to 20 m (Chayanis Dochai, pers. comm.).
The receivers were deployed in March 2018 and remained in fixed locations throughout the study period. Receivers were attached to float stations with plastic mesh (Figure 2) and moored one to two meters (m) below the water surface [18]. Float stations were located 5–10 m from the shore, and their positions were adjusted according to water level. Receivers were monitored daily by local residents.
Receivers were deployed for 12 months, from March 2018 to February 2019, and collected data continuously. Data were downloaded every month in the field using a laptop computer with the VUE software (version 2.4.2; VEMCO 2018) and the VEMCO Bluetooth communications kit (VEMCO, Bedford, Nova Scotia, Canada). VUE software is used to communicate with the receivers and download, organize, and process the detection data.

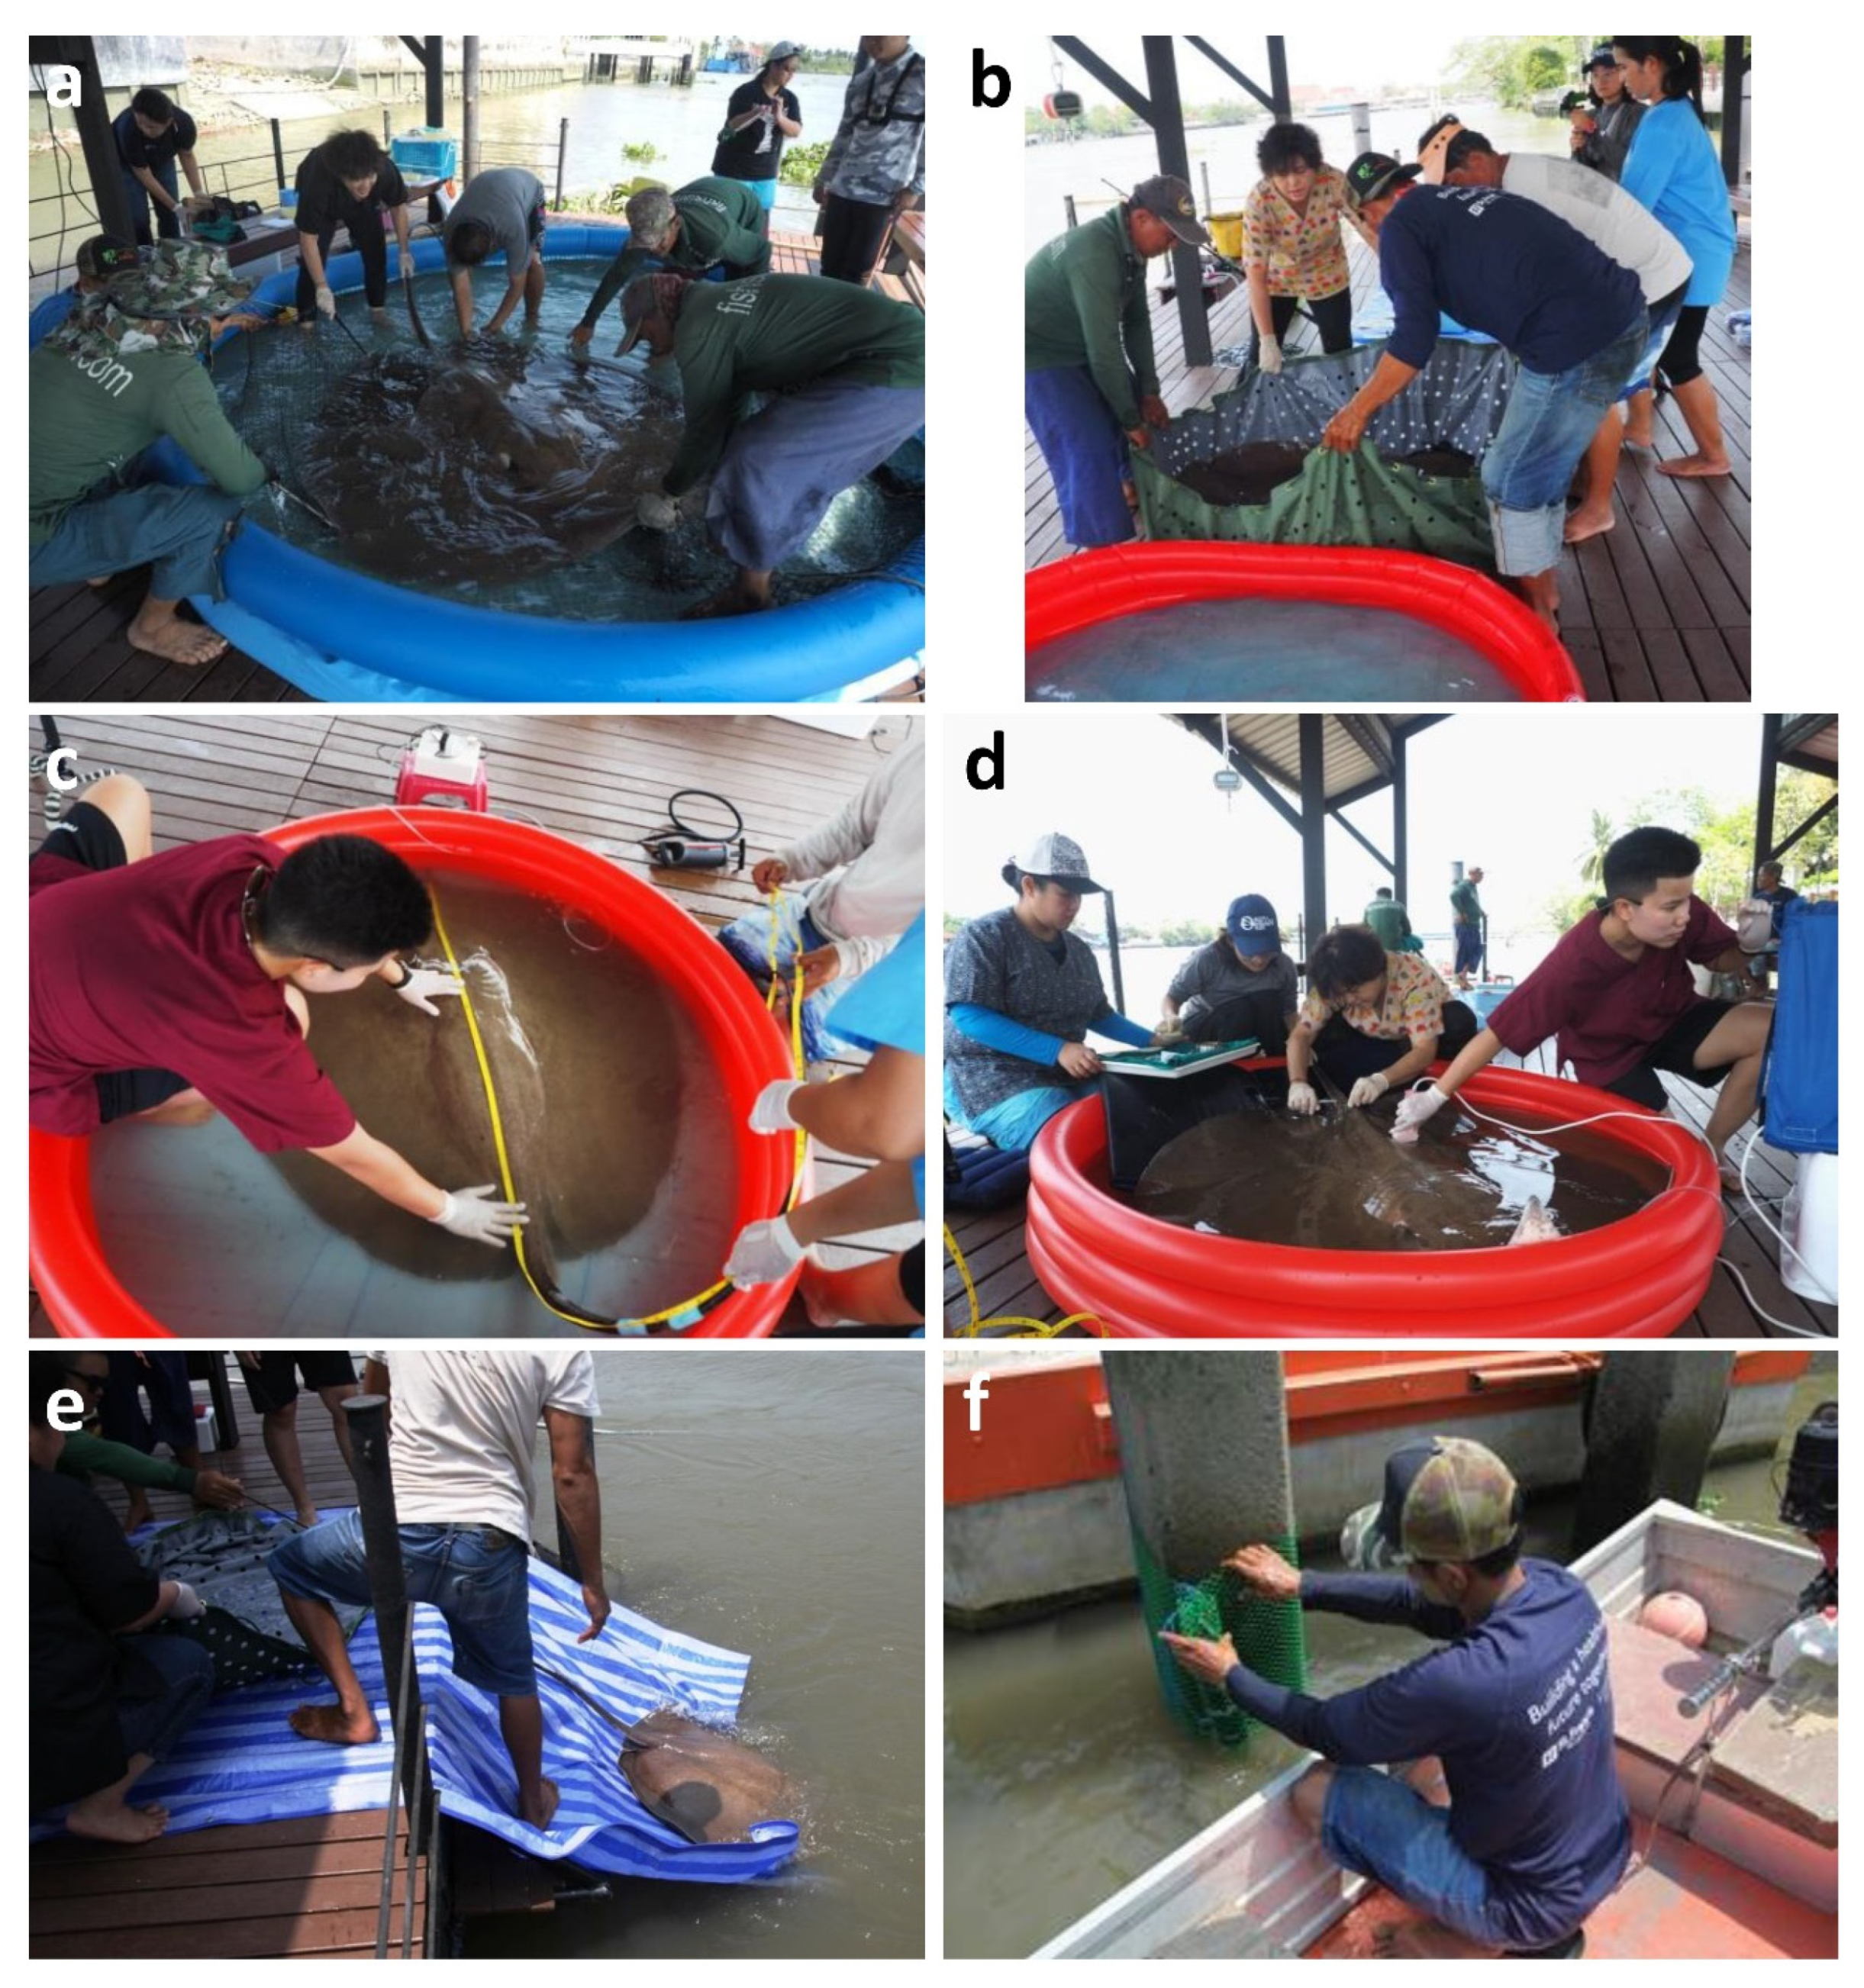
2.2. Animal Capture, Work-Up, and Tagging

This work was conducted under Institutional Animal Care and Use Committee (IACUC) protocol 1831064. Between 18 March and 23 July 2018, a total of 22 giant freshwater whiprays were captured within the fishing area (Figure 1) using circle hooks, 200 lb monofilament line, and tuna-style fishing rods. When captured, the whiprays were placed in net-like soft canvas and restrained using a non-anesthetic technique (Figure 2). The sting was wrapped with commercial Coban self-adherent wrap to protect the researchers. Whiprays were then transported to the bank and transferred into an inflatable swimming pool that was 2.5 m wide and 40 cm deep and filled with aerated water (Figure 2). Due to their large size, whiprays were handled in ventral recumbency rather than dorsal recumbency, which is commonly used with elasmobranchs to induce tonic immobility [19], because we felt that it would be less stressful on the animals.
Each whipray was measured for total length (TL), girdle length (GL), disc width (DW), and body weight (WT; Figure 2). Total length was measured from the tip of the snout to the end of the tail; girdle length was measured from the tip of the snout to the pelvic girdle; and disc width was measured between the tips of the wings. Girdle length was measured because of previous observations of whiprays with damage to their tails that would affect the total length measurement.
Sexual maturity was determined by calcified claspers [20] and scanned by My SonoU6 portable ultrasound with LN5-12 electronic linear array transducer or C2-8 curved array transducers (Figure 2). Ovarian or testicular status were assessed for sexual maturity [21,22]. Presence of embryo implantation or fetus was determined for both sides of the uterus [23].
Whiprays were tagged with passive integrated transponder (PIT) tags to provide a secondary form of identification if the whipray was recaptured. The PIT tag was inserted subcutaneously in the left precaudal area [24].
Each whipray was then tagged with an acoustic transmitter that communicated with the receiver array (Figure 2). We used V9-180 kHz transmitters that were 25 mm long, 9 mm in diameter, and 2.1 g in water. They emitted a code in 5–30 s randomized intervals and had an expected battery life of 12 months (VEMCO).
A local anesthetic (lidocaine) was applied to the right distal area, cranial to the pelvic girdle [9]. The whipray’s respiratory rate was monitored by observing the movement of the spiracle. An air cushion pad was placed under the abdomen to lift the surgical area above the water surface. The surgical area was sterilized using betadine solution, and a 1.5 cm incision was made approximately 3 cm lateral to the precaudal midline. The transmitter was inserted under the subcutaneous layer. The incision was closed using monofilament absorbable sutures with 2–4 interrupted mattress stiches and secured with a horizontal mattress stitch [25]. The incision was then coated with New-Skin Liquid Bandage. Once the surgery was completed, the whipray was injected intramuscularly with a prophylactic antibiotic.
Total handling time ranged from 10 to 12 min, with surgical time usually lasting less than 7 min. After the surgery and treatment, whiprays were released gently back into the river (Figure 2).

2.3. Data Analysis

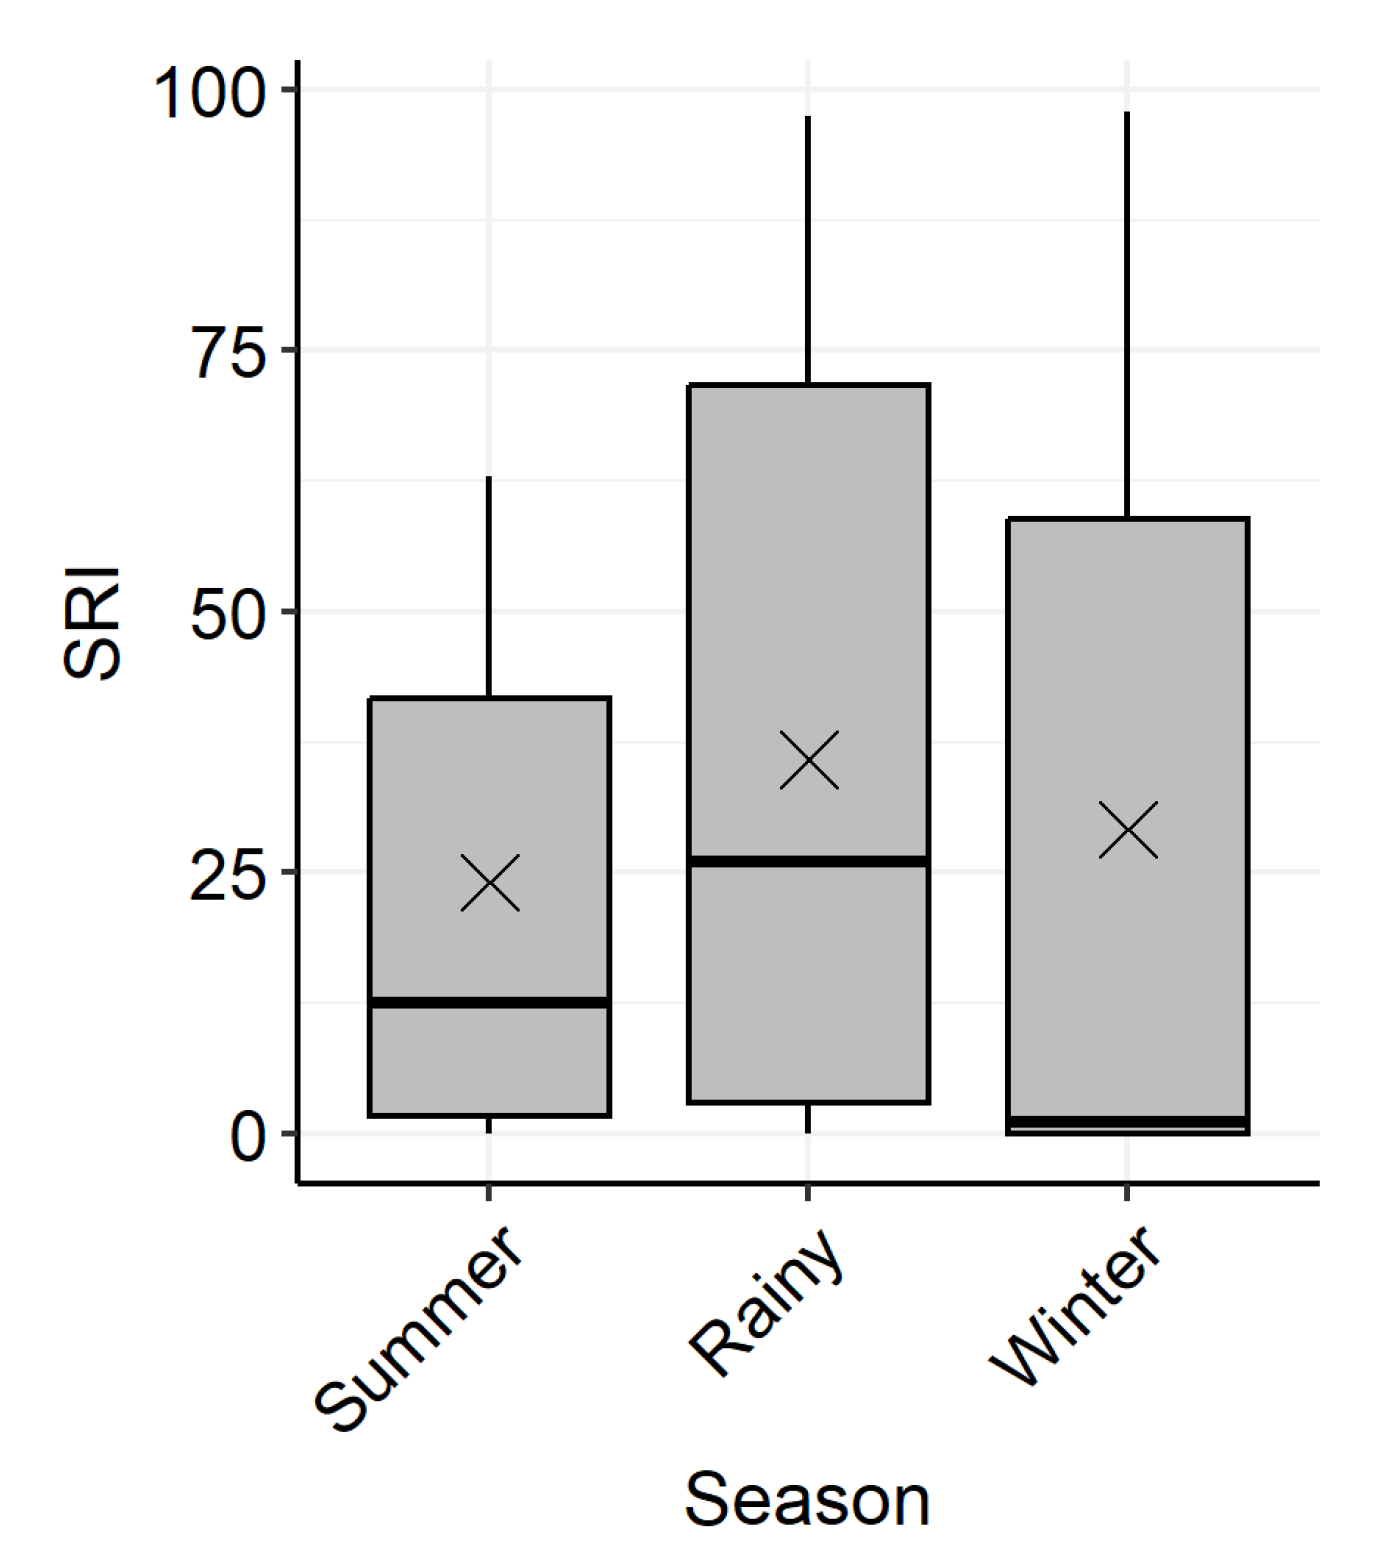
2.3.1. Annual and Seasonal Site Fidelity

Site fidelity was assessed by calculating residency indices (RI) for each whipray. RIs gave a measure of the proportion of the study duration the whipray was detected by the receiver array. RIs were calculated by dividing the number of days detected by the total number of monitoring days and multiplying by 100 (RI = days detected/days monitored × 100) [26,27]. Monthly residency indices (MRI) and seasonal residency indices (SRI) were also calculated, where MRI = days detected during the month/days monitored during the month × 100, and SRI = days detected during the season/days monitored during the season × 100 [27,28]. Seasons were defined as follows: summer = February through May, rainy = June through October, and winter = November through January.
Differences in RI among life-history groups (immature females, immature males, mature females, and mature males) were assessed using an analysis of variance (ANOVA) test with a significance level of α = 0.05. If ANOVA determined there were significant differences among groups, Tukey’s post hoc test was used to compare differences between each group. If a whipray was never detected by the receiver array after release, it was removed from the analyses because it could not be determined whether it was not detected because of the individual leaving the array or because of tag loss or mortality.

2.3.2. Spatial Variation in Site Use

The whiprays’ spatial use of the study site was assessed by examining individual longitudinal movement patterns and by assessing various receiver metrics. Total presence events, cumulative event duration, and average event duration were used to assess intensity of use at each receiver. A presence event was defined as two or more detections recorded on the same day by the same receiver. The duration of a presence event was calculated as the time difference between the first and last detections of a whipray at a given receiver within a day. Each detection corresponded to a pulse emitted by the transmitter, which occurred every 5 to 30 s, that was detected by the receiver. The number of detections, presence events, and presence duration in hours were calculated using the database management and data analysis functions of the VUE software (VUE Software Manual, Version 2.4.2, VEMCO 2018).
Because the number of presence events at a receiver is affected by the length of receiver deployment, and Receivers 6 and 7 had shorter deployments than the others, we used another metric, the detection index (DI), that was independent of receiver deployment duration and allowed direct comparison among all receivers. The detection index accounted for the time that the receiver was deployed, as well as the number of fish that were available for detection while the receiver was deployed. The detection index was calculated as the number of fish detection days divided by the number of fish days multiplied by 100 (DI = fish detection days / fish days x 100). Fish detection days is the sum of the number of days each fish was detected by the receiver. Thus, if three individual whiprays were detected by the same receiver in one day, the number of fish detection days would be equal to three. Fish days is the sum of the number of days that each fish was available for detection by the receiver. Thus, if a given receiver was operating at the beginning of the study before fish were tagged, then the number of fish days for that receiver was zero up until the day that fish were tagged. If, on the first day of tagging, four fish were tagged and released, and then the next day, three more fish were tagged and released, the total fish days for that receiver at the end of those two days of tagging would be seven. In this way, the detection index for each receiver was independent of the amount of time the receiver was deployed and the number of fish that were available for detection and, thus, could be compared directly across all receivers.

2.3.3. Diel Activity Patterns

To get an understanding of diel activity patterns, the number of presence events during the day and during the night were totaled for all whiprays and by sex and maturity (life-history groups). Presence events are indicative of whipray activity because whiprays must move into the detection range of a receiver in order to initiate a presence event. Day was considered to be 0730 to 1930, and night was 1930 to 0730. The ratio of the number of day events to the number of night events was calculated in order to understand whether individual whiprays tended to have more presence events during the day or at night. This ratio was calculated for the entire group of tagged whiprays, as well as by sex, maturity, and life-history group.

2.3.4. Relationship between Temperature and Site Fidelity

Water temperature, salinity, and tide (water depth) data were obtained from the Pollution Control Department database [29]. Data were taken from four monitoring stations positioned throughout the lower Maeklong River (Figure 1). Daily measurements were converted to mean monthly values, which were used to evaluate correlations with RI using Pearson’s correlation analysis. The monthly temperature means were compared with mean monthly RI for all whiprays and for female, male, immature, and mature groups. Significance of the correlation was accepted at the α = 0.05 level.

3. Results

3.1. Whipray Morphology and Physiology

The whiprays used for this study included 10 males and 12 females, as well as 10 mature and 12 immature individuals (Table 2). Body weights ranged from 13–105 kg (Table 2). Body size measurements ranged from 1.10–4.14 m TL (mean = 2.65 ± 0.75), 0.63–2.00 m GL (1.11 ± 0.38), and 0.72–2.06 m DW (1.19 ± 0.42) (Table 2). Mature females were significantly larger than mature males (p < 0.05) for all measurements except for WT, which was not analyzed statistically because of the small sample size for females (Table S1, Figure S1). Immature males and females were not significantly different in body size (Table S1, Figure S1). Summary statistics of body size grouped by sex and maturity may be found in Table S2. One female (tag number 1062) was pregnant with five pups.

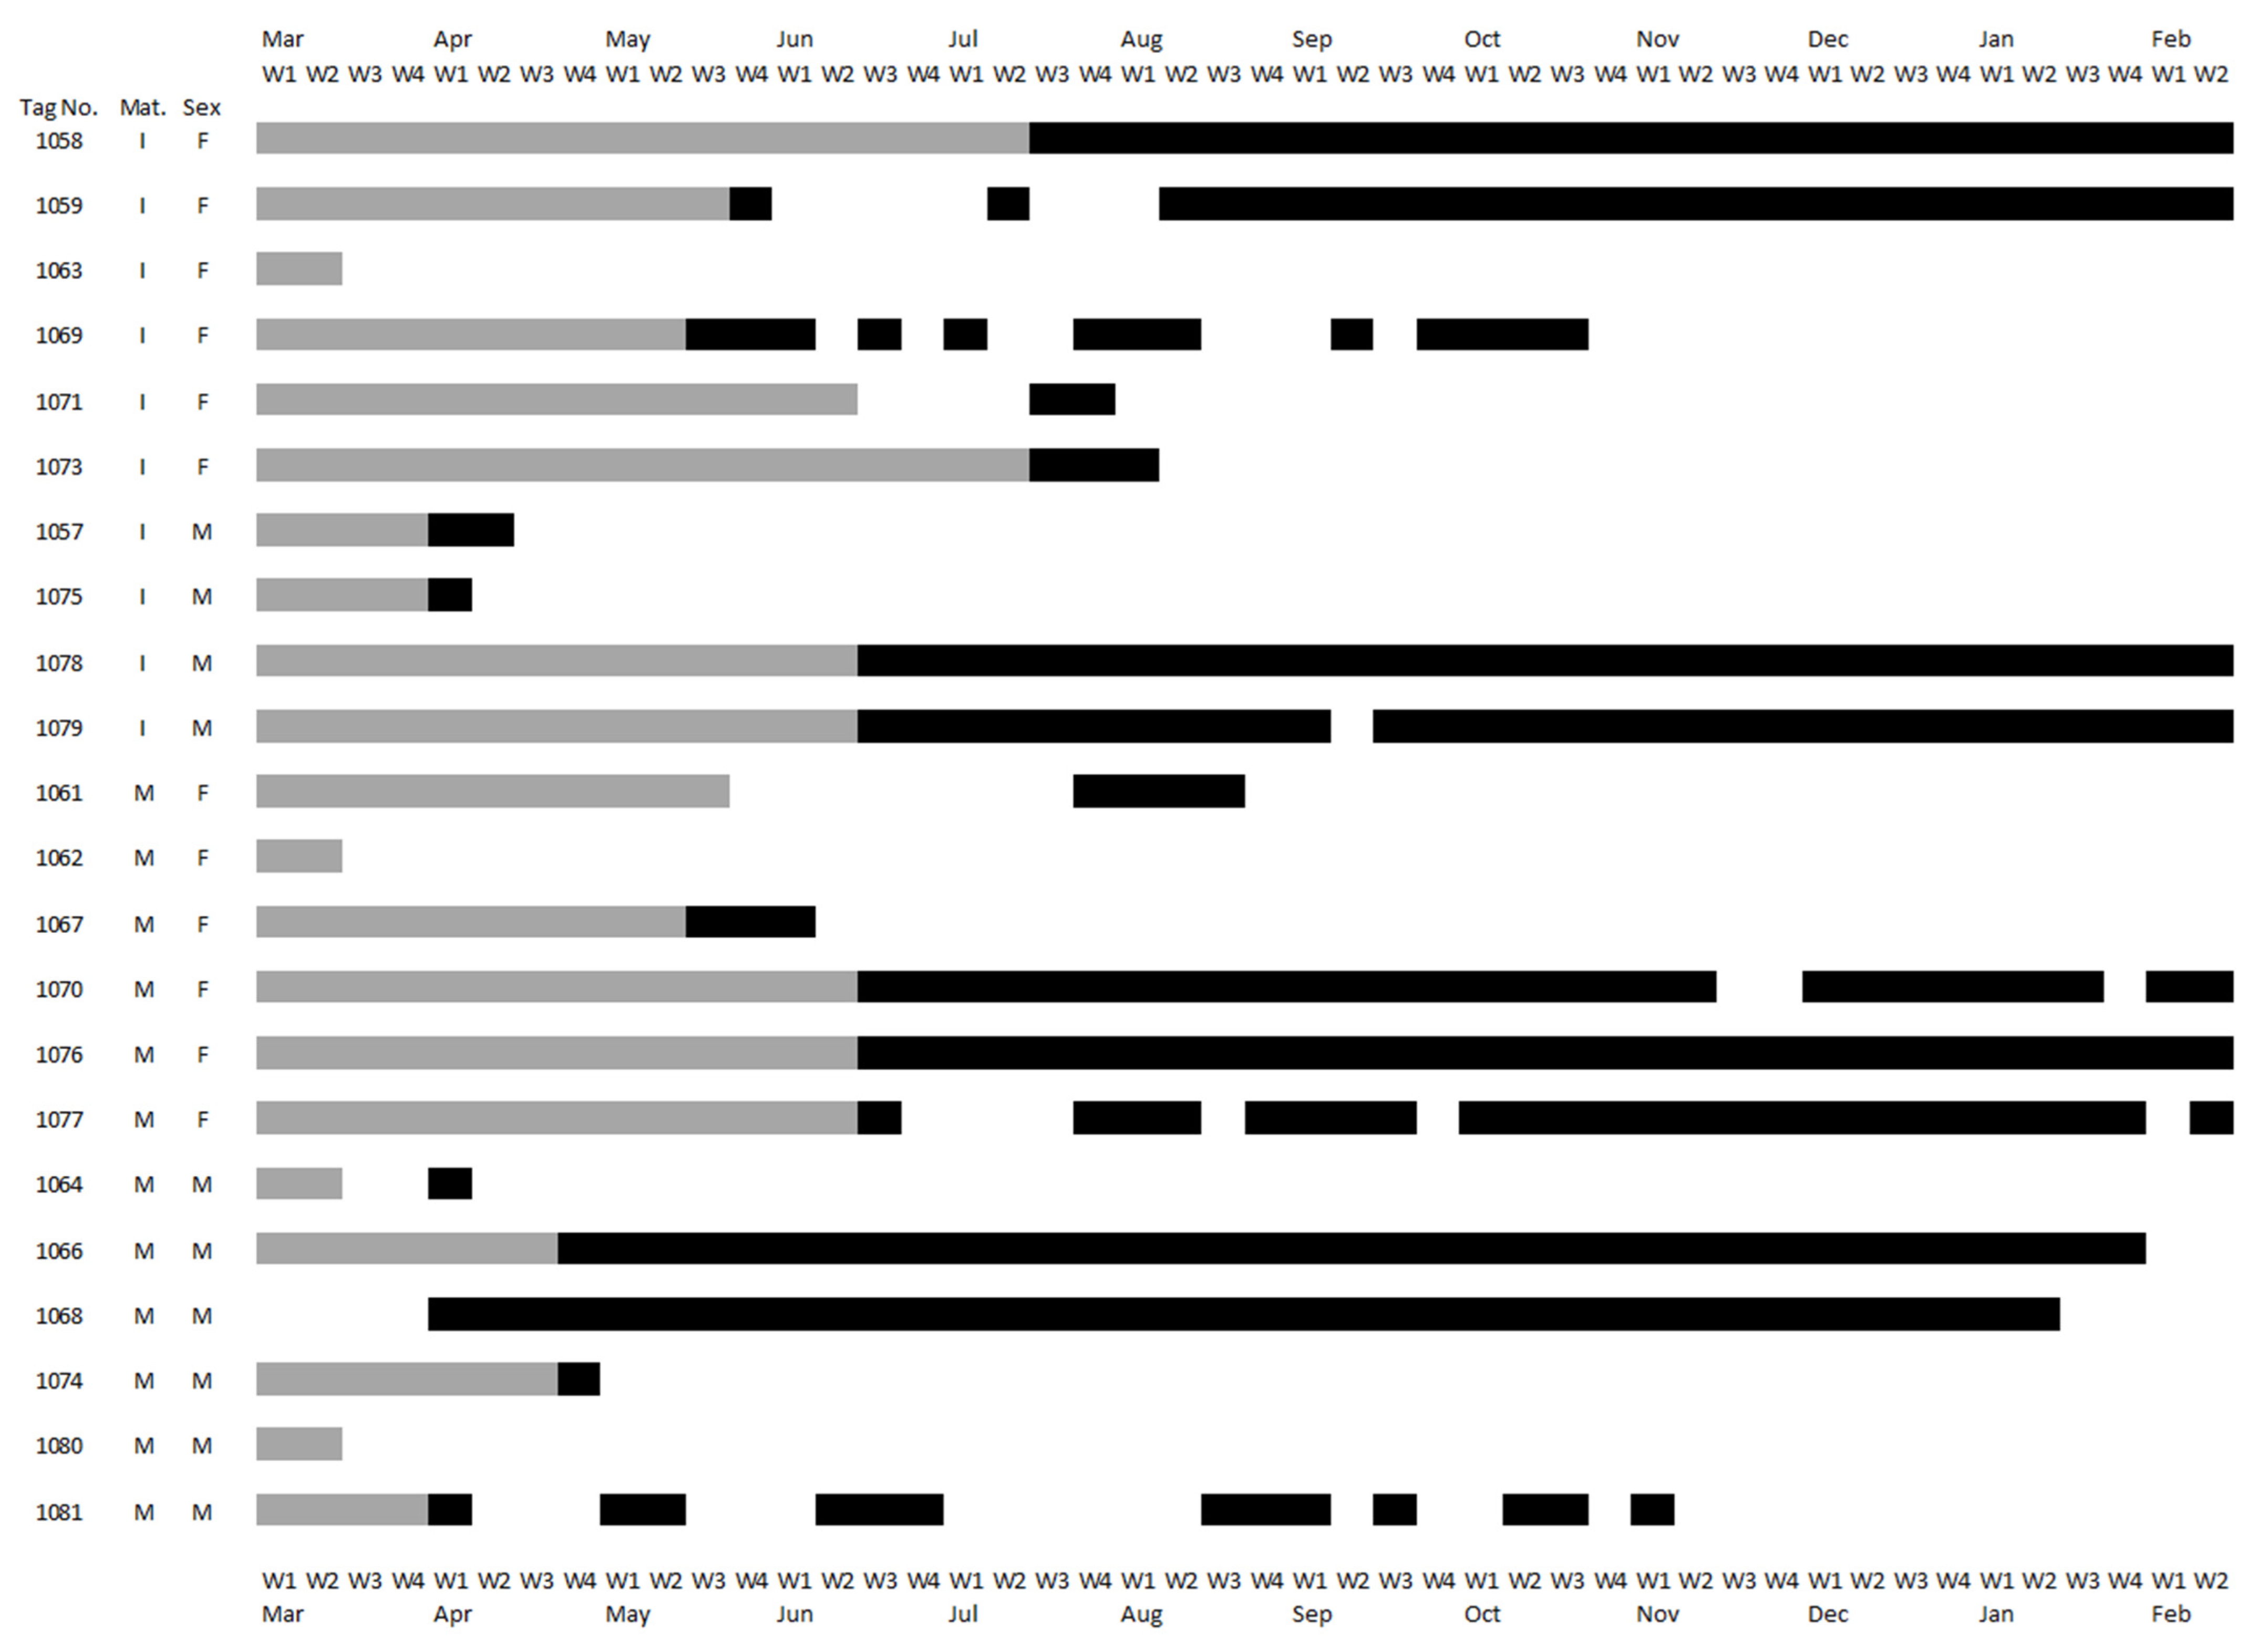
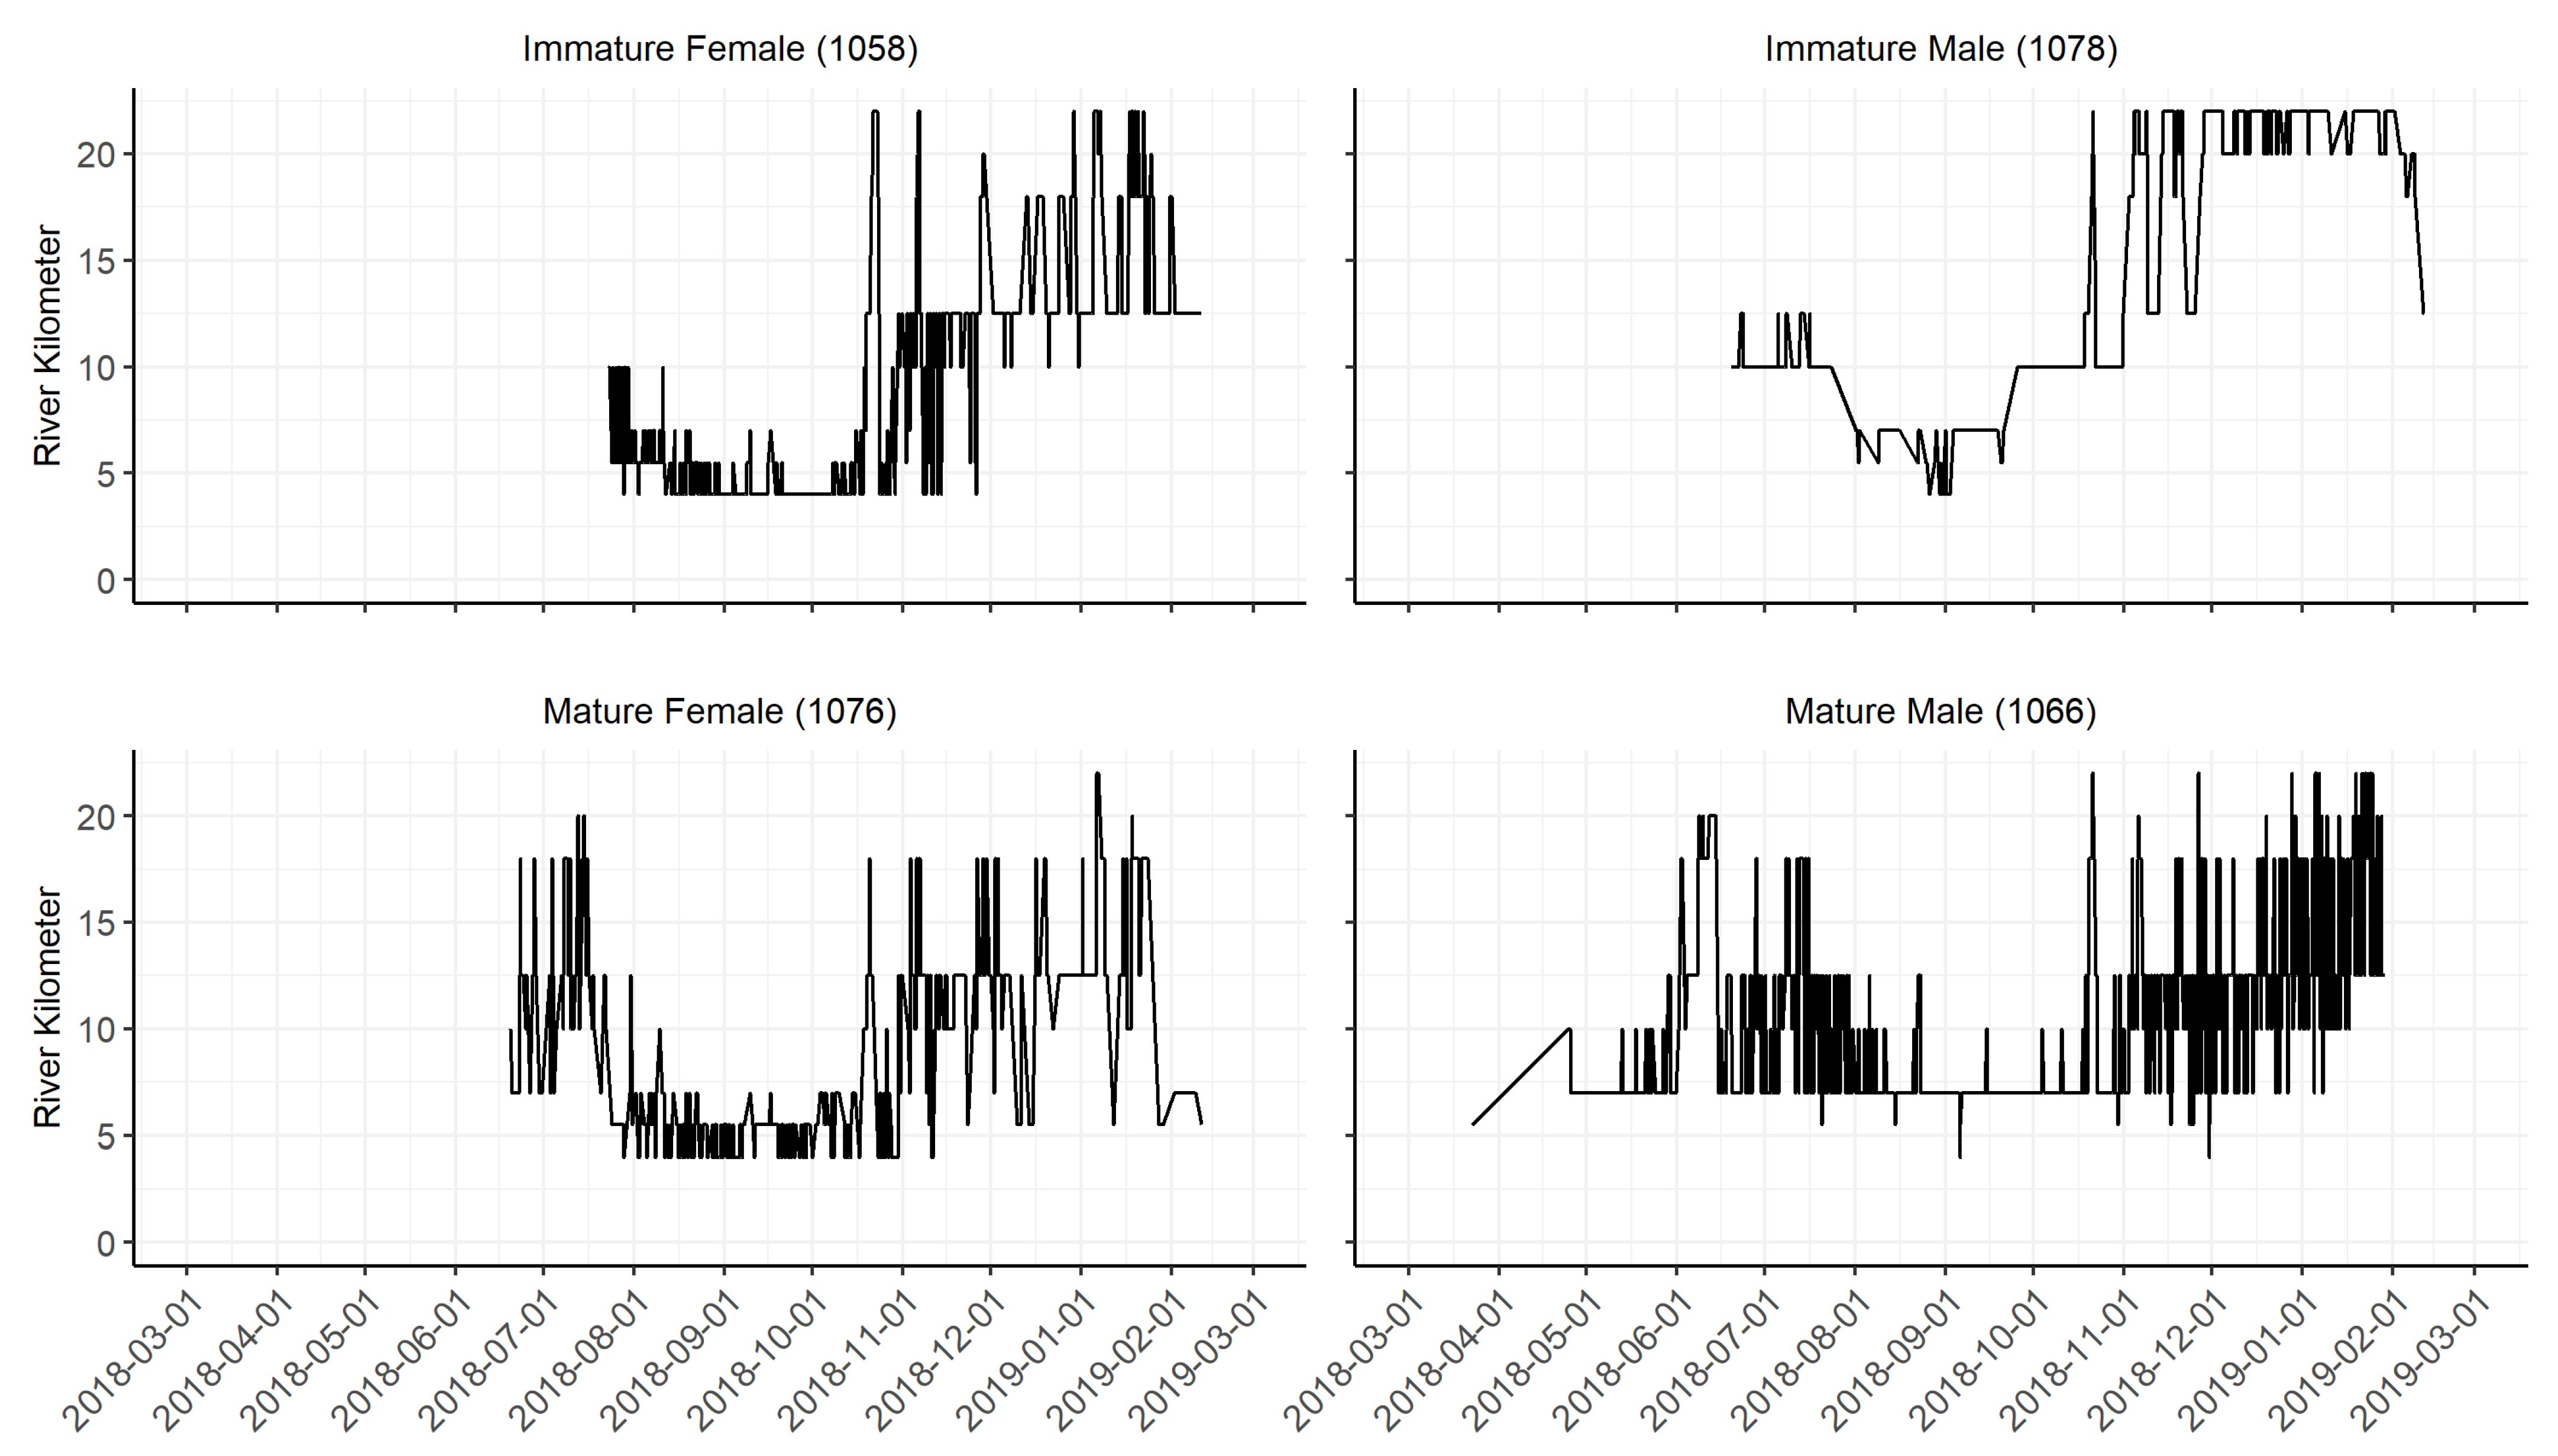
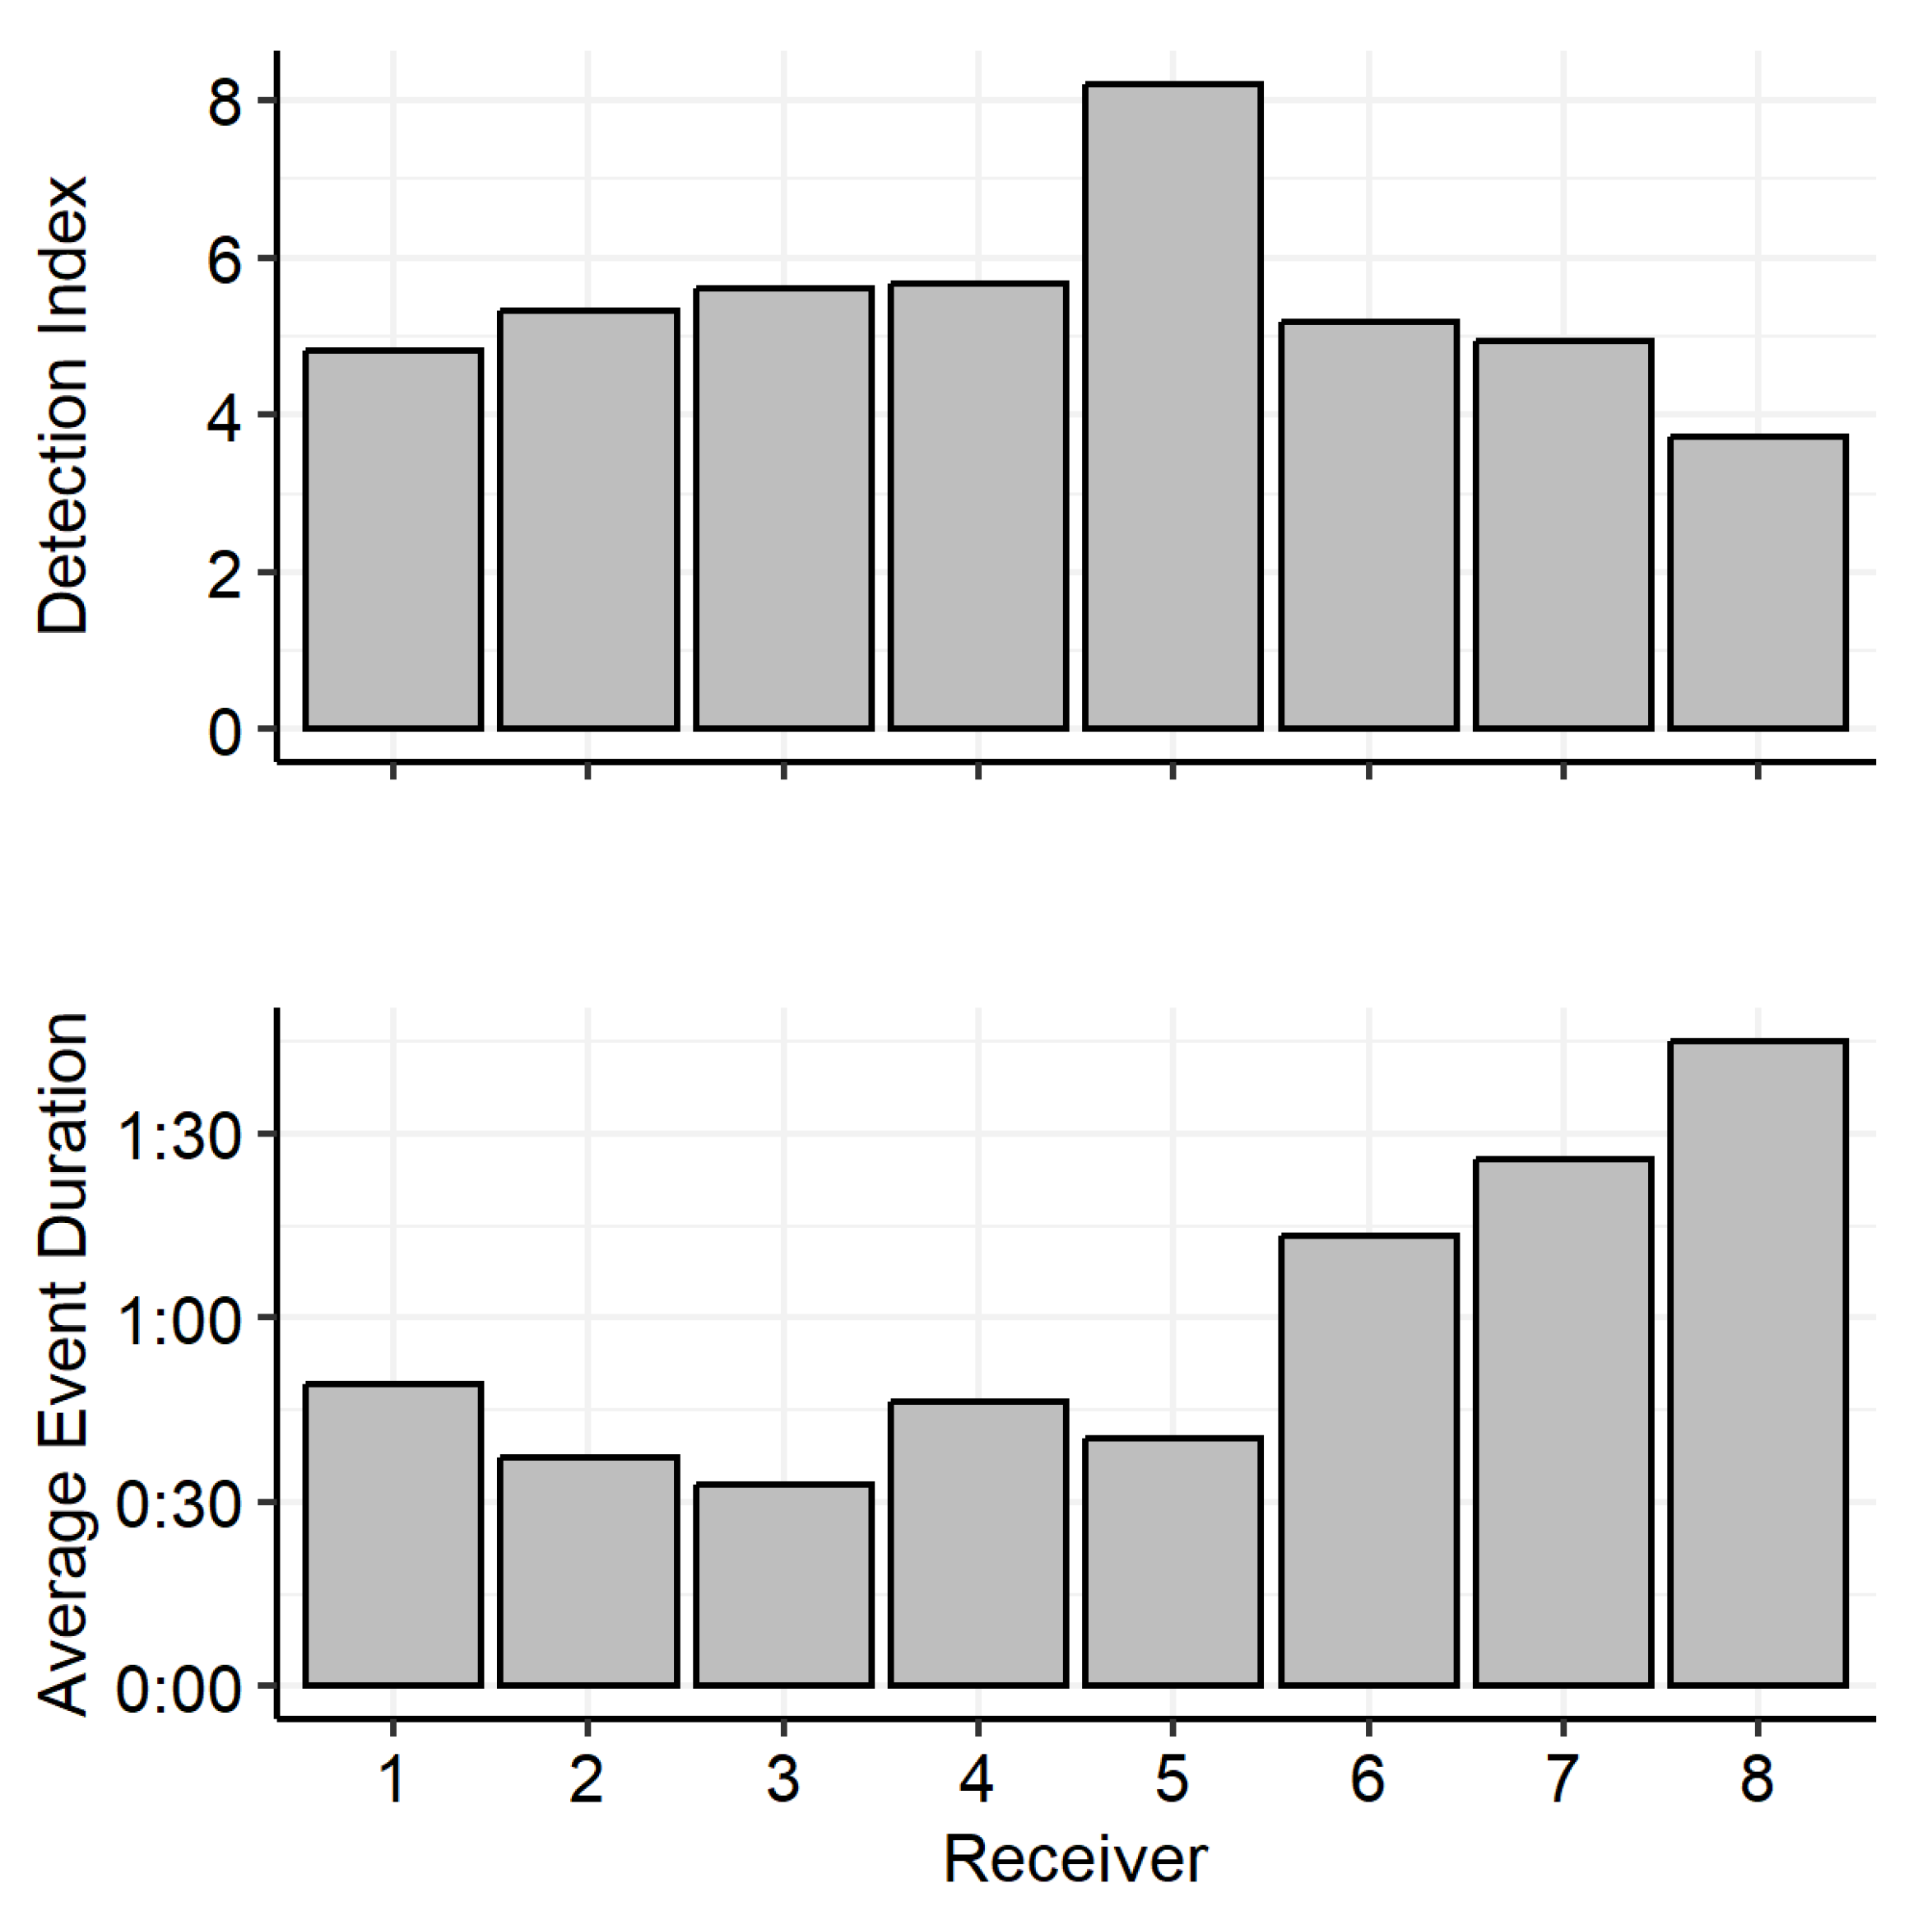
3.2. Spatio-Temporal Patterns of Site Use

Eleven of the 22 tagged whiprays were detected by the array throughout the majority of the monitoring period, while the other 11 were detected for approximately one month or less (Table 3, Figure 3). Three of the whiprays were not detected again after tagging. Each of the four life-history groups had two or more individuals with long detection periods and a large number of days detected, total detections, and presence events (Table 3, Figure 3). The largest number of days detected (276), total detections (26,700), and presence events (1084), as well as the longest presence time (1299 h), belonged to two mature males (Table 3).
Plotting individual whiprays’ longitudinal movements showed that many whiprays used the entire study area throughout the course of the monitoring period, with some spatio-temporal variation in use patterns (Figure 4). From approximately August to November, whiprays tended to remain closer to (and may have temporarily moved into) the estuary. Outside of those months, immature individuals tended to remain in the middle to upper reaches of the study area, while mature individuals moved continuously up- and downstream throughout the entire length of the study area (Figure 4).
Receivers 6 and 7 had the highest number of total detections (Table S3). Despite being deployed four months after the other receivers, Receiver 8 had more total detections than Receivers 1–5. Receiver 5 had the highest number of presence events, but Receiver 7 had the longest cumulative event duration. The lowest cumulative event durations were from Receivers 1–3 (Table S3).
When accounting for the number of days each receiver was deployed and the number of days each fish was available for detection, it was found that Receiver 5 had the highest detection index and Receiver 8 had the lowest (Table S3, Figure 5). However, average event duration, which is also independent of the length of time receivers were deployed, was highest for Receiver 8, followed by Receivers 7 and 6. Average event duration was lowest for Receivers 3 and 2 (Table S3, Figure 5).
Clear patterns in receiver use by life-history group were not apparent other than for immature males, which had more presence events on the upstream receivers (Receivers 6–8) than the other receivers (Figure S2). The other life-history groups tended to have more presence events on the middle and lower receivers (Receivers 1–5). Relative to the other groups, mature females had low numbers of presence events on all receivers (Figure S2). Full receiver results by life-history group and by month can be found in Table S4.
There was wide variation in site fidelity (RI) among tagged whiprays (Table 3). The three whiprays that were not detected had RIs equal to zero. Six whiprays had RIs greater than 50, indicating that they were detected by the array for more than half of the days monitored. Overall, RIs ranged from zero to 94, with a mean and standard deviation (SD) of 28 ± 34. Removing the three rays with zero detections changed the range of RIs from 0.3 to 94, with a mean and SD equal to 32 ± 34. Results of ANOVA determined there were no significant differences in RI among life-history groups (sex: F = 0.101, p = 0.755; maturity: F = 0.538, p = 0.474).
Both monthly and seasonal RIs varied among and within months and seasons (Figure S3 and Figure 6). The rainy season had the highest mean and median SRIs, but the difference was not significant according to the results of an ANOVA test (F = 0.617, p = 0.543). Summer had fewer SRIs greater than 50 when compared to the winter and rainy seasons, but it also had fewer SRIs near zero when compared to winter (Figure 6).
Overall, there tended to be more presence events in the rainy and winter seasons (July–December), especially among females (Figure S4). Males tended to have more presence events in the late rainy and winter seasons. Seasonal patterns of detection were more similar by sex than by maturity, although immature females tended to have more presence events than mature females (Figure S4).

3.3. Diel Activity Patterns

For all whiprays combined, the total numbers of presence events during the day (2264) and night (2245) were similar (Table S5). The mean ratio of day events to night events for all whiprays was less than one, indicating that individual whiprays tended to have more presence events at night than during the day. However, the mean value of 0.87 was close to one, indicating that the difference in day versus night events was not great. The mean day:night presence event ratios for immature females, immature males, and mature females were all less than one, indicating that these groups tended to have more presence events at night than during the day. The mature males group was the only group that tended to have more presence events during the day than at night (Table S5). Differences were only statistically significant by maturity (F = 4.66, p = 0.047), with immature individuals having a mean day:night presence event ratio of 0.70 ± 0.37, and mature individuals having a mean ratio of 1.04 ± 0.30 (Table S5).

3.4. Environmental Correlates of Site Use

Water temperature over the study period ranged from 20.3–37 °C with a mean and SD equal to 21.15 ± 2.29. Mean salinity over the study period was 0.32 ± 1.05 g/L. Water tide ranged from 0.32–3.83 m with mean and SD of 2.36 ± 1.11.
Pearson’s correlation analyses showed that there was no relationship between mean monthly temperature and mean MRI for all whiprays or for female, male, immature, or mature groups (p > 0.05; Table S6). Similarly, no relationship was found between MRI and salinity or tide (Table S6).

4. Discussion

4.1. Site Fidelity

This is the first research program to directly study the patterns of residency and habitat use of the giant freshwater whipray. Our results have demonstrated that the lower Maeklong River is an important aggregation site for the species in Thailand. The ecological importance of this area was shown by high site fidelity among tagged individuals throughout the year. Several tagged whiprays were detected in the study area year round, leaving for only short time periods. These whiprays included male, female, immature, and mature individuals.
Based on their use of the site, whiprays appeared to belong to three different groups: a high-use group that spent the majority of their time within the site (RI > 50), a mid-use group that spent a shorter amount of time within the site (16 ≤ RI ≤ 34), and a low-use group that spent very little time within the site (RI ≤ 7; Table 3, Figure 3). Six whiprays belonged to the high-use group (RI = 61–94) and may have been demonstrating home-range behavior [9,30,31]. A seventh whipray had an RI of 46, possibly belonging to this group. High-use whiprays exhibited long periods of presence within the site, from 20 to 37 consecutive weeks, and only short-term absences, indicating that they likely did not travel far from the site (Figure 3). Mid-use whiprays (n = 4) demonstrated longer absences, migrating out of the site for a week to a month before returning. The low-use group was comprised of 11 whiprays, three of which were never detected by the receiver array. These whiprays had very few detections by the receiver array, indicating that they spent most of their time away from the site. It is possible that mid- and low-use whiprays represent either a more mobile portion of this aggregation or members of an adjacent aggregation, possibly migrating through this part of the river to the estuary. Each of these groups had members from all life-history groups, and as such, none were typified by any one sex or maturity stage as in [9].
Sex aggregation and segregation are widespread behaviors among elasmobranchs that result in differential spatial and seasonal habitat use between the sexes [32,33,34]. Females of some elasmobranch species demonstrate higher site fidelity and aggregation behavior than males in connection with their reproductive behavior and physiology [9,35]. Female freshwater whiprays (U. dalyensis) in the Wenlock River, Australia, remained within an 8 km area, while males traveled approximately 60 km downstream to brackish water during the wet season [9]. Other elasmobranch species have also demonstrated segregation of mature and immature individuals [36,37]. The mix of sexes and maturity stages that remained present in our study site throughout all seasons suggests that either this species does not segregate by sex or maturity or that this part of the Maeklong River is not used as a maternal aggregation site or nursery. This area also appears to not be a breeding site because there were no signs of courtship bites on the mature females captured in this study [37,38]. Additionally, breeding aggregations tend to be a seasonal occurrence [39,40]. Therefore, the mixed aggregation observed in this study site must be present for another reason, such as taking advantage of preferred habitat or increased food availability relative to surrounding areas [32,41].

4.2. Spatio-Temporal Patterns of Site Use

Whiprays were present in the site in all seasons. There was some evidence to suggest that site fidelity was higher in the rainy and early winter seasons, but differences in MRI and SRI among months and seasons were not statistically different (Figure 6 and Figures S3 and S4). Furthermore, the lower summer RIs may have been due to the fact that many whiprays had not yet been tagged in March through May, and the February monitoring period was shortened because of the end of the study period being mid-month. However, it could be that the receding waters in late winter and summer may cause some whiprays to migrate out of the study site and into the estuary or upstream areas, depending on their response to changing flows and salinity gradients [42]. Increased water temperature and decreased dissolved oxygen [43] in summer may also have caused some whiprays to leave the study site for the estuary, although we did not detect a correlation between temperature and MRI. Furthermore, longitudinal movement patterns suggest that whiprays spend more time near the estuary during the second half of the rainy season and into winter (Figure 4). More research is needed to understand the relationship between seasonal environmental changes and whipray movement patterns and broad-scale habitat use.
Whiprays displayed differential use of the site spatially. All receivers had high numbers of detections and detection events, but the upstream area (Receivers 6–8) seemed to hold some importance for whiprays. Although Receivers 7 and 8 had shorter deployments than the others, they received some of the highest numbers of total detections. In general, the upstream receivers had low to average numbers of detection days and presence events but higher than average total detections, average presence event durations, and cumulative presence event durations, indicating that when whiprays were present in this upstream area, they stayed in the area for longer periods of time than in downstream areas (Table S3, Figure 5). Receiver 5 marked another ecologically notable location. This receiver had the highest total presence events, as well as the highest detection index out of all the receivers (Table S3, Figure 5). This meant that, after accounting for receiver deployment time and the number of fish available for detection, Receiver 5 had the highest detection rate of tagged whiprays. However, its average event duration was low (Figure 5). This may indicate that whiprays regularly pass through this area on their way to and from an upstream aggregation area (Receivers 6–8) and brackish waters in or near the estuary. The longitudinal movement patterns showed many instances of whiprays making long up- and downstream movements within the study site (Figure 4). Downstream receivers (1–4) generally had an average number of detection days and total presence events, but low numbers of total detections and presence event durations (Table S3, Figure 5), indicating that whiprays did not remain as long in the downstream area.
The differential use of the site has different implications for management and conservation strategies. As whiprays demonstrated presence throughout the study site, it is clear that the entire area is worth examining for restoration and management opportunities. However, the upstream area is especially important as shown by whiprays spending more time in this area. Interestingly, the area near Receiver 6 is also the proposed site for a shrimp reintroduction program. As shrimp is a primary prey item for the giant freshwater whipray [15], this program may benefit the population. This area should also be considered for potential fishing conservation zones or gear regulations to help conserve the whipray population [44]. The area around Receiver 5 should be looked at as an important movement corridor, and as such, connectivity between upstream and downstream habitats should be preserved. The downstream area is most impacted by boat traffic, development, and industrial uses, and may be considered for environmental cleanup programs and traffic regulation. The giant freshwater whipray may be sensitive to pollution [14] and boat traffic, which may be why individuals in our study did not spend as much time in this area.
Seasonally and spatially, the site appeared to be used similarly by all life-history groups independent of sex or maturity. This is evidenced by a near-equal sample size for all life-history groups and no statistical differences in RI or seasonal/spatial patterns of site use. A couple of trends were observed that, although not statistically significant, may be ecologically interesting. First, immature females had many more presence events in the rainy season than the other life-history groups, and they also had more detection events than the other groups on Receivers 1 and 2 (Figures S2 and S4). Second, immature males had many more presence events than the other groups on Receivers 6–8 (Figure S2). More research is needed to determine if this is representative of sexual segregation among immature individuals [45].

4.3. Life-History Observations

This study also provided much-needed insight into the life-history and ecological traits of the giant freshwater whipray. As in other studies [14], mature females were larger than mature males (Tables S1 and S2, Figure S1). Two individuals over 2 m DW and one pregnant female were captured in our study, showing that the giant freshwater whipray is able to live long enough to grow to large sizes and reproduce in this area. Among immature individuals, there was no statistically significant difference in body size (Table S1, Figure S1). In our study area, we found a near-even sex ratio and ratio of immature to mature individuals. Studies of other elasmobranchs have found even sex ratios [46,47], while others have found female-biased sex ratios [45,46,48]. Both sexes and maturity stages were present year round in our study site, indicating that this combined site use is not isolated to certain seasons. The only indication of possible spatial sexual segregation was among immature males and females (Figure S2).
Individual movement patterns showed that whiprays often made long up- and downstream movements throughout the study site, remaining within smaller areas for certain periods of time (Figure 4). Other elasmobranch research has shown different activity levels in day versus night periods. Nocturnal or crepuscular foraging behavior has been commonly described [49,50,51]. However, Tilley et al. [31] found greater day-time activity for Atlantic stingrays, which was thought to be due to local environmental factors and predation risk. In our study, we found a similar number of detection events during the day and night for all rays combined (Table S5). Individual rays tended to have more detection events at night, except for mature males, which tended to have more during the day (Table S5). Additionally, mature whiprays were detected more during the day than immature whiprays. However, mean day:night ratios were not greatly different than zero, indicating that, overall, detections were spread relatively evenly across day and night periods. This suggests that whipray movement, potentially for foraging or migration purposes, occurs during both periods. Thus, this species may be described as cathemeral rather than nocturnal or diurnal [52]. As this is a large-bodied species, it may not be as vulnerable to predation and not have as great a need to avoid other species’ foraging periods.

4.4. Environmental Influences on Site Fidelity

Although environmental factors, such as temperature, salinity, dissolved oxygen, and tide, among others, have been shown to influence elasmobranch movements [7], we did not detect any environmental influences on whipray site fidelity (RI). Temperature has been shown to be an important environmental parameter for elasmobranchs to maintain optimum body temperature [10,53,54], but we found no correlation between RI and mean monthly water temperature. This could be because the range of water temperatures in our study was relatively narrow (20.3–37 °C) compared to the wide thermal tolerance (1–43.4 °C) observed in other batoid species [55]. The Atlantic stingray, Dasyatis sabina, showed a preferred feeding and reproductive temperature range of 21.5–31 °C [54]. If the giant freshwater whipray has similar thermal tolerances, then it would not need to take refuge from the temperatures observed in our study. Similarly, we found no correlations between RI and salinity or tide (water depth) as researchers have found for other elasmobranch species [7,9,11,56]. This may be a result of the euryhaline nature of the giant freshwater whipray [57], which may make it less sensitive to these changes. We also may not have detected influences of environmental variables because we used monthly means to compare to monthly mean RIs. Whiprays may be more sensitive to maximum temperatures or daily changes in tide [9] rather than monthly means.

4.5. Research Technique

Overall, we found the research technique to be an effective and valuable method for learning more about the ecology and habitat use of this rare, endangered species. The receiver array detected 86% of our tagged whiprays, 53% of which were detected for the majority of the monitoring period (Figure 3). This detection rate is comparable to rates found in other similar telemetry monitoring studies [58,59,60]. It is also much higher than the recapture rate (5%) found in traditional mark and recapture studies that have been attempted in this area (N. Chansue, pers. comm.). Acoustic telemetry also provides more detailed site use information than mark–recapture studies.
Our high detection rate and long detection periods of tagged fish show that our tagging and processing methods were safe and effective. We note that the subcutaneous dorsal tagging technique used in this study has not been reported elsewhere. Other researchers use ventral peritoneal tagging with the animal in dorsal recumbency to induce tonic immobility [9,10,19,31]. Tonic immobility in prolonged durations can be dangerous to the animal [61,62], and the risk could be greater for large-bodied animals like the giant freshwater whipray. Moreover, insertion of a transmitter into the peritoneal area risks peritoneal infection. The subcutaneous dorsal tagging technique we used was less invasive and did not require an incision to the abdominal cavity. Thus, we felt that it would be safer and less stressful on the animals. The long detection periods of many of our tagged whiprays support this assumption and the effectiveness of this tagging method.
There is some indication that whiprays may have been negatively affected during handling in March because, out of the four individuals tagged between 19–20 March, three of them were never detected again and the fourth was detected for only two days (Table 3). However, the fate of these whiprays cannot be determined—it could be that they immediately left the receiver array for the estuary or other parts of the Maeklong River. If there was a problem with the handling of the animals, it was quickly resolved because whiprays tagged in April had high numbers of detections (Table 3). We encourage the use of acoustic telemetry to continue learning more about the migratory, reproductive, and aggregation behaviors of the giant freshwater whipray and that researchers learn to safely handle and tag animals from experienced researchers. To date, there have been only a few applications of acoustic telemetry to study endangered fish species in Thailand [58,60,63], and we hope to highlight the benefits of this approach and encourage future research.

5. Conclusions

Here, we have clearly demonstrated the importance of the lower Maeklong River to the giant freshwater whipray population and provided valuable insights into the species’ ecology and life-history. We hope this research encourages more of its kind so that understanding of this species’ ecology and life history can be improved, which can lead to more and better conservation measures. This part of the river may offer a prime location for conservation zones and other fisheries management opportunities that may effectively improve the health of the giant freshwater whipray population. Other opportunities to improve population health include food supplementation through the shrimp reintroduction program upstream and managing pollution and disturbance from tourism and boat traffic in the lower part of the river near the estuary. Although our study was not set up to show the use of the estuary, this habitat is likely important to the species [57], and as such, we believe that conservation measures should be considered for both the estuarine and riverine environments.

Supplementary Materials

The following supporting information can be downloaded at https://www.mdpi.com/article/10.3390/w15132311/s1: Table S1: Results of Student’s t-test analyses of whipray body size as a function of sex and maturity; Table S2: Summary statistics of whipray body size grouped by maturity and sex; Figure S1: Box plots of whipray body size as a function of sex and maturity; Table S3: Summary of receiver detection results; Figure S2: Total presence events by receiver for each life-history group; Figure S3: Boxplots showing the distribution of monthly residency index 9 mri0 data for tagged whiprays; Figure S4: Total presence events by month for each life-history group; Table S4: Receiver presence events by month for each life-history group; Table S5: Number of presence events during the day and night for all life-history groups; Table S6: Results of Pearson’s correlation tests for environmental correlates of residency index (RI); Movement Plots of High-Use Whiprays.

Author Contributions

Conceptualization, T.H. and N.K.; methodology, N.C., T.H. and N.K.; software, N.K. and Z.H.; validation, N.K., Z.H. and T.C.; formal analysis, N.K., C.D., T.T. and T.C.; investigation, N.C., T.H., N.K., C.D., T.T. and Z.H.; resources, Z.H.; data curation, N.K., C.D. and T.T.; writing—original draft preparation, C.D. and T.C.; writing—review and editing, N.C., T.H. and T.C.; visualization, C.D. and T.C.; supervision, N.C. and T.H.; project administration, N.C.; funding acquisition, N.C. and Z.H. All authors have read and agreed to the published version of the manuscript.

Funding

This research was funded through the National Geographic Society’s grant program “Science and Exploration in Asia,” No. Asia 29-16, and the United States Agency for International Development (USAID) “Wonders of the Mekong” Cooperative Agreement No. AID-OAA-A-16-00057.

Data Availability Statement

Data are available upon request.

Acknowledgments

We are grateful to the members of Fishsiam who helped us catch the whiprays used in this study, as well as everyone who helped monitor the acoustic receivers. We also thank Baan Tai Had Resort and Patcharodom Unsuwan, who provided us with the research station site and accommodations.

Conflicts of Interest

The authors declare no conflict of interest.

References

  1. Campbell, T.; Onboundisane, S.; Kong, H.; Hogan, Z.S. A review of the conservation status and ecology of the giant freshwater whipray (Urogymnus polylepis) across its known distribution. Water, 2023; in press. [Google Scholar]
  2. Grant, I.; Rigby, C.L.; Bin Ali, A.; Fahmi; Haque, A.B.; Hasan, V.; Sayer, C. Urogymnus polylepis. In The IUCN Red List of Threatened Species, 25 January 2021 ed.; International Union for Conservation of Nature and Natural Resources: Gland, Switzerland, 2021; p. e.T195320A104294071. [Google Scholar]
  3. Compagno, L.J.V.; Cook, S.F. Urogymnus polylepis (Thailand subpopulation). In The IUCN Red List of Threatened Species, 30 June 2000 ed.; International Union for Conservation of Nature and Natural Resources: Gland, Switzerland, 2000; p. e.T39408A10228071. [Google Scholar]
  4. Monkolprasit, S.; Roberts, T.R. Himantura chaophraya, a new giant freshwater stingray from Thailand. Jpn. J. Ichthyol. 1990, 37, 203–208. [Google Scholar]
  5. Millward, A. Record-breaking ray confirmed as world’s largest freshwater fish. In Guinness World Records Limited 2023; Guinness World Records: London, UK, 2022. [Google Scholar]
  6. Shaw, A.K. Drivers of animal migration and implications in changing environments. Evol. Ecol. 2016, 30, 991–1007. [Google Scholar] [CrossRef]
  7. Schlaff, A.M.; Heupel, M.R.; Simpfendorfer, C.A. Influence of environmental factors on shark and ray movement, behaviour and habitat use: A review. Rev. Fish Biol. Fish. 2014, 24, 1089–1103. [Google Scholar] [CrossRef]
  8. Heupel, M.R.; Webber, D.M. Trends in acoustic tracking: Where are the fish going and how will we follow them? In Proceedings of the American Fisheries Society Symposium 76, Auckland, New Zealand, 24–28 February 2008; American Fisheries Society Symposium: Bethesda, MD, USA, 2012; pp. 219–231. [Google Scholar]
  9. Campbell, H.A.; Hewitt, M.; Watts, M.E.; Peverell, S.; Franklin, C.E. Short-and long-term movement patterns in the freshwater whipray (Himantura dalyensis) determined by the signal processing of passive acoustic telemetry data. Mar. Freshw. Res. 2012, 63, 341–350. [Google Scholar] [CrossRef]
  10. Ramsden, S.; Cotton, C.F.; Curran, M.C. Using acoustic telemetry to assess patterns in the seasonal residency of the Atlantic stingray Dasyatis Sabina. Environ. Biol. Fishes 2017, 100, 89–98. [Google Scholar] [CrossRef]
  11. Vaudo, J.J.; Heithaus, M.R. Diel and seasonal variation in the use of a nearshore sandflat by a ray community in a near pristine system. Mar. Freshw. Res. 2012, 63, 1077–1084. [Google Scholar] [CrossRef]
  12. Davy, L.E.; Simpfendorfer, C.A.; Heupel, M.R. Movement patterns and habitat use of juvenile mangrove whiprays (Himantura granulata). Mar. Freshw. Res. 2015, 66, 481–492. [Google Scholar] [CrossRef]
  13. Corcoran, M.J.; Wetherbee, B.M.; Shivji, M.S.; Potenski, M.D.; Chapman, D.D.; Harvey, G.M. Supplemental feeding for ecotourism reverses diel activity and alters movement patterns and spatial distribution of the southern stingray, Dasyatis americana. PLoS ONE 2013, 8, e59235. [Google Scholar] [CrossRef] [Green Version]
  14. Then, A.Y.-H.; Lim, K.C.; Loh, K.-H. Updated distribution of the endangered freshwater stingray Urogymnus polylepis in Malaysia, with notes on biology and genetics. Raffles Bull. Zool. 2022, 70, 534–549. [Google Scholar]
  15. Sen, S.; Thomas, S.; Joe Kizhakudan, S.; Dash, G.; Pradhan, R.K.; Ghosh, S.; Das, M.; Dash, B.; Zacharia, P.U. New observations of the endangered giant freshwater whipray, Urogymnus polylepis, provide further evidence for its distribution and breeding in the north-east coast of India. J. Fish Biol. 2022, 101, 1611–1616. [Google Scholar] [CrossRef]
  16. Huveneers, C.; Simpfendorfer, C.A.; Kim, S.; Semmens, J.M.; Hobday, A.J.; Pederson, H.; Stieglitz, T.; Vallee, R.; Webber, D.; Heupel, M.R. The influence of environmental parameters on the performance and detection range of acoustic receivers. Methods Ecol. Evol. 2016, 7, 825–835. [Google Scholar] [CrossRef]
  17. Loher, T.; Webster, R.A.; Carlile, D. A test of the detection range of acoustic transmitters and receivers deployed in deep waters of Southeast Alaska, USA. Anim. Biotelem. 2017, 5, 27. [Google Scholar] [CrossRef] [Green Version]
  18. Clements, S.; Jepsen, D.; Karnowski, M.; Schreck, C.B. Optimization of an acoustic telemetry array for detecting transmitter-implanted fish. North Am. J. Fish. Manag. 2005, 25, 429–436. [Google Scholar] [CrossRef]
  19. Kessel, S.T.; Hussey, N.E. Tonic immobility as an anaesthetic for elasmobranchs during surgical implantation procedures. Can. J. Fish. Aquat. Sci. 2015, 72, 1287–1291. [Google Scholar] [CrossRef]
  20. Chatchavalvanich, K.; Thongpan, A.; Nakai, M. Structure of the testis and genital duct of freshwater stingray, Himantura signifer (Elasmobranchii: Myliobatiformes: Dasyatidae). Ichthyol. Res. 2005, 52, 123. [Google Scholar] [CrossRef]
  21. Daochai, C.; Keschumras, N.; Daochai, S.; Chansue, N. Using ultrasonography method for monitoring ovarian status in freshwater stingray (Potamotrygon sp.). In Proceedings of the Biomedical Engineering International Conference, Pattaya, Thailand, 25–27 November 2015; pp. 1–4. [Google Scholar]
  22. Daochai, C. Using Ultrasonography Method for Monitoring Testis Status in Freshwater Stingray (Potamotrygon motoro). Thai. J. Vet. Med. Suppl. 2016, 46, 330. [Google Scholar]
  23. Daochai, C.; Chansue, N.; Daochai, S. Application of ultrasound in determination gestation status in captive female freshwater stingray (Potamotrygon sp.). In Proceedings of the Biomedical Engineering International Conference, Singapore, 7–10 December 2016; pp. 1–4. [Google Scholar]
  24. Freeland, W.J.; Fry, K. Suitability of passive integrated transponder tags for marking live animals for trade. Wildl. Res. 1995, 22, 767–773. [Google Scholar] [CrossRef]
  25. Wagner, G.N.; Cooke, S.J. Methodological approaches and opinions of researchers involved in the surgical implantation of telemetry transmitters in fish. J. Aquat. Anim. Health 2005, 17, 160–169. [Google Scholar] [CrossRef]
  26. Bond, M.E.; Babcock, E.A.; Pikitch, E.K.; Abercrombie, D.L.; Lamb, N.F.; Chapman, D.D. Reef sharks exhibit site-fidelity and higher relative abundance in marine reserves on the Mesoamerican Barrier Reef. PLoS ONE 2012, 7, e32983. [Google Scholar] [CrossRef] [Green Version]
  27. Reubens, J.T.; Pasotti, F.; Degraer, S.; Vincx, M. Residency, site fidelity and habitat use of Atlantic cod (Gadus morhua) at an offshore wind farm using acoustic telemetry. Mar. Environ. Res. 2013, 90, 128–135. [Google Scholar] [CrossRef] [PubMed]
  28. Vianna, G.M.S.; Meekan, M.G.; Meeuwig, J.J.; Speed, C.W. Environmental influences on patterns of vertical movement and site fidelity of grey reef sharks (Carcharhinus amblyrhynchos) at aggregation sites. PLoS ONE 2013, 8, e60331. [Google Scholar] [CrossRef] [PubMed] [Green Version]
  29. Pollution Control Department. Water Quality Data. 2018. Available online: https://rwater.mnre.go.th/front/main/WaterQuality (accessed on 2 May 2023).
  30. Yeiser, B.G.; Heupel, M.R.; Simpfendorfer, C.A. Occurrence, home range and movement patterns of juvenile bull (Carcharhinus leucas) and lemon (Negaprion brevirostris) sharks within a Florida estuary. Mar. Freshw. Res. 2008, 59, 489–501. [Google Scholar] [CrossRef]
  31. Tilley, A.; López-Angarita, J.; Turner, J.R. Effects of scale and habitat distribution on the movement of the southern stingray Dasyatis americana on a Caribbean atoll. Mar. Ecol. Prog. Ser. 2013, 482, 169–179. [Google Scholar] [CrossRef] [Green Version]
  32. Vaudo, J.J.; Lowe, C.G. Movement patterns of the round stingray Urobatis halleri (Cooper) near a thermal outfall. J. Fish Biol. 2006, 68, 1756–1766. [Google Scholar] [CrossRef] [Green Version]
  33. Jirik, K.E.; Lowe, C.G. An elasmobranch maternity ward: Female round stingrays Urobatis halleri use warm, restored estuarine habitat during gestation. J. Fish Biol. 2012, 80, 1227–1245. [Google Scholar] [CrossRef]
  34. Whitney, N.M.; Pyle, R.L.; Holland, K.N.; Barcz, J.T. Movements, reproductive seasonality, and fisheries interactions in the whitetip reef shark (Triaenodon obesus) from community-contributed photographs. Environ. Biol. Fishes 2012, 93, 121–136. [Google Scholar] [CrossRef]
  35. Mull, C.G.; Lowe, C.G.; Young, K.A. Seasonal reproduction of female round stingrays (Urobatis halleri): Steroid hormone profiles and assessing reproductive state. Gen. Comp. Endocrinol. 2010, 166, 379–387. [Google Scholar] [CrossRef]
  36. Shea, O.O.; Van Leeuwen, T.E.; Brien, D.O.; Arrowsmith, L.; McCalman, R.; Griffiths, M.; Exton, D.A. Evidence and description of a nursery habitat for the recently reclassified stingray Styracura schmardae from The Bahamas. Mar. Ecol. Prog. Ser. 2021, 660, 141–151. [Google Scholar]
  37. Le Port, A.; Lavery, S.; Montgomery, J.C. Conservation of coastal stingrays: Seasonal abundance and population structure of the short-tailed stingray Dasyatis brevicaudata at a Marine Protected Area. ICES J. Mar. Sci. 2012, 69, 1427–1435. [Google Scholar] [CrossRef] [Green Version]
  38. Nordell, S.E. Observations of the mating behavior and dentition of the round stingray, Urolophus halleri. Environ. Biol. Fishes 1994, 39, 219–229. [Google Scholar] [CrossRef]
  39. Chaikin, S.; Belmaker, J.; Barash, A. Coastal breeding aggregations of threatened stingrays and guitarfish in the Levant. Aquat. Conserv. Mar. Freshw. Ecosyst. 2020, 30, 1160–1171. [Google Scholar] [CrossRef]
  40. Pratt Jr, H.L.; Pratt, T.C.; Knotek, R.J.; Carrier, J.C.; Whitney, N.M. Long-term use of a shark breeding ground: Three decades of mating site fidelity in the nurse shark, Ginglymostoma cirratum. PLoS ONE 2022, 17, e0275323. [Google Scholar] [CrossRef] [PubMed]
  41. Pini-Fitzsimmons, J.; Knott, N.A.; Brown, C. Effects of food provisioning on site use in the short-tail stingray Bathytoshia brevicaudata. Mar. Ecol. Prog. Ser. 2018, 600, 99–110. [Google Scholar] [CrossRef]
  42. Lyon, B.J.; Dwyer, R.G.; Pillans, R.D.; Campbell, H.A.; Franklin, C.E. Distribution, seasonal movements and habitat utilisation of an endangered shark, Glyphis glyphis, from northern Australia. Mar. Ecol. Prog. Ser. 2017, 573, 203–213. [Google Scholar] [CrossRef]
  43. Choo-ina, S.; Tharasawatpipata, C.; Kasemsawata, S.; Monprapussornb, S.; Utarasakula, T. Surface Water Quality for Sustainable Water Consumption and Utilization in Samut Songkram Province. In Proceedings of the 2nd Environment Asia International Conference on “Human Vulnerability and Global Environmental Change”, Chonburi, Thailand, 15–17 May 2013. [Google Scholar]
  44. Koning, A.A.; Perales, K.M.; Fluet-Chouinard, E.; McIntyre, P.B. A network of grassroots reserves protects tropical river fish diversity. Nature 2020, 588, 631–635. [Google Scholar] [CrossRef]
  45. Mattos, S.M.G.; Broadhurst, M.; Hazin, F.H.V.; Jonnes, D.M. Reproductive biology of the Caribbean sharpnose shark, Rhizoprionodon porosus, from northern Brazil. Mar. Freshw. Res. 2001, 52, 745–752. [Google Scholar] [CrossRef]
  46. Carlisle, A. Long-term trends in catch composition from elasmobranch derbies in Elkhorn Slough, California. Mar. Fish. Rev. 2007, 69, 25–45. [Google Scholar]
  47. Thorson, T.B.; Langhammer, J.K.; Oetinger, M.I. Reproduction and development of the South American freshwater stingrays, Potamotrygon circularis and P. motoro. Environ. Biol. Fishes 1983, 9, 3–24. [Google Scholar] [CrossRef]
  48. Heithaus, M.R. The biology of tiger sharks, Galeocerdo cuvier, in Shark Bay, Western Australia: Sex ratio, size distribution, diet, and seasonal changes in catch rates. Environ. Biol. Fishes 2001, 61, 25–36. [Google Scholar] [CrossRef]
  49. Cartamil, D.P.; Vaudo, J.J.; Lowe, C.G.; Wetherbee, B.M.; Holland, K.N. Diel movement patterns of the Hawaiian stingray, Dasyatis lata: Implications for ecological interactions between sympatric elasmobranch species. Mar. Biol. 2003, 142, 841–847. [Google Scholar] [CrossRef]
  50. Collins, A.B.; Heupel, M.R.; Motta, P.J. Residence and movement patterns of cownose rays Rhinoptera bonasus within a south-west Florida estuary. J. Fish Biol. 2007, 71, 1159–1178. [Google Scholar] [CrossRef]
  51. Brinton, C.P.; Curran, M.C. Tidal and diel movement patterns of the Atlantic stingray (Dasyatis sabina) along a stream-order gradient. Mar. Freshw. Res. 2017, 68, 1716–1725. [Google Scholar] [CrossRef]
  52. Schieber, N.L.; Collin, S.P.; Hart, N.S. Comparative retinal anatomy in four species of elasmobranch. J. Morphol. 2012, 273, 423–440. [Google Scholar] [CrossRef]
  53. Morrissey, J.F.; Gruber, S.H. Habitat selection by juvenile lemon sharks, Negaprion brevirostris. Environ. Biol. Fishes 1993, 38, 311–319. [Google Scholar] [CrossRef]
  54. Wallman, H.L.; Bennett, W.A. Effects of parturition and feeding on thermal preference of Atlantic stingray, Dasyatis sabina (Lesueur). Environ. Biol. Fishes 2006, 75, 259–267. [Google Scholar] [CrossRef]
  55. Fangue, N.A.; Bennett, W.A. Thermal tolerance responses of laboratory-acclimated and seasonally acclimatized Atlantic stingray, Dasyatis sabina. Copeia 2003, 2003, 315–325. [Google Scholar] [CrossRef]
  56. Carlisle, A.B.; Starr, R.M. Tidal movements of female leopard sharks (Triakis semifasciata) in Elkhorn Slough, California. Environ. Biol. Fishes 2010, 89, 31–45. [Google Scholar] [CrossRef]
  57. Grant, M.I.; Kyne, P.M.; Simpfendorfer, C.A.; White, W.T.; Chin, A. Categorising use patterns of non-marine environments by elasmobranchs and a review of their extinction risk. Rev. Fish Biol. Fish. 2019, 29, 689–710. [Google Scholar] [CrossRef]
  58. Mitamura, H.; Mitsunaga, Y.; Arai, N.; Viputhanumas, T. Movements of immature hatchery-reared Mekong giant catfish Pangasianodon gigas released in the Mekong River, measured using acoustic telemetry. Fish. Sci. 2008, 74, 1034–1039. [Google Scholar] [CrossRef]
  59. Hahn, L.; Martins, E.G.; Nunes, L.D.; da Câmara, L.F.; Machado, L.S.; Garrone-Neto, D. Biotelemetry reveals migratory behaviour of large catfish in the Xingu River, Eastern Amazon. Sci. Rep. 2019, 9, 8464. [Google Scholar] [CrossRef] [Green Version]
  60. Naughton, G.P.; Hogan, Z.S.; Campbell, T.; Graf, P.J.; Farwell, C.; Sukumasavin, N. Acoustic Telemetry Monitors Movements of Wild Adult Catfishes in the Mekong River, Thailand and Laos. Water 2021, 13, 641. [Google Scholar] [CrossRef]
  61. Davie, P.S.; Franklin, C.E.; Grigg, G.C. Blood pressure and heart rate during tonic immobility in the black tipped reef shark, Carcharhinus melanoptera. Fish Physiol. Biochem. 1993, 12, 95–100. [Google Scholar] [CrossRef] [PubMed]
  62. Brooks, E.J.; Sloman, K.A.; Liss, S.; Hassan-Hassanein, L.; Danylchuk, A.J.; Cooke, S.J.; Mandelman, J.W.; Skomal, G.B.; Sims, D.W.; Suski, C.D. The stress physiology of extended duration tonic immobility in the juvenile lemon shark, Negaprion brevirostris (Poey 1868). J. Exp. Mar. Biol. Ecol. 2011, 409, 351–360. [Google Scholar] [CrossRef]
  63. Mitamura, H.; Mitsunaga, Y.; Arai, N.; Yamagishi, Y.; Khachaphichat, M.; Viputhanumas, T. Horizontal and vertical movement of Mekong giant catfish Pangasianodon gigas measured using acoustic telemetry in Mae Peum Reservoir, Thailand. Fish. Sci. 2008, 74, 787–795. [Google Scholar] [CrossRef]
Figure 1. Study site showing the acoustic receiver array in the Maeklong River, Thailand. Black dots represent receiver locations. Gray, semi-transparent circles show the lower end (1000 m) of the receiver detection range (1000–2000 m). Dashed lines across the river demarcate the area where study animals were captured. Black triangles show locations of water quality monitoring stations (one additional location is north of the study site out of view). The star in the inset map shows the location of the study site.
Water 15 02311 g001
Figure 2. Photographs of field procedures, including whipray capture, tagging, and sampling, and acoustic receiver deployment. Panels: (a) pool for holding whiprays; (b) transportation of a whipray; (c) measuring a whipray; (d) a whipray being tagged with an acoustic transmitter and scanned with ultrasound; (e) release of a whipray back to the river; (f) deployment of a receiver.
Water 15 02311 g002
Figure 3. Weekly whipray detection data from all receivers during the monitoring period from March 2018 to February 2019. Black rectangles represent weeks during which the whipray was detected by the receiver array. Grey rectangles represent weeks before the whipray was tagged. Mat. = maturity.
Water 15 02311 g003
Figure 4. Longitudinal movement patterns of tagged whiprays within the study area throughout the duration of the study period. The plots show movements of one whipray (tag number in parentheses) with a long tracking history from each life-history group. Additional whipray movement plots may be viewed in the Supplementary Material. The downstream-most receiver is located at 4 rkm and the upstream-most receiver is located at 22 rkm. Movements outside of this range would not have been detected.
Water 15 02311 g004
Figure 5. Graphs of receiver metrics that are independent of the amount of time receivers were deployed. Detection index = fish detection days / fish days × 100. Average event duration refers to presence events (see methods). Units for average event duration are h:mm.
Water 15 02311 g005
Figure 6. Boxplots showing the distribution of seasonal residency index (SRI) data for tagged whiprays. Data are symbolized as in Figure S3. Whiprays that were never detected by the array (n = 3) were removed from the analysis. Summer = February–May; rainy = June–October; winter = November–January. March was not included because three out of four tagged fish were never detected again, and the fourth had an MRI = 0.
Water 15 02311 g006
Table 1. Receiver locations. Primary site use: FH = fishing harbor; PH = public harbor; AQ = aquaculture; RC = recreation; EC = ecotourism. Distance from River Mouth is in rkm.
ReceiverLat
WGS84
Long
WGS84
Approximate Distance from River MouthLocationPrimary Site UseDeployment Date
113.38144799.9849964Near estuaryFH18 March 18
213.38997099.9873045.5Mussel PierFH18 March 18
313.40716899.9972957Marine DepartmentPH18 March 18
413.41442799.98375710Baan Tai Had ResortAQ/RC18 March 18
513.40153399.97661412.5Wat Tai HadAQ/RC18 March 18
613.42410499.95611418Chaosamran RestaurantRC/EC18 March 18
713.43271999.94854520Wat Bang Khae NoiRC3 April 18
813.44616299.94302822Wat Bang KungRC23 July 18
Table 2. Physiological and morphological characteristics of tagged whiprays. TL = total length, GL = girdle length, DW = disc width, WT = weight. TL, GL, and DW are reported in meters. WT is reported in kilograms. The shading visually distinguishes males and females.
Tag No.MaturitySexTLGLDWWTTag Date
1058ImmatureFemale2.280.90.99 23 July 2018
1059ImmatureFemale2.320.941.022622 May 2018
1063ImmatureFemale1.510.630.72 20 March 2018
1069ImmatureFemale2.020.720.821321 May 2018
1071ImmatureFemale1.90.690.72 18 June 2018
1073ImmatureFemale2.480.890.952223 July 2018
1057ImmatureMale1.10.870.77155 April 2018
1075ImmatureMale2.20.720.814.253 April 2018
1078ImmatureMale2.240.870.9221.519 June 2018
1079ImmatureMale2.360.920.9828.119 June 2018
1061MatureFemale2.821.521.6610523 July 2018
1062MatureFemale3.381.61.69 19 March 2018
1067MatureFemale4.1422.06 21 May 2018
1070MatureFemale3.921.752.03 19 June 2018
1076MatureFemale3.951.791.93 19 June 2018
1077MatureFemale2.911.136.718 June 2018
1064MatureMale2.921.261.316220 March 2018
1066MatureMale2.651.11.2144.324 April 2018
1068MatureMale2.70.991.07334 April 2018
1074MatureMale3.181.161.255023 April 2018
1080MatureMale2.691.031.164020 March 2018
1081MatureMale2.721.041.12364 April 2018
Table 3. Results of acoustic telemetry monitoring of tagged whiprays, including total detections, number of days detected, presence events and duration, and residency indices (RI). Mat = maturity: I = immature, M = mature. Sex: F = female, M = male. Presence duration units are hr:min:sec. The shading visually distinguishes males and females.
Mat.SexTag No.Tag DateDays
Monitored
Days
Detected
Total
Detections
Presence EventsPresence DurationRI
IF105823 July 20182041705942489335:34:0083
IF105922 May 20182661224203279277:05:0046
IF106320 March 201832900000
IF106921 May 2018267501206107171:04:0019
IF107118 June 2018239385616:50:001
IF107323 July 2018204114053238:07:005
IM10575 April 201831398431641:04:003
IM10753 April 201831512421:12:000.3
IM107819 June 20182381477062328453:53:0062
IM107919 June 2018238374656135:10:0016
MF106123 July 20182042617659888:30:0014
MF106219 March 201833000000
MF106721 May 2018267101312010:39:004
MF107019 June 20182381623983400354:44:0061
MF107619 June 20182381913486482250:58:0080
MF107718 June 20182398180514354:34:0034
MM106420 March 201832922922:49:000.6
MM106624 April 201829427695871084604:33:0094
MM10684 April 201831426126,7009121299:29:0083
MM107423 April 201829533273:14:001
MM108020 March 201832900000
MM10814 April 2018314211844115:25:007
Disclaimer/Publisher’s Note: The statements, opinions and data contained in all publications are solely those of the individual author(s) and contributor(s) and not of MDPI and/or the editor(s). MDPI and/or the editor(s) disclaim responsibility for any injury to people or property resulting from any ideas, methods, instructions or products referred to in the content.

