1. Introduction
The Horn of Africa is frequently hit by severe extreme events such as droughts and floods, but its climate remains poorly understood. The plains of Somalia and the Republic of Djibouti are arid and, despite their proximity to the equator, are under a low annual rainfall regime, 60–300 mm [
1]. Indeed, westerly winds lose most of their moisture after crossing the Sahel and Sudan [
2] However, this region presents significant spatial and seasonal contrasts, partly due to its highly varied relief [
3].
In the Republic of Djibouti, rainfall events are scarce. These events feed the flow of ephemeral rivers (wadi) and contribute to groundwater recharge but also trigger urban and surface flood hazards (the floods of 2004, 2018, 2019…). More generally, variability in rainfall rate, amount, and distribution substantially determines the Earth’s ecosystem, water cycle, and climate [
4]. Therefore, accurate measurement of rainfall is essential to analyze the spatial and temporal patterns of precipitation at different scales and further to understand the impact of rainfall on agriculture, hydrology, and climate.
Conventionally, the ground rain gauge is the most widely used rainfall measurement instrument. This is the most accurate and reliable approach to point measurement of rainfall. However, rain gauge stations in many parts of the world and in most parts of Africa, including the Republic of Djibouti, are scarce and unequally distributed. Therefore, ground rainfall analysis is subject to high uncertainty when based on networks that have a low rain gauge density or are limited to a few isolated rain gauge stations. In this situation, the spatial representativeness of the measurement is closely related to the coverage of the rain gauges.
In this context, gridded precipitation datasets, hereinafter called P datasets, available on the Internet at different spatial/temporal scales offer a convenient alternative [
5]. Such products have blossomed since the 1980s and represent a valuable opportunity because they are usually time continuous records, they provide a measurement in any portion of space, and they provide coverage with a daily or even hourly time step.
There are three basics P datasets, defined according to the input data and rainfall data retrieval process: those based on spatial information from rain gauges, those based on reanalysis data derived from physical and dynamic models, and those based on satellite information using passive microwave (PMW) and infrared (IR) information. It should be noted that a lot of P datasets combine the three types of data sources to obtain a better assessment.
In various global regions, the assessment and utilization of rainfall data pertaining to P datasets have emerged as crucial components in facilitating efficient management of water resources and comprehending the intricacies of extreme occurrences and spatiotemporal fluctuations in precipitation patterns. To illustrate, in East Asia, a study conducted by Peña-Arancibia et al. [
6] entailed an assessment of the precision of precipitation estimations in reanalyses, satellite-derived datasets, and an ensemble methodology. The outcomes of their investigation underscored the considerable potential inherent in these datasets, thereby enhancing our comprehension of precipitation patterns and their variability within the region. In a similar vein, Ceccherini [
7] investigated the deployment of high-resolution precipitation datasets based on rainfall derived from satellites, the enhanced vegetation index, and digital elevation models in South America and West Africa. The findings from this research project substantiated the efficacy of these datasets in capturing the nuanced spatiotemporal variations in precipitation and furnishing invaluable insights for hydrological applications in their respective geographical domains. In the West African context, Satge et al. [
5] carried out an evaluation of 23 gridded precipitation datasets. This particular study involved a comparative analysis of the performance exhibited by these datasets in encapsulating precipitation characteristics throughout the region. The results revealed marked divergences in the effectiveness of various datasets, thereby underscoring the criticality of meticulous selection and evaluation processes when employing P datasets for hydroclimatic analyses in West Africa. Moreover, Gosset et al. [
8] scrutinized several rainfall products utilized for hydrological applications across West Africa. Their investigation specifically concentrated on assessing the performance of these datasets by leveraging two extensively calibrated gauge networks. The findings accentuated the disparities in accuracy and dependability observed among the assessed datasets, thereby underscoring the exigency for a meticulous approach encompassing the selection and evaluation of P datasets for hydrological modeling and water management applications within the region.
In East Africa, where data scarcity is a challenge, the application of precipitation estimation products (P datasets) has gained significant attention. Studies conducted in this region have highlighted the importance of using P datasets to complement rain gauge measurements [
9,
10,
11]. These P datasets offer a valuable alternative, especially in catchments with a limited number of gauges. Satellite-based measurements provide extensive coverage over large areas, enabling the estimation of rainfall in regions where ground-based observations are sparse. The evaluation and comparison of satellite-based rainfall products have been conducted in various East African river basins, such as the Sio-Malaba-Malakisi river basin [
11] and the upper Blue Nile basin in Ethiopia [
12]. These studies emphasize the need for reliable P datasets to support hydrological modeling and water allocation studies in data-scarce regions. Additionally, the evaluation of specific satellite-based systems, such as the PERSIANN system [
13], and the integration of soil moisture measurements for near real-time rainfall estimation [
10] have contributed to advancing our understanding of precipitation dynamics in East Africa. Except for large-scale studies that consider the whole of East Africa, there have been very few reports on the spatiotemporal variability of rainfall in the Republic of Djibouti [
1,
14].
Assowe Dabar [
1] provides a description of the spatial and temporal rainfall variability in Djibouti by analyzing monthly and annual rainfall data recorded at 14 stations. Firstly, a regionalization by a principal component analysis is performed in terms of spatial distribution of rainfall, and two zones of seven stations each are identified, located in the west (inland region) and the east (coastal region) of Djibouti, respectively. Secondly, the performance of four gridded datasets of satellite rainfall estimates and of the ERA5 reanalysis data is evaluated on the base of the regionalization in these two zones and at Djibouti-Aerodrome, the longest meteorological record in Djibouti. They conclude that satellite-based rainfall products with high resolutions and ERA5 reanalysis offer insightful information on the rainfall variations at the spatial scale of Djibouti.
In semi-arid regions, understanding the relationship between rainfall and runoff is crucial, given the potentially devastating impacts of flash floods in these areas. This importance is further magnified in volcanic environments, where the presence of bare surface volcanic soils can exacerbate the effects of flash floods. However, evaluating precipitation estimation products in such environments remains limited, and there is a scarcity of studies specifically addressing their performance in semi-arid regions.
One challenge in these regions is the scarcity of rainfall events, which translates to a limited number of streamflow events that can trigger significant runoff. Consequently, it becomes essential to accurately identify and monitor these rare events to better manage water resources and mitigate the risks associated with flash floods. However, due to the unique characteristics of semi-arid and steep relief regions, the existing precipitation estimation products may exhibit varying degrees of performance.
Notably, studies have shown that the performance of precipitation datasets can be less satisfactory at the daily timescale where the variability and intensity of rainfall events can pose additional challenges [
15]. The constraints associated with the accurate depiction of these events can be attributed to the spatiotemporal resolution limitations of the datasets or the intricacies involved in capturing the dynamics of rainfall in semi-arid environments.
In this study, we aimed to identify the most representative P datasets for hydrological modeling and their usefulness for a specified study area including the Ambouli catchment (794 km2) where pluviometric data are scarce. At the scale of this catchment, some hydrological data have been acquired in the past, but there is no concomitant pluviometric information which does not allow implementation of a hydrological model at a daily time step. So, this evaluation is based on quantitative aspects (quantitative metrics) of rainfall but also on qualitative aspects of rainfall (categorial metrics): detection of days with/without rain. This qualitative aspect of rainfall estimation products is not commonly studied but is important for hydrological modeling of small watersheds that react to rainfall events in a few hours or even days.
2. Study Area and Datasets
2.1. Study Area
The Republic of Djibouti is located in the Horn of Africa, at the junction of the Gulf of Aden and the Red Sea. The country covers an area of 23,200 km
2 and lies between latitudes 10°9′ N and 12°7′ N and longitudes 41°8′ E and 43°5′ E. With a geology of volcanic origin, the Republic of Djibouti is characterized by a very steep relief featuring a succession of massifs, plateaus, and plains. The Republic of Djibouti has a semi-arid/arid climate mainly characterized by the irregularity and the weakness of precipitation, the absence of perennial streams, except in the mountainous regions, and a hot temperature year-round: “low” temperatures from October to April (20 °C to 30 °C) and “high” temperatures from May to September (30 °C to 45 °C). These climatic conditions are responsible for strong water evaporation of about 2000 mm/year (potential evapotranspiration), which severely affects both pasture and the soil [
16].
2.1.1. Southeast of the Republic of Djibouti
Assowe Dabar [
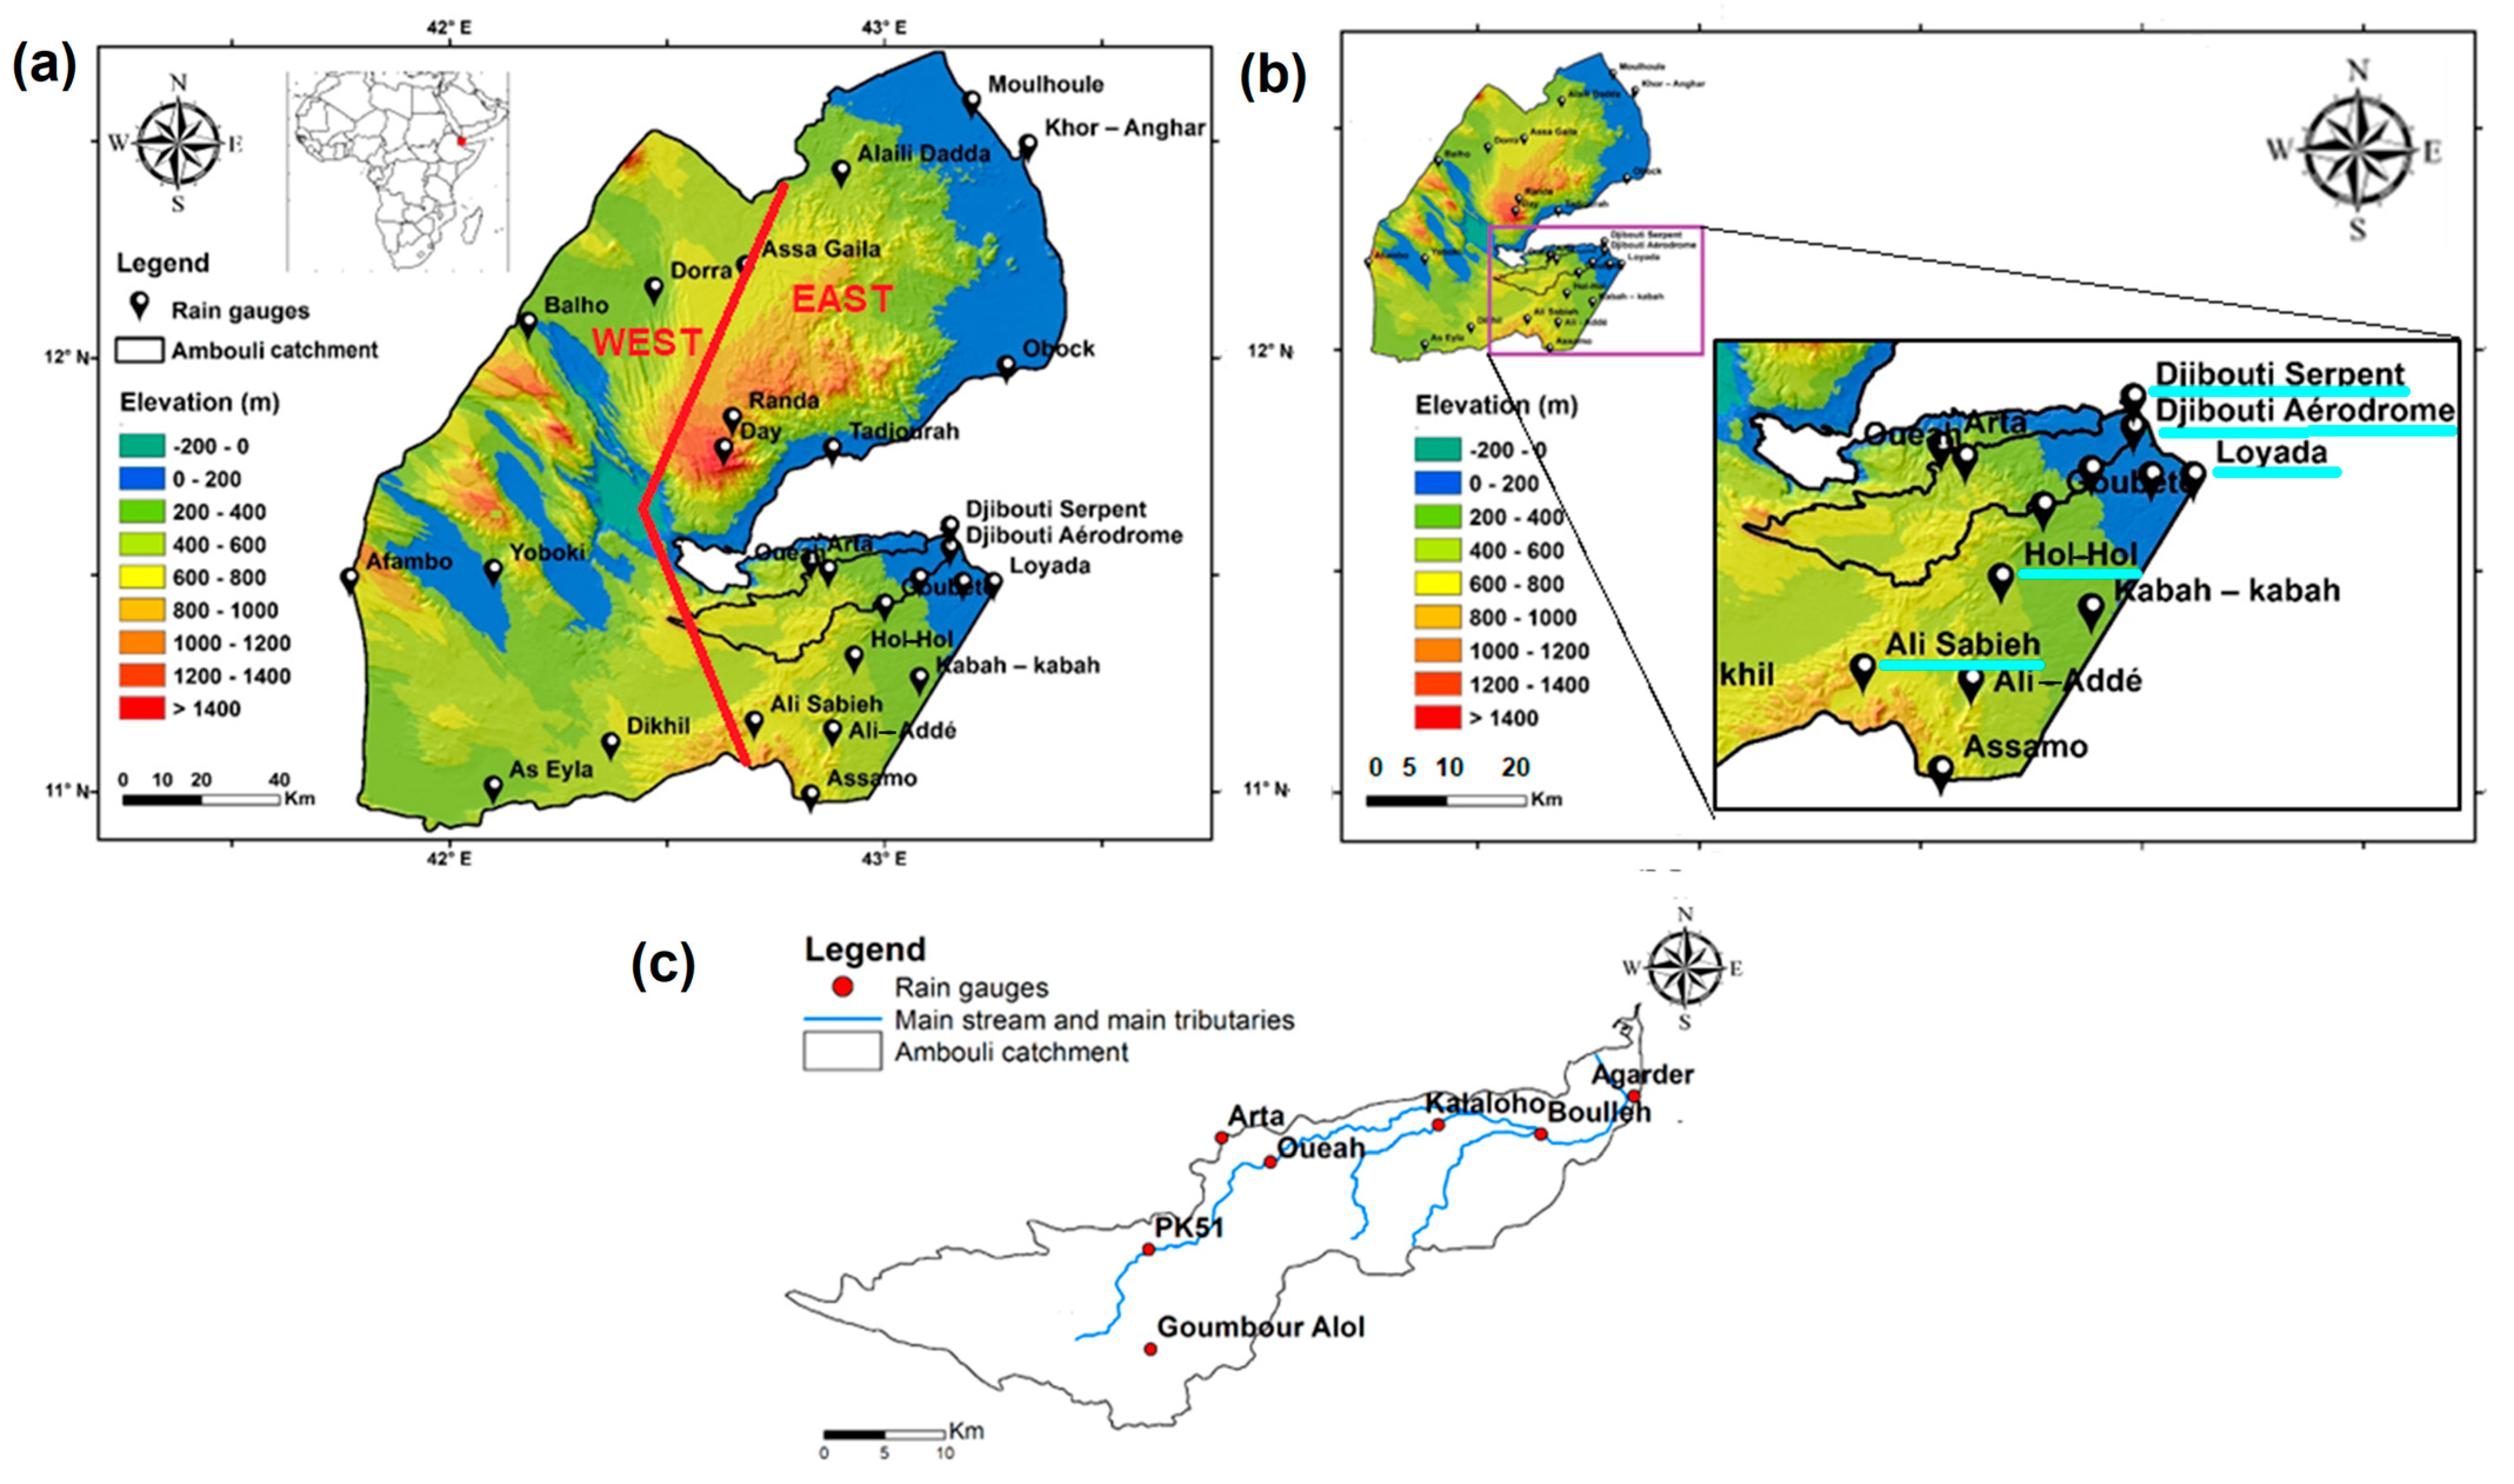
1] regionalized the climate of the Republic of Djibouti on the basis of an analysis of precipitation and obtained two clusters, EAST and WEST (
Figure 1a). The EAST zone concentrates most of the population and economic exchanges between Djibouti and its neighboring countries (
Figure 1b). Therefore, our study focuses on the southeast part of the country, near Djibouti. The southeast area is about 5000 km
2. Its proximity to the Red Sea and Gulf of Aden drives most of the rainfall variability [
1].
In the EAST zone, as in most of East Africa, it rains mainly from March–May (MAM) and October–December (OND). There are several hypotheses on the origin of these rains. During the transitional months (January and February), it is thought that these rains are associated with rare occurrences of tropical disturbances from the northwestern Indian Ocean, and in the winter, it is thought that they come from higher altitudes [
1,
17].
2.1.2. Catchment of the Ambouli Wadi
Inside the southeast region, we focus on the catchment of the Ambouli wadi, which is one of the country’s largest catchments (794 km
2) and is of major importance (
Figure 1c). The Ambouli aquifer is the main source of drinking water for the city of Djibouti.
Despite the importance of the catchment for the development of Djibouti City, it has been the subject of only a few scientific studies. Moreover, the increase in the population has been accompanied by a greater sprawl of Djibouti City [
18]. Urbanization leads to greater sealing of the catchment, which modifies the quality of water seeping into the aquifer and affects aquifer storage, but above all increases the frequency and magnitude of floods. Seyoum et al. [
19] have shown these effects in various East African countries such as Kenya and Ethiopia. The frequency of extreme flood events in Djibouti City has been increasing over the last two decades. The events of the years 2004, 2013, and 2018 were responsible for much economic and human damage [
14,
20].
2.2. Datasets
2.2.1. Rainfall Estimate Products (P Datasets)
The P dataset products were selected based on their availability in the two study areas and their relevance for operational research focusing on hydrology and/or agronomy [
8]. To be relevant for the target application, products need a daily or sub-daily temporal resolution.
Table 1 describes the 21 products. It should be noted, however, that the GPCC product has a monthly temporal resolution. Among the 21 products analyzed and compared to the rain gauge data, there are 15 long-term P datasets with more than 30 years of continuous observations and 5 P datasets spanning more than 15 years. For the southeast, the analysis is carried out on 15 long-term P datasets, and for the Ambouli catchment, 11 P datasets (
Table 1).
2.2.2. Rain Gauges of the National Meteorological Agency
At this scale, we work at monthly to annual time steps, except for Djibouti-Aerodrome where we also work at the daily time step. There are 14 rain gauge stations located in the southeast of the Republic of Djibouti managed by the Agence Nationale de la Météorologie de Djibouti (ANM). However, the main weakness of the rain data available from this network is the gaps in the time series. Based on the criteria of having more than 10 months of data per year, a total of 5 rain gauges were selected for analysis, namely Djibouti-Serpent, Djibouti-Aerodrome, Ali-Sabieh, Hol-Hol, and Loyada (
Figure 1b). These are tipping-bucket rain gauges. For the comparison with the 15 P datasets, the common period of analysis is 1980–1990. At the daily time step only the Djibouti-Aerodrome rain gauge is available for the southeast for the period of analysis (1981–2010).
2.2.3. Rain Gauges of the Early Warning System
Following the catastrophic floods in Djibouti City in 1994 and 2004, the government of the Republic of Djibouti has set up protective measures. These measures included the installation of the USAID-funded Wadi Ambouli Flood Monitoring and Alert System (RACA). This system was installed in the Ambouli catchment between February and March 2008. The hydrogeology and hydrology laboratory of the Centre d’Etudes et de Recherches de Djibouti (CERD) managed this network of 7 rain gauge stations (
Figure 1c) until 2015. These are tipping bucket rain gauges. For some of them, rainfall is measured at a sub-daily time step with no long periods of missing data (less than ten days per month and less than four months per year missing). For the comparison with the 11 P datasets, the common period is 2008–2013.
2.2.4. Selected Rain Gauges and Common Periods of Study
The two study areas mentioned above, the southeast of the Republic of Djibouti and the Ambouli catchment, are covered by, respectively, the ANM and the RACA network. The datasets are available for different periods and are analyzed at different time steps (
Table 2 and
Figure 1).
3. Methodology
3.1. Preprocessing (Pretreatment)
In order to ensure comparability among the selected P datasets, certain preprocessing steps were performed in this study. Firstly, since the datasets differed in spatial resolution, ranging from 0.0375° for TAMSAT v.3 to 1° for GPCC v.7, all datasets were resampled to a common spatial resolution of 0.1° by 0.1°. This resampling was implemented to facilitate straightforward comparison and analysis across the datasets.
For P datasets with a spatial resolution greater than 0.1° (such as PERSIANN-CDR, ERA-5, MERRA-2), a downscaling process was applied to adjust their resolution to 0.1°. Nearest neighbor interpolation was employed to downscale these datasets, ensuring that the values from the original dataset were preserved without alteration.
Conversely, for P datasets with a spatial resolution less than 0.1° (such as CHIRPS, TAMSAT), an upscaling procedure was employed to increase their resolution to 0.1°. Bilinear interpolation was utilized in this upscaling process, which estimates new values based on weighted averages of the neighboring points in the original dataset [
5,
38].
Furthermore, it is worth noting that some of the selected P datasets provided data at the sub-daily time step, while others were available at the daily time step. To obtain homogenous data for analysis, the sub-daily data were aggregated to the daily time step over the entire study period. This aggregation ensured consistency in the temporal resolution of the P datasets, allowing for meaningful and consistent comparisons among them.
By implementing these preprocessing steps, we aimed to standardize the spatial resolution and temporal granularity of the P datasets used in our study. This allowed for more robust and reliable comparisons, facilitating a comprehensive assessment of their performance within the defined study period.
These preprocessing steps were undertaken to ensure the compatibility of the datasets and to create a consistent framework for subsequent analysis. It is important to acknowledge and account for such data preprocessing techniques to enhance the validity and reliability of the research outcomes.
3.2. Approach
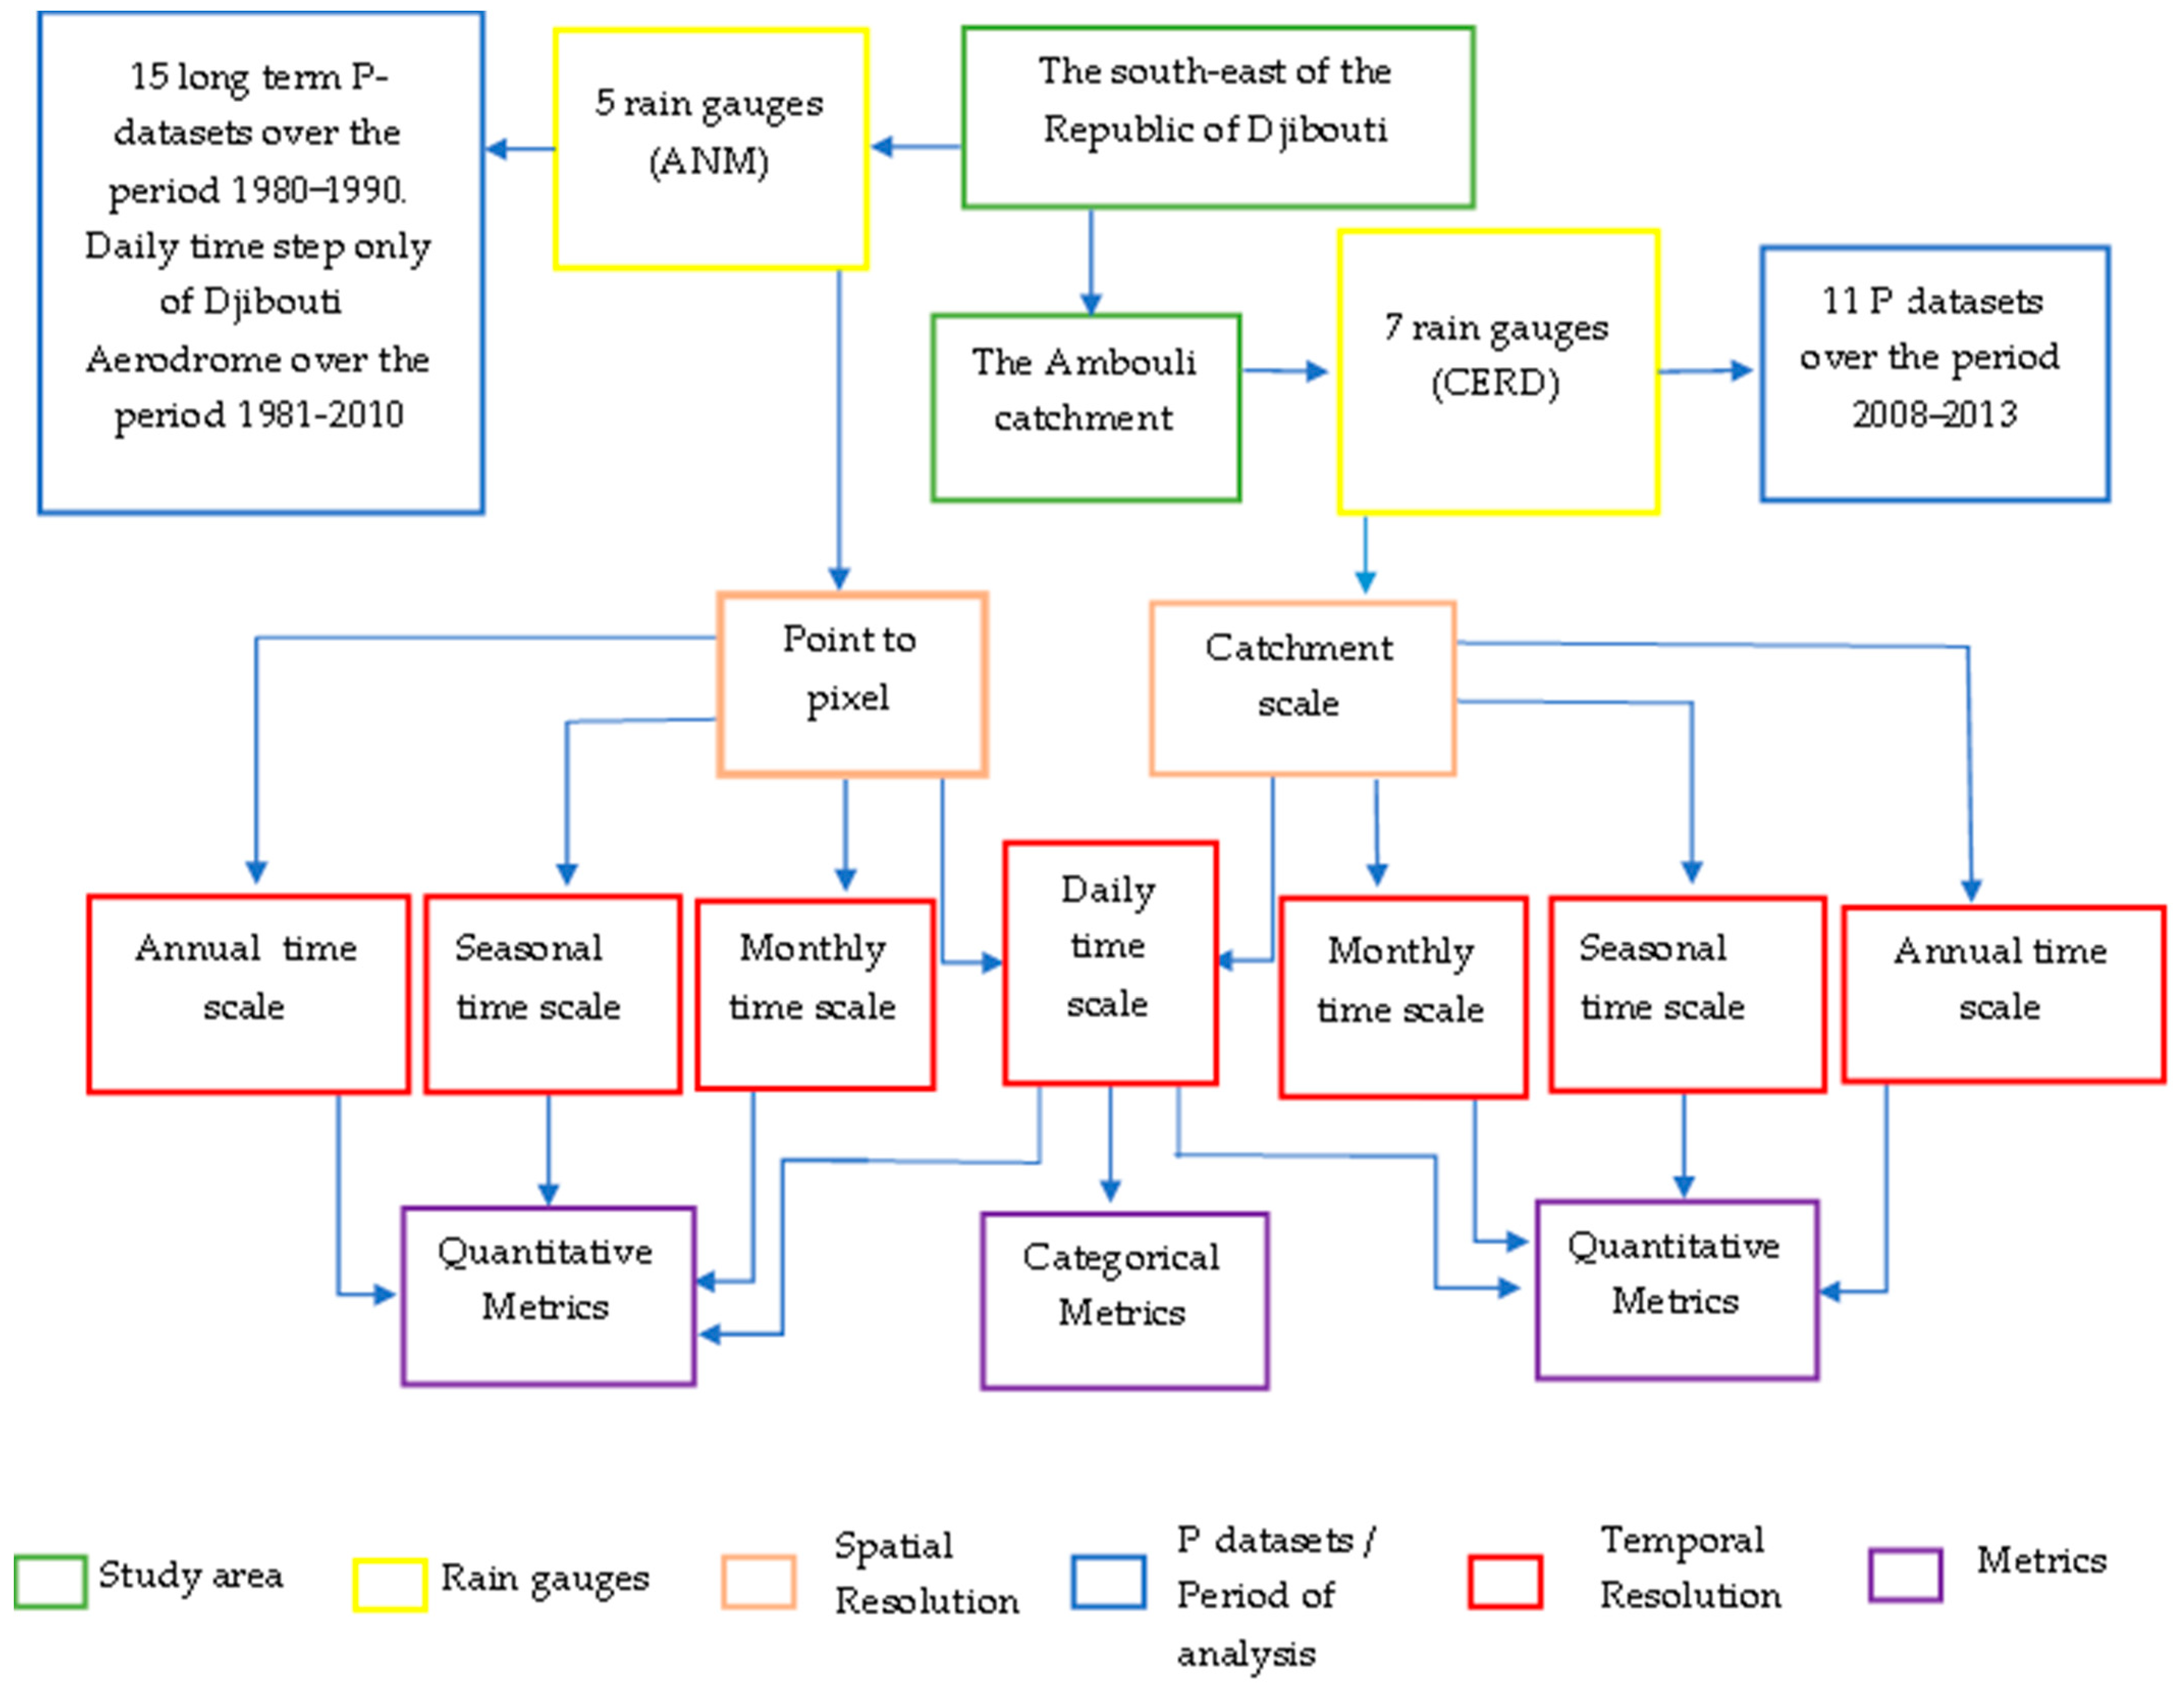
This study assesses the performance of 21 P datasets at different temporal resolutions including daily, monthly, seasonal, and annual time scales as summarized the
Figure 2. The evaluation is conducted on two distinct spatial scales and over two time periods: first, the southeast zone of the Republic of Djibouti using 15 long-term P datasets for the common period of 1980–1990, and the Ambouli catchment area using 11 P datasets for the period of 2008–2013. The prerequisite for the choice of comparison period was that the period be common to all the P datasets and all the rain gauge data. It is worth noting that the 5 P datasets used in both analysis areas bring the total number of P datasets to 21. The choice of P datasets for the southeast zone was based on their availability over the selected period, while the selection for the Ambouli catchment was based on their spatial resolution, which needed to be less than or equal to 0.1.
The validation of the P datasets was carried out on two spatially aggregated levels: point-to-pixel and catchment scale. The point-to-pixel scale is a pairwise comparison of the rain gauge data from the ground station with the corresponding gridded precipitation value.
The catchment-scale validation analysis was performed by comparing spatially aggregated P datasets for the catchment to a corresponding interpolated rainfall based on the ground reference rainfall. The catchment spatial unit is particularly relevant for characterizing rainfall because it represents the conventional working unit for hydrological applications. At the same time, and as suggested by Xie and Arkin [
39], aggregation on a larger scale enhances the stability of the precipitation validation exercise. For the interpolation of the mean annual rainfall at the catchment scale, we used the inverse distance weighting [
40] spatial interpolation method. This is a local deterministic interpolation technique that calculates the value of a point by averaging the values of the neighboring points weighted by the inverse of the distance to the calculated point: the closer the points, the greater the weight assigned.
3.3. Metric Validation
To assess the ability of P datasets to estimate the amount of ground reference rainfall, the metric analysis includes detailed quantitative and categorical metrics. Although a wide range of evaluation metrics are available to assess data performance [
4,
41,
42,
43], there is no single metric that encapsulates all the aspects of interest. For this reason, it is useful to consider several performance metrics and understand the type of information or insight they might provide [
44].
3.3.1. Quantitative Metrics
Three quantitative metrics were used for all the time steps (
Table 3):
The root mean square error (RMSE) is a frequently used measurement of the difference between two variables. It measures the average magnitude of the estimation errors: low RMSE values indicate a low variance in the P datasets. To calculate the RMSE, we used the median value of a P dataset.
The mean bias error (MBE) is used to estimate the average bias in the P datasets and provides a good indication of the mean under- or overestimation of the predictions. A positive value of MBE means an overestimation. To calculate the MBE of a P dataset, we used the median value.
There are several indices used to evaluate the performance and reliability of P datasets over time. We used the Kling–Gupta Efficiency (KGE) because water resource management requires reliable representation of precipitation temporal dynamics (measured by
r) and volume (measured by
β and
γ [
5]. However, for this study we only analyzed the value of the KGE in its totality. Thus, the median value of the KGE was used as a reliability criterion at the scale of the study area.
In
Table 3,
x corresponds to the ground reference rainfall and
y corresponds to the rainfall of the P datasets.
is the Pearson correlation coefficient and is used to evaluate the goodness of fit of the P dataset estimations to the observed data.
is the ratio between the averages of the P datasets and of the observed data.
is the ratio between the coefficients of variation of the P datasets and of the observed data.
3.3.2. Categorical Metrics
The performance of the P datasets was also analyzed using categorical metrics at the daily time step [
5]. Five statistical indicators based on a contingency table (
Table 4) were computed to constitute the categorical metrics (
Table 5):
The probability of detection (POD) indicates what fraction of the observed events was correctly estimated.
The false alarm ratio (FAR) corresponds to the proportion of events identified by the P datasets but not confirmed by gauge observations.
The Accuracy measures the proportion of correct decisions.
The Error measures the proportion of incorrect decisions.
The Heidke skill score (HSS) evaluates the ability of the P datasets to detect precipitation events in comparison to a random prediction. The HSS values range from −∞ to 1, with a perfect score of 1 and negative values indicating that random prediction outperforms the P dataset.
The HSS value was computed at each grid-cell location to observe P dataset reliability over space.
4. Results
The performance of the P datasets was evaluated using the quantitative metrics (i.e., KGE, RMSE, and MBE) and categorical metrics (i.e., POD, FAR, Accuracy, Error, and HSS) at the annual, seasonal, monthly, and daily temporal scales.
4.1. Annual Comparison
4.1.1. Southeast of the Republic of Djibouti (1980–1990/15 P Datasets)
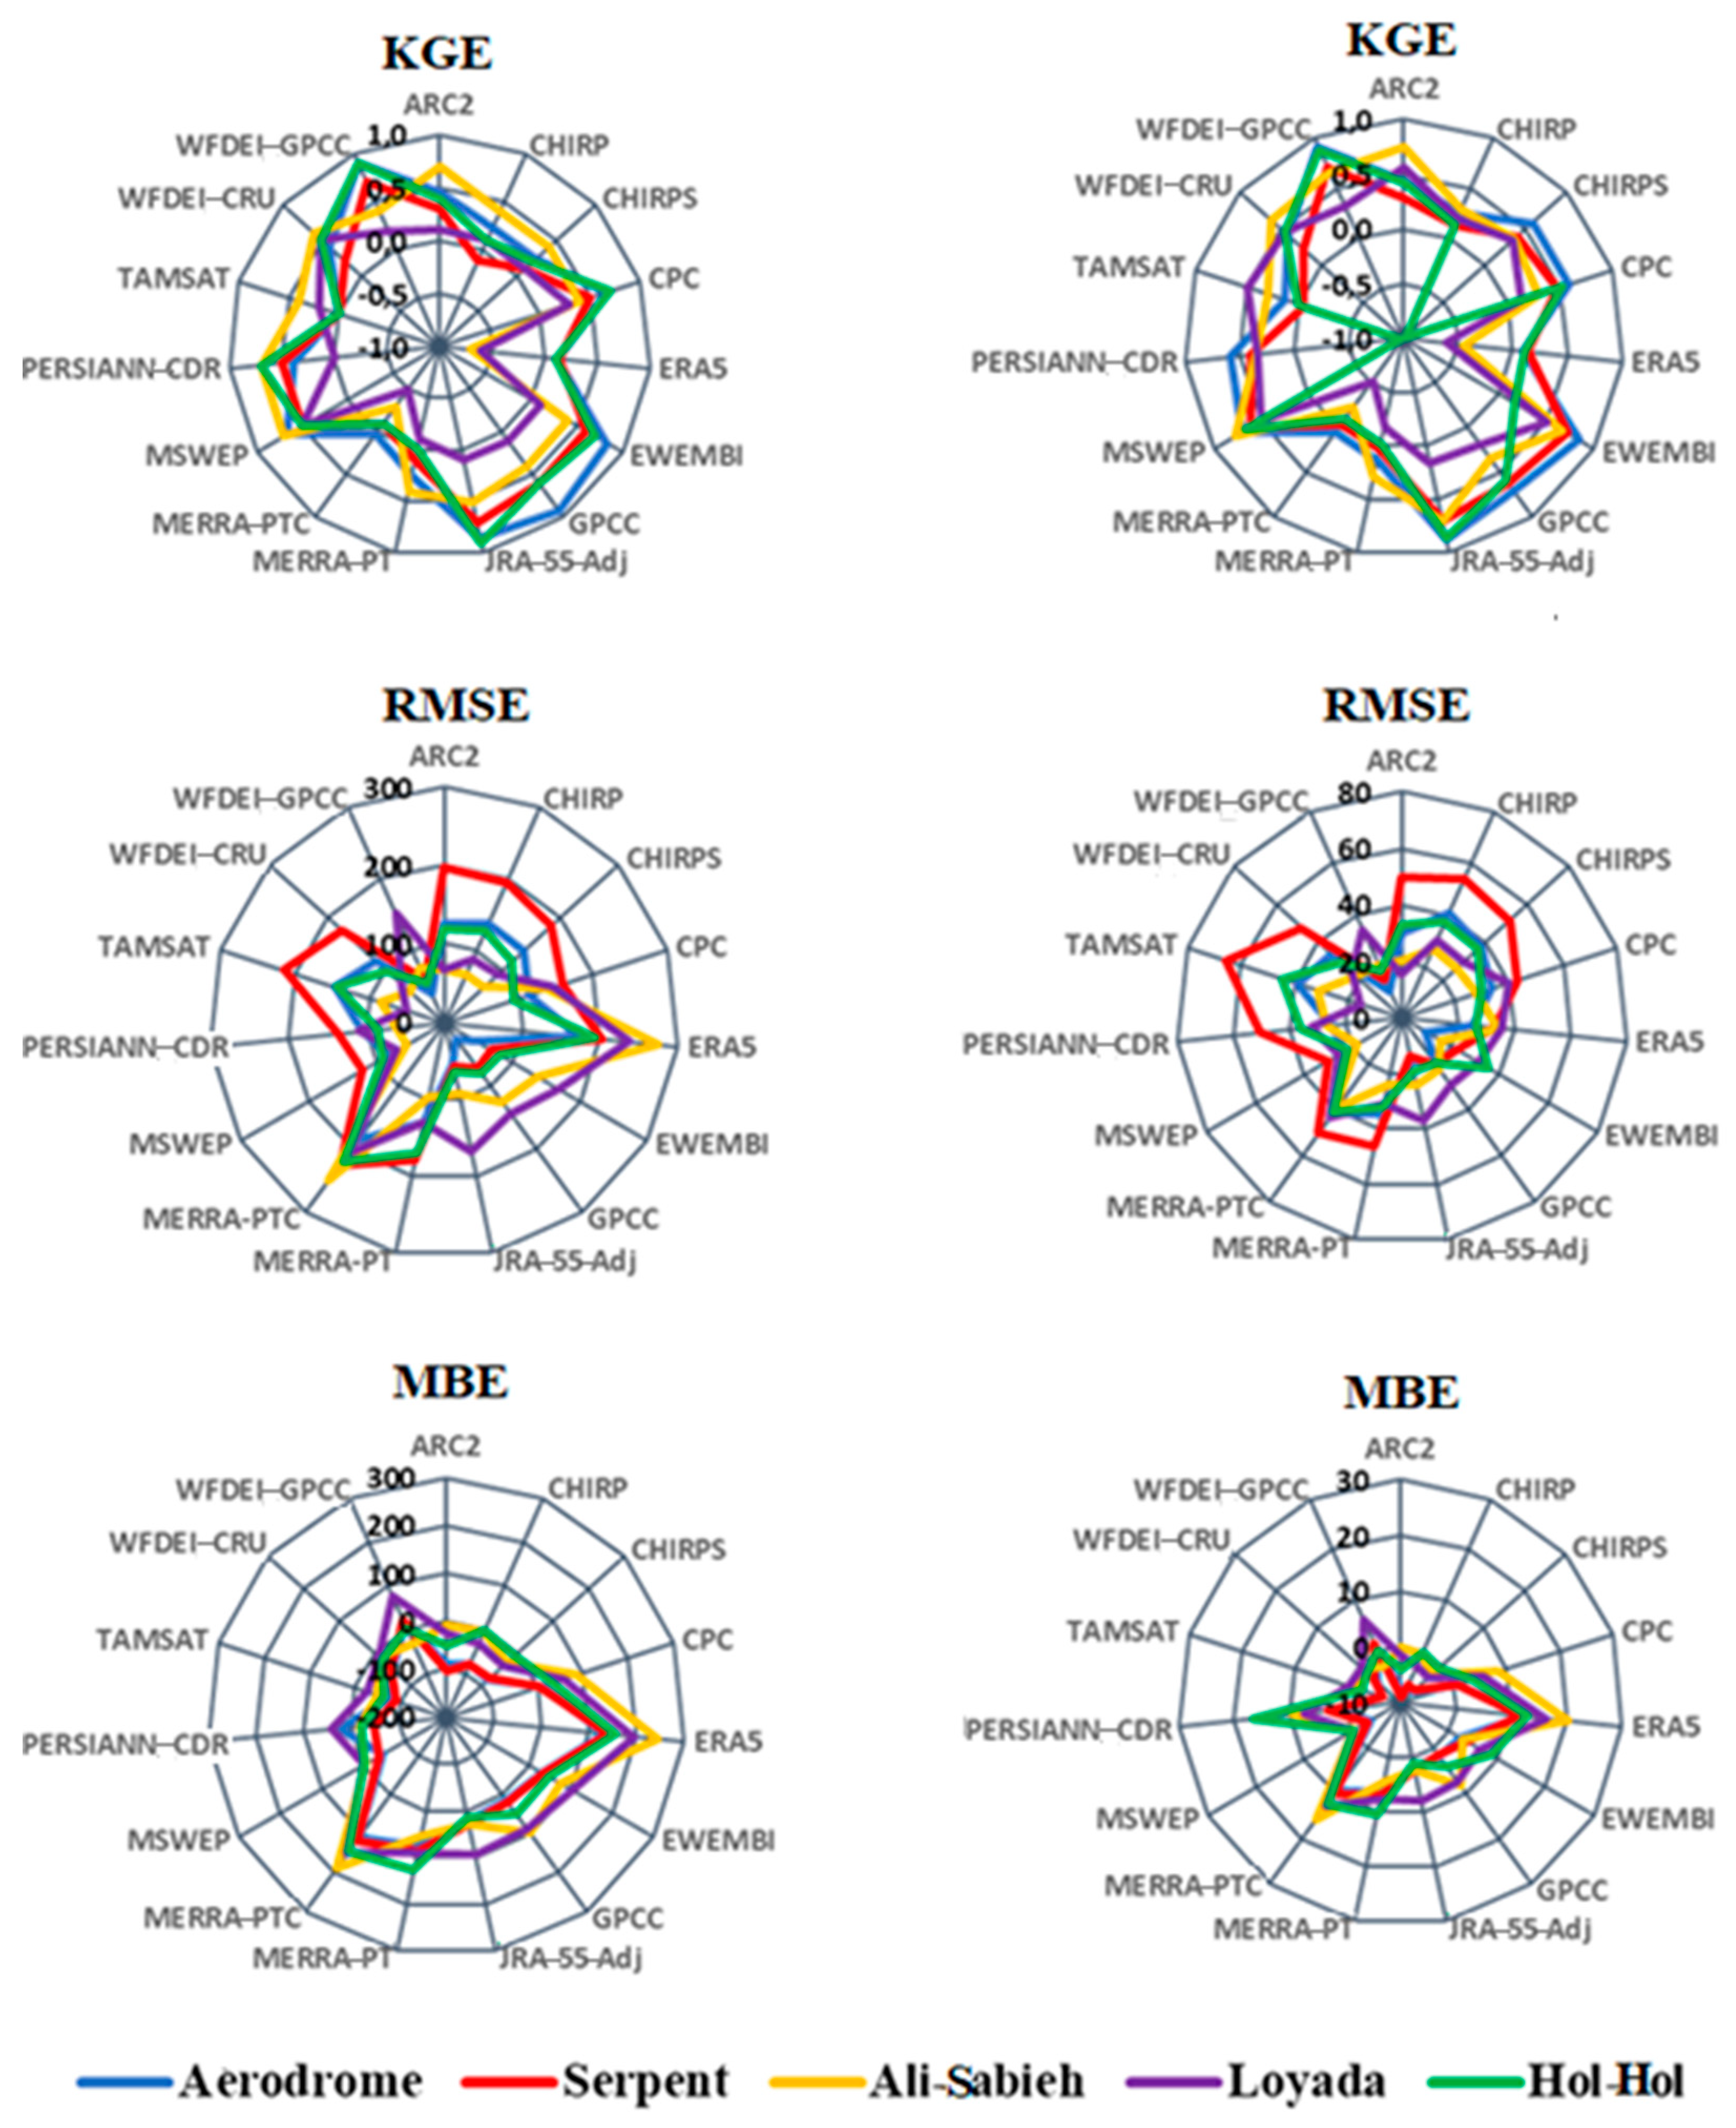
The KGE values reveal strong agreement with the rain gauge data for some of the P datasets (
Figure 3). Eight of the P datasets (CPC, ERA5, EWEMBI, GPCC, JRA-55 Adj, MERRA-2 PT, MERRA-2 PTC, and WFDEI-GPCC) overestimated rainfall (positive MBE). Five P datasets have high KGE values: EWEMBI, GPCC, JRA_55 Adj, MSWEP v.2.2, and WFDEI-GPCC. These five P datasets also have the lowest RMSE values (between 75 and 100 mm per year). Moreover, WFDEI-GPCC is the best among all the P datasets (using the KGE performance criterion), with the most satisfactory values of MBE and RMSE, while MERRA-2 PTC and ERA 5 have the worst performance. It is worth mentioning that the Loyada rainfall station has the lowest values of KGE except for TAMSAT and WFDEI-CRU (
Figure 3).
4.1.2. Ambouli Catchment (2008–2013/11 P Datasets)
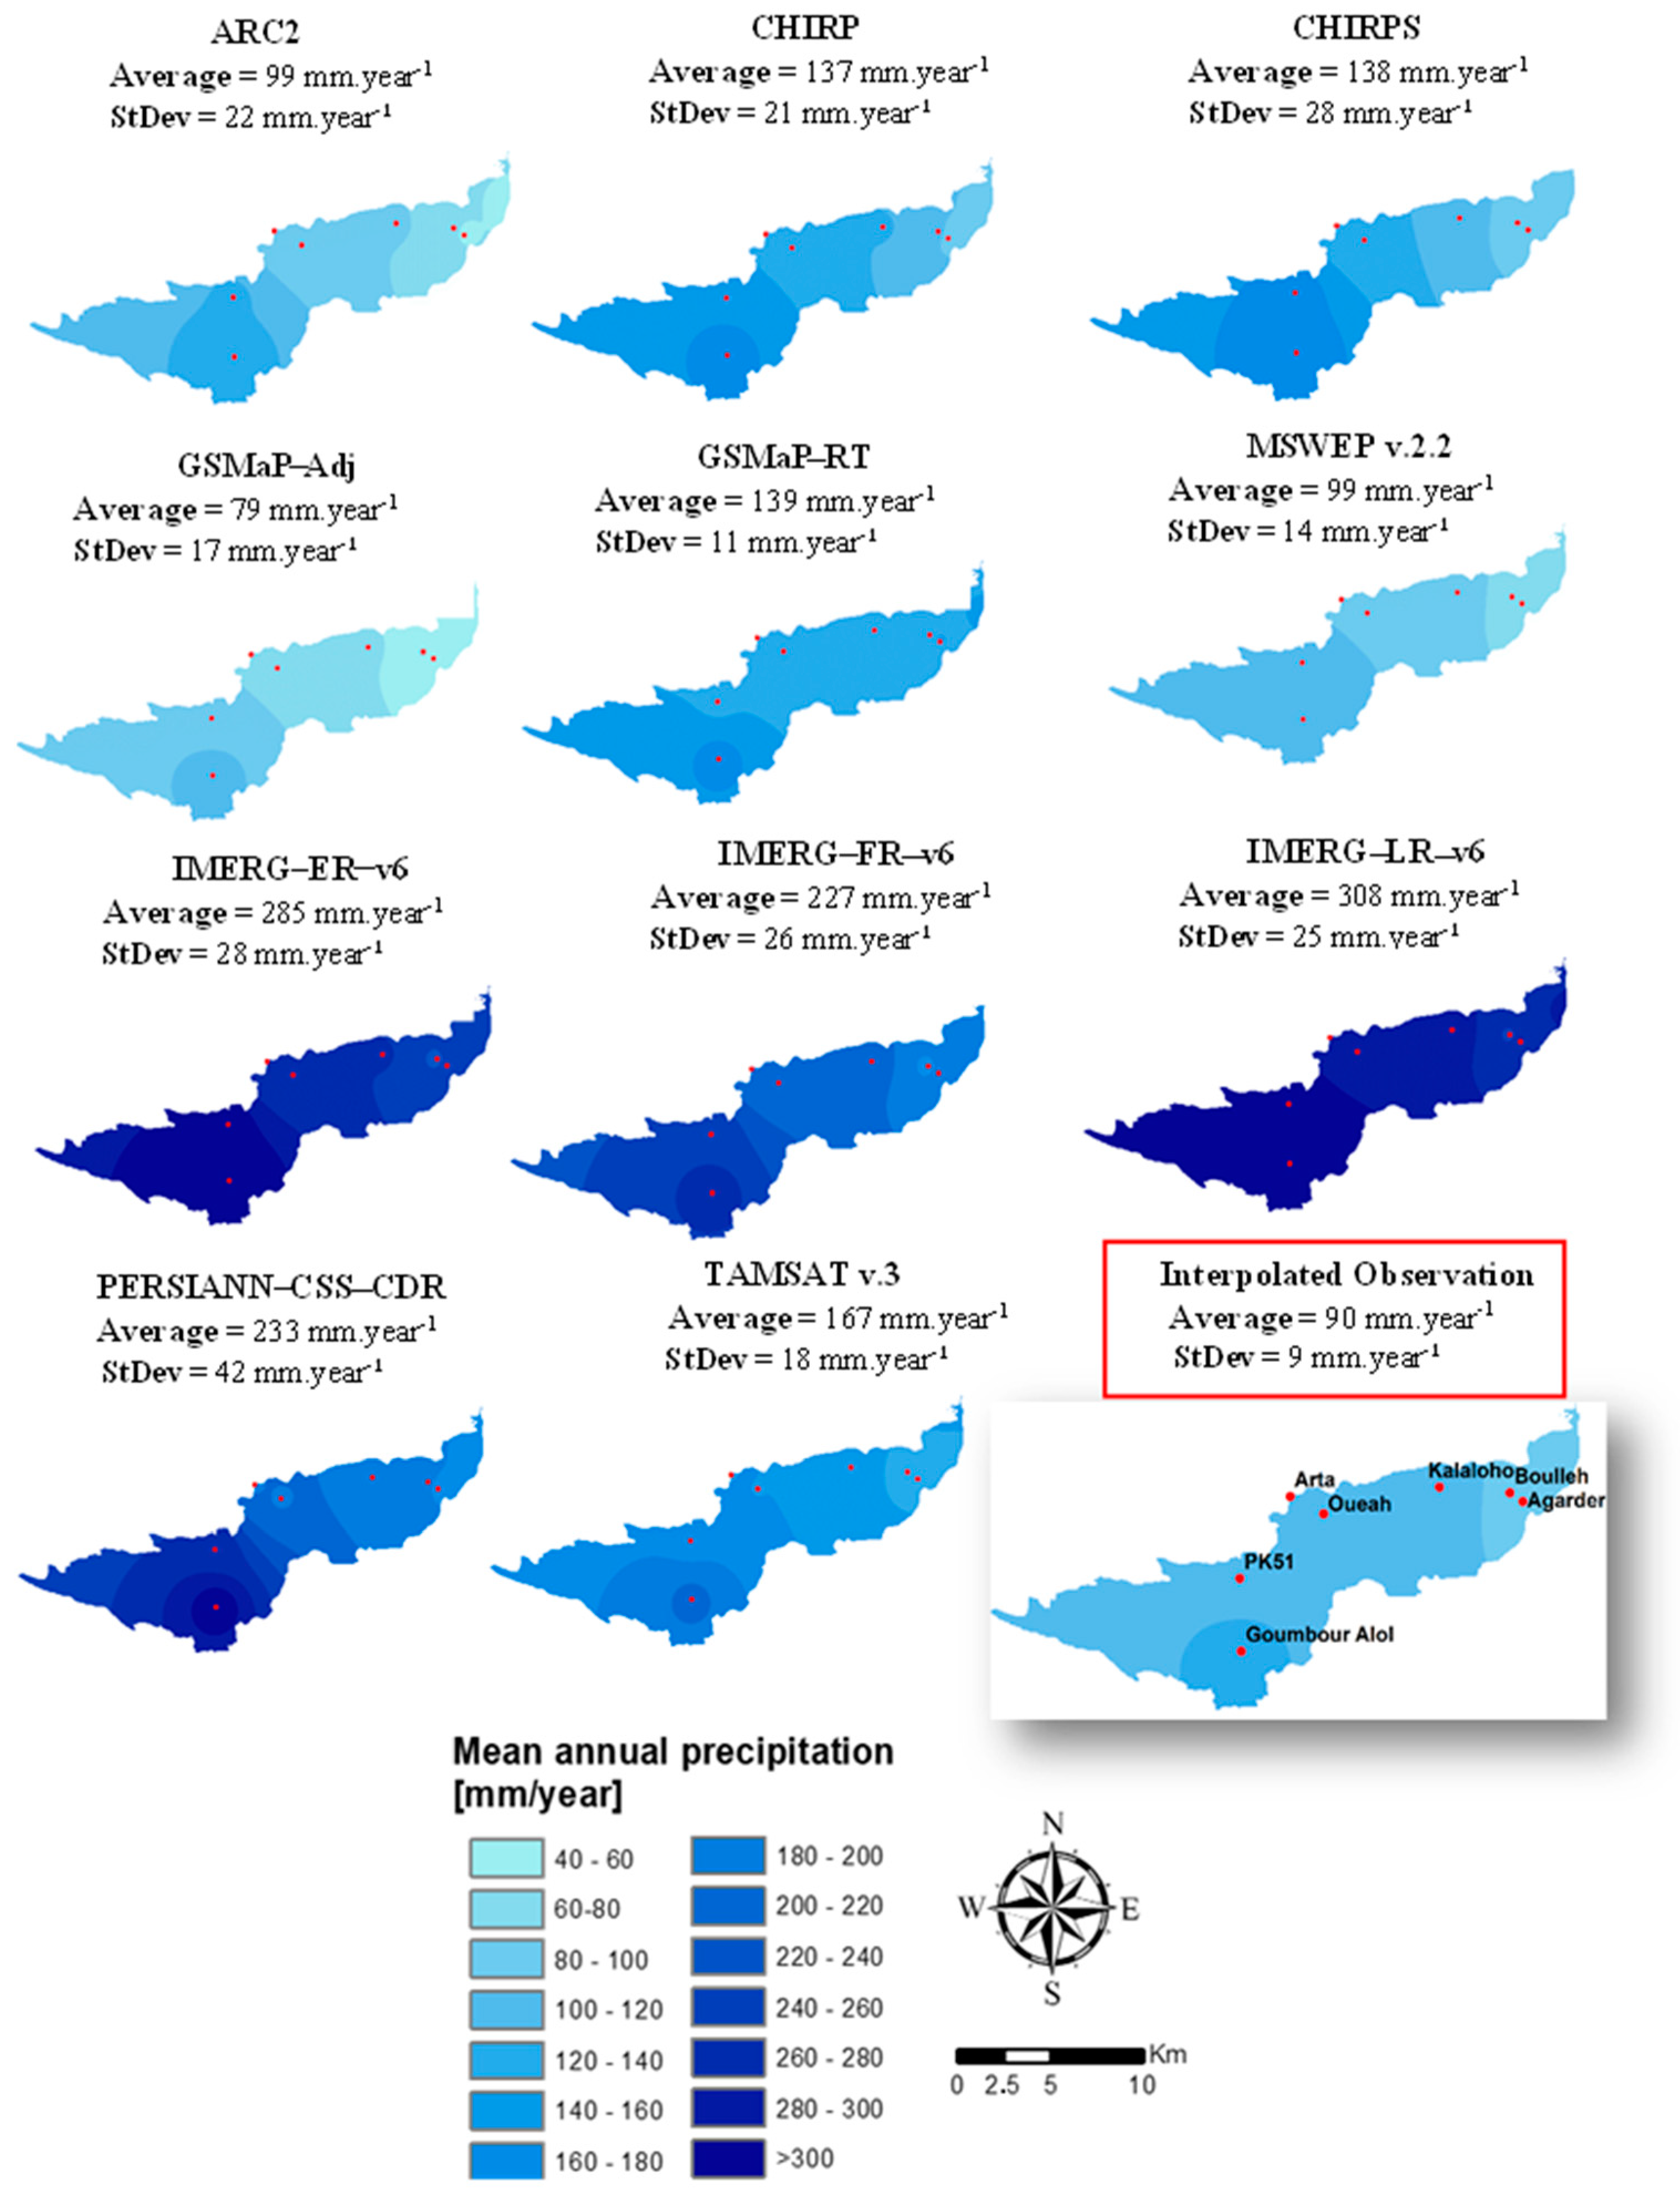
Figure 4 shows the interpolated average annual precipitation of the 11 P datasets compared to the average annual precipitation of the rain gauge stations. We first notice that the general west–east rainfall gradient, which is characterized by a decrease in mean annual rainfall, was captured by most of the analyzed products. IMERG-LR presents the highest annual average (308 mm year
−1, with a standard deviation of 25 mm year
−1) and GSMaP-Adj the lowest (79 mm year
−1, with a standard deviation of 17 mm year
−1), which corresponds to a wide range of annual rainfall from 79 to 308 mm. The average annual rainfall according to the rain gauge stations is 90 mm year
−1. We have thus identified the four P datasets out of the eleven that present the lowest standard deviation in terms of annual mean (ARC2, CHIRPS, GSMaP-Adj, and MSWEP v.2.2), with MSWEP v.2.2 being the most reliable product compared to the rain gauge stations (with a slight overestimation of the annual rainfall values by 10%). The MSWEP v.2.2 product remains effective at both scales. The lowest performing products are the IMERG products (ER, FR, and LR).
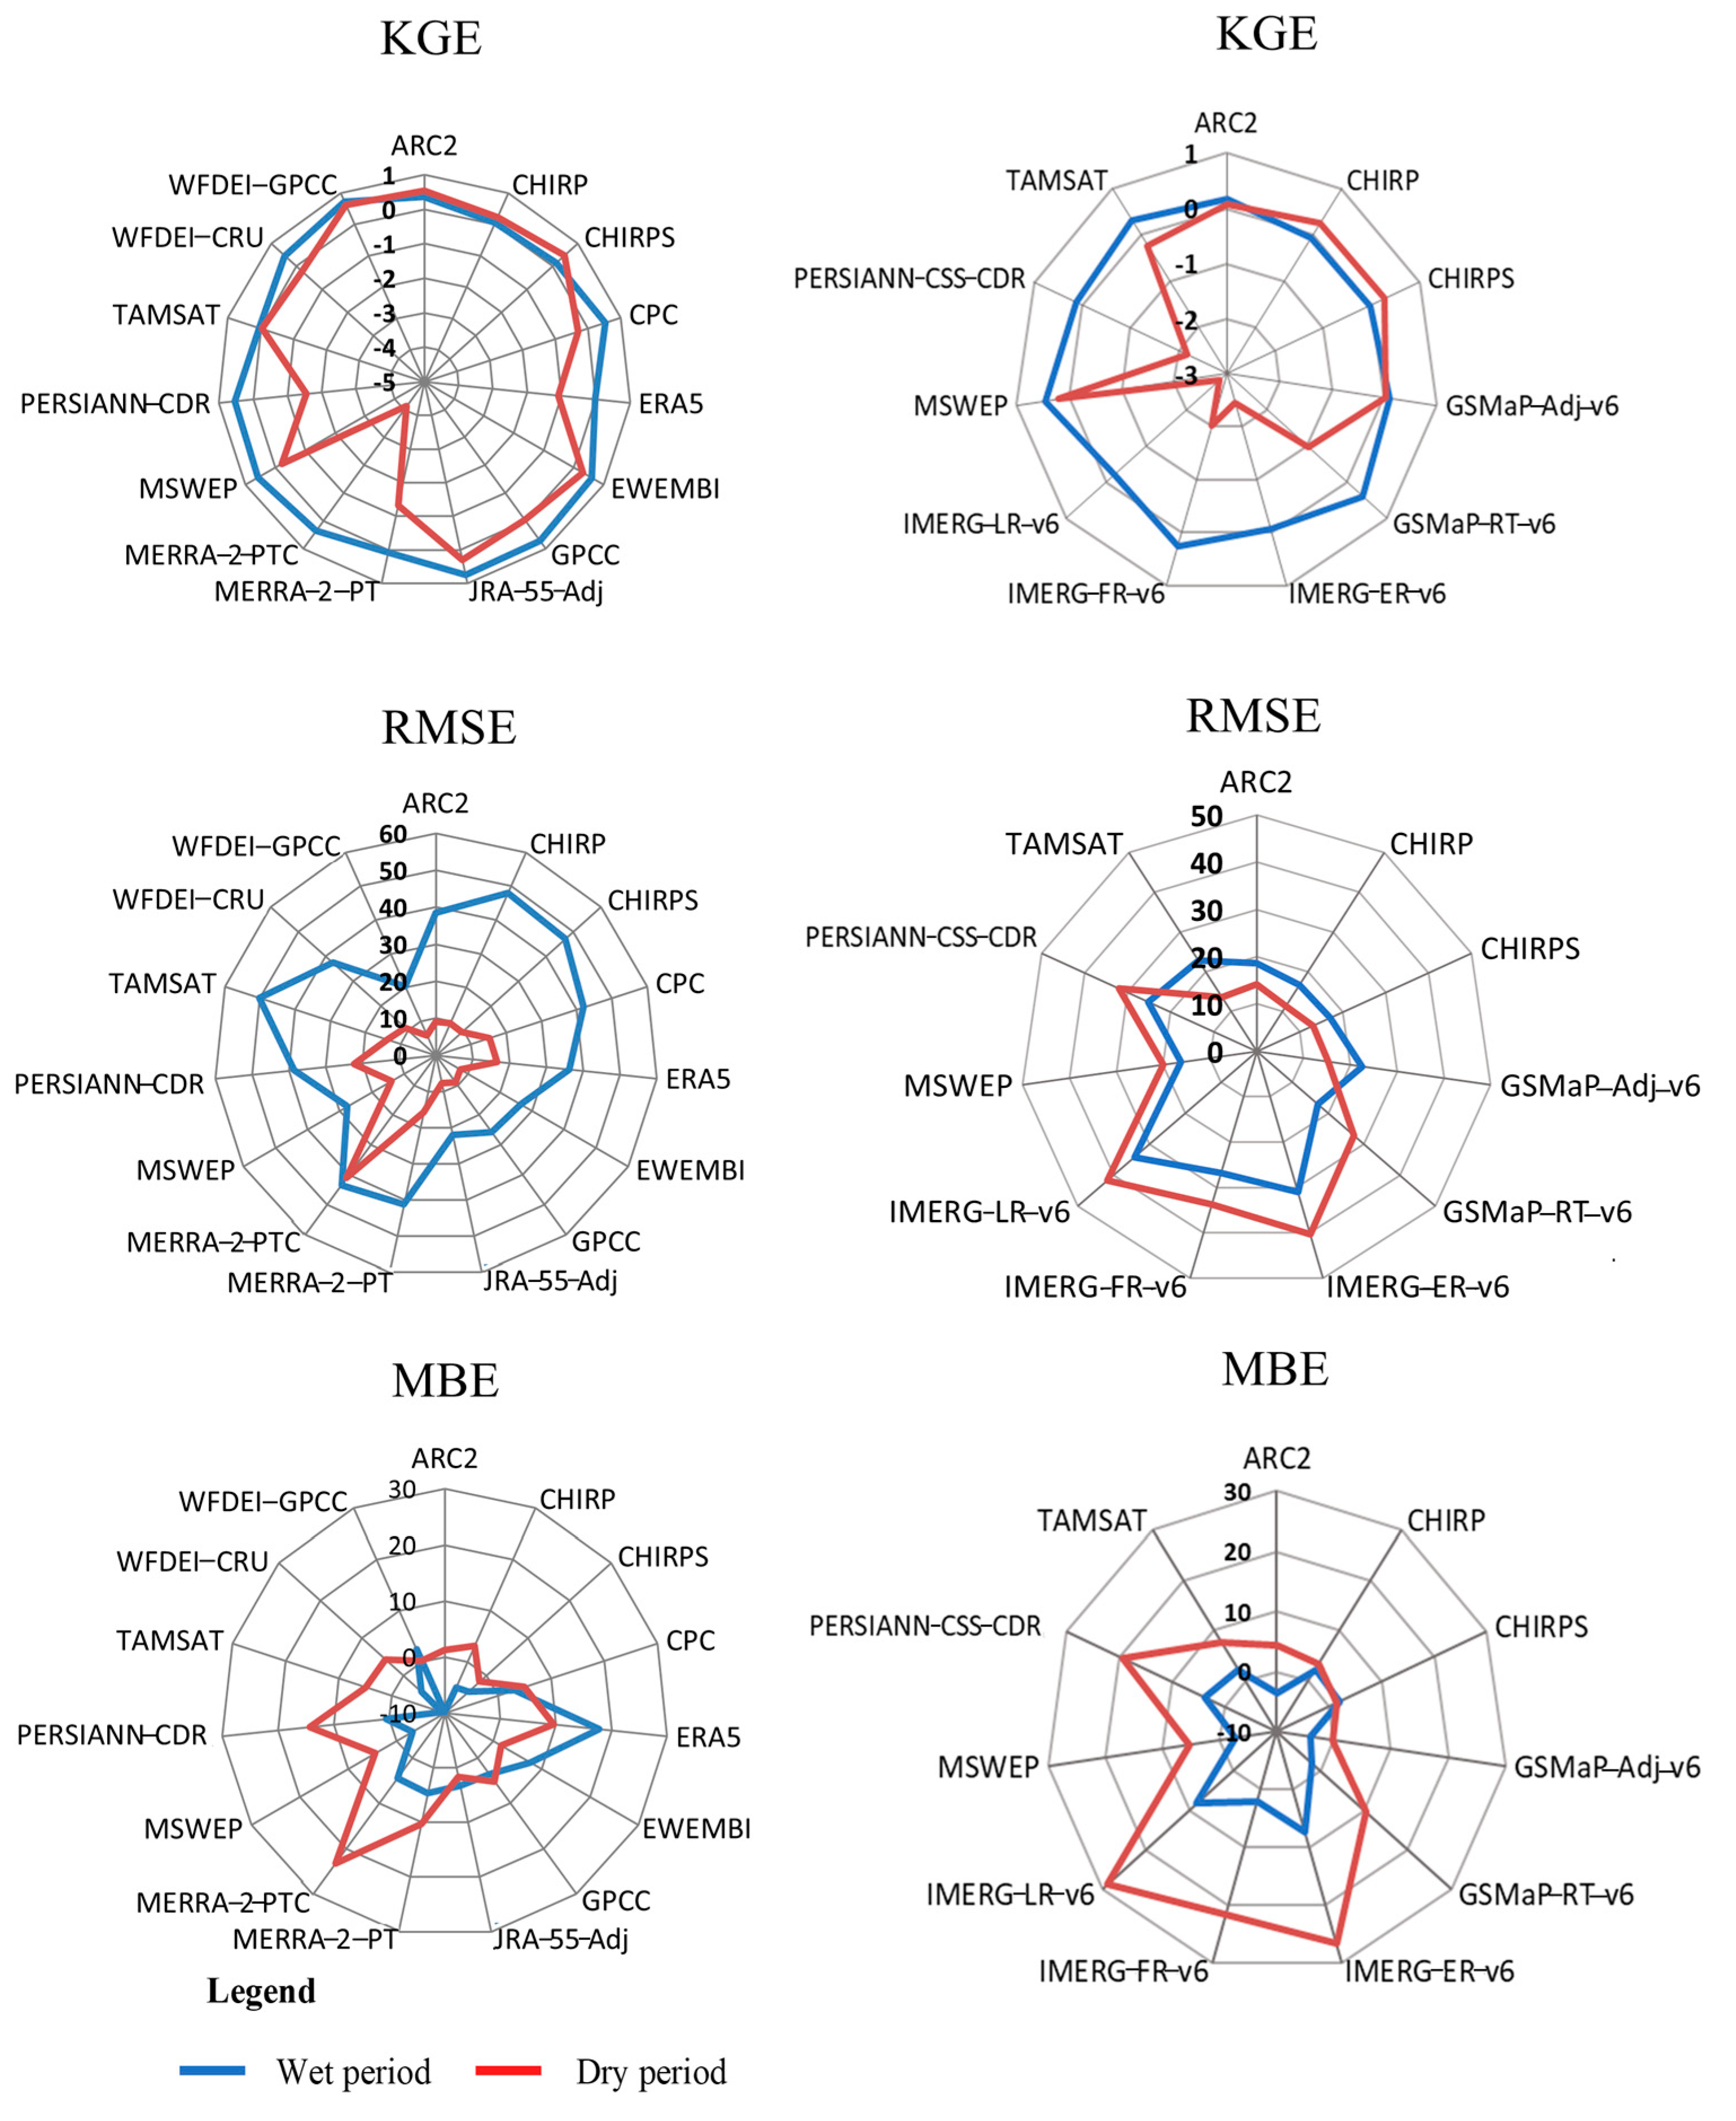
4.2. Seasonal Comparison
4.2.1. Southeast of the Republic of Djibouti (1980–1990/15 P Datasets)
The climate of the country is characterized by two distinct periods:
Figure 5 presents the metric validation at the seasonal scale. We observe that 80% of the P datasets perform better during the wet season than during the dry season. Like for the annual time step, EWEMBI, GPCC, JRA-55 Adj, MSWEP v.2.2, and WFDEI-GPCC are the best-performing P datasets.
The KGE values of these five P datasets vary considerably, around 0.5 for the wet season and much lower for the dry season. For all the P datasets, the RMSE values for the wet season are on average more than three times higher than for the dry season. The MBE values show that the five P datasets generally overestimate the rainfall (positive MBE values), but we do observe two underestimated values, corresponding to MSWEP v.2.2 (wet season) and WFDEI_GPCC (dry season).
WFDEI-GPCC is the most reliable product at the seasonal scale (wet and dry periods). MERRA-2_PTC is the least accurate product, with high RMSE and MBE values and a KGE value lower than 0.2 (
Figure 5).
4.2.2. Ambouli Catchment (2008–2013/11 P Datasets)
Just like in the seasonal analysis for the southeast of the country, in the Ambouli catchment:
The P datasets mainly overestimate the seasonal rainfall but perform better in the wet season than in the dry season.
CHIRP and CHIRPS perform better in the dry season but have a low KGE value of around 0.2.
However, contrary to the above seasonal analysis, the RMSE values for the dry season and for the wet season have an almost identical mean, which means that for this period, we have a rainy season spread over both the wet and dry periods.
We also notice that the best-performing products at the seasonal time step are GSMAP-RT and MSWEP v.2.2, which are the same as for the annual time step.
4.3. Monthly Comparison
4.3.1. Southeast of the Republic of Djibouti (1980–1990/15 P Datasets)
The metrics are listed in
Table 6. Strong agreement with the rain gauge data is observed for some of the P datasets. At the monthly time step, we observe results similar to those obtained at the previous time step (
Figure 3):
EWEMBI, GPCC, JRA-55_Adj, MSWEP v.2.2, and WFDEI_GPCC, the five most reliable P datasets at the previous time step, show the best statistical scores at the monthly time step (
Figure 3).
WFDEI_GPCC has the best performance (KGE = 0.70, RMSE = 19.61 mm month−1 and MBE= 1.27 mm month−1).
MERRA-2 PTC is the least reliable product.
Loyada is the rain gauge station that presents the least satisfactory KGE values.
4.3.2. Ambouli Catchment (2008–2013/11 P Datasets)
Table 7 shows the values obtained for the quantitative metrics at the monthly and daily time steps. MSWEP v.2.2 has the highest KGE (0.32), the lowest RMSE (15.5 mm·month
−1), and the lowest MBE (near to 0 mm month
−1). This product also has the best performance at the annual and seasonal time steps. On the contrary, the IMERG products (ER, FR, and LR) show the least satisfactory results, with a negative KGE value and the highest RMSE and MBE values, like for the previous time step. At the monthly time step, the KGE values obtained for the southeast of the country are higher than those obtained for the Ambouli catchment (0.70 versus 0.35 for the most reliable P datasets).
Only MSWEP v.2.2 remains effective for both spatial resolutions and temporal windows, as well as for the previous time step.
4.4. Daily Comparison
4.4.1. Southeast of the Republic of Djibouti: Djibouti-Aerodrome Rain Gauge (1981–2010/15 P Datasets)
For the daily time step analyses, we use data from the only Djibouti-Aerodrome rain gauge for the period 1981–2010, which is the common period between the station and all the P datasets. The GPCC product is not present in the analysis of the daily time step data because it has a monthly temporal resolution.
The ability of the P datasets to quantify the amount of daily precipitation is relatively low, with most products having negative KGE values (
Table 6). Only the most reliable products at the previous time step, EWEMBI, JRA-55_Adj, MSWEP v.2.2, and WFDEI_GPCC, have positive KGE values. With regard to MBE, the values are relatively homogeneous for all the products (from −0.13 mm to 0.42 mm). The low values of MBE and RMSE are due to the low number of rainy days (i.e., with a rainfall of >1 mm day
−1).
Table 8 shows the results of the POD, FAR, Accuracy, Error, and HSS metrics. Some values such as POD, Accuracy, and Error give “relatively good” values but are in fact largely skewed due to the very few rain events observed. For the POD, the P datasets MERRA-2 (PT and PTC) and ERA5 (the worst-performing products at the previous time steps) detect almost no rainy days, which explains the almost good POD values for these products. EWEMBI, JRA-55 Adj, and WFDEI-GPCC provide a satisfactory POD of >0.7. For the FAR, we observe relatively high values for the products (FAR >0.9 except for CHIRPS, which presents a FAR of 0.75). For the Accuracy and Error, the results are moderately satisfactory for most of the products; however, like for the FAR values, the CHIRPS product has the best Accuracy and Error. Indeed, compared to rainfall data, these products detect events rather well when they occur (POD and Accuracy) but they detect many more events than in reality (FAR and Error). Compared to the other products, MSWEP has, however, a poor POD.
The HSS values for all the products are very low (almost zero). The highest HSS was obtained by CHIRPS (HSS = 0.19). Given the number of non-rainy days, it seems necessary to set a threshold value (rainfall threshold). Thus, several threshold values ranging from 1 mm to 50 mm were applied to the products for the calculation of HSS [
5], and the maximum HSS was obtained with a threshold value of 1 mm. After applying the threshold value of 1 mm, we observe that the HSS values are higher, which probably shows that there are more detected rainfall events <1mm and the products with the best performance are the same as at the annual and monthly time steps (EWEMBI, JRA-55 Adj, MSWEP v.2.2, and WFDEI-GPCC), as well as CHIRPS. Therefore, the optimum of the “threshold HSS” is HSS > 1 mm, which probably shows that there is limited concomitance between the P datasets and the observed data for the extreme rainfall events (this analysis is detailed further in the next paragraph).
With an average annual rainfall of 150 mm at the Djibouti-Aerodrome station, the average number of rainy days is 12 days (higher than 1 mm). However, the most efficient products at a daily time step, MSWEP, CHIRPS, and JRA-55, give an average of 16, 21, and 24 rainy days, respectively (for rainfall higher than 1 mm). In contrast, the other products provide results with an average of more than 40 days (with the maximum rainy days for the MERRA-2 product with 86 rainy days on average).
To complement this analysis, we also investigated the ability of these P datasets to detect rainfall events triggering runoff. For this purpose, a threshold of rainfall greater than 10 mm (which corresponds to an average of three events per year) was used. The percentage of concomitant rainfall days was calculated for each P dataset, with values ranging from 44% for MSWEP to 80% for EWEMBI for the efficient products.
After obtaining the concomitant day values, we analyzed the concomitance of the rainfall values and observed that, on average, 95% of rainfall events higher than 10 mm are significantly underestimated by the P datasets. There was no concomitance observed between the P datasets and extreme rainfall values (greater than 50 mm). These results highlight the limitations of these P datasets for rainfall-runoff modeling at a daily time step and underscore the need for further research to develop more accurate and reliable rainfall datasets for high flood forecasting in semi-arid regions.
4.4.2. Ambouli Catchment (2008–2013/11 P Datasets)
Similarly to the daily analysis in the southeast, the ability of the P datasets to quantify the amount of daily precipitation is relatively low. In terms of the KGE values (
Table 7), only GSMaP-RT and MSWEP v.2.2 (the best-performing P datasets at the previous time steps) present values greater than 0.3. These values are homogenous with those obtained at the previous time step. The RMSE and MBE values of these two products are satisfactory, with an MBE close to 0 mm and an RMSE close to 2 mm.
To complement the analysis of the quantitative metrics, we analyzed the selected categorical metrics (
Table 9):
The POD and FAR values are mainly high because a mean of 11 rainy days was recorded per year at the Ambouli catchment (these results are in agreement with the results obtained in the southeast of Djibouti), and rainfall estimation products in general overestimate the number of rainfall events in an arid environment, which results in FAR values close to 1 (optimum 0).
The Accuracy and Error values for the P datasets (other than the CHIRP product) are, on average, close to 0.9 and 0.1, respectively. These values are satisfactory.
It is the HSS that allows us to quantify the reliability of the P datasets in reproducing daily rainfall. We note that the values of HSS without a threshold value are almost zero, while the values of HSS with a threshold at 1 mm are higher (for some products values are close to 0.3), which agrees with the study conducted by Satge [
5] and the point-to-pixel analysis (southeast of the Republic of Djibouti). The highest scores in terms of HSS, with a threshold of > 1 mm, were obtained by GSMaP-RT, MSWEP v.2.2, and CHIRPS. Therefore, the results obtained in the Ambouli catchment are similar to those obtained in the southeast zone.
5. Discussions
In recent years, the use of P datasets has been increasing in areas with a low rainfall network density due to the ease of access to data and the spatial coverage of these products.
In this study, some P datasets provide good performance at all time steps. For the southeast of the Republic of Djibouti, three out of five of the best-performing products (EWEMBI, JRA-55 Adj, and WFDEI-GPCC) are reanalysis products that are merged with gauge-based information. For the Ambouli catchment, the best-performing P datasets are satellite-based products that are merged with gauge-based information (except for GSMaP-RT, which is a pure satellite product). Thus, the best-performing products are those that integrate rain gauge information into their algorithm, which confirms the previous results obtained in Africa [
8,
46,
47] and other regions of the world [
38,
48,
49].
For this study, CHIRPS performs better than CHIRP at all time steps. However, GSMaP-RT outperformed its adjusted version, GSMaP-Adj, at the monthly and daily time steps. This result is consistent with previous observations over the contiguous US (CONUS) [
5,
38] and illustrates the potential limit of P dataset algorithms to consider the best gauge data. GSMaP-RT v.6 is the only P dataset with no gauge-based information that ranks in the top two monthly and daily at the catchment scale. Therefore, GSMaP-Adj v.6 should be highly effective if it uses gauge-based information in the optimal form [
5].
Only MSWEP v.2.2 is reliable at all time steps and for both time periods considered. The strong performance of MSWEP v.2.2 might be due to the integration of daily gauge observations for the calibration of rainfall estimates [
11,
33,
38]. In comparison to the rain gauge of Djibouti-Aerodrome, this product underestimates heavy rainfall and overestimates light rainfall, but still manages to detect the rainy days. CHIRPS is among the best products at the daily time step over the two periods of the study. These results agree with several comparative studies from the East African region [
50]. However, for most of the P datasets, there is a degradation in the performance from the annual to the shorter time steps.
It is advisable to be attentive to the P dataset version. Our results show that MSWEP v.2.2 has a better performance in terms of rainfall data accuracy. This best identified product MSWEP v.2.2 has a newer version, MSWEP v.2.8. One could expect performance to increase with version. However, when analyzing the rainfall distribution, MSWEP v.2.2 shows a better fit to the observed data than MSWEP v.2.8 [
51]. In addition, we find that MSWEP v.2.2 provides more consistent data for semi-arid areas exhibiting low rainfall, in contrast to MSWEP v.2.8 which shows inconsistencies in these areas. MSWEP v.2.2 outperforms the new MSWEP v.2.8 for estimating rainfall data in semi-arid regions. These results highlight the importance of continuous evaluation of rainfall data models to assess their performance and accuracy.
According to Satge [
5] and Omonge [
11], products dedicated to the African continent (TAMSAT and ARC-2) do not always perform well. For the southeast of the Republic of Djibouti, our results confirm this low performance (KGE and HSS) over the years 1980–1990. However, ARC2 is in the top three over the period 2008–2013 at the catchment scale at the annual and monthly time steps and gives satisfactory results at the daily time step (ranked 4/11 in terms of performance). Therefore, as for most P datasets, the use of a new rainfall estimation algorithm may be advantageous, but this may not be the case depending on each model. It would be recommendable to select a set of fairly well-performing models (and not only just the best one) and test the performance of the last two versions of the same models, in order to span the possible optimal point of representativeness of rainfall products. This method should be continued in the future in the region for assessing the progress of models in representing the rainfall variability.
This study focused on long-term P datasets, but also on more recent P datasets (created in the 2000s) at the catchment scale. More recent products perform better than those incorporating historical data into their database (except for MSWEP v.2.2), which is probably due to the fact that the most recent products integrate new innovations (high-definition satellite images, new passive microwave sensors) into their algorithm.
6. Conclusions
Our objective was to determine the best-performing rainfall estimation products in the study area for use in supplementing the limited data available for use in hydrologic modeling. To achieve this objective, we compared the performance of different rainfall estimation products using two types of metrics: quantitative (KGE, RMSE, and MBE) and categorical metrics (POD, FAR, Accuracy, and Error). The quantitative metrics measured the accuracy of rainfall estimation in terms of numerical values. The categorical metrics, on the other hand, were used to evaluate the ability of the rainfall estimation products to correctly detect rainfall events. The use of categorical metrics was particularly important in our study, as it allowed us to better evaluate the ability of the different rainfall estimation products to reproduce the temporal variability of rainfall. We compare P datasets to rain gauge data at two spatial resolutions (southeast of the Republic of Djibouti and the Ambouli catchment) over two temporal windows (1980–1990/2008–2013).
For the southeast of the Republic of Djibouti, at the point-to-pixel scale, five P datasets present high KGE values at the annual and monthly time steps: EWEMBI, GPCC, JRA-55 Adj, MSWEP v.2.2, and WFDEI-GPCC. At the seasonal time step, all the P datasets reproduce the seasonality relatively well but overestimate the precipitation amounts. At the daily time step, the five best products in terms of KGE and HSS are CHIRPS, EWEMBI, JRA-55 Adj, MSWEP V.2.2, and WFDEI-GPCC. The least effective products are the MERRA-2 products (PT and PTC) and the IMERG products (ER, FR, and LR).
At the scale of the Ambouli catchment, the best products, at annual and seasonal time scales and in terms of average annual rainfall over the catchment, are: MSWEP v.2.2, GSMaP-Adj, ARC2, and GSMaP-RT. At the monthly time scale, in terms of KGE value, they are: MSWEP v.2.2, GSMaP-RT, ARC2, and GSMaP-Adj. At the daily time scale, in terms of the metrics used (KGE and HSS), they are: MSWEP v.2.2, GSMaP-RT, and CHIRPS.
Despite a sparse rainfall measurement network and often discontinuous data, some observations emerge from the analyses. As with the study conducted by Babaousimail in 2019 [
15], the results of our study corroborate the observation that the performance of P datasets tends to deteriorate as the time scale decreases from annual to daily. The performance of most of the products also differs from one spatial scale to another.
In our study, we also considered the impact of climate change by examining two distinct measurement periods, 1980–1990 and 2008–2013. These periods, constrained in terms of data availability, also allowed us to capture temporal dynamics and assess changes in precipitation patterns resulting from climate change. The decreasing trend in average annual precipitation observed during both periods may reflect the influence of climate change on the hydroclimatic conditions. Our findings demonstrate the relevance of considering different temporal and spatial windows and illustrates that a given P dataset performs differently according to the spatiotemporal scales.
Strong discrepancies between rain gauge observations and P datasets are illustrated. However, MSWEP v.2.2, GSMaP-RT, and CHIRPS products can be used to indicate an order of magnitude of rainfall in the southeast area of Ambouli, especially if we consider long inter-annual series. MSWEP v.2.2 outperforms the new MSWEP v.2.8 version for estimating rainfall data in semi-arid regions. These results highlight the importance of continuous evaluation of rainfall data models to assess their performance and accuracy.
Nevertheless, even the most effective products are not suitable for flood forecasting using rainfall-runoff models at the daily time step in our study area. This is supported by our analysis of categorical metrics and the concomitant rainfall days. While some products, such as CHIRPS and MSWEP v.2.2, showed better performance in terms of overall rainfall detection and days of concomitant rainfall, they still fell short in accurately predicting extreme rainfall triggering floods.
While the performance of some of the P datasets is acceptable at the monthly and annual time steps, the poor performance at the daily time step is a major limitation for our study. In the specific context of our study and within our study area, this finding highlights the need for developing more accurate and reliable P datasets that can capture the spatiotemporal variability of daily rainfall in the region and especially the highest events. In addition, further research is needed to investigate the factors that influence the performance of P datasets in the region, such as the impact of topography, land cover, and land use.
Overall, our study provides important insights into the limitations of P datasets for flood forecasting in the Ambouli catchment and underscores the need for continued efforts to improve the accuracy of rainfall data for hydrological applications. In conclusion, while P datasets are useful tools for studying precipitation patterns and trends, they should be used with caution for flood forecasting in semi-arid regions. First and foremost, the data specific to the study region (such as rainfall, river flow, topography, land use …) and then more sophisticated modeling approaches (advanced hydrological models, data assimilation techniques, remote sensing data, machine learning algorithms, ensemble modeling approaches…) are helpful for accurate and reliable flood prediction in these vulnerable regions.

 ,
, 


