
Physicochemical Investigation of Rainfall for Managed Aquifer Recharge in Punjab (Pakistan)

 ,
, 
 ,
,  ,
,  and
and
Abstract
:1. Introduction
2. Materials and Methods
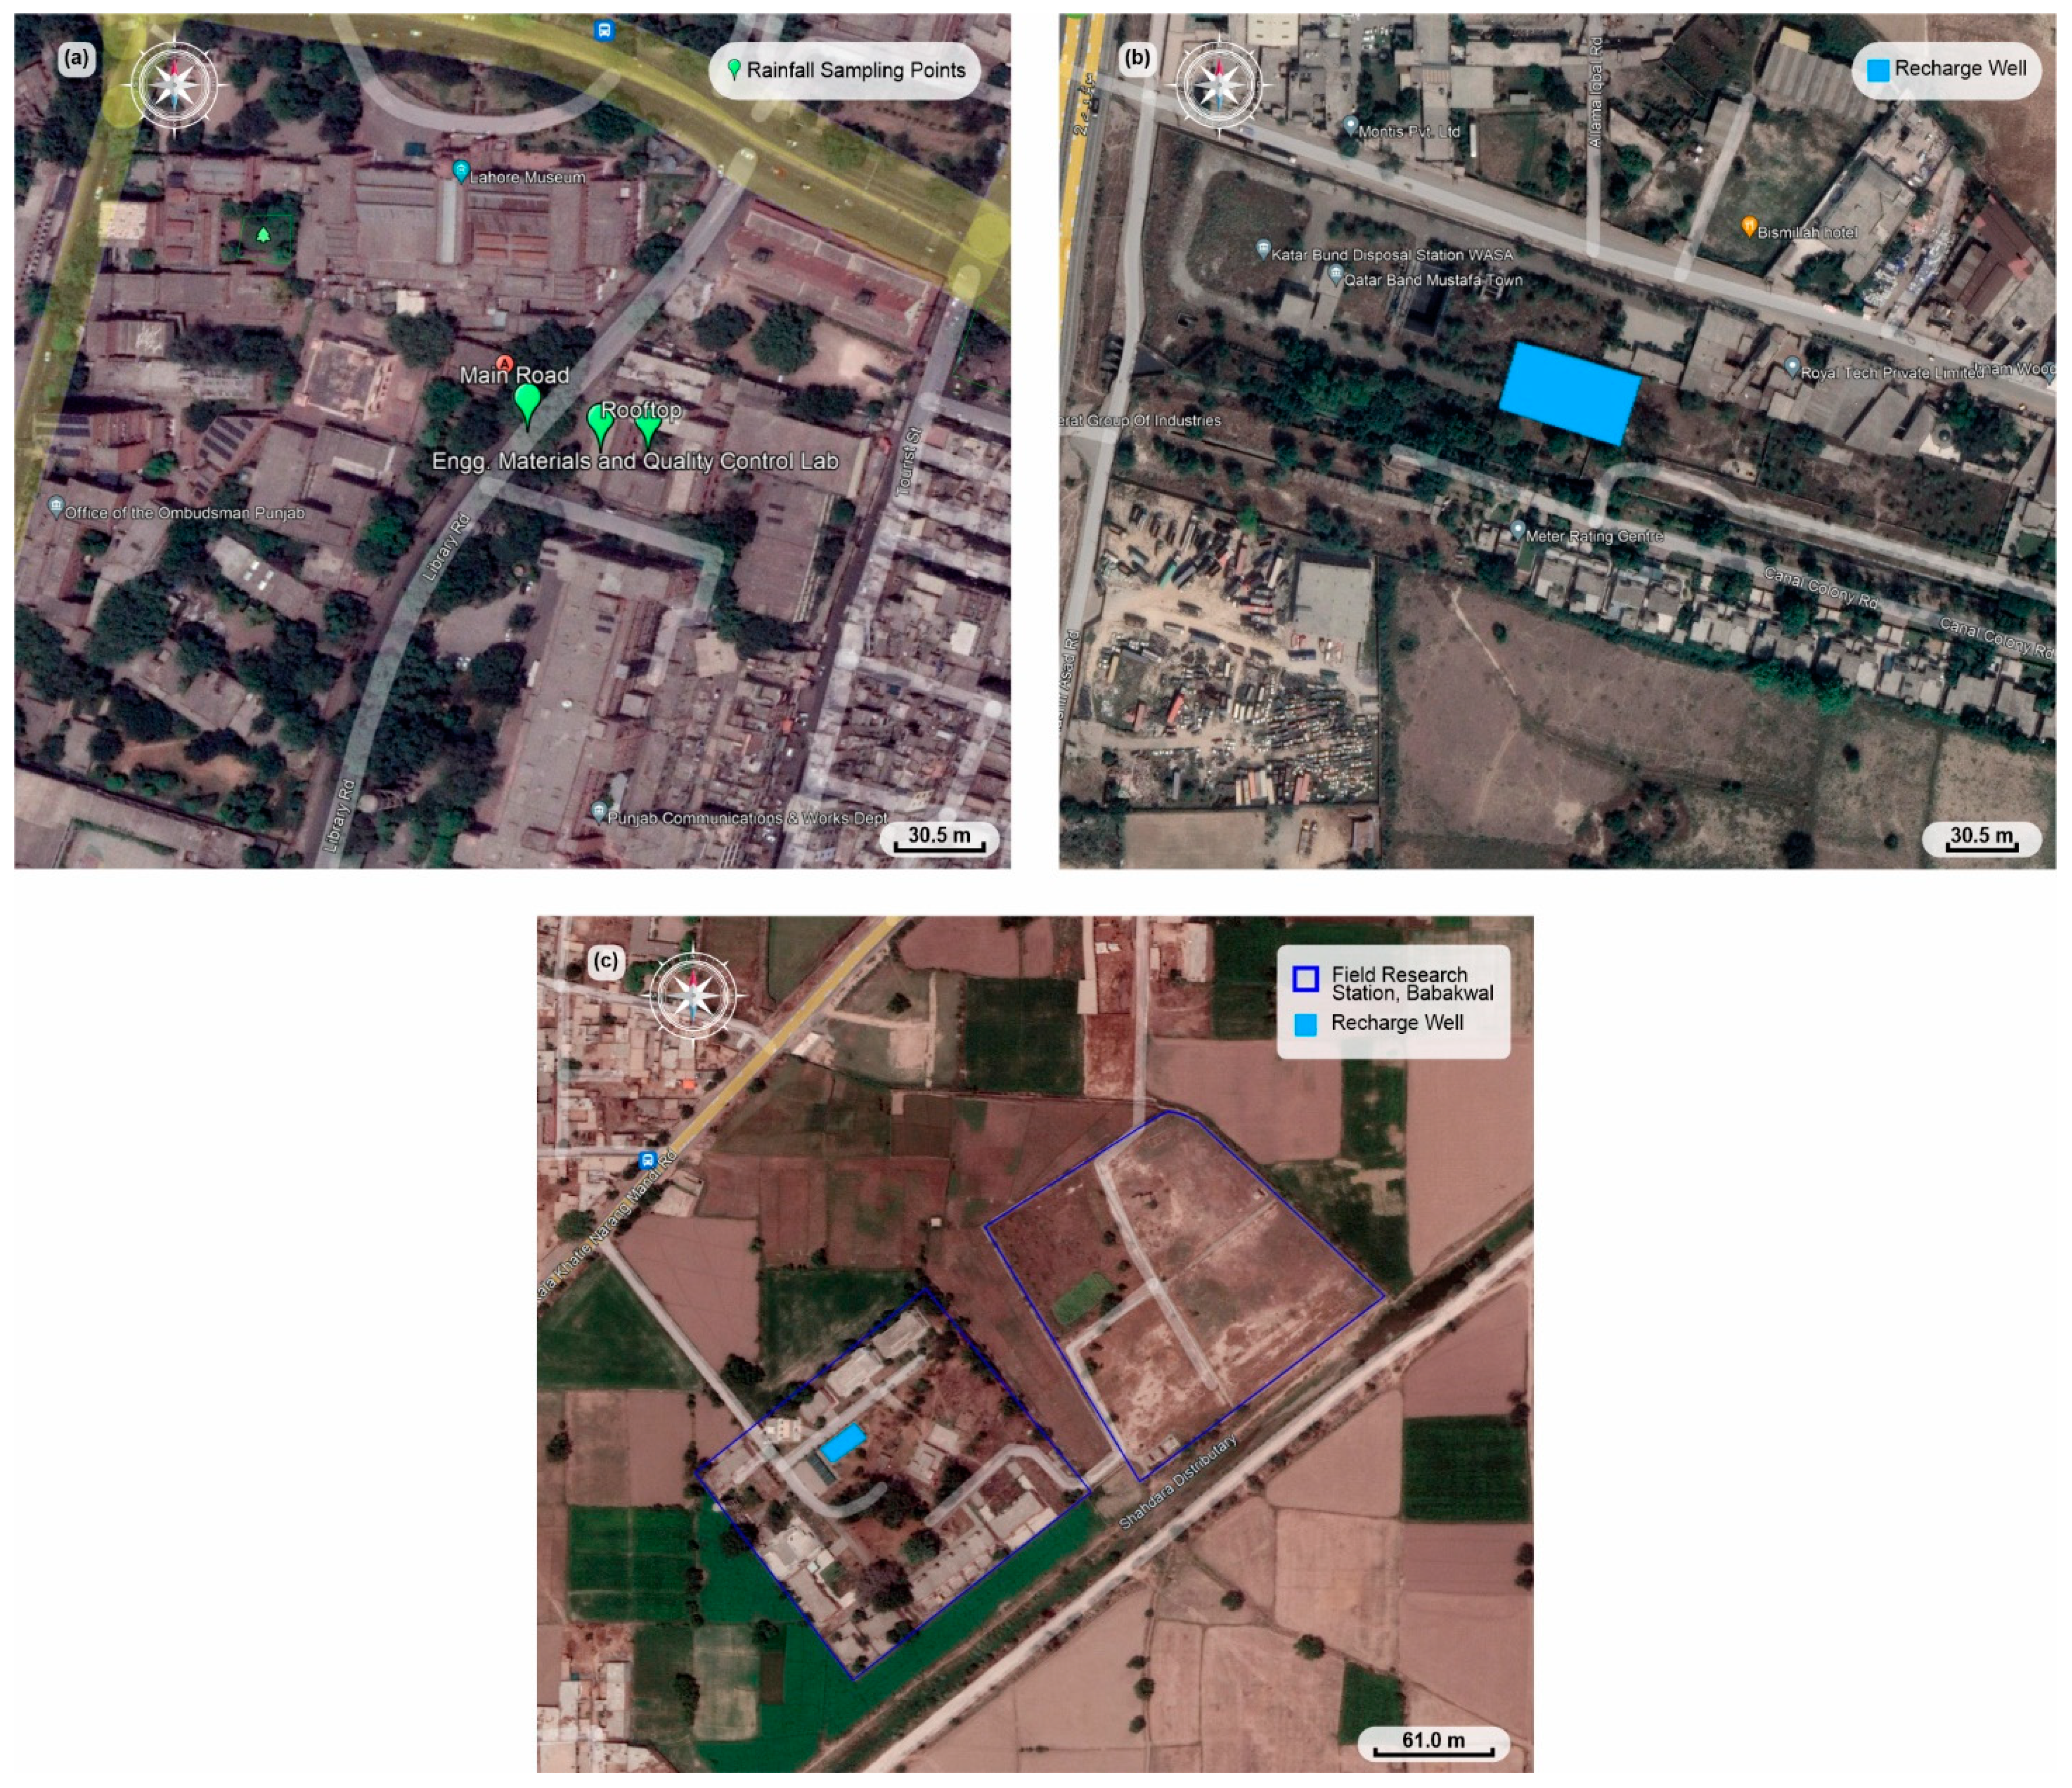
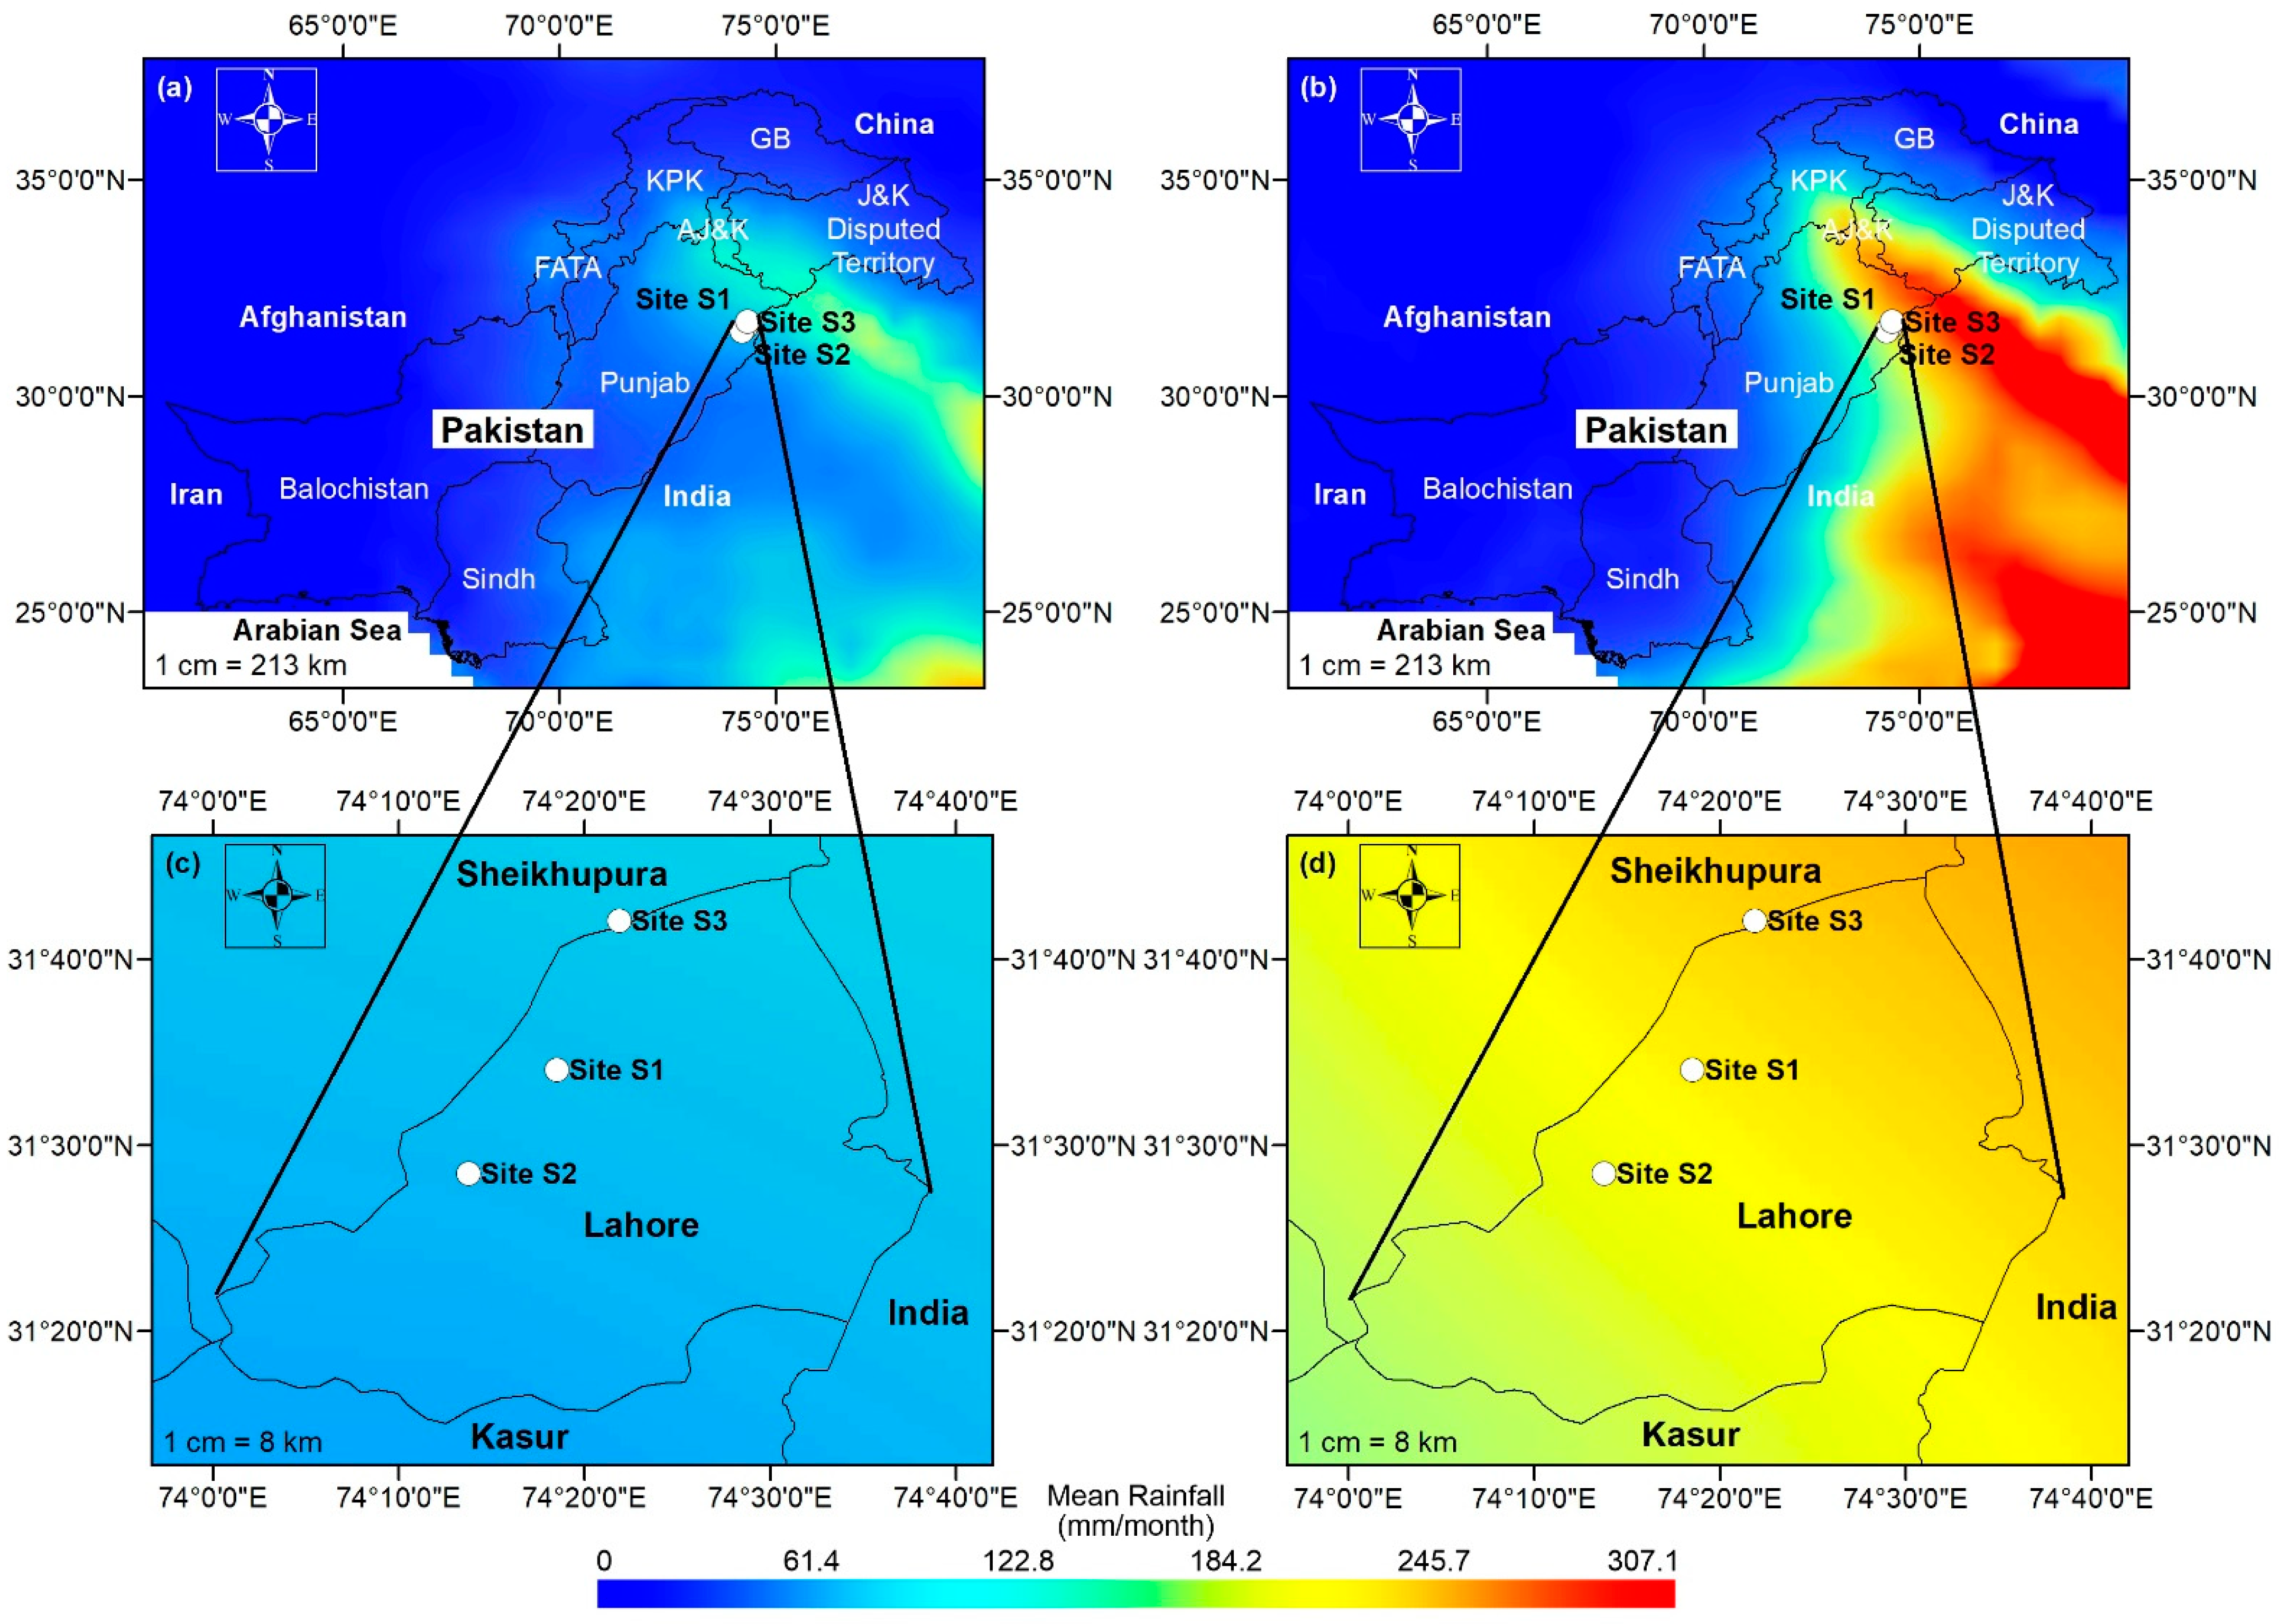
2.1. Study Area
2.2. Sample Collection
2.3. Laboratory Analysis
3. Results
3.1. Site 1—IRI Department, Lahore
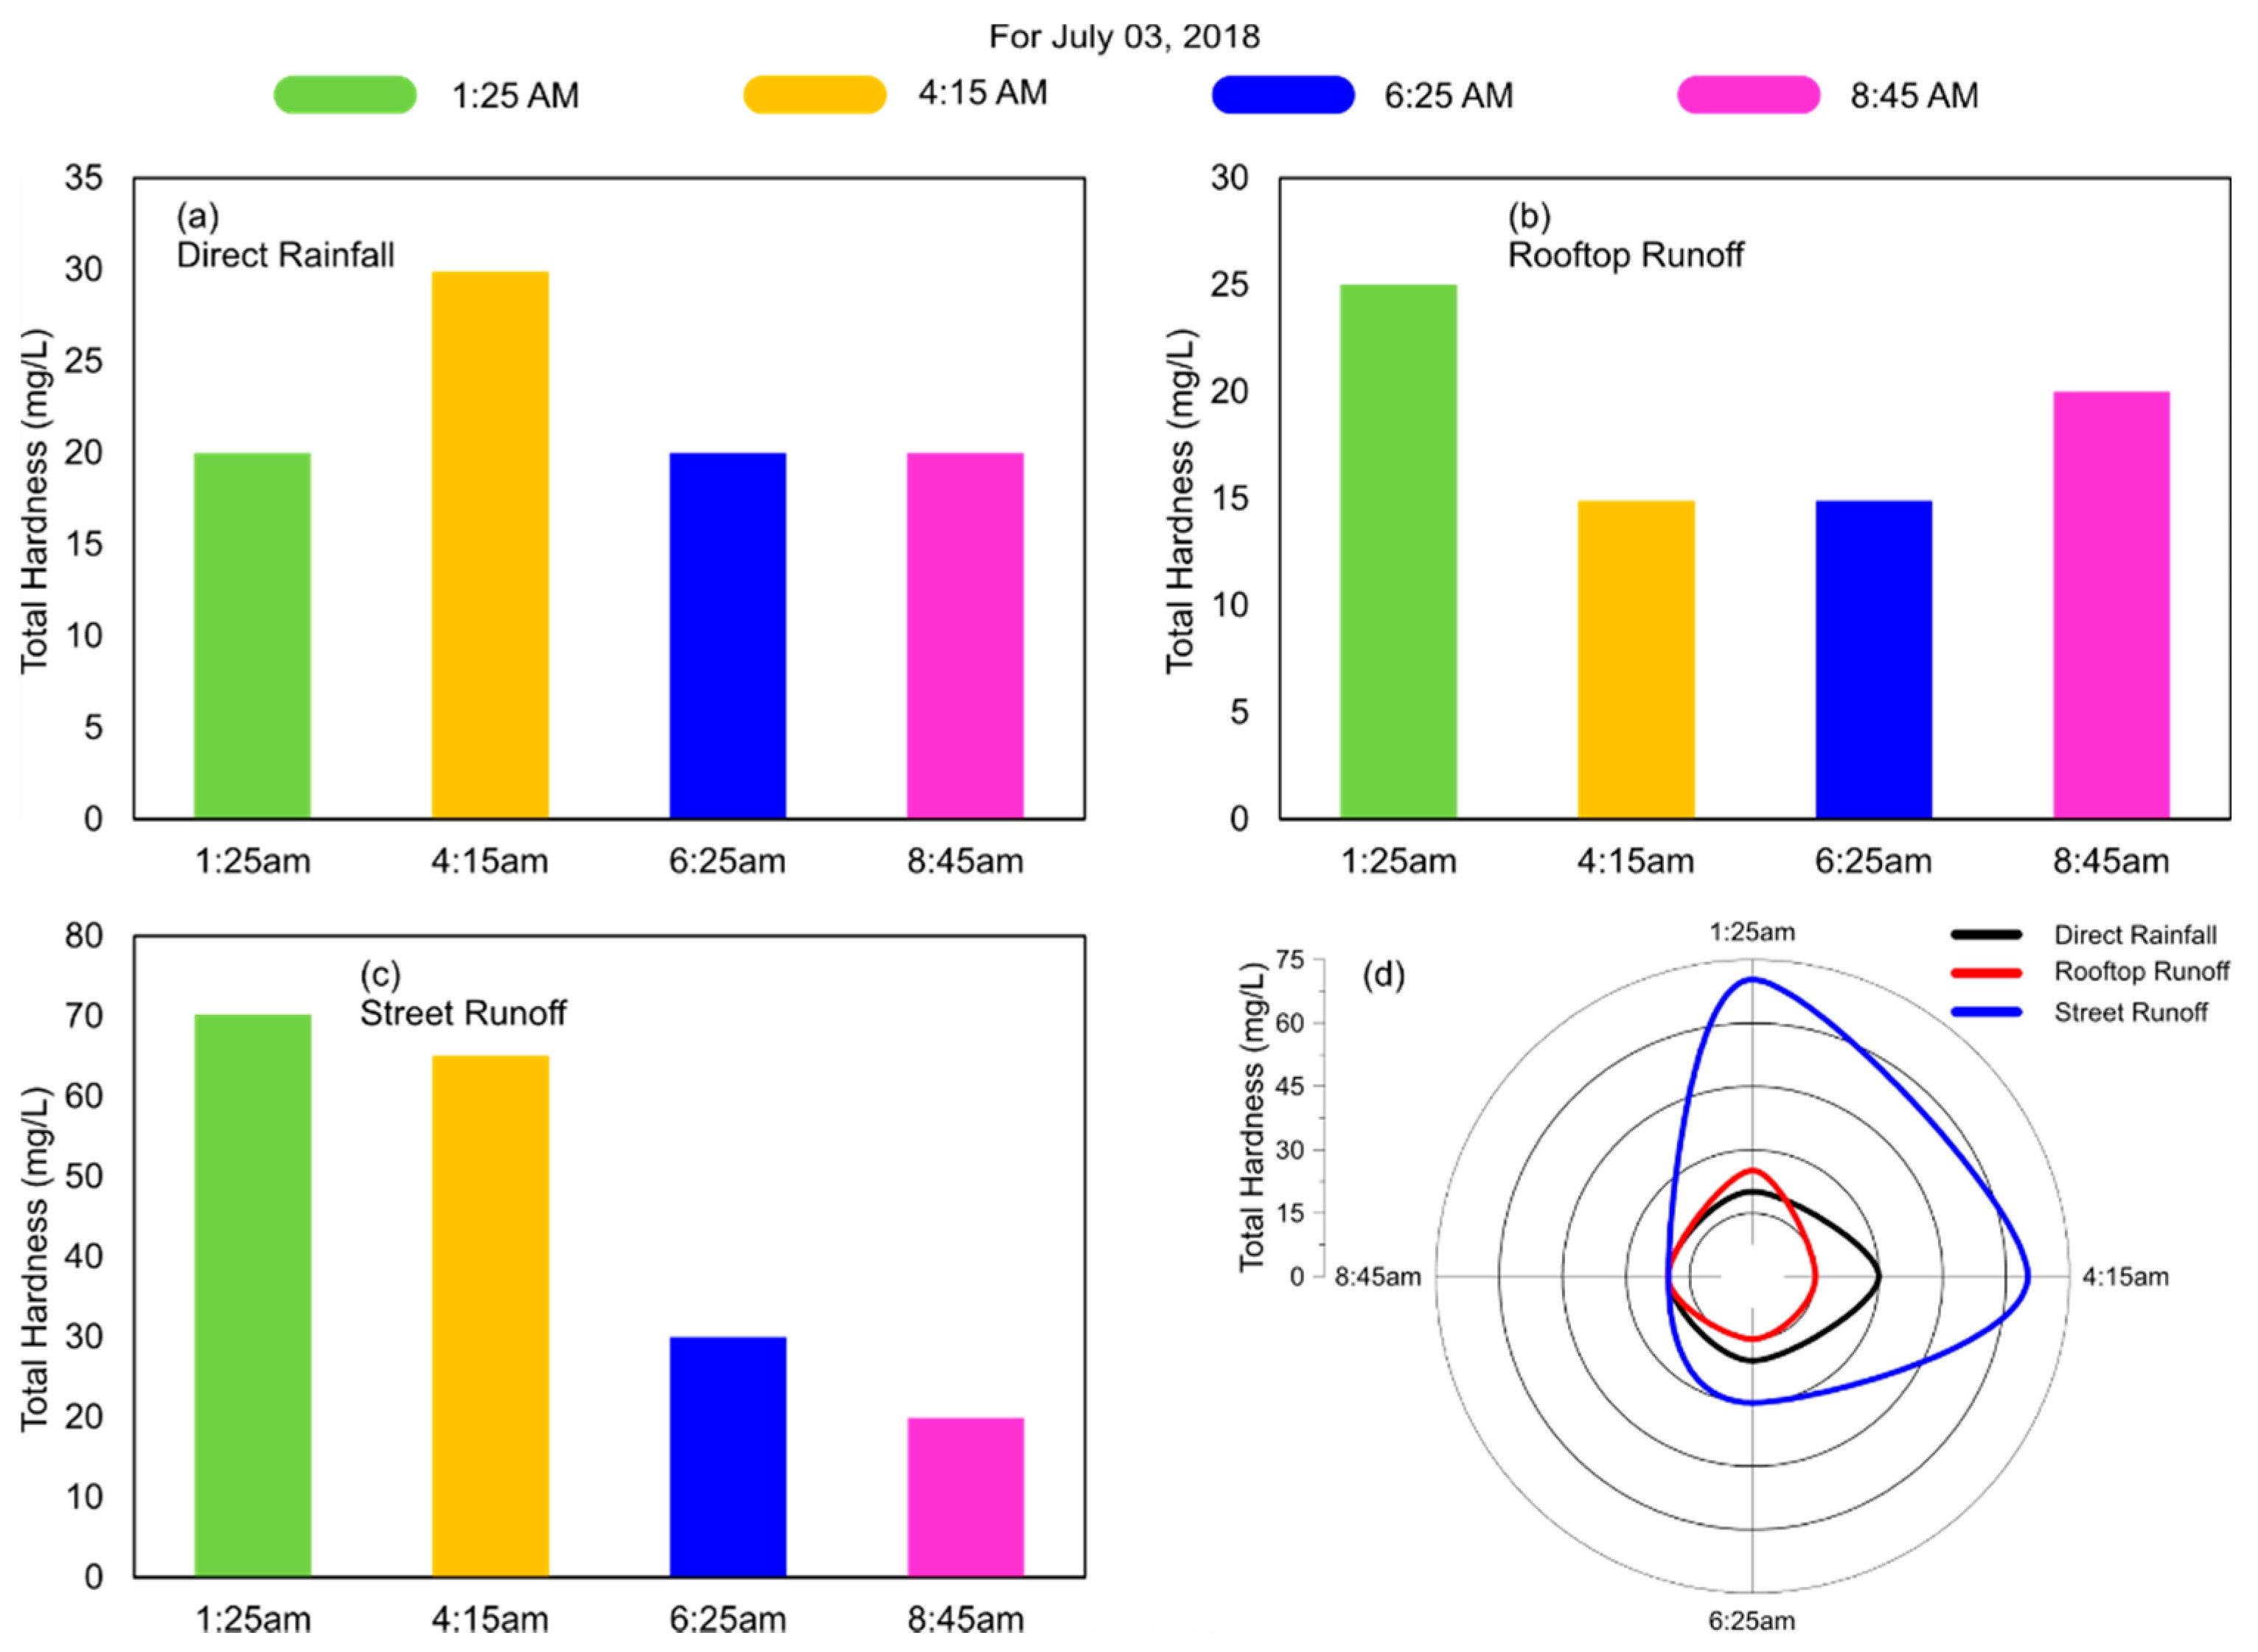
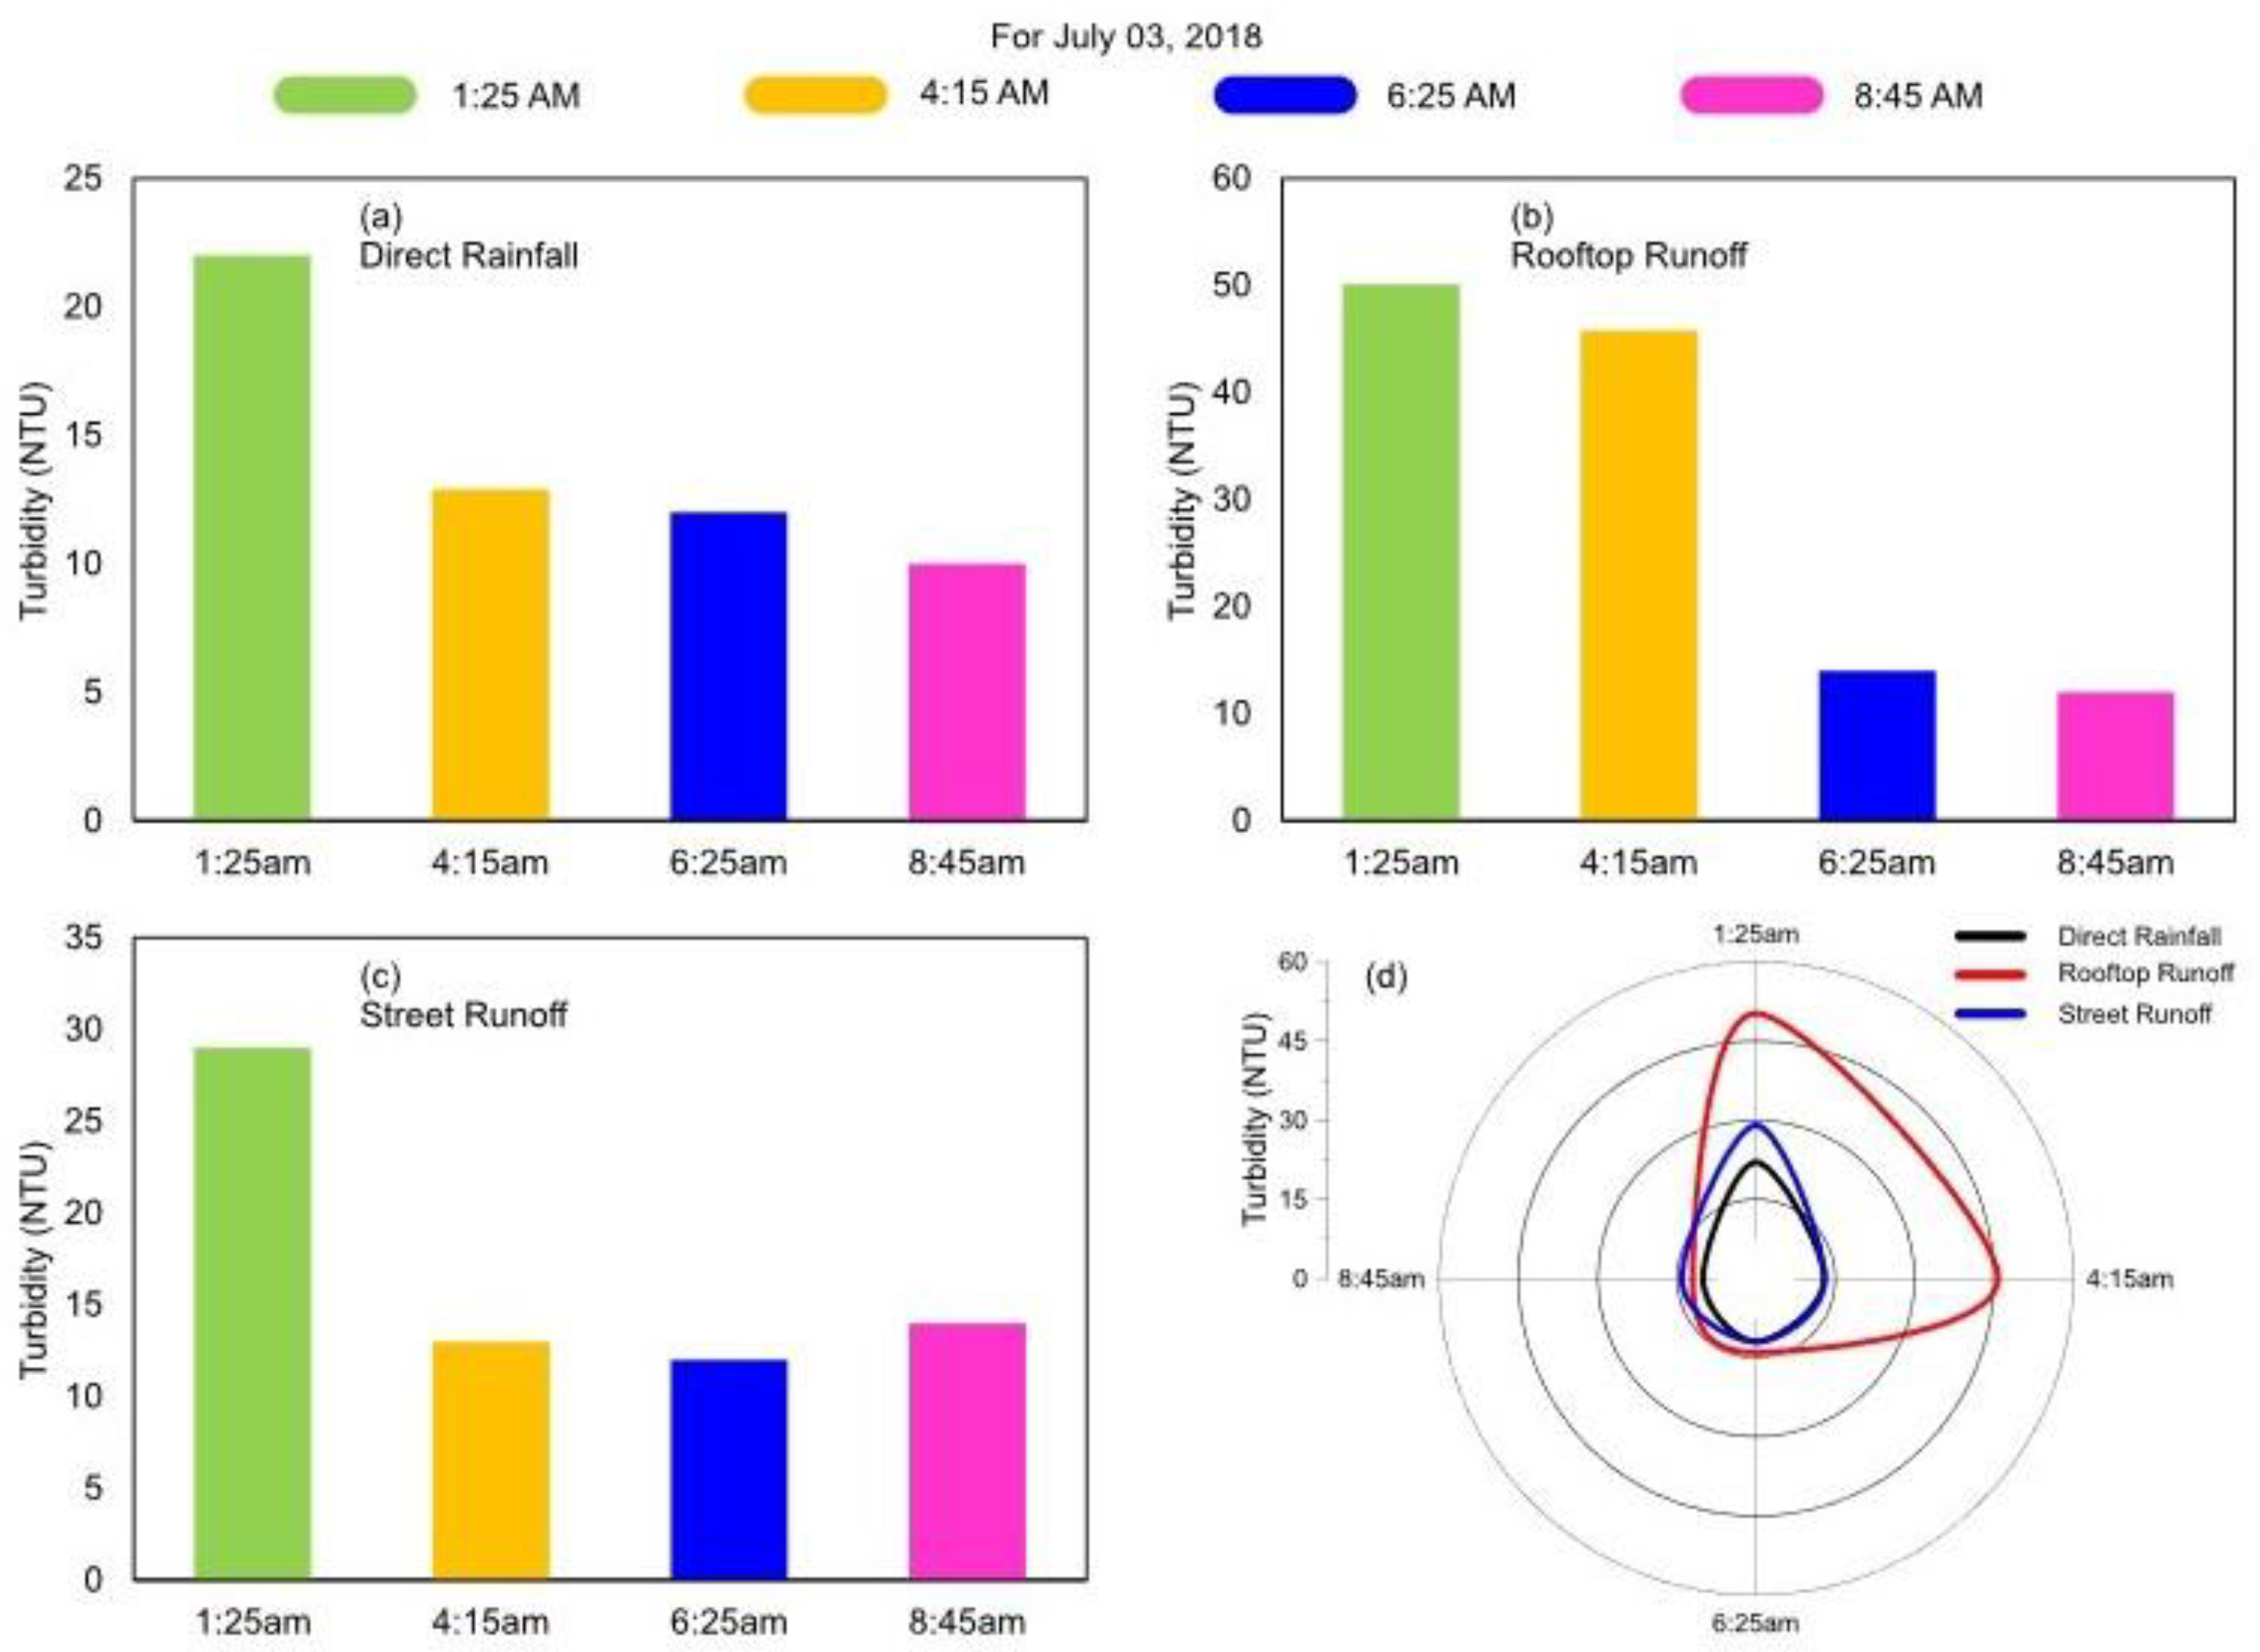
3.2. Site 2—Experimental Research Station (ERS), Lahore
3.3. Site 3—Field Research Station (FRS), Babakwal
4. Discussion
5. Conclusions
Author Contributions
Funding
Institutional Review Board Statement
Informed Consent Statement
Data Availability Statement
Acknowledgments
Conflicts of Interest
Appendix A

| Sr. No | Name of Station/Site | Sampling Duration | Type of Samples Collected | No. of Samples Collected |
|---|---|---|---|---|
| 1 | Irrigation Research Institute, Lahore (Site 1) | 29–06–18 to 19–07–18 | Direct Rainfall (DR) | 17 |
| Roof Run off (RR) | 13 | |||
| Street Run off (SR) | 13 | |||
| 2 | Field Research Station, Babakwal (Site 2) | 29–06–18 to 21–07–18 | Direct Rainfall (DR) | 17 |
| Roof Run off (RR) | 17 | |||
| Street Run off (SR) | 17 | |||
| Groundwater Recharge Model (GR) | 16 | |||
| 3 | Experimental Research Station, Niazbeg (Site 3) | 03–07–18 to 19–07–18 | Direct Rainfall (DR) | 9 |
| Roof Run off (RR) | 11 | |||
| Street Run off (SR) | 10 | |||
| Total | 140 | |||
| Parameter | Units | Permissible Limits | ||||
|---|---|---|---|---|---|---|
| WHO | IBWA | PSQCA | USEPA | ISI | ||
| pH | - | 6.5–8.5 | - | 6.5–8.5 | 6.5–8.5 | 6.5–8.5 |
| TDS | (mg/L) | 1000 | 500 | 500 | - | - |
| Turbidity | (NTU) | 5 | - | 0.5 | - | 10 |
| Bicarbonate | (mg/L) | - | - | - | - | - |
| Carbonate | (mg/L) | - | - | - | - | - |
| Chloride | (meq/L) | 7.042 | 7.042 | 7.042 | 7.042 | 5.633 |
| Conductivity | (µS/cm) | - | - | - | - | - |
| Hardness | (mg/L) | - | - | - | - | 300 |
| Date | Rain Fall Event | Samples Collected | Sampling Time | PH | EC (µs/cm) | TDS (ppm) | Turbidity (NTU) | CO3− (me/L) | HCO3− (me/L) | Cl− (me/L) | Ca+2 + Mg+2 (me/L) | Total Hardness (mg/L) | |
|---|---|---|---|---|---|---|---|---|---|---|---|---|---|
| Start Time | End Time | ||||||||||||
| 29.06.18 | 1:00 p.m. | 1:30 p.m. | 1 | 1:00 p.m. | 6.5 | 77.0 | 38.0 | 19.0 | 2.6 | Nil | 0.4 | 0.5 | 25.0 |
| 2 | 1:15 p.m. | 6.6 | 45.0 | 22.0 | 17.6 | 3.4 | Nil | 0.2 | 0.3 | 15.0 | |||
| 3:25 p.m. | 3:50 p.m. | 1 | 3:35 p.m. | 6.5 | 62.0 | 31.0 | 13.1 | Nil | 0.2 | 0.1 | 0.3 | 15.0 | |
| 03.07.18 | 8:00 a.m. | 8:40 a.m. | 1 | 8:10 a.m. | 6.5 | 180 | 90.0 | 18.7 | Nil | 0.8 | 0.7 | 1.3 | 65.0 |
| 2 | 8:20 a.m. | 6.5 | 80.0 | 40.0 | 16.2 | Nil | 0.3 | 0.4 | 0.3 | 15.0 | |||
| 3 | 8:30 a.m. | 6.5 | 80.0 | 40.0 | 11.2 | Nil | 0.3 | 0.5 | 0.2 | 10.0 | |||
| 11:05 a.m. | 11:45 a.m. | 1 | 11:15 a.m. | 6.5 | 70.0 | 35.0 | 11.8 | Nil | 0.2 | 0.3 | 0.3 | 15.0 | |
| 2 | 11:25 a.m. | 6.5 | 68.0 | 34.0 | 12.5 | Nil | 0.3 | 0.3 | 0.3 | 15.0 | |||
| 3 | 11:35 a.m. | 6.6 | 62.0 | 37.0 | 10.2 | Nil | 0.2 | 0.2 | 0.2 | 10.0 | |||
| 12.07.18 | 1:00 p.m. | 1:40 p.m. | 1 | 1:17 p.m. | 6.5 | 134 | 67.0 | 11.8 | Nil | 0.8 | 0.4 | 1.2 | 60.0 |
| 2 | 1:30 p.m. | 6.5 | 102 | 51.0 | 11.7 | Nil | 0.5 | 0.3 | 0.7 | 35.0 | |||
| 13.07.18 | 9:50 a.m. | 10:15 a.m. | 1 | 9:50 a.m. | 6.5 | 99.0 | 49.0 | 8.7 | Nil | 0.5 | 0.3 | 0.4 | 20.0 |
| 16.07.18 | 11:40 a.m. | 12:00 p.m. | 1 | 11:45 a.m. | 6.6 | 120 | 60.0 | 11.8 | Nil | 0.5 | 0.4 | 1.0 | 50.0 |
| 2 | 11:55 a.m. | 6.5 | 79.0 | 39.0 | 11.7 | Nil | 0.2 | 0.3 | 0.5 | 25.0 | |||
| 19.07.18 | 12:10 p.m. | 12:50 p.m. | 1 | 12:15 p.m. | 6.3 | 143 | 71.0 | 14.7 | Nil | 0.2 | 0.4 | 0.7 | 35.0 |
| 2 | 12:30 p.m. | 6.2 | 85.0 | 42.0 | 12.0 | Nil | 0.2 | 0.2 | 0.3 | 15.0 | |||
| 3 | 12:45 p.m. | 6.2 | 60.0 | 30.0 | 10.3 | Nil | 0.1 | 0.3 | 0.3 | 15.0 | |||
| Date | Rain Fall Event | Samples Collected | Sampling Time | PH | EC (µs/cm) | TDS (ppm) | Turbidity (NTU) | CO3− (me/L) | HCO3− (me/L) | Cl− (me/L) | Ca+2 + Mg+2 (me/L) | Total Hardness (mg/L) | |
|---|---|---|---|---|---|---|---|---|---|---|---|---|---|
| Start Time | End Time | ||||||||||||
| 29.06.18 | 1:00 p.m. | 1:30 p.m. | 1 | 1:00 p.m. | 6.6 | 79.0 | 40.0 | 22.0 | Nil | 0.3 | 0.2 | 0.4 | 20.0 |
| 2 | 1:15 p.m. | 6.5 | 63.0 | 31.0 | 21.0 | Nil | 0.3 | 0.2 | 0.4 | 20.0 | |||
| 29.06.18 | 3:25 p.m. | 3:50 p.m. | 1 | 3:30 p.m. | 6.5 | 131 | 65.0 | 18.1 | Nil | 0.3 | 0.4 | 1.0 | 50.0 |
| 2 | 3:45 p.m. | 6.5 | 85.0 | 42.0 | 12.1 | Nil | 0.2 | 0.1 | 0.3 | 15.0 | |||
| 3.07.18 | 11:25 a.m. | 11:40 a.m. | 1 | 11:30 a.m. | 6.4 | 95.0 | 47.0 | 16.1 | Nil | 0.3 | 0.4 | 1.0 | 50.0 |
| 12.07.18 | 1:00 p.m. | 1:40 p.m. | 1 | 1:19 p.m. | 6.5 | 177 | 88.0 | 15.2 | Nil | 0.5 | 0.5 | 1.4 | 70.0 |
| 2 | 1:30 p.m. | 6.5 | 121 | 60.0 | 12.8 | Nil | 0.5 | 0.4 | 0.6 | 30.0 | |||
| 13.07.18 | 9:50 a.m. | 10:15 a.m. | 1 | 9:50 a.m. | 6.6 | 106 | 53.0 | 12.0 | Nil | 0.4 | 0.3 | 0.7 | 35.0 |
| 16.07.18 | 11:35 a.m. | 12:00 p.m. | 1 | 11:40 a.m. | 6.6 | 156 | 78.0 | 13.1 | Nil | 0.5 | 0.4 | 1.0 | 50.0 |
| 2 | 11:50 a.m. | 6.6 | 79.0 | 39.0 | 17.0 | Nil | 0.3 | 0.3 | 0.4 | 20.0 | |||
| 19.07.18 | 12:10 p.m. | 12:50 p.m. | 1 | 12:15 p.m. | 6.2 | 150 | 75.0 | 14.9 | Nil | 0.2 | 0.4 | 0.6 | 30.0 |
| 2 | 12:30 p.m. | 6.2 | 103 | 51.0 | 12.5 | Nil | 0.2 | 0.2 | 0.5 | 25.0 | |||
| 3 | 12:45 p.m. | 6.2 | 66.0 | 33.0 | 11.2 | Nil | 0.1 | 0.2 | 0.4 | 20.0 | |||
| Date | Rain Fall Event | Samples Collected | Sampling Time | PH | EC (µs/cm) | TDS (ppm) | Turbidity (NTU) | CO3− (me/L) | HCO3− (me/L) | Cl− (me/L) | Ca+2 + Mg+2 (me/L) | Total Hardness (mg/L) | |
|---|---|---|---|---|---|---|---|---|---|---|---|---|---|
| Start Time | End Time | ||||||||||||
| 29.06.18 | 1:00 p.m. | 1:30 p.m. | 1 | 1:00 p.m. | 6.5 | 144 | 72.0 | 13.9 | Nil | 0.6 | 0.4 | 0.7 | 35.0 |
| 2 | 1:15 p.m. | 6.5 | 132 | 66.0 | 30.0 | Nil | 0.4 | 0.2 | 0.6 | 30.0 | |||
| 29.06.18 | 3:25 p.m. | 3:50 p.m. | 1 | 3:08 p.m. | 6.4 | 285 | 142 | 17.9 | Nil | 0.3 | 0.3 | 0.7 | 35.0 |
| 2 | 3:35 p.m. | 6.4 | 226 | 113 | 64.7 | Nil | 0.4 | 0.3 | 0.9 | 45.0 | |||
| 3.07.18 | 11:25 a.m. | 11:40 a.m. | 1 | 11:30 a.m. | 6.4 | 118 | 59.0 | 18.2 | Nil | 0.4 | 0.4 | 1.0 | 50.0 |
| 12.07.18 | 1:10 p.m. | 1:35 p.m. | 1 | 1:15 p.m. | 6.7 | 235 | 117 | 12.6 | Nil | 0.6 | 0.7 | 1.4 | 70.0 |
| 2 | 1:30 p.m. | 6.7 | 127 | 63.0 | 12.5 | Nil | 0.5 | 0.5 | 0.8 | 40.0 | |||
| 13.07.18 | 10:30 a.m. | 10:50 a.m. | 1 | 10:45 a.m. | 6.5 | 130 | 65.0 | 12.5 | Nil | 0.5 | 0.3 | 0.9 | 45.0 |
| 16.07.18 | 11:35 a.m. | 11:55 a.m. | 1 | 11:40 a.m. | 6.6 | 128 | 64.0 | 17.7 | Nil | 0.5 | 0.3 | 1.8 | 90.0 |
| 2 | 11:50 a.m. | 6.5 | 84.0 | 42.0 | 11.7 | Nil | 0.3 | 0.2 | 0.5 | 25.0 | |||
| 19.07.18 | 12:10 p.m. | 12:50 p.m. | 1 | 12:15 p.m. | 6.3 | 180 | 90.0 | 15.0 | Nil | 0.4 | 0.3 | 0.8 | 40.0 |
| 2 | 12:30 p.m. | 6.2 | 100 | 50.0 | 13.1 | Nil | 0.3 | 0.3 | 0.7 | 35.0 | |||
| 3 | 12:45 p.m. | 6.2 | 92.0 | 46.0 | 12.0 | Nil | 0.2 | 0.4 | 0.4 | 20.0 | |||
| Date | Rain Fall Event | Samples Collected | Sampling Time | PH | EC (µs/cm) | TDS (ppm) | Turbidity (NTU) | CO3− (me/L) | HCO3− (me/L) | Cl− (me/L) | Ca+2 + Mg+2 (me/L) | Total Hardness (mg/L) | |
|---|---|---|---|---|---|---|---|---|---|---|---|---|---|
| Start Time | End Time | ||||||||||||
| 03.07.18 | 10:15 a.m. | 10:35 a.m. | 1 | 10:30am | 6.5 | 52.0 | 26.0 | 19.3 | Nil | 0.1 | 0.2 | 0.4 | 20.0 |
| 12:10 p.m. | 12:35 p.m. | 2 | 12:30pm | 6.5 | 50.0 | 25.0 | 17.0 | Nil | 0.1 | 0.3 | 0.2 | 10.0 | |
| 2:15 p.m. | 2:35 p.m. | 3 | 2:30pm | 6.5 | 45.0 | 230 | 11.0 | Nil | 0.1 | 0.2 | 0.4 | 20.0 | |
| 4:15 p.m. | 4:40 p.m. | 4 | 4:30pm | 6.5 | 42.0 | 210 | 10.3 | Nil | 0.2 | 0.1 | 0.3 | 15.0 | |
| 4.07.18 | 1:25 a.m. | 1:40 a.m. | 1 | 1:30 a.m. | 6.4 | 45.0 | 22.0 | 14.3 | Nil | 0.2 | 0.2 | 0.3 | 15.0 |
| 10.07.18 | 11:45 a.m. | 12:45 p.m. | 1 | 11:50 a.m. | 6.5 | 80.0 | 40.0 | 16.7 | Nil | 0.2 | 0.3 | 0.7 | 35.0 |
| 12.07.18 | 12:15 p.m. | 12:30pm | 1 | 12:30 p.m. | 6.6 | 60.0 | 30.0 | 15.9 | Nil | 0.2 | 0.2 | 0.5 | 25.0 |
| 19.07.18 | 12:05 p.m. | 12:40 p.m. | 1 | 12:15 p.m. | 6.6 | 50.0 | 25.0 | 12.5 | Nil | 0.1 | 0.2 | 0.3 | 15.0 |
| 2 | 12:30 p.m. | 6.5 | 40.0 | 20.0 | 10.7 | Nil | 0.1 | 0.2 | 0.3 | 15.0 | |||
| Date | Rain Fall Event | Samples Collected | Sampling Time | PH | EC (µs/cm) | TDS (ppm) | Turbidity (NTU) | CO3− (me/L) | HCO3− (me/L) | Cl− (me/L) | Ca+2 +Mg+2 (me/L) | Total Hardness (mg/L) | |
|---|---|---|---|---|---|---|---|---|---|---|---|---|---|
| Start Time | End Time | ||||||||||||
| 03.07.18 | 5:45 a.m. | 6:00 a.m. | 1 | 5:50 a.m. | 6.5 | 91.0 | 45.0 | 40.0 | Nil | 0.4 | 0.2 | 0.5 | 25.0 |
| 8:25 a.m. | 8:35 a.m. | 2 | 8:30 a.m. | 6.4 | 80.0 | 40.0 | 33.0 | Nil | 0.5 | 0.3 | 0.5 | 25.0 | |
| 10:15 a.m. | 10:35 a.m. | 3 | 10:30 a.m. | 6.5 | 79.0 | 39.0 | 22.1 | Nil | 0.3 | 0.2 | 0.4 | 20.0 | |
| 11:15 a.m. | 11:35 a.m. | 4 | 11:30 a.m. | 6.5 | 68.0 | 34.0 | 20.0 | Nil | 0.4 | 0.2 | 0.5 | 25.0 | |
| 12:10 p.m. | 12:35 p.m. | 5 | 12:30 p.m. | 6.5 | 62.0 | 31.0 | 20.0 | Nil | 0.2 | 0.1 | 0.4 | 20.0 | |
| 1:50 p.m. | 2:05 p.m. | 6 | 2:00 p.m. | 6.5 | 60.0 | 30.0 | 22.0 | Nil | 0.2 | 0.3 | 0.4 | 20.0 | |
| 04.07.18 | 1:00 a.m. | 1:20 a.m. | 1 | 1:15 a.m. | 6.6 | 98.0 | 49.0 | 18.1 | Nil | 0.2 | 0.1 | 0.5 | 25.0 |
| 10.07.18 | 11:45 a.m. | 11:55 a.m. | 1 | 11:50 a.m. | 6.6 | 95.0 | 47.5 | 11.3 | Nil | 0.3 | 0.6 | 0.7 | 35.0 |
| 12.07.18 | 12:20 p.m. | 12:40 p.m. | 1 | 12:30 p.m. | 6.6 | 98.0 | 49.0 | 10.6 | Nil | 0.4 | 0.3 | 0.6 | 30.0 |
| 19.07.18 | 12:05 p.m. | 12:40 p.m. | 1 | 12:15 p.m. | 6.5 | 96.0 | 48.0 | 16.5 | Nil | 0.2 | 02 | 0.4 | 20.0 |
| 2 | 12:30 p.m. | 6.5 | 68.0 | 34.0 | 15.7 | Nil | 0.1 | 0.2 | 0.4 | 20.0 | |||
| Date | Rain Fall Event | Samples Collected | Sampling Time | PH | EC (µs/cm) | TDS (ppm) | Turbidity (NTU) | CO3− (me/L) | HCO3− (me/L) | Cl− (me/L) | Ca+2 + Mg+2 (me/L) | Total Hardness (mg/L) | |
|---|---|---|---|---|---|---|---|---|---|---|---|---|---|
| Start Time | End Time | ||||||||||||
| 03.07.18 | 5:45 a.m. | 6:05 a.m. | 1 | 5:50 a.m. | 6.5 | 200 | 100 | 19.9 | Nil | 0.7 | 0.5 | 0.9 | 45.0 |
| 7:35 a.m. | 7:50 a.m. | 2 | 7:40 a.m. | 6.5 | 150 | 75.0 | 15.0 | Nil | 0.5 | 0.6 | 0.9 | 45.0 | |
| 10:15 a.m. | 10:35 a.m. | 3 | 10:30 a.m. | 6.5 | 86.0 | 43.0 | 15.0 | Nil | 0.2 | 0.2 | 0.4 | 20.0 | |
| 11:15 a.m. | 11:35 a.m. | 4 | 11:30 a.m. | 6.5 | 84.0 | 42.0 | 13.0 | Nil | 0.2 | 02 | 0.5 | 25.0 | |
| 12:10 p.m. | 12:35 p.m. | 5 | 12:30 a.m. | 6.5 | 72.0 | 36.0 | 11.9 | Nil | 0.2 | 0.1 | 0.5 | 25.0 | |
| 04.07.18 | 1:00 a.m. | 1:25 a.m. | 1 | 1:20 a.m. | 6.4 | 140 | 70.0 | 22.0 | Nil | 0.5 | 0.4 | 0.7 | 35.0 |
| 10.07.18 | 11:45 a.m. | 11:55 a.m. | 1 | 11:50 a.m. | 6.6 | 120 | 60.0 | 14.6 | Nil | 0.5 | 0.5 | 0.6 | 30.0 |
| 12.07.18 | 12:20 p.m. | 12:40 p.m. | 1 | 12:30 p.m. | 6.6 | 214 | 107 | 16.6 | Nil | 0.4 | 1.2 | 1.3 | 65.0 |
| 19.07.18 | 12:05 p.m. | 12:40 p.m. | 1 | 12:15 p.m. | 6.6 | 122 | 61.0 | 19.2 | Nil | 0.3 | 0.3 | 0.6 | 30.0 |
| 2 | 12:30 p.m. | 6.5 | 114 | 57.0 | 17.7 | Nil | 0.2 | 0.4 | 0.5 | 25.0 | |||
| Date | Rain Fall Event | Samples Collected | Sampling Time | PH | EC (µs/cm) | TDS (ppm) | Turbidity (NTU) | CO3− (me/L) | HCO3− (me/L) | Cl− (me/L) | Ca+2 + Mg+2 (me/L) | Total Hardness (mg/L) | |
|---|---|---|---|---|---|---|---|---|---|---|---|---|---|
| Start Time | End Time | ||||||||||||
| 29.06.18 | 5:25 a.m. | 6:30 a.m. | 1 | 5:30 a.m. | 6.5 | 140 | 70.0 | 18.5 | Nil | 0.7 | 0.6 | 1.2 | 60.0 |
| 2 | 6:20 a.m. | 6.5 | 65.0 | 33.0 | 10.5 | Nil | 0.2 | 0.2 | 0.4 | 20.0 | |||
| 1:15 p.m. | 2:05 p.m. | 3 | 1:20 p.m. | 6.6 | 50.0 | 25.0 | 10.8 | Nil | 0.3 | 0.2 | 0.4 | 20.0 | |
| 4 | 2:00 p.m. | 6.5 | 35.0 | 17.0 | 12.8 | Nil | 0.1 | 0.1 | 0.4 | 20.0 | |||
| 30.06.18 | 5:30 a.m. | 6:25 a.m. | 1 | 5:45 a.m. | 6.4 | 50.0 | 25.0 | 15.4 | Nil | 0.1 | 0.1 | 0.2 | 10.0 |
| 2 | 6:20 a.m. | 6.4 | 32.0 | 16.0 | 10.7 | Nil | 0.1 | 0.1 | 0.3 | 15.0 | |||
| 3.07.18 | 1:00 a.m. | 1:25 a.m. | 1 | 1:15 a.m. | 6.4 | 93.0 | 46.0 | 22.0 | Nil | 0.2 | 0.1 | 0.5 | 20.0 |
| 3:55 a.m. | 4:15 a.m. | 2 | 4:00 a.m. | 6.4 | 72.0 | 36.0 | 12.7 | Nil | 0.2 | 0.1 | 0.6 | 30.0 | |
| 6:15 a.m. | 6:25 a.m. | 3 | 6:20 a.m. | 6.3 | 54.0 | 27.0 | 12.5 | Nil | 0.2 | 0.2 | 0.4 | 20.0 | |
| 7:55 a.m. | 8:45 a.m. | 4 | 8:00 a.m. | 6.3 | 50.0 | 25.0 | 10.1 | Nil | 0.2 | 0.1 | 0.4 | 20.0 | |
| 5 | 8:40 a.m. | 6.3 | 30.0 | 15.0 | 10.0 | Nil | 0.1 | 0.1 | 0.2 | 10.0 | |||
| 13.07.18 | 9:15 a.m. | 10:15 a.m. | 1 | 9:30 a.m. | 6.2 | 100 | 50.0 | 16.3 | Nil | 0.4 | 0.3 | 0.4 | 20.0 |
| 2 | 10:00 a.m. | 6.0 | 50.0 | 25.0 | 12.8 | Nil | 0.2 | 0.2 | 0.5 | 25.0 | |||
| 17.07.18 | 1:35 p.m. | 2:30 p.m. | 1 | 1:45 p.m. | 6.6 | 97.0 | 48.0 | 16.3 | Nil | 0.3 | 0.3 | 0.4 | 20.0 |
| 2 | 2:15 p.m. | 6.5 | 66.0 | 33.0 | 15.7 | Nil | 0.2 | 0.2 | 0.2 | 10.0 | |||
| 21.07.18 | 4:50 p.m. | 5:45 p.m. | 1 | 5:00 p.m. | 6.6 | 78.0 | 39.0 | 13.3 | Nil | 0.2 | 0.3 | 0.5 | 25.0 |
| 2 | 5:30 p.m. | 6.5 | 46.0 | 23.0 | 9.5 | Nil | 0.1 | 0.2 | 0.2 | 10.0 | |||
| Date | Rain Fall Event | Samples Collected | Sampling Time | PH | EC (µs/cm) | TDS (ppm) | Turbidity (NTU) | CO3− (me/L) | HCO3− (me/L) | Cl− (me/L) | Ca+2 + Mg+2 (me/L) | Total Hardness (mg/L) | |
|---|---|---|---|---|---|---|---|---|---|---|---|---|---|
| Start Time | End Time | ||||||||||||
| 29.06.18 | 5:25 a.m. | 6:30 a.m. | 1 | 5:30 a.m. | 6.6 | 185 | 92.0 | 16.3 | Nil | 0.4 | 0.6 | 1.1 | 55.0 |
| 2 | 6:20 a.m. | 6.6 | 125 | 62.0 | 13.4 | Nil | 0.4 | 0.5 | 0.8 | 40.0 | |||
| 1:15 p.m. | 2:05 p.m. | 3 | 1:20 p.m. | 6.7 | 99.0 | 50.0 | 17.1 | Nil | 0.2 | 0.2 | 0.6 | 30.0 | |
| 4 | 2:00 p.m. | 6.6 | 89.0 | 45.0 | 14.8 | Nil | 0.4 | 0.2 | 0.4 | 20.0 | |||
| 30.06.18 | 5:30 a.m. | 6:25 a.m. | 1 | 5:45 a.m. | 6.5 | 100 | 50.0 | 24.7 | Nil | 0.3 | 0.4 | 0.3 | 15.0 |
| 2 | 6:20 a.m. | 6.6 | 76.0 | 38.0 | 11.4 | Nil | 0.2 | 0.2 | 0.5 | 25.0 | |||
| 3.07.18 | 1:00 a.m. | 1:25 a.m. | 1 | 1:15 a.m. | 6.5 | 135 | 67.0 | 10.2 | Nil | 0.3 | 0.5 | 0.5 | 25.0 |
| 3:55 a.m. | 4:15 a.m. | 2 | 4:00 a.m. | 6.6 | 108 | 54.0 | 16.2 | Nil | 0.3 | 0.3 | 0.3 | 15.0 | |
| 6:15 a.m. | 6:25 a.m. | 3 | 6:20 a.m. | 6.5 | 74.0 | 37.0 | 13.7 | Nil | 0.2 | 0.3 | 0.3 | 15.0 | |
| 7:55 a.m. | 8:45 a.m. | 4 | 8:00 a.m. | 6.5 | 50.0 | 25.0 | 11.9 | Nil | 0.2 | 0.3 | 0.4 | 20.0 | |
| 5 | 8:40 a.m. | 6.5 | 48.0 | 24.0 | 10.0 | Nil | 0.1 | 0.3 | 0.3 | 15.0 | |||
| 13.07.18 | 9:15 a.m. | 10:15 a.m. | 1 | 9:30 a.m. | 6.4 | 142 | 71.0 | 14.4 | Nil | 0.3 | 0.3 | 0.8 | 40.0 |
| 2 | 10:00 a.m. | 6.3 | 77.0 | 38.0 | 17.7 | Nil | 0.2 | 0.2 | 0.6 | 30.0 | |||
| 17.07.18 | 1:35 p.m. | 2:30 p.m. | 1 | 1:45 p.m. | 6.5 | 163 | 81.0 | 13.9 | Nil | 0.3 | 0.4 | 0.7 | 35.0 |
| 2 | 2:15 p.m. | 6.4 | 157 | 78.0 | 10.3 | Nil | 0.4 | 0.5 | 0.6 | 30.00 | |||
| Date | Rain Fall Event | Samples Collected | Sampling Time | PH | EC (µs/cm) | TDS (ppm) | Turbidity (NTU) | CO3− (me/L) | HCO3− (me/L) | Cl− (me/L) | Ca+2 + Mg+2 (me/L) | Total Hardness (mg/L) | |
|---|---|---|---|---|---|---|---|---|---|---|---|---|---|
| Start Time | End Time | ||||||||||||
| 29.06.18 | 5:25 a.m. | 6:30 a.m. | 1 | 5:30 a.m. | 6.6 | 190 | 95.0 | 30.0 | Nil | 0.3 | 1.2 | 1.2 | 60.0 |
| 2 | 6:20 a.m. | 6.5 | 140 | 70.0 | 22.0 | Nil | 0.2 | 0.8 | 0.8 | 40.0 | |||
| 1:15 p.m. | 2:05 p.m. | 3 | 1:20 p.m. | 6.5 | 100 | 50.0 | 20.0 | Nil | 0.2 | 0.3 | 0.8 | 40.0 | |
| 4 | 2:00 p.m. | 6.5 | 98.0 | 49.0 | 15.0 | Nil | 0.2 | 0.2 | 0.7 | 35.0 | |||
| 30.06.18 | 5:30 a.m. | 6:25 a.m. | 1 | 5:45 a.m. | 6.5 | 163 | 81.0 | 18.0 | Nil | 0.3 | 0.4 | 0.5 | 25.0 |
| 2 | 6:20 a.m. | 6.4 | 90.0 | 45.0 | 11.0 | Nil | 0.2 | 0.2 | 0.6 | 30.0 | |||
| 03.07.18 | 1:00 a.m. | 1:25 a.m. | 1 | 1:15 a.m. | 6.6 | 400 | 200 | 29.5 | Nil | 0.5 | 1.5 | 1.4 | 70.0 |
| 3:55 a.m. | 4:15 a.m. | 2 | 4:00 a.m. | 6.5 | 307 | 153 | 13.5 | Nil | 0.4 | 0.7 | 1.3 | 65.0 | |
| 6:15 a.m. | 6: 30 a.m. | 3 | 6:20 a.m. | 6.5 | 209 | 104 | 12.1 | Nil | 0.4 | 0.5 | 0.6 | 30.0 | |
| 7:55 a.m. | 8:45 a.m. | 4 | 8:00 a.m. | 6.4 | 74.0 | 37.0 | 14.9 | Nil | 0.2 | 0.2 | 0.4 | 20.0 | |
| 5 | 8:40 a.m. | 6.3 | 70.0 | 35.0 | 14.7 | Nil | 0.2 | 0.3 | 0.3 | 15.0 | |||
| 13.07.18 | 9:15 a.m. | 10:15 a.m. | 1 | 9:30 a.m. | 6.1 | 350 | 175 | 13.3 | Nil | 0.3 | 1.5 | 2.0 | 100 |
| 2 | 10:00 a.m. | 6.0 | 115 | 57.0 | 13.1 | Nil | 0.3 | 0.4 | 1.2 | 60.0 | |||
| 17.07.18 | 1:35 p.m. | 2:30 p.m. | 1 | 1:45 p.m. | 6.5 | 344 | 172 | 18.9 | Nil | 0.5 | 0.8 | 1.3 | 65.0 |
| 2 | 2:15 p.m. | 6.2 | 207 | 103 | 18.4 | Nil | 1.0 | 0.6 | 1.2 | 60.0 | |||
| 21.07.18 | 4:50 p.m. | 5:45 p.m. | 1 | 5:00 p.m. | 6.5 | 150 | 75.0 | 22.2 | Nil | 0.3 | 0.5 | 0.7 | 35.0 |
| 2 | 5:30 p.m. | 6.4 | 88.0 | 44.0 | 10.4 | Nil | 0.2 | 0.3 | 0.4 | 20.0 | |||
| Date | Rain Fall Event | Samples Collected | Sampling Time | PH | EC (µs/cm) | TDS (ppm) | Turbidity (NTU) | CO3− (me/L) | HCO3− (me/L) | Cl− (me/L) | Ca+2 + Mg+2 (me/L) | Total Hardness (mg/L) | |
|---|---|---|---|---|---|---|---|---|---|---|---|---|---|
| Start Time | End Time | ||||||||||||
| 29.06.18 | 5:25 a.m. | 6:30 a.m. | 1 | 5:30 a.m. | 6.6 | 370 | 185 | 75.3 | Nil | 0.5 | 0.3 | 0.8 | 40.0 |
| 2 | 6:20 a.m. | 6.5 | 367 | 183 | 39.8 | Nil | 0.4 | 0.3 | 1.0 | 50.0 | |||
| 1:15 p.m. | 2:05 p.m. | 3 | 1:20 p.m. | 6.5 | 425 | 212 | 68.9 | Nil | 0.4 | 0.4 | 1.2 | 60.0 | |
| 4 | 2:00 p.m. | 6.4 | 525 | 262 | 70.2 | Nil | 0.8 | 0.5 | 1.3 | 65.0 | |||
| 30.06.18 | 1:15 p.m. | 2:05 p.m. | 1 | 2:00 p.m. | 6.5 | 165 | 83.0 | 52.0 | Nil | 0.4 | 0.3 | 0.4 | 20.0 |
| 03.07.18 | 1:00 a.m. | 1:25 a.m. | 1 | 1:15 a.m. | 6.5 | 204 | 102 | 13.2 | Nil | 0.4 | 0.4 | 0.4 | 20.0 |
| 3:55 a.m. | 4:15 a.m. | 2 | 4:00 a.m. | 6.5 | 214 | 107 | 14.7 | Nil | 0.3 | 0.5 | 0.6 | 30.0 | |
| 6:15 a.m. | 6: 30 a.m. | 3 | 6:20 a.m. | 6.5 | 166 | 83.0 | 25.8 | Nil | 0.4 | 0.4 | 0.5 | 25.0 | |
| 7:55 a.m. | 8:45 a.m. | 4 | 8:00 a.m. | 6.4 | 165 | 82.0 | 36.3 | Nil | 0.3 | 0.3 | 0.5 | 25.0 | |
| 5 | 8:40 a.m. | 6.4 | 142 | 71.0 | 12.4 | Nil | 0.3 | 0.4 | 0.4 | 20.0 | |||
| 13.07.18 | 9:15 a.m. | 10:15 a.m. | 1 | 9:30 a.m. | 6.2 | 1243 | 621 | 17.8 | Nil | 2.4 | 3.0 | 4.5 | 225 |
| 2 | 10:00 a.m. | 6.0 | 454 | 227 | 13.6 | Nil | 0.3 | 0.7 | 1.4 | 70.0 | |||
| 17.07.18 | 1:35 p.m. | 2:30 p.m. | 1 | 1:45 p.m. | 6.2 | 821 | 410 | 12.5 | Nil | 0.8 | 1.0 | 2.8 | 140 |
| 2 | 2:15 p.m. | 6.0 | 745 | 372 | 10.0 | Nil | 2.0 | 1.2 | 2.2 | 110 | |||
| 21.07.18 | 4:50 p.m. | 5:45 p.m. | 1 | 5:00 p.m. | 6.6 | 550 | 275 | 19.9 | Nil | 0.5 | 0.8 | 1.2 | 60.0 |
| 2 | 5:30 p.m. | 6.5 | 238 | 119 | 11.1 | Nil | 0.5 | 0.6 | 0.8 | 40.0 | |||
References
- Herrmann, T.; Schmida, U. Rainwater utilisation in Germany: Efficiency, dimensioning, hydraulic and environmental aspects. Urban Water 2000, 1, 307–316. [Google Scholar] [CrossRef]
- Coombes, P.J.; Argue, J.R.; Kuczera, G. Figtree Place: A case study in water sensitive urban development (WSUD). Urban Water 2000, 1, 335–343. [Google Scholar] [CrossRef]
- Coombes, P.J.; Kuczera, G.; Kalma, J.D. Economic, water quantity and quality impacts from the use of a rainwater tank in the inner city. Australas. J. Water Resour. 2003, 7, 111–120. [Google Scholar] [CrossRef]
- Ghisi, E. Potential for potable water savings by using rainwater in the residential sector of Brazil. Build. Environ. 2006, 41, 1544–1550. [Google Scholar] [CrossRef]
- Ghisi, E.; Bressan, D.L.; Martini, M. Rainwater tank capacity and potential for potable water savings by using rainwater in the residential sector of southeastern Brazil. Build. Environ. 2007, 42, 1654–1666. [Google Scholar] [CrossRef]
- Bilal, M.; Sultan, M.; Morosuk, T.; Den, W.; Sajjad, U.; Aslam, M.M.A.; Shahzad, M.W.; Farooq, M. Adsorption-based atmospheric water harvesting: A review of adsorbents and systems. Int. Commun. Heat Mass Transf. 2022, 133, 105961. [Google Scholar] [CrossRef]
- Wasti, T.Z.; Sultan, M.; Aleem, M.; Sajjad, U.; Farooq, M.; Raza, H.M.; Khan, M.U.; Noor, S. An overview of solid and liquid materials for adsorption-based atmospheric water harvesting. Adv. Mech. Eng. 2022, 14, 16878132221082768. [Google Scholar] [CrossRef]
- Sultan, M.; Bilal, M.; Miyazaki, T.; Sajjad, U.; Ahmad, F. Adsorption-Based Atmospheric Water Harvesting: Technology Fundamentals and Energy-Efficient Adsorbents. In Technology in Agriculture; Ahmad, F., Sultan, M., Eds.; IntechOpen: London, UK, 2021; Volume 1, p. 369. [Google Scholar]
- Aziz, M.; Rizvi, S.A.; Sultan, M.; Bazmi, M.S.A.; Shamshiri, R.R.; Ibrahim, S.M.; Imran, M.A. Simulating Cotton Growth and Productivity Using AquaCrop Model under Deficit Irrigation in a Semi-Arid Climate. Agriculture 2022, 12, 242. [Google Scholar] [CrossRef]
- Ngigi, S.N. What is the limit of up-scaling rainwater harvesting in a river basin? Phys. Chem. Earth Parts ABC 2003, 28, 943–956. [Google Scholar] [CrossRef]
- Bruins, H.J.; Evenari, M.; Nessler, U. Rainwater-harvesting agriculture for food production in arid zones: The challenge of the African famine. Appl. Geogr. 1986, 6, 13–32. [Google Scholar] [CrossRef]
- Shanan, L.; Tadmor, N.; Evenari, M.; Reiniger, P. Runoff Farming in the Desert. III. Microcatchments for Improvement of Desert Range 1. Agron. J. 1970, 62, 445–449. [Google Scholar] [CrossRef]
- Falkenmark, M.; Fox, P.; Persson, G.; Rockström, J. Water Harvesting for Upgrading of Rainfed Agriculture; Stockholm International Water Institute: Stockholm, Sweden, 2001; pp. 76–87. [Google Scholar]
- AbdelKhaleq, R.A.; Alhaj Ahmed, I. Rainwater harvesting in ancient civilizations in Jordan. Water Sci. Technol. Water Supply 2007, 7, 85–93. [Google Scholar] [CrossRef]
- Xiao, G.; Zhang, Q.; Xiong, Y.; Lin, M.; Wang, J. Integrating rainwater harvesting with supplemental irrigation into rain-fed spring wheat farming. Soil Tillage Res. 2007, 93, 429–437. [Google Scholar] [CrossRef]
- Kahinda, J.-m.M.; Taigbenu, A.E.; Boroto, J.R. Domestic rainwater harvesting to improve water supply in rural South Africa. Phys. Chem. Earth Parts ABC 2007, 32, 1050–1057. [Google Scholar] [CrossRef]
- Yaziz, M.I.; Gunting, H.; Sapari, N.; Ghazali, A. Variations in rainwater quality from roof catchments. Water Res. 1989, 23, 761–765. [Google Scholar] [CrossRef]
- Sazakli, E.; Alexopoulos, A.; Leotsinidis, M. Rainwater harvesting, quality assessment and utilization in Kefalonia Island, Greece. Water Res. 2007, 41, 2039–2047. [Google Scholar] [CrossRef]
- Zhu, K.; Zhang, L.; Hart, W.; Liu, M.; Chen, H. Quality issues in harvested rainwater in arid and semi-arid Loess Plateau of northern China. J. Arid Environ. 2004, 57, 487–505. [Google Scholar] [CrossRef]
- Kim, R.-H.; Lee, S.; Kim, J.-O. Application of a metal membrane for rainwater utilization: Filtration characteristics and membrane fouling. Desalination 2005, 177, 121–132. [Google Scholar] [CrossRef]
- Rockstrom, J. Water resources management in smallholder farms in Eastern and Southern Africa: An overview. Phys. Chem. Earth Part B Hydrol. Ocean. Atmos. 2000, 25, 275–283. [Google Scholar] [CrossRef]
- Mbilinyi, B.; Tumbo, S.; Mahoo, H.; Mkiramwinyi, F. GIS-based decision support system for identifying potential sites for rainwater harvesting. Phys. Chem. Earth Parts ABC 2007, 32, 1074–1081. [Google Scholar] [CrossRef]
- Gitte, A.; Pendke, M. Effect of water conservation practices on hydrological behavior, water table fluctuation and ground water recharge in a watershed. J. Maharashtra Agric. Univ. (India) 2002, 27, 290–292. [Google Scholar]
- Julius, J.; Prabhavathy, R.A.; Ravikumar, G. Rainwater harvesting (RWH)—A review. Int. J. Innov. Res. Dev. 2013, 2, 13. [Google Scholar]
- Awuah, E.; Gyasi, S.F.; Anipa, H.M.; Sekyiamah, K.E. Assessment of rainwater harvesting as a supplement to domestic water supply: Case study in Kotei-Ghana. J. Issues ISSN 2014, 2360, 8803. [Google Scholar]
- Rahman, S.; Khan, M.T.R.; Akib, S.; Din, N.B.C.; Biswas, S.K.; Shirazi, S.M. Sustainability of Rainwater Harvesting System in terms of Water Quality. Sci. World J. 2014, 2014, 721357. [Google Scholar] [CrossRef]
- Association, A.P.H. Standard Method for the Examination of Water and Wastewater, 23rd ed.; Baird, R.B., Eaton, A.D., Rice, E.W., Eds.; American Public Health Association; American Water Works Association; Water Environment Federation: Washington, DC, USA, 2017. [Google Scholar]
- Abdulla, F.A.; Al-Shareef, A.W. Roof rainwater harvesting systems for household water supply in Jordan. Desalination 2009, 243, 195–207. [Google Scholar] [CrossRef]
- Baguma, D.; Loiskandl, W.; Darnhofer, I.; Jung, H.; Hauser, M. Knowledge of measures to safeguard harvested rainwater quality in rural domestic households. J. Water Health 2009, 8, 334–345. [Google Scholar] [CrossRef] [Green Version]


| Site No | Figure No. | Name of Site/Address | Location |
|---|---|---|---|
| Site 1 (S1) | Figure 1a | Irrigation Research Institute (IRI), Irrigation Department, Lahore, Pakistan | 31.55 N, 74.31 E |
| Site 2 (S2) | Figure 1b | Experimental Research Station (ERS), Niazbeg, Lahore, Pakistan | 31.47 N, 74.23 E |
| Site 3 (S3) | Figure 1c | Field Research Station (FRS) Babakwal, Tehsil Ferozewala District Sheikhupura | 31.70 N, 74.36 E |
Publisher’s Note: MDPI stays neutral with regard to jurisdictional claims in published maps and institutional affiliations. |
© 2022 by the authors. Licensee MDPI, Basel, Switzerland. This article is an open access article distributed under the terms and conditions of the Creative Commons Attribution (CC BY) license (https://creativecommons.org/licenses/by/4.0/).
Share and Cite
Zakir-Hassan, G.; Punthakey, J.F.; Shabir, G.; Yasmeen, F.; Sultan, M.; Ashraf, H.; Sohoo, I.; Majeed, F. Physicochemical Investigation of Rainfall for Managed Aquifer Recharge in Punjab (Pakistan). Water 2022, 14, 2155. https://doi.org/10.3390/w14142155
Zakir-Hassan G, Punthakey JF, Shabir G, Yasmeen F, Sultan M, Ashraf H, Sohoo I, Majeed F. Physicochemical Investigation of Rainfall for Managed Aquifer Recharge in Punjab (Pakistan). Water. 2022; 14(14):2155. https://doi.org/10.3390/w14142155
Chicago/Turabian StyleZakir-Hassan, Ghulam, Jehangir F. Punthakey, Ghulam Shabir, Fozia Yasmeen, Muhammad Sultan, Hadeed Ashraf, Ihsanullah Sohoo, and Faizan Majeed. 2022. "Physicochemical Investigation of Rainfall for Managed Aquifer Recharge in Punjab (Pakistan)" Water 14, no. 14: 2155. https://doi.org/10.3390/w14142155