
Regional Evapotranspiration Estimation by the Improved MOD16-sm Model and Its Application in Central China


1
College of Water Resources, North China University of Water Resources and Electric Power, Zhengzhou 450046, China
2
Henan Key Laboratory of Water Resources Conservation and Intensive Utilization in the Yellow River Basin, Zhengzhou 450046, China
3
Department of Civil, Environmental and Geomatics Engineering, Florida Atlantic University, 14 Florida, Boca Raton, FL 33431, USA
*
Author to whom correspondence should be addressed.
Water 2022, 14(9), 1491; https://doi.org/10.3390/w14091491
Submission received: 2 April 2022
/
Revised: 28 April 2022
/
Accepted: 3 May 2022
/
Published: 6 May 2022
(This article belongs to the Section Hydrology)
Abstract
:Evapotranspiration (ET) is a key component of the hydrological cycle, but traditional monitoring approaches are always based on measurements, which cannot satisfy the requirements of research on a regional scale. Hence, ET estimation by remote sensing is essential. MOD16 is a remote-sensing model based on the P-M equation and has good applicability. However, it describes soil moisture indirectly by RH, etc., which may cause uncertainties in ET estimating, so this study attempts to utilize the NDWI as a supplement to soil moisture information and makes improvements on the MOD16 model (with the resultant new model being named MOD16-sm). Specific work includes two aspects: one is model verification through making comparisons between ET estimates and measurements, and the other is a model application effect test analyzing the spatiotemporal characteristics of ET and exploring how ET responds to climate and land-use changes. Model verification indicated that the accuracy of the improved MOD16-sm model increased, with a higher R2 of 0.71, a lower RMSE 0.9 mm, and a lower MAE 0.91 mm, and that the improved MOD16-sm model was convincing. The application effect test of the MOD16-sm model showed that the average relative change rate of annual ET was 1.7%, showing an upward trend, and areas with growth trends of ET also had high vegetation coverage. As for the impacts of climate and land-use changes on ET, ET was positively correlated with precipitation, whereas it had no relevant correlation with air temperature in most areas, and the ET of all land-use types displayed significant increasing trends resulting from climate change. The application effect test demonstrated that ET estimates by the improved MOD16-sm model were reasonable.
1. Introduction
Evapotranspiration, ET, is a key component of the ecohydrological and energy cycles [1]. ET has complex mechanisms and influencing factors, such as precipitation and soil water content (representing the water supply), and solar radiation, temperature, etc. (representing the energy supply) [2,3,4,5,6]. Accurately estimating ET is beneficial to understanding the linkage between climatic feedback and ecosystem functions [7].
Traditional ET monitoring methods are mainly based on measurements from instruments, which cannot satisfy the requirements of the study of regional, large-scale ET, and furthermore the installation of the instruments is always time-consuming, labor-intensive, and sometimes subject to instrument failure [8]. Compared with traditional methods, remote sensing has become an important way to monitor regional ET [8,9,10,11]. With the development of satellite remote-sensing technology and related inversion algorithms, it is possible to acquire continuous ET on a large scale [12]. In the past few decades, a number of remote-sensing-based ET modeling techniques have been developed for better managing water resources and understanding climate changes. Models have been developed that focus on estimating regional ET, including the SEBS model [13], SEBAL model [14], Priestley–Taylor model [15], and Penman–Monteith equation [16]. ET estimation models available in the literature above can be broadly classified as (1) fully physically-based combination models that account for mass and energy conservation principles (these models have a clear physical mechanism and good portability, but the model accuracy greatly depends on the surface roughness and the parameterization of aerodynamic impedance); (2) semi physically-based models that deal with either mass or energy conservation (whose model characteristics are between fully physically-based combination models and black-box models) (3) black-box models based on artificial neural networks, empirical relationships, and fuzzy and genetic algorithms (these models have fewer parameters, and are easy to operate, but rely greatly on ground observations and need to be recalibrated in different climatic regions, that is to say, have poor portability).
Meanwhile, ET products derived from the existing ET models have been produced. The global terrestrial ET product (MOD16/ET), based on the Penman–Monteith equation, is jointly issued by National Aeronautics and Space Administration (NASA) and the NTSG of the University of Montana, 2011. The MOD16/ET has been verified by global flux observation data, with an estimated accuracy of 86% [17]. Because of its high spatiotemporal resolution and free access, MOD16/ET has been widely used in studying the characteristics of regional ET worldwide. Many scholars have compared MOD16 products with measurements in different climate zones all over the world. Kim et al. validated MODIS-derived ET estimates by observations from various sites and revealed that the MOD16 model performed the best in forest and poorly in arid and polar climates [18]. In China, some scholars have validated MODIS-derived ET estimates by flux observations, and also found high accuracy in farmland and forest ecosystems [19]. However, Ramoelo et al. validated MODIS-derived ET estimates using the data of two eddy covariance (EC) flux towers from sparse grassland ecosystem in South Africa from 2000 to 2010, and found that MOD16 estimations achieved a poorer correlation with flux tower results [20]. Similarly, Srivastava et al. found ET estimates by MOD16 model highly underestimated a periodic shift that may be attributed to the cloud-cover and leaf-shadowing effects [21]. To sum up, although MOD16 products can represent the overall trend of ET on a global scale, there still exist large deviations from observations on a local scale. Several researchers thought the reasons for the poor performance of ET products made with the MOD16 model were related to the local parameterization of the model input data, and one of them proposed a simple empirical model to estimate the surface resistance, which is closely related to the soil moisture [22].
Therefore, the parameterization of the MOD16 model is critical. In the MOD16 model, the parameterization of the soil moisture information is through surface resistance, which expresses the soil moisture information in the temporal and spatial changes of land surface temperature, and the influence of soil water stress on ET is implied. Hence, the parameterization of the soil moisture information is unreasonable [23]. The consideration of the inadequacy and indirection of soil moisture in surface resistance may cause uncertainties in MOD16 ET results. Studies show that MOD16 model is suitable for areas where available energy limits ET, but it faces great challenges in regions where soil water stress is the main limiting factor [24]. Therefore, it is necessary to improve the MOD16 model for estimating ET under soil water stress circumstances, which means strengthening the expression of soil moisture information through surface resistance parameterization.
In the MOD16 model, the soil surface resistance of the dry soil surface and the stomatal conductance of dry vegetation canopy are the parameters closely connected with soil moisture information, and they are expressed and described by the relative humidity (RH), water vapor pressure deficit (VPD), leaf area index, and so on, which are regarded as the soil water process of the model. Therefore, the influence of soil moisture is indirectly considered in the MOD16 model. As the water source of ET, soil moisture plays an important role in the parameterization of canopy resistance and soil surface resistance, and large errors may occur if the influence of soil moisture is ignored [25]. Gokmen et al. integrated the water stress information into the SEBS model to retrieve ET and found that water stress integrated SEBS model can provide more accurate ET estimations, with the RSME decreased by 10% [26]. Sun et al. utilized the vegetation index and surface temperature characteristics to represent the soil water information and added them into the MOD16 model to estimate the regional ET, with the RSME of 8-day ET decreased from 10.58 mm to 7.82 mm and the BIAS of 8-day ET also decreased from 6.72 mm to 4.02 mm [25]. According to the above reviews, it is obvious that integrating soil moisture information, such as NDWI, into the MOD16 model is helpful to reduce the uncertainty of ET estimations under water stress circumstances.
Exploring the temporal and spatial characteristics of regional ET, as well as its response to climate changes, have important scientific significance for regional water resource development, management, scientific distribution, and efficient utilization [8,9,27,28,29,30]. Besides climate, land-use changes resulting from the combined effects of human activities and ecological environments can bring about great changes in a series of surface parameters such as surface temperature, vegetation coverage, and soil moisture, which can affect the spatiotemporal pattern of regional ET [31,32]. Therefore, effects from climate change and land-use change on ET must be carefully studied to improve hydrologic management [33]. According to regional ET estimates on a long time-scale by remote sensing, many studies have been carried out on the spatiotemporal variation in ET and the influence of climate changes on ET [34]. Jhajharia et al. found that RH and wind speed were more sensitive than air temperature in estimating ET in northeast India [35]; however, other scholars thought RH and wind speed were inessential to ET estimates in Brazilian Cerrado [36]. Besides the impact of climate changes, the influence of land-use changes in the form of vegetation type changes, leaf area index change, and surface albedo change are also contribute to the ET capacity and the spatiotemporal variation in ET [37]. Studies have found that built-up areas offer much lower actual ET than croplands, and deforestation would reduce ET significantly [12]. In China, many scholars used ET data to study the temporal and spatial variation characteristics of ET in different regions (such as the source region of the Yellow River, Poyang Lake Basin, and Dongting Lake Basin), for the purpose of better understanding how climate and land-use changes affect ET [38]. Henan province is one of China’s important grain-producing areas, is located in central China, and experienced a rapid industrialization process in the twentieth century. The overexploitation of groundwater has caused the amount of available water resources to become increasingly scarce [12]. As for a key expenditure item of the water cycle, a full understanding of the temporal and spatial characteristics of ET in Henan province, central China, as well as the driving mechanism of ET, has important and scientific significance for the development and utilization of water resources and ecological restoration. At present, most studies on ET in Henan province focus on the potential ET based on meteorological observations [39], such as Zhang et al., who explored climatic characteristics and evaluated modeling of pan ET over Henan province [40]. There are few studies on the temporal and spatial characteristics of actual ET according to the remote-sensing model in Henan province, and research on the influence of climate and land-use changes on regional ET is even more lacking. What is worse, because of the inadequacy of corresponding studies, the responding mechanism of ET to climate and land-use changes is also unclear. Hence, it is imperative, necessary, and valuable to study the effects of climate change and land-use change on ET in Henan province, for the purpose of improving the hydrologic management in central China.
Based on the above research review, the study firstly focuses on the improvement of the MOD16 model by integrating the NDWI, which is a soil moisture index and can reasonably reflect soil wetting and drying conditions, and undertakes a corresponding verification based on ground-based measurements, which can fill with the gap that the MOD16 model ignores in the soil moisture information and improve the accuracy of ET estimations. The study secondly performs an application effect test in central China by analyzing temporal and spatial evolution and exploring the impacts of climate and land-use changes on ET based on the improved MOD16 model, which can fill the gaps in the spatiotemporal patterns of actual ET and the ET response mechanisms of Henan province, which are inadequate. The innovations of the current study are (1) making improvements to the MOD16 model using the NDWI, and (2) exploring the temporal and spatial evolution of the actual ET in Henan province, central China, in recent years (from 2000 to 2020) and trying to ascertain how actual ET responds to climate and land-use changes. The study will provide important suggestions on improving the accuracy of ET estimates by remote sensing and benefits for sustainably managing water resources.
2. Material
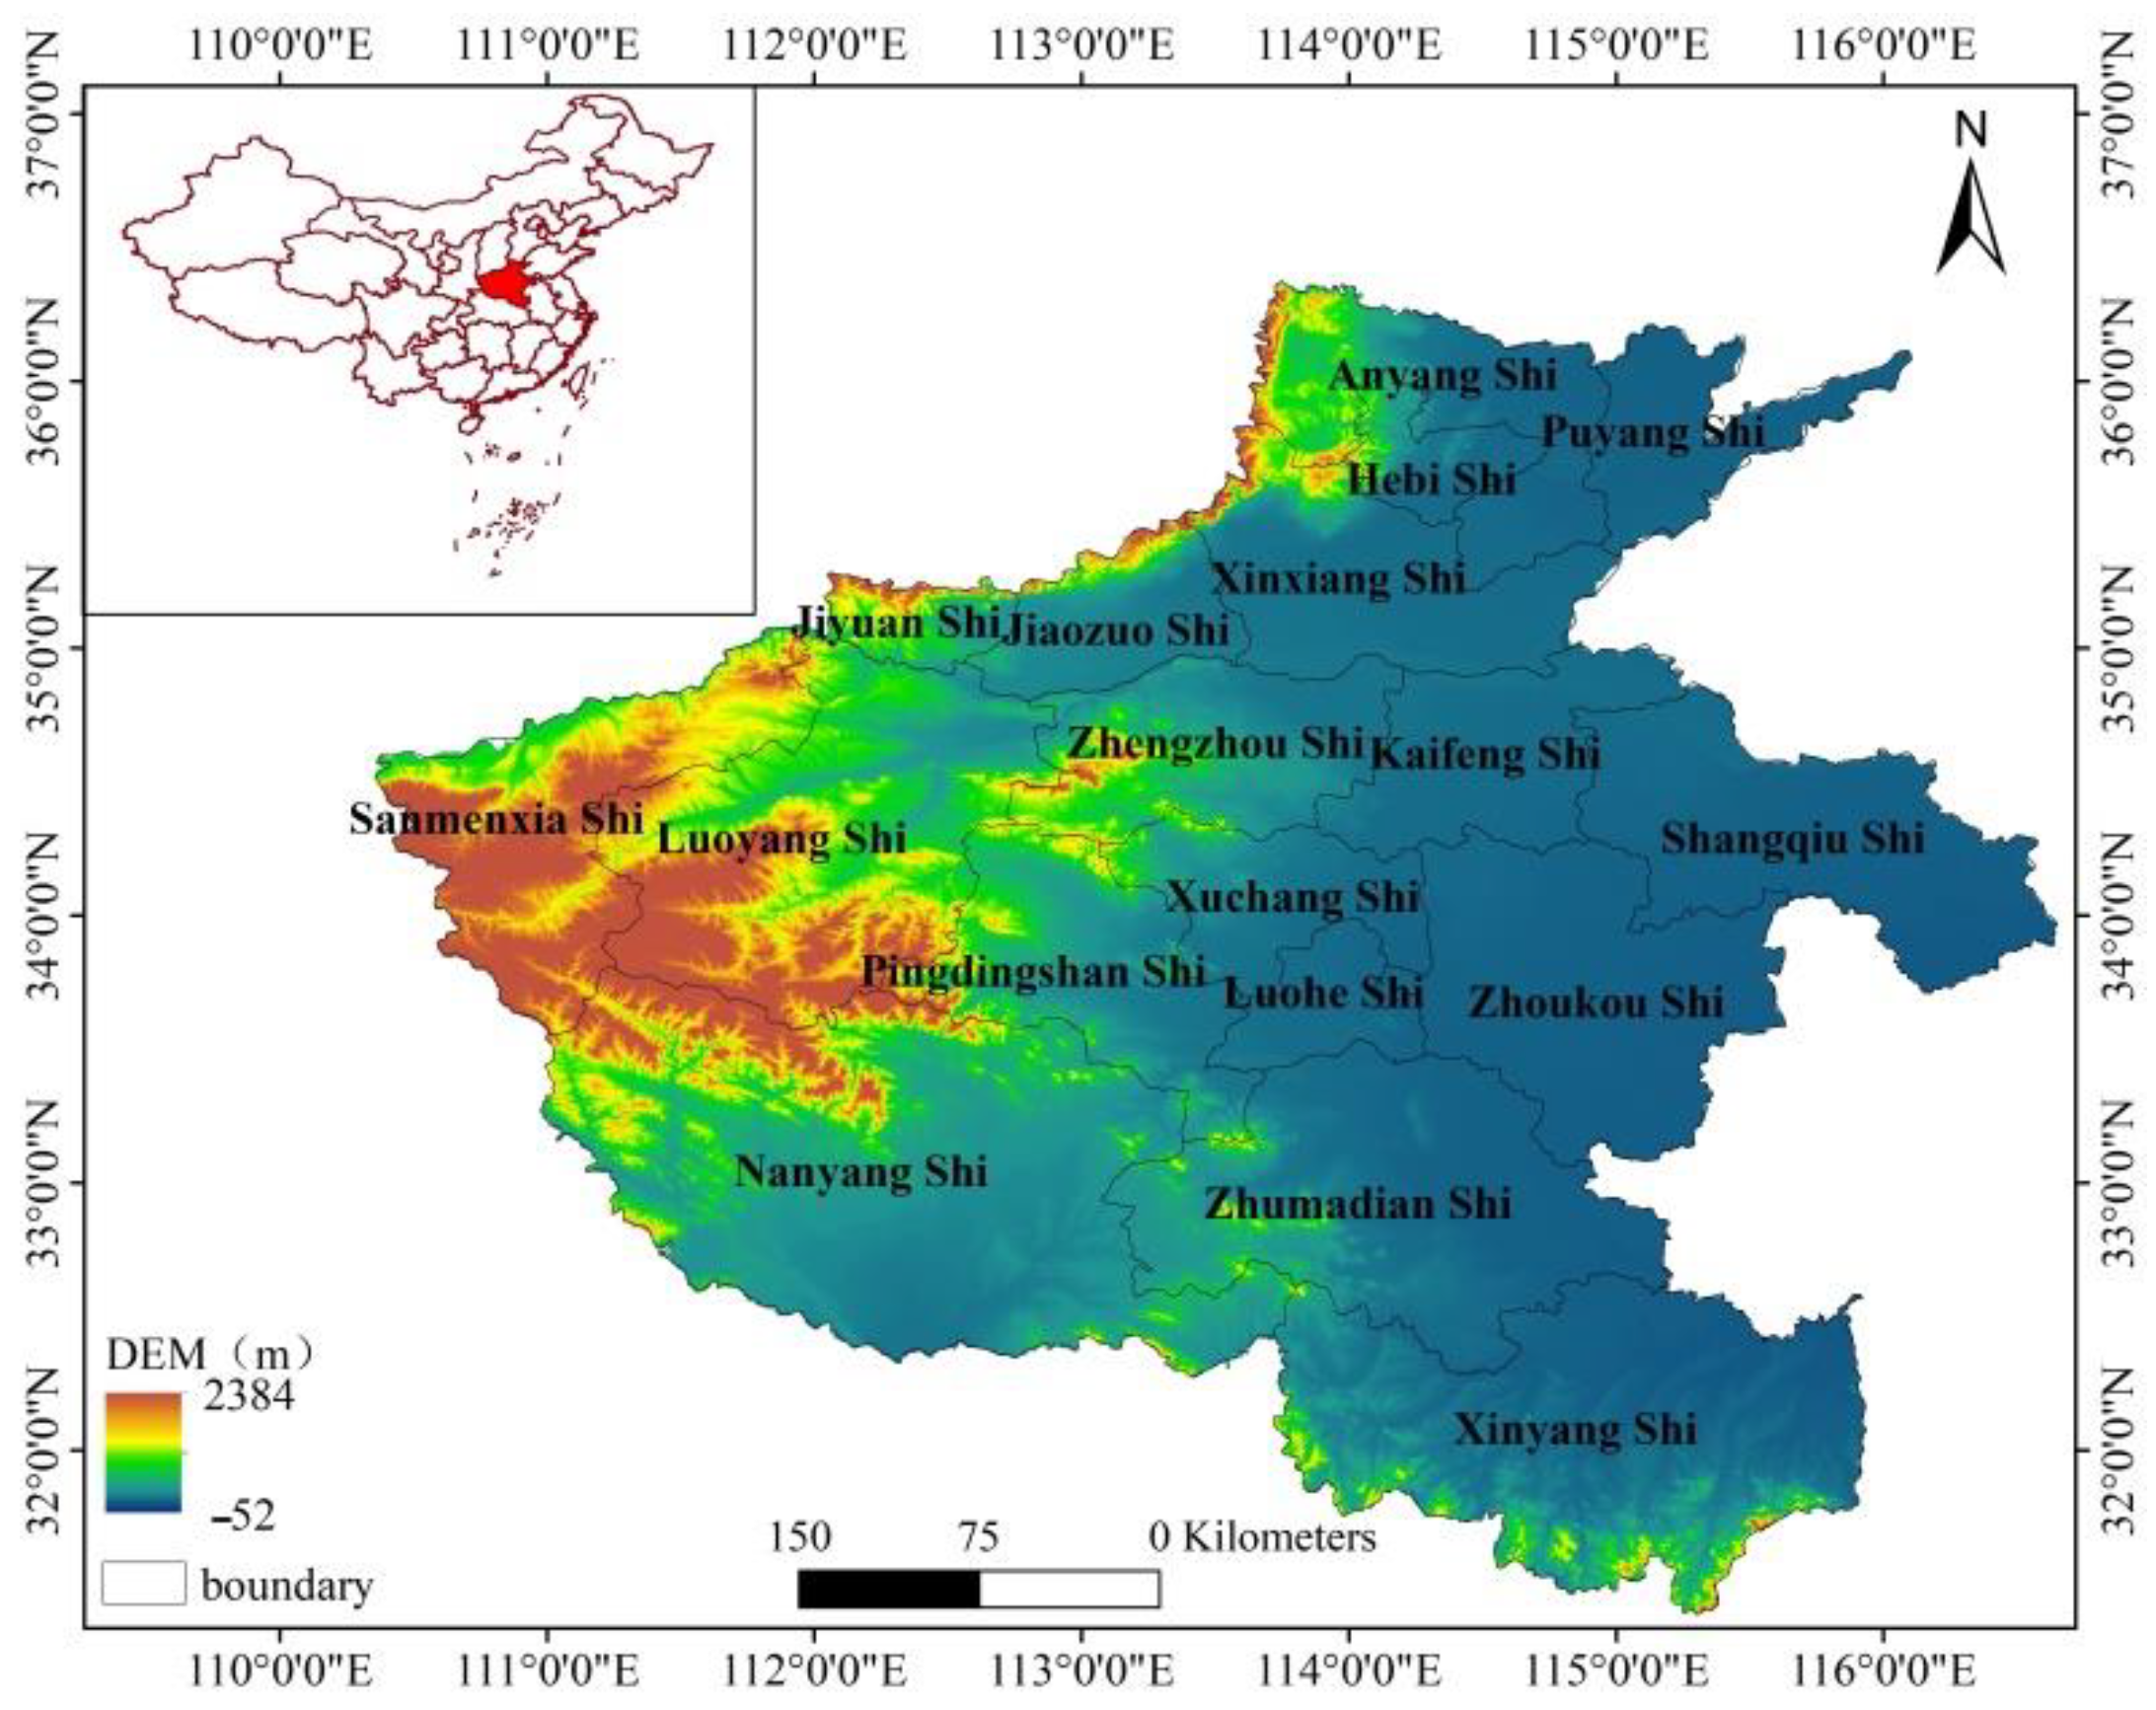
2.1. Study Area
Henan province, latitude 31°23′–36°22′ N and longitude 110°21′–116°39′ E, is located in the central-eastern part of China and belongs to the middle and lower reaches of the Yellow River. Figure 1 gives the location and DEM of the study area. The study area is surrounded by mountains distributed along the provincial boundary in the north, west, and south, in a semi-circular shape. Besides mountain areas, the middle and eastern regions are the plain, and the southwest is the basin. The terrain is high in the west and low in the east. The landform types in the territory are complex and diverse, including plains and basins, mountains, and hills, which account for 55.7%, 26.6%, and 17.7% of the total area, respectively. The highest and lowest elevations are 2413.8 m and 23.2 m, respectively. Henan province straddles four major river basins, which are the Hai River, the Yellow River, the Huai River, and the Yangtze River basins. The Yellow River traverses the middle of the province. The annual average precipitation is about 500–900 mm and can reach more than 1100 mm in the mountainous areas. In addition, the annual precipitation distribution is extremely uneven, and 50% of the annual precipitation is concentrated in summer and often involves heavy rains. Most of Henan province is located in the warm temperate zone, and the south region crosses the subtropical zone. The annual average air temperature is generally between 12 °C and 16 °C. The winter is cold and snowless, the spring is dry and sandy, the summer is hot and rainy, and the autumn is sunny. The cultivated land area of Henan province is 71.792 million hectares, accounting for about 55.7% of the study area. As a major agricultural province, Henan province has encountered serious impacts on the ecological environment due to climate change and the rapid increase in population in recent years, and water resources is extremely tight [39]. The contradiction between water supply and demand has become the main factor that restricts sustainable economic developments. Therefore, for understanding the impact of climate change, water cycle, and human activities on the ecosystem, it is of great importance to accurately elaborate the temporal and spatial characteristic changes of ET and discuss the response relationship with climate and land-use changes.
2.2. Dataset
The data include remote-sensing data, land-use type data, meteorological data, and surface flux data. MODIS images, which come from NASA (http://ladsweb.nascom.nasa.gov/, 1 May 2021), are the main remote-sensing data, and we use two datasets, including MOD03 and MOD021KM. Bands 1 to 7, 17 to 19, and 31 and 32 of MODIS images are selected to retrieve the ground parameters, and the specific calculation performed include completing the radiance conversion in the Integrated Land and Water Information System (ILWIS) software, retrieving the water vapor content and brightness temperature, carrying out atmospheric correction and acquiring the normalized vegetation index (NDVI), the NDWI, land surface temperature, emissivity, and albedo. The land-use type data come from the Resource Data Center of the Chinese Academy of Sciences and are mainly used for analyzing the temporal and spatial evolution of ET in Henan province. The weather-driven data are from the Weather Research and Forecasting Model (WRF model), and the output meteorological data have a time resolution of 1 hour and a spatial resolution of 1 km, which compares well with ground weather station observations [41].
The EC data used for the verification of ET estimations are supplied by the HiWATER (Heihe Watershed Allied Telemetry Experimental Research) experiment, which is designed to address problems including heterogeneity, uncertainty, scaling, and closing of the water cycle at the watershed scale from an interdisciplinary perspective and is a watershed-scale eco-hydrological experiment. The surface flux measurements are processed into a half-hour time step and undergo strict data quality control using EdiRe software, which is developed by the University of Edinburgh and is one of the popular software packages for processing surface micrometeorological flux data [42]. The HiWATER experiment data can be acquired by submitting applications to the National Tibetan Plateau/Third Pole Environment Data Center data center in Beijing, China (https://data.tpdc.ac.cn/en/data, 6 March 2021). In addition, it is possible for readers to access another website with a document that indicates the ftp and an http address of HiWATER experiment data (http://www.wds-china.org/info/945e7, 6 March 2021).
3. Methods
3.1. The Improvement of MOD16 Model
The MOD16 mode, a typical representative of the coupling of the P-M equation and remote-sensing data, has a rigorous physical mechanism and meaning, and hence good applicability. The basic algorithm is as follows [23,43]
where is the daily evapotanspiration; is latent heat of evaporation, J/kg; is available energy partitioned among sensible heat, latent heat, and soil heat fluxes on land surface, MJ/m2/d; is the slope of the curve relating saturated water vapor pressure () to temperature; is the variable vapor pressure, Pa; is the air density, kg/m3, is the heat capacity of the air, MJ/kg/°C; is aerodynamic resistance, s/m; is the surface resistance, s/m; and γ is the psychrometric constant (0.066 kPa °C−1); is the potential ET. In Formula (1), available energy, is calculated as follows:
where , and are sensible heat flux, latent heat flux, and soil heat flux, respectively. The units of the four items are W/m2.
The MOD16 model divides ground surface into wet soil surface, dry soil surface, wet vegetation surface, and dry vegetation surface. According to Fisher et al., the dry and wet surface can be differentiated by RH, and the vegetation and soil area can be distinguished by vegetation coverage [44]. The daily ET is the sum of four parts that are surface evaporation of wet soil, ETwet-S; surface evaporation of dry soil, ETdry-S; surface evaporation of wet vegetation canopy, ETwet-C; and surface transpiration of dry vegetation, ETtran.
The MOD16 model uses the RH and VPD to describe the soil moisture process, and indirectly considers the impact of soil moisture. Although the VPD and RH can represent soil moisture state to a certain extent, there are some problems: (1) the variation trend of VPD or RH is not consistent with the variation trend of soil moisture; (2) VPD or RH is affected by atmospheric conditions greater than soil moisture when advection occurs. As the source of ET, soil moisture plays an important role in calculating the canopy resistance and soil resistance parameters, and hence deficient consideration of this factor is likely to cause errors in estimating ET [27]. Hence, this study attempted to utilize the NDWI to construct the soil moisture adjustment factor, which can be regarded as an additional item of parameters closely related to soil moisture in the MOD16 model, and realized the purpose of improving the model.
Since the surface evaporations of wet soil and wet vegetation canopy can be considered as having sufficient water supply and are not limited by soil moisture, the improvement of the study mainly focuses on the evaporation of the dry soil surface, ETdry-S, and the transpiration of dry vegetation canopy, ETtran. The following only lists the formulas closely related to the improvement. For specific details of the MOD16 model, readers can refer to Mu et al. [23,43].
For dry soil surfaces, the MOD16 model assumes that RH and VPD can describe the information of soil moisture content, and obtains the evaporation of the dry soil surface, ETdry-S, through the evaporation complementarity theory,
In the formula, Asoil is the available energy of the soil surface, MJ/m2/d; fc is the vegetation coverage; VPD is water vapor deficit; fwet is the proportion of wet area; rss is the soil surface resistance, s/m; and β is the adjustment coefficient of VPD, which is an empirical constant and its value is 0.2 kPa in the MOD16 model.
For dry vegetation canopy, the transpiration process can be described as follows: the root system absorbs water from the soil, transports water to the leaves through the tube in the plant, and water escapes to the atmosphere through stomata behavior. Therefore, the transpiration rate is affected by both the canopy conductance, Gc (the inverse of the canopy resistance, rc) and the aerodynamic conductance (the inverse of the aerodynamic resistance, ra). Dry vegetation canopy transpiration, ETtran, can be expressed by the following formula:
In the formula, Ac is the available energy of the vegetation area, MJ/m2/d; the canopy conductance, Gc, can be expressed by the following formula,
where gs is the conductance of the leaf boundary layer, m/s; is the stomatal conductance determined by the MOD16 algorithm, m/s; gcu is the conductance of the stratum corneum, m/s; and LAI is the leaf area index.
For dry soil surface evaporation, ETdry-S, and dry vegetation canopy transpiration, ETtran, parameters closely connected with soil moisture information are soil surface resistance, rss, and stomatal conductance, , respectively. Therefore, this paper proposes the soil moisture adjustment factor, Fsm, as an additional item of the above two parameters to express the influence of soil moisture on the occurrences of ET from the dry soil and dry canopy surfaces. If the soil moisture is sufficient, the change in water content will not cause significant variations in ET, and the soil moisture adjustment factor, Fsm, has little effect on the soil surface resistance and stomatal conductance. If water stress occurs, the soil moisture adjustment factor, Fsm, should reflect the restrictive effect of soil water content [3]. Based on the above theory, the sigmoid-type function is adopted to construct the relationship between soil moisture and soil moisture adjustment factor, Fsm. With the purpose of improving the ET estimations under water stress circumstances, the NDWI, which reflects the soil dryness and wetness, is integrated into the MOD16 model. The functional relationship based on the sigmoid-type function is as follows:
where a, b, and c are the coefficients of a sigmoid-type function, which can be determined by the smallest error function between ET observations and estimations. In Formula (6), the NDWI is calculated as:
where is the reflectivity at the near-infrared band, and is the reflectivity at the middle-infrared band.
Therefore, the improved soil surface resistance, rss-adjust, and the improved stomatal conductance, , can be expressed as:
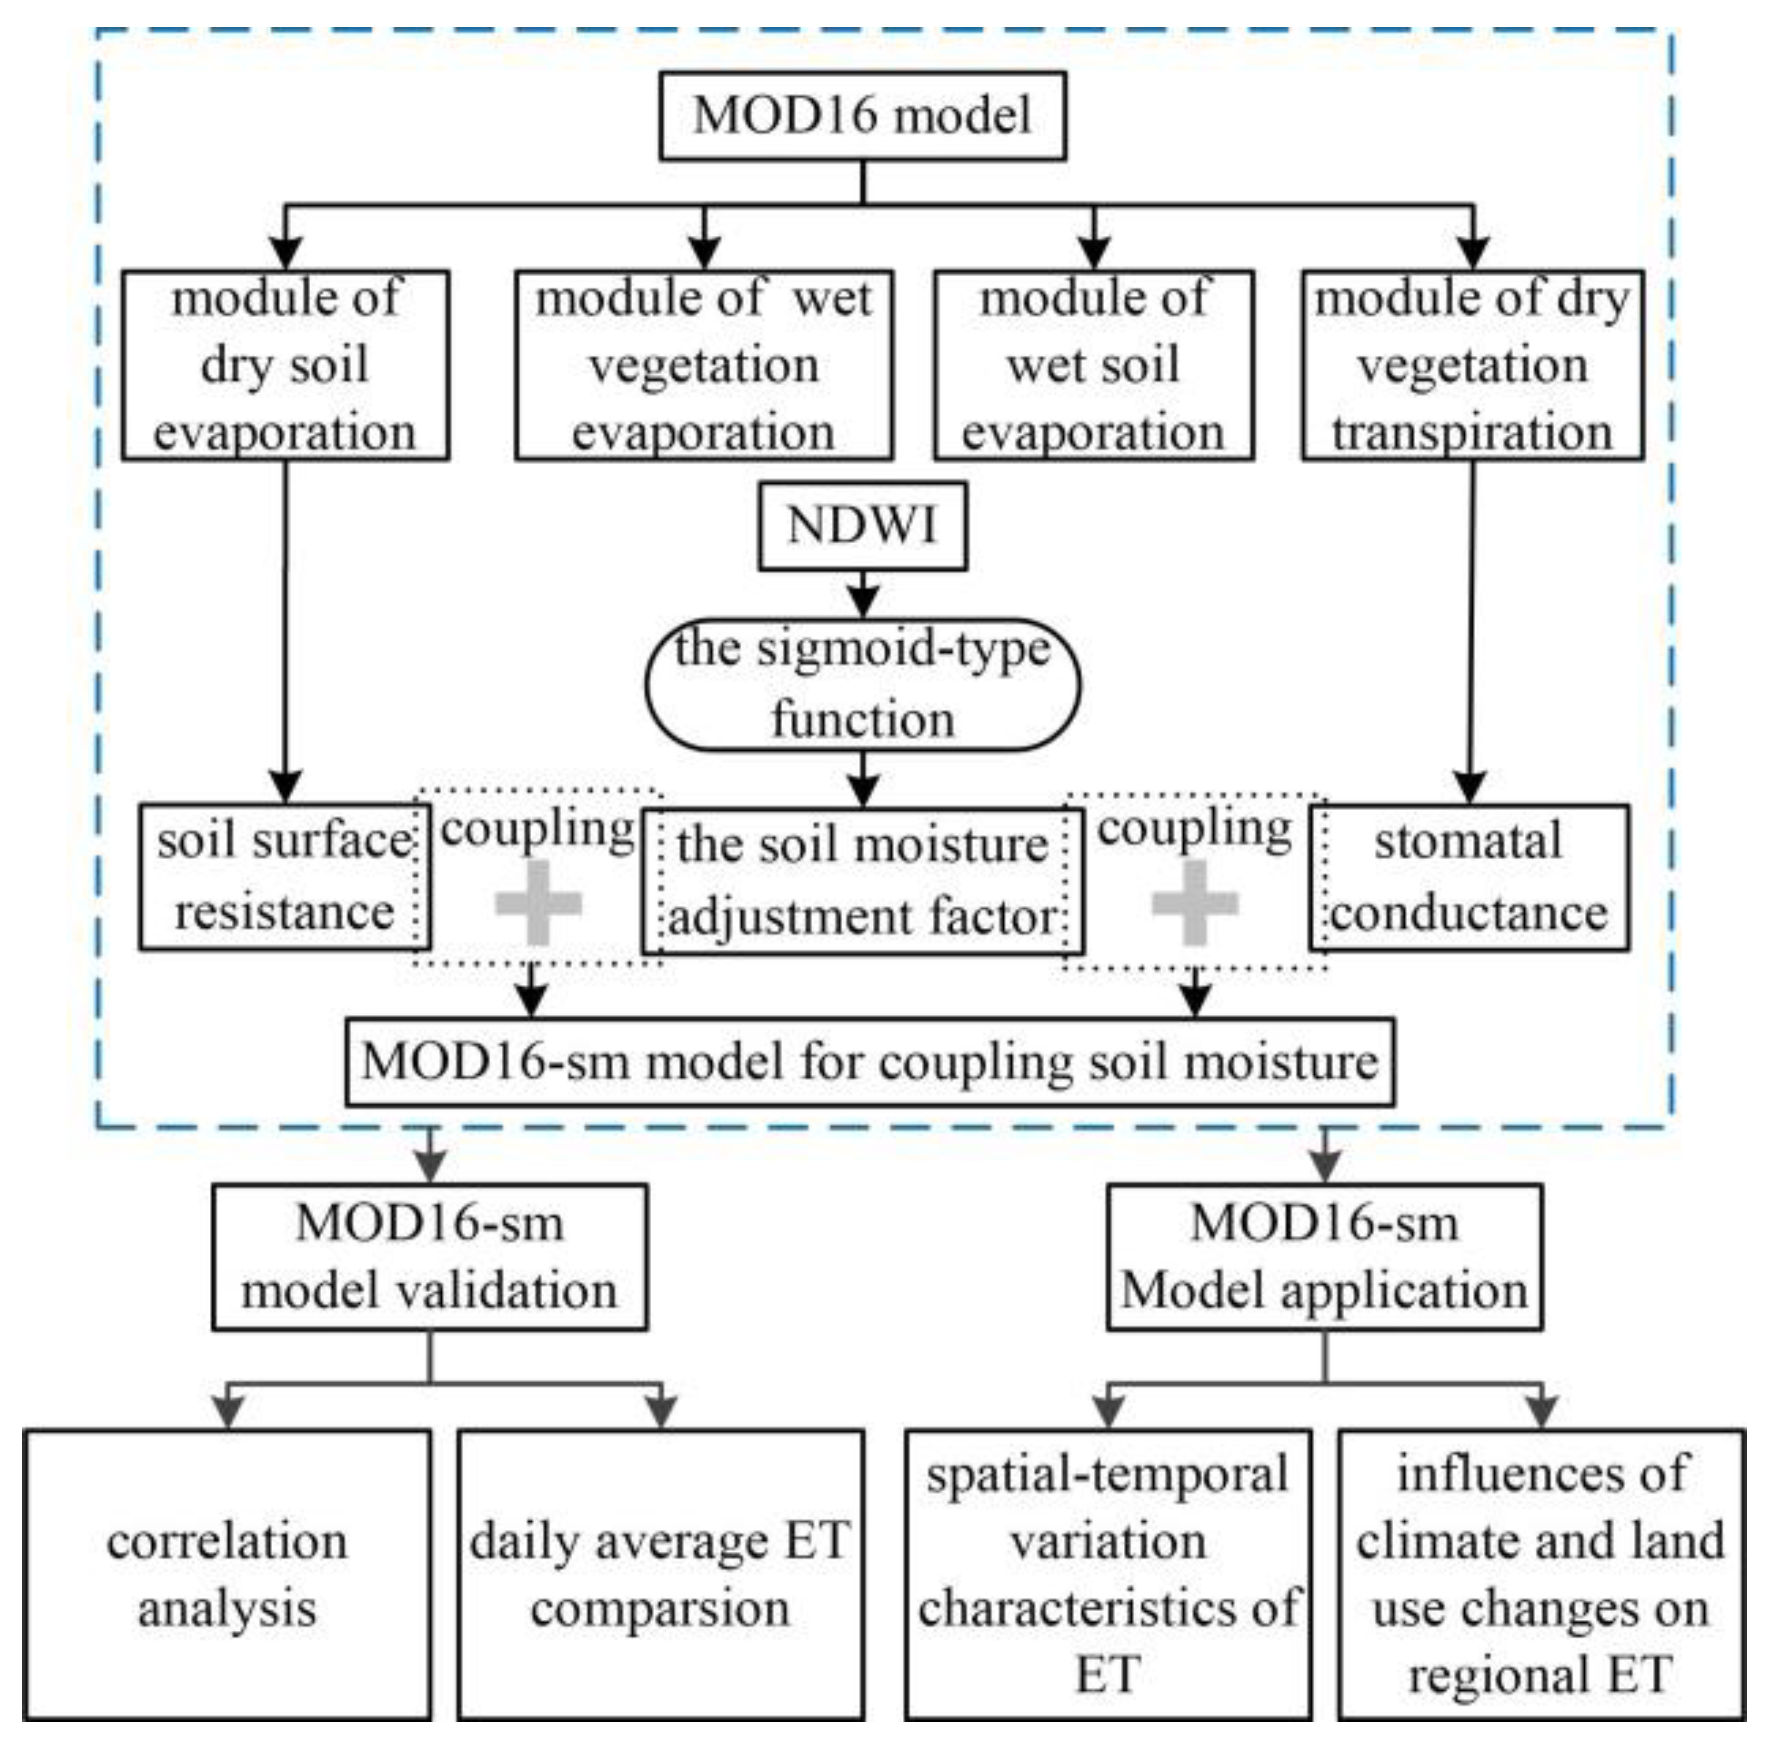
The flowchart coupling the soil moisture adjustment factor to improve the MOD16 model is shown in Figure 2 and the improved MOD16 model is named the MOD16-sm model.
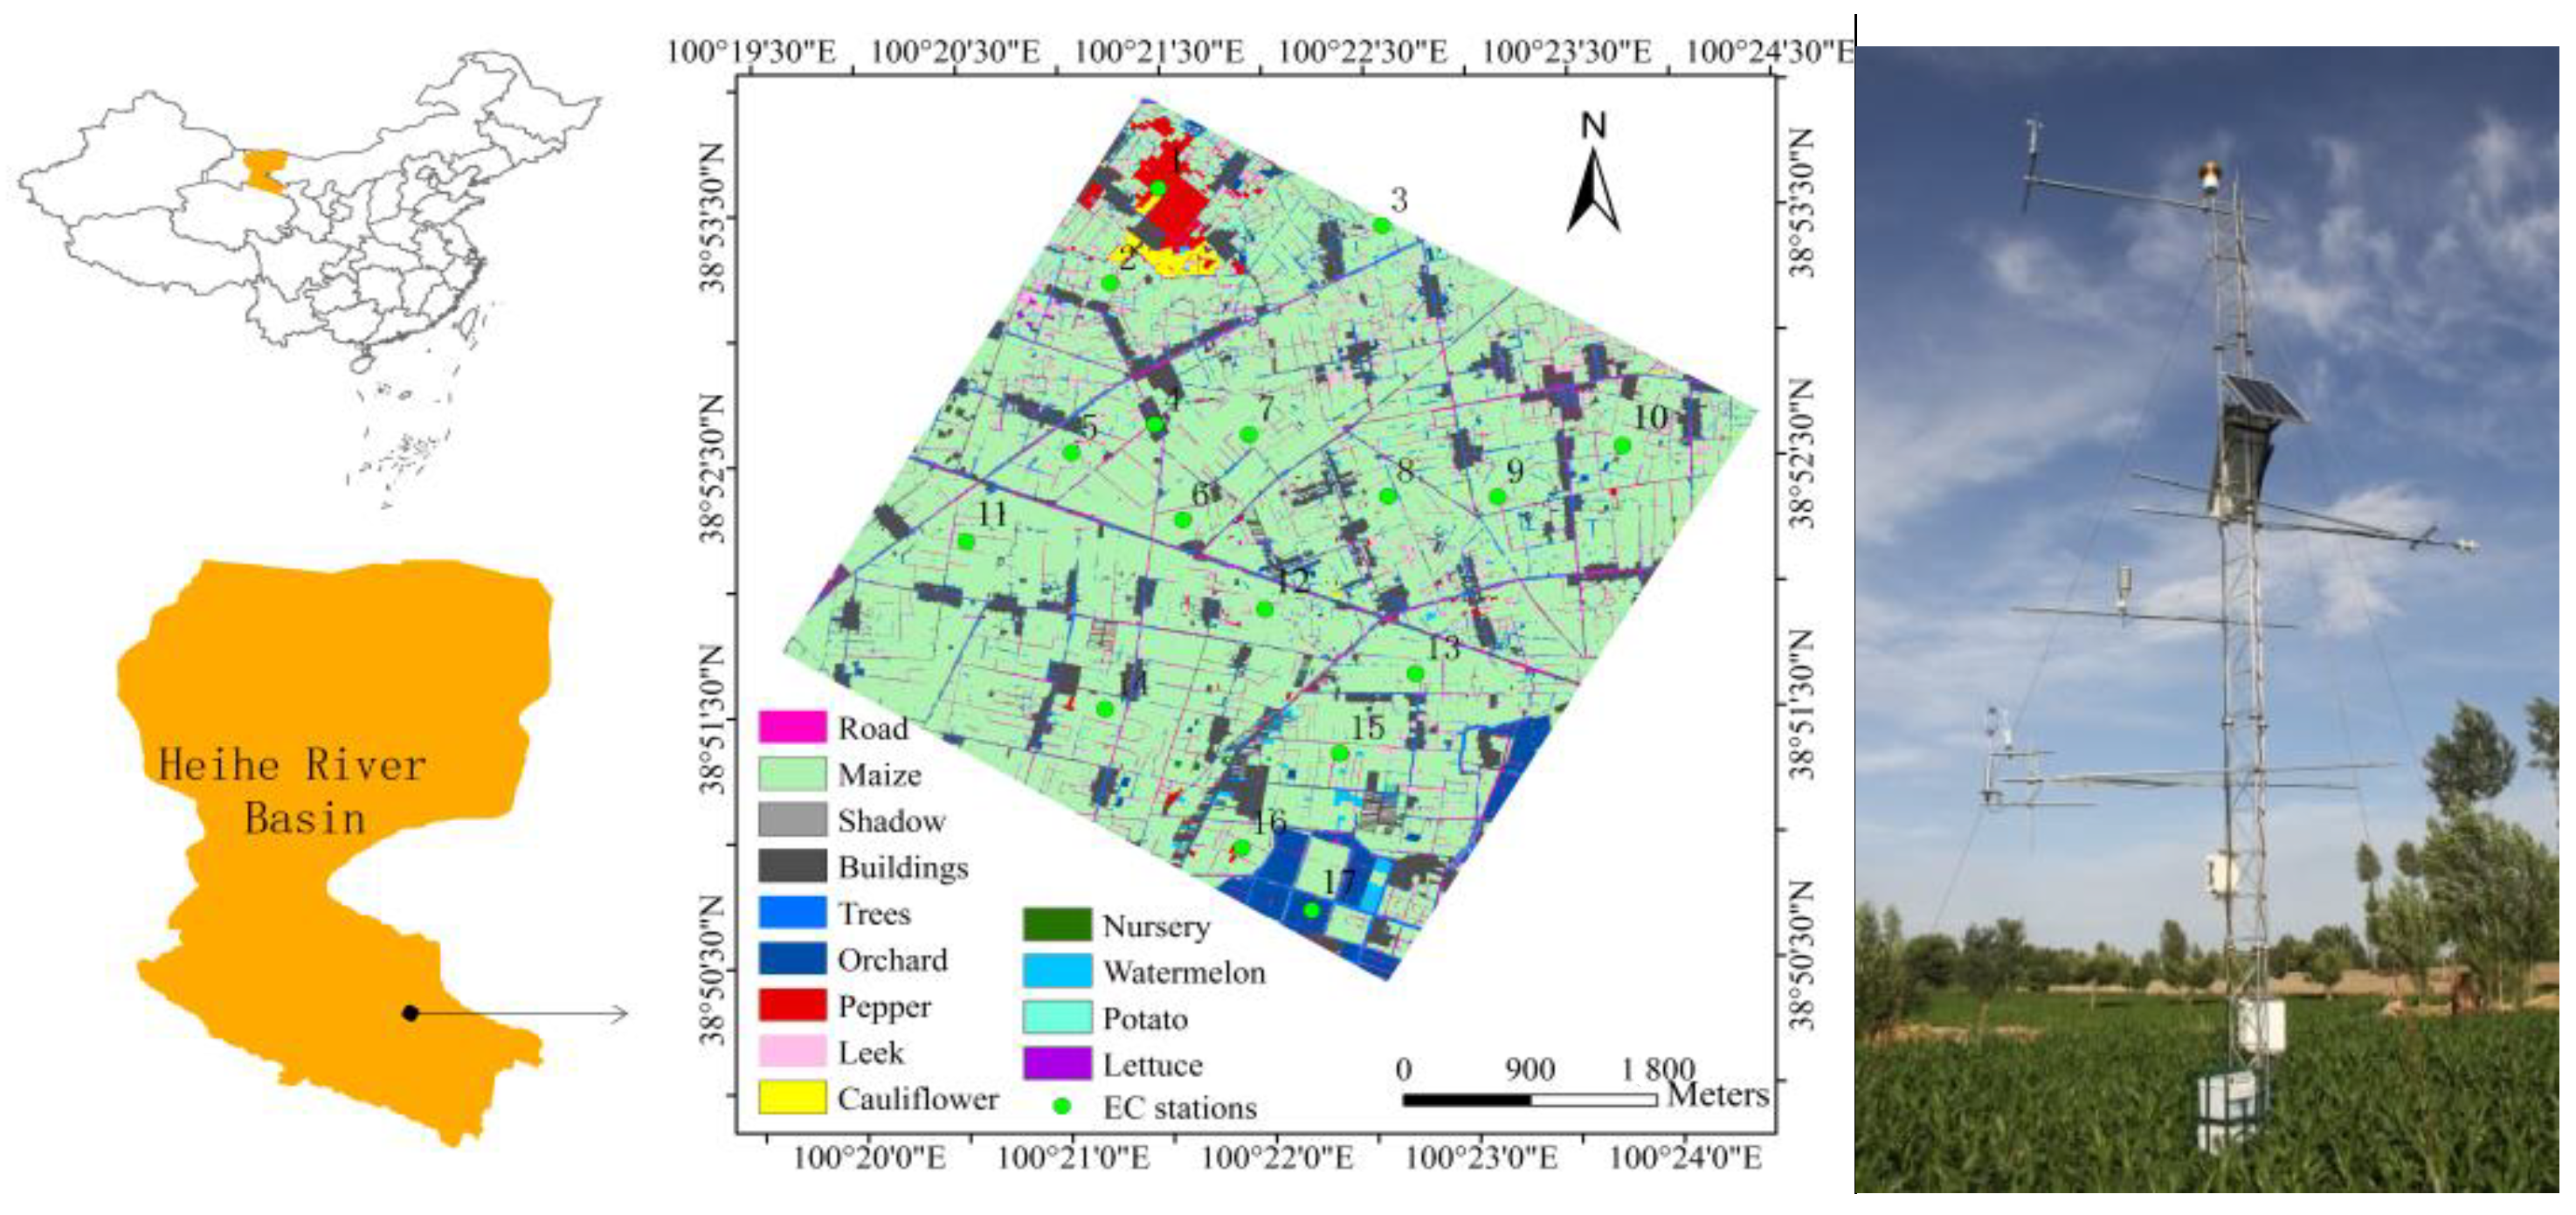
To test the model performance of the improvements, ET estimates retrieved by the MOD16 and MOD16-sm model were validated against measurements of ground-based EC stations. The study used the coefficient of determination (R2), the root mean square error (RMSE), mean absolute error (MAE), and Nash–Sutcliffe efficiency coefficient (NSE) as model performance metrics. In this study, the EC observations utilized for model validation were from the HiWATER experiment [39], which was performed with the support of the National Natural Science Foundation of China and conducted in the middle reaches of the Heihe River in northeast China, 2012, and can provide sufficient surface fluxes and relevant parameters. Hence, we can ensure the accuracy of model verification. Figure 3 shows the core test area of the HiWATER experiment. Automatic weather stations and EC stations were installed in the test area. To ensure the rationality of the validation, we utilized EC stations with different underlying surfaces, which were EC1 (with vegetation), EC4 (with village), EC10 (with maize), and EC17 (with orchard), respectively. Table 1 gives descriptions of four EC stations and dates selected in June (removing missing data and cloudy dates) for verifying the model.
3.2. Inter-Annual ET Trend Analysis
The inter-annual trend of ET in Henan province adopts the unary linear regression analysis method. The slope of the ET trend line, ETslope, represents the inter-annual rate of ET change. We need to obtain the ETslope of each pixel in the study area, and then analyze the spatial evolution law of ET in the study area [45,46] The calculation of ETslope is as follows:
where ETslope is the trend slope of the regression equation of each pixel in the study area from 2000 to 2020; and n is the number of years that the ET spanned (n = 21). Through Equation (10), this can indicate the significance of the inter-annual change trend of ET. ETslope > 0 indicates an increasing trend of inter-annual ET and ETslope < 0 means a decreasing trend of inter-annual ET.
3.3. Correlation Analysis between Climate Factors and ET
Relevant studies at home and abroad show that air temperature and precipitation are the two most important climatic factors in response to regional water and heat changes [47], and hence this paper takes air temperature and precipitation as the main controlling climatic factors affecting the temporal and spatial changes of ET in Henan province to make correlation analysis. Based on the pixel-scale ET (the resolution is 1 km) and spatially interpolated climate factors (precipitation and air temperature, with the resolution 1 km), the correlation analysis of single climate factors is performed [48], and the calculation formula of the correlation coefficient (CC) is as follows:
where CCxy represents the correlation coefficient between variables x and y; xi represents the ET value of year I; yi represents the value of the climate factor in the year i; and and represent average ET and climate factor values during n years.
4. Results
Results can be divided into two parts: one part is the validation of the MOD16-sm model, and the other part is the application of the MOD16-sm model, which focuses on the spatial and temporal characteristics of ET and its response to climate and land-use changes.
4.1. The Validation of the MOD16 and MOD16-sm Models
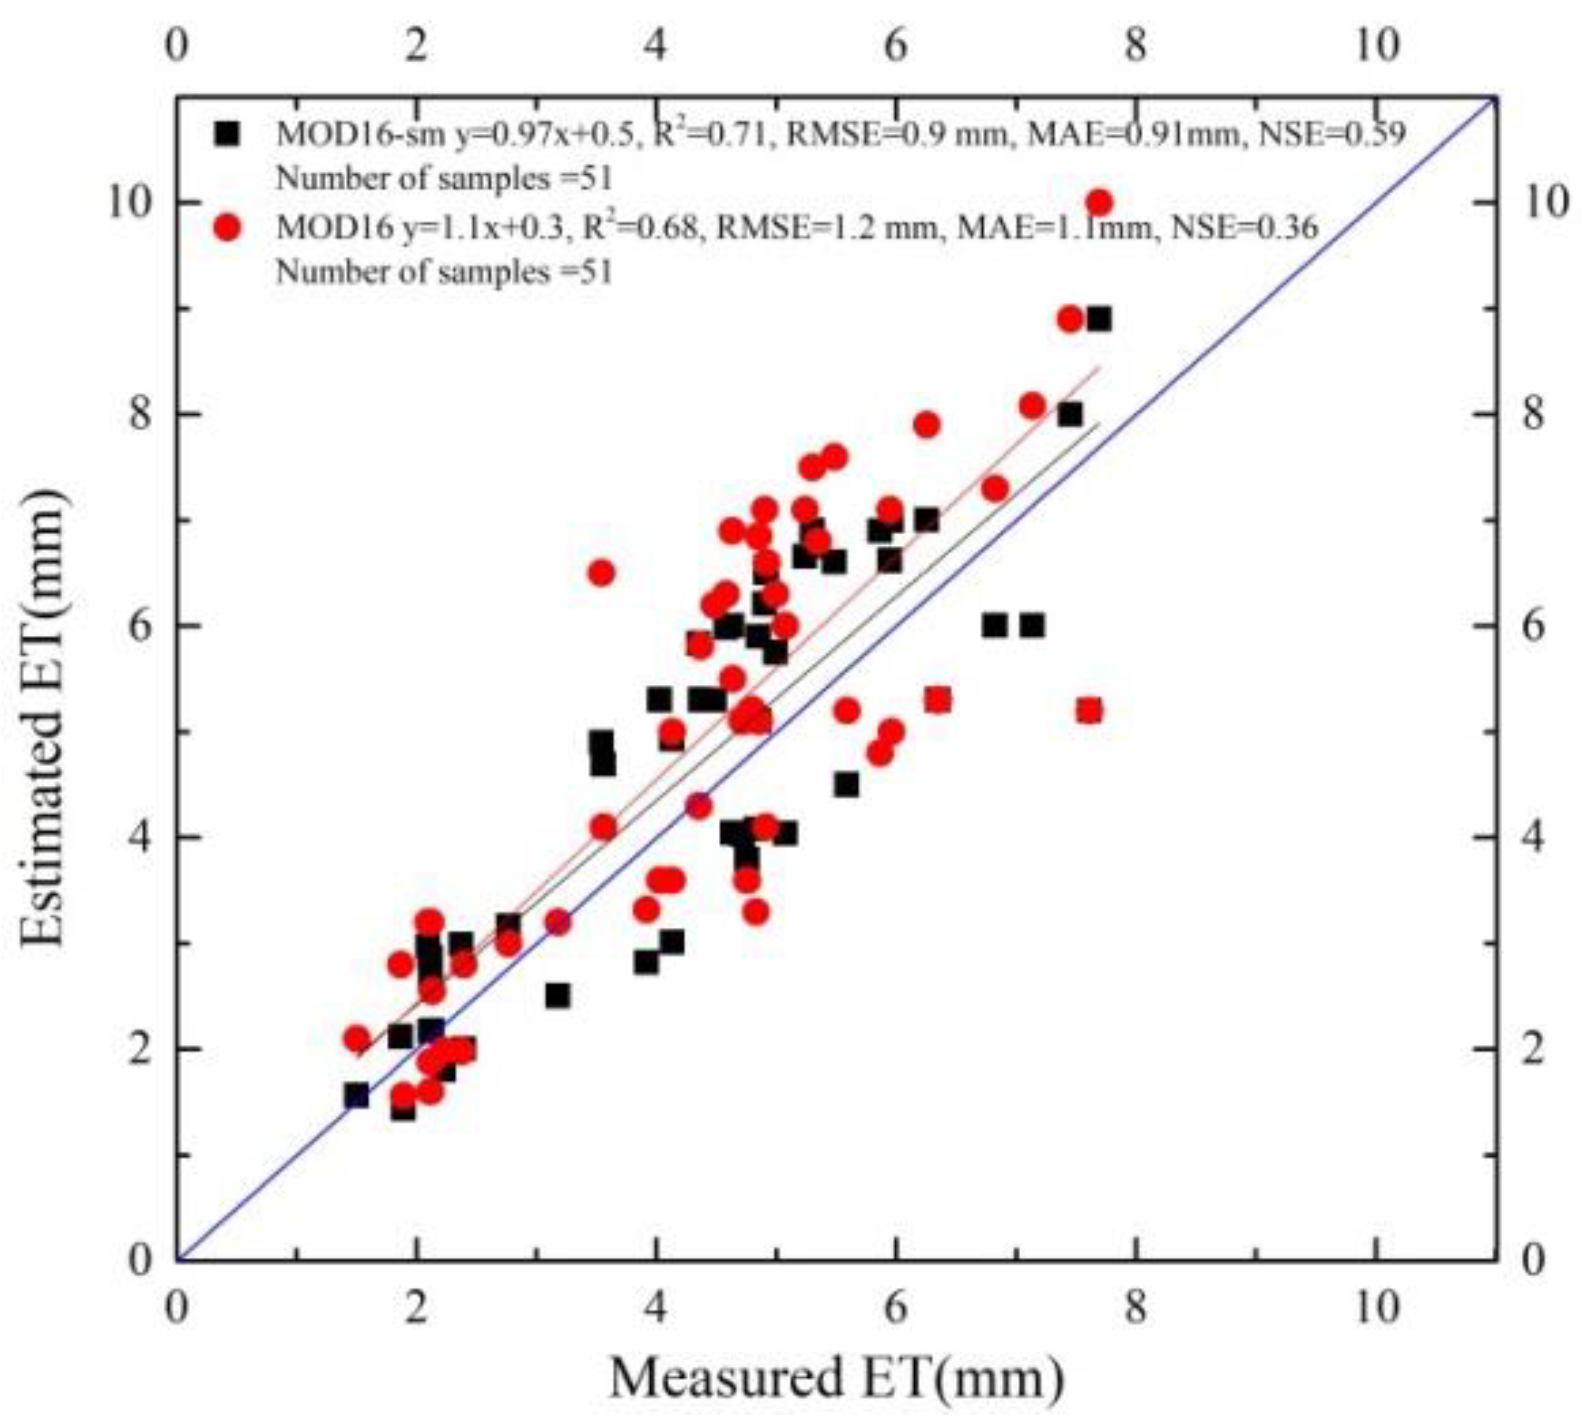
The comparison between daily ET estimates obtained by the MOD16 and MOD16-sm model and measurements from EC stations are displayed in Figure 4. The black points represent the correlation between estimates by the MOD16-sm model and measurements, while the red points denote the correlation between estimates by the MOD16 model and measurements. ET estimates calculated by the improved MOD16 model and the observed ET values were distributed around the 1:1 line, with an R2 of 0.71, an RMSE of 0.9 mm, and an MAE 0.91 mm, which was better than the correlation result between MOD16 estimates and observations with an R2 of 0.68, an RMSE of 1.2 mm, and an MAE of 1.1 mm. As for the NSE, the MOD16-sm model had a value of 0.59, and the MOD16 had a value of 0.36, which means the reliability of the MOD16-sm was high and the overall results of MOD16 were also reliable but the simulation errors were large. Correlation analyses indicated that the improved MOD16-sm model could better reflect the impact of soil water on ET. The MOD16-sm model improves the overestimation of the MOD16 model. The results were consist with previous studies that claimed SEBS would display a large improvement when the soil moisture was integrated explicitly into the calculation [28].
To make further analyses on the MOD16 and MOD16-sm model, comparisons of daily average ET on a monthly scale are displayed in Table 2. Daily average ET values estimated by the MOD16-sm model at the four stations were much closer to measured ET values. Although the difference was slight, the comparison of the long-term series showed that the improved model was better.
4.2. Application Effect Test of the Improved MOD16-sm Model by Applying it in Central China, Henan Province
By using the improved MOD16-sm model, the study retrieved the regional ET of Henan province from 2000 to 2020. The application effect test included three aspects including the temporal and spatial characteristics of ET, the effect from climate change on ET, and the effect from land-use change on ET.
4.2.1. Temporal and Spatial Variation Characteristics of ET Based on the Improved MOD16-sm Model
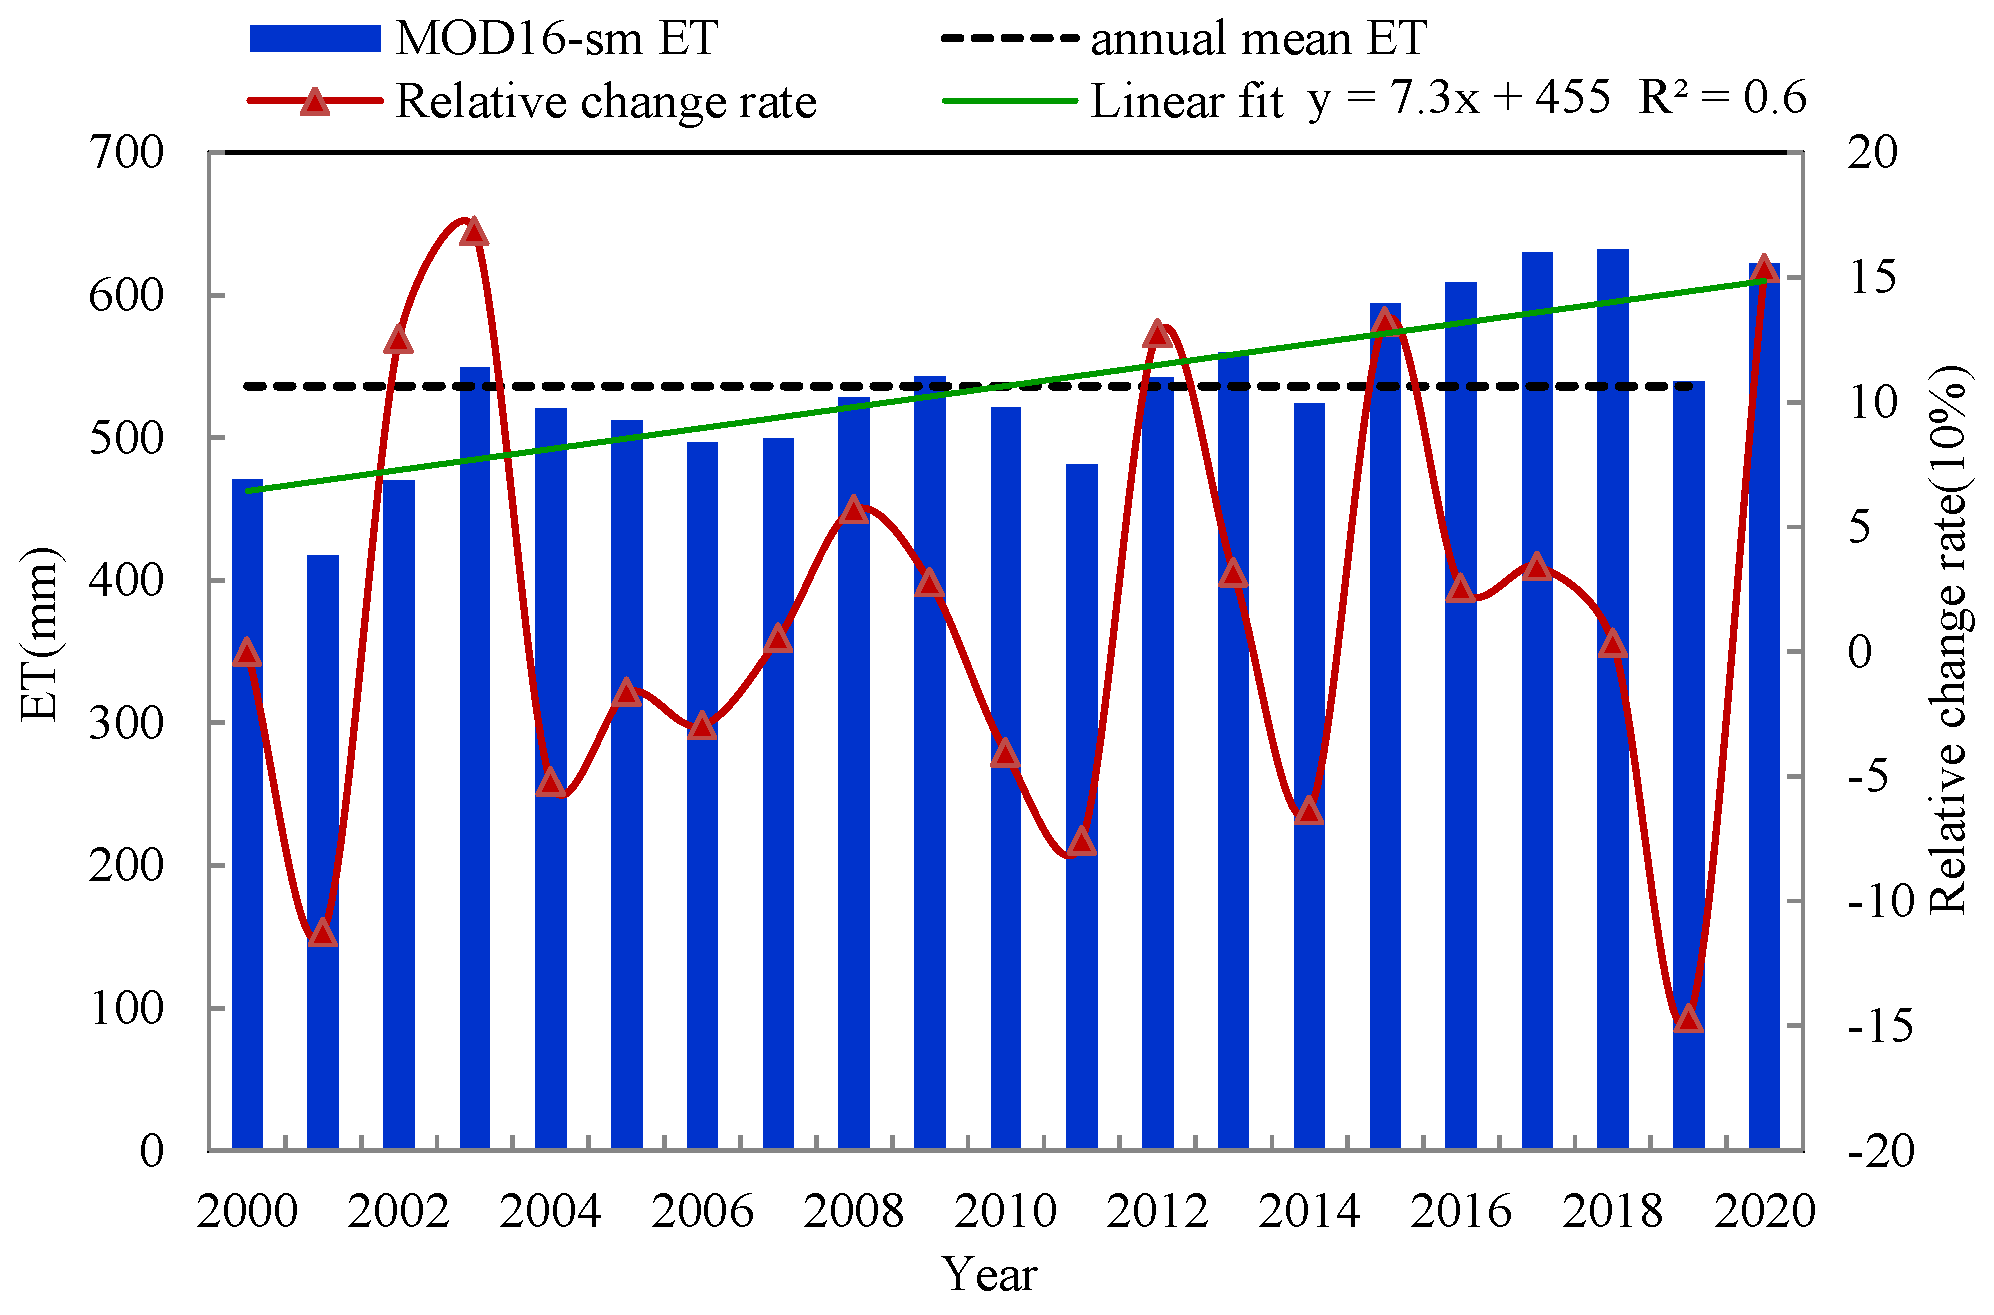
The inter-annual variation in ET (histogram in Figure 5) and the inter-annual relative change rate of ET (dotted line in Figure 5) from 2000 to 2020 are displayed. The fluctuation range of multi-year ET from 2000 to 2020 was 417.7~632.1 mm/a, and the multi-year average ET was 536.3 mm/a (dashed black line in Figure 5). Years in which the annual ET exceeded the multi-year average ET were 2003 (549.3 mm/a), 2009 (542.9 mm/a), 2012 (542.8 mm/a), 2013 (560 mm/a), 2015 (593.8 mm/a), 2016 (609 mm/a), 2017 (629.9 mm/a), 2018 (632.1 mm/a), 2019 (539.2 mm/a), and 2020 (622 mm/a), and the inter-annual difference between the highest (632.1 mm in 2018) and lowest (417.7 mm in 2001) ET values was 214.4 mm, indicating that driving factors of ET were significantly different within Henan province. In different study periods, the fluctuation range of the inter-annual relative change rate of ET was also complex, with the highest (16.8%) in 2003 and the lowest (−14.7%) in 2019, and the average relative change rate of ET was 1.7%, showing a general upward trend, which was consistent with timeseries variation analyses of annual ET (green line in Figure 5) from 2000 to 2020 with a linear fitting R2 of 0.6 showing a positive growth.
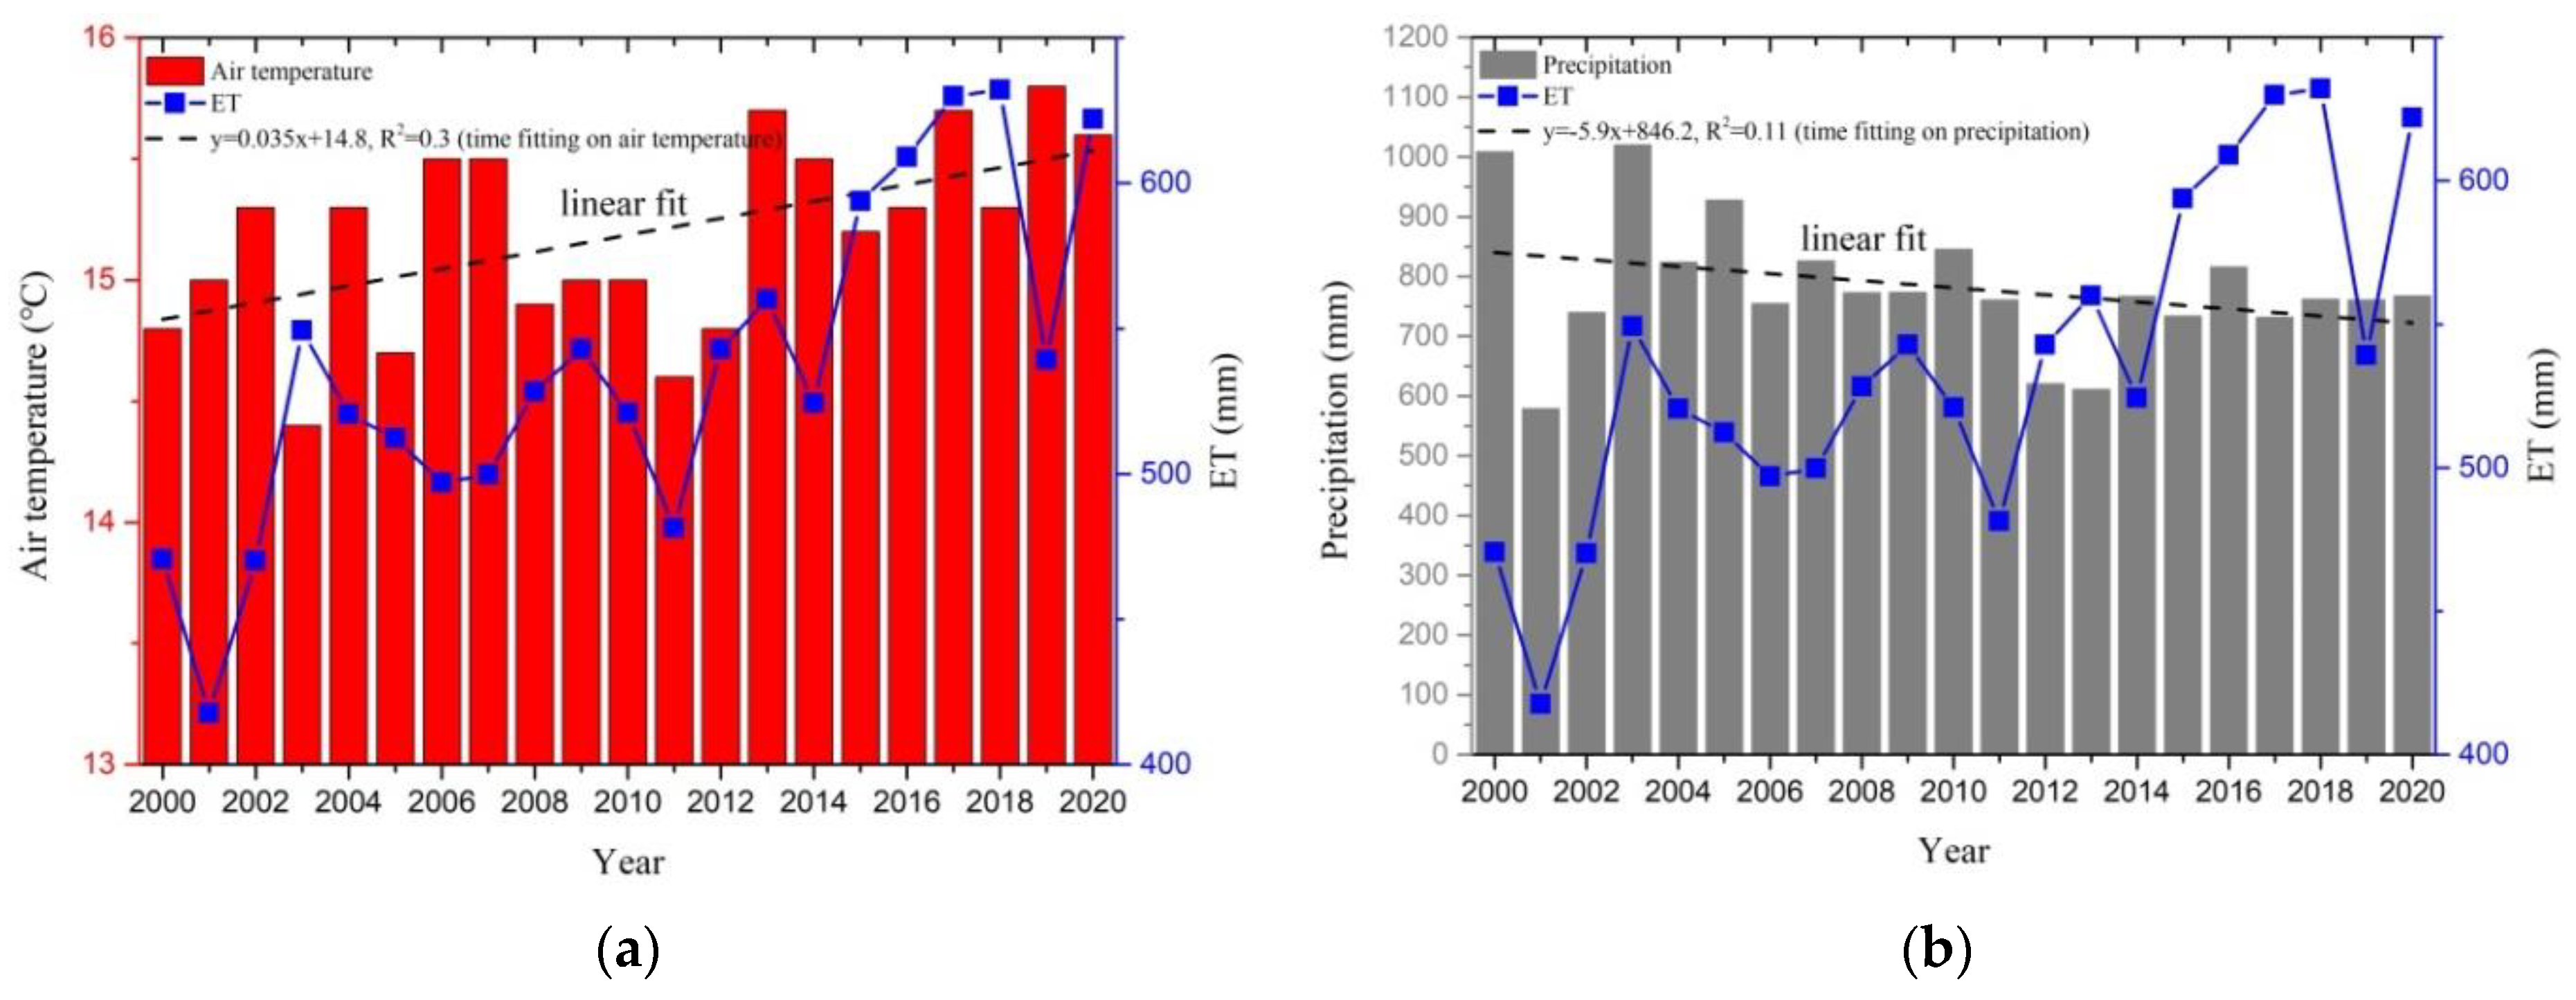
According to the above analyses, it is obvious that the inter-annual variation in overall ET in the study area from 2000 to 2020 showed an increasing trend, and it probably resulted from the climatic factors. Figure 6 shows the interannual variations of the two most important meteorological elements, air temperature and precipitation, from 2000 to 2020. The interannual variation in air temperature (Figure 6a) in the study area displayed a significant upward trend (the linear fit with R2 = 0.3), while the interannual variation in precipitation (Figure 6b) exhibited an inconspicuous trend (the linear fit with R2 = 0.11) which means the annual precipitation in the study area from 2000 to 2020 remained stable. Air temperature and precipitation trends can supply more sufficient thermal-driven and indistinctive water-driven ET compared with the past, and hence the overall ET in the study area displayed apparent increasing trends.
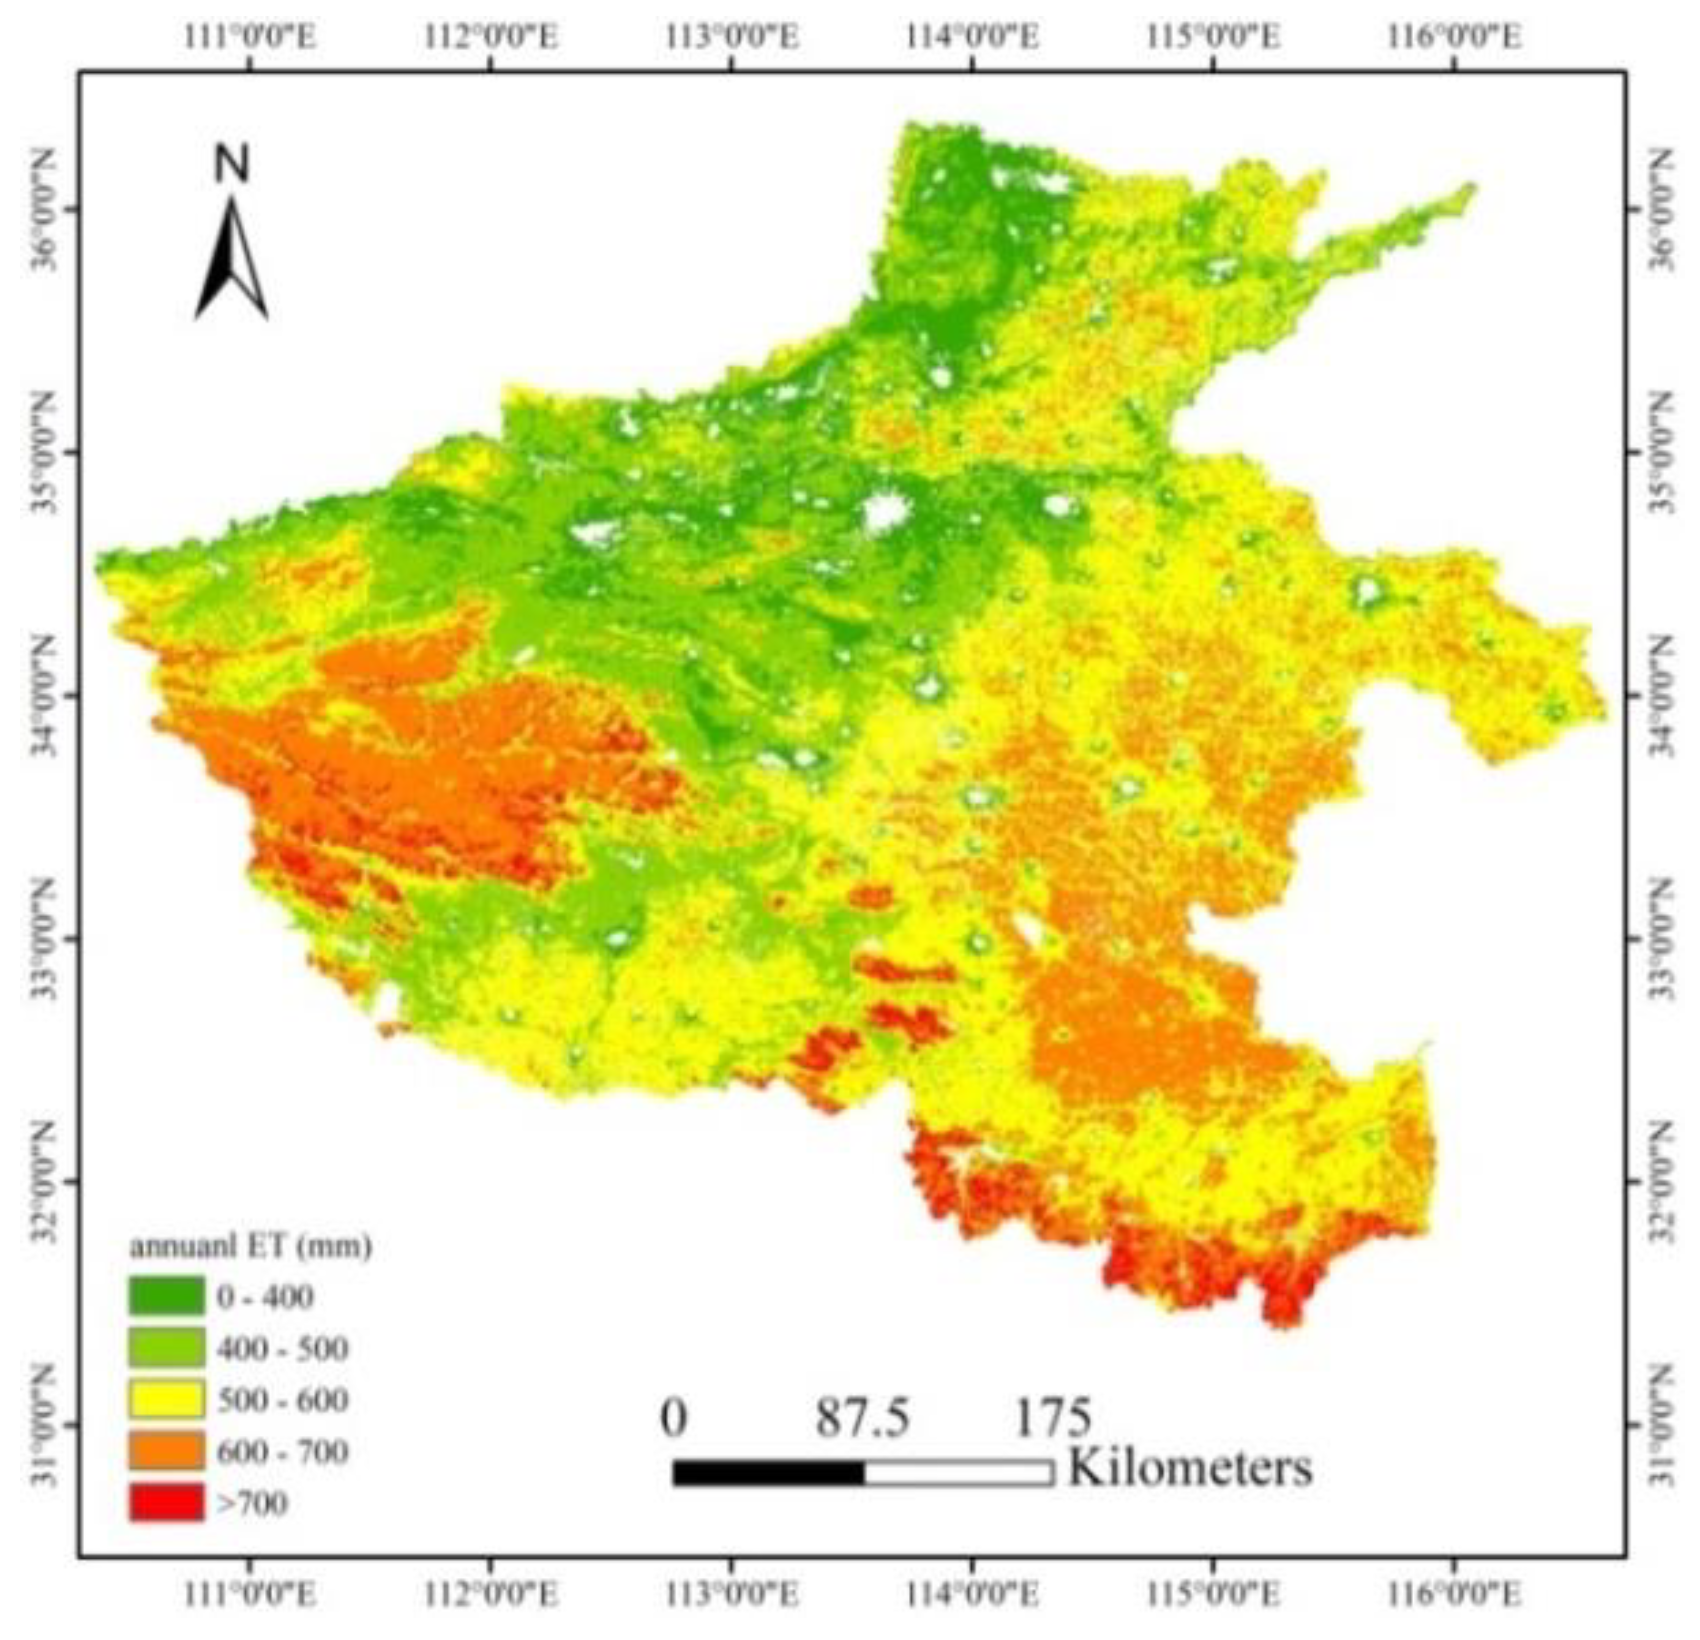
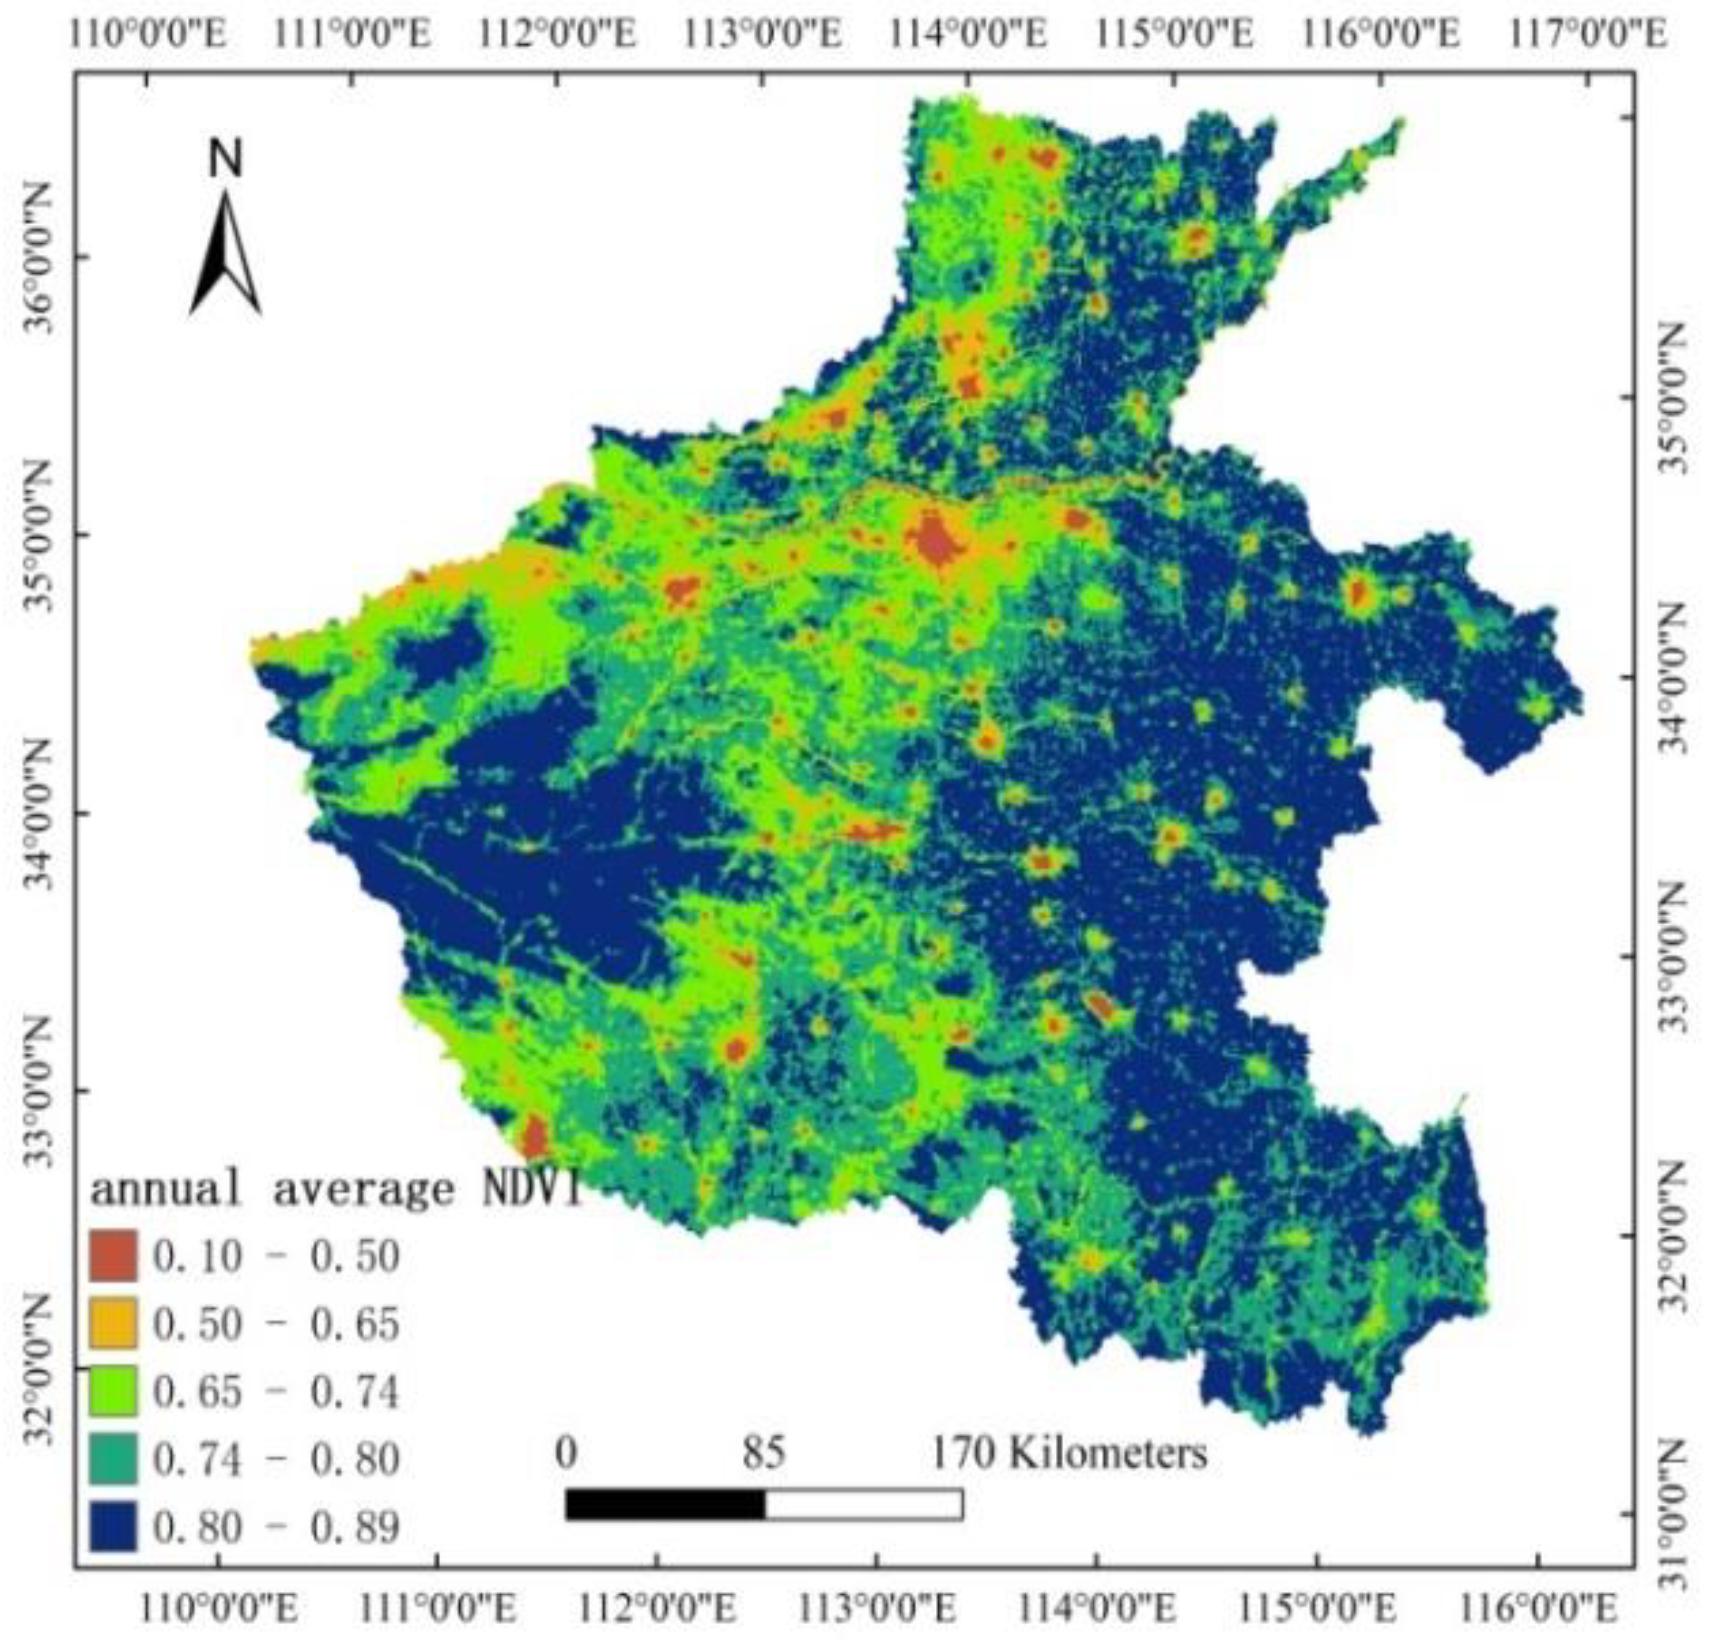
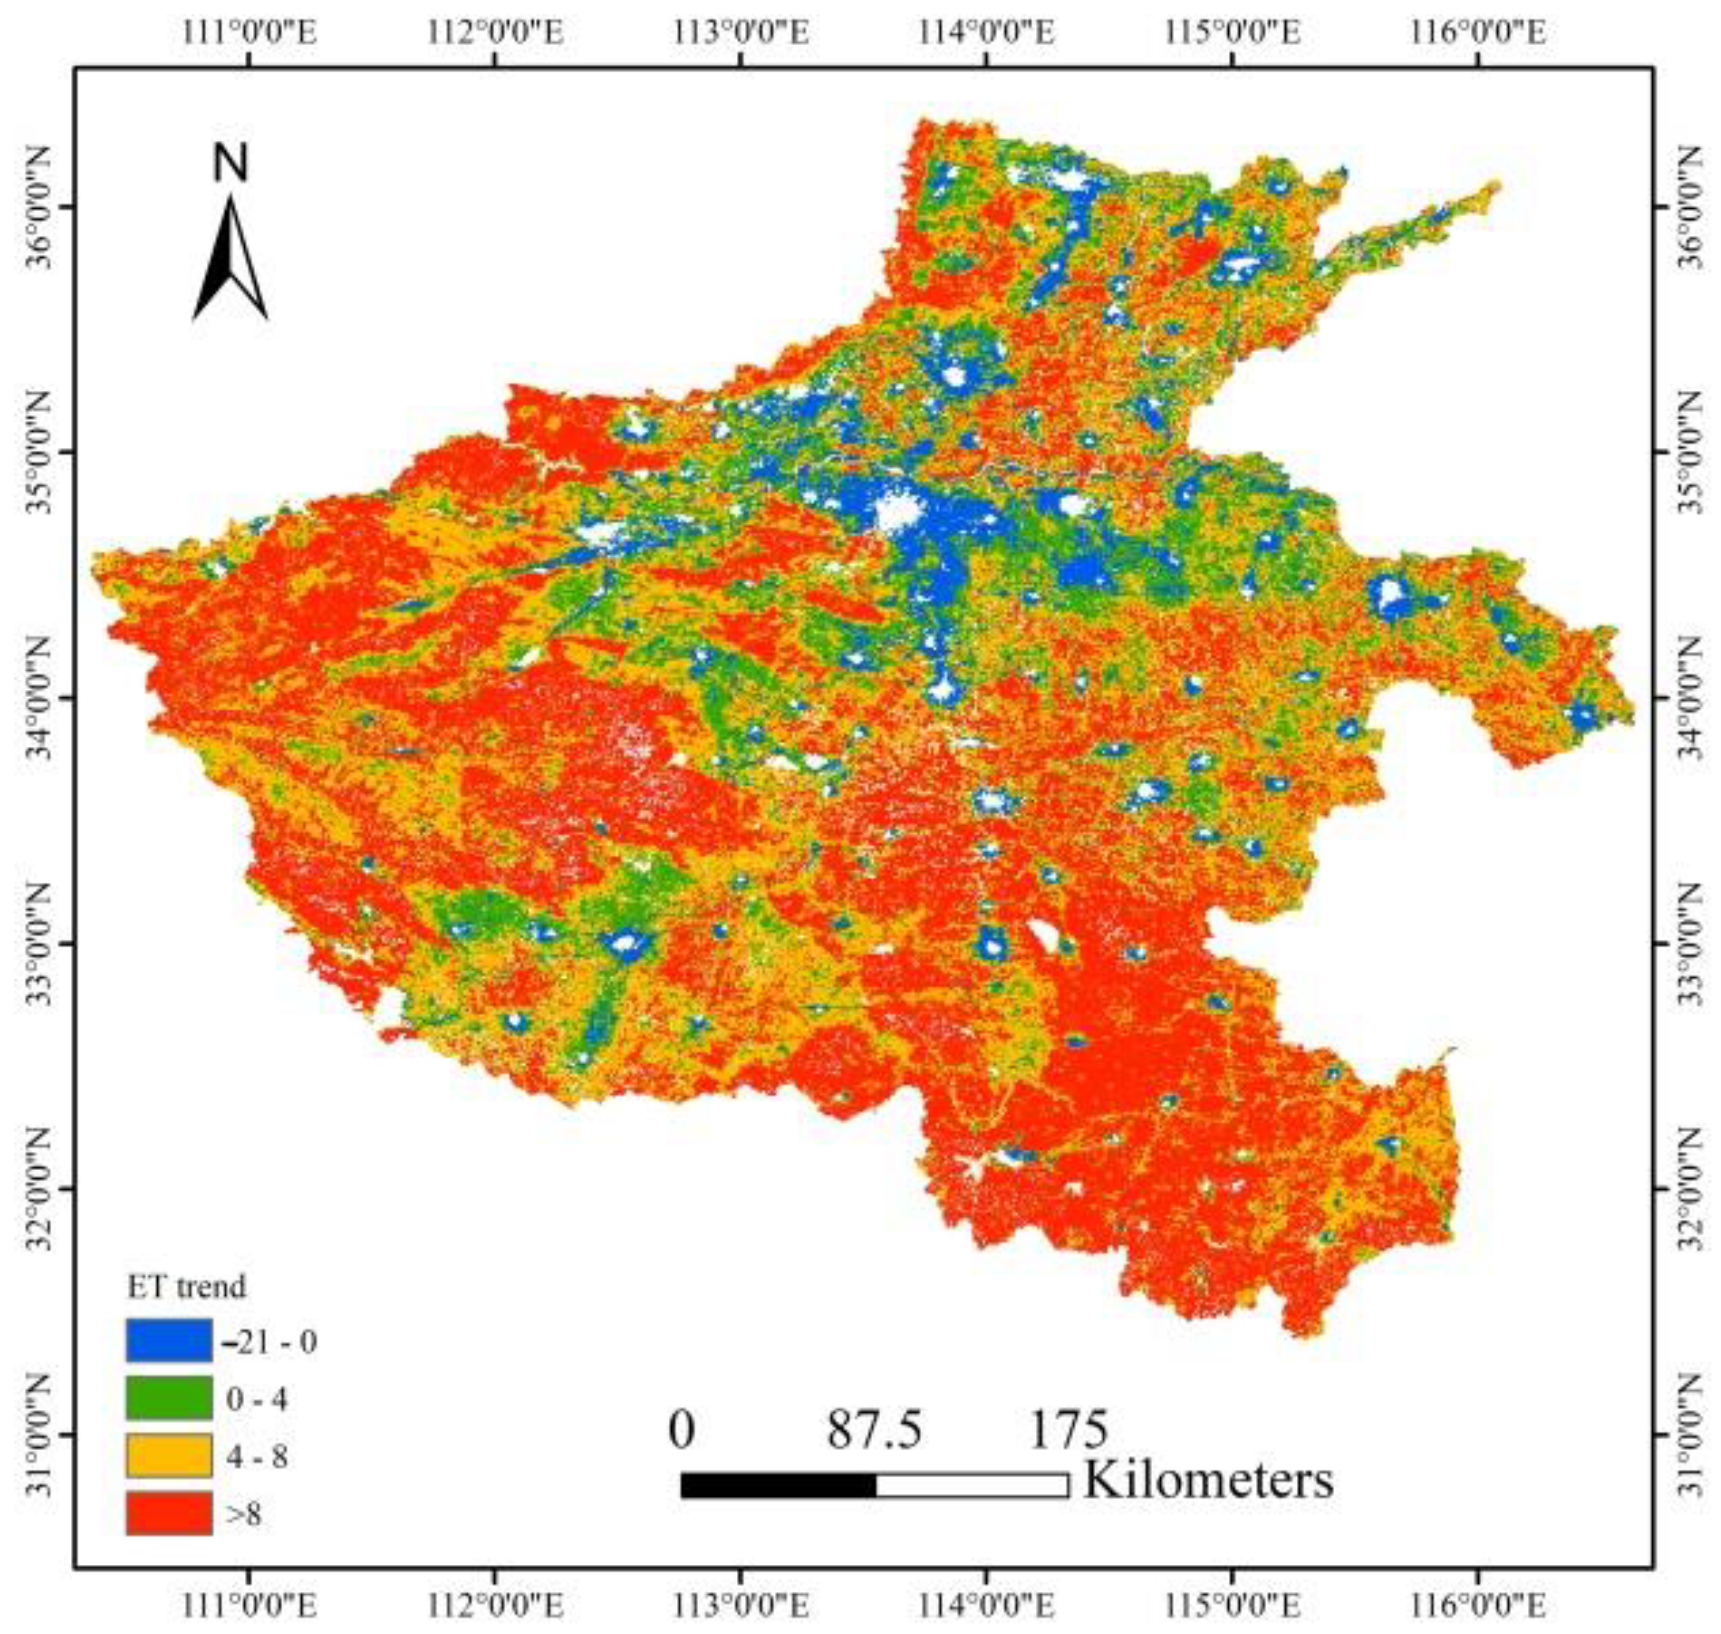
The spatial distribution of multi-year average ET in Henan province from 2000 to 2020 is shown in Figure 7. The annual average ET had obvious spatial distribution characteristics, with high values in the west and southeast and low values in the north. To a certain extent, the spatial distribution of ET had close relation to the uneven distribution of vegetation in Henan province. Areas with low ET values (about 0–400 mm/a) always appeared in the north where the vegetation coverage was relatively low (as is shown in Figure 8). In addition, the vegetation coverage of the provincial capital, Zhengzhou, was decreasing year by year due to rapid economic development and more frequent human activities, and hence, ET values in Zhengzhou were relatively low. Areas with high ET values (above 600–700 mm/a) were mostly concentrated in the west and southeast where there were mountain and field areas, and the vegetation coverage in these areas can reach 0.8. The spatial distribution of the ET trend in Henan province from 2000 to 2020 is shown in Figure 9. According to the ET trend slope of regression equation (10), the trend of ET was divided into three categories: significantly decreasing trend (−21 < ET trend ≤ 0), no obvious change (0 < ET trend ≤ 4 and 4 < ET trend ≤ 8), and slightly increasing trend (8 < ET trend). Among them, the areas with an increasing ET trend were mainly distributed in the west and southeast which belonged to the mountain forest and farmland areas with high vegetation coverage. However, the increasing trend was not obvious. The decreasing trend areas showed a “scattered distribution,” and by combining them with the land-use map, we can find that the main reason for the decrease was the population density and urbanization effects. The ET trend in most areas had no obvious changes, and therefore the inter-annual ET changes were relatively stable. In general, the average inter-annual change rate of ET in Henan province over the past 21 years was 3.4 mm/a, and the overall trend was increasing.
4.2.2. Impacts of Climate Change on ET
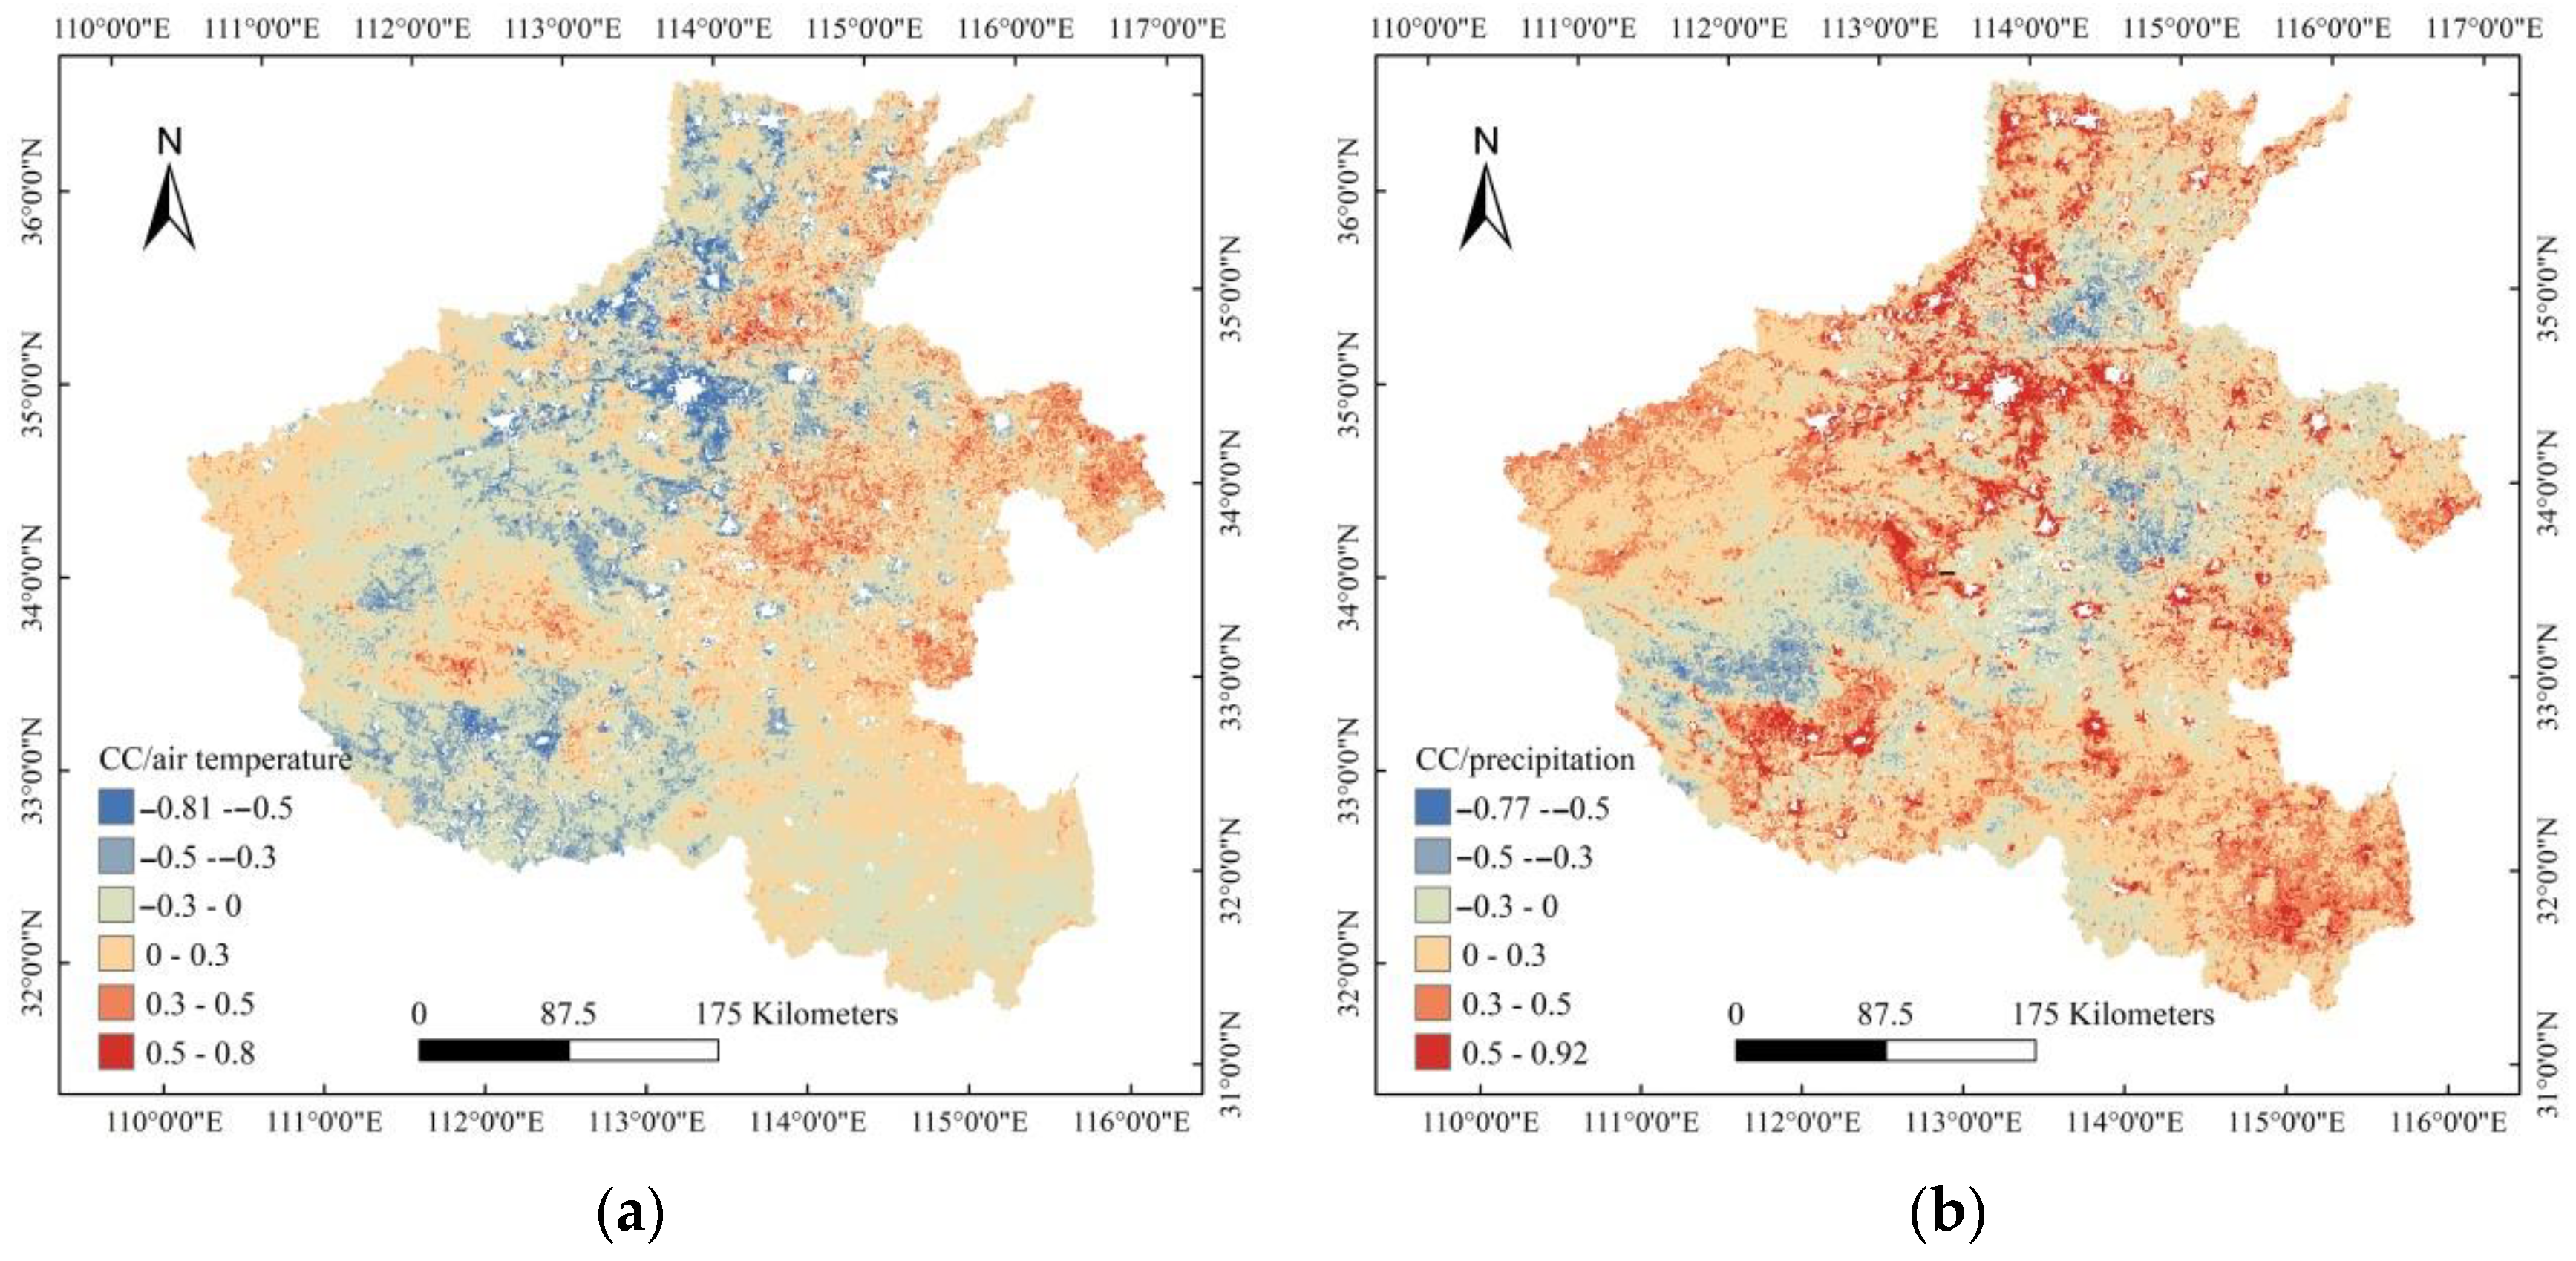
According to Equation (11), the spatial distributions of correlation coefficients between ET and climatic factors (air temperature and precipitation) on the pixel scale from 2000 to 2020 in Henan province are shown in Figure 10. Based on statistical analyses, it can be seen that the correlation coefficient between ET and air temperature was −0.81~0.8, and the average correlation coefficient all over the region was −0.03, which can be considered as having no correlation; the correlation coefficient between ET and precipitation was −0.77~0.92 and the average correlation coefficient all over the region was 0.13, showing a positive correlation. The statistical analyses of the correlation between ET and climatic factors (air temperature and precipitation) are displayed in Table 3. Combining Figure 10 and Table 3, we can see that the areas where ET was positively correlated with air temperature and precipitation account for 47.99% and 70.17% of the total area, respectively; the areas where ET was negatively correlated with air temperature and precipitation account for 52.01% and 29.83%, respectively. Therefore, ET had a stronger positive correlation with precipitation and ET in most areas was positively correlated with precipitation, and the negatively correlated areas between ET and precipitation were mainly scattered in the central and western parts of Henan province. However, ET had negative correlations with air temperature in most areas and the positively correlated areas between ET and air temperature were mainly distributed in the west, east, northeast, and southeast. As for regions in which ET had positive or negative correlations with air temperature and meanwhile had consistent correlations with precipitation, it had no significant regional characteristics, further indicating that precipitation and air temperature were important climatic factors that affected the temporal and spatial distribution of regional ET in Henan province.
4.2.3. Impacts of Land-use Change on ET
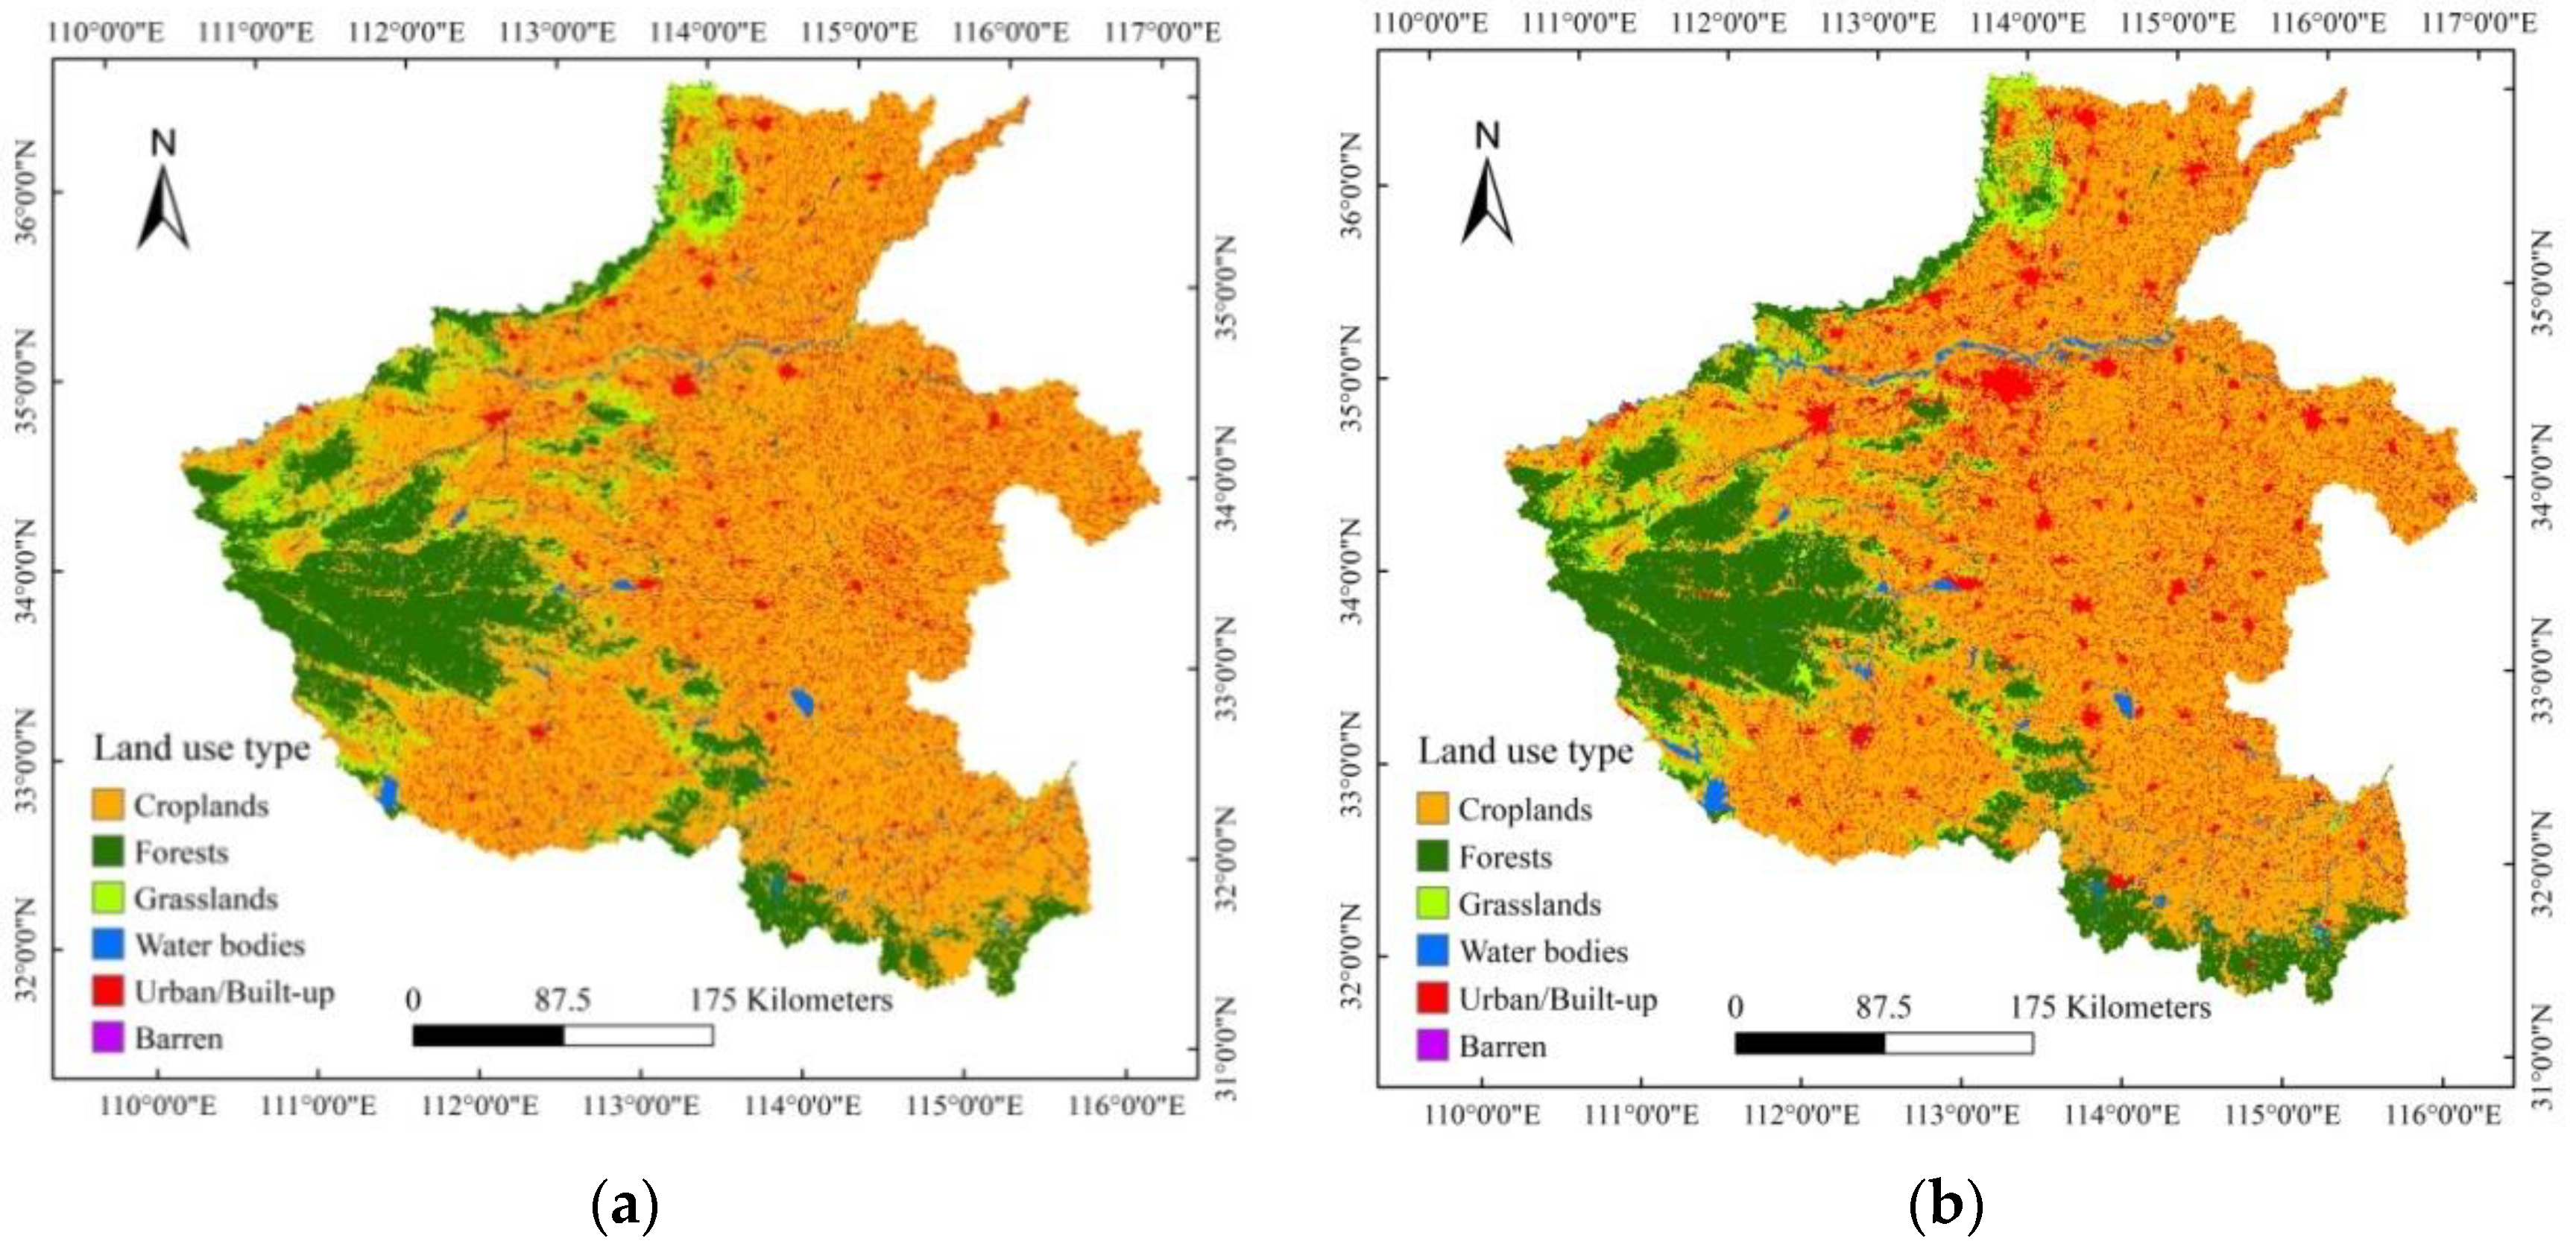
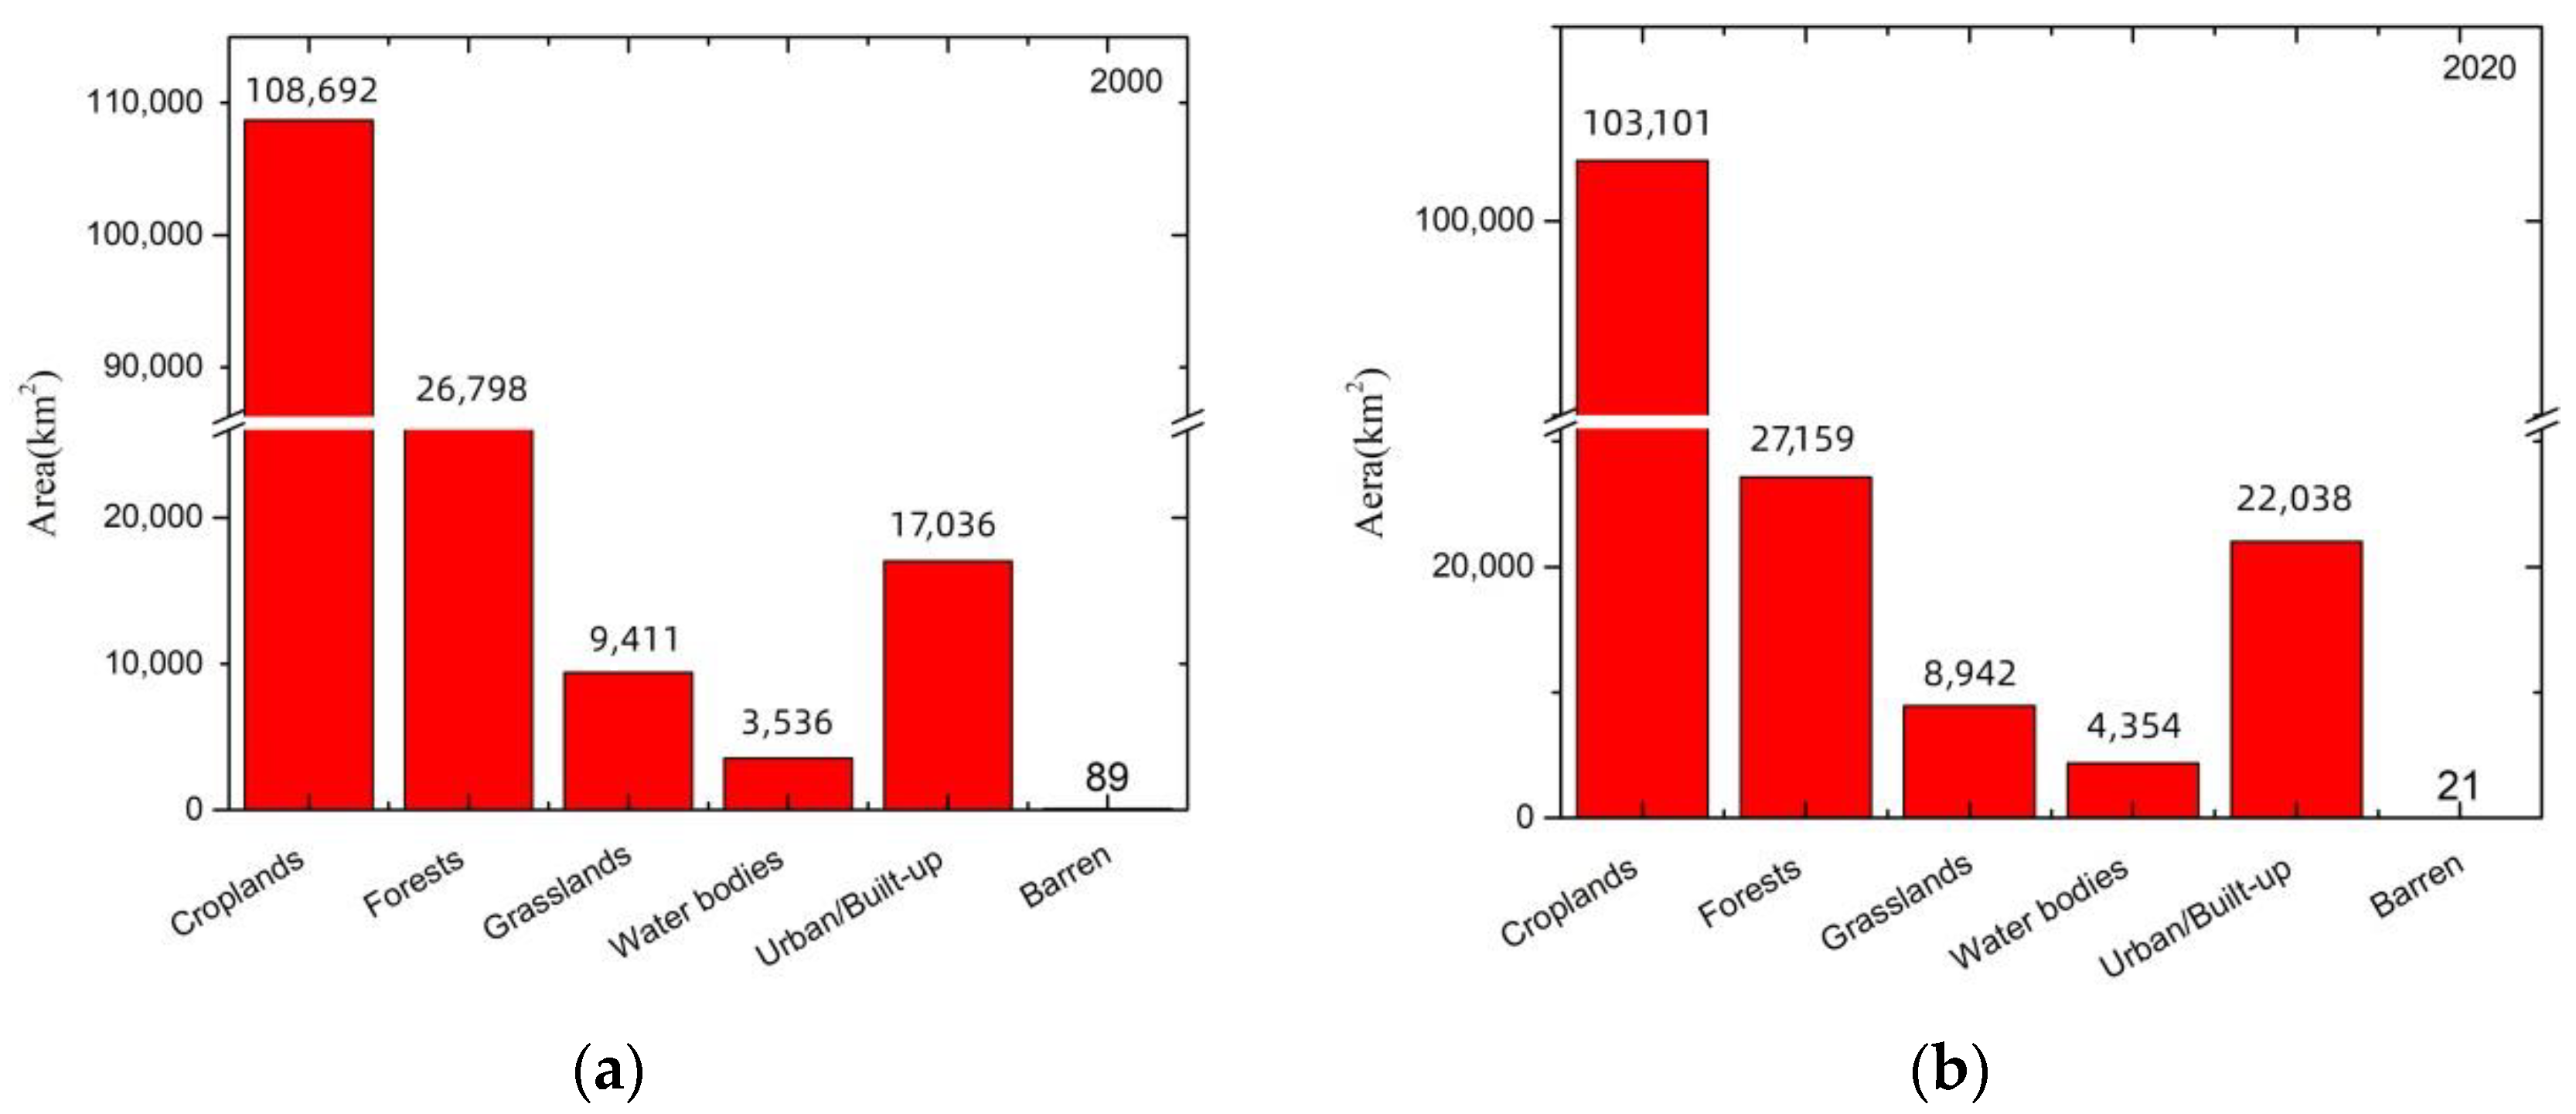
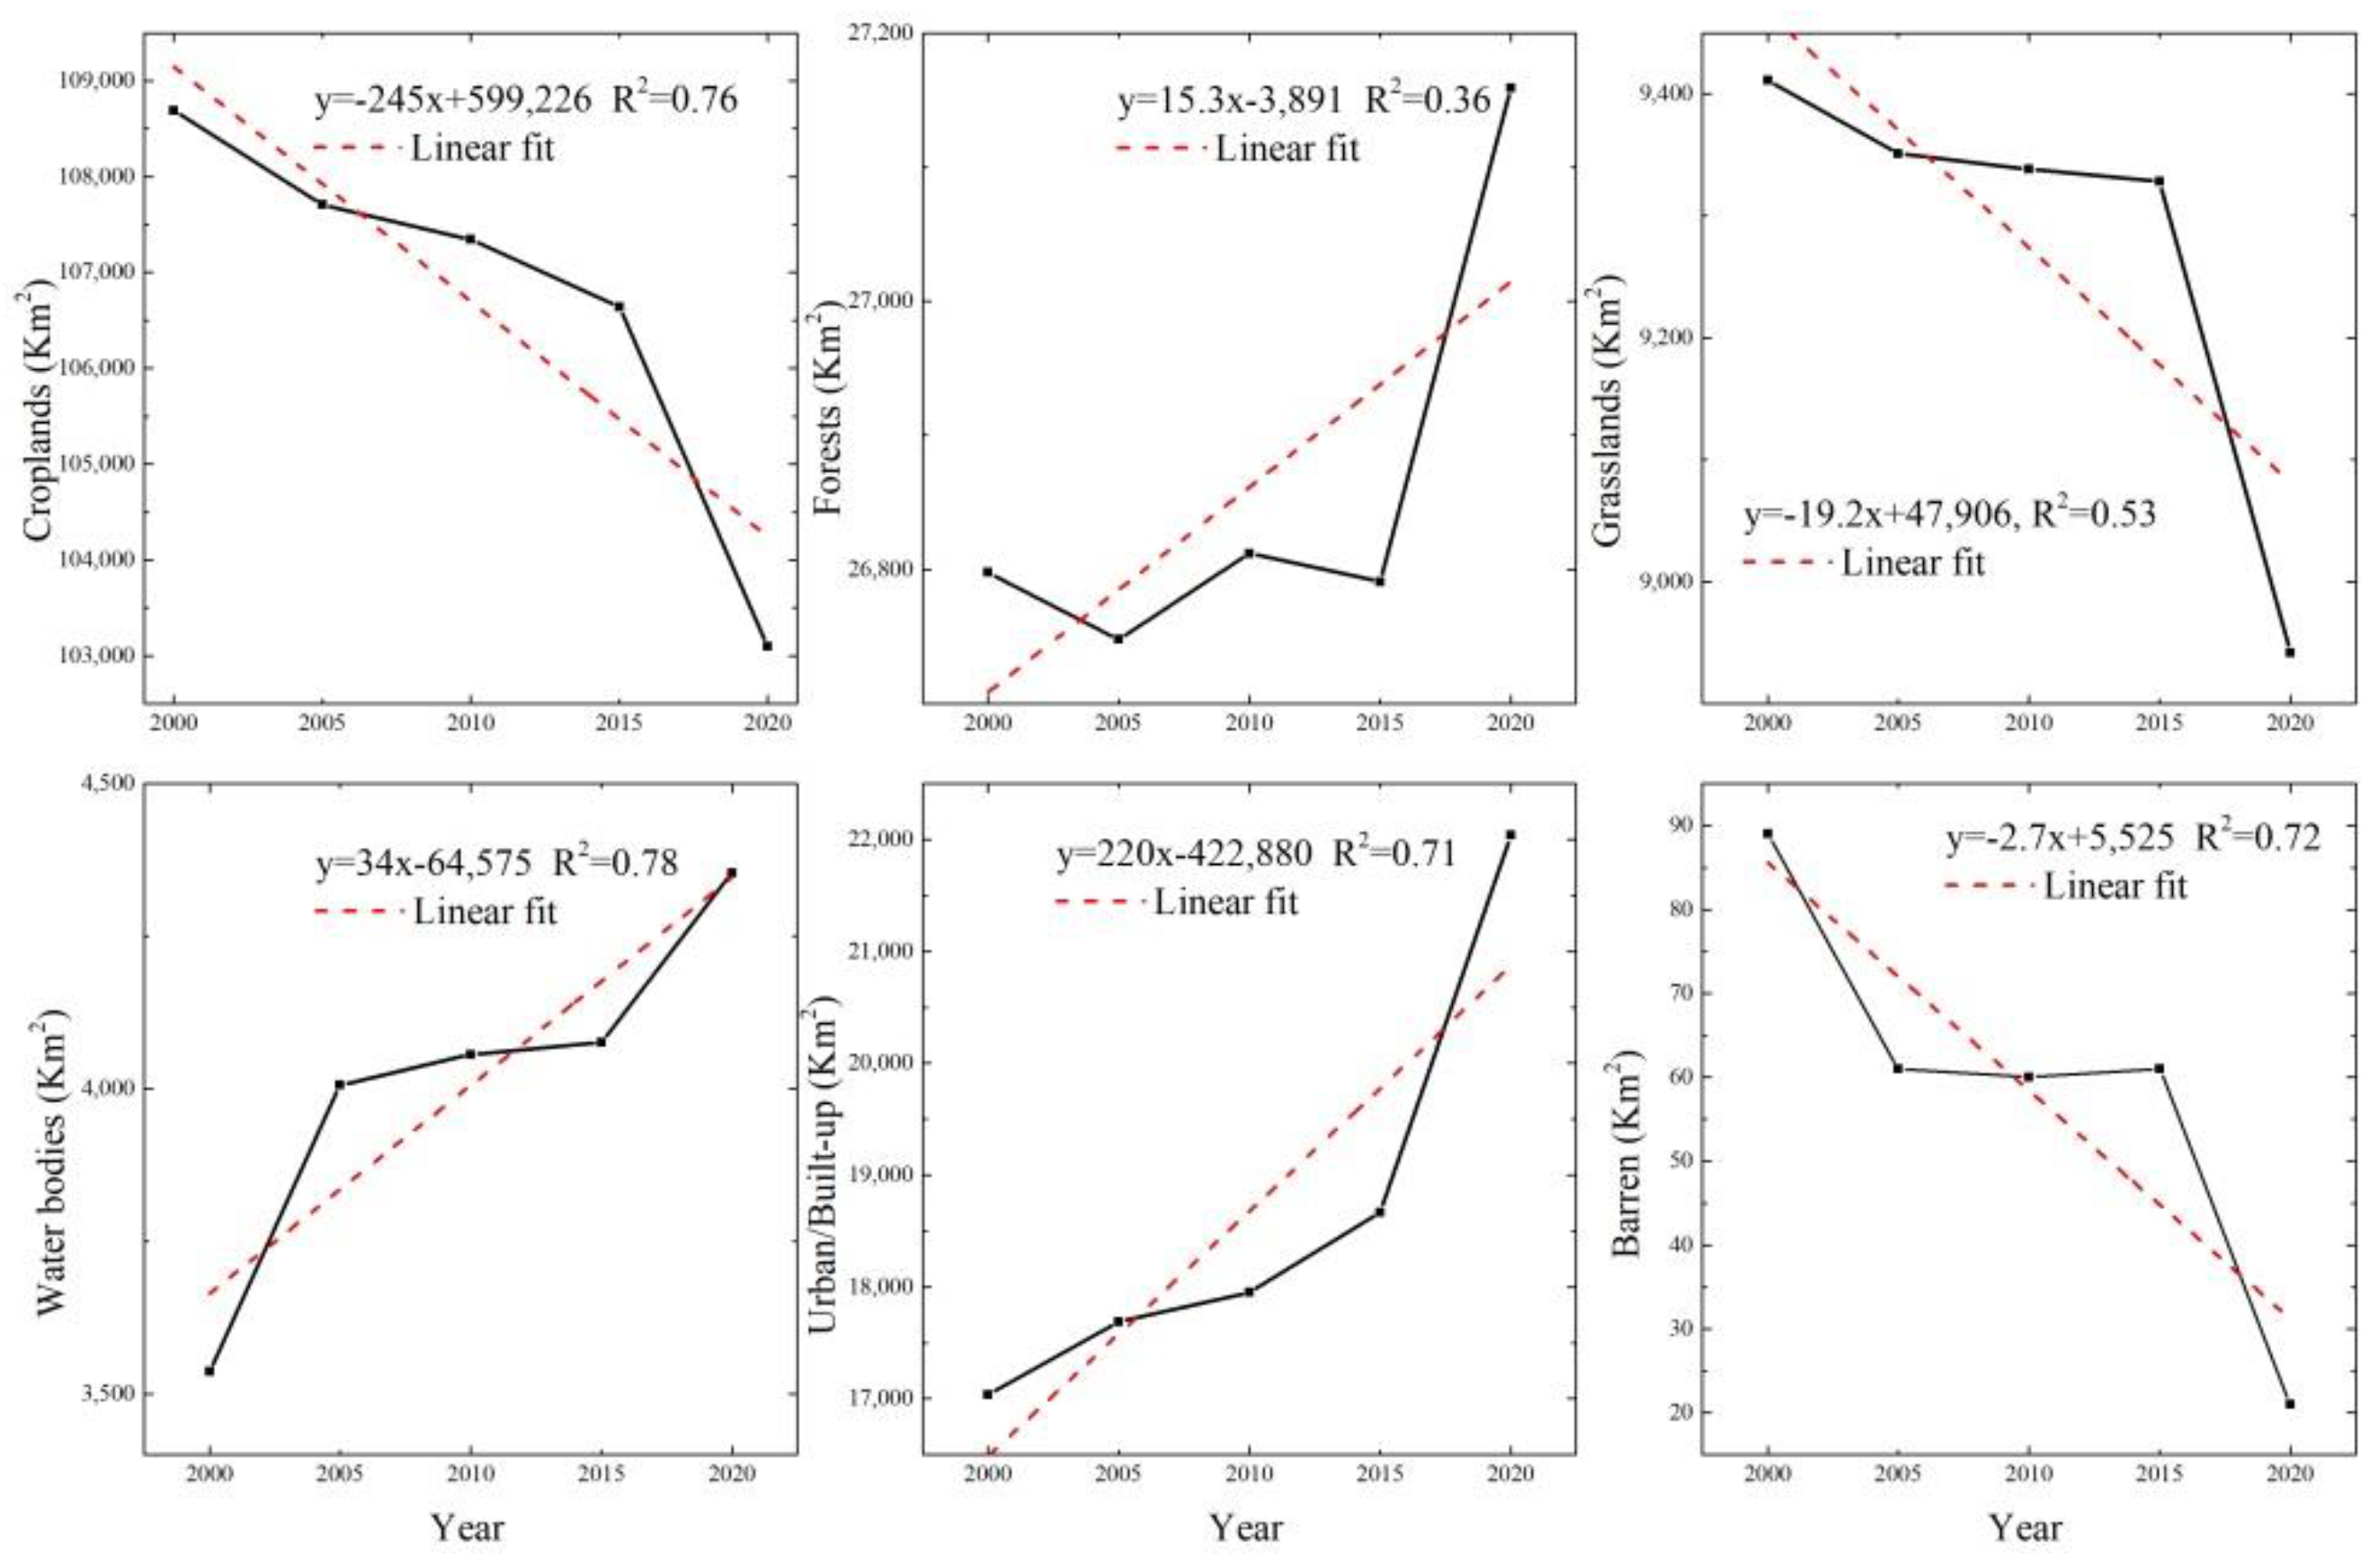
After reclassification, the spatial distribution map of land-use types and area statistics of each land-use type in 2000 and 2020 are displayed in Figure 11 and Figure 12, respectively. Figure 13 shows the changing trend of each land-use type during the past 21 years. The croplands area, the grasslands area, and the barren area showed decreasing trends, while the forest area, the water-body area and the urban area displayed gradually increasing trends.
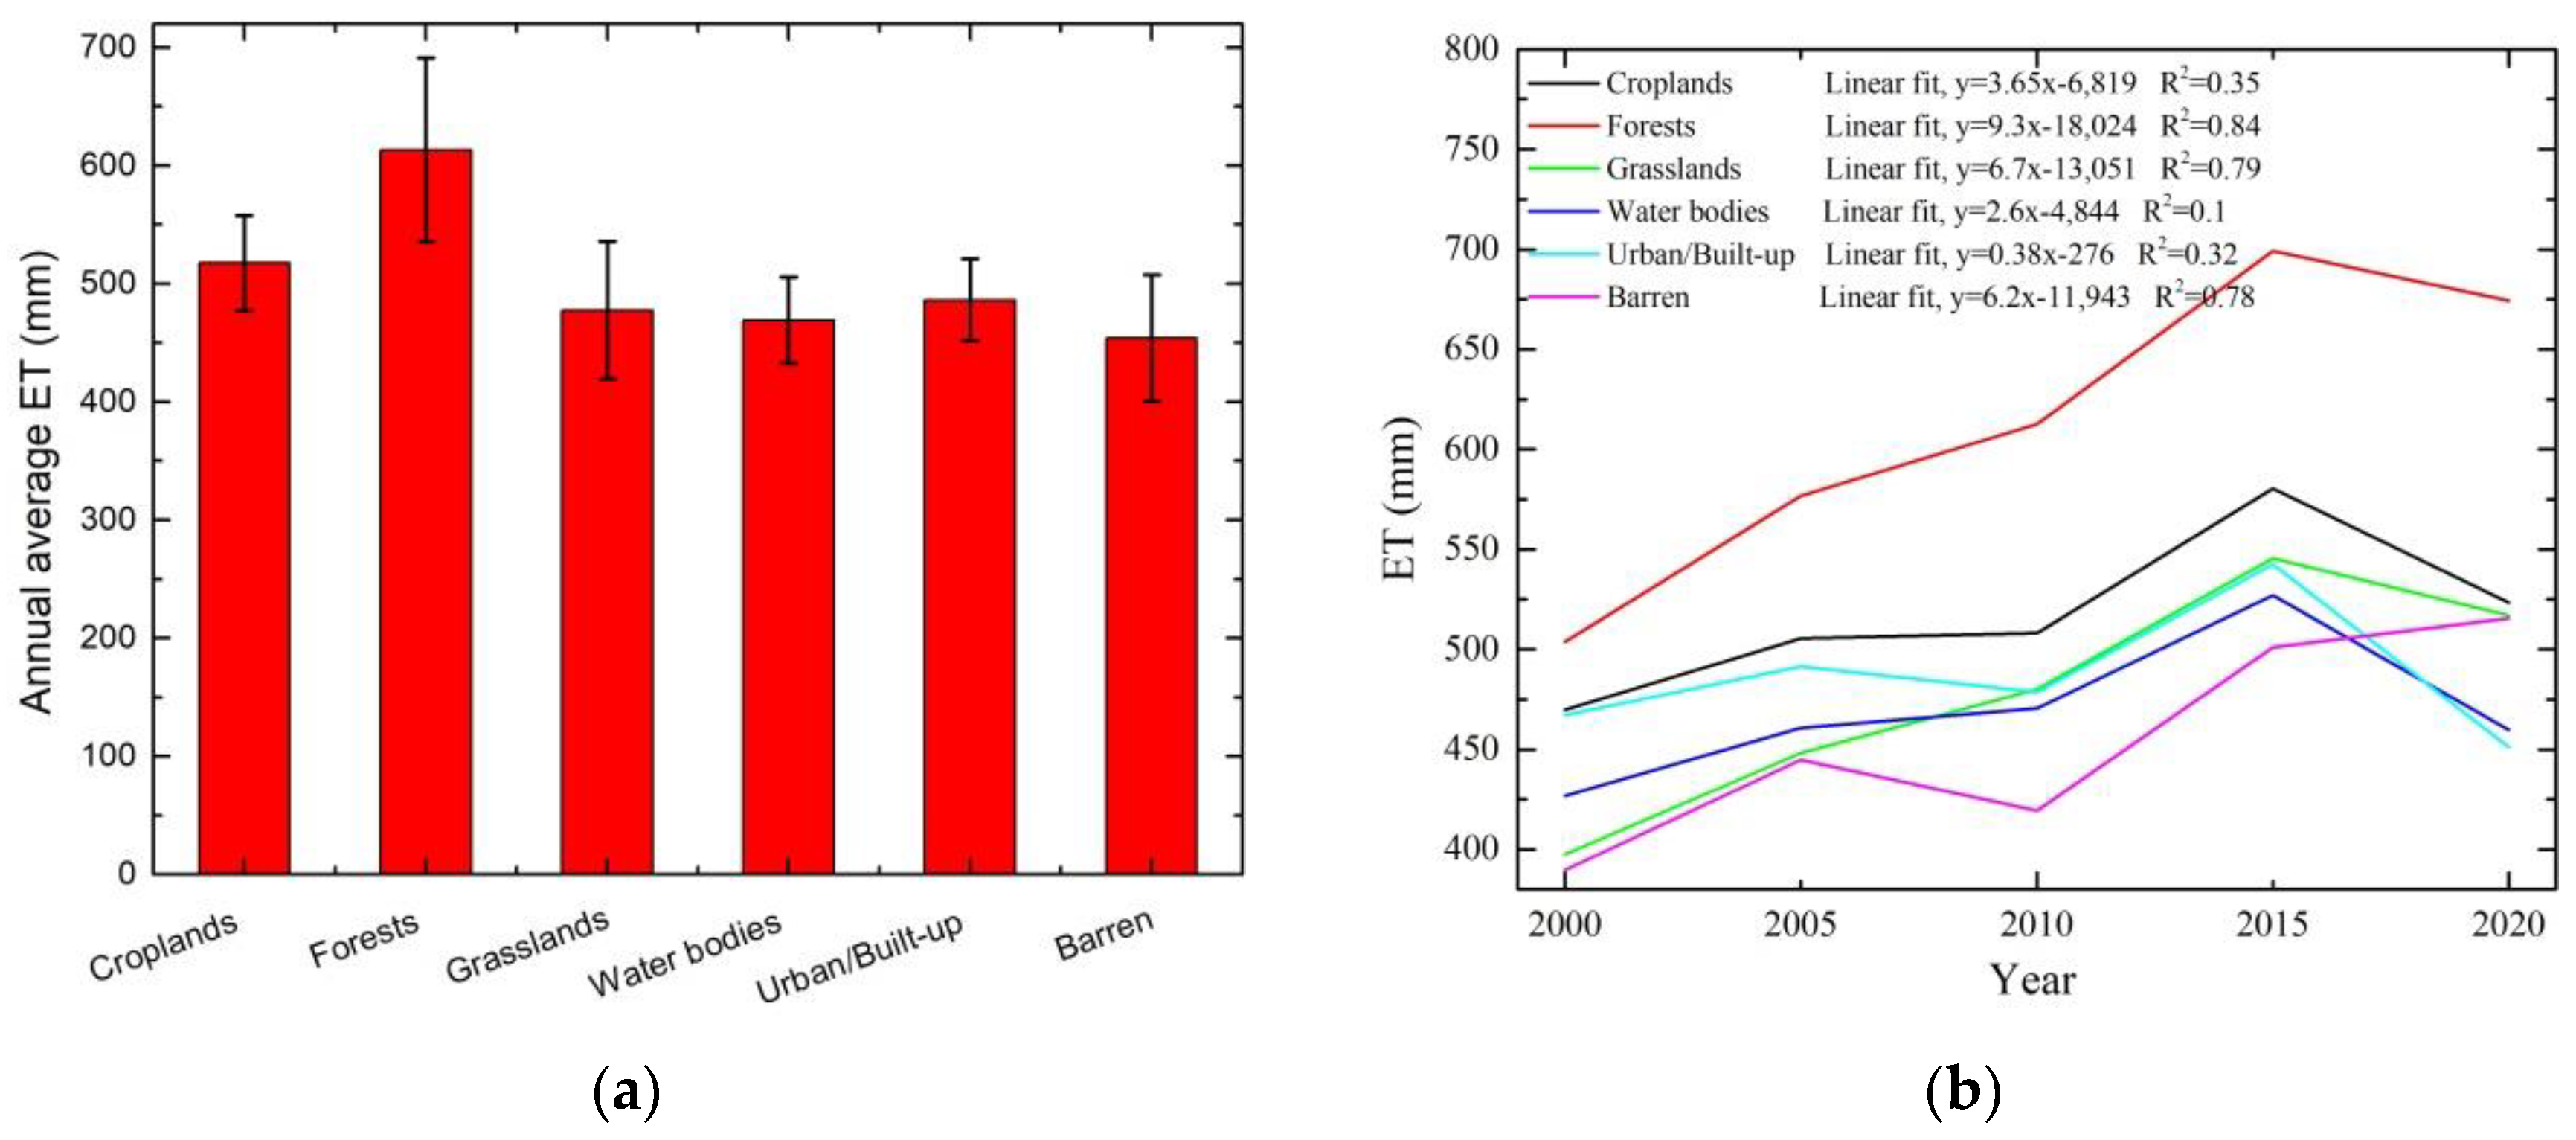
Due to the different physiological and ecological characteristics and precipitation conditions of different land-use types, the land surfaces have different ET rates [49]. Figure 14a,b display the annual average ET of different land-uses types and the annual ET variations of different land-use types from 2000 to 2020, respectively. As seen in Figure 14a, there is a profound difference of ET among land-use types. In the past 21 years, the annual average ET in different land-use types had the following order: forests (613.3 mm/a) > croplands (517 mm/a) > urban/built-up (486.2 mm/a) > grassland (477.6 mm/a) > water bodies (468.9 mm/a) > barren (454.1 mm/a). The annual average ET of forests was the highest, followed by that of croplands. However, there was no significant difference among the annual average ET values of grasslands, urban/built-up, water bodies, and barren areas. As for the variation trend of different land-use types (Figure 14b), it is obvious that the ET of all land-use types manifested significantly increasing trends, and the forests, grasslands, and barren areas had the most obvious growth trends, followed by croplands and urban areas, while the water bodies had an unapparent growth trend. Previous studies also found that there was significant difference among different land-use types and held that ET spatial distribution was closely related to the land-use type [12].
The annual average ET of different land cover types was inconsistent with the area proportion of land-use types. Forests accounted for 16% of the total area of Henan province, which was equivalent to 25~26% of the total croplands. However, the annual average ET of forests was about 95.9 mm/a higher than the annual average ET of croplands. The reason is that, on the one hand, due to the physiological characteristics of tree roots that absorb water, forests have strong transpiration; on the other hand, low plants covered under the canopy of trees also make a significant contribution to the overall ET of forest lands [50]. Although the construction land in the study area is increasing, the decreasing trend of cultivated land area is not obvious, because Henan province is a major agricultural region and the red line of cultivated land is strictly controlled. By analyzing it specifically, it can be seen that the cultivated land has only been reduced by 5.2% in the past 21 years. However, the corresponding annual average ET of croplands still showed an upward trend, and this may result from climatic factors that are more thermally (as shown in Figure 6a) and stable-water driven (as shown in Figure 6b) compared with the past, which can result in the occurrence of significant ET. Therefore, the ET of croplands displayed obvious increasing trends. Due to the prominent effects of climate change, the multi-year average ET of other land-use types (except water bodies) also exhibited increasing trends in recent years.
The application effect test above indicates an objective and rational spatial-temporal evolution of ET in central China, and the effects from climate change and land-use changes on ET are scientific and consistent with similar research, which demonstrates the improved MOD16-sm model is feasible, reliable, and transplantable.
5. Discussion
The MOD16 model is based on the P-M equation and has a clear physical mechanism, and hence the model has good applicability. However, in the MOD16 model, the soil moisture information is expressed by surface resistance which is always composed of RH or VPD, and hence the influence of soil water stress on ET is implied. Soil moisture plays an important role in the canopy impedance, and inadequate consideration of soil moisture is likely to cause large errors. This study uses an easily available parameter, NDWI, as a supplement to soil moisture information to modify the surface impedance of the MOD16 model, aiming to improve the accuracy of the ET estimate. The verification of MOD16-sm model in the middle reaches of the Heihe River in China showed that the improved model was applicative in estimating the regional ET and the accuracy was improved. As a supplement of soil moisture information, the NDWI has the advantage of being easy to obtain. However, the NDWI is also an indirect expression of soil moisture information, and it is not the most direct soil moisture data. Therefore, the improvement effect of the MOD16-sm model is limited. In the future, it will be a promising approach to integrate the soil moisture information acquired from high spatial resolution synthetic aperture radar satellites and we anticipate coupling the soil moisture information directly with the MOD16 model calculation to improve the accuracy of ET estimation. Aside from integrating the soil moisture information into the MOD16 model, combining physically-based ET models with artificial intelligence algorithms will also improve the accuracy of ET estimates, as well as enhancing the model’s capacity to be applied in different climate regions, thereby realizing the efficient use of water resources and optimizing water resource distribution and management [51].
In addition, during the verification of MOD16-sm, although the daily ET estimated by the improved MOD16-sm model is significantly improved, the RMSE is still 0.9 mm. The error mainly results from two aspects: one is the energy non-closure phenomenon, and the other the inconsistency between the spatial resolution of MODIS image and the representativeness space of EC measurements. The above error types also exist in the validation of other ET models [51,52].
As for the application effect test, the ET in Henan province showed a significant temporal and spatial regularity, and the high values of annual average ET for many years were mainly distributed in mountainous areas that had relatively high altitudes and were located in the west and southeast, indicating that the spatial distribution of ET also had a certain relationship with the altitude [41]. Correlation analyses between ET and climatic factors manifested themselves in the positive correlation between ET and precipitation, which was obviously stronger than that of between ET and air temperature, which was related to the temperate monsoon climate zone [49]. The correlation between air temperature and ET was poor and the negative correlation was significant in some areas, and this may be related to the phenomenon of the “evaporation paradox” in central China [42]. In view of the land-use type, it has undergone more complex conversions, and human activities had been more frequent in the past 21 years, which is consistent with the results of other researchers on ET responses to climate and land-use change [12]. The annual ET of six land-use types all showed increasing trends, indicating that, in addition to land-use and climate change, human activities were also the main driving factors contributing to the spatiotemporal changes of ET [45].
The temporal and spatial dynamics of ET are driven by many factors [53]. However, this paper only uses two climatic factors, air temperature and precipitation, to discuss the influences on ET. Besides the above two factors, other factors (such as wind speed, sunshine hours, altitude, or human activities) also make a contribution to the spatial and temporal distribution patterns of ET, and hence further quantitative explorations and comprehensive analyses are needed in future research.
6. Conclusions
The MOD16 model is a rigorous physical mechanism based on the P-M equation, and MOD16-derived ET can represent the overall trend on a global scale; however, large deviations against observations on a local scale always exist, which may result from the insufficient consideration of soil moisture, because the MOD16 model uses the RH and VPD to describe the soil moisture process. Therefore, the parameterization of soil moisture in the MOD16 model is critical. The study attempts to utilize the NDWI as a supplement to soil moisture information to make improvements to the MOD16 model. Specific work was performed towards model validation and model application effect testing, including making comparisons between ET estimates and measurements, analyzing the spatial-temporal characteristics of ET, and exploring impacts on ET from climate change and land-use change. Our conclusions are summarized as follows:
- (1)
- The validation of MOD16 and MOD16-sm model showed that daily ET estimates calculated by the improved MOD16-sm model and the observed daily ET values had an R2 of 0.71, an RMSE of 0.9 mm, and an MAE 0.91 mm, which was better than the correlation result between MOD16-derived ET estimates and measurements with an R2 of 0.68, an RMSE of 1.2 mm, and an MAE of 1.1 mm. Further analyses on the long time scale application of the MOD16 and MOD16-sm model also indicated that the improved MOD16-sm model can acquire slightly higher precision;
- (2)
- The application effect test of ET in Henan province from 2000 to 2020 demonstrated that the improved MOD16-sm model is feasible, reliable, and transplantable, and the specific results can be summarized as follows: the fluctuation range of the annual ET showed significantly temporal distribution characteristics, with the inter-annual fluctuation being 417.7~632.1 mm/a, and the average relative change rate of annual ET being 1.7%, showing an overall increasing trend. As for the spatial distribution, the annual average ET was high in the west and southeast and low in the north, and the spatial distribution of the ET trend indicated that regions with a slight growth in the ET trend were in western and southeastern areas with high vegetation coverage. The impacts of climate change and land-use change on ET showed that the correlation between ET and precipitation was significantly positive and the correlation with air temperature was regarded as zero. Thus, the ET of all land-use types showed significant increasing trends.
The findings of this study will make a very positive contribution to understanding ET features in central China and elaborating how ET responds to climate change and LUCC, which will provide water managers better insights into how to reduce uncertainties, plan effectively, and realize sustainable development and usage of water resources.
Author Contributions
Methodology, S.L. and Y.H.; Writing—original draft, S.L.; Writing—review and editing, Y.H. and H.S. All authors have read and agreed to the published version of the manuscript.
Funding
This research was funded by the Key Scientific Research Project Plan of Colleges of Henan province, China, grant number 20A170011, and the Technologies R & D Program in Henan Province, China, grant number 222102320083.
Institutional Review Board Statement
Not applicable.
Informed Consent Statement
Not applicable.
Data Availability Statement
The MOD16 data are available at http://ladsweb.nascom.nasa.gov/, 1 May 2021 and the HiWATER data are from https://data.tpdc.ac.cn/en/data, 6 March 2021.
Acknowledgments
The authors thank the National Data Center of Tibetan Plateau Science, China, for Hi-WATER data.
Conflicts of Interest
The authors declare no conflict of interest.
References
- Aliku, O.; Oshunsanya, S.O.; Aiyelari, E.A. Estimation of crop evapotranspiration of Okra using drainage Lysimeters under dry season conditions. Sci. Afr. 2022, 16, e01189. [Google Scholar] [CrossRef]
- Kothavala, Z.; Arain, M.A.; Black, T.A.; Verseghy, D. The simulation of energy, water vapor and carbon dioxide fluxes over common crops by the Canadian Land Surface Scheme (CLASS). Agric. For. Meteorol. 2005, 133, 89–108. [Google Scholar] [CrossRef]
- Anderson, M.C.; Norman, J.M.; Kustas, W.P.; Houborg, R.; Starks, P.J.; Agam, N. A thermal-based remote sensing technique for routine mapping of land-surface carbon, water and energy fluxes from field to regional scales. Remote Sens. Environ. 2008, 112, 4227–4241. [Google Scholar] [CrossRef]
- Brutsaert, W. Hydrology: An Introduction; Cambridge University Press: New York, NY, USA, 2005. [Google Scholar]
- Priestley, C.H.B.; Taylor, R.J. On the assessment of surface heat flux and evaporation using large-scale parameters. Mon. Weather Rev. 1972, 100, 81–92. [Google Scholar] [CrossRef]
- Wang, S. Simulation of evapotranspiration and its response to plant water and CO2 transfer dynamics. J. Hydrometeorol. 2008, 9, 426–443. [Google Scholar] [CrossRef]
- Bhattarai, N.; Wagle, P. Recent advances in remote sensing of evapotranspiration. Remote Sens. 2021, 13, 4260. [Google Scholar] [CrossRef]
- Liou, Y.A.; Kar, S.K. Evapotranspiration estimation with remote sensing and various surface energy balance algorithms—A review. Energies 2014, 7, 2821–2849. [Google Scholar] [CrossRef] [Green Version]
- Glenn, E.P.; Huete, A.R.; Nagler, P.L.; Hirschboeck, K.K.; Brown, P. Integrating remote sensing and ground methods to estimate evapotranspiration. CRC Crit. Rev. Plant Sci. 2007, 26, 139–168. [Google Scholar] [CrossRef]
- Wang, K.; Dickinson, R.E. A review of global terrestrial evapotranspiration: Observation, modelling, climatology, and climatic variability. Rev. Geophys. 2012, 50, 1–54. [Google Scholar] [CrossRef]
- Kalma, J.D.; McVicar, T.R.; McCabe, M.F. Estimating land surface evaporation: A review of methods using remotely sensed surface temperature data. Surv. Geophys. 2008, 29, 421–469. [Google Scholar] [CrossRef]
- Li, M.; Chu, R.; Islam, A.R.M.T.; Shen, S. Characteristics of surface evapotranspiration and its response to climate and land use and land cover in the Huai River Basin of eastern China. Environ. Sci. Pollut. Res. 2021, 28, 683–699. [Google Scholar] [CrossRef] [PubMed]
- Yang, Y.; Shang, S.; Jiang, L. Remote sensing temporal and spatial patterns of evapotranspiration and the responses to water management in a large irrigation district of North China. Agric. For. Meteorol. 2012, 164, 112–122. [Google Scholar] [CrossRef]
- Bastiaanssen, W.G.M.; Menenti, M.; Feddes, R.A.; Holtslag, A.A.M. A remote sensing surface energy balance algorithm for land (SEBAL). 1. Formulation. J. Hydrol. 1998, 212, 198–212. [Google Scholar] [CrossRef]
- Vinukollu, R.K.; Wood, E.F.; Ferguson, C.R.; Fisher, J.B. Global estimates of evapotranspiration for climate studies using multi-sensor remote sensing data: Evaluation of three process-based approaches. Remote Sens. Environ. 2011, 115, 801–823. [Google Scholar] [CrossRef]
- Cleugh, H.A.; Leuning, R.; Mu, Q.; Running, S.W. Regional evaporation estimates from flux tower and MODIS satellite data. Remote Sens. Environ. 2007, 106, 285–304. [Google Scholar] [CrossRef]
- Gowda, P.H.; Chavez, J.L.; Colaizzi, P.D.; Evett, S.R.; Howell, T.A.; Tolk, J.A. ET mapping for agricultural water management: Present status and challenges. Irrig. Sci. 2008, 26, 223–237. [Google Scholar] [CrossRef] [Green Version]
- Kim, H.W.; Hwang, K.; Mu, Q.; Lee, S.O.; Choi, M. Validation of MODIS 16 global terrestrial evapotranspiration products in various climates and land cover types in Asia. KSCE J. Civ. Eng. 2012, 16, 229–238. [Google Scholar] [CrossRef]
- He, T.; Shao, Q. Spatial-temporal variation of terrestrial evapotranspiration in China from 2001 to 2010 using MOD16 products. J. Geo-Inf. Sci. 2014, 16, 979–988. [Google Scholar]
- Ramoelo, A.; Majozi, N.; Mathieu, R.; Jovanovic, N.; Nickless, A.; Dzikiti, S. Validation of global evapotranspiration product (MOD16) using flux tower data in the African savanna, South Africa. Remote Sens. 2014, 6, 7406–7423. [Google Scholar] [CrossRef] [Green Version]
- Srivastava, A.; Sahoo, B.; Raghuwanshi, N.S.; Singh, R. Evaluation of variable-infiltration capacity model and MODIS-terra satellite-derived grid-scale evapotranspiration estimates in a river basin with tropical monsoon-type climatology. J. Irrig. Drain. Eng. 2017, 143, 04017028. [Google Scholar] [CrossRef] [Green Version]
- Autovino, D.; Minacapilli, M.; Provenzano, G. Modelling bulk surface resistance by MODIS data and assessment of MOD16A2 evapotranspiration product in an irrigation district of Southern Italy. Agric. Water Manag. 2016, 167, 86–94. [Google Scholar] [CrossRef]
- Mu, Q.; Heinsch, F.A.; Zhao, M.; Running, S.W. Development of a global evapotranspiration algorithm based on MODIS and global meteorology data. Remote Sens. Environ. 2007, 111, 519–536. [Google Scholar] [CrossRef]
- Lubczynski, M.W.; Gurwin, J. Integration of various data sources for transient groundwater modeling with spatio-temporally variable fluxes—Sardon study case, Spain. J. Hydrol. 2005, 306, 71–96. [Google Scholar] [CrossRef]
- Sun, L.; Liang, S.; Yuan, W.; Chen, Z. Improving a Penman-Monteith evapotranspiration model by incorporating soil moisture control on soil evaporation in semiarid areas. Int. J. Digit. Earth 2013, 10, 134–156. [Google Scholar] [CrossRef]
- Gokmen, M.; Vekerdy, Z.; Verhoef, A.; Verhoef, W.; Batelaan, O.; Der Tol, C. Integration of soil moisture in SEBS for improving evapotranspiration estimation under water stress conditions. Remote Sens. Environ. 2012, 121, 261–274. [Google Scholar] [CrossRef]
- Engman, E.T.; Gurney, R.J. Remote Sensing in Hydrology; Chapman and Hall: London, UK, 1991. [Google Scholar]
- Sellers, P.J.; Dickinson, R.E.; Randall, D.A.; Betts, A.K.; Hall, F.G.; Berry, J.A.; Collatz, G.J.; Denning, A.S.; Mooney, H.A.; Nobre, C.A.; et al. Modeling the exchanges of energy, water, and carbon between continents and the atmosphere. Science 1997, 275, 502–509. [Google Scholar] [CrossRef] [Green Version]
- Kustas, W.; Anderson, M. Advances in thermal infrared remote sensing for land surface modeling. Agric. For. Meteorol. 2009, 149, 2071–2081. [Google Scholar] [CrossRef]
- Shuttleworth, W.J. Putting the “vap” into evaporation. Hydrol. Earth Syst. Sci. 2007, 11, 210–244. [Google Scholar] [CrossRef] [Green Version]
- Yun, B.; Zhang, J.; Sha, Z.; Yao, F.; Vincenzo, M. A remote sensing-based two-leaf canopy conductance model: Global optimization and applications in modeling gross primary productivity and evapotranspiration of crops. Remote Sens. Environ. 2018, 215, 411–437. [Google Scholar]
- Sharma, S.; Rajan, N.; Cui, S.; Maas, S.; Casey, K.; Ale, S.; Jessup, R. Carbon and evapotranspiration dynamics of a non-native perennial grass with biofuel potential in the southern U.S. Great Plains. Agric. For. Meteorol. 2019, 269, 285–293. [Google Scholar] [CrossRef]
- De Oliveira, R.G.; Valle Júnior, L.C.G.; Da Silva, J.B.; Espíndola, D.A.L.F.; Lopes, R.D.; Nogueira, J.S.; Curado, L.F.A.; Rodrigues, T.R. Temporal trend changes in reference evapotranspiration contrasting different land uses in southern Amazon basin. Agric. Water Manag. 2021, 250, 106815. [Google Scholar] [CrossRef]
- Zou, M.; Niu, J.; Kang, S.; Li, X.; Lu, H. The contribution of human agricultural activities to increasing evapotranspiration is significantly greater than climate change effect over Heihe agricultural region. Sci. Rep. 2017, 7, 8805. [Google Scholar] [CrossRef] [PubMed] [Green Version]
- Jhajharia, D.; Dinpashoh, Y.; Kahya, E.; Singh, V.P.; Fakheri-Fard, A. Trends in reference evapotranspiration in the humid region of northeast India. Hydrol. Process. 2012, 26, 421–435. [Google Scholar] [CrossRef]
- Júnior, L.C.G.V.; Ventura, T.M.; Gomes, R.; José, D.S.N.; Francisco, D.; Vourlitis, G.L.; Rodrigues, T.R. Comparative assessment of modelled and empirical reference evapotranspiration methods for a brazilian savanna. Agric. Water Manag. 2020, 232, 106040. [Google Scholar] [CrossRef]
- Gong, T.; Lei, H.; Yang, D.; Jiao, Y.; Hanbo, Y. Monitoring the variations of evapotranspiration due to land use/cover change in a semiarid shrubland. Hydrol. Earth Syst. Sci. 2017, 21, 863–877. [Google Scholar] [CrossRef] [Green Version]
- Kui, H.; Yimin, L.; Zheng, W.; He, C.; Zhang, B.; Ma, W. Effects of land use and climate change on spatiotemporal changes of evapotranspiration in Haihe river basin. J. Geo-Inf. Sci. 2019, 21, 1888–1902. [Google Scholar] [CrossRef]
- Ji, X.J.; Zhu, Y.; Gu, W. Analysis on trends in annual reference crop evapotranspiration and its impact climatic factors in Henan province during 1971 to 2010. Chin. J. Agrometeorol. 2013, 34, 14–22. [Google Scholar]
- Zhang, M.; Su, B.; Nazeer, M.; Bilal, M.; Qi, P.; Han, G. Climatic characteristics and modeling evaluation of pan evapotranspiration over Henan province, China. Land 2020, 9, 229. [Google Scholar] [CrossRef]
- Choi, Y. A new algorithm to calculate weighted flow-accu_mulation from a DEM by considering surface and under_ground stormwater infrastructure. Environ. Model. Softw. 2012, 30, 81–89. [Google Scholar] [CrossRef]
- Bao, Z.; Yan, X.; Wang, G. Mechanism of ef_fect of meteorological factors in paradox theory of pan evaporation of Haihe River basin. J. Water Resour. Water Eng. 2014, 25, 1–7. [Google Scholar]
- Mu, Q.; Zhao, M.; Running, S.W. Improvements to a MODIS global terrestrial evapotranspiration algorithm. Remote Sens. Environ. 2011, 115, 1781–1800. [Google Scholar] [CrossRef]
- Fisher, J.B.; Tu, K.P.; Baldocchi, D.D. Global estimates of the land—Atmosphere water flux based on monthly AVHRR and ISLSCP-II data, validated at 16 FLUXNET sites. Remote Sens. Environ. 2008, 112, 901–919. [Google Scholar] [CrossRef]
- Lei, H.; Yang, D. Interannual and seasonal variability in evapotranspiration and energy partitioning over an irrigated cropland in the North China Plain—ScienceDirect. Agric. For. Meteorol. 2010, 150, 581–589. [Google Scholar] [CrossRef]
- Ye, H.; Zhang, T.; Yi, G.; Li, J. Spatio-temporal characteristics of evapotranspiration and its relationship with climate factors in the source region of the Yellow River from 2000 to 2014. Acta Geogr. Sin. 2018, 73, 2117–2134. [Google Scholar]
- Abdul Karim, S.N.A.; Ahmed, S.A.; Nischitha, V.; Bhatt, S.; Kiran Raj, S.; Chandrashekarappa, K.N. FAO 56 Model and Remote Sensing for the Estimation of Crop-Water Requirement in Main Branch Canal of the Bhadra Command area, Karnataka State. J. Indian Soc. Remote Sens. 2013, 41, 883–894. [Google Scholar] [CrossRef]
- Smith, A.A.; Welch, C.; Stadnyk, T.A. Assessing the seasonality and uncertainty in evapotranspiration partitioning using a tracer-aided model. J. Hydrol. 2018, 560, 595–613. [Google Scholar] [CrossRef]
- Li, R.; Hua, Z.; Huang, B.; Xu, H.; Li, Y. Dynamic impacts of climate and land-use changes on surface runoff in the mountainous region of the Haihe river basin, China. Adv. Meteorol. 2018, 2018, 3287343. [Google Scholar] [CrossRef] [Green Version]
- Jia, L.; Xi, G.; Liu, S.; Huang, C.; Yan, Y.; Liu, G. Regional estimation of daily to annual regional evapotranspiration with MODIS data in the Yellow River Delta wetland. Hydrol. Earth Syst. Sci. 2009, 13, 1775–1787. [Google Scholar] [CrossRef] [Green Version]
- Chao, L.; Zhang, K.; Wang, J.; Feng, J.; Zhang, M. A comprehensive evaluation of five evapotranspiration datasets based on ground and grace satellite observations: Implications for improvement of evapotranspiration retrieval algorithm. Remote Sens. 2021, 13, 2414. [Google Scholar] [CrossRef]
- Taheri, M.; Mohammadian, A.; Ganji, F.; Bigdeli, M.; Nasseri, M. Energy-based approaches in estimating actual evapotranspiration focusing on land surface temperature: A review of methods, concepts, and challenges. Energies 2022, 15, 1264. [Google Scholar] [CrossRef]
- Sharma, V.; Kilic, A.; Irmak, S. Impact of scale/resolution on evapotranspiration from Landsat and MODIS images. Water Resour. Res. 2016, 52, 1207–1221. [Google Scholar] [CrossRef] [Green Version]
Figure 1.
The location of the study area.

Figure 2.
The flow chart of the study (blue dashed frame: improvements of the MOD16 model).

Figure 3.
The core test area of HiWATER experiment and distributions of observation stations.

Figure 4.
The comparison between ET observations and estimates by the MOD16 and MOD16-sm model.

Figure 5.
Inter-annual variations of ET in the study area from 2000 to 2020.

Figure 6.
Annual air temperature (a) and precipitation (b) variations from 2000 to 2020.

Figure 7.
Spatial distribution of annual average ET during 2000–2020.

Figure 8.
Spatial distribution of annual average NDVI during 2000–2020.

Figure 9.
Spatial distribution of ET trend during 2000–2020.

Figure 10.
Spatial distributions of correlation coefficient between ET and air temperature (a), and between ET and precipitation (b) in Henan province 2000–2020.
Figure 10.
Spatial distributions of correlation coefficient between ET and air temperature (a), and between ET and precipitation (b) in Henan province 2000–2020.

Figure 11.
Land-use types of Henan province after reclassification in 2000 (a) and 2020 (b).

Figure 12.
Statistics of each individual land-use type in 2000 (a) and 2020 (b).

Figure 13.
Change trends of different land-use type areas from 2000 to 2020.

Figure 14.
Annual average ET of different land-uses types (a) and the annual ET variations of different land-use types from 2000 to 2020 (b).
Figure 14.
Annual average ET of different land-uses types (a) and the annual ET variations of different land-use types from 2000 to 2020 (b).


Table 1.
Descriptions of EC stations and dates used for validation.
| Stations | Underlying Surfaces | Dates for Validation in June |
|---|---|---|
| EC1 | vegetation | 07, 09, 10, 11, 18, 19, 20, 21, 29, 30 |
| EC4 | village | 04, 07, 09, 10, 11, 15, 16, 18, 19, 20, 21, 24, 29, 30 |
| EC10 | maize | 07, 09, 10, 11, 15, 16, 18, 19, 20, 21, 24, 29, 30 |
| EC17 | orchard | 04, 07, 09, 10, 11, 15, 16, 18, 19, 20, 21, 24, 29, 30 |
Table 2.
Daily average ET comparisons on monthly scale.
| Stations | Average Daily ET in June (mm/d) | ||
|---|---|---|---|
| MOD16 Estimates | MOD16-sm Estimates | Measurements | |
| EC1 | 5.09 | 4.96 | 4.59 |
| EC4 | 2.57 | 2.51 | 2.31 |
| EC10 | 6.49 | 6.21 | 5.98 |
| EC17 | 6.06 | 5.61 | 5.06 |
Table 3.
Regional statistics of correlation coefficients between ET and air temperature and precipitation, respectively.
Table 3.
Regional statistics of correlation coefficients between ET and air temperature and precipitation, respectively.
| CC between ET and Air Temperature | Proportion (%) | CC between ET and Precipitation | Proportion (%) |
|---|---|---|---|
| −0.81–−0.5 | 2.60 | −0.77–−0.5 | 0.44 |
| −0.5–−0.3 | 9.59 | −0.5–−0.3 | 4.03 |
| −0.3–0 | 39.82 | −0.3–0 | 25.36 |
| 0.0–0.3 | 40.82 | 0–0.3 | 44.86 |
| 0.3–0.5 | 6.61 | 0.3–0.5 | 17.93 |
| 0.5–0.8 | 0.56 | 0.5–0.92 | 7.38 |
Publisher’s Note: MDPI stays neutral with regard to jurisdictional claims in published maps and institutional affiliations. |
© 2022 by the authors. Licensee MDPI, Basel, Switzerland. This article is an open access article distributed under the terms and conditions of the Creative Commons Attribution (CC BY) license (https://creativecommons.org/licenses/by/4.0/).
Share and Cite
MDPI and ACS Style
Liu, S.; Han, Y.; Su, H. Regional Evapotranspiration Estimation by the Improved MOD16-sm Model and Its Application in Central China. Water 2022, 14, 1491. https://doi.org/10.3390/w14091491
AMA Style
Liu S, Han Y, Su H. Regional Evapotranspiration Estimation by the Improved MOD16-sm Model and Its Application in Central China. Water. 2022; 14(9):1491. https://doi.org/10.3390/w14091491
Chicago/Turabian StyleLiu, Suhua, Yuping Han, and Hongbo Su. 2022. "Regional Evapotranspiration Estimation by the Improved MOD16-sm Model and Its Application in Central China" Water 14, no. 9: 1491. https://doi.org/10.3390/w14091491
Note that from the first issue of 2016, this journal uses article numbers instead of page numbers. See further details here.