
Anthropogenic Influences on an Urban River: Differences in Cations and Nutrients along an Urban/Suburban Transect

Department of Environmental Science, American University, Washington, DC 20016, USA
*
Author to whom correspondence should be addressed.
Water 2022, 14(9), 1330; https://doi.org/10.3390/w14091330
Submission received: 10 March 2022
/
Revised: 5 April 2022
/
Accepted: 12 April 2022
/
Published: 20 April 2022
(This article belongs to the Section Water Quality and Contamination)
Abstract
:The Anacostia River in Washington, D.C. has been experiencing the challenges typical of urban rivers over the last 70+ years. Here, we examine six years (2014 to 2020) of base-flow geochemistry of three tidal Anacostia sites and three suburban sites. Parameters examined include pH, hardness, SAR, alkalinity, TDS, Ca, Mg, Na, K, Fe, Mn, Zn, Al, As, B, Ba, Be, Cd, Cr, Cu, Co, Mo, Ni, Pb, total P, S, Sr, Ti, NO3−, and NH4+. Not surprisingly, winter and spring months showed very high Na (means of 786 mg/L and 1000 mg/L, respectively). Plotting Na/(Na + Ca) versus TDS shows contributions from groundwater, but also differences from major world rivers. Main stem locations usually had Ca/Sr ratios > 200, suggesting that concrete was the source of Ca; however, suburban sites showed high Ca as well and suburban Ca/Sr ratios were frequently <200, indicating a different source for Ca. Most sites showed low median Si:NO3 ratios (between 3 and 5), suggesting elevated NO3− from non-natural sources. The data are consistent with freshwater salinization syndrome (a specific type of urban stream syndrome), and also show that the developed landscape in suburban environments influences geochemistry differently than in urban environments.
1. Introduction
Urban stream syndrome is described as occurring when the alteration of the urban landscape is inextricably linked to the geochemistry of a river [1,2]. The Anacostia River in Washington D.C. is a minor tributary of the Potomac river and has been experiencing urban stream syndrome for decades, including legacy organic contamination (PAHs, PCBs, etc.), sedimentation, and elevated Na, Ca, and Mg, and high pH and nitrate among other chemical contaminants [3,4,5,6]. Over the last 20+ years, there have been numerous studies documenting the appearance and scope of urban stream syndrome in various developed watersheds, including the Anacostia River [4,5,7,8,9]. The main stem of the Anacostia has been experiencing urban stream syndrome, appearing as elevated Na, Ca, and Mg and high pH and nitrate among other chemical contaminants. Although the river itself flows through Washington DC and is designated as 75% urban, its tributaries flow through suburban Maryland. The suburban tributaries are presumably less “urban” and rainfall may encounter less impervious urban infrastructure than water flowing into the main stem from storm runoff.
In recent years, however, the Anacostia has been the beneficiary of aggressive governmental efforts to remediate water contamination through stormwater retention programs (underground tunnels to hold combined sewage overflow (CSO) and divert it to treatment later). As stormwater abatement facilities come online, it is widely assumed that water quality improvements will result. This is a perfectly reasonable expectation since it is quite clear that storm flow triggers CSO with high concentrations of nutrients and bacteria. Indeed, in both 2018 and 2020, the river received the first-ever “passing” grades from the Anacostia Watershed Society [10]. Additionally, the storm flow passes over concrete, blacktop, etc., which releases ions and contaminants into the river if not contained. The main stem of the Anacostia also receives water from tributaries, however, which enter the main stem from the Northwest and Northeast Branches, which meet at Bladensburg, MD. These tributaries provide base flow to the river and suburban storms will feed the tributaries, and after a short period of time, the main stem Anacostia.
The purpose of this study was to determine if there were chemical differences in water chemistry between the urban waters of the Anacostia main stem and the water flowing through the smaller suburban tributaries. The working hypothesis is that urban stream syndrome characteristics will be absent or reduced in the suburban streams. As stormwater abatement programs continue in DC, the suburban flows will need to be examined, since whatever may be in those waters will end up in the Anacostia: regardless of DC’s runoff abatement infrastructure.
2. Materials and Methods
2.1. Study Site
The Anacostia River drains a small urban watershed that is comprised of several northern Washington, D.C. metropolitan suburbs [11]. It is located in the Atlantic Coastal Plain and the Piedmont Plateau, areas in both Maryland and Washington D.C. The western and northern portions of the watershed are part of the Piedmont Plateau, which consists of metamorphic, metasedimentary, and metaigneous rocks from the late Precambrian and early Paleozoic eras [11]. The southern and eastern portions of the watershed are part of the Coastal Plain, which consists of unmetamorphosed fluvial and marine sediments from the Cretaceous through Miocene era [11]. More specifically, the watershed is underlain by Precambrian phyllites (metamorphosed mica and quartz-rich clays; aluminum, silicon, oxygen, potassium), sericite (KAl3Si3O10(OH)2 and muscovite mica (KAl3Si3O10(OH,F)2), chlorite ((Mg,Fe)3(Si,Al)4O10(OH)2(Mg,Fe)3(OH)6, quartzite (metamorphosed sandstone quartz, SiO2), and slate (metamorphose shale; 4 to 8% Fe2O, 55–65% SiO2, 15–20% Al2O3, 2–4% Na2O/K2O, 0.5–3.0% CaO/MgO) to the west; schist (metamorphosed clays, quartz), metagraywacke (quartz, biotite (K(Mg,Fe) AlSi3O10(OHF)2); schist, albite (NaAlSi3O8) quartzite and marble (CaCO3) to the immediate west; and Cretaceous sand with Quaternary alluvium in the immediate drainage area [12].
A total of 93% of the mainstream Anacostia’s flow is controlled by the Northeast and Northwest Branches, which connect at Bladensburg, Maryland [10]. From Bladensburg, the river flows 8.4 miles and joins the Potomac River. The Anacostia River basin has a drainage area of 440 km2, of which 70% of the land is developed, 60% is either urban or suburban, and 25% is impervious [11,12]. The average annual flow for the Anacostia River is 1.2 × 10⁸ m3/year and the instantaneous flow ranges from 0.05 to 30 m3/second above the head of the tide for the Northeast and Northwest Branches [11]. Water located downstream of Bladensburg has a residence time of approximately 35 to 100 days due to the large tidal volume to river inflow ratio [11]. The Anacostia receives significant amounts of sediment via the Northeast and Northwest Branches. As such, the deposition rates in the tidal river are estimated to be approximately 3 to 4 cm annually [11]. This sediment deposition further reduces the overall water flow in the river.
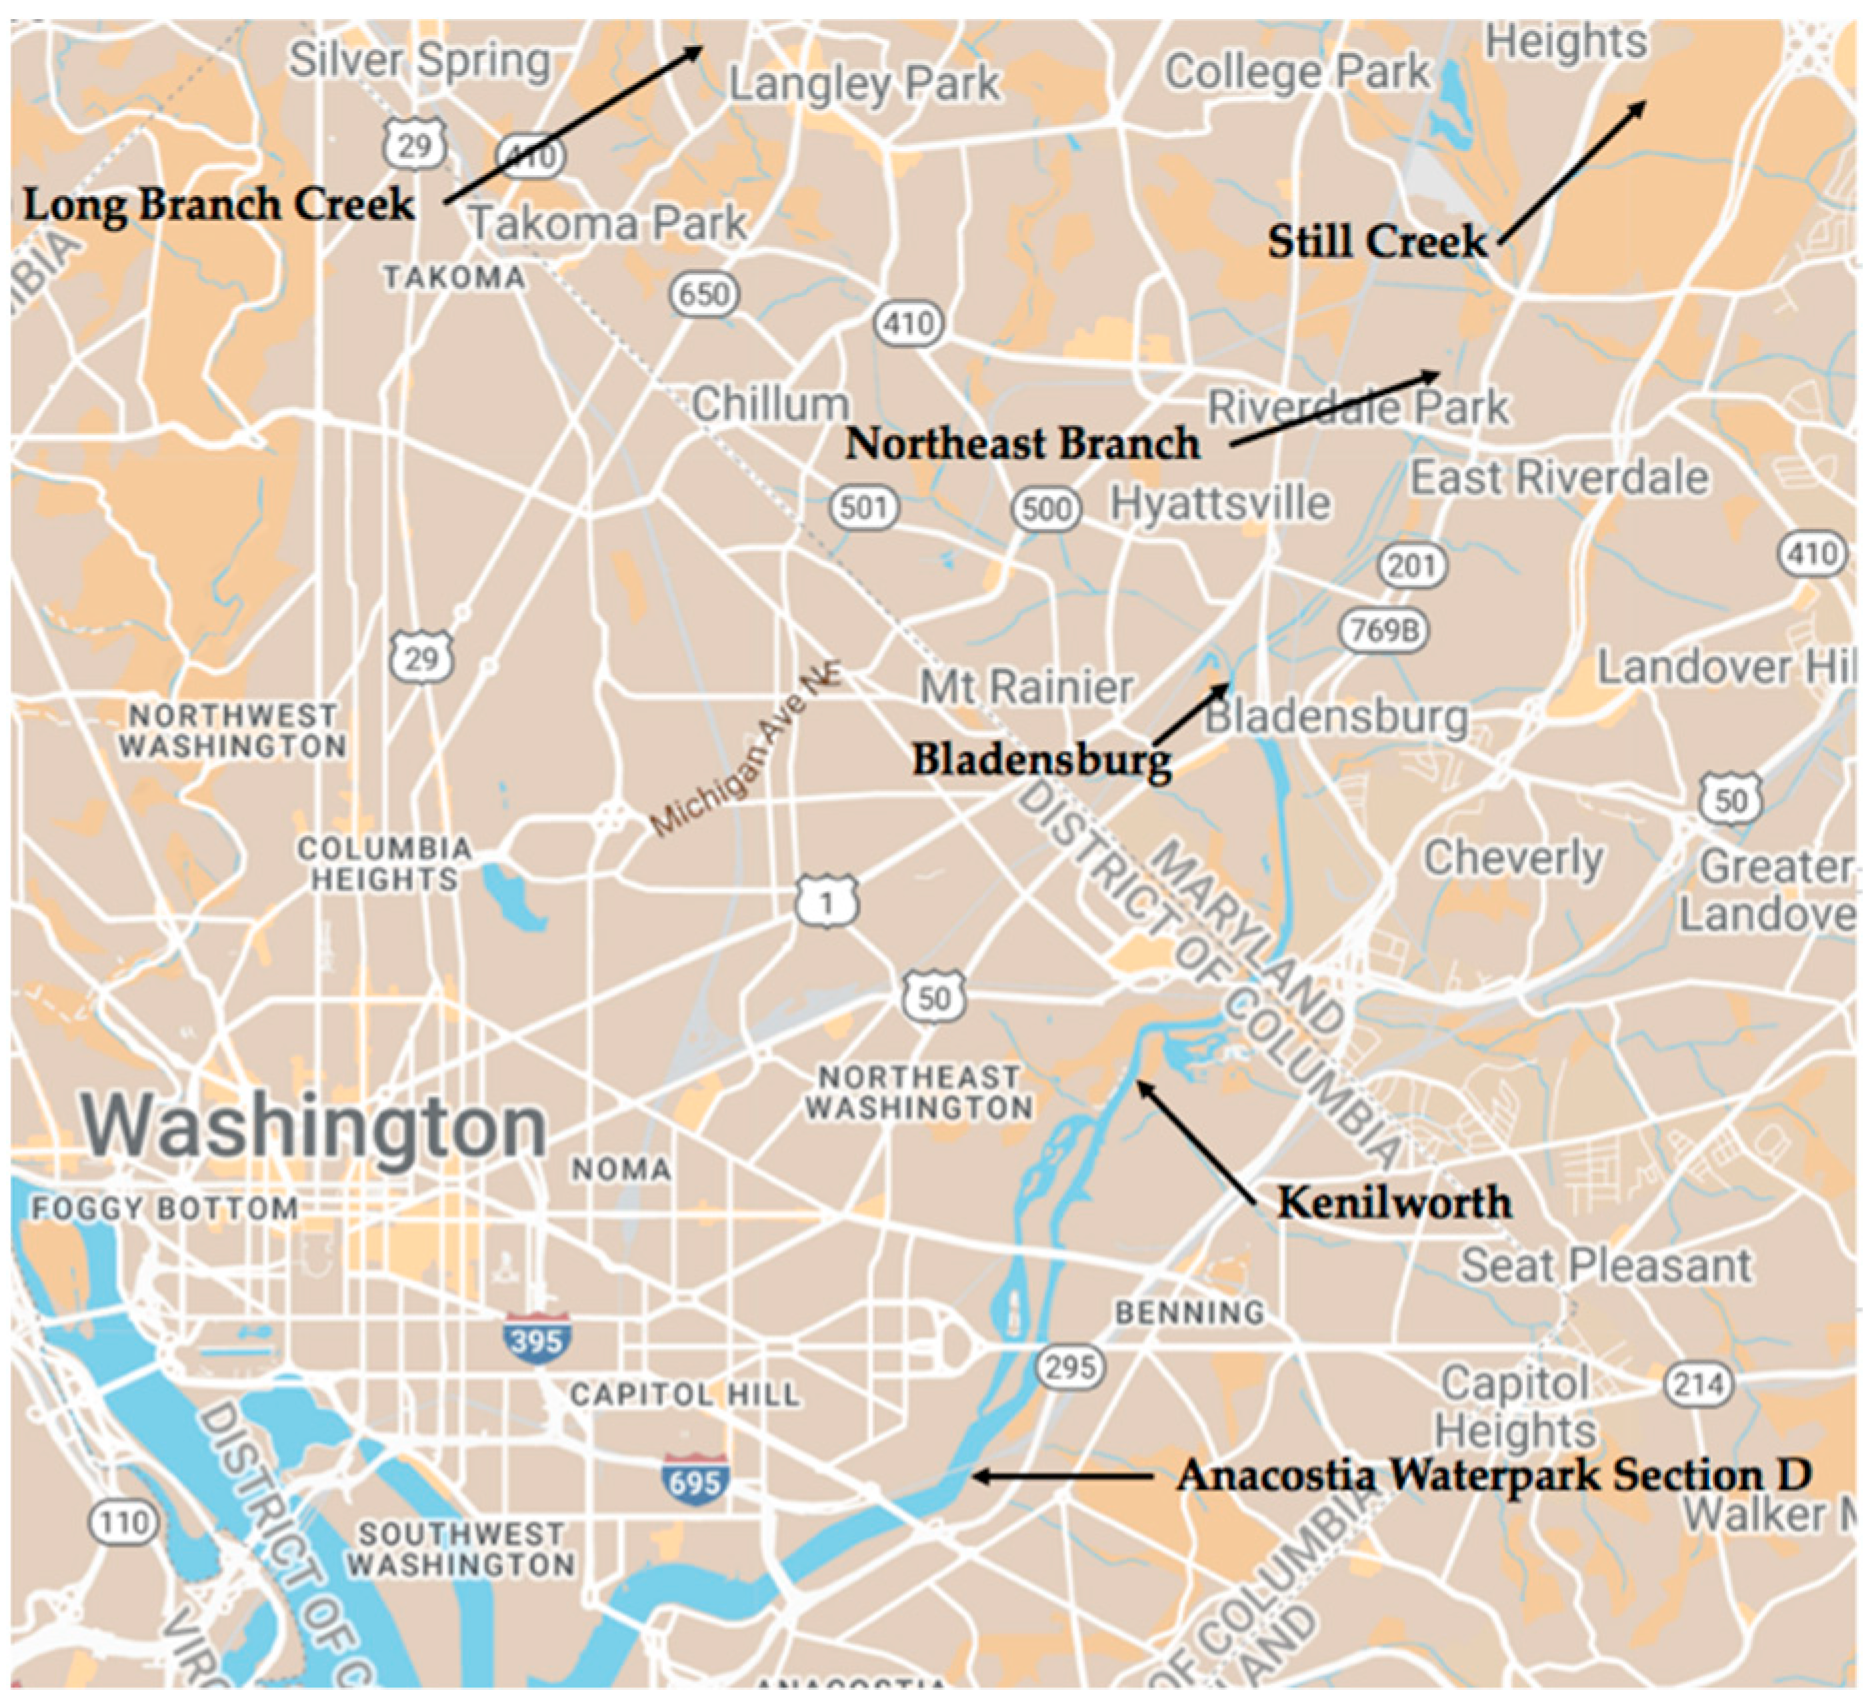
Three suburban and three urban sites were chosen for water chemistry analysis (Figure 1). Urban areas have higher population densities in comparison to suburban areas and they are adjacent to outflow locations for stormwater drainage pipes, combined sewer outflows, or both. Urban areas usually include the inner or main city, whereas suburban areas are those that are adjacent to or surrounding the city. The more suburban sites were Long Branch Park (approximately 33% impervious), Still Creek (19% impervious) and the Northeastern Branch (37% impervious). The Anacostia main stem (and presumably more urban) sites were the Bladensburg Marina, Kenilworth Park and Anacostia Park (the collective tidal Anacostia is 40% impervious) [13]. Long Branch Creek runs through relatively suburban Takoma Park, Maryland. Still Creek flows through Greenbelt Park (a 445-hectare National Park in Maryland) but is surrounded by suburban development. The Northeastern Branch is due east of the University of Maryland main campus and downstream of the confluence of three other creeks; Indian Creek, Little Paint Branch, and Paint Branch. The Bladensburg site is directly downstream from where the Northeast and Northwest Branches converge and is adjacent to two stormwater overflows. Kenilworth Park was previously a landfill that caught fire and was turned into a recreational park in the 1970s. The Anacostia Park (Section D) is upstream and across the river from the Navy Yard.
2.2. Water Chemistry
Water collections were made at most sites approximately 8 times a year, over six years: 2014 to 2020. The total number of samples collected at each site ranged from 26 to 29 (logistics around access sometimes prevented collection (closed access areas for example)). Water column samples were collected using 500 mL acid-washed HDPE bottles. All samples were insulated and transported to Cornell’s Nutrient Analysis Lab for analysis of water nutrients and inorganics (pH, hardness, SAR, alkalinity, TDS, Ca, Mg, Na, K, Fe, Mn, Zn, Al, As, B, Ba, Be, Cd, Cr, Cu, Co, Mo, Ni, Pb, total P, S, Sr, Ti, NO3−, and NH4+). Methodology for nutrient and inorganic ion analysis was based on EPA requirements (Standard Methods for the Examination of Water and Wastewater, http://www.standardmethods.org/, accessed on 11 April 2022). A Colorimetric Bran-Luebbe Automated Ion Analyzer was used for NH4+, PO43−), and NO3−. Elements were analyzed by plasma-atomic emission spectrometry (ICP-AES), which determines trace elements, including metals, in a solution. Nutrient ions are reported with charge, elements are not.
2.3. Quality Assurance/Quality Control
For ammonia analysis, every 20 samples analyzed had one sample duplicate and one sample spiked at the low and high levels. The relative percent difference (RPD) of the duplicate was within 20%. For nitrate analysis, there was a blank (<0.001) and standard check every 20 sample cups. The standard recovery was between 90 and 110% for all runs. Additionally, duplicates were run every 20 samples. The RDP for the standard was within 20%. For phosphate analysis, a reading of a standard and duplicate was performed every 12 samples and at the end of the run. Standards were within 10% of the actual value (for further details see EPA Method 356.1.). For the ICP elemental analysis of water samples, blanks (reagent water) were analyzed regularly to ensure no memory effects or contamination. A spiked sample was used each run to ensure recovery was within 10% of the actual value. For further details of elemental analysis methods, please refer to EPA Method No. 6010-B.
2.4. Statistical Analysis
Principal components analysis (PCA) is a powerful method for analyzing co-variation among many variables in large data sets and was used to examine the 30 water chemical variables analyzed in this study [14]. The PCA can be thought of as a way of linearly transforming the data as it is arranged in three-dimensional space. Since the results of the PCA are a way of organizing the data and were only to be used to examine relationships, as opposed to generating models (regressions for example), raw data were used [15,16]. When considering relationships among geochemical or nutrient variables indicated by the PCA, we approximated Puckett and Bricker’s [17] subjective practice for considering loadings by only considering values > 0.60 as qualifying for interpretation (they used 0.50). Those over 0.75 were interpreted as additionally important. This is more conservative than criteria by some other researchers (for example: 0.40 for Miller and Drever [18], and <0.4 for Reeder et al. [19]). Data were not transformed (log or otherwise) prior to the PCA. Simple regressions were used to generate predictive relationships between specific variables where appropriate. Multiple comparisons were made among meteorological seasons or sites using Wilcoxon tests (JMP, Inc., Cary, NC, USA).
3. Results
Data from all sites showed very high variation, with standard deviations frequently greater than the means (Table 1). Non-parametric Wilcoxon rank comparisons of major cations, metals and nutrients were made among sites (Table 1) and among meteorological seasons (Table 2).
3.1. Cations, Metals, and Nutrient Concentrations among Sites
Long Branch Creek had significantly higher Ca, Mg and nitrate relative to the other sites (Table 1). Long Branch also had significantly higher Si and lower Fe than other sites (but Bladensburg had low Fe as well). Metals/Metalloids such as As, Co, Cr, Cd, Mo, Pd, and Ni were seldom detected at any site and when they were, concentrations were below 0.002 mg/L. There were no differences in Cu (mean concentrations ranging 0.003–0.005 mg/L), pH (7.2 ± 0.5 range), or Al (mean concentrations ranging from 0.1 to 0.2 mg/L) among sites. Mean P was highest at the Anacostia Park, but the standard deviations were all higher than the means and sites had similar ranges in concentration (0.02–0.5 mg/L). Ni was significantly higher at Still Creek (in Greenbelt Park) relative to the main stem sites at Bladensburg and Kenilworth (3.6 ± 5.4 ug/L versus 0.7 ± 1.9 ug/L and 0.8 ± 1.8 ug/L, respectively). Strontium was highest at Long Branch (0.29 ± 0.14 mg/L N = 27) and lowest at the Northeast Branch (0.10 ± 0.03 mg/L). Ammonium and nitrate were higher at Anacostia Park than all other sites except for Kenilworth (ammonium) and Long Branch (nitrate) (Table 1). The sodium absorption ratio (SAR) was highly variable, with SD being 3× the means in some cases (Table 1). SAR is calculated by the following equation:
SAR = Na (meq/L)/(square root of (Ca (meq/L) + Mg (meq/L))/2)
At all sites, the mean SAR was high relative to what would be expected in a more pristine environment, and in terms of sodium hazard (for irrigating crops), bordered on “medium” (indicating that amendments such as CaSO4 are needed before irrigation) to “high,” meaning unsuitable for continuous irrigation.
3.2. Seasonal Trends in Cations, Metals, and Nutrient Concentrations
For elements and nutrients that were consistently detected, trends were examined with respect to the meteorological season. Differences were not observed for Ca or Mg (Table 2). K and Fe were higher in meteorological winter compared to spring and summer. Na was significantly higher in winter and spring relative to summer and fall. For Mn, seasons were different from each other except for fall vs. summer. Zn was higher in winter than in other seasons, as was Al, although Al was only significantly higher in winter relative to summer. For Ba, winter and spring were higher than fall or summer. For B, summer was higher than fall or spring, while spring and winter were higher than fall. Looking at trends with salts and pH, SAR shows substantial changes with season (Table 2). Spring and winter are significantly higher than summer and fall. Soluble salt and TDS followed the same pattern although winter was higher than spring, which was reversed for SAR. The only seasons that were not statistically different from each other were summer and fall. Hardness showed large variability within each season and no significant differences were detected among seasons. Hardness means ranged between 60 and 350 mg/L. pH did not significantly differ and values ranged from 6.2 to 8.4 with means between 7.2 and 7.4. Examining how inorganic nutrients change with the season, one again sees high variability and significant differences were only observed between summer and spring (Table 2). Nitrate was significantly higher in winter relative to other seasons; however, the only seasons that were not different from each other were summer and fall (both low). For phosphorus, fall was higher than spring and summer.
3.3. Ratios
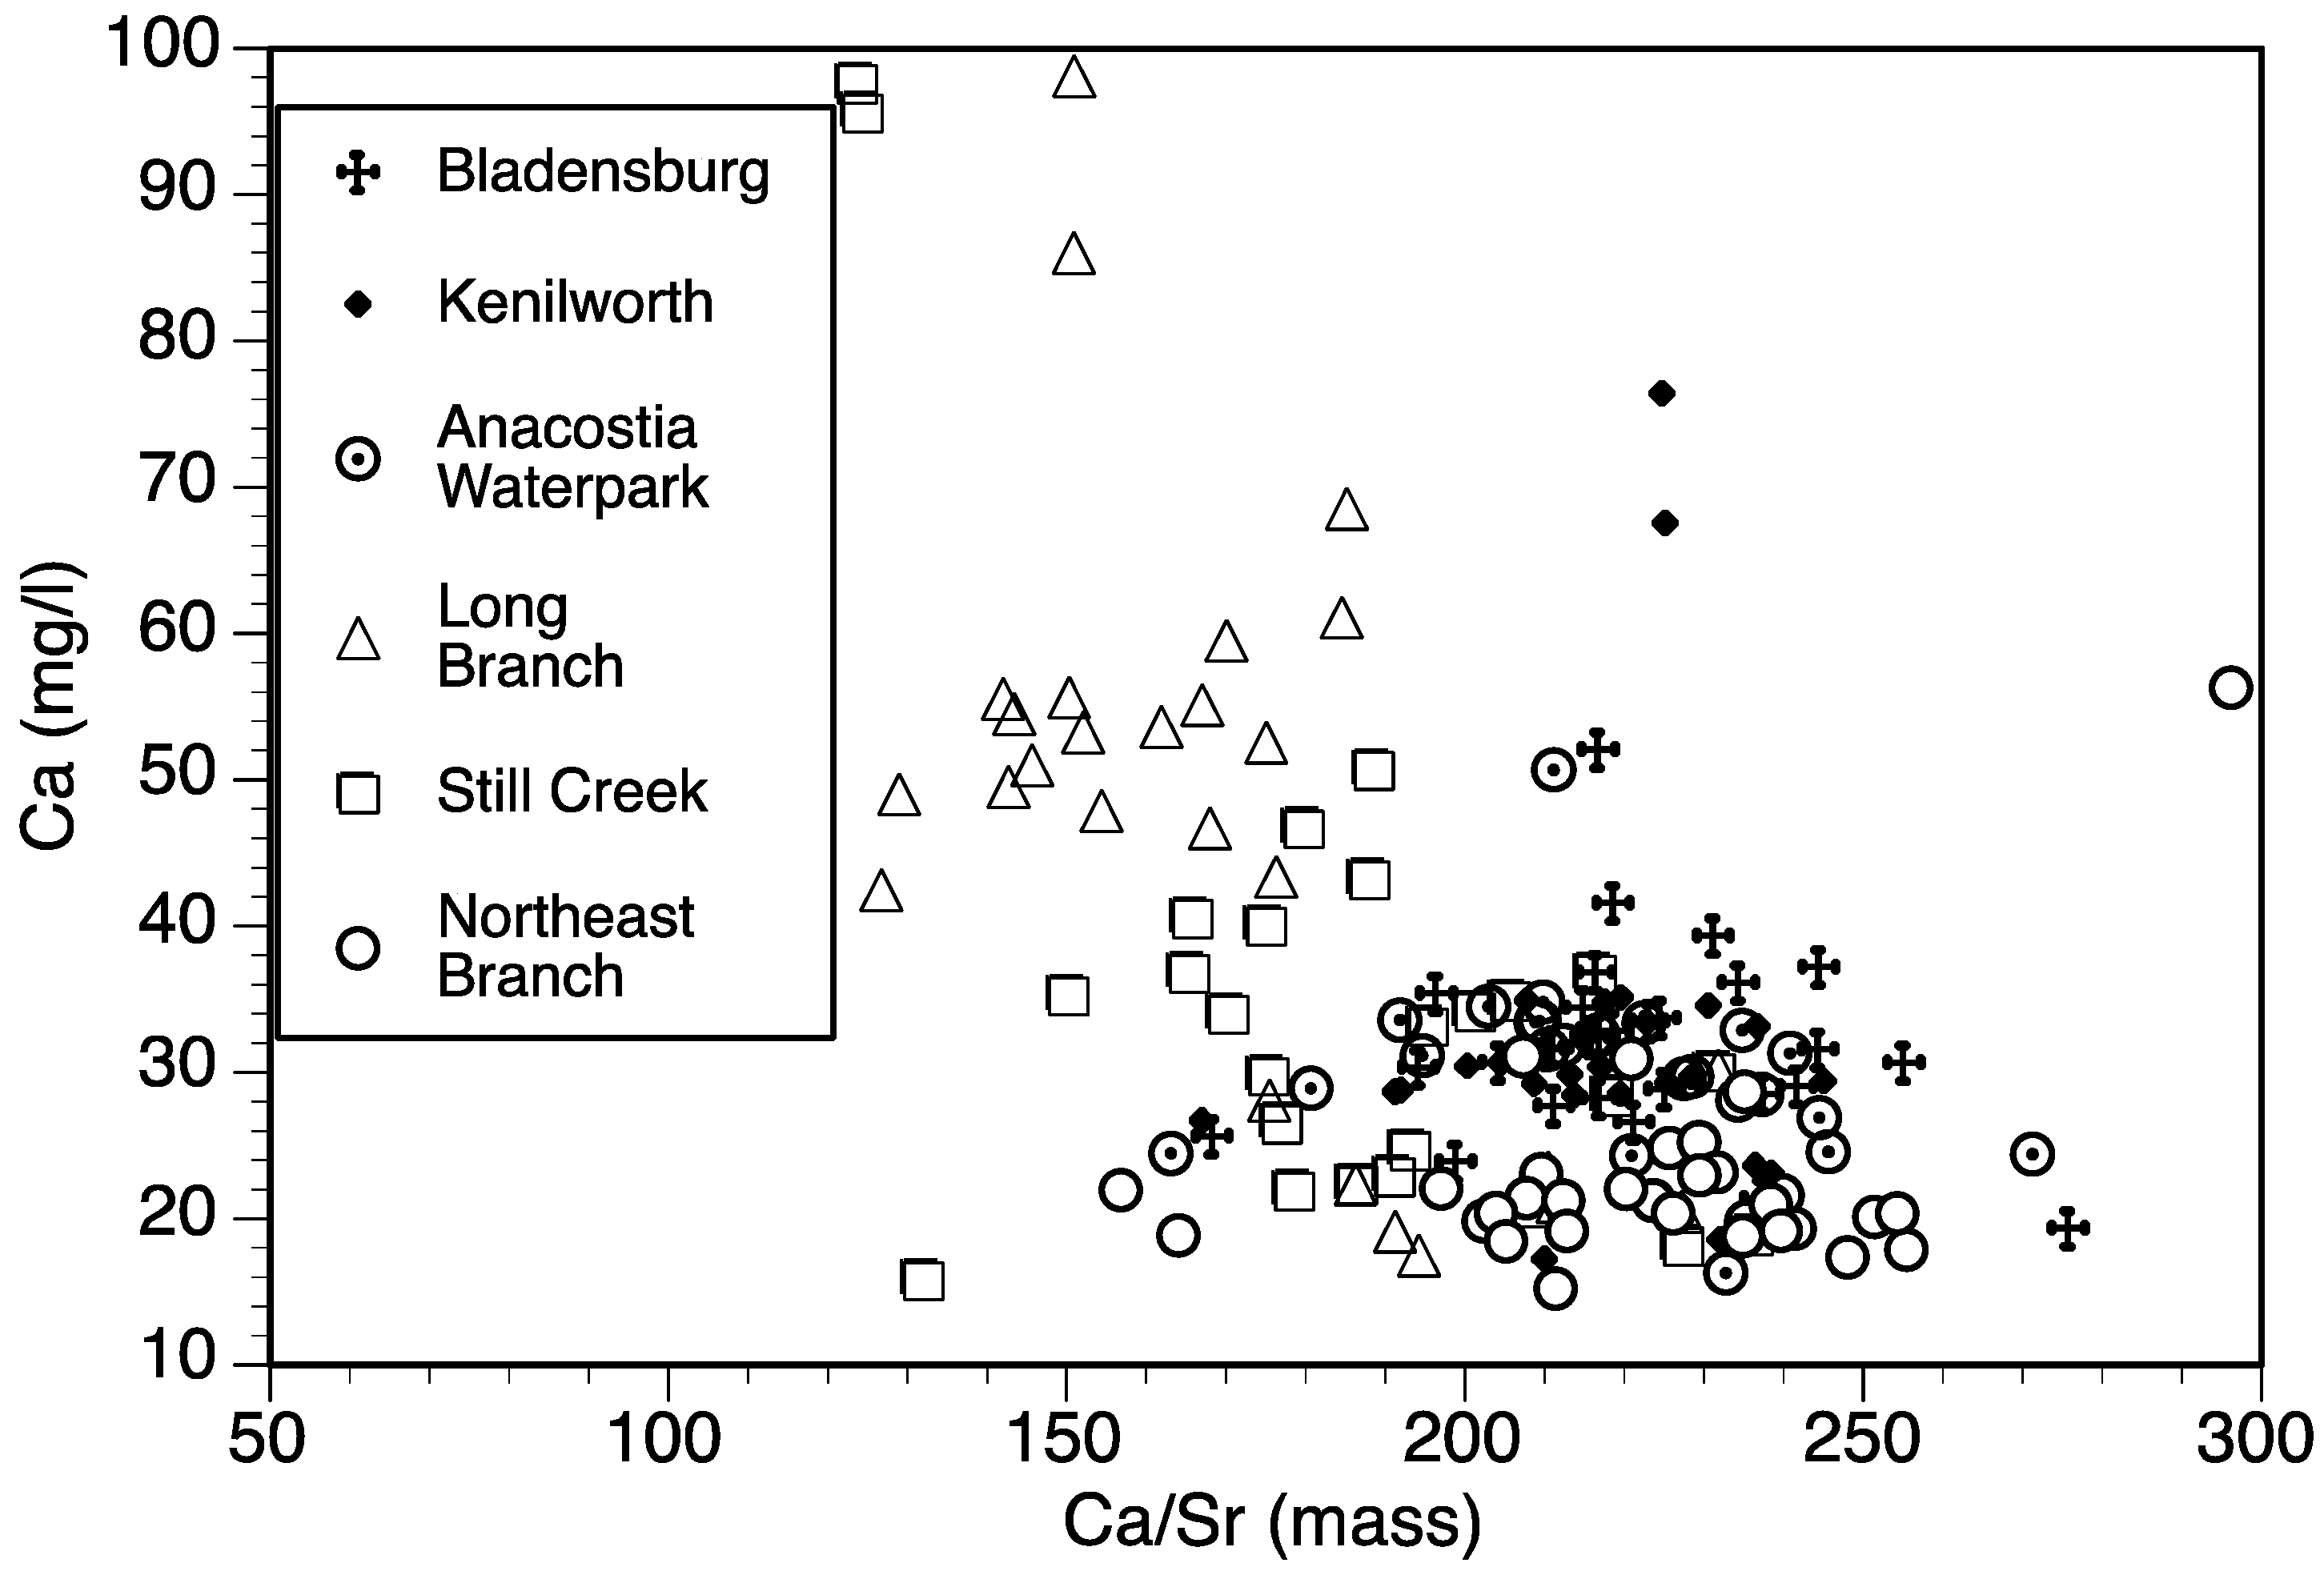
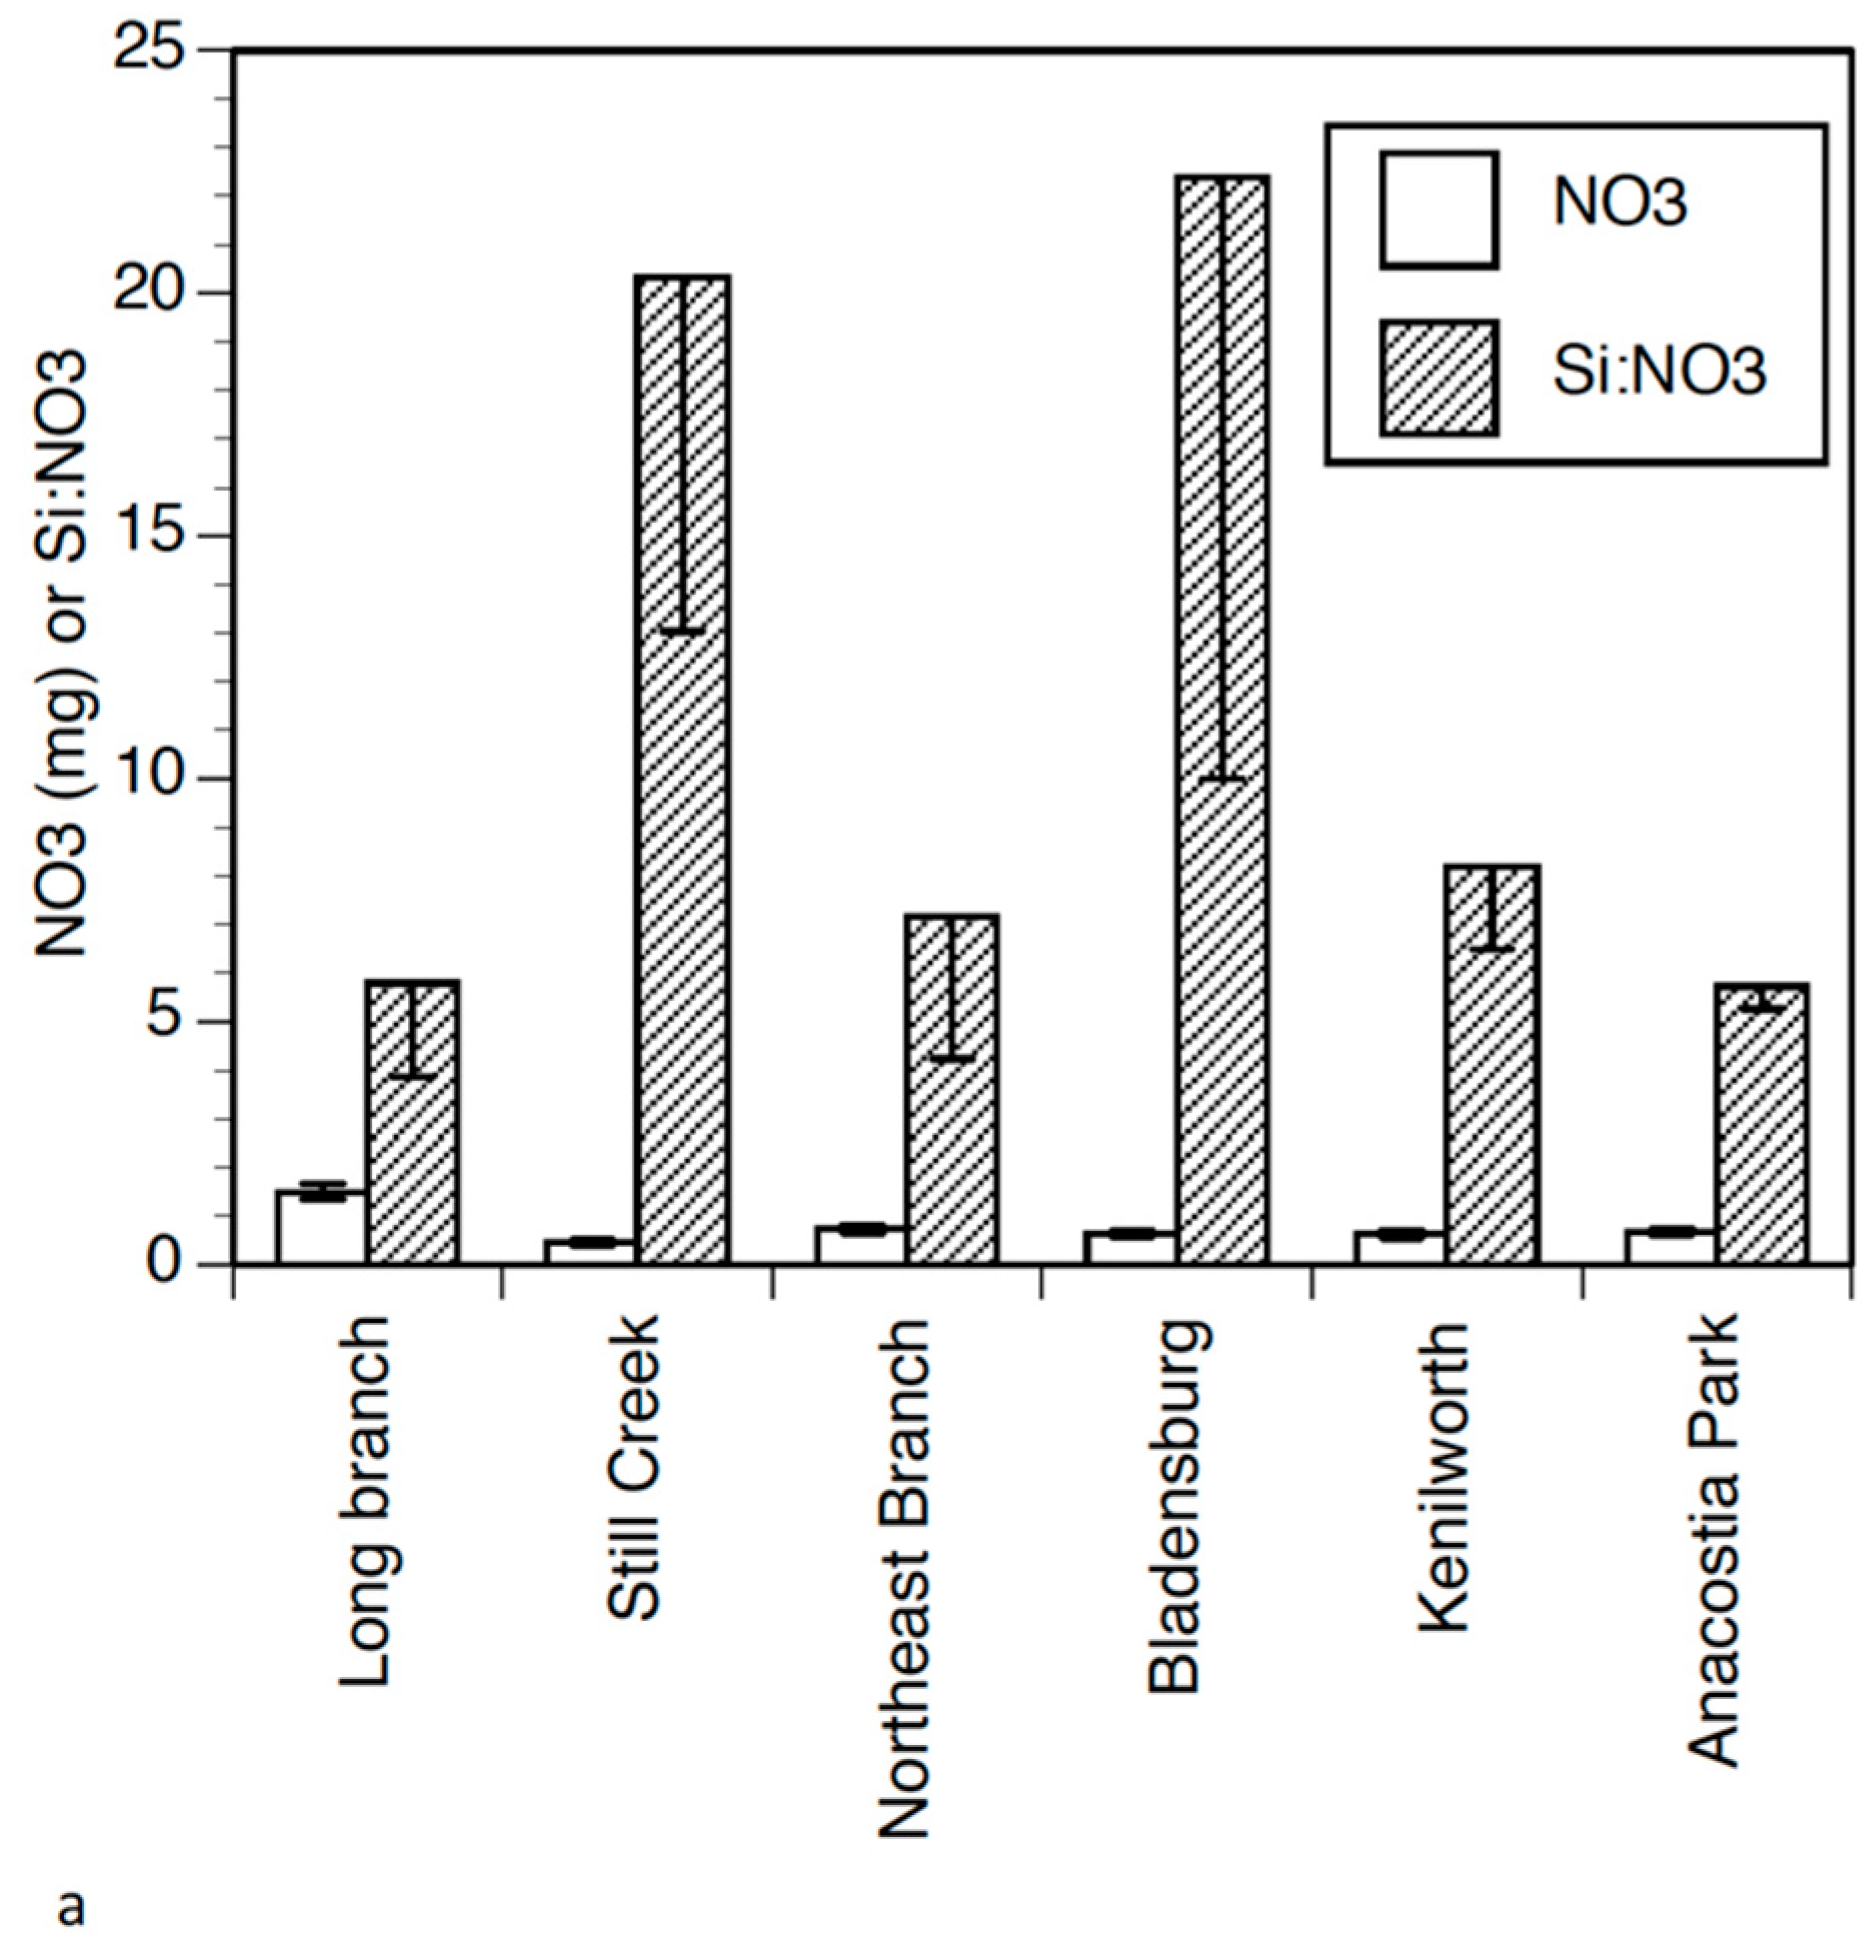
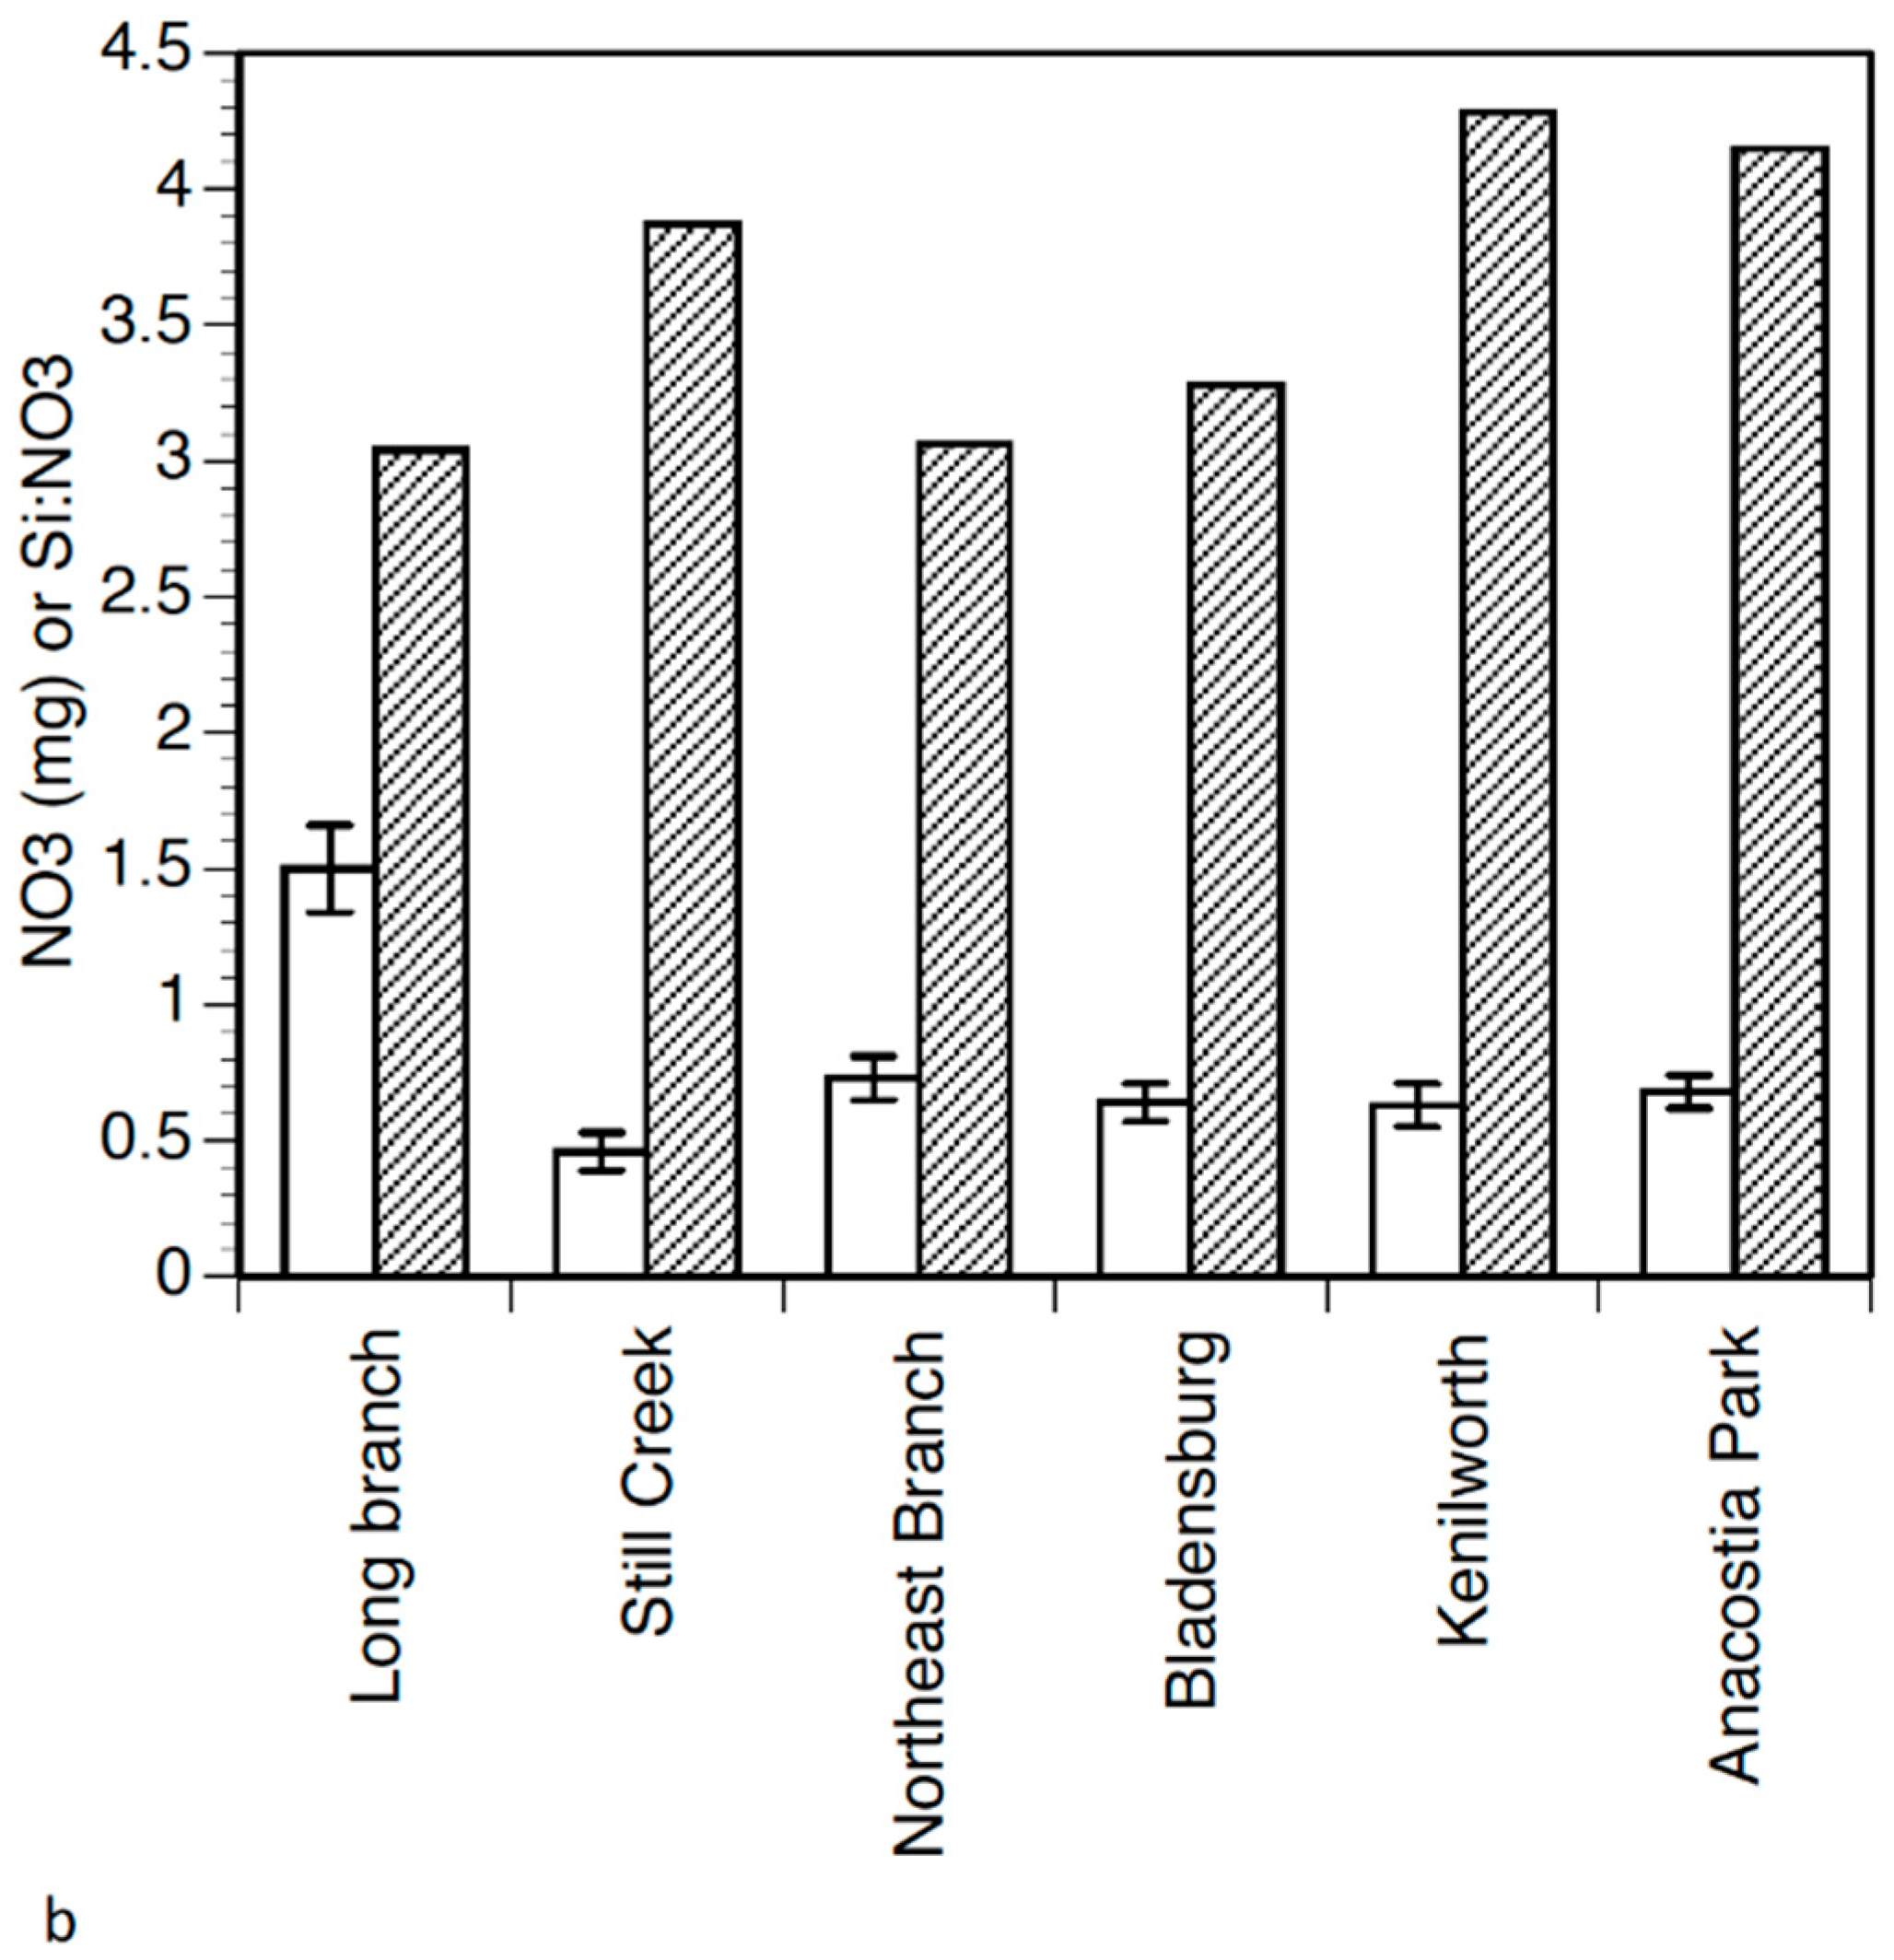
Ca/Na molar and mass ratios were below 1 and were lower for Still Creek relative to Kenilworth, Bladensburg and Anacostia Park. Ca/K was higher, generally between 5 and 7, with the Northeast Branch being lower than the other sites (Table 3). Ca/Sr concentration ratios were <200 for the three more suburban sites and were >200 for the three more urban sites on the main stem (Table 3, Figure 2). Regressions showing the tendency for Ca to correlate with Sr reveal that the relationship between the cations at all sites is not the same (Figure 3). Long Branch and Still Creek show higher Ca relative to Sr compared to other sites. The ratio of Si:NO3 was examined since it can indicate the degree of anthropogenic nitrate. All sites examined in this study have ratios with a median of 4 to 5 (Figure 4). Long Branch, which had the highest Ca concentration, also had a median Si:NO3 of 3 and a mean of 6: both values being among the lowest for any site (Figure 4). TDS vs. Na/(Na + Ca) was also examined since it can indicate if groundwater, precipitation or seawater are the stream water source. Water chemistry for world rivers shows that many fall upon the ranges expected for groundwater (Figure 5) [20,21].
3.4. PCA
The principal components analyses were performed for the dataset overall and for each site. Factor scores of 0.60 or greater were considered a strong association (Table 4). Overall, principal component 1 explained 23.9% of the data variance (largely cations, including Ba and Sr (both 2+ cations)), but only 0.4 for Na and nitrate. Component 2 explained 13.5% (mostly metals: Fe, Mn, Al, Cr, Co, Ni and Ti), and component 3 explained 7.6% (correlated most strongly with Be and P). Examining individual sites, the component that explained the most variation (between 22 and 35%) was strongly associated with Ca, Mg, K, Ba and Sr. Interestingly, Na was only correlated with component 1 at Long Branch Creek. Principal component 2 explained between 12.5 and 16.3% of the variance and was associated with metals such as Fe, Mn, Al, Cr, Co, Ni and Ti. The third component explained 7.6% and was correlated Be and P (Table 4). Si was only correlated with a component (2nd) at Still Creek and was not associated with cations at any site.
4. Discussion
4.1. Cations and Ratios
Cations derived from silicate mineral weathering have high Ca/Na (higher than 8 was observed by Bu et al. [24] and low Ca/K. The Anacostia watershed is largely underlain by silicate minerals (as listed in the methods); however, the river water is chemically distinct from what normally drains silicate-derived soils. The Ca/Na ratio observed in the Anacostia is very low (Table 3) because of the high concentration of Na throughout the watershed. The elevation of Na in urban streams has been termed “salinization syndrome” and can occur even in the absence of road salting [8]. Although winter and spring have higher Na concentrations than summer and fall, base flow mean Na averages > 80 mg/L, which is three times that of Ca and is extremely unusual for a river more than >100 km from an ocean. K concentration is also several times higher than that observed by Bu et al. [24], which makes the Ca/K ratios lower than what they report. Kaushal et al. [8,25] noted the elevated K can be associated with “urban karst,” mainly consisting of concrete infrastructure.
Portland cement is the dominant type used by the Washington D.C. Dept. of Transportation [26] and is composed mostly of calcium silicate minerals (Pavement Interactive). Its chief chemical components are calcium silica, alumina and iron. The calcium is derived from limestone, marl or chalk. Silica, alumina and iron come from sand, clay, and iron ore. The materials used to make concrete are low in Sr and the Ca/Sr ratio for Portland cement ranges between 260 and 305 [22], while non-carbonate natural Ca sources are Ca/Sr < 200 [27].
Ca/Sr > 200 in waters without carbonates (which is the case in the main stem of the Anacostia), suggests concrete as the calcium source (Figure 2). Additionally, dissolved Si was not correlated with the cations at any of the sites, suggesting that silicate mineral weathering was not a strong source of cations either. Still Creek and Long Branch had Ca/Sr ratios < 200 and Long Branch Creek had higher Ca than other sites. Given the high nitrate at Long Branch, it is possible that leaking sewer pipes are releasing both nitrate and calcium. Kaushal et al. [28] examined nitrogen stable isotopes in suburban Baltimore and found that lawn fertilizer was not a likely source of nitrogen (the δ15N of nitrate was higher than expected for ammonium fertilizer) and leaking sewers were the likely source. It is possible that is also the case in the suburban Anacostia watershed.
A metric that can be used to assess natural versus anthropogenic sources of nitrate in freshwater is the Si:NO3 ratio. Currently, dissolved silica is decreasing in impounded or eutrophic rivers [23]. At the same time, nitrate is rising in agricultural or sewage impacted/eutrophic rivers. Natural rivers in the early 1900s and prior had Si:NO3 ratios of 10 or more. Modern agriculturally impacted rivers have values less than 1.0 (in the Mississippi for example) [23]. As mentioned in the Results, all sites had ratios with a median of 4 to 5. Long Branch, which had the highest Ca concentration, also had a median Si:NO3 of 3 and a mean of 6: both values being among the lowest for any site. While these data cannot identify sewage as the nitrate and calcium source, they do suggest anthropogenic nitrogen.
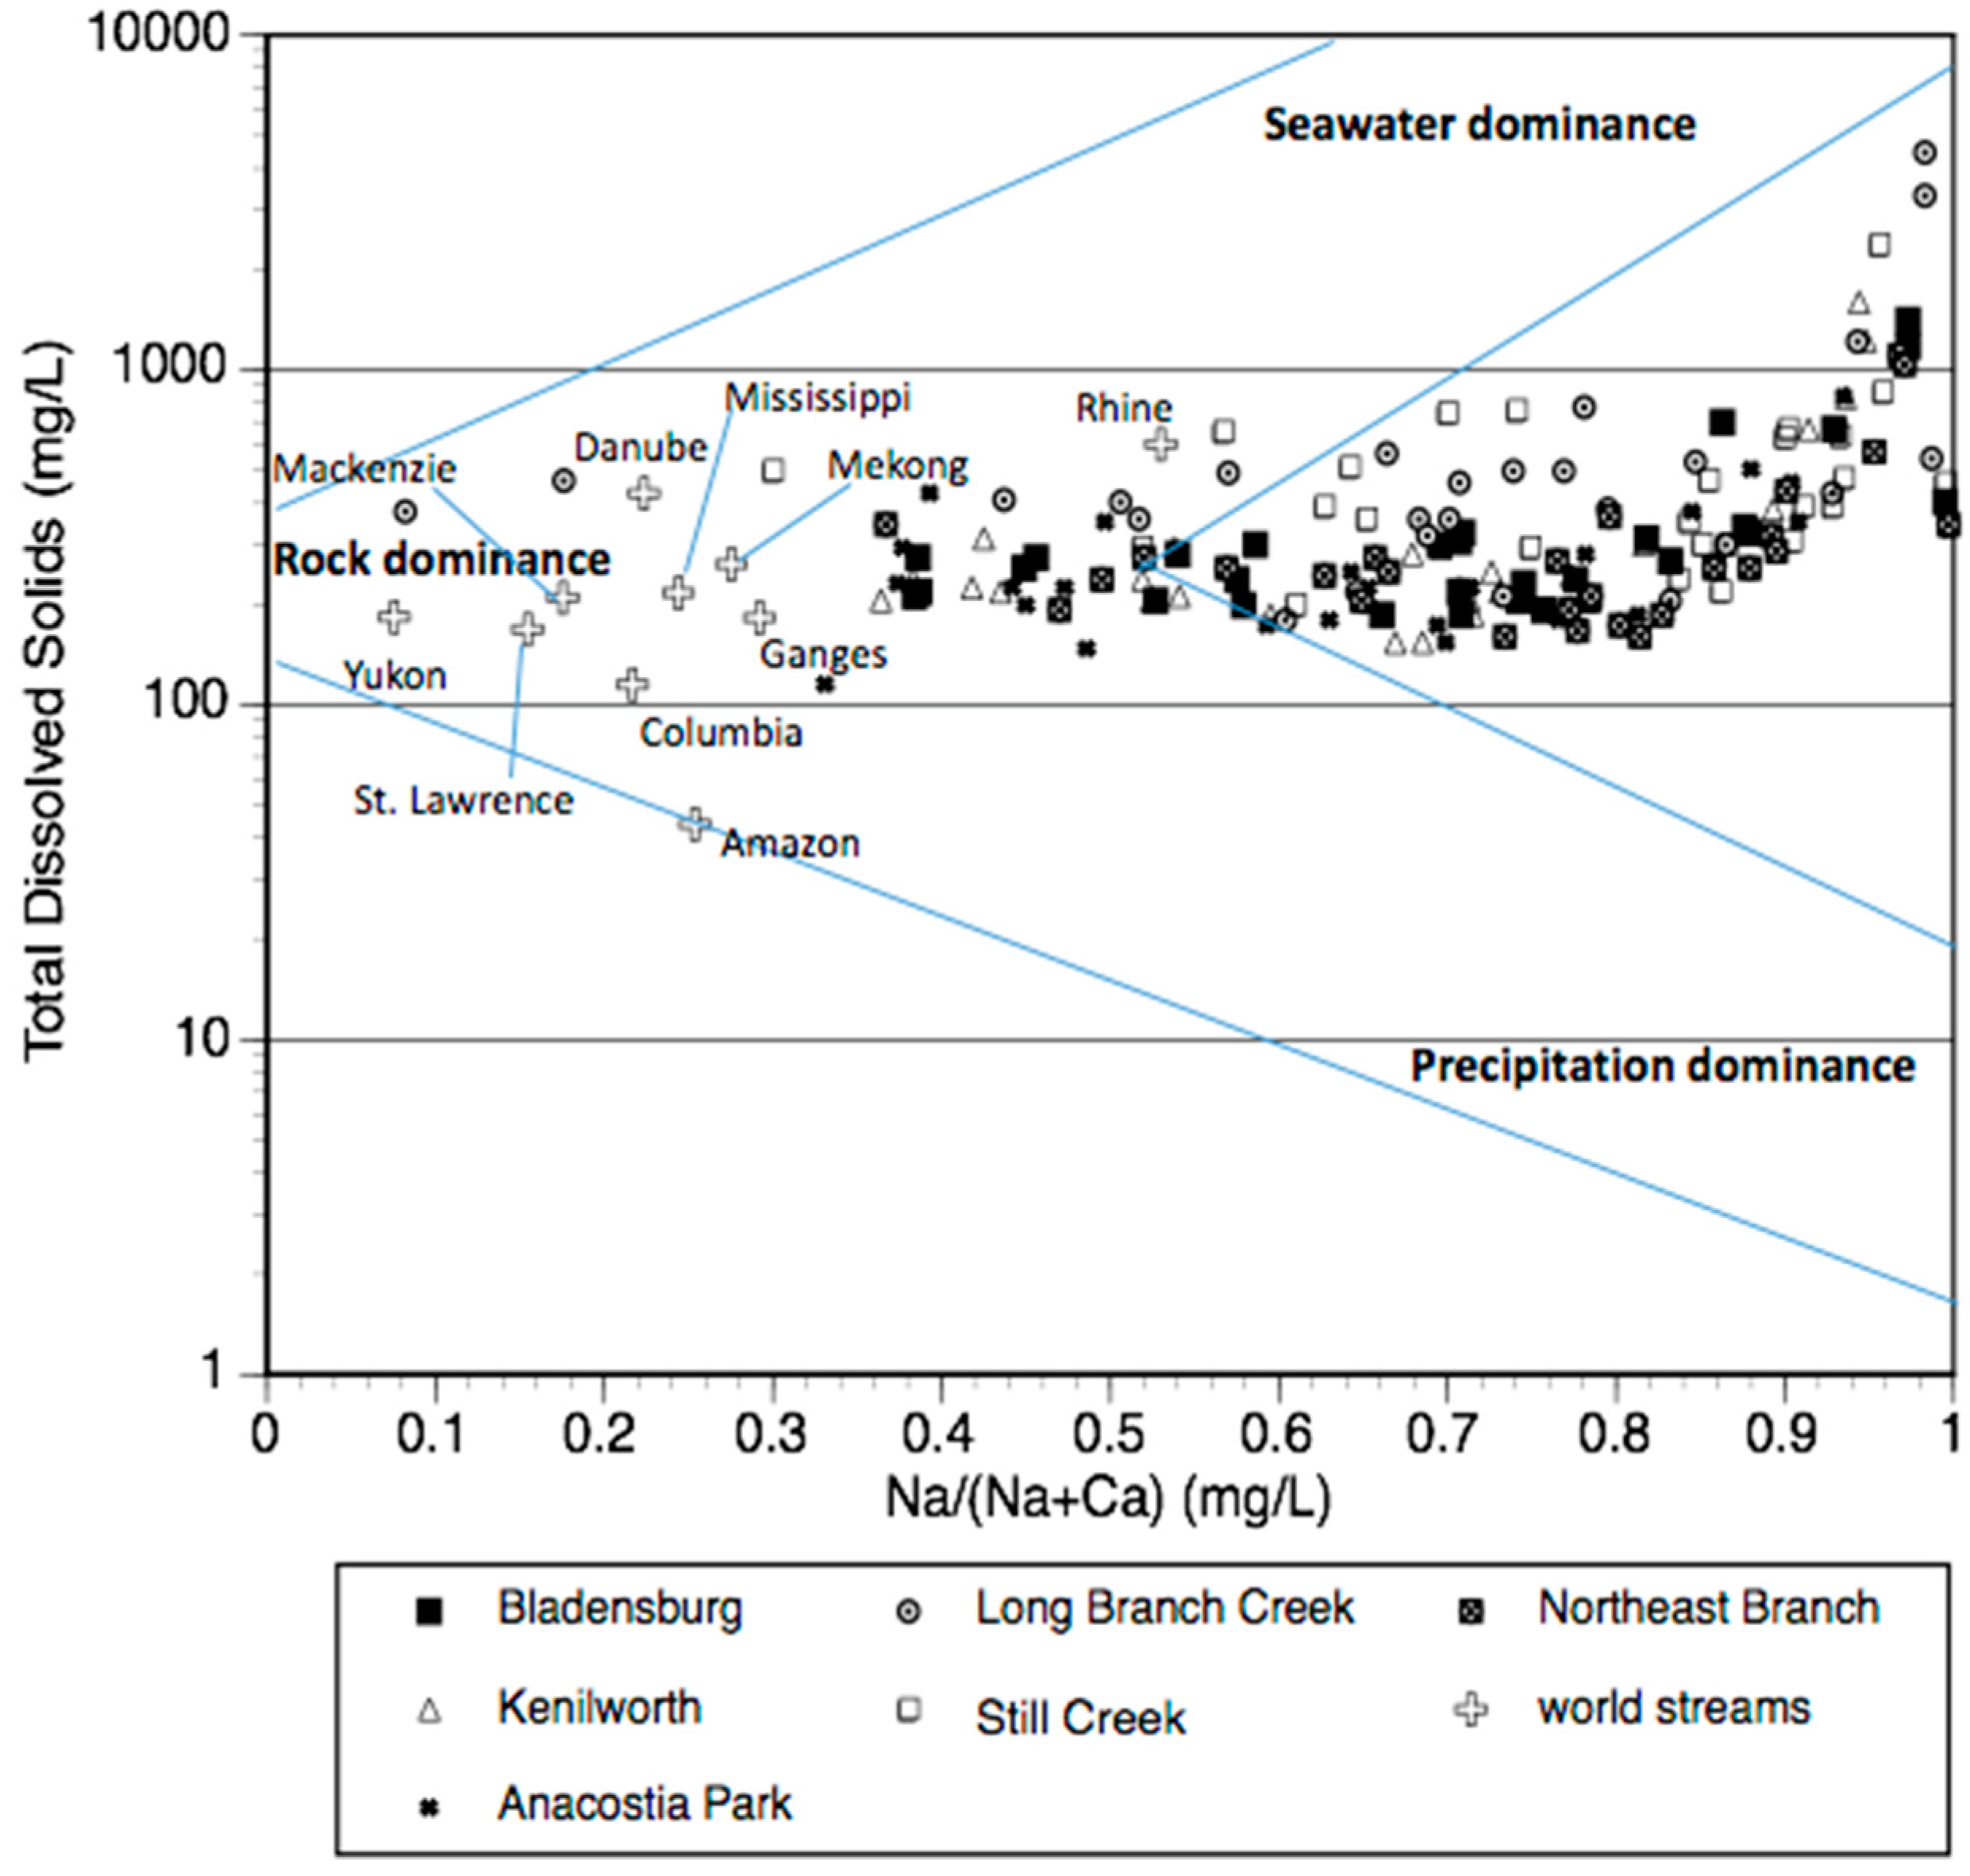
In 1970, Gibbs published a classic figure plotting Na/(Na + Ca) versus total dissolved solids (TDS) as a way of identifying the sources of river water [29]. Large rivers are generally grouped within the “rock dominance” region of the figure (Figure 4). Plotting the six sites examined in this study clearly shows that the Anacostia and its tributaries are often beyond the range usually observed for rivers. The elevated Na at base flow (salinization syndrome, a more specific characterization of urban stream syndrome) pulls the water chemistry away from what is normally observed in freshwater [9]. The TDS values approaching 1000 mg/L and above (almost brackish) indicate road salting during the winter months.
The SAR values also clearly show seasonal differences in water chemistry. During the summer and fall, the values are high compared to precipitation or soil water but could be considered safe for irrigating food crops if calcium amendments were added to the soil. During the winter and spring, the SAR values are within the “very high” unsuitable for irrigation and no amount of calcium amendments will make the water usable by plants (crops at least). Soils treated with water showing ratios > 9 would have permeability problems [30]. Calcium helps soil particles flocculate whereas sodium contributes to the dispersion of soil particles and interferes with ion uptake. While Anacostia water is not being used to grow crops, using SAR as a water quality metric further demonstrates that the river is experiencing salinization syndrome.
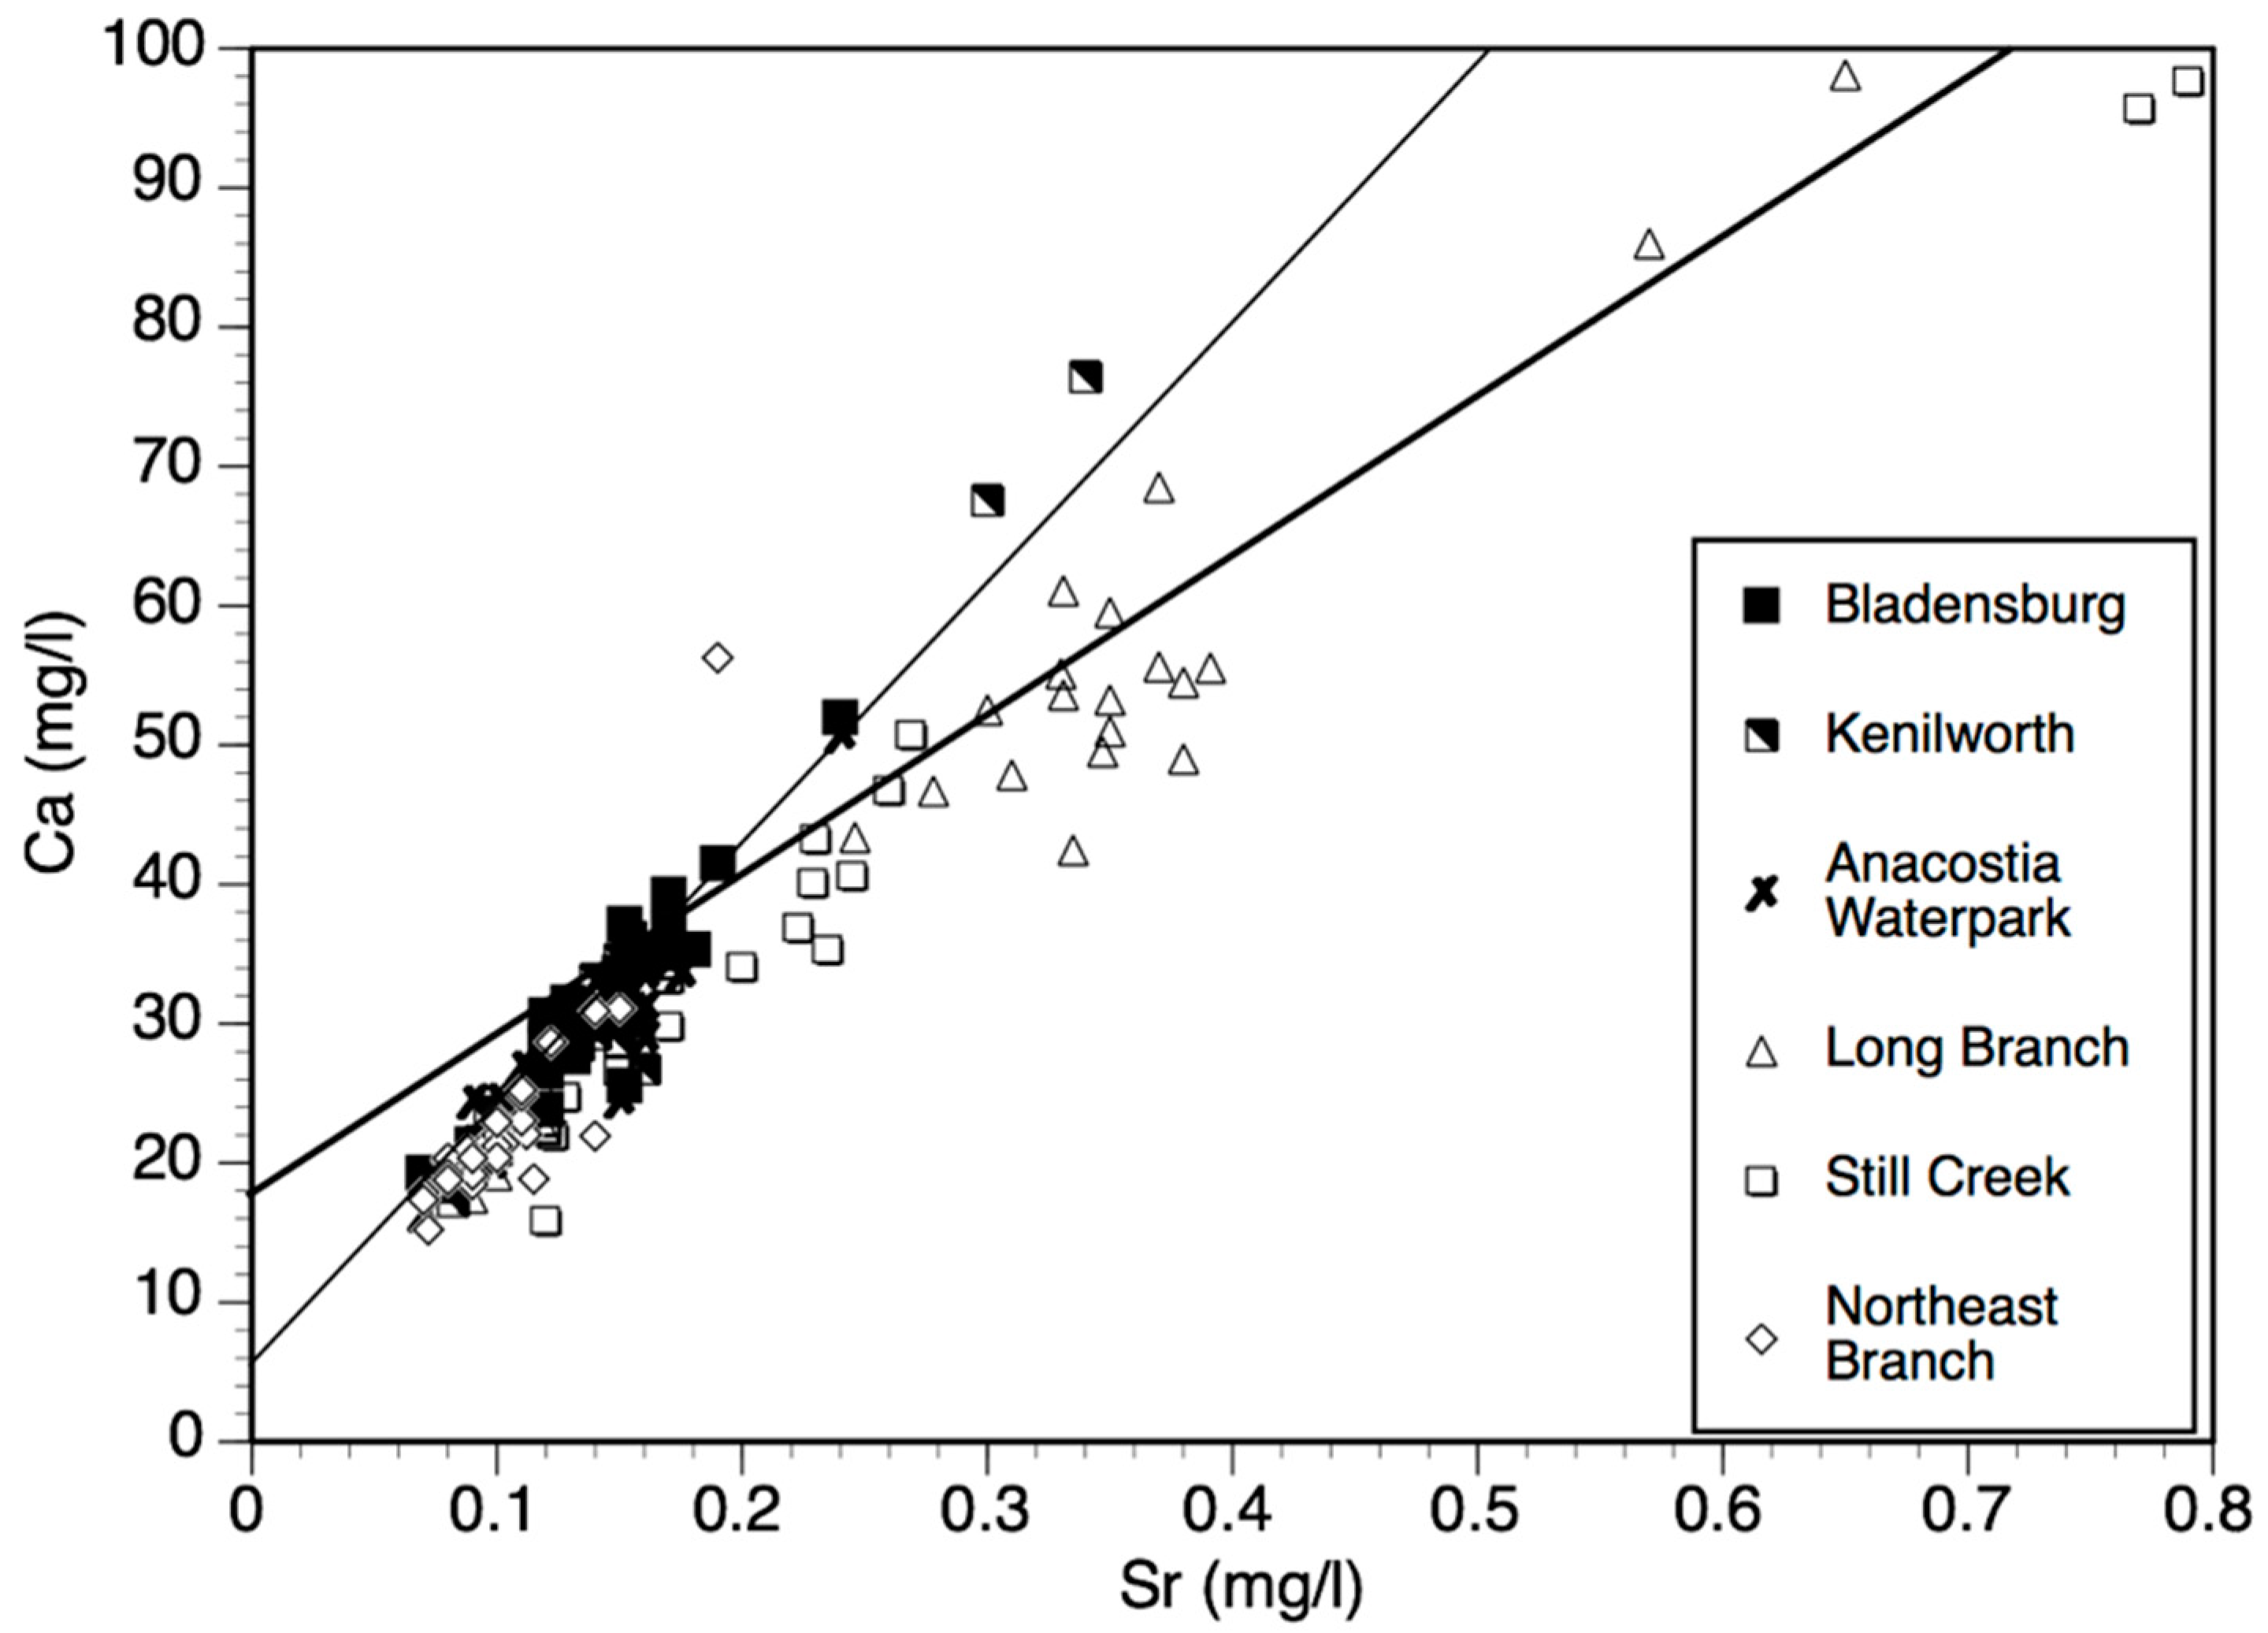
If Sr correlates more strongly with Mg than Ca, it points to other sources for Ca than carbonate [24]. The correlation for Ca vs. Sr is 0.89 for all sites combined and for Mg vs. Sr is 0.80. However, as shown in a regression of Ca vs. Sr, there is a clear difference in the relationship between some sites (Figure 5). The two suburban sites with higher Ca also have higher Sr relative to the other four sites. The regression for the Long Branch and Still Creek has a shallower slope relative to the urban sites plus the Northeast Branch because of the higher Sr concentration. Bu et al. [24] show a regression (Ca vs. Sr.) that is similar to the more urban sites (thicker line), although they report a lower r2 (0.88) and have lower concentrations for both cations than in the urban Anacostia sites. The river examined by Bu et al. [24] exists in a carbonate-dominated watershed (Jinshui River basin, China) which the Anacostia partially resembles but only because of artificial carbonates (concrete) in the more urban sites.
4.2. Mn and Fe
Although it is an essential element for plants and animals, the recommended upper limit for Mn in drinking water is 0.05 mg/L (NAS-NAE 1972 as cited in Hem [31]). It usually originates from pyroxene, amphibole, basalt and olivine [31]. Mn is increasingly used in manufacturing and is a common pollutant associated with degraded dry cell batteries. Shiyong et al. [32] found mildly elevated Fe (1.3×) and markedly elevated Mn (5×) in urban Wuhan streams (0.371 and 0.047 mg/L, respectively) relative to their reference site, the Yangtze River. Although Bladensburg is lower in Mn than the other sites, the concentration was still elevated (mean 0.03 ± 0.10 mg/L, Table 1) relative to the concentrations Shiyong et al. [32] report. Still Creek had even higher values, with mean Mn that was 3 × what Shiyong et al. [32] observed. Fe was also within the ranges reported by Shiyong et al. [32]. Highest Fe was observed at the same sites that had high Mn and a simple regression of all sites combined was significant (p = 0.0001) and showed a positive correlation, but the r2 was low (0.27; data not shown). The elevated concentrations of Fe and Mn reflect anthropogenically influenced geochemistry but there was not a strong urban versus suburban distinction.
5. Conclusions
Taken as a whole, the data suggest that freshwater salinization syndrome (a specific type of urban stream syndrome) is occurring in the Anacostia and its tributaries. The developed landscape in suburban environments, however, influences geochemistry differently than in urban environments. Despite the combined sewage outflow which still occurs in the tidal stretches of the Anacostia, the highest nitrate values were found in a suburban tributary. The elevated Ca concentrations in the suburban tributaries are probably derived from sewage, while the high Ca in the more main stem and urban areas is driven by the chemical weathering of concrete. As Washington D.C. continues to develop their stormwater retention facilities (which will ultimately capture 98% of combined stormwater and sewage), we expect the reversal of some salinization and other characteristics of urban stream syndrome.
Author Contributions
Conceptualization, S.E.M.; methodology and investigation, S.E.M. and A.L.; data curation, S.E.M.; writing, S.E.M. and A.L.; project administration and funding acquisition, S.E.M. All authors have read and agreed to the published version of the manuscript.
Funding
This work was supported by the Water Resources Research Institute of Washington D.C. grants, 2014DC161B, 2017DC190B and WRRI AU Ref. 31483) and research funds from American University to SE MacAvoy.
Data Availability Statement
Data are available upon request. Data will be available to the public via depository by April 2022.
Acknowledgments
Ashley Acevedo, Kristina Nicholas, Bethany Perkins, and Dorothy Rathmell all contributed greatly in the field.
Conflicts of Interest
The authors declare no conflict of interest. The funders had no role in the design of the study; in the collection, analyses, or interpretation of data; in the writing of the manuscript, or in the decision to publish the results.
References
- Paul, M.J.; Meyer, J.L. Streams in the urban landscape. Annu. Rev. Ecol. Evol. Syst. 2001, 32, 333–365. [Google Scholar] [CrossRef]
- Walsh, C.J.; Roy, A.H.; Cottingham, P.D.; Groffman, P.M.; Morgan, R.P. The urban stream syndrome: Current knowledge and the search for a cure. J. N. Am. Benthol. Soc. 2005, 24, 706–723. [Google Scholar] [CrossRef]
- Maa, J.P. Sediment erosion characteristics in the Anacostia River. J. Hydraul. Eng. 2008, 134, 1102–1109. [Google Scholar] [CrossRef] [Green Version]
- Velinsky, D.J.; Riedel, G.F.; Ashley, J.T.; Cornwell, J.C. Historical contamination of the Anacostia River, Washington, D.C. Environ. Monit. Assess. 2011, 183, 307–328. [Google Scholar] [CrossRef]
- Connor, N.P.; Sarraino, S.; Frantz, D.E.; Bushaw-Newton, K.; MacAvoy, S.E. Geochemical characteristics of an urban river: Influences of an anthropogenic landscape. Appl. Geochem. 2014, 47, 209–216. [Google Scholar] [CrossRef]
- Rao, N.S.; Dinakar, A.; Kumari, B.K. Appraisal of vulnerable zones of non-cancer-causing health risks associated with exposure of nitrate and fluoride in groundwater from a rural part of India. Environ. Res. 2021, 202, 111674. [Google Scholar] [CrossRef]
- Kaushal, S.S.; Belt, K.T. The urban watershed continuum: Evolving spatial and temporal dimensions. Urban Ecosyst. 2012, 15, 409–435. [Google Scholar] [CrossRef]
- Kaushal, S.S.; Duan, S. Human-accelerated weathering increases salinization, major ions, and alkalization in fresh water across land use. Appl. Geochem. 2017, 83, 121–135. [Google Scholar] [CrossRef]
- Kaushal, S.S.; Likens, G.E.; Pace, M.L.; Reimer, J.E.; Maas, C.M.; Galella, J.G.; Utz, R.M.; Duan, S.; Kryger, J.R.; Yaculak, A.M.; et al. Freshwater salinization syndrome: From emerging global problem to managing risks. Biogeochemistry 2021, 154, 255–292. [Google Scholar] [CrossRef]
- AWS 2021 State of the Anacostia River Full Report. Available online: https://www.anacostiaws.org/what-we-do/public-policy-advocacy/state-of-the-river-report-card/2021-state-of-the-anacostia-river-full-report.html (accessed on 1 March 2022).
- Foster, G.D.; Roberts, E.C.; Gruessner, B.; Velinsky, D.J. Hydrogeochemistry and transport of organic contaminants in an urban watershed of Chesapeake Bay (USA). Appl. Geochem. 2000, 15, 901–915. [Google Scholar] [CrossRef]
- Weaver, K.N. Generalized Geological Map of Maryland. Department of Natural Resources, Maryland Geological Survey. 1967. Available online: http://www.mgs.md.gov/geology/geologic_map/md_geologic_map.html (accessed on 1 April 2022).
- U.S. Army Corps of Engineers (USACE). Anacostia River Watershed Restoration Plan and Report, Final Draft, Accessed 2 January 2013. 2010. Available online: http://www.anacostia.net/Restoration_Plan/download/Anacostia-Report-Web-Quality.pdf. (accessed on 11 April 2022).
- Subba Rao, N.; Dinakar, A.; Karuna Kumari, B.; Karunanidhi, D.; Kamalesh, T. Seasonal and spatial variation of groundwater quality vulnerable zones of Yellareddygudem watershed, Nalgonda district, Telangana State, India. Arch. Environ. Contam. Toxicol. 2021, 80, 1–30. [Google Scholar] [CrossRef] [PubMed]
- Jolliffe, I.T. Principal Component Analysis, 2nd ed.; Springer: New York, NY, USA, 2022. [Google Scholar]
- Subba Rao, N.; Sakram, G.; Rashmirekha, D. Deciphering artificial groundwater recharge suitability zones in the agricultural area of a river basin in Andhra Pradesh, India using Geospatial Techniques and Analytical Hierarchical Process Method. Catena 2022, 212, 106085. [Google Scholar] [CrossRef]
- Puckett, L.J.; Bricker, O.P. Factors controlling the major ion chemistry of streams in the Blue Ridge and Valley and Ridge physiographic provinces of Virginia and Maryland. Hydrol. Process. 1992, 6, 79–97. [Google Scholar] [CrossRef]
- Miller, W.R.; Drever, J.I. Water chemistry of a stream flowing in a storm, Absaroka Mountains, Wyoming. Geol. Soc. Am. Bull. 1977, 88, 286–290. [Google Scholar] [CrossRef]
- Reeder, S.W.; Hitchon, B.; Levinson, A.A. Hydrogeochemistry of the surface waters of the Mackenzie River drainage basin Canada–I, Factors controlling inorganic composition. Geochem. Cosmochim. Acta 1972, 36, 825–865. [Google Scholar] [CrossRef]
- Wiegand, B.A. Tracing effects of decalcification on solute sources in a shallow groundwater aquifer, NW Germany. J. Hydrol. 2009, 378, 62–71. [Google Scholar] [CrossRef]
- Bushaw-Newton, K.L.; Ewers, E.; Fortunato, C.A.; Ashley, J.T.; Velinsky, D.J.; MacAvoy, S.E. Bacterial community profiles from sediments of the Anacostia River using metabolic and molecular analyses. Environ. Sci. Poll. Res. 2012, 19, 1271–1279. [Google Scholar] [CrossRef]
- Goguel, R.L.; St John, D.A. Chemical identification of Portland cements in New Zealand Concretes. Cem. Concr. Res. 1993, 23, 59–68. [Google Scholar] [CrossRef]
- Maybeck, M. Global occurrence of major elements in Rivers. In Surface and Ground Water, Weathering, and Soils. Treatise on Geochemistry, 1st ed.; Drever, J.I., Holland, H.D., Turekian, K.K., Eds.; Elsvier-Pergamon: Oxford, UK, 2005; Volume 5, pp. 207–223. [Google Scholar]
- Bu, H.; Song, X.; Zhang, Q.; Burford, M.A. Strontium concentrations and isotope ratios in a forest-river system in the South Qinling Mts. China. Water Res. 2016, 93, 91–97. [Google Scholar] [CrossRef]
- Kaushal, S.S.; Wood, K.L.; Galella, J.G.; Gion, A.M.; Haq, S.; Goodling, P.J.; Haviland, K.A.; Reimer, J.E.; Morel, C.J.; Wessel, B.; et al. Making ‘chemical cocktails’- Evolution of urban geochemical processes across the periodic table of elements. Appl. Geochem. 2020, 119, 104632. [Google Scholar] [CrossRef]
- Nicholson, R.T. Standard Specifications for Highways and Structures. 2013. Available online: https://ddot.dc.gov/sites/default/files/dc/sites/ddot/publication/attachments/DDOT_StandardSpecificationsHighwaysStructures_2013.pdf (accessed on 11 April 2022).
- Graham, I.L.; Goguel, R.L.; St John, D.A. Use of strontium isotopes to determinethe orgin of cement in concretes: Case examples from New Zealand. Cem. Concr. Res. 2000, 30, 1105–1111. [Google Scholar] [CrossRef]
- Kaushal, S.S.; Groffman, P.M.; Brand, L.E.; Elliot, E.M.; Shields, C.A.; Kendall, C. Tracking nonpoint source nitrogen pollution in human-impacted watersheds. Environ. Sci. Technol. 2011, 45, 8225–8232. [Google Scholar] [CrossRef] [PubMed]
- Gibbs, R.J. Mechanisms controlling world water chemistry. Science 2011, 170, 1739–1755. [Google Scholar] [CrossRef] [PubMed]
- Nnadi, E.O.; Newman, A.P.; Coupe, S.J.; Mbanasco, F.U. Stormwater harvesting for irrigation purposes: An investigation of chemical quality of water recycled in pervious pavement system. J. Environ. Manag. 2015, 147, 246–256. [Google Scholar] [CrossRef] [PubMed]
- Hem, J.D. Study and Interpretation of the Chemical Characteristics of Natural Waters, 3rd ed.; USGS Survey Water-Supply Paper 2254; United States Government Printing Office: Washington DC, USA, 1985. [Google Scholar]
- Shiyong, T.; Zhang, X.; Xu, J.; Pan, G.; Gu, F. Anthropogenic impacts on isotopic and geochemical characteristics of urban streams: A case study in Wuhan, China. Environ. Sci. Poll. Res. 2021, 28, 39186–39198. [Google Scholar] [CrossRef]
Figure 1.
Site locations in and around Washington DC. Long Branch Creek is a tributary of Sligo Creek and then the Northwest Branch in Silver Spring and Takoma Park MD. Still Creek is located in Greenbelt Park, Greenbelt MD and is a tributary of the Northeast Branch, which was sampled adjacent to College Park MD. Bladensburg is immediately south of where the Northwest and Northeast Branches come together to create the Anacostia River’s main stem. The Kenilworth location is directly downstream of the Kenilworth Aquatic Gardens and is in an area that was a landfill between 1942 and 1970. The Anacostia Park (Section D) is upstream and across the river from the Navy Yard (Figure created using Google My Map).

Figure 2.
Concentrations (mg/L) of Ca vs. Ca/Sr for the six sites. Ca/Sr >200 in waters with minimal contact with carbonate rock (which is the case for the Anacostia) suggest concrete as the calcium source (Portland cement dominates in Washington D.C. and has a Ca/Sr between 260 and 305 [22]). Still Creek and Long Branch had Ca/Sr ratios < 200, suggesting a Ca source other than concrete, and Long Branch Creek had higher Ca than other sites. The Northeast Branch had lower Ca than other sites.

Figure 3.
The thick black line above is Ca vs. Sr for Long Branch and Still Creek. The regression of that line, Ca = 10.7 + 122(Sr), r2 = 0.94, has a different slope than the line for the other 4 sites. The thin black line is the main stem sites plus the Northeast Branch. The regression for that line is Ca = 1.6 + 206.5(Sr), r2 is 0.90. The figure shows that the relationship between Ca and Sr is different for the sites. The two suburban sites have higher Ca but also higher Sr relative to the other four sites.

Figure 4.
(a) Means with standard deviation for nitrate and Si:NO3 (SD in negative direction only) and (b) medians for Si:NO3 and mean nitrate with standard deviations for the six sites. Long Branch, Still Creek and the Northeast Branch are all tributaries of the Anacostia and considered “suburban”. Bladensburg (MD), Kenilworth (DC) and the Anacostia Park Section D (DC) are all on the main stem. Dissolved silica is decreasing in impounded or eutrophic rivers, and a trend with development has been lower Si and elevated NO3. Natural rivers in the early 1900s and prior had Si:NO3 ratios of 10 or more. Currently, agriculturally impacted rivers have ratios of less than 1.0 (in the Mississippi for example) [23].


Figure 5.
TDS vs. Na/(Na + Ca) showing general ranges associated with precipitation, seawater, and groundwater-dominated rivers worldwide. Water chemistry for world rivers is from [20].
Figure 5.
TDS vs. Na/(Na + Ca) showing general ranges associated with precipitation, seawater, and groundwater-dominated rivers worldwide. Water chemistry for world rivers is from [20].


Table 1.
Cations, metals and nutrients at different sites (mg/L). Means ± standard deviation (SD). Values sharing the same letter are not significantly different. N is the number in ().
Table 1.
Cations, metals and nutrients at different sites (mg/L). Means ± standard deviation (SD). Values sharing the same letter are not significantly different. N is the number in ().
| Longbranch (27) | Still Creek (26) | Northeast (29) | Bladensburg (29) | Kenilworth (29) | Anacostia Park (28) | |
|---|---|---|---|---|---|---|
| Ca | 46.9 ± 19.8 B | 36.2 ± 20.0 D | 22.8 ± 7.4 A | 31.8 ± 6.3 D,E | 31.9 ± 12.1 D,E | 29.0 ± 6.7 C,D |
| Mg | 15.2 ± 6.1 A | 10.1 ± 4.0 B,D | 7.4 ± 1.9 C | 9.2 ± 1.8 D | 8.3 ± 2.0 C,B | 7.8 ± 2.1 C |
| Na | 673.6 ± 1542.0 A | 562.3 ± 1259.6 A,B | 416.6 ± 1432.0 A | 402.7 ± 1197.7 A | 434.8 ± 1408.4 A | 390.9 ± 1548.7 A,C |
| K | 7.8 ± 4.6 A | 5.4 ± 3.2 A,B | 4.7 ± 1.8 A | 5.5 ± 1.9 A | 5.9 ± 3.2 A | 4.8 ± 1.2 A,C |
| Fe | 0.20 ± 0.34 A | 0.68 ± 0.61 B | 0.41 ± 0.37 B,D | 0.20 ± 0.21 A,C | 0.38 ± 0.37 C,D | 0.45 ± 0.41 B,D |
| S | 6.1 ± 2.4 A | 5.0 ± 2.1 B | 4.3 ± 0.9 B | 5.5 ± 1.0 A,C | 6.5 ± 2.5 A,C | 6.4 ± 2.5 A,C |
| Si | 5.22 ± 1.81 A | 3.68 ± 0.87 B | 2.80 ± 0.98 C | 3.01 ± 1.08 D | 3.44 ± 1.07 D | 3.40 ± 1.07 D |
| P | 0.06 ± 0.11 A | 0.08 ± 0.12 A | 0.07 ± 0.13 A | 0.07 ± 0.12 A,B | 0.07 ± 0.12 A,B | 0.08 ± 0.12 B |
| Mn | 0.06 ± 0.11 A,B | 0.14 ± 0.26 A | 0.07 ± 0.17 A | 0.03 ± 0.10 B | 0.07 ± 0.11 A | 0.06 ± 0.10 A |
| NO3 | 1.5 ± 0.8 A | 0.15 ± 0.4 B | 0.7 ± 0.4 C | 0.6 ± 0.4 B | 0.6 ± 0.4 B | 0.7 ± 0.3 D |
| NH4 | 0.17 ± 0.50 A,D | 0.12 ± 0.40 A,D | 0.12 ± 0.35 D | 0.15 ± 0.25 A,B | 0.19 ± 0.18 B,C | 0.31 ± 0.55 C |
| SAR | 18.1 ± 38.4 A,B | 20.5 ± 51.2 A | 19.7 ± 67.8 A,B | 15.6 ± 46.6 A,B | 16.8 ± 57.1 A,B | 17.7 ± 70.4 B |
Table 2.
Cations, metals and nutrients by season (mg/L except for SAR which is an ratio). Means ± standard deviation. Number in () is N. Values sharing the same letter are not significantly different.
Table 2.
Cations, metals and nutrients by season (mg/L except for SAR which is an ratio). Means ± standard deviation. Number in () is N. Values sharing the same letter are not significantly different.
| Fall (54) | Winter (33) | Spring (46) | Summer (34) | |
|---|---|---|---|---|
| Al | 0.17 ± 0.37 A | 0.23 ± 0.28 A,B | 0.15 ± 0.18 A,B | 0.08 ± 0.10 C |
| B | 0.011 ± 0.010 A | 0.21 ± 0.020 B,D | 0.02 ± 00.23 C,B | 0.028 ± 0.019 D |
| Ca | 32.4 ± 12.0 A | 38.9 ± 24.8 A | 30.6 ± 9.7 A | 30.8 ± 10.1 A |
| Mg | 9.4 ± 3.9 A | 10.3 ± 5.6 A | 9.3 ± 3.8 A | 9.5 ± 3.6 A |
| Na | 81.2 ± 82.7 A | 786.1 ± 1279.2 B | 1000.6 ± 2294.9 B | 87.7 ± 86.2 A |
| K | 6.2 ± 2.4 A | 7.4 ± 5.0 A,B | 4.3 ± 1.4 C | 5.0 ± 1.4 B |
| Fe | 0.4 ± 0.5 A | 0.5 ± 0.4 B | 0.3 ± 0.4 A | 0.2 ± 0.3 A |
| S | 5.3 ± 1.7 A,C | 7.0 ± 3.7 B | 5.5 ± 1.3 A,B | 4.9 ± 3.7 C |
| P | 0.08 ± 0.10 A | 0.11 ± 0.16 A,C | 0.07 ± 0.13 B,C | 0.02 ± 0.02 B,C |
| NO3 | 0.66 ± 0.58 A,C | 0.98 ± 0.57 B | 0.78 ± 0.37 C | 0.71 ± 0.72 A,D |
| NH4 | 0.21 ± 0.50 A,B | 0.10 ± 0.13 A,B | 0.07 ± 0.10 A | 0.35 ± 0.54 B |
| Mn | 0.05 ± 0.15 A | 0.16 ± 0.18 B | 0.07 ± 0.16 C | 0.01 ± 0.02 A |
| SAR | 3.2 ± 2.8 A | 23.4 ± 30.7 B | 42.1 ± 99.4 B | 3.5 ± 3.2 A |
| Si | 4.1 ± 1.5 A | 3.8 ± 1.1 A.B | 3.0 ± 1.1 B | 3.4 ± 1.6 B |
| Zn | 0.005 ± 0.006 A | 0.015 ± 0.020 B | 0.006 ± 0.007 A | 0.007 ± 0.023 A |
Table 3.
Molar and mass ratios for cations from 6 sites along the Anacostia River. Bladensburg, Kenilworth and Anacostia Park are on the tidal main stem. Means ± standard deviation. Numver in () is N. Long Branch Creek, Still Creek and the Northeast Branch are tributaries in Maryland and are considered suburban. Values sharing the same letter are not significantly different.
| Long Branch Creek (27) | Still Creek (26) | Northeast Branch (29) | Bladensburg (29) | Kenilworth (29) | Anacostia Park (28) | |
|---|---|---|---|---|---|---|
| Ca/Na (mass) | 0.96 ± 2.23 A,B | 0.35 ± 0.49 A | 0.41 ± 0.40 A,B | 0.55 ± 0.48 B | 0.57 ± 0.48 B | 0.66 ± 0.57 B |
| Ca/Na (molar) | 0.55 ± 1.28 A,B | 0.20 ± 0.27 A | 0.23 ± 0.23 A,B | 0.32 ± 0.27 B | 0.33 ± 0.29 B | 0.38 ± 0.33 B |
| Ca/K (mass) | 6.5 ± 1.8 A | 7.7 ± 4.7 A | 5.4 ± 2.2 B | 6.2 ± 1.8 A | 5.9 ± 1.7 A | 6.3 ± 1.6 A |
| Ca/K (molar) | 6.3 ± 1.7 A | 7.5 ± 4.6 A | 5.2 ± 2.2 B | 6.0 ± 1.7 A | 5.7 ± 1.6 A | 6.2 ± 1.6 A |
| Ca/Sr (mass) | 171 ± 28 A | 186 ± 33 B | 223 ±27 C | 221 ± 21 C | 218 ± 17 C | 220 ± 22 C |
| Ca/Sr (molar) | 373 ± 61 A | 404 ± 66 A,E | 489 ± 59 B,C,D | 484 ± 45 D | 476 ± 36 D | 480 ± 49 D |
Table 4.
PCA loading matrix for each site independenty. The first three principle components with % of the variation explained included. Data derived from 26 to 29 water samples collected between 2014 and 2020. SAR is Sodium Adsorption Ratio.
Table 4.
PCA loading matrix for each site independenty. The first three principle components with % of the variation explained included. Data derived from 26 to 29 water samples collected between 2014 and 2020. SAR is Sodium Adsorption Ratio.
| Long Branch | Still Creek | Northeast Branch | Bladensburg | Kenilworth | Anacostia Waterfront | |||||||||||||
|---|---|---|---|---|---|---|---|---|---|---|---|---|---|---|---|---|---|---|
| PC1 (35.2%) | PC2 (13.5%) | PC3 (9.4%) | PC1 (31.1%) | PC2 (16.3%) | PC3 (11.9%) | PC1 (25.3%) | PC2 (15.5%) | PC3 (12.5%) | PC1 (25.4%) | PC2 (14.2%) | PC3 (11.8%) | PC1 (32.7%) | PC2 (12.5%) | PC3 (10.3%) | PC1 (22.0%) | PC2 (16.0%) | PC3 (10.9%) | |
| Ca | 0.95 | −0.16 | −0.03 | 0.95 | −0.05 | 0.00 | 0.89 | 0.35 | 0.02 | 0.87 | 0.16 | −0.21 | 0.96 | 0.07 | −0.02 | 0.94 | −0.26 | 0.06 |
| Mg | 0.89 | −0.32 | 0.00 | 0.93 | −0.12 | −0.11 | 0.68 | −0.18 | −0.17 | 0.86 | −0.06 | −0.26 | 0.92 | −0.09 | −0.07 | 0.90 | −0.29 | 0.01 |
| Na | 0.78 | 0.36 | −0.15 | 0.39 | −0.013 | 0.69 | 0.15 | −0.38 | −0.09 | 0.43 | 0.02 | 0.36 | 0.34 | 0.07 | 0.46 | −0.14 | 0.14 | 0.70 |
| K | 0.90 | 0.00 | 0.01 | 0.84 | −0.02 | −0.2 | 0.61 | −0.15 | 0.14 | 0.61 | 0.00 | −0.20 | 0.81 | 0.17 | 0.10 | 0.41 | −0.21 | 0.13 |
| Fe | −0.44 | 0.74 | 0.35 | −0.15 | 0.85 | −0.03 | 0.26 | 0.60 | 0.52 | −0.30 | 0.50 | 0.65 | −0.26 | 0.36 | 0.10 | 0.26 | 0.86 | 0.06 |
| Mn | 0.38 | 0.78 | 0.24 | 0.58 | 0.59 | 0.08 | 0.73 | 0.52 | 0.28 | 0.07 | 0.92 | −0.07 | 0.52 | 0.17 | 0.10 | 0.44 | 0.35 | 0.03 |
| Zn | 0.25 | 0.17 | 0.03 | 0.41 | 0.47 | 0.00 | 0.04 | −0.44 | 0.54 | 0.04 | 0.37 | 0.49 | 0.51 | 0.38 | −0.29 | 0.00 | 0.51 | 0.30 |
| Al | −0.43 | 0.57 | 0.18 | −0.39 | 0.69 | 0.00 | −0.37 | 0.19 | 0.65 | −0.52 | 0.18 | 0.63 | −0.35 | 0.78 | −0.28 | −0.22 | 0.88 | 0.17 |
| As | −0.15 | −0.11 | −0.29 | −0.38 | −0.05 | 0.61 | −0.28 | −0.07 | −0.19 | 0.04 | 0.21 | −0.24 | −0.09 | 0.04 | 0.56 | −0.13 | −0.03 | 0.42 |
| Ba | 0.93 | 0.15 | 0.06 | 0.92 | 0.12 | −0.14 | 0.63 | −0.41 | 0.09 | 0.72 | −0.29 | 0.06 | 0.67 | −0.09 | 0.21 | −0.03 | −0.47 | 0.43 |
| B | −0.18 | 0.00 | −0.11 | 0.28 | −0.06 | −0.40 | 0.33 | 0.28 | −0.03 | 0.38 | −0.03 | 0.09 | 0.41 | 0.15 | −0.43 | 0.54 | 0.33 | −0.32 |
| Cd | 0.03 | −0.41 | 0.63 | 0.06 | 0.00 | −0.11 | 0.00 | 0.00 | −0.14 | −0.03 | −0.10 | −0.21 | −0.06 | −0.11 | 0.06 | 0.04 | −0.11 | 0.07 |
| Cr | 0.03 | −0.33 | 0.67 | −0.26 | 0.67 | 0.02 | −0.34 | 0.16 | 0.56 | −0.04 | 0.92 | −0.27 | −0.32 | 0.79 | 0.29 | −0.15 | 0.31 | −0.22 |
| Co | −0.24 | 0.45 | 0.63 | 0.18 | 0.74 | 0.07 | −0.35 | 0.12 | 0.57 | −0.03 | 0.93 | −0.27 | −0.31 | 0.79 | 0.31 | 0.62 | 0.45 | −0.23 |
| Cu | −0.26 | −0.17 | 0.15 | −0.18 | 0.18 | −0.15 | −0.35 | 0.08 | −0.14 | −0.20 | 0.18 | −0.07 | −0.23 | 0.17 | −0.07 | −0.13 | 0.22 | −0.07 |
| Mo | 0.03 | −0.52 | 0.61 | 0.09 | −0.22 | −0.62 | 0.37 | −0.41 | 0.08 | −0.12 | −0.19 | −0.42 | −0.17 | −0.25 | 0.21 | −0.24 | −0.08 | −0.26 |
| Ni | −0.24 | 0.22 | 0.63 | 0.43 | 0.79 | −0.06 | −0.36 | 0.06 | 0.57 | −0.08 | 0.83 | −0.43 | −0.35 | 0.52 | 0.41 | 0.53 | 0.35 | −0.36 |
| P | −0.26 | 0.28 | 0.12 | −0.19 | −0.31 | 0.68 | 0.19 | 0.59 | 0.33 | −0.34 | −0.13 | 0.38 | −0.27 | 0.08 | −0.69 | 0.12 | 0.41 | −0.14 |
| Pb | −0.06 | −0.07 | −0.02 | 0.04 | −0.21 | −0.58 | 0.00 | −0.03 | −0.22 | NA | NA | NA | NA | NA | NA | NA | NA | NA |
| S | 0.88 | 0.22 | 0.18 | 0.73 | −0.08 | 0.42 | 0.30 | −0.68 | 0.26 | 0.68 | 0.22 | 0.07 | 0.94 | 0.14 | −0.04 | 0.97 | 0.00 | −0.04 |
| Sr | 0.95 | −0.19 | 0.01 | 0.93 | 0.05 | 0.00 | 0.93 | 0.06 | −0.01 | 0.90 | 0.03 | −0.21 | 0.96 | 0.03 | 0.00 | 0.90 | −0.36 | 0.04 |
| Ti | −0.46 | 0.61 | 0.32 | −0.36 | 0.67 | 0.16 | −0.47 | 0.22 | 0.76 | −0.50 | 0.47 | 0.44 | −0.48 | 0.76 | 0.04 | −0.22 | 0.78 | −0.05 |
| Be | −0.03 | 0.09 | −0.16 | 0.07 | −0.25 | −0.09 | 0.77 | 0.87 | −0.07 | −0.03 | −0.26 | −0.05 | 0.04 | −0.18 | −0.57 | 0.27 | −0.29 | −0.12 |
| NO3 | 0.53 | −0.26 | 0.45 | −0.24 | −0.24 | 0.24 | −0.21 | −0.35 | 0.47 | 0.19 | −0.24 | 0.57 | 0.01 | 0.22 | −0.51 | 0.62 | 0.43 | 0.11 |
| NH4 | 0.03 | −0.38 | 0.16 | 0.10 | −0.21 | −0.59 | 0.50 | 0.74 | −0.06 | 0.04 | −0.08 | −0.49 | 0.25 | −0.35 | 0.57 | −0.04 | −0.11 | −0.08 |
| Si | 0.43 | −0.39 | 0.38 | 0.00 | 0.77 | −0.31 | −0.03 | 0.17 | −0.38 | −0.23 | −0.07 | 0.06 | 0.27 | 0.44 | −0.31 | 0.25 | 0.52 | −0.18 |
| pH | 0.37 | −0.28 | 0.23 | 0.34 | −0.48 | −0.23 | 0.25 | 0.02 | −0.35 | 0.22 | −0.04 | −0.04 | 0.16 | −0.06 | 0.11 | −0.26 | −0.24 | −0.14 |
| TDS (mg/L) | 0.86 | 0.31 | −0.02 | 0.85 | −0.06 | −0.04 | 0.69 | −0.51 | 0.24 | 0.78 | 0.09 | 0.21 | 0.90 | 0.18 | 0.10 | 0.43 | −0.18 | 0.63 |
| hardness | 0.91 | −0.20 | −0.10 | 0.93 | −0.05 | −0.05 | 0.83 | 0.22 | 0.01 | 0.71 | 0.08 | −0.09 | 0.86 | 0.06 | −0.17 | 0.79 | −0.17 | 0.16 |
| SAR | 0.75 | 0.36 | 0.33 | 0.24 | −0.15 | 0.72 | 0.13 | −0.38 | −0.10 | 0.43 | 0.02 | 0.36 | 0.28 | 0.06 | 0.47 | −0.14 | 0.16 | 0.69 |
Publisher’s Note: MDPI stays neutral with regard to jurisdictional claims in published maps and institutional affiliations. |
© 2022 by the authors. Licensee MDPI, Basel, Switzerland. This article is an open access article distributed under the terms and conditions of the Creative Commons Attribution (CC BY) license (https://creativecommons.org/licenses/by/4.0/).
Share and Cite
MDPI and ACS Style
MacAvoy, S.E.; Lunine, A. Anthropogenic Influences on an Urban River: Differences in Cations and Nutrients along an Urban/Suburban Transect. Water 2022, 14, 1330. https://doi.org/10.3390/w14091330
AMA Style
MacAvoy SE, Lunine A. Anthropogenic Influences on an Urban River: Differences in Cations and Nutrients along an Urban/Suburban Transect. Water. 2022; 14(9):1330. https://doi.org/10.3390/w14091330
Chicago/Turabian StyleMacAvoy, Stephen E., and Alex Lunine. 2022. "Anthropogenic Influences on an Urban River: Differences in Cations and Nutrients along an Urban/Suburban Transect" Water 14, no. 9: 1330. https://doi.org/10.3390/w14091330
Note that from the first issue of 2016, this journal uses article numbers instead of page numbers. See further details here.