
Pretreatment of Rubber Additives Processing Wastewater by Aluminum–Carbon Micro-Electrolysis Process: Process Optimization and Mechanism Analysis


1
Guizhou Academy of Environmental Science & Designing, Guiyang 550081, China
2
Joint Laboratory of Guangdong Province and Hong Kong Region on Marine Bioresource Conservation and Exploitation, College of Marine Sciences, South China Agricultural University, Guangzhou 510642, China
*
Authors to whom correspondence should be addressed.
Water 2022, 14(4), 582; https://doi.org/10.3390/w14040582
Submission received: 13 January 2022
/
Revised: 8 February 2022
/
Accepted: 11 February 2022
/
Published: 15 February 2022
(This article belongs to the Special Issue Advances in Wastewater Treatment: Resources Recovery, Energy Neutralization, Water Reuse)
Abstract
:The pretreatment of rubber additives processing wastewater was performed by Al/AC micro-electrolysis (ME). The single-factor experiments for the removal of COD and chroma were investigated. The Box-Behnken Design (BBD) was also applied to optimize the experimental conditions, and the fitted response surface model supplied highly significant quadratic models for the process. The COD removal efficiency reached 51.6% at an initial pH of 9.8, Al scrap dosage of 98.6 g L−1, Al/AC mass ratio of 0.26, and reaction time of 176 min, which was reasonably consistent with the predicated value of 51.9%. Moreover, we proposed a reaction mechanism of the process for the degradation of organic contaminants, and found that the removal of COD and chroma were mainly ascribed to the combination of active hydrogen [H] with strong chemical reactivity and flocculation of aluminum hydroxide. All these results showed that Al/AC ME is a promising pretreatment technique for this wastewater.
1. Introduction
A great quantity of wastewater from the rubber processing industry was recently directly discharged into the aquatic environment, causing severe environmental pollution [1,2]. A source of pollutants in rubber additive production wastewater is mainly the refractory heterocyclic heterochain organics with high molecular weight, strong toxicity, complex structure and stable properties, which are commonly utilized as vulcanization accelerators in the rubber processing industry [3]. The rubber additive wastewater is endowed with two typical characteristics, including high salt concentration and chemical oxygen demand (COD). Especially for COD, its concentration can reach hundreds of thousands of mg L−1 [4], and if not pretreated, will severely impact the microorganisms in the biochemical pool. Generally speaking, traditional physical and chemical techniques can realize the water resource cycle, but are limited by their high treatment costs and low removal efficiency [5]. Therefore, it is necessary and critical to explore appropriate pretreatment methods to treat rubber additive processing wastewater before entering the environment.
Currently, the micro-electrolysis (ME) process has gradually become a promising research hotspot in the field of wastewater treatment, mainly based on the difference of the redox potential between different materials [6,7], which has been widely applied in dyeing, electroplating, the chemical industry, and other wastewater treatment [8]. Moreover, this process does not need external electrical energy or chemical coagulants [7]. Now, much attention is being paid to degrade organic pollutants in wastewater using a Fe/C ME system [9,10,11]. Nonetheless, due to the corrosion products on the metal surface and large amounts of hydroxide precipitation, the reactivity of Fe is apt to decrease over time [12]. In addition, the pH value affects wastewater treatment efficiency to a great extent [13,14]. It is reported that it is effective only in the pH range of 1.5–4 [15,16].
To overcome the above shortcomings, the Al/AC ME process has gained much interest because of the amphoteric characteristics of Al and little loss of functional materials [17]. In recent years, relevant works have demonstrated that this process achieves better treatment performance for alkaline wastewater than Fe/C ME [18,19,20]. When Al-AC is immersed in wastewater, numerous micro-scale galvanic cells are formed on its surface with Al and C as the anode and cathode, respectively. Al loses three electrons to generate Al3+, and the released electrons accepted by the cathode are transferred to oxygen or targeted contaminants, thus facilitating the reduction reaction process [21]. The reaction process of Al/AC ME is as follows [22,23].
Anodic oxidation:
Al(s)→Al3+(aq) + 3e−, Eθ(Al3+/Al) = −1.667 V
Cathodic reduction:
2H+(aq) + 2e−→2[H]→H2(g), (H+/H)Eθ = 0 V
Acidic to alkaline with oxygen:
O2(g) + 4H+(aq) + 4e−→2O + 4[H]→2H2O (acidic, Eθ = (O2/H2O) = 1.23 V)
O2(g) + H2O + 4e−→4OH− (neutral or alkaline), Eθ = (O2/OH−) = 0.4 V
Active hydrogen [H] produced by the cathode process has strong chemical activity and can destroy the structure of large molecular organic compounds into small molecular pollutants, thus improving the biodegradability of wastewater. Wang et al. [24] applied the Al/AC ME system to treat dyeing and printing wastewater (pH = 12.06). The results exhibited that the removal efficiency of COD reached 42.22%, and the biochemical oxygen demand (BOD)/COD ratio was increased from 0.15 to 0.46. Moreover, as good flocculants, aluminum hydroxides can also remove small molecule compounds through the combination of enmeshment, coprecipitation, adsorption and interparticle bridging during coagulation [25]. Hence, the Al/AC ME process extensively displayed applications in wastewater treatment because of the high removal efficiencies of chroma and COD.
Kusworo et al. [26] prepared the PSf-TiO2/GO nanohybrid membrane for photocatalytic degradation of organic contaminants in natural rubber wastewater, and the removal efficiencies of COD and NH3 were 60.98% and 91.27%, respectively. To date, there are a few studies on wastewater treatment by the Al/AC ME system [24,27]; however, as reviewed, limited information on the treatment of rubber additives production wastewater utilizing Al/AC ME system has been reported. Therefore, in this paper, the pretreatment of this wastewater is carried out by Al/AC ME. The initial pH, Al scrap dosage, Al/AC mass ratio, reaction time, and stirring speed affecting the chroma and COD removal were investigated. RSM and BBD were adopted to design the experiments, construct models, and optimize the experimental conditions in terms of four independent variables, including initial pH, Al scrap dosage, Al/AC mass ratio, and reaction time. Finally, a plausible reaction mechanism of the Al/AC ME for organic pollutants was proposed.
2. Materials and Methods
2.1. Materials and Chemicals
Before use, the rubber peptizer processing wastewater used in the current study was obtained from a chemical plant in Wuhan. Table S1 described the characteristics of the wastewater. Activated carbon with 1–3 meshes (mm, Wuhan Jinhan Duhua Boke Teaching Instrument Co. Ltd., Wuhan, China) was first soaked in tap water for 2 h, then dipped in real wastewater for 72 h to eliminate the adsorption effect, and finally, washed by deionized water and dried. Aluminum scraps with a particle size range of 3–5 mm from Tianjin Kemeiou Chemical Reagent Co., Ltd. (Tianjin, China) were immersed in alkaline solution with the addition of detergent, and then activated by 5% diluted HCl for 30 min. Finally, the pretreated aluminum scraps were rinsed with deionized water and dried in an oven. Deionized water was utilized for the total experiments.
Potassium dichromate, mercury sulfate, silver sulfate, and silver nitrate were bought from Tianjin Kaitong Chemical Reagent Co., Ltd. (Tianjin, China). Sulfuric acid (H2SO4) and hydrochloric acid (HCl) were obtained from the Zhongping Neng Chemical Group Kaifeng Dongda Chemical Co., Ltd. (Kaifeng, China) reagent factory. Sodium hydroxide (NaOH) was purchased from Sinopharm Group Chemical Reagent Co., Ltd. (Shanghai, China). All these chemicals were of analytical grade and utilized without further purification unless otherwise specified.
2.2. Apparatus and Procedure
The experimental apparatus comprised a six-unit electric agitator and beakers (Figure S1). A few beakers (500 mL) containing electrode materials (Al scraps and activated carbon) and wastewater were used to investigate the decomposition of organic contaminants. Rubber peptizer processing wastewater (100 mL) was poured into the beaker. The pH value of wastewater was adjusted by diluted NaOH and H2SO4. The samples were collected at given time intervals and then filtrated by a syringe membrane filter (0.45 μm, Tianjin Keyilong Experimental Equipment Co., Ltd., Tianjin, China) for subsequent analysis. All the measurements were carried out at room temperature.
2.3. Analytical Methods
The pH value of wastewater was determined by a meter (PHS-25, Leici, Shanghai, China). The chroma (color) was obtained by dilution multiple methods based on the national standard methods (State Environmental Protection Administration of China, Monitoring and Analysis Methods of Water and Wastewater, fourth ed., Beijing, China). Briefly, the sample was diluted with pure water to the same color as pure water, and multiple dilution was defined as the chroma. A dichromate method was adopted to measure COD after digestion of the samples in a COD reactor (DRB200, HACH, Ralph, CO, USA) and portable spectrophotometer (DR1900, HACH, USA) according to the fast digestion-spectrophotometric method (HJ/T 399-2007) listed by the Environmental Protection Industry Standard of the People’s Republic of China.
The removal efficiencies of chroma (color) and COD can be expressed as:
in which C0 and C are the initial and remaining chroma, respectively,
in which the initial and remaining chemical oxygen demand are represented by COD0 and COD, respectively.
R(%) = (C0 − C)/C0 × 100%,
R(%) = (COD0 − COD)/COD0 × 100%,
2.4. Statistical Analysis and Modelling Using RSM
The statistical design of experiments and data analysis were conducted by Design-Expert® software (version 8.0.6, Stat-Ease, Minneapolis, MN, USA). The effects of Initial pH value, Al scrap dosage, Al/C mass ratio, and reaction time on COD removal efficiency were evaluated by the Box–Behnken Design (BBD). Table 1 listed the experimental range and levels of independent variables utilized in the Al/C ME process with four factors with three levels.
The relationship between the independent variables and the response variable (Y) was predicted by the generalized second-order polynomial model. Equation (7) depicted the quadratic equation for the variable [28,29]:
where Y is the response variable, Xi and Xj are the coded independent variables, β0 is the constant regression coefficient, and βi, βii, and βij are the coefficient for linear, quadratic, and the interaction terms, respectively. K is the optimal number in this experiment.
The analysis of variance (ANOVA) was performed to analyze these results and verify the statistical significance of the fitted quadratic models at a 95% confidence level [29]. The correlation coefficient (R2 and adj. R2) was used to express the quality of the fitted polynomial model, and the F-value was applied to check its statistical significance. The optimum conditions of responses stimulated by the varied independent variables were investigated by the actual values vs. predicted values and three-dimensional (3D) RSM plots [30]. The experimental reliability and precision can be expressed by a coefficient of variance (CV) value [31].
3. Results and Discussion
3.1. Effects of Operation Parameters on Treatment Efficiency
The treatment efficiency of wastewater depends on the operating parameters to a great extent. The optimal operation conditions are essential for wastewater treatment with the Al/AC ME system. Therefore, the influences of initial pH, Al scrap dosage, and Al/AC mass ration are examined in the following sections.
3.1.1. Effect of Initial pH
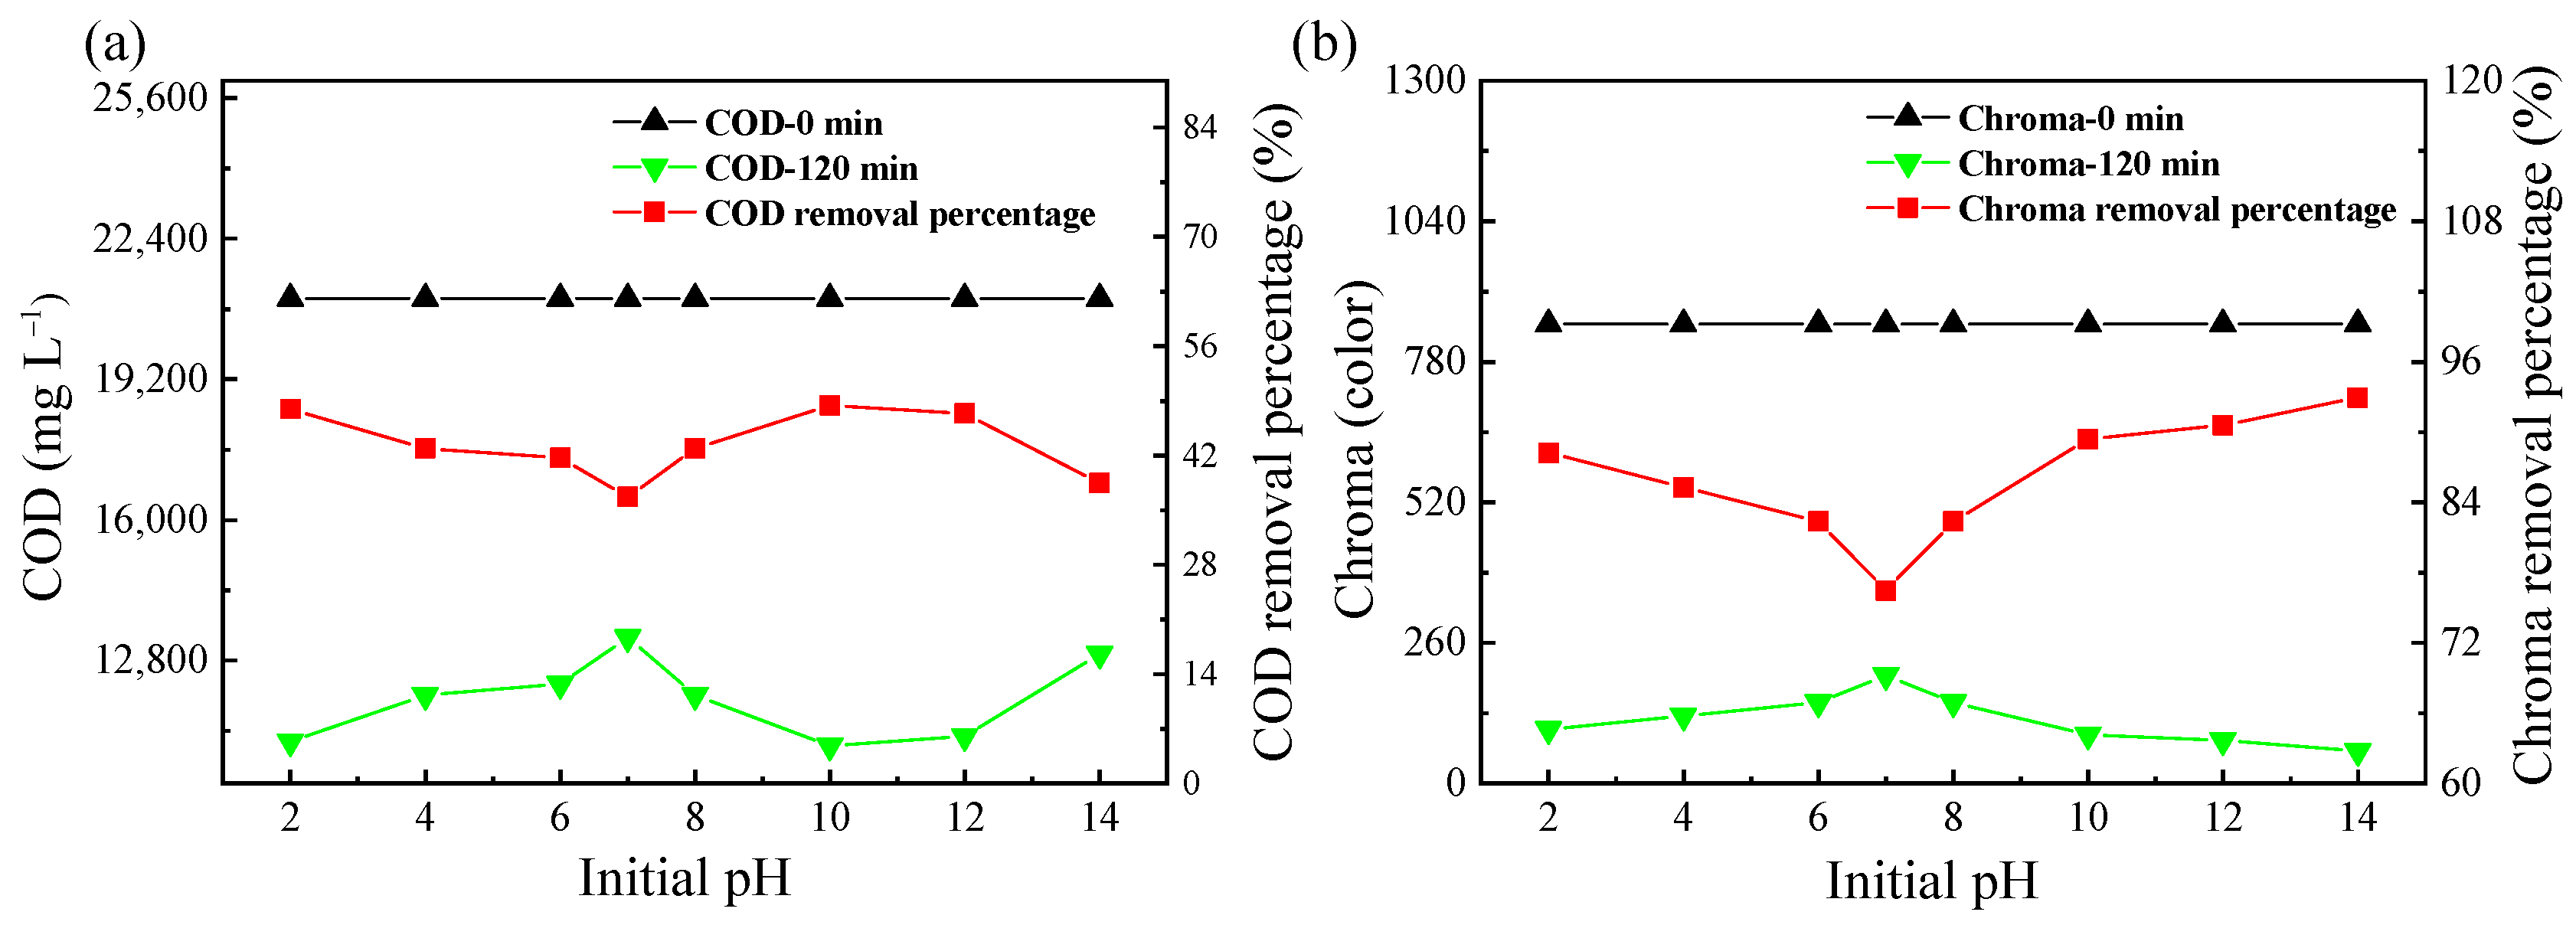
According to the reaction mechanism (Equations (1)–(4)) of the Al/AC ME system, this reaction process is susceptible to pH values because the change in how pH value influences the number of formed [H] and O, the dissolution rate of Al, the speciation of Al, and redox potential in the ME system [32]. As exhibited in Figure S2, the effluent pH value is higher than the initial value in the range of 4–6. However, when the pH value exceeded 6, the effluent pH value became lower than the initial value, which was attributed to different forms of Al in solution associated with the pH value of the solution. Additionally, the impacts of an initial pH value on the removal of COD and chroma in the Al/AC ME system were investigated. Figure 1a,b depicted the variation in COD and chroma removal efficiencies with various initial pH values (2–14) after 2 h of treatment. As observed, the COD and chroma removal efficiencies decreased with the increasing initial pH value under an acidic condition. Nonetheless, their removal efficiencies were poor under neutral conditions. Under alkaline conditions, their removal efficiencies first increased with the increase in pH value, and then decreased with the pH value exceeding 10, which was attributed to metal corrosion. In a neutral environment, the Al surface is passivated and its corrosion rate is relatively slow. However, in a strong acidic or alkaline solution, the dissolution rate of Al is higher than the formation rate, and thus, the rate of Al corrosion becomes fast. However, the removal percentages of COD and chroma did not change significantly over the whole pH range. The cost of wastewater treatment will increase if the wastewater is adjusted to strong acidity. Therefore, the Al/AC ME process was performed under alkaline conditions in this study. In comparison, 10 is selected as the optimal pH value in the Al/AC ME process.
3.1.2. Effect of Aluminum Scrap Dosage
Al materials, as a source of Al3+ and Al(OH)3, play a vital role in the ME system. The influences of Al scrap dosage on the COD and chroma removal were evaluated by varying the Al scrap dosage (20–150 g L−1) at 2 h of treatment. However, activated carbon dosage, stirring speed, and the pH value of wastewater was maintained at 150 g L−1, 150 r min−1, and 10, respectively. In Figure 2, the removal efficiencies of COD and chroma largely increased after 2 h with an increasing Al scrap dosage from 20 to 80 g L−1. With a further increase in Al scrap dosage from 80 to 150 g L−1, the increase in COD removal efficiency was negligible. Nonetheless, the chroma removal efficiency continued to increase in the Al scrap dosage range. Considering the Al scrap dosage, attention should be focused not only on the advancement of the treatment effect, but on the economic cost. As the proportion of Al scrap dosage in the liquid–solid mixing system increased, large amounts of [H] and Al3+ were generated. They could also enhance the electrochemical reaction and physisorption of ME system with the help of more microscopic galvanic cells and effective contact areas [33]. However, excess Al scrap dosage is immune to COD removal because the best treatment effect was achieved at the Al/C mass ration determined by the Al scrap dosage, and the remaining amounts of Al scrap will not participate in the reaction. Therefore, the optimal Al scrap dosage was determined to be 80 g L−1 for future work.
3.1.3. Effect of Al/C Mass Ratio
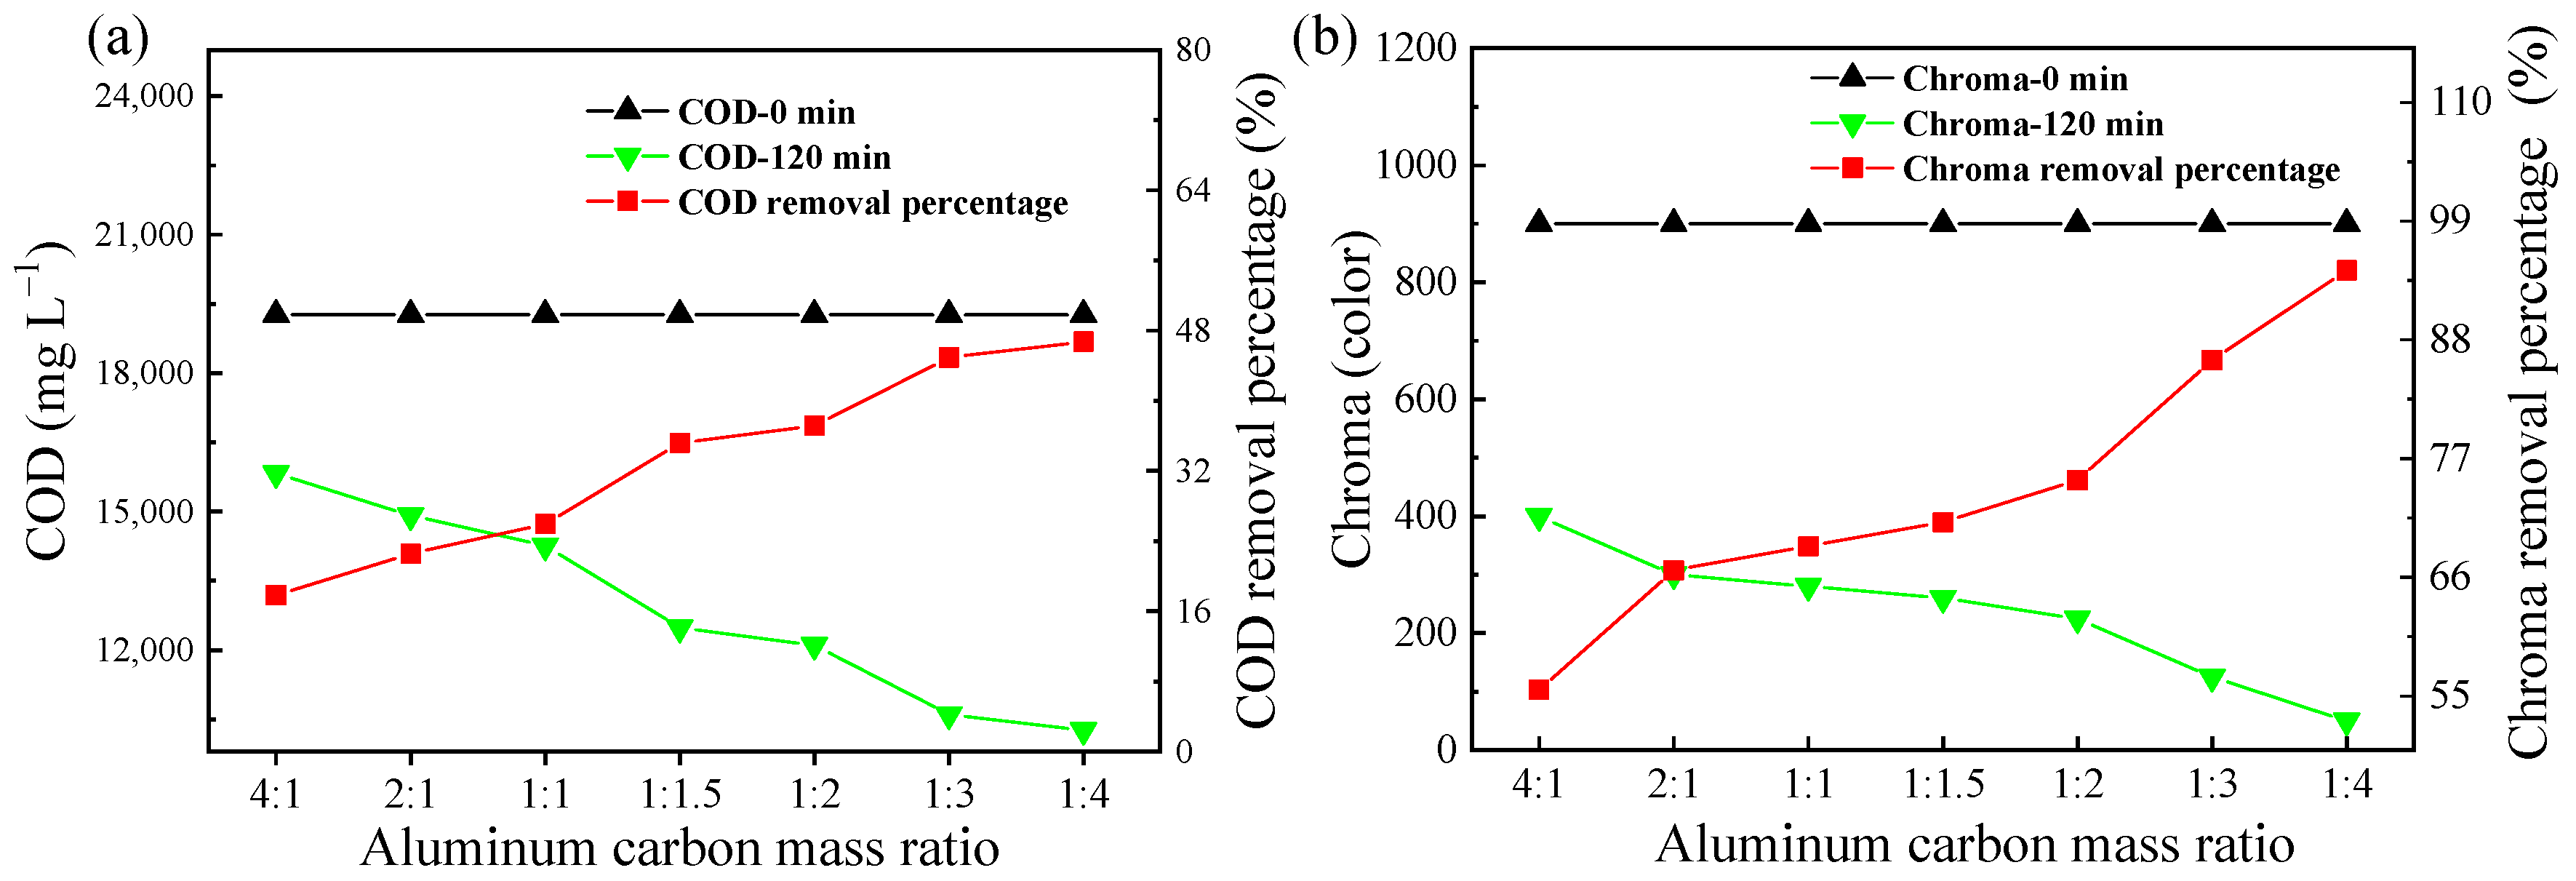
In an Al/AC ME system, the contact areas between scrap aluminum and activated carbon can remarkably affect the number of microscopic galvanic cells [25]. Therefore, the Al/AC mass ratio is a key factor that can significantly influence the treatment efficiency of wastewater in this process. The influence of the amounts of activated carbon on the treatment efficiency of wastewater was displayed in Figure 3. As observed, the removal efficiencies of COD and chroma increased with the decrease of the Al/AC ration, indicating that a small Al/AC ration helps to facilitate the reaction process. This is mainly because the numbers of microscopic galvanic cells were increased by the increased amounts of activated carbon participating in the reaction, and the numbers of microcells can affect Al corrosion and the formation rate of Al3+ [34]. However, their removal efficiencies almost remain unchanged at an Al/AC ration of 1:3. A further decrease in the Al/C mass ration can hardly bring any improvement in COD and chroma removal. An optimal Al/AC mass ratio of 1:3 can accelerate the adsorption of organic pollutants by activated and Al(OH)3. Therefore, it can be determined that the enhancement in removal efficiencies was induced by the enhanced interactions between Al and activated carbon. An appropriate proportion of activated carbon in the Al/AC mixture ensured sufficient contact between Al and AC in the reaction. Hence, the Al/AC mass ratio of 1:3 was recommended in the following experiments.
3.1.4. Effects of Reaction Time and Stirring Speed
3.2. Reaction Mechanism
Based on the aforementioned experimental results and discussion, a plausible reaction mechanism of the Al/AC ME process for the decomposition of organic pollutants in an aquatic environment was proposed (Figure 4). Due its high adsorption capacity and conductance [35], activated carbon was used as cathodic protection. At the anode (Al scrap), electrons supplied by Al transferred to the cathode (activated carbon) via micro-scale galvanic cells [36], and the organic pollutants adsorbed on the cathodic surface were attacked by these released electrons. H+ from water ionization gained electrons at the cathode and produced active hydrogen [H] with strong chemical reactivity or H2, and active hydrogen [H]· can partially degrade organic contaminations. In addition, Al loses three electrons to form aluminum ions (Al3+). Then, the precipitation of aluminum ions forms aluminum hydroxides (Al(OH)3, Al(OH)−4, etc.). As favorable flocculants, these aluminum hydroxides can effectively eliminate the organic pollutant from wastewater. The refractory pollutants are decomposed to small molecule intermediates with the assistance of the Al/C ME process, and can also be eliminated by flocculation and coprecipitation of the aluminum hydroxide floc sludge. In other words, many synergy effects related to the Al/C ME process can effectively decompose the organic contaminants in an aqueous environment.
3.3. Statistical Analysis
Four independent variables (X1, X2, X3, and X4) and the response value (Y1) originated from the experiment by the Design-Expert® software (version 8.0.6) on the basis of the Box–Behnken Design (BBD). The response function was established by incorporating the interactions between the four variables, such as four first-order coefficients (X1, X2, X3, and X4), six interaction effects (X1 X2, X1 X3, X1 X4, X2 X3, X2 X4, and X3 X4), and four second-order effects (X12, X22, X32, and X42). The expression was as follows:
Y = 42.58 + 0.069 X1 + 6.89 X2 − 9.31 X3 + 4.62 X4 + 3.26 X1 X2 − 2.49 X1 X3 − 4.74 X1 X4 − 1.54 X2 X3 − 3.67 X2 X4 − 1.11 X3 X4 − 3.67 X12 − 4.13 X22 + 1.30 X32 − 5.13 X42
The analysis of variance table and analysis of variance (ANOVA) results for the quadratic models were displayed in Table 2 and Table 3, respectively. The correlation between the independent variables and the response was described successfully. The low p-value implied that the terms were significant in the model. As can be seen in Table 2, the regression model with a very low p-value (<0.0001) implied that the model terms were highly significant in the model. In addition, we found that four independent variables were significant model terms, suggesting that the Al scrap dosage (X2), Al/C mass ration (X3), and reaction time (X4) had remarkable influences on COD removal. Nonetheless, the p-values of X1 X2, X1 X3, X2 X3, X2 X4, X3 X4, and X32 were greater than 0.05, indicating that these model terms were not significant in the model. The R2 coefficient was used to investigate the fitness of the model. The model with a high R2 coefficient of 0.9328 confirmed the suitability of fitted models to experimental data. Moreover, the adjusted R2 coefficient of 0.8656 was also responsible for the high significance of the model. A model with CV less than 10% generally can be regarded as reproducible [37]. As found in Table 3, a CV value of 9.29% was obtained in the model, suggesting the model was in the reproducibility. The probability of lack of fit (PLOF) is greater than 0.05, suggesting that the obtained model can fit the experimental data well. Furthermore, the model with adequate precision (AP) higher than 4 indicates adequate model discrimination.
Figure 5 exhibits the plot of the actual values vs. predicted values for COD removal. The reasonable agreement between the predicated and actual values from the model can be observed in the plot. Therefore, the predicted model was demonstrated to be suitable for navigating the design space defined by the BBD [27].
3.4. Process Optimization and Analysis
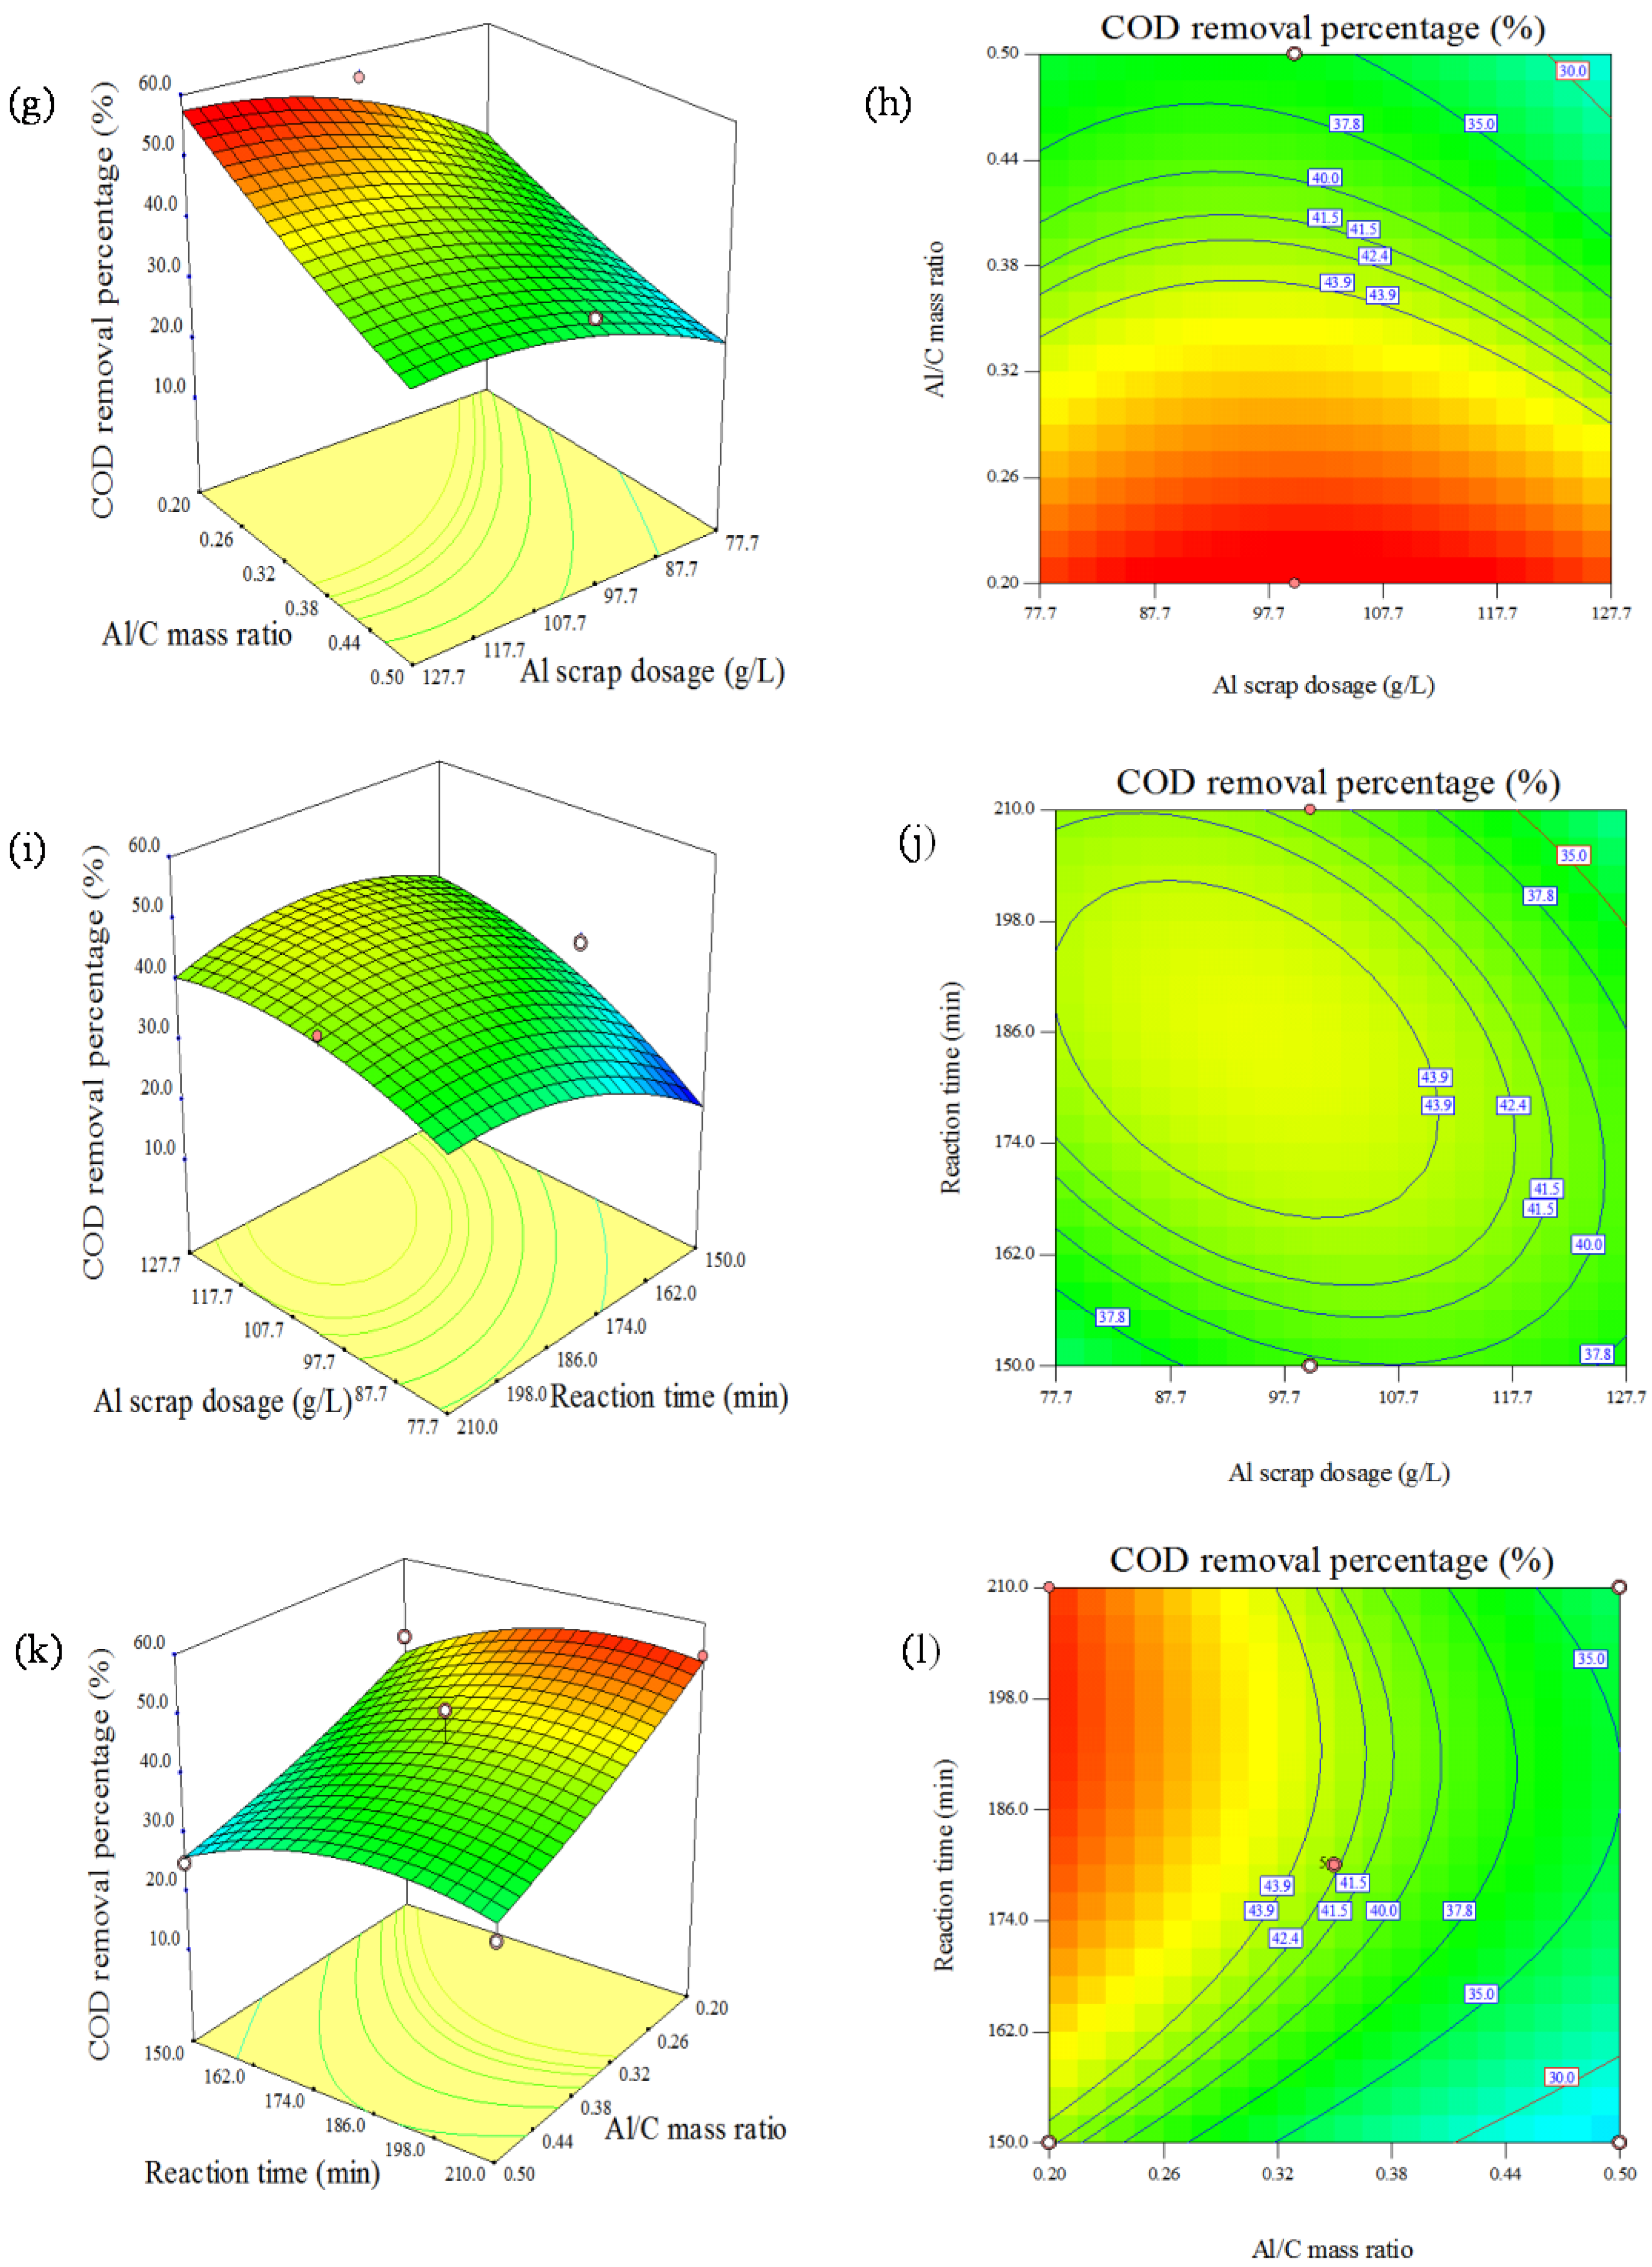
To further understand the influences of the four independent variables (initial pH, Al scrap dosage, Al/AC mass ratio, and reaction time) on COD removal efficiency, the predicted model was displayed as response surface and contour maps (Figure 6). The optimal values of experimental conditions were achieved at an initial pH of 9.8, Al scrap dosage of 98.6 g L−1, Al/AC mass ratio of 0.26, and reaction time of 176 min for maximal COD removal efficiency of 51.9%. Besides, the optimized COD removal efficiency was selected based on the energy consideration. Additional experiments were performed to further confirm the predicted values adopting the optimal experimental conditions, and the obtained results are shown in Table S2. As observed, the experimental data were in good accordance with the predicted value for COD removal efficiency, suggesting the response surface method is of high precision and good predictability in the treatment of rubber additives in wastewater.
4. Conclusions
In this work, the Al/AC ME system was explored to treat rubber additives processing wastewater in an aqueous environment. Firstly, single-factor experiments (i.e., initial pH, Al scrap dosage, Al/AC mass ratio, reaction time, and stirring speed) were applied to assess the influences of COD and chroma removal. Experimental results showed that the removal efficiencies of COD and chroma reached 44.2% and 88.9% at an initial pH of 10, Al scrap dosage of 80 g L−1, Al/AC mass ratio of 1:3, reaction time of 150 min, and stirring speed of 300 r min−1, respectively. The significant and interactive effects of four independent variables, such as initial pH value, Al scrap dosage, Al/AC mass ratio, and reaction time were validated by RSM based on the Box–Behnken model (BBD). The high R2 value for the predicated model by ANOVA implied that an acceptable polynomial model was obtained. The optimal experimental conditions were as follows: the initial pH was 9.8, Al scrap dosage was 98.6 g L−1, Al/AC mass ratio was 0.26, and the reaction time was 176 min. At these conditions, the experimental value of 51.6% for COD removal efficiency was almost identical to the predicated value of 51.9%. Furthermore, a plausible reaction mechanism of the Al/AC ME process for the decomposition of organic pollutants in an aquatic environment was proposed. The active hydrogen [H] and flocculation of aluminum hydroxide were responsible for the removal of COD and chroma. This work paves an avenue for future rubber additives wastewater treatment by the ME process.
Supplementary Materials
The following supporting information can be downloaded at: https://www.mdpi.com/article/10.3390/w14040582/s1, Figure S1: The schematic of Al/AC micro-electrolysis process; Figure S2: Comparison of initial and effluent pH of wastewater; Figure S3: Influence of reaction time on (a) COD and (b) chroma removal. Reaction conditions: Al scrap dosage, 80 g L−1; Al/AC mass ratio, 1:3; rotate speed, 150 r min−1; pH value, 10; Figure S4: Influence of stirring speed on (a) COD and (b) chroma removal at 2.5 h. Reaction conditions: Dosage of Al chips, 80 g L−1; Al/C mass ratio, 1:3; pH value, 10; Table S1: Characteristics of environmental rubber peptizer wastewater; Table S2: Al/AC ME optimization validation experiment.
Author Contributions
Conceptualization, L.Z., D.H. and H.D.; methodology, L.Z. and H.D.; validation, L.Z. and D.H.; formal analysis, L.Z. and D.H.; investigation, L.Z.; data curation, L.Z., D.H. and H.D.; writing—original draft preparation, H.D.; funding acquisition, H.D. All authors have read and agreed to the published version of the manuscript.
Funding
This research was funded by the National Natural Science Foundation of China (42077364).
Institutional Review Board Statement
Not applicable.
Informed Consent Statement
Not applicable.
Data Availability Statement
Not applicable.
Conflicts of Interest
The authors declare that they have no conflict of interest.
References
- Krainara, S.; Suraraksa, B.; Prommeenate, P.; Thayanukul, P.; Luepromchai, E. Enrichment and characterization of bacterial consortia for degrading 2-mercaptobenzothiazole in rubber industrial wastewater. J. Hazard. Mater. 2020, 400, 123291. [Google Scholar] [CrossRef] [PubMed]
- Kusworo, T.D.; Ariyanti, N.; Utomo, D.P. Effect of nano-TiO2 loading in polysulfone membranes on the removal of pollutant following natural-rubber wastewater treatment. J. Water Process Eng. 2020, 35, 101190. [Google Scholar] [CrossRef]
- Ghorai, S.; Jalan, A.K.; Roy, M.; Das, A.; De, D. Tuning of accelerator and curing system in devulcanized green natural rubber compounds. Polym. Test. 2018, 69, 133–145. [Google Scholar] [CrossRef]
- Promnuan, K.; Higuchi, T.; Imai, T.; Kongjan, P.; Reungsang, A.; O-Thong, S. Simultaneous biohythane production and sulfate removal from rubber sheet wastewater by two-stage anaerobic digestion. Int. J. Hydrogen Energy 2020, 45, 263–274. [Google Scholar] [CrossRef]
- Lin, J.; Ye, W.; Baltaru, M.-C.; Tang, Y.P.; Bernstein, N.J.; Gao, P.; Balta, S.; Vlad, M.; Volodin, A.; Sotto, A.; et al. Tight ultrafiltration membranes for enhanced separation of dyes and Na2SO4 during textile wastewater treatment. J. Membr. Sci. 2016, 514, 217–228. [Google Scholar] [CrossRef]
- Liu, W.-W.; Tu, X.-Y.; Wang, X.-P.; Wang, F.-q.; Li, W. Pretreatment of coking wastewater by acid out, micro-electrolysis process with in situ electrochemical peroxidation reaction. Chem. Eng. J. 2012, 200, 720–728. [Google Scholar] [CrossRef]
- Yang, X. Interior microelectrolysis oxidation of polyester wastewater and its treatment technology. J. Hazard. Mater. 2009, 169, 480–485. [Google Scholar] [CrossRef]
- Yang, X.; Xue, Y.; Wang, W. Mechanism, kinetics and application studies on enhanced activated sludge by interior microelectrolysis. Bioresour. Technol. 2009, 100, 649–653. [Google Scholar] [CrossRef]
- Song, N.; Xu, J.; Cao, Y.; Xia, F.; Zhai, J.; Ai, H.; Shi, D.; Gu, L.; He, Q. Chemical removal and selectivity reduction of nitrate from water by (nano) zero-valent iron/activated carbon micro-electrolysis. Chemosphere 2020, 248, 125986. [Google Scholar] [CrossRef]
- Liu, Y.; Gao, Y.; Yao, B.; Zou, D. Removal of chlortetracycline by nano- micro-electrolysis materials: Application and mechanism. Chemosphere 2020, 238, 124543. [Google Scholar] [CrossRef]
- Ma, W.; Han, Y.; Xu, C.; Han, H.; Zhong, D.; Zhu, H.; Li, K. The mechanism of synergistic effect between iron-carbon microelectrolysis and biodegradation for strengthening phenols removal in coal gasification wastewater treatment. Bioresour. Technol. 2019, 271, 84–90. [Google Scholar] [CrossRef] [PubMed]
- Zhang, Q. Treatment of oilfield produced water using Fe/C micro-electrolysis assisted by zero-valent copper and zero-valent aluminium. Environ. Technol. 2015, 36, 515–520. [Google Scholar] [CrossRef] [PubMed]
- Zhu, Q.; Guo, S.; Guo, C.; Dai, D.; Jiao, X.; Ma, T.; Chen, J. Stability of Fe–C micro-electrolysis and biological process in treating ultra-high concentration organic wastewater. Chem. Eng. J. 2014, 255, 535–540. [Google Scholar] [CrossRef]
- Wang, X.; Gong, X.; Zhang, Q.; Du, H. Degradation mechanism of Direct Pink 12B treated by iron-carbon micro-electrolysis and Fenton reaction. J. Environ. Sci. 2013, 25, S63–S68. [Google Scholar] [CrossRef]
- Huang, D.; Yue, Q.; Fu, K.; Zhang, B.; Gao, B.; Li, Q.; Wang, Y. Application for acrylonitrile wastewater treatment by new micro-electrolysis ceramic fillers. Desalin. Water Treat. 2016, 57, 4420–4428. [Google Scholar] [CrossRef]
- Xu, X.; Cheng, Y.; Zhang, T.; Ji, F.; Xu, X. Treatment of pharmaceutical wastewater using interior micro-electrolysis/Fenton oxidation-coagulation and biological degradation. Chemosphere 2016, 152, 23–30. [Google Scholar] [CrossRef]
- Wang, D.; Han, H.; Han, Y.; Li, K.; Zhu, H. Enhanced treatment of Fischer-Tropsch (F-T) wastewater using the up-flow anaerobic sludge blanket coupled with bioelectrochemical system: Effect of electric field. Bioresour. Technol. 2017, 232, 18–26. [Google Scholar] [CrossRef]
- Ma, L.M.; Ding, Z.G.; Gao, T.Y.; Zhou, R.F.; Xu, W.Y.; Liu, J. Discoloration of methylene blue and wastewater from a plant by a Fe/Cu bimetallic system. Chemosphere 2004, 55, 1207–1212. [Google Scholar] [CrossRef]
- Fan, J.H.; Ma, L.M. The pretreatment by the Fe-Cu process for enhancing biological degradability of the mixed wastewater. J. Hazard. Mater. 2009, 164, 1392–1397. [Google Scholar] [CrossRef] [PubMed]
- Tang, P.; Deng, C.; Tang, X.; Si, S.; Xiao, K. Degradation of p-nitrophenol by interior microelectrolysis of zero-valent iron/copper-coated magnetic carbon galvanic couples in the intermittent magnetic field. Chem. Eng. J. 2012, 210, 203–211. [Google Scholar] [CrossRef]
- Zhao, H.; Nie, T.; Zhao, H.; Liu, Y.; Zhang, J.; Ye, Q.; Xu, H.; Shu, S. Enhancement of Fe-C micro-electrolysis in water by magnetic field: Mechanism, influential factors and application effectiveness. J. Hazard. Mater. 2020, 410, 124643. [Google Scholar] [CrossRef] [PubMed]
- Attour, A.; Touati, M.; Tlili, M.; Ben Amor, M.; Lapicque, F.; Leclerc, J.P. Influence of operating parameters on phosphate removal from water by electrocoagulation using aluminum electrodes. Sep. Purif. Technol. 2014, 123, 124–129. [Google Scholar] [CrossRef]
- Kobya, M.; Gengec, E.; Demirbas, E. Operating parameters and costs assessments of a real dyehouse wastewater effluent treated by a continuous electrocoagulation process. Chem. Eng. Process Process Intensif. 2016, 101, 87–100. [Google Scholar] [CrossRef]
- Wang, Y.; Feng, M.; Liu, Y. Preparation and application of aluminum-carbon microelectrolysis materials. J. Environ. Eng. 2018, 144, 04018016. [Google Scholar] [CrossRef]
- Yang, Z.; Ma, Y.; Liu, Y.; Li, Q.; Zhou, Z.; Ren, Z. Degradation of organic pollutants in near-neutral pH solution by Fe-C micro-electrolysis system. Chem. Eng. J. 2017, 315, 403–414. [Google Scholar] [CrossRef]
- Kusworo, T.D.; Susanto, H.; Aryanti, N.; Rokhati, N.; Widiasa, I.N.; Al-Aziz, H.; Utomo, D.P.; Masithoh, D.; Kumoro, A.C. Preparation and characterization of photocatalytic PSf-TiO2/GO nanohybrid membrane for the degradation of organic contaminants in natural rubber wastewater. J. Environ. Chem. Eng. 2021, 9, 105066. [Google Scholar] [CrossRef]
- Fu, Q.; Hu, Y. Treatment effect and decolorization mechanism of Congo red wastewater by aluminum-carbon microelectrolysis. Huanjing Kexue Xuebao/Acta Sci. Circumstantiae 2013, 33, 1527–1534. [Google Scholar]
- Wang, L.; Yang, Q.; Wang, D.; Li, X.; Zeng, G.; Li, Z.; Deng, Y.; Liu, J.; Yi, K. Advanced landfill leachate treatment using iron-carbon microelectrolysis- Fenton process: Process optimization and column experiments. J. Hazard. Mater. 2016, 318, 460–467. [Google Scholar] [CrossRef]
- Sharma, S.; Aygun, A.; Simsek, H. Electrochemical treatment of sunflower oil refinery wastewater and optimization of the parameters using response surface methodology. Chemosphere 2020, 249, 126511. [Google Scholar] [CrossRef]
- Singh, B.; Kumar, P. Pre-treatment of petroleum refinery wastewater by coagulation and flocculation using mixed coagulant: Optimization of process parameters using response surface methodology (RSM). J. Water Process Eng. 2020, 36, 101317. [Google Scholar] [CrossRef]
- Dawood, A.; Li, Y.J.W. Modeling and optimization of new flocculant dosage and pH for flocculation: Removal of pollutants from wastewater. Water 2013, 5, 342. [Google Scholar] [CrossRef]
- Wang, B.; Tian, K.; Xiong, X.; Ren, H. Treatment of overhaul wastewater containing N-methyldiethanolamine (MDEA) through modified Fe–C microelectrolysis-configured ozonation: Investigation on process optimization and degradation mechanisms. J. Hazard. Mater. 2019, 369, 655–664. [Google Scholar] [CrossRef] [PubMed]
- Lan, S.; Ju, F.; Wu, X. Treatment of wastewater containing EDTA-Cu(II) using the combined process of interior microelectrolysis and Fenton oxidation–coagulation. Sep. Purif. Technol. 2012, 89, 117–124. [Google Scholar] [CrossRef]
- Chen, R.-H.; Chai, L.-Y.; Wang, Y.-Y.; Liu, H.; Shu, Y.-D.; Zhao, J. Degradation of organic wastewater containing Cu–EDTA by Fe–C micro-electrolysis. Trans. Nonferrous Met. Soc. China 2012, 22, 983–990. [Google Scholar] [CrossRef]
- Jüntgen, H. Activated carbon as catalyst support: A review of new research results. Fuel 1986, 65, 1436–1446. [Google Scholar] [CrossRef]
- Zee, F.P.V.D.; Bisschops, I.A.E.; Lettinga, G.; Field, J.A.J.E.S. Activated carbon as an electron acceptor and redox mediator during the anaerobic biotransformation of azo dyes. Environ. Sci. Technol. 2003, 37, 402. [Google Scholar]
- Ghafari, S.; Aziz, H.A.; Isa, M.H.; Zinatizadeh, A.A. Application of response surface methodology (RSM) to optimize coagulation–flocculation treatment of leachate using poly-aluminum chloride (PAC) and alum. J. Hazard. Mater. 2009, 163, 650–656. [Google Scholar] [CrossRef]
Figure 1.
Influences of initial pH on (a) COD and (b) chroma removal at 2 h. Reaction conditions: Al scrap dosage, 100 g L−1; Al/AC mass ratio, 1:2; rotate speed, 150 r min−1.
Figure 1.
Influences of initial pH on (a) COD and (b) chroma removal at 2 h. Reaction conditions: Al scrap dosage, 100 g L−1; Al/AC mass ratio, 1:2; rotate speed, 150 r min−1.

Figure 2.
Influence of Al scrap dosage on (a) COD and (b) chroma removal at 2 h. Reaction conditions: Activated carbon dosage, 200 g L−1; rotation speed, 150 r min−1; pH value, 10.
Figure 2.
Influence of Al scrap dosage on (a) COD and (b) chroma removal at 2 h. Reaction conditions: Activated carbon dosage, 200 g L−1; rotation speed, 150 r min−1; pH value, 10.

Figure 3.
Influence of Al/AC mass ratio on (a) COD and (b) chroma removal at 2 h. Reaction conditions: Al scrap dosage, 80 g L−1; rotation speed, 150 r min−1; pH value, 10.
Figure 3.
Influence of Al/AC mass ratio on (a) COD and (b) chroma removal at 2 h. Reaction conditions: Al scrap dosage, 80 g L−1; rotation speed, 150 r min−1; pH value, 10.

Figure 4.
Proposed reaction mechanism of the Al/AC ME process for the decomposition of organic contaminants.
Figure 4.
Proposed reaction mechanism of the Al/AC ME process for the decomposition of organic contaminants.

Figure 5.
COD removal efficiency response surface model, predicted value vs. actual value.

Figure 6.
Response surface (a,c,e,g,i,k) and contour map (b,d,f,h,j,l) of COD removal percentage.


Table 1.
Response surface experimental factors and level design.
| Level | Independent Variables and Range | |||
|---|---|---|---|---|
| Initial pH (X1) | Al Scrap Dosage (g L−1) (X2) | Al/C Mass Ratio (X3) | Reaction Time (min) (X4) | |
| −1 | 8 | 50 | 0.20 | 150 |
| 0 | 10 | 75 | 0.35 | 180 |
| 1 | 12 | 100 | 0.50 | 210 |
Table 2.
Analysis of variance q.
| Sources of Variation | Sum of Squares | Degree of Freedom | Mean of Squares | F-Value | p |
|---|---|---|---|---|---|
| Model | 2391.05 | 14 | 170.79 | 13.88 | <0.0001 |
| X1 | 0.057 | 1 | 0.057 | 4.67 × 10⁻³ | 0.9465 |
| X2 | 568.98 | 1 | 568.98 | 46.25 | <0.0001 |
| X3 | 1040.67 | 1 | 1040.67 | 84.59 | <0.0001 |
| X4 | 218.03 | 1 | 218.03 | 17.72 | 0.0009 |
| X1X2 | 42.64 | 1 | 42.64 | 3.47 | 0.0838 |
| X1X3 | 24.8 | 1 | 24.8 | 2.02 | 0.1775 |
| X1X4 | 89.78 | 1 | 89.78 | 7.3 | 0.0172 |
| X2X3 | 9.55 | 1 | 9.55 | 0.78 | 0.3932 |
| X2X4 | 53.95 | 1 | 53.95 | 4.39 | 0.0549 |
| X3X4 | 4.95 | 1 | 4.95 | 0.4 | 0.5361 |
| X12 | 87.18 | 1 | 87.18 | 7.09 | 0.0186 |
| X22 | 110.69 | 1 | 110.69 | 9 | 0.0096 |
| X32 | 11.03 | 1 | 11.03 | 0.9 | 0.3598 |
| X42 | 170.6 | 1 | 170.6 | 13.87 | 0.0023 |
| Residual | 172.24 | 14 | 12.3 | ||
| Lack of fit | 134.86 | 10 | 13.49 | 1.44 | 0.3864 |
| Pure error | 37.38 | 4 | 9.34 | ||
| Total error | 2563.29 | 28 |
Table 3.
ANOVA results of response variable.
| p | AP | S.D. | R2 | Radj2 | F | PLOF | CV (%) |
|---|---|---|---|---|---|---|---|
| <0.0001 s | 15.459 | 3.51 | 0.9328 | 0.8656 | 13.88 | 0.3864 ns | 9.29 |
Notes: p, probability of error; AP, adequate precision; S.D., standard deviation; R2, correlation coefficient; Radj2, adjusted correlation coefficient; PLOF, probability of lack of fit; CV (%), coefficient of variance; s, significant; ns, not significant.
Publisher’s Note: MDPI stays neutral with regard to jurisdictional claims in published maps and institutional affiliations. |
© 2022 by the authors. Licensee MDPI, Basel, Switzerland. This article is an open access article distributed under the terms and conditions of the Creative Commons Attribution (CC BY) license (https://creativecommons.org/licenses/by/4.0/).
Share and Cite
MDPI and ACS Style
Zhu, L.; Huang, D.; Du, H. Pretreatment of Rubber Additives Processing Wastewater by Aluminum–Carbon Micro-Electrolysis Process: Process Optimization and Mechanism Analysis. Water 2022, 14, 582. https://doi.org/10.3390/w14040582
AMA Style
Zhu L, Huang D, Du H. Pretreatment of Rubber Additives Processing Wastewater by Aluminum–Carbon Micro-Electrolysis Process: Process Optimization and Mechanism Analysis. Water. 2022; 14(4):582. https://doi.org/10.3390/w14040582
Chicago/Turabian StyleZhu, Ling, Daikuan Huang, and Hao Du. 2022. "Pretreatment of Rubber Additives Processing Wastewater by Aluminum–Carbon Micro-Electrolysis Process: Process Optimization and Mechanism Analysis" Water 14, no. 4: 582. https://doi.org/10.3390/w14040582
Note that from the first issue of 2016, this journal uses article numbers instead of page numbers. See further details here.