Article

Investigation of the Effects of Climate Variability, Anthropogenic Activities, and Climate Change on Streamflow Using Multi-Model Ensembles

1
Department of Civil and Environmental Engineering, Hanyang University, Seoul 04763, Korea
2
Research Institute of Engineering and Technology, Hanyang University (ERICA), Ansan 15588, Korea
3
Department of Civil and Environmental Engineering, Hanyang University (ERICA), Ansan 15588, Korea
*
Author to whom correspondence should be addressed.
Water 2022, 14(4), 512; https://doi.org/10.3390/w14040512
Submission received: 8 January 2022 / Revised: 3 February 2022 / Accepted: 7 February 2022 / Published: 9 February 2022
(This article belongs to the Special Issue Assessing and Managing Risk of Flood and Drought in a Changing World)

Abstract

:
Streamflow is a very important component of the hydrological cycle, and variation in the streamflow can be an indication of hydrological disaster. Thus, the accurate quantification of streamflow variation is a core concern in water resources engineering. In this study, we evaluated the factors influencing streamflow and decomposed their effects in three large rivers: the Buk Han River (BHR), the Nam Han River (NHR), and the Lower Han River (LHB). The Pettit test was used to investigate breakpoints in conjunction with the climate elasticity approach and decomposition framework to quantify and decompose the effects of climate variability and anthropogenic activity. The abrupt breakpoints in the streamflow and precipitation data were detected in 1997 and 1995. Considering these breakpoints, we divided the time series into two periods: the baseline period and the post-baseline period. Climate elasticity approaches were used to quantify the effects of climate variability and anthropogenic activity during the baseline period, post-baseline period, and future periods (2031–2060 and 2071–2100) under the Representative Concentration Pathways’ 4.5 and 8.5 scenarios. The results revealed that climate variability was the leading cause of alteration in the streamflow in the BHR and NHR, accounting for 76.52% to 80.51% of the total change, respectively. Meanwhile, the LHR remained more sensitive to anthropogenic activity, which accounted for 56.42% of the total variation in streamflow. Future climate change also showed an increase in precipitation and temperature in both scenarios, especially during the far-future period (2071–2100). This variation in the climatic factor was shown to affect the future streamflow by 22.14% to 27.32%. These findings can play a very important role in future planning for large river basins, considering the impacts of increasing anthropogenic activity and climate change to reduce the risks of hydrological hazards.

1. Introduction

Global warming has become a core concern of researchers in the area of hydrology and water resources [1]. It has been proven from experimental evidence from various regions of the globe that the hydrological cycle has been influenced by warming, including anthropogenic warming due to the release of greenhouse gases (GHGs) into the atmosphere [2]. This addition of greenhouse gases eventually results in a rise in evaporation and extensive precipitation events [1,3,4,5]. A warming trend of 0.23 °C/decade in the mean annual temperature over South Korea has been observed during the last five decades, which has resulted in an increased frequency of extreme temperature events with greater values during the 1980s and 1990s.
Recently, streamflow generation on the catchment scale has become a global concern in this changing environment [6,7,8]. Variation in streamflow has been observed in response to climate and watershed changes, including climate warming, urbanization, irrigation, and watercourse alteration, etc. As an example of climate warming, according to the fifth assessment report of the Intergovernmental Panel on Climate Change [9], the mean global temperature increased by 0.74 °C from 1880 to 2012. The global temperature can result in changes in rainfall, air temperature, potential evaporation, sunshine hours, humidity, and other climate variables that can lead to possible variation in streamflow [10]. The streamflow is also closely related to various anthropogenic activities. These activities include a shift in land use/land cover (LULC), construction dams, embankments, urbanization, changes in agriculture patterns, deforestation, and operational management practices, which are believed to have a direct or indirect impacts on the hydrological cycle of a watershed [11,12,13,14]. Therefore, the hydrological response to anthropogenic activities and future climate change has turned out to be a core issue among the research community in the fields of hydrology and water and environmental engineering.
The unpredictable environment of the hydrological response can disturb planning, management, and disaster control strategies. Xin et al. [15] rationalized the combination of climate change and the impact of human activities with basin hydrology. Moreover, a climate elasticity approach was established for the estimation of the effects of climate variability and human activities on streamflow conditions. This approach has been widely used to quantify the factors affecting streamflow conditions [4,7,16,17].
In recent years, it has been documented that the global water cycle has been disturbed in response to the combined effects of climate variability and anthropogenic activities [15,18]. Therefore, it is essential to investigate the hydrological responses to climate variability and anthropogenic activities to improve insight into watershed hydrology. In Korea, the streamflow has been determined to be sensitive to human activities [19]. Compared to other rivers in Korea, the relative proportion of human activities in the Han River basin (HRB) was observed to be more sensitive [20,21]. The HRB is one of the largest inland rivers in the country, and it plays a vital role in the development of the country because more than 60% of the country’s population lives within this basin. Therefore, there is a huge demand for water, which leads to an increase in the difference between water demand and supply. The Seoul metropolitan city, which is the hub of the country’s economy, also lies within this basin, which has accelerated urbanization and industrialization and led to a remarkable change in the land use and land cover in the basin during the last four decades [19]. Furthermore, urbanization was the leading feature of land conversion in the HRB as a rapid increase in urbanization was noticed in the 1990s.
Thus, anthropogenic activities affect the splitting of precipitation on the basin scale. Apparently, it would not be erroneous to ignore the impacts of anthropogenic activities on streamflow alterations. Recently, the quantification of factors influencing streamflow has remained an issue that is not often studied by hydrological researchers [15,21,22,23,24]. Tan and Gan [25] found that the mean annual streamflow observed in the Canadian river basins decreased in response to human activities. Shahid et al. [26] reported that the change in LULC decreased the annual runoff in the San River basin, Pakistan. Villarini and Wasko [
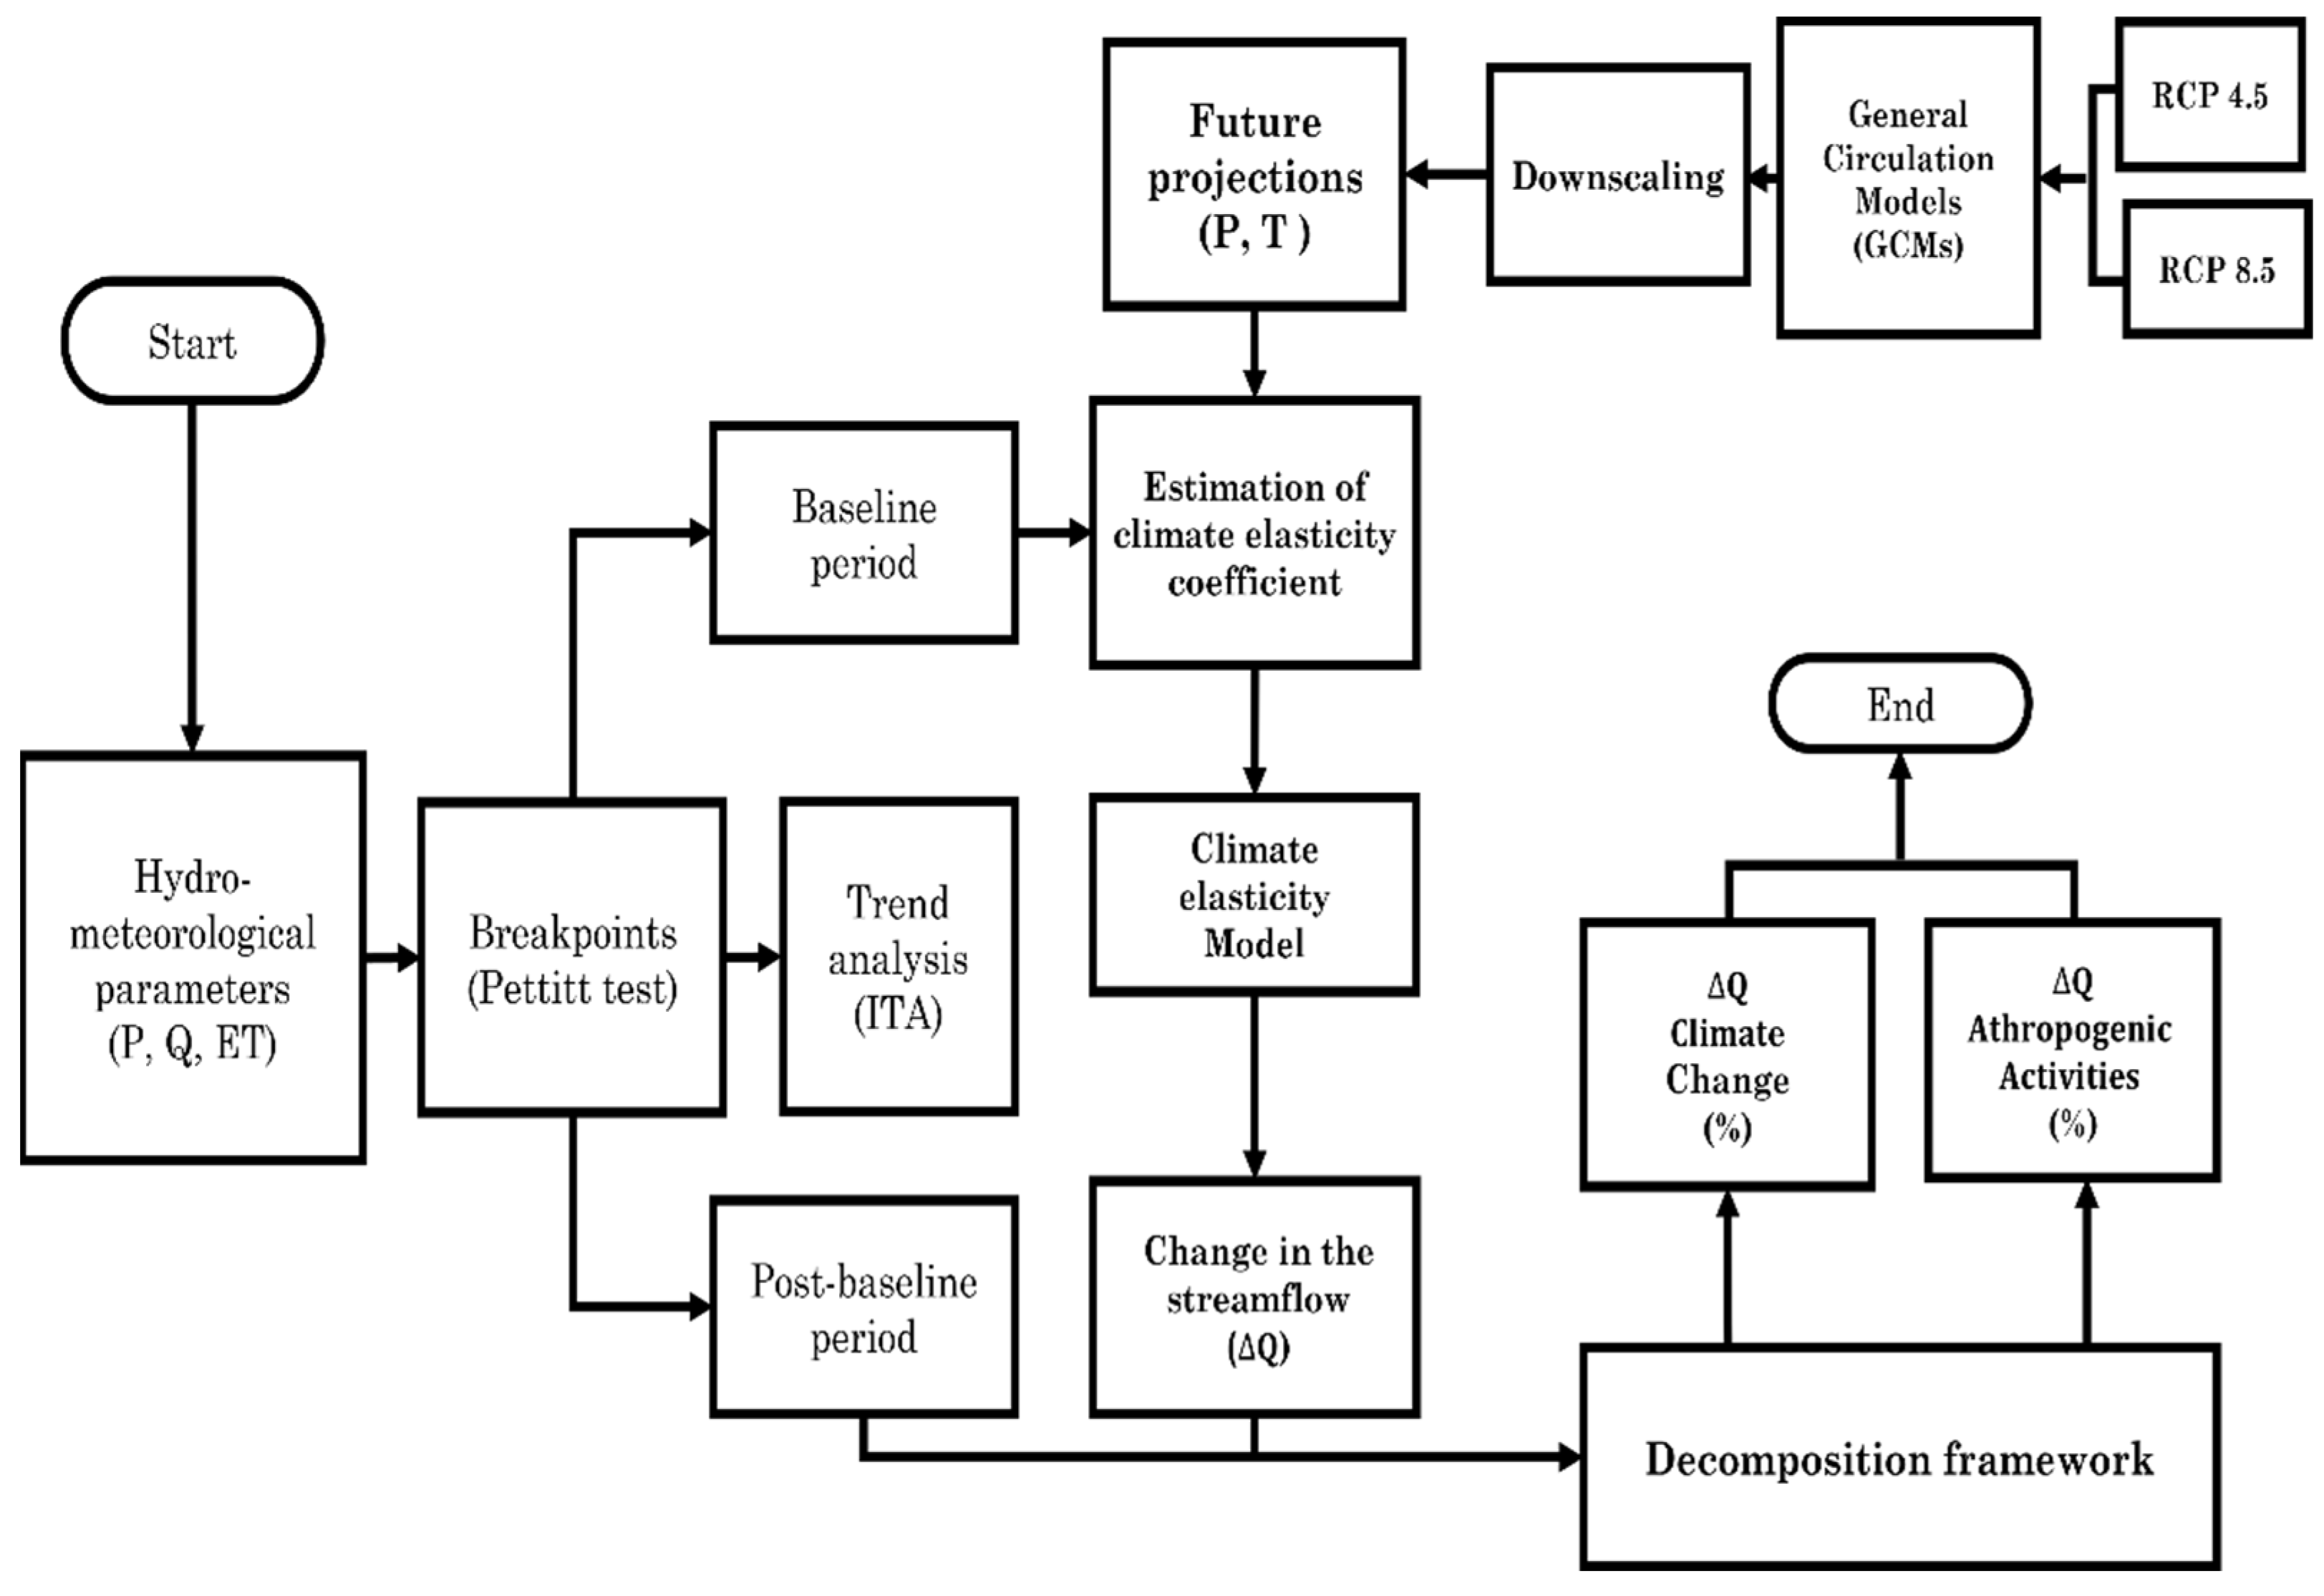
27] concluded that globally, although the variation in the streamflow in response to climate change is ambiguous, the basins influenced by anthropogenic activities remained more sensitive to changes in streamflow. In Iran, agricultural land development decreased the annual streamflow during the historical period by 21%. However, this impact will change from 14 to 44% in the future periods under climate change scenarios. Considering this global background, very few studies have been carried out to evaluate and decompose the effects climate variability and anthropogenic activities on streamflow. In this study, an attempt was made to evaluate and decompose the alteration in the streamflow in response to climate variability and anthropogenic activities in large basins considering climate change scenarios. A comprehensive framework was adopted, consisting of the determination of change points, the identification of trends in the time-series of precipitation and streamflow, and the decomposition of the impacts of climate variability and anthropogenic activities. In this study, three catchments of the HRB: the Buk Han River (BHR; North Han River), Nam Han River (NHR; South Han River), and Lower Han River (LHR), were taken into consideration. The objectives of this study were to: (1) analyze the influence of climate variability and anthropogenic activities on the streamflow of the catchment, (2) evaluate the quantitative contribution of climate variability and anthropogenic activities during the observation period (1966–2014) with the application of a climate elasticity approach, and (3) compute the projected variation in the streamflow under the Representative Concentration Pathways (RCP) 4.5 and 8.5, based on the CMIP5 projections.

2. Study Area and Data

The HRB is one of the large river basins in Korea and is located in the middle of the Korean peninsula between 36°30′–38°55′ N and 126°24′–129°20′ E. The length of the river is 483.1 km, with a catchment drainage area of 2385.6 km2. This large basin can be naturally divided into three main rivers: the NHR, BHR, and LHR, which are presented in Figure 1. The HRB is the most densely populated basin in Korea, with more than half of the country’s population living in this basin, including Seoul, a metropolitan city in South Korea with a population of 25 million. The HRB has continental, mountainous, and humid climatic conditions, with an average elevation of about 406 m, and the mean annual precipitation and temperature are 1300 mm and 12 °C, respectively [28].
The meteorological data, consisting of daily precipitation and temperature (max and min) for the period from 1966 to 2014, were collected from the official website of the Korea Meteorological Administration (http://www.data.kma.go.kr, accessed on 15 July 2021). The monthly discharge data from the BHR, NHR, and LHR for the period of 1966 to 2014, the LULC, and the population data were obtained from the Water Management Information System (http://www.wamis.go.kr/Main.aspx, accessed on 23 August 2021). The detailed features of the LULC data during the baseline (1966–1997) and post-baseline (1998–2014) periods (defined later) are presented in Table 1. The projected precipitation and temperature data were generated by general circular models (GCMs). Table 2 shows the source and resolution of the four GCMs used in this study. The projected data were obtained from the website of the Earth System Grid Federation (http://esgf-node.llnl.gov, accessed on 27 August 2021) from 2031 to 2100 under both the RCP 4.5 and 8.5 scenarios, which were based on CMIP5. These projected data were used to estimate the future climate impact on streamflow. The Hargreaves equation, which requires the least amount of and mostly readily available input data sets, such as minimum and maximum temperature [29], was used to measure the potential evapotranspiration, due to the unavailability of huge hydro-meteorological data sets.

3. Methods

A comprehensive framework was adapted, as shown in Figure 2, for evaluating and decomposing the changes to streamflow due to climate variability and anthropogenic activities under climate change conditions.

3.1. Identification of Trends

Innovative trend analysis (ITA) was applied to investigate the trends in the hydro-meteorological data. This test has been frequently used and has universal applicability [30,31]. As Shah et al. [32] specified a detailed procedure of ITA, the trend indicator of ITA was defined by Sen [33] as:
ITA = 1 n   i = 1 n ( k i j i ) μ
where ITA is the trend indicator, n is the number of data points, μ is the average value time series, and ji and ki indicate the observation points. A positive value of ITA signifies that the time series possesses an increasing trend, whereas a negative ITA indicates a decreasing trend.

3.2. Investigation of Breakpoints

In this study, a broadly used and highly endorsed non-parametric Pettit method was applied to ascertain breakpoints. Several studies have utilized this approach to categorize abrupt breakpoints and to distinguish the baseline and post-baseline periods [34]. The procedure for the Pettit breakpoint test considers the time series as two series: e1,…, et and et+1,…, eN. The Pettit Ut,N is given by Equation (2) as follows:
U t , N = i = 1 t j = t + 1 N sgn ( e i e j )
The probability of break points for each year can be measured as follows:
ρ 1 exp ( 6 U t , N 2 N 3 + N 2 )

3.3. Decomposing the Relative Contribution of Climate Variability and Anthropogenic Activities

Alterations in streamflow can be influenced by the combined interaction of climate variability and anthropogenic activities. Climate variability is mainly attributed to external forces. Thus, these forces are considered to be independent variables [35]. The relative contributions of climate variability ( RC C )   and anthropogenic activities ( RC A ) can be quantified as follows:
| Δ Q | = | Δ Q C | + | Δ Q A |
RC A ( % ) = Δ Q A | Δ Q | × 100 ( % )
RC C ( % ) = Δ Q C | Δ Q | × 100 ( % )

3.4. Decomposing the Relative Contribution of Climate Variability and Anthropogenic Activities

The Budyko assumption depends on the principle of the water and energy balance of a catchment. The sum of precipitation is equal to the sum of streamflow and evaporation, whereas inbound solar radiation is the same as the outbound thermal radiation from the earth [16]. Considering this relationship, Budyko [36] anticipated that the ratio of yearly evapotranspiration to precipitation (evaporation index) would likely be associated with the ratio of yearly potential evapotranspiration to precipitation (dryness index (φ)) and the physical characteristics of the catchment. In general, the Budyko assumption can be written as:
ET = P × f ( φ ,   C )
where ET is the evapotranspiration, P is the precipitation, and C is the catchment characteristics. Equation (7) reveals the typical linkage of the evaporation ratio and dryness index. However, for practical applications, it must be in a certain form. Therefore, the Budyko curve-based functions proposed by Zhange et al. [37] express the aforementioned linkage as follows:
PET P = 1 + φ ( 1 + ( φ ) )
PET P = 1 + w φ 1 + w φ + ( 1 + w φ ) 1
where PET is the potential evapotranspiration, and w indicates the catchment characteristics, which are a function of vegetation types and topographical characteristics.
Δ Q C = ( Ɛ P Δ P P Ɛ PET Δ PET P ) × Q
where ΔP and ΔPET reflect the change in precipitation and the potential evapotranspiration, respectively. ƐP and ƐPET are the streamflow elasticities to precipitation and potential evapotranspiration, respectively. The streamflow elasticities, ƐP and ƐPET, are connected, as ƐP + ƐPET = 1. Thus, ΔQC and ΔQA are the increments of streamflow due to climate variability and anthropogenic activities, respectively.
To compute the ΔQC, ƐP and ƐPET are initially required to be analyzed. In this study, we applied the Budyko hypotheses procedure that can be expressed as:
Ɛ P = 1 + φ × f ( φ ) 1 f ( φ )
where f ( φ ) is the derivative of the function from the Budyko-based approach.

4. Results

4.1. Investigation of Breakpoints

To quantify and decompose the hydrological response to climate warming and anthropogenic activities in the river basin, we initially diagnosed the spurious breakpoint in the time series. We detected the breakpoints in the hydro-meteorological times series using the Pettitt test, and the results are shown in Figure 3. The breakpoints in precipitation and streamflow in all three of the rivers were observed during the 1990s. In the BHR and NHR, both the precipitation and streamflow times series showed similar breakpoints in 1997. Meanwhile, the breakpoint in streamflow in the LHR was detected in 1995. The breakpoints in our study are comparable with those in recent studies conducted over the HRB [19,21]. Considering the breakpoints, we divided the time series into two sub-series: the baseline period from 1966 to the breakpoint detection year, assuming that the streamflow during this period was only influenced by climate variability, and the post-baseline period from the breakpoint to 2014, assuming that the streamflow during this period was influenced by both climate variability and anthropogenic activities.

4.2. Characteristics of LULC in the HRB

The characteristics of LULC in the HRB were mainly dominated by three types of land use: forests, cultivable land, and urbanization. However, remarkable variations in the proportion of land use were noticed. These variations were observed distinctly in the BHR, NHR, and LHR, as shown in Table 1. During the baseline period, the fractions of forests, cultivable land, and urbanized land were 75.7%, 19.2%, and 0.51% in the BHR; 85.7%, 9.9%, and 0.95% in the NHR; and 44.8%, 23.14%, and 21.6% in the LHR, respectively. However, during the post-baseline period, significant reductions in forest by 8.3% and 15% were observed in the BHR and LHR, respectively, whereas rapid growth in urbanization compared to the baseline period, accounting for 86.3%, 65.7%, and 39.6% were detected in the BHR, NHR, and LHR, respectively. The ratio of cultivable land was observed to be reduced in both the NHR and LHR. This variation in land use indicated that ecological progression began in the watershed. As denoted in Table 1, the forest and cultivable land areas were gradually converted into urban areas in all of the river basins. The proportional variation of the LULC indicated that, within the baseline period, the reductions in cultivable land were observed as 27.17 and 83.3% in the NHR and LHR, respectively. However, an extensive increase of urbanization was observed as 39.6 to 86.3%. Condensing the LULC change, the time series of all the river basins were classified into two sub-series with the baseline period that had relatively less variation in LULC from 1966 to around 1990. Whereas the post-baseline period had a rapid fraction in LULC that began in the 1990s and continued to the last year of the present study on record.

4.3. Variation in the Time-Series of Precipitation and Streamflow

The inconsistencies in precipitation and streamflow in the BHR, NHR, and LHR for the period of 1966–2014, and future periods (2031–2060 (P1) and 2071–2100 (P2)) were evaluated using the ITA. The trends observed in both precipitation and streamflow are shown in Figure 4, which showed a significant shift from the baseline period to the post-baseline period in all river basins. Negative values of ITA for precipitation and streamflow in the BHR and LHR were observed during the baseline period, which showed decreasing trends. However, the values of the trend indicator ITA for the post-baseline period were observed to be positive (increasing) in all river basins. Abrupt shifts in the precipitation and streamflow trends from decreasing to increasing during the baseline and post-baseline periods were observed in the BHR and LHR. Considerable increases in precipitation and streamflow in the HRB were also reported by Shah et al. [21]. This significant variation in precipitation and streamflow may be in response to anthropogenic activities, including the LULC change, the construction of dams and levees, urbanization, and changes in irrigation, deforestation, and operational management practices, which might alter the hydrology of the watershed.

4.4. Relative Contributions of Climate Variability and Anthropogenic Activities

The Budyko-based climate elasticity approach was adapted to evaluate and decompose the streamflow changes from climate variation and anthropogenic activities in all three large rivers in the HRB. First, the elasticity coefficient for streamflow, corresponding to climatic variables, such as precipitation ( Ɛ P ) and potential evapotranspiration ( Ɛ PET ), for the BHR, NHR, and LHR were estimated using the Budyko-based curve. The results of the climate elasticity approach are compiled and shown in Table 3. The values of the elasticity coefficients for precipitation ( Ɛ P ) were 1.95, 1.96, and 1.86, and the elasticity coefficients of potential evapotranspiration ( Ɛ PET ) were observed as −0.95, −0.96, and −0.86 in the BHR, NHR, and LHR, respectively. These results suggest that climate variability was a key factor responsible for the alteration in streamflow. However, the impact of climate variability varied in each river basin in the HRB, as shown in Figure 5. The effects of climate variability in the BHR and NHR accounted for 76.52% and 80.51% of the total change, respectively. Precipitation remained a primary factor of the climate variability in both the BHR and NHR. Whereas the impact of climate variability remained a secondary source of altering streamflow in the LHR, causing 43.57% of the total change in streamflow. Meanwhile, the proportion of anthropogenic activities was observed to be less than that of climate variability in the BHR and NHR, accounting for 23.48% and 19.5% of the total change, respectively. Whereas the impact of anthropogenic activities was a leading source of the alteration in the streamflow in the LHR, accounting for 56.42% of the total variation.

4.5. Change in the Projected Precipitation and Temperature under the RCP Scenarios

Future variation in the extent of precipitation was computed with both the RCP 4.5 and 8.5 scenarios for the future periods. To evaluate the impacts of climate variability on streamflow alteration in the HRB, the data were divided into three periods: P0 (1966–1997) was chosen as the baseline period, and the other two periods were future periods: P1 (2031–2060) and P2 (2071–2100). The variations in precipitation of P1 and P2 were compared to those of P0 under the RCP 4.5 and 8.5 scenarios, as demonstrated in Table 4. Corresponding to the scenarios, the annual increase in precipitation of P2 was relatively greater than that of P1 ranging from 11.1% to 13% compared to that of P0 under the RCP 4.5 and 8.5 scenarios, respectively.
Furthermore, seasonal variations in the future precipitation were observed in both scenarios and are shown in Table 4. Seasonally, a slight decrease in precipitation was observed in the spring and summer, whereas a slight increase during the fall season was observed between P1 and P2 under both the RCP 4.5 and 8.5 scenarios. Figure 6 exhibits the monthly variation in the precipitation that increased in April, May, and November, whereas it decreased in June under the RCP 8.5 scenario. However, an increase in precipitation was observed during May and August and a decrease was observed in October under the RCP 8.5 scenario.
The results of the temperature variations are shown in Table 5. These results indicate that the temperature will follow an increasing trend. Temperature variations under the RCP 4.5 and 8.5 scenarios are shown in Figure 7, which revealed that warming will be less under the RCP 4.5. However, it will constantly be increasing under the RCP 8.5.
We used the climate elasticity approach (Equation 10) to compute the variations in the streamflow under climate change conditions in response to precipitation and evapotranspiration under the RCP scenarios. The results revealed the projected variation in the streamflow in response to climate factors, as shown in Table 6. Considering the results obtained from the multi-model ensemble (MME) under the RCPs 4.5 and 8.5 scenarios for the period of P1, the projected variations in the precipitation were 4.6% to 11.18%, and the evapotranspiration varied from −6.23% to −6.34%, respectively. However, during P2, under both scenarios, variation in the precipitation increased from 10.35% to 10.53%, and the evapotranspiration increased due to the increase in temperature during P2, which accounted for 11.79% to 16.76%. These variations in the future climate factors might lead to alteration of the streamflow in the basin. The projected variation in the streamflow during P2 ranged from 22.14% to 27.33% compared to the baseline period under the RCP 4.5 and 8.5 scenarios.

5. Discussion

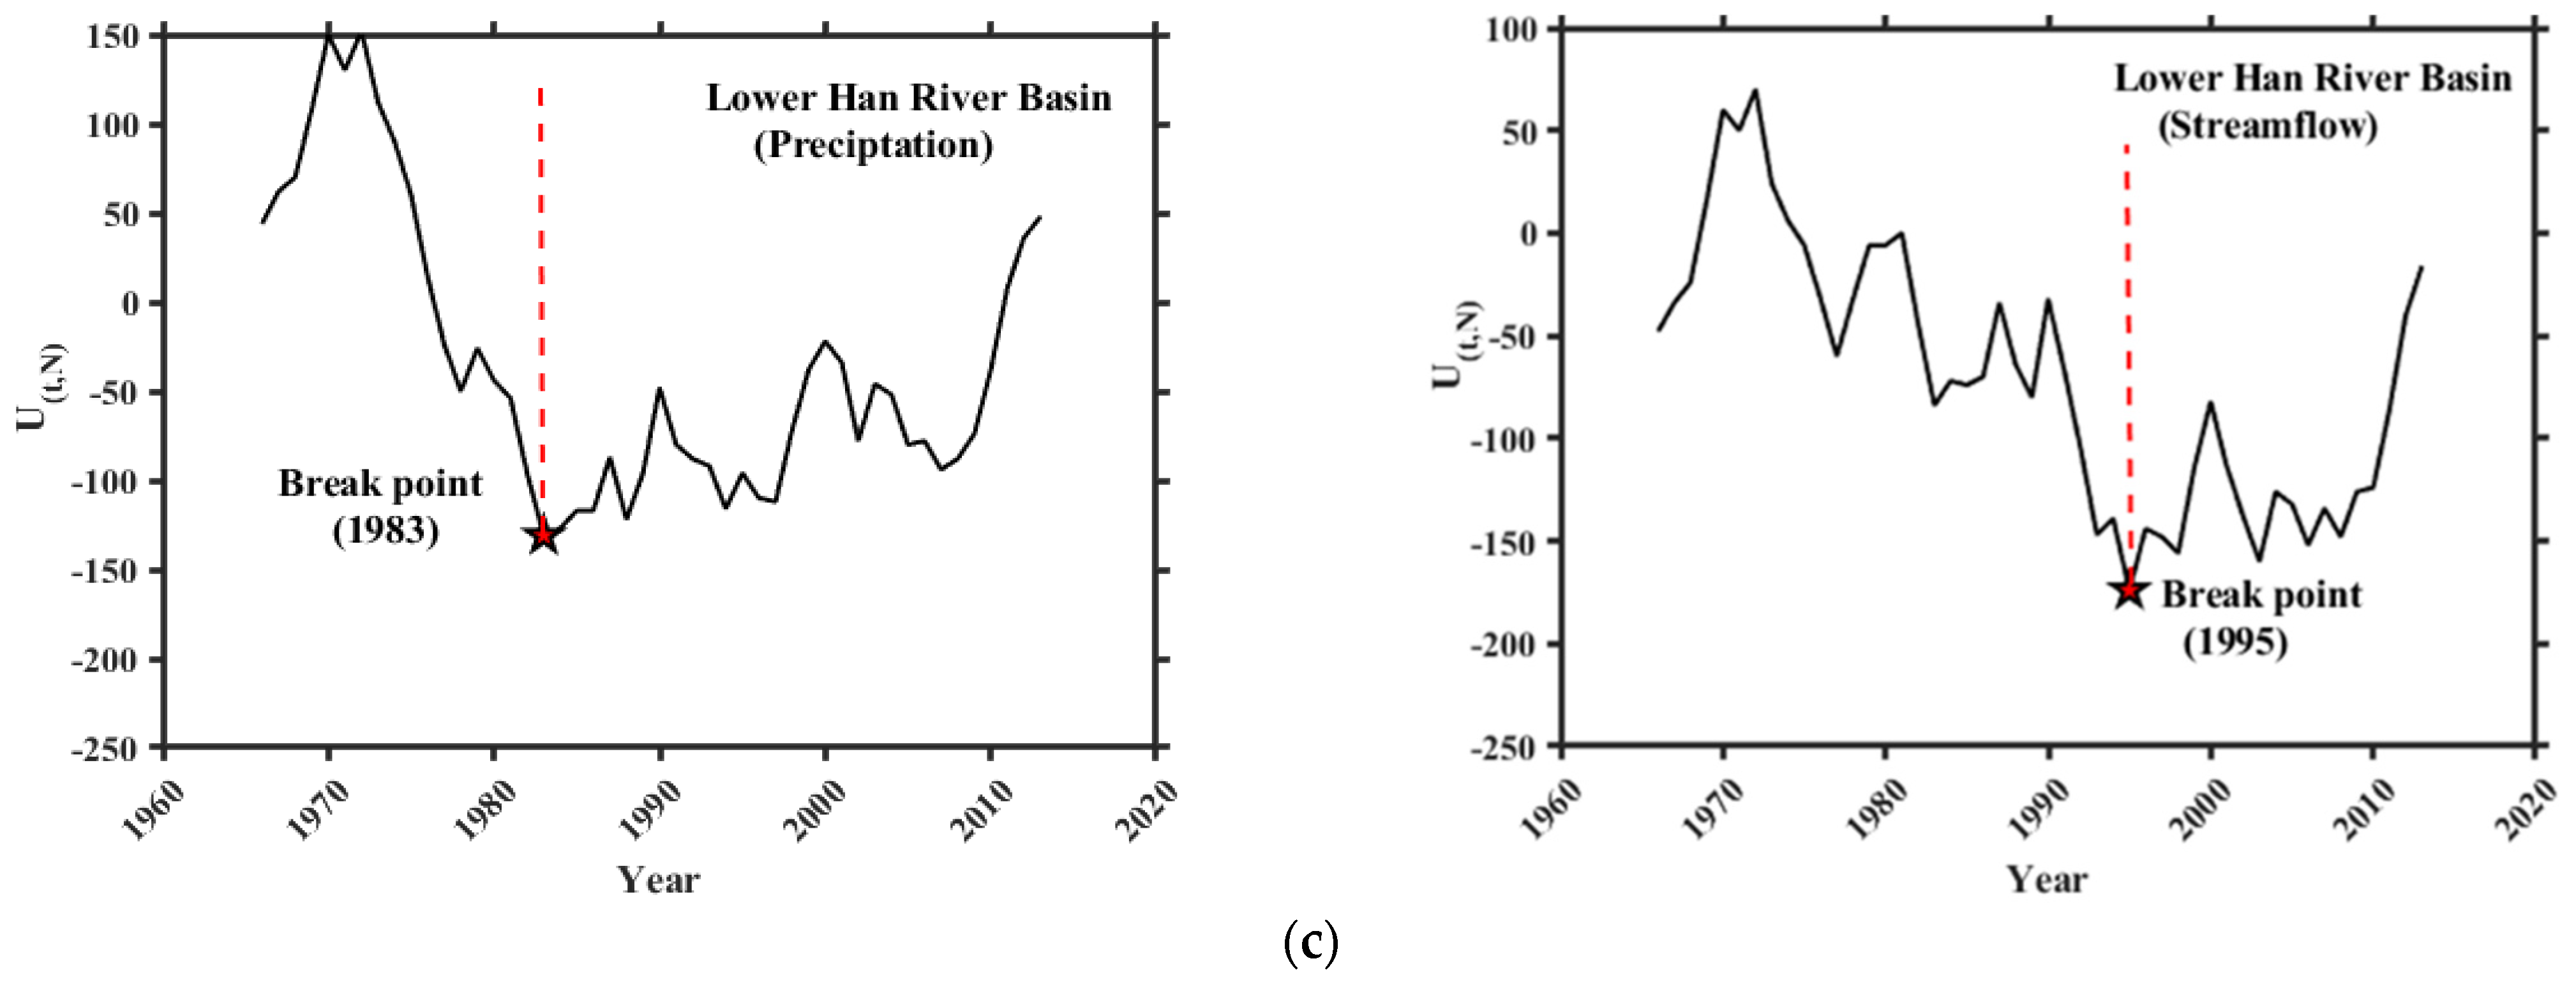
In this study, we evaluated and decomposed the influence of climate variability and anthropogenic activities on the streamflow alteration in large basins using MME projections under the RCP 4.5 and RCP 8.5 scenarios in the HRB. To achieve our objective, we first identified the breakpoints for the precipitation, evaporation, and streamflow time series and found breakpoints during the 1990s in all three rivers: the BHR, NHR and LHR. Our breakpoint results are consistent with those of recent studies on the HRB [19,
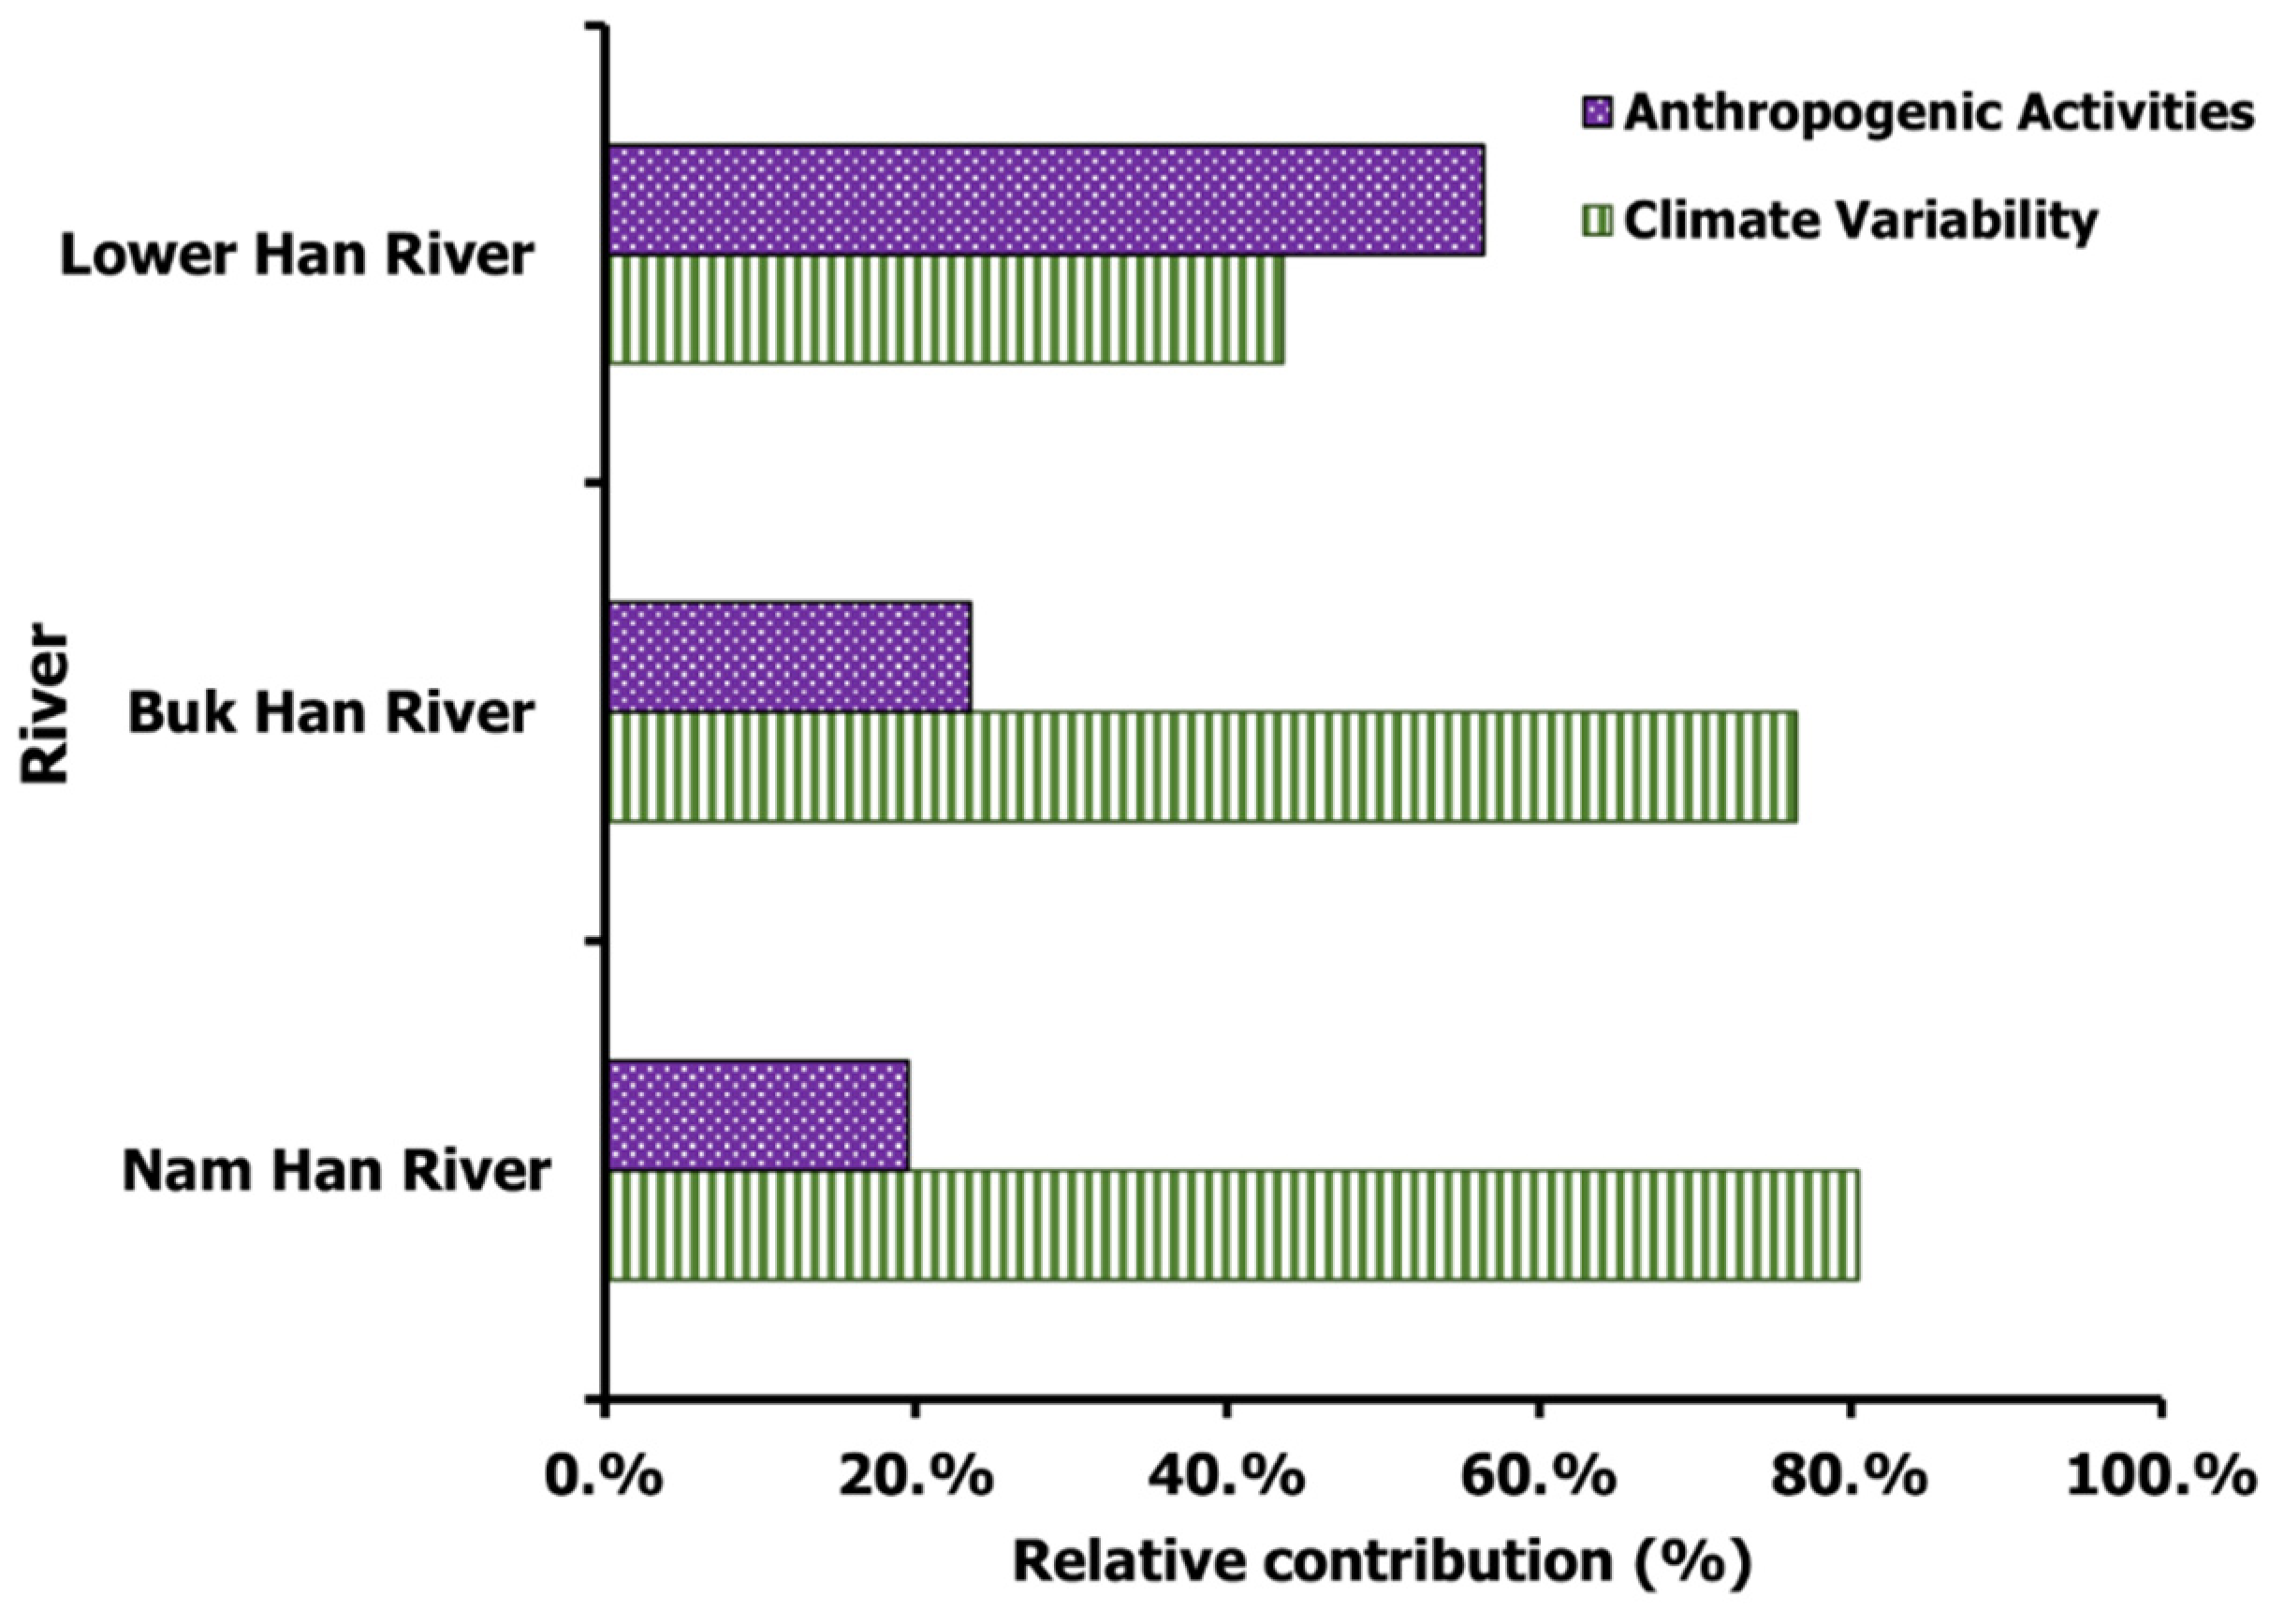
21]. These studies also determined breakpoints during the 1990s that were that start of anthropogenic activities in the basin. Furthermore, we quantified the effects of climate variability and anthropogenic activities on streamflow alteration using the climate elasticity approach. We found that climate variability was the dominant factor accounting for 76.52% and 80.51% of the total variation in the streamflow, while anthropogenic activities remained secondary, accounting for 23.48% and 19.5% of the variation in the streamflow in the BHR and NHR, respectively. However, a large variation in the relative proportions was observed in the LHR, with climate variability contributing 43.57% and anthropogenic activities contributing 56.7%. The higher contribution of anthropogenic activities in the LHR could have been due to rapid urbanization and LULC changes in the basin.
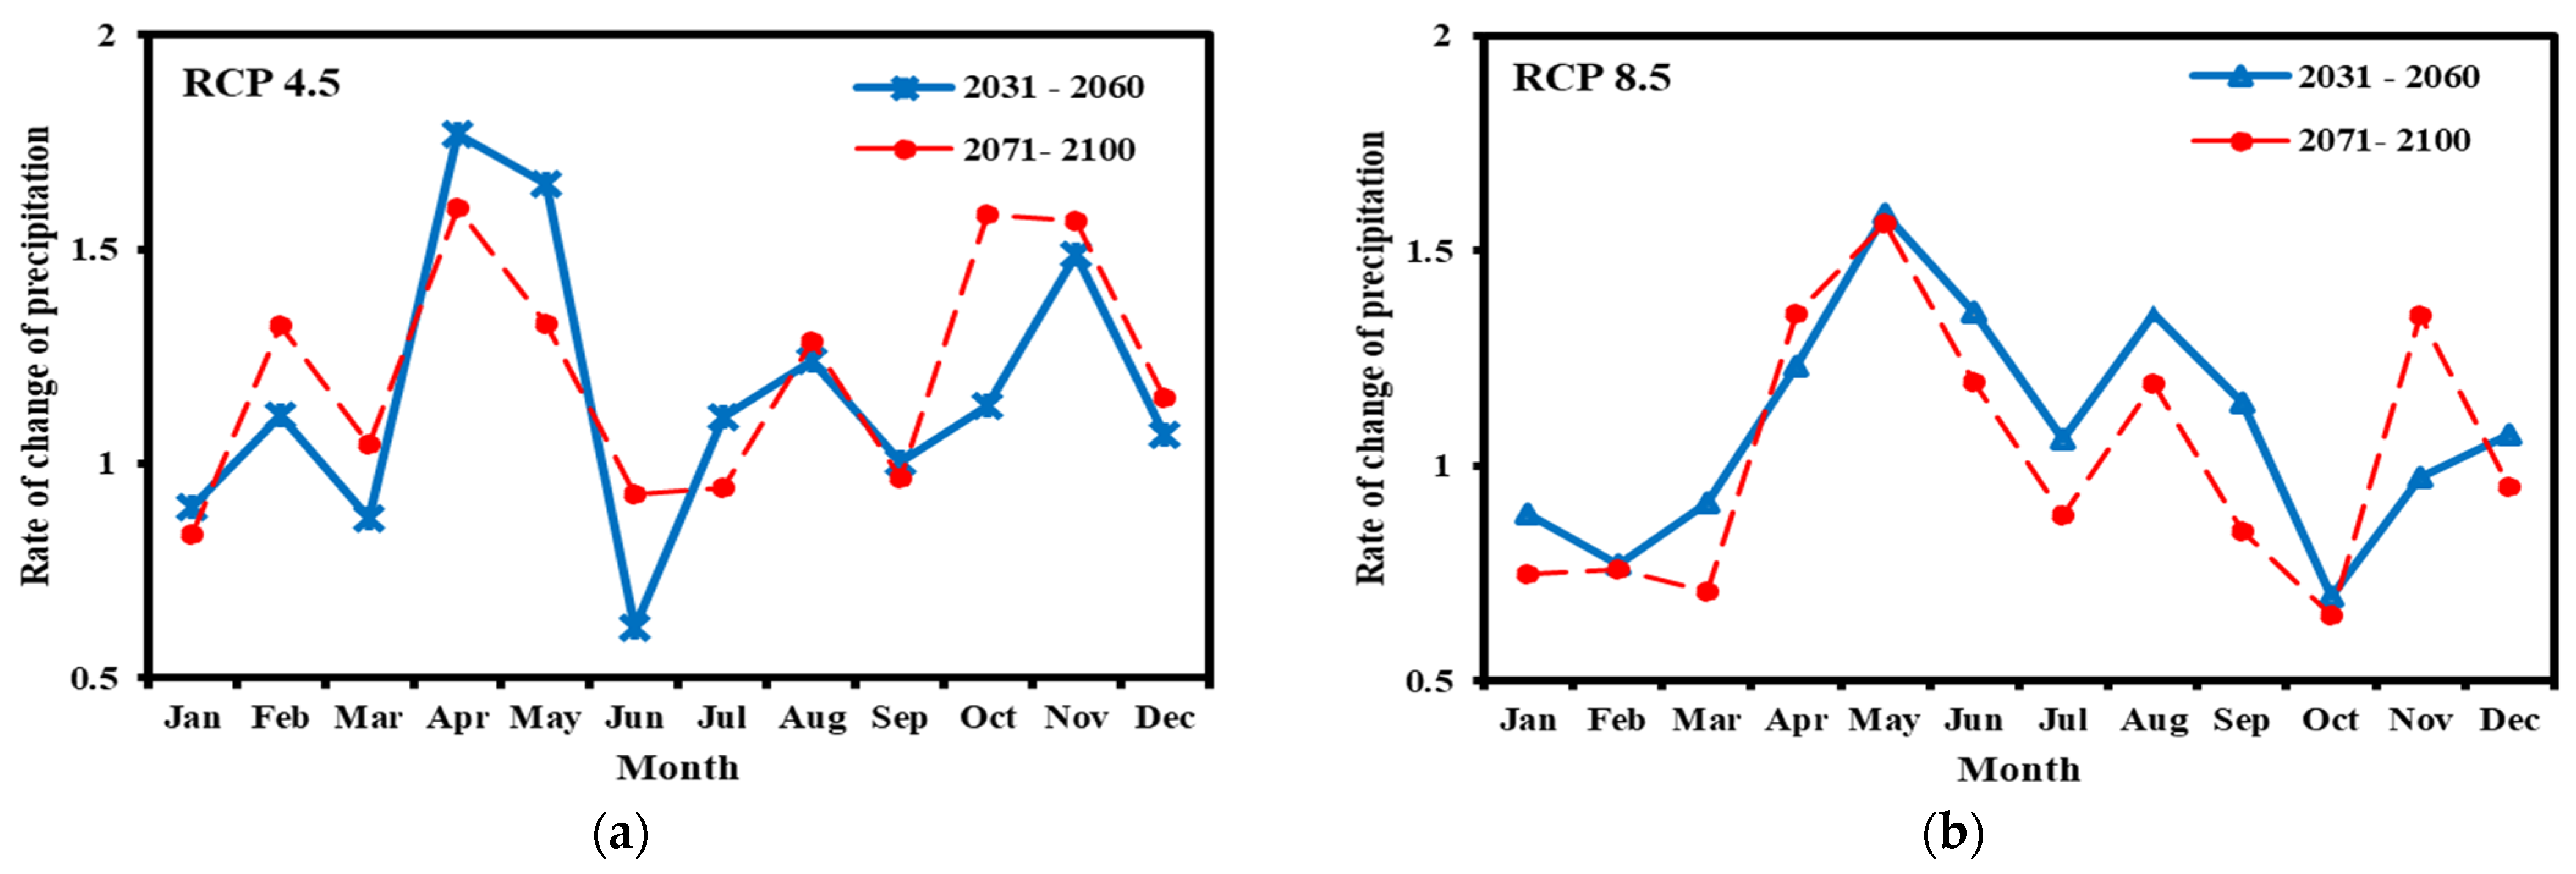
We investigated the impacts of future climate change on the streamflow using MME for the RCP 4.5 and 8.5 scenarios. Our results indicated that significant increases in the precipitation and temperature were expected during P1 and P2 compared to those in P0. The variation in the climatic factors could cause variation in the streamflow during the future periods. Variations of 4.6% to 10% and 10.35% to 10.53% in precipitation and −6.23% to −6.34% and 11.79 to 16.79% in evapotranspiration were projected in the RCP 4.5 and RCP 8.5 scenarios, respectively. These variations in climate factors could cause an alteration in the streamflow ranging from 22.14% to 27.32% in the future. Our results for future climate warming effects cannot be compared with those from other studies because there have been no such studies conducted on the HRB. However, compared to our baseline results, the results for the future period suggest that climate warming effects will remain below 50%. These results indicate that anthropogenic activities might increase significantly in the future.

6. Conclusions

In this study, the quantitative effects of climate variability, anthropogenic activities, and future climate change on streamflow conditions in three large river basins: the BHR, NHR, and LHR, were assessed and decomposed using the climate elasticity approach and decomposition framework. The core findings of the current study are as follows:
(1)
Three rivers, the BHR, NHR, and LHR, showed a significant variation in climate factors, which altered the streamflow. Significant increases in the streamflow in the BHR, NHR, and LHR of 176.85, 126.88, and 104.75 mm/year, respectively, were observed during the post-baseline period;
(2)
The relative contributions to the total streamflow variations indicated dominance of the climate warming factor in the BHR and NHR with 76.52% to 80.51%, respectively. However, anthropogenic activities remained the leading factor of alteration in the LHR at 56.42%;
(3)
The alteration in the streamflow was associated with changes in the climate factor. Precipitation and temperature were expected to increase in the future under both the RCP 4.5 and 8.5 scenarios. This increase altered the streamflow in the basin up to 22.14% to 27.32% compared to that of the baseline period, especially for the future period (2071–2100).
The findings of this study showed that the relative contributions of factors affecting streamflow in all three rivers, the BHR, NHR, and LHR, were influenced by both climate variability and anthropogenic activities. Climate change could be a key component for future changes in the streamflow. We recommend careful insight, especially on rapidly increasing anthropogenic activities and future warming in the climate, to mitigate expected hazards in the basin. These findings will be beneficial for achieving an integrated water resource management and will aid in planning water management strategies to reduce the risk of hydrological disasters. This study is limited to local regions. However the framework of the analysis could be adapted to other regions of the world with similar climate conditions. We also recommend future research to investigate the individual impacts of each climate and anthropogenic activity on streamflow conditions.

Author Contributions

Conceptualization, T.-W.K. and S.A.S.; methodology, S.A.S.; validation, M.J. and J.Y.; formal analysis, S.A.S.; investigation, J.Y. and S.H.; resources, M.J.; data curation, S.A.S.; writing—original draft preparation, S.A.S.; writing—review and editing, T.-W.K.; visualization, J.Y. and S.H.; supervision, T.-W.K.; project administration, J.Y. All authors have read and agreed to the published version of the manuscript.

Funding

This work was supported by the National Research Foundation of Korea (NRF) grant funded by the Korea government (MSIT) (NRF-2020R1C1C1014636).

Institutional Review Board Statement

Not applicable.

Informed Consent Statement

Informed consent was obtained from all the subjects involved in the study.

Data Availability Statement

All the data used in the study are available online at http://www.data.kma.go.kr (accessed on 15 July 2021) and http://www.wamis.go.kr/Main.aspx (accessed on 23 August 2021).

Acknowledgments

Sabab Ali Shah is grateful to the Higher Education Commission (HEC) of Pakistan for a scholarship under the project titled “HRD Initiative MS-Leading to Ph.D. program for faculty development for UESTPS, Phase-1, Batch V”.

Conflicts of Interest

The authors declare no conflict of interest.

References

  1. Huntington, T.G. Evidence for intensification of the global water cycle: Review and synthesis. J. Hydrol. 2006, 319, 83–95. [Google Scholar] [CrossRef]
  2. Solomon, S.; Qin, D.; Manning, M.; Averyt, K.; Marquis, M. Climate Change 2007-the Physical Science Basis: Working Group I Contribution to the Fourth Assessment Report of the IPCC; Cambridge University Press: Cambridge, UK, 2007. [Google Scholar]
  3. Wang, D.; Hejazi, M. Quantifying the relative contribution of the climate and direct human impacts on mean annual streamflow in the contiguous United States. Water Resour. Res. 2011, 47, W00J12. [Google Scholar] [CrossRef] [Green Version]
  4. Zhang, J.; Wang, F. Changes in the risk of extreme climate events over East Asia at different global warming levels. Water 2019, 11, 2535. [Google Scholar] [CrossRef] [Green Version]
  5. Yin, J.; Guo, S.; Gu, L.; Zeng, Z.; Liu, D.; Chen, J.; Shen, Y.; Xu, C.-Y. Blending multi-satellite, atmospheric reanalysis and gauge precipitation products to facilitate hydrological modelling. J. Hydrol. 2021, 593, 125878. [Google Scholar] [CrossRef]
  6. Ahn, K.-H.; Merwade, V. Quantifying the relative impact of climate and human activities on streamflow. J. Hydrol. 2014, 515, 257–266. [Google Scholar] [CrossRef]
  7. Wu, J.; Miao, C.; Wang, Y.; Duan, Q.; Zhang, X. Contribution analysis of the long-term changes in seasonal runoff on the Loess Plateau, China, using eight Budyko-based methods. J. Hydrol. 2017, 545, 263–275. [Google Scholar] [CrossRef]
  8. Zhang, Q.; Liu, J.; Singh, V.P.; Gu, X.; Chen, X. Evaluation of impacts of climate change and human activities on streamflow in the Poyang Lake basin, China. Hydrol. Process. 2016, 30, 2562–2576. [Google Scholar] [CrossRef]
  9. Field, C.B.; Barros, V.; Stocker, T.; Qin, D.; Dokken, D.; Ebi, K.; Mastrandrea, M.; Mach, K.; Plattner, G.; Allen, S. IPCC, 2012: Managing the Risks of Extreme Events and Disasters to Advance Climate Change Adaptation. A Special Report of Working Groups I and II of the Intergovernmental Panel on Climate Change; Cambridge University Press: Cambridge, UK, 2012; Volume 30, pp. 7575–7613. [Google Scholar]
  10. Heidari, H.; Arabi, M.; Warziniack, T.; Kao, S.C. Assessing shifts in regional hydroclimatic conditions of U.S. River basins in response to climate change over the 21st century. Earth’s Future 2020, 8, e2020EF001657. [Google Scholar] [CrossRef]
  11. Zhao, G.; Mu, X.; Strehmel, A.; Tian, P. Temporal variation of streamflow, sediment load and their relationship in the Yellow River basin, China. PLoS ONE 2014, 9, e91048. [Google Scholar] [CrossRef] [Green Version]
  12. Wada, Y.; Bierkens, M.F.P.; de Roo, A.; Dirmeyer, P.A.; Famiglietti, J.S.; Hanasaki, N.; Konar, M.; Liu, J.; Müller Schmied, H.; Oki, T.; et al. Human-water interface in hydrological modelling: Current status and future directions. Hydrol. Earth Sys. Sci. 2017, 21, 4169–4193. [Google Scholar] [CrossRef] [Green Version]
  13. Kazemi, H.; Hashemi, H.; Maghsood, F.F.; Hosseini, S.H.; Sarukkalige, R.; Jamali, S.; Berndtsson, R. Climate vs. human impact: Quantitative and qualitative assessment of streamflow variation. Water 2021, 13, 2404. [Google Scholar] [CrossRef]
  14. Yin, J.; Guo, S.; Gentine, P.; Sullivan, S.C.; Gu, L.; He, S.; Chen, J.; Liu, P. Does the hook structure constrain future flood intensification under anthropogenic climate warming? Water Resour. Res. 2021, 57, e2020WR028491. [Google Scholar] [CrossRef]
  15. Xin, Z.; Li, Y.; Zhang, L.; Ding, W.; Ye, L.; Wu, J.; Zhang, C. Quantifying the relative contribution of climate and human impacts on seasonal streamflow. J. Hydrol. 2019, 574, 936–945. [Google Scholar] [CrossRef]
  16. Li, H.; Shi, C.; Zhang, Y.; Ning, T.; Sun, P.; Liu, X.; Ma, X.; Liu, W.; Collins, A.L. Using the Budyko hypothesis for detecting and attributing changes in runoff to climate and vegetation change in the soft sandstone area of the middle Yellow River basin, China. Sci. Total Environ. 2020, 703, 135588. [Google Scholar] [CrossRef] [PubMed]
  17. Ji, G.; Wu, L.; Wang, L.; Yan, D.; Lai, Z. Attribution analysis of seasonal runoff in the source region of the Yellow River using seasonal Budyko hypothesis. Land 2021, 10, 542. [Google Scholar] [CrossRef]
  18. Jiang, C.; Xiong, L.; Wang, D.; Liu, P.; Guo, S.; Xu, C.-Y. Separating the impacts of climate change and human activities on runoff using the Budyko-type equations with time-varying parameters. J. Hydrol. 2015, 522, 326–338. [Google Scholar] [CrossRef]
  19. Jehanzaib, M.; Shah, S.A.; Yoo, J.; Kim, T.-W. Investigating the impacts of climate change and human activities on hydrological drought using non-stationary approaches. J. Hydrol. 2020, 588, 125052. [Google Scholar] [CrossRef]
  20. Jehanzaib, M.; Shah, S.A.; Kwon, H.-H.; Kim, T.-W. Investigating the influence of natural events and anthropogenic activities on hydrological drought in South Korea. Terr. Atmos. Ocean. Sci. 2020, 31, 85–96. [Google Scholar] [CrossRef] [Green Version]
  21. Shah, S.A.; Jehanzaib, M.; Lee, J.-H.; Kim, T.-W. Exploring the factors affecting streamflow conditions in the Han River basin from a regional perspective. KSCE J. Civil Eng. 2021, 25, 4931–4941. [Google Scholar] [CrossRef]
  22. Ning, T.; Li, Z.; Liu, W. Vegetation dynamics and climate seasonality jointly control the interannual catchment water balance in the Loess Plateau under the Budyko framework. Hydrol. Earth Sys. Sci. 2017, 21, 1515–1526. [Google Scholar] [CrossRef] [Green Version]
  23. Li, Z.; Li, Q.; Wang, J.; Feng, Y.; Shao, Q. Impacts of projected climate change on runoff in upper reach of Heihe River basin using climate elasticity method and GCMs. Sci. Total Environ. 2020, 716, 137072. [Google Scholar] [CrossRef] [PubMed]
  24. Dey, P.; Mishra, A. Separating the impacts of climate change and human activities on streamflow: A review of methodologies and critical assumptions. J. Hydrol. 2017, 548, 278–290. [Google Scholar] [CrossRef]
  25. Tan, X.; Gan, T.Y. Contribution of human and climate change impacts to changes in streamflow of Canada. Sci. Rep. 2015, 5, 1–10. [Google Scholar] [CrossRef] [PubMed]
  26. Shahid, M.; Cong, Z.; Zhang, D. Understanding the impacts of climate change and human activities on streamflow: A case study of the Soan River basin, Pakistan. Theor. Appl. Climatol. 2018, 134, 205–219. [Google Scholar] [CrossRef]
  27. Villarini, G.; Wasko, C. Humans, climate and streamflow. Nat. Clim. Change 2021, 11, 725–726. [Google Scholar] [CrossRef]
  28. Kim, C.-G.; Lee, J.; Lee, J.E.; Kim, N.W.; Kim, H. Monthly precipitation forecasting in the Han River Basin, South Korea, using large-scale teleconnections and multiple regression models. Water 2020, 12, 1590. [Google Scholar] [CrossRef]
  29. Hargreaves, G.H.; Samani, Z.A. Estimating potential evapotranspiration. J. Irrig. Drain. Div. 1982, 108, 225–230. [Google Scholar] [CrossRef]
  30. Wu, H.; Qian, H. Innovative trend analysis of annual and seasonal rainfall and extreme values in Shaanxi, China, since the 1950s. Int. J. Climatol. 2017, 37, 2582–2592. [Google Scholar] [CrossRef]
  31. Serinaldi, F.; Chebana, F.; Kilsby, C.G. Dissecting innovative trend analysis. Stoch. Environ. Res. Risk Assess. 2020, 34, 733–754. [Google Scholar] [CrossRef]
  32. Shah, S.A.; Jehanzaib, M.; Kim, M.J.; Kwak, D.-Y.; Kim, T.-W. Spatial and temporal variation of annual and categorized precipitation in the Han River Basin, South Korea. KSCE J. Civil Eng. 2022. [Google Scholar] [CrossRef]
  33. Şen, Z. Innovative trend analysis methodology. J. Hydrol. Eng. 2012, 17, 1042–1046. [Google Scholar] [CrossRef]
  34. Li, S.; Xiong, L.; Li, H.-Y.; Leung, L.R.; Demissie, Y. Attributing runoff changes to climate variability and human activities: Uncertainty analysis using four monthly water balance models. Stoch. Environ. Res. Risk Assess. 2015, 30, 251–269. [Google Scholar] [CrossRef]
  35. Wu, J.; Miao, C.; Zhang, X.; Yang, T.; Duan, Q. Detecting the quantitative hydrological response to changes in climate and human activities. Sci. Total Environ. 2017, 586, 328–337. [Google Scholar] [CrossRef] [PubMed]
  36. Budyko, M.I. Climate and Life; Academic Press: Cambridge, MA, USA, 1974. [Google Scholar]
  37. Zhang, L.; Dawes, W.R.; Walker, G.R. Response of mean annual evapotranspiration to vegetation changes at catchment scale. Water Resour. Res. 2001, 37, 701–708. [Google Scholar] [CrossRef]
Figure 1. Location of the study area and hydro-meteorological stations.
Water 14 00512 g001
Figure 2. Adopted comprehensive framework of the analysis.
Water 14 00512 g002
Figure 3. Breakpoints in the time-series of streamflow and precipitation: (a) Buk Han River, (b) Nam Han River, (c) Lower Han River.
Water 14 00512 g003aWater 14 00512 g003b
Figure 4. Variation of trends in precipitation (P) and streamflow (Q) during the baseline period and the post-baseline period.
Water 14 00512 g004
Figure 5. Relative contributions of climate variability and anthropogenic activities to streamflow alteration in the Buk Han River, Nam Han River, and Lower Han River.
Water 14 00512 g005
Figure 6. Rate of change in monthly precipitation under the: (a) RCP 4.5; (b) RCP 8.5 scenarios, corresponding to the projected future precipitation from 2031 to 2060 and 2071 to 2100 as compared to the baseline period.
Water 14 00512 g006
Figure 7. Projected climate variables under the RCP 4.5 and RCP 8.5 scenarios: (a) precipitation for 2001–2100; (b) temperatures for 2001–2100.
Water 14 00512 g007
Table 1. Proportion of land use land cover during the baseline period and post-baseline period.
Characteristics of WatershedBuk Han RiverNam Han RiverLower Han River
Baseline 1966–1997Post-Baseline 1998–2014Baseline 1965–1997Post-Baseline 1998–2014Baseline 1965–1995Post-Baseline 1996–2014
Urbanized/Dry land0.513.610.952.7721.6035.4
Cultivable land19.2520.809.927.8023.1412.8
Forest75.7769.9185.7884.7044.8237.41
Grass land2.051.750.751.322.634.41
Marsh0.100.550.010.380.441.16
Impervious1.511.450.010.814.375.18
Water bodies0.901.930.122.223.114.17
Note: All the values in the table are in percentage (%).
Table 2. Details of the GCMs used in this study.
GCMSSourceResolution
HadGEM2-ESMet office Hadley Center2.5° × 2.023°
IPSL-CM5-LRInstitute Pierre-Simon Laplace1.875° × 1.250°
MIROC-ESM-EHEMJANSTEC, NIES, and AORI3.750° × 1.895°
NorESM-MNorwegian Climate Center2.5° × 1.895°
Table 3. Relative contributions of climate variability and anthropogenic activities to streamflow alteration.
VariableNam Han RiverBuk Han RiverLower Han River
BaselinePost-BaselineBaselinePost-BaselineBaselinePost-Baseline
P1260.31403.91283.71433.321286.831350.78
PET960.8902.2960.8902.21960.8939.7
Q654.3781.2844.211021.06632.99737.77
εP1.96-1.95-1.86-
εPET−0.96-−0.95-−0.86-
ΔP-143.61-149.62-63.95
ΔPET-56.26-58.61-21.1
ΔQ-126.88-176.85-104.78
ΔQC-80.51-76.52-43.57
ΔQA-19.5-23.48-56.42
Note: P, PET, and Q are the precipitation, potential evaporation, and streamflow, respectively. ε is the coefficient of elasticity, and Δ represents the change in a variable compared to the baseline period.
Table 4. Variation in the precipitation in the HRB under the RCP 4.5 and 8.5 scenarios compared to that during the baseline period.
ScenarioPeriodAnnualSpringSummerFallWinter
RCP 4.52031–206010.8%14.30%10.20%11.00%10.30%
2071–210011.1%13.310.40%11.40%11.00%
RCP 8.52031–206011.40%12.70%12%9.80%9.30%
2071–210013%12.10%10.20%10.20%8.40%
Table 5. Variation in the projected annual temperatures (mean, minimum, and maximum) under the RCP 4.5 and 8.5 scenarios for future periods compared to those of the baseline period.
ScenarioPeriodMean TemperatureMin. TemperatureMax. Temperature
ValueΔT (°C)ValueΔT (°C)ValueΔT (°C)
Baseline1966–200012.5-8.6-17.1-
RCP 4.52031–206014.41.910.11.519.22.1
2071–210015.32.711.02.420.12.9
RCP 8.52031–206014.62.110.31.719.42.3
2071–210017.14.512.84.122.04.9
Note: ΔT (°C) indicates the change in temperature compared to the baseline period.
Table 6. Relative variation in streamflow for the projected future periods using the climate elasticity model under the RCP 4.5 and 8.5 scenarios, compared to that during the baseline period.
ScenarioPeriodεPεPET Δ P P Δ P E T P E T Ɛ P Δ P P Ɛ P E T Δ P E T P E T ΔQ
RCP 4.52031–20601.54−0.542.9811.484.606.2310.83
2071–21001.69−0.696.1317.1010.3511.722.14
RCP 8.52031–20601.55−0.557.1611.4811.18−6.344.86
2071–21001.57−0.576.6917.0910.5316.7927.32
Note: Unit for the ΔP/P, ΔPET/PET (%).
Publisher’s Note: MDPI stays neutral with regard to jurisdictional claims in published maps and institutional affiliations.

