
Location Matters: A Framework to Investigate the Spatial Characteristics of Distributed Flood Attenuation


Department of Geographical and Sustainability Sciences, University of Iowa, Iowa City, IA 52242, USA
*
Author to whom correspondence should be addressed.
Water 2021, 13(19), 2706; https://doi.org/10.3390/w13192706
Submission received: 31 July 2021
/
Revised: 23 September 2021
/
Accepted: 24 September 2021
/
Published: 29 September 2021
(This article belongs to the Section Hydrology)
Abstract
:Distributed attenuation in flood management relies on small and low-impact runoff attenuating features variously distributed within a catchment. Distributed systems of reservoirs, natural flood management, and green infrastructure are practical examples of distributed attenuation. The effectiveness of attenuating features lies in their ability to work in concert, by reducing and slowing runoff in strategic parts of the catchment, and desynchronizing flows. The spatial distribution of attenuating features plays an essential role in the process. This article proposes a framework to place features in a hydrologic network, group them into spatially distributed systems, and analyze their flood attenuation effects. The framework is applied to study distributed systems of reservoirs in a rural watershed in Iowa, USA. The results show that distributed attenuation can be an effective alternative to a single centralized flood mitigation approach. The different flow peak attenuation of considered distributed systems suggest that the spatial distribution of features significantly influences flood magnitude at the catchment scale. The proposed framework can be applied to examine the effectiveness of distributed attenuation, and its viability as a widespread flood attenuation strategy in different landscapes and at multiple scales.
1. Introduction
Large reservoirs and levees have long been the traditional engineering response for river flood protection. In the United States, the US Army Corps of Engineers estimates that the 715 dams and 4100 miles of levees under their management prevented $348 billion in flood losses in 2019, and an annual average of $138 billion in the decade 2010–2019 [1]. However, levees do not attenuate floods and transfer the hazard up and downstream [2,3]. Meanwhile, large reservoirs decrease flow peak magnitude and frequency, but also act as barriers to sediment flux and aquatic fauna mobility. With trapped sediments and less high flows, streambed geomorphology stabilizes over time [4,5,6]. A fluvial landscape that is more simplified and disconnected from a floodplain hosts less suitable habitats for aquatic species [6,7,8]. Moreover, large reservoirs require high maintenance costs [9,10], while large space and costs decrease viability of new constructions. Dams are being removed at an increasing rate for similar reasons [11]. Finally, adapting a centralized work, such as a levee or a large reservoir, to changing conditions or to prevent failures [12,13] and unintended behaviors [14] is an onerous process [15,16,17].
As rising losses from river floods are expected to continue [18], there is a pressing need for alternative, cost-effective, and environmentally sustainable strategies for flood attenuation. Flood control reservoirs attenuate floods by storing large water volumes from inflow, and slowly releasing the outflow downstream [19]. How much attenuation would occur if smaller amounts of storage were distributed in multiple places? This question has not been fully addressed in the hydrologic field, but is relevant when pursuing low-impact and adaptable flood attenuation approaches.
Runoff attenuating features reduce runoff locally by intercepting, infiltrating, storing, and slowing precipitation water. Distributed attenuation consists of multiple runoff attenuating features distributed in space that contain flooding at the catchment scale. There are currently at least three strategies for implementing distributed attenuation: distributed systems of reservoirs (DSRs), natural flood management (NFM), and green infrastructure (GI). DSRs consist of small reservoirs or ponds installed on multiple reaches of a stream network. They are specifically designed for flood control [20], although some might also serve for water supply or filtering [21]. NFM is the use of natural practices and features to reduce runoff and peak flow, and delay catchment response [22]. For example, trees and low-level vegetation increase interception and infiltration capacities in the landscape; terrain reshaping, roughening stream banks, and floodplains extend flow pathways; wetlands, ponds, and large woody debris temporary store water and increase flow times; and controlled diversions disconnect flow as more water enters the stream [23]. GI refers to a broad set of practices leveraging vegetation and soil to increase rainwater interception, infiltration, and retention [24], especially in urban environment. GI include permeable pavements, bioswales, green roofs, bioretention systems [25], retrofitting patches, and fringe areas, increasing vegetation density and quality [26]. DSRs, NFM, and GI are all realized through runoff attenuating features that are distributed in multiple locations. Their effectiveness is partially unclear though, given their novelty, recent application, and, thus, limited lifetime for evaluating long-term effects.
The effectiveness of a system of runoff attenuating features depends on the functioning of its elements, both individually and in concert. Features alter flow speed and volume, and attenuate the hydrograph locally, but they also change the interactions among volumes of waters draining from different areas of a catchment. As features delay the flow, peak timing becomes a crucial aspect. When inflow peaks are synchronized at a confluence, they combine and generate a heightened outflow peak. On the contrary, peak desynchronization results in flood attenuation [27]. Hence, distributed features can potentially diminish or exacerbate a flood event, depending on where in the catchment they are placed.
The spatial dimension of distributed attenuation comprises all the spatial and topological characteristics of a system of attenuating features in a catchment, including their position in the hydrologic network and their position relative to each other. By contrast, the engineering dimension includes the type, geometry, and attributes of the single runoff attenuating feature. Both dimensions are important factors in lessening floods, but past research on distributed attenuation has focused mainly on the engineering characteristics.
This paper provides a framework for analyzing the spatial dimension of distributed attenuation. To thoroughly explore it, a variety of spatial distributions of attenuating features is necessary. The spatial distributions are obtained by first modeling attenuating features at many potential locations within the study catchment. Features are then combined into different subsets that explicitly realize the spatial distributions. Finally, a hydrological model incorporates the distributions and simulates the catchment response to a precipitation event.
The following sections highlight key ideas used to conceptualize the framework, with reference to existing studies in literature. Then, we will illustrate the framework and present a simple application for a DSR in a northeast Iowa watershed. We will finally discuss the application results and make the case for the effectiveness of distributed attenuation and the importance of siting in the design of a system of runoff attenuating features.
2. The Case for Distributed Flood Attenuation
Runoff attenuating features reduce surface runoff, and eventually flood magnitude, by holding rainwater in place and lengthening the water flow path. Holding water in place means intercepting precipitation water and storing it in place for a certain time before it runs off [28]. Lengthening the flow pathway entails increasing the flowing distance to the nearest water body. While these mechanisms are well-established in hydrologic theory, the effectiveness of multiple runoff attenuating features at the catchment scale is poorly understood, due to limited implementation and empirical evidence. DSRs, NFM, and GI, are the main ways by which distributed attenuation is realized in practice. Relevant studies discussing their feasibility, performance, and possible knowledge gaps are presented in the following.
2.1. Distributed Systems of Reservoirs (DSR)
Few studies have examined DSRs built for flood mitigation at the catchment scale, and their attenuating effects are mixed. Studies on a system of 132 small ponds in the rural Soap Creek watershed in Iowa, estimated a 30% peak reduction for a 24 h rainfall with a return period of 100 years, compared to a scenario without ponds [20,29,30]. In the South Tobacco Creek watershed, in Manitoba, a system of 26 small retention basins built for flood control and irrigation water supply decreased peak flow at the outlet [31,32]. However, small reservoirs do not guarantee a mitigation effect in catchments with developed areas. Emerson et al. [33] found that in a suburban area of Philadelphia, Pennsylvania, increased runoff generated from new developments was not offset by small detention basins designed to limit peak rate to pre-development rate. One explanation is that basins were created with a site-by-site approach and do not function in concert. A coordinated functioning is essential to avoid peak flow synchronization and flood wave buildup.
Where should reservoirs be placed to work coordinately? In studies considering simple, virtually generated watersheds, Goff and Gentry [34] found that upstream locations are the most effective at controlling peak rates, whereas Ayalew et al. [35] determined that reservoirs on parallel channels reduce downstream flow peaks more than when in-series on the same channel. Other studies used real watersheds and identified a limited number of candidate reservoir locations (<15), which were constrained by topography, land-use, or other project-specific criteria [36,37,38,39]. Their flood mitigation results varied depending on the watershed geometry and reservoir distributions considered. The question on how reservoir locations influence flood attenuation does not yet have a generalizable answer.
2.2. Natural Flood Management (NFM)
NFM and nature-based solutions are particularly viable in watersheds periodically affected by flooding but where traditional engineering is uneconomical or unfeasible [40]. Installation of runoff attenuating features, such as offline diversion ponds, disconnection ponds, field bunds, and woody debris have occurred in the UK [41,42,43] and in other regions of Europe [44]. However, this approach is not widespread due to a lack of effectiveness evidence at the catchment scale [45,46]. While NFM features reduce and slow runoff locally [43,47,48], the extent to which their effects are observable is unclear.
A variety of interventions in multiple locations might be necessary to observe attenuation at the catchment scale. Metcalfe et al. [49] modeled a distribution of regularly spaced, in-channel woody barriers, placed on main stem and tributaries, and found a peak flow reduction of 10% (which would be insufficient to mitigate expected flood events). Nicholson, O’Donnell, Wilkinson, and Quinn [23] estimated storage by offline ponds of 2000–4000 m3/km2 for effective flood attenuation in a small rural catchment, assuming attenuation only occurs by storage. Flow desynchronization also contributes to attenuation [50]. Dixon et al. [51] modeled riparian forest restoration in a catchment and found a substantial flood peak reduction, mainly due to peak desynchronization when afforestation occurred in the upper and middle parts of the catchment. Notably absent from these studies is the assessment of alternative siting. Overall, existing literature suggests that the spatial dimension of NFM interventions is an influencing factor worth investigating in the future.
2.3. Green Infrastructure (GI)
GIs in the urban environment can attenuate floods, both at the parcel and sub-catchment scale, as demonstrated by numerous studies [52,53]. Properties and neighborhoods where GI features are installed generate less runoff [54], and their hydrographs show a smaller peak flow [55] and sometimes a longer lag time response [56,57]. However, such benefits greatly reduce during severe events [56,58]. Fewer studies have evaluated GI benefits at the catchment scale. Existing findings indicate that watersheds with GI in place show a reduced runoff [59] and have a more stable and less flashy hydrology [60,61]. There is general consensus that the distribution of GI in a catchment influences the hydrology of the catchment itself, similar to DSRs and NFM. The distribution of features depends on morphological, physical, and landscape characteristics, especially the distribution of imperviousness [62] and land cover [63].
Modeling multiple spatial configurations can provide indications toward best practices for feature siting. For example, scattering GI features has been found to be more effective than clustering them [58]. This can be explained by flows from different parts of the catchment being reduced and delayed, and combining to a lesser flow downstream [57]. Stronger runoff reduction was found when GIs were placed on street sides, which are obvious flow paths [58,64]. Di Vittorio and Ahiablame [65] obtained a significant discharge reduction at the outlet with GI in the downstream part of the catchment, although alternative configurations were not included. Given the importance of decentralization in urban stormwater management [66,67], where to place GIs and what their effect is at the catchment scale are still two important questions in the field [68,69,70].
2.4. Distributed Attenuation Spatial Modeling
Distributed attenuation depends on the positions of its elements, yet there are no universally valid criteria for siting runoff attenuating features. Empirical studies over large areas require long times for installation and observation. Complex network interactions and confounding processes represent additional difficulties [71]. Conversely, spatially explicit models provide results within a model simulation timeframe and allow the experimentation of spatial alternatives [55,58,71,72]. The framework proposed in this article aims to support spatially explicit studies on distributed attenuation. It can help answer research questions such as, how does the spatial distribution of attenuating features influence flooding? How much flood attenuation can realistically be expected from a distributed strategy? For what range of flood events is distributed attenuation effective?
3. Framework
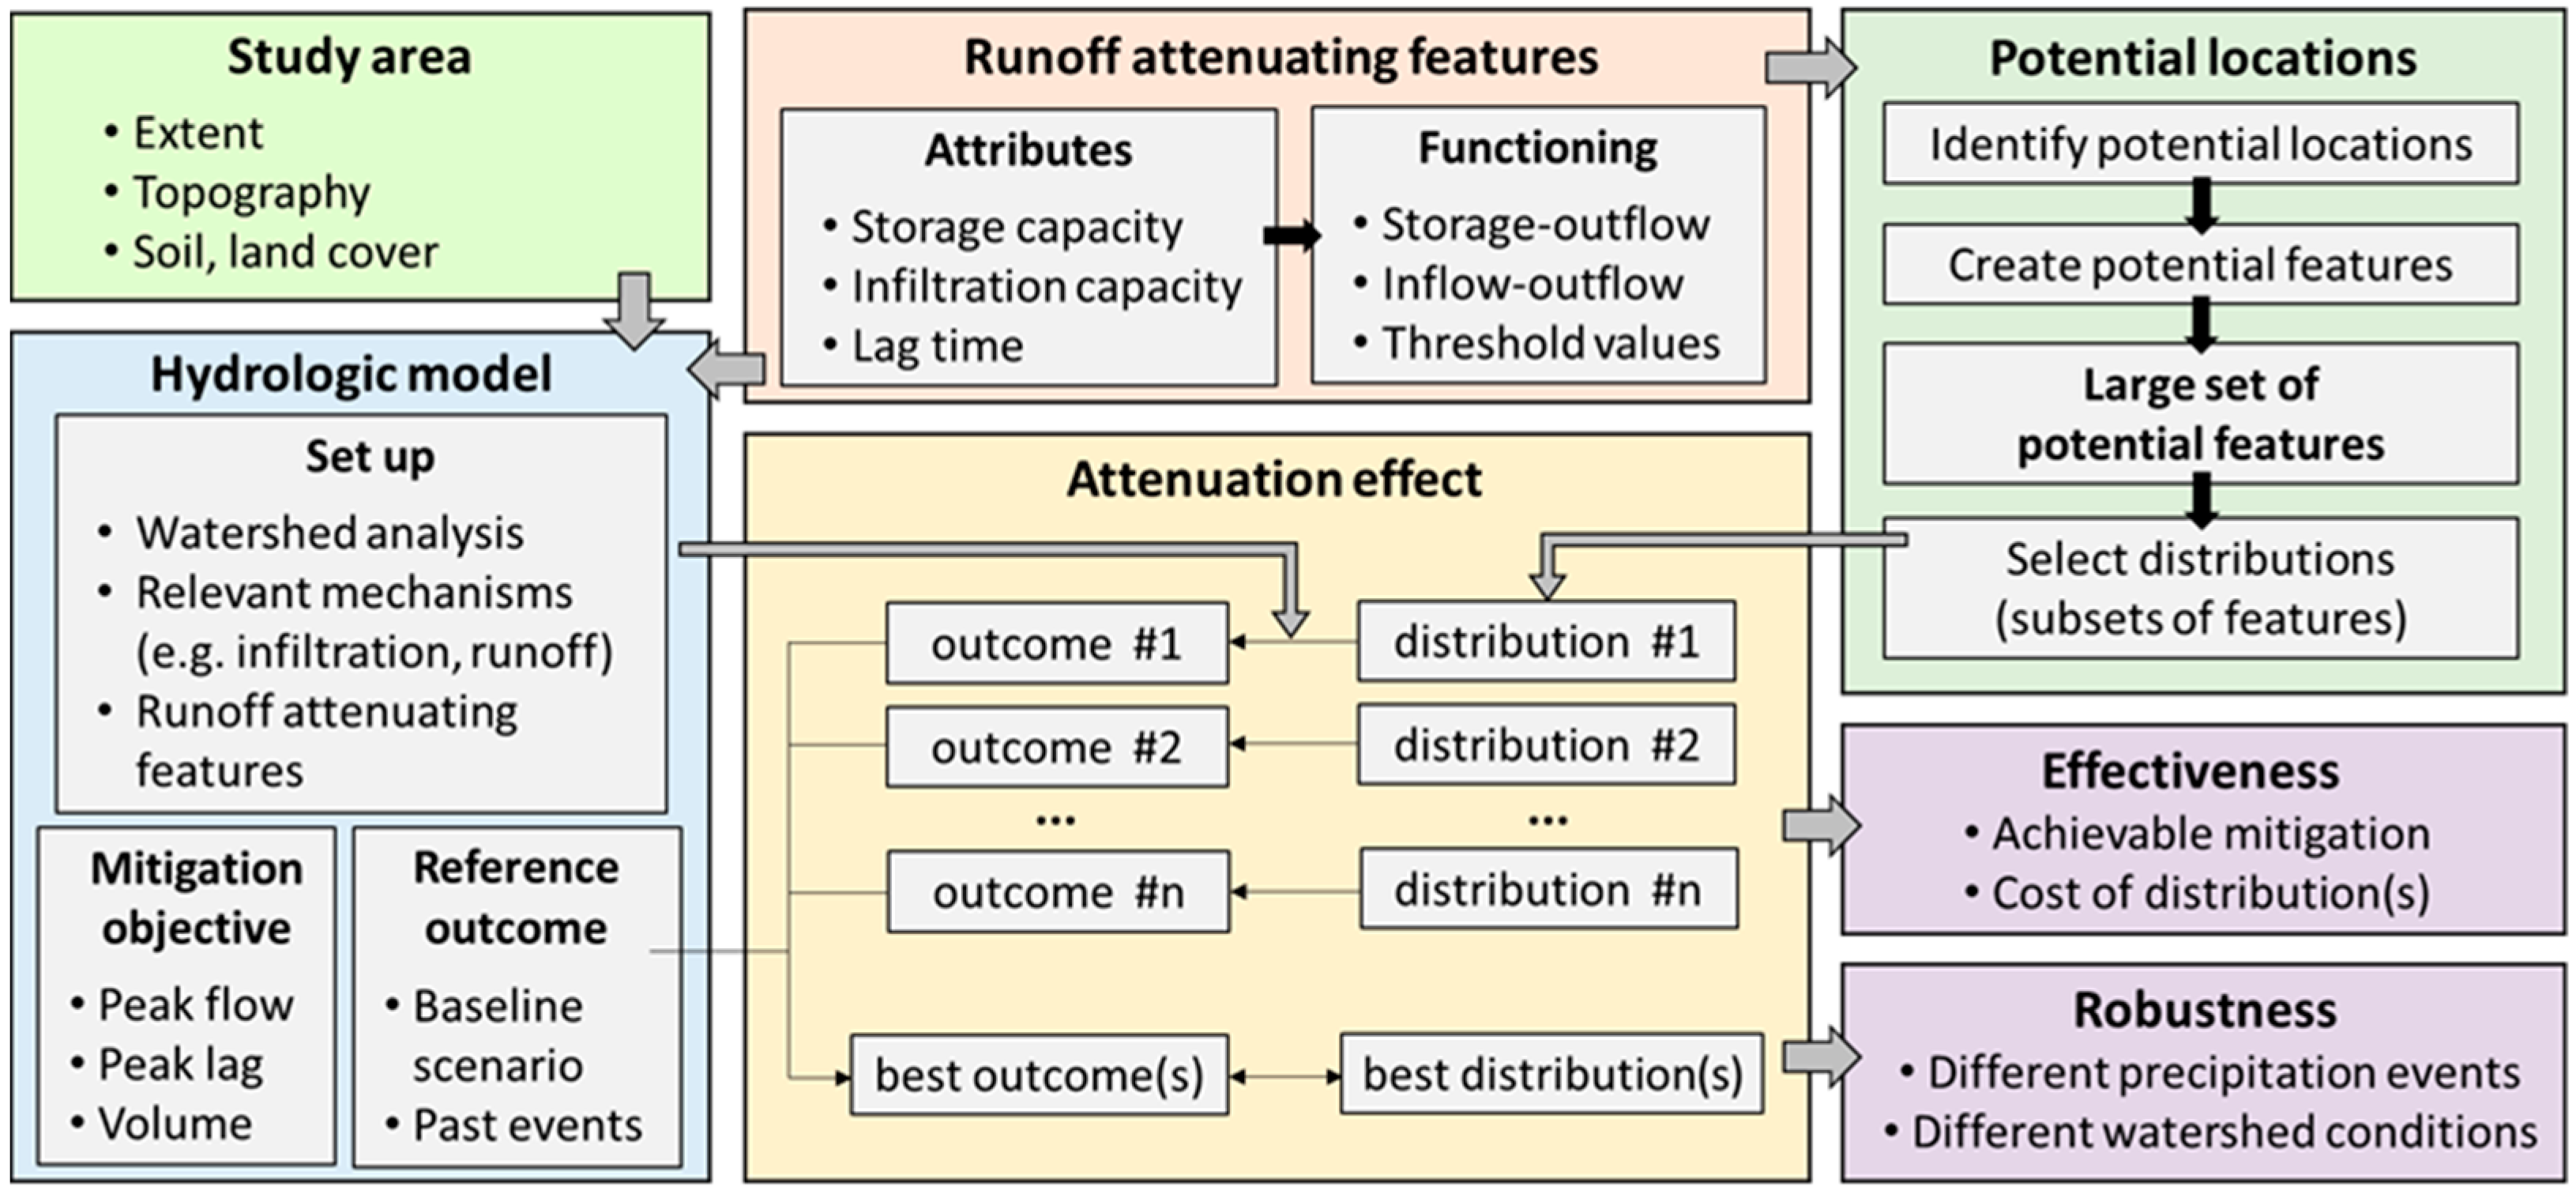
A framework for studying the influence of runoff attenuating feature locations is hereby proposed (Figure 1). The pivotal concept is identifying a high number of locations for installing attenuating features in the context of a given study area. This is instrumental in analyzing multiple and diverse spatial distributions of features. Features are characterized in each location and entered in a hydrologic model of choice. For a given rainfall event, the model estimates how spatial distributions of features affect the mitigation objectives. By comparing results, one can determine which spatial distributions show the most desirable behavior, and what spatial characteristics these distributions display. A further step is modeling different rainfall events and/or initial conditions, and evaluating the robustness of desirable spatial distributions. The next subsections describe each component of the framework.
3.1. Study Area Characterization
One goal of the framework is to evaluate numerous locations, hence the delineation of smaller streams and flow paths is especially important. This is typically completed with watershed analysis, where a Digital Elevation Model (DEM) raster of the catchment is used to delineate flow paths [73,74]. The choice of the DEM resolution considers the scale of analysis and the size and distancing of attenuating features. For example, if the DEM cell size is larger than the minimum expected distance between two nearby locations, the model might even out elevation and differences of feature functioning in those locations. Those differences would instead be observable using a higher resolution DEM. In general, high-resolution data, when available, allow for better local modeling of hydrologic processes.
3.2. Runoff Attenuating Features
Feature attributes that determine how the feature functions and how it is installed locally are part of the feature modeling. Attributes include geometry (volume, extent, depth) and physical quantities, such as interception capacity, infiltration capacity, and increased flow path. Attributes may consist of fixed values (e.g., Manning’s roughness, hydraulic conductivity) or can be a function of other parameters. For example, reservoir volume (DSR) is a function of water depth; the volume of water diverted to an offline area (NFM) is function of the water height in the main water course [75]; and the rainfall fraction intercepted by vegetation (NFM, GI) can be expressed with an exponential decay function of rainfall quantity [76,77].
The viability of runoff attenuating features attributes is constrained by the local context. For example, high DSR dams in a topographically flat area would require costly terrain reshaping. In a developed catchment, the existing built environment affects the type and size of plants that can be introduced to intercept the rainfall (GI). Such local constraints will differ by location. Depending on the study objective, modelers can loosen such constraints, but compatibility between potential features and their locations makes the study of flood attenuation more realistic and useful.
3.3. Potential Locations
Potential locations for mitigating features should be high in number, cover the whole study catchment, and be diverse. This allows for the full exploration of the spatial dimension and a broader understanding of where runoff attenuation is more effective. Altogether, features modeled on multiple locations form a set of potential attenuating features. The local context might influence the attributes and the functioning of a feature. In this light, location and other geometric and structural attributes are not independent, and feature location is an integral component of runoff attenuation.
The number of potential locations is more important than the feasibility of installing the runoff attenuating feature. For instance, it is not important to know which landowners agree on having a rain garden in the front yard (GI) or a pond in their property (DSR), since the purpose of the framework is to study the effect of spatial distributions, not to actually design a system of attenuation. However, a location can be deemed infeasible if it generates a paradox, such as the controlled inundation of an inhabited area (DSR, NFM), or for physical reasons, such as soil type not being suitable for permeable pavement (GI). Environmental, socio-economic, legal, and aesthetic aspects can be initially overlooked and considered at a later stage when designing the system, to filter the set of potential features.
Locations are diverse when the corresponding features produce distinguishable effects. Due to spatial autocorrelation, installing a feature a few meters upstream or downstream on the same flow tract would likely affect runoff in the same way. Furthermore, the marginal benefit of adding features in the same part of the catchment might eventually decrease. In general, a high feature density implies low diversity. To find a compromise between features’ high number and moderate to low density, some preliminary runs of the hydrologic model can help in resizing a larger than needed set of potential locations. An ideal spacing of locations depends on topography, flow path geometry, external constraints, and can change across the catchment.
3.4. Hydrologic Model
There are numerous tools for modeling rainfall runoff transformation and other hydrologic processes. We will refer to these tools as “hydrologic models,” although the model of choice can also contain a hydraulic component. All key processes leveraged by runoff attenuating features should be part of the hydrologic model. For example, reservoir functioning (DSR, NFM) necessitates that the model implements equations from hydraulics, whereas a simple infiltration capacity value is sufficient to define the functioning of permeable pavements or bioinfiltration cells (GI) at the feature scale. The spatial and temporal scales of the analysis are also a factor. For example, groundwater recharge and flow can be neglected when modeling short rainstorm events in a small urban catchment. In a large rural watershed, antecedent soil moisture conditions and groundwater flow play a more important role.
3.5. Attenuation Effect
At this point of the framework, a large set of potential runoff attenuating features is available. By subsetting it in multiple ways, one can create different spatial distributions of features. Distributions can be selected randomly; can be spatially scattered or clustered; can regard a few, many, or all flow paths; can target hydrologically relevant locations, such as confluences; can be limited to features of a certain size, etc. Similar to individual features, subsets of features should be sufficiently diverse to cover the range of possibilities, and show distinct effects on runoff and overland flow.
Features of each distribution are plugged into the hydrologic model. The hydrologic model simulates the same rainfall event for each feature distribution and results are compared. It is common practice to create a baseline scenario with no features in place, against which to compare the mitigating scenarios. Performance evaluation occurs by comparing hydrograph characteristics, such as peak flow, lag time to peak and runoff volume, or other quantities of interest (e.g., soil moisture, flood extent). When available, measured outcomes from past events are an excellent reference for evaluation.
3.6. Effectiveness and Robustness
A distribution of runoff attenuating features is effective if it achieves the mitigation objective (e.g., flow peak reduction) for a flood event. Multiple such distributions may exist. A limiting criterion, such as construction cost or landscape disturbance, is necessary to avoid a distribution with an unrealistically large number of features. There is a trade-off between attenuation costs and benefits, with the ideal distribution of features realizing the desirable attenuation at the minimum cost.
A distribution of features is robust if its attenuation is observable for different flood events. Distributed features respond with decreasing attenuation when runoff volume increases due to precipitation (intensity, duration, spatial pattern) or ground (soil moisture, snowmelt) conditions. However, a robust distribution can still effectively control a range of events. Spatial patterns of precipitation are predictable to a certain extent, and extreme events that overwhelm the distributed features put in place have a low probability of occurrence. Distribution robustness can be assessed by testing its response to different precipitation events and ground conditions.
In the application of the framework that follows, we considered a few eminent distributions. More distributions and hydrologic simulations would be needed to assess distributed attenuation in the study area. Effectiveness and robustness, methods and tools for their analysis, and their practical implications in distributed attenuation design will be the focus of future research.
4. Case Study
This section describes a practical application of the framework with the installation of a DSR in a rural catchment. The mitigating feature is a small inline reservoir. Reservoirs are modeled in all the reaches of the stream network, including the non-perennial source reaches, which are not commonly investigated in the literature. Some spatial distributions are considered, and their effect is simulated with a hydrologic model.
4.1. Study Area and Stream Network Characterization
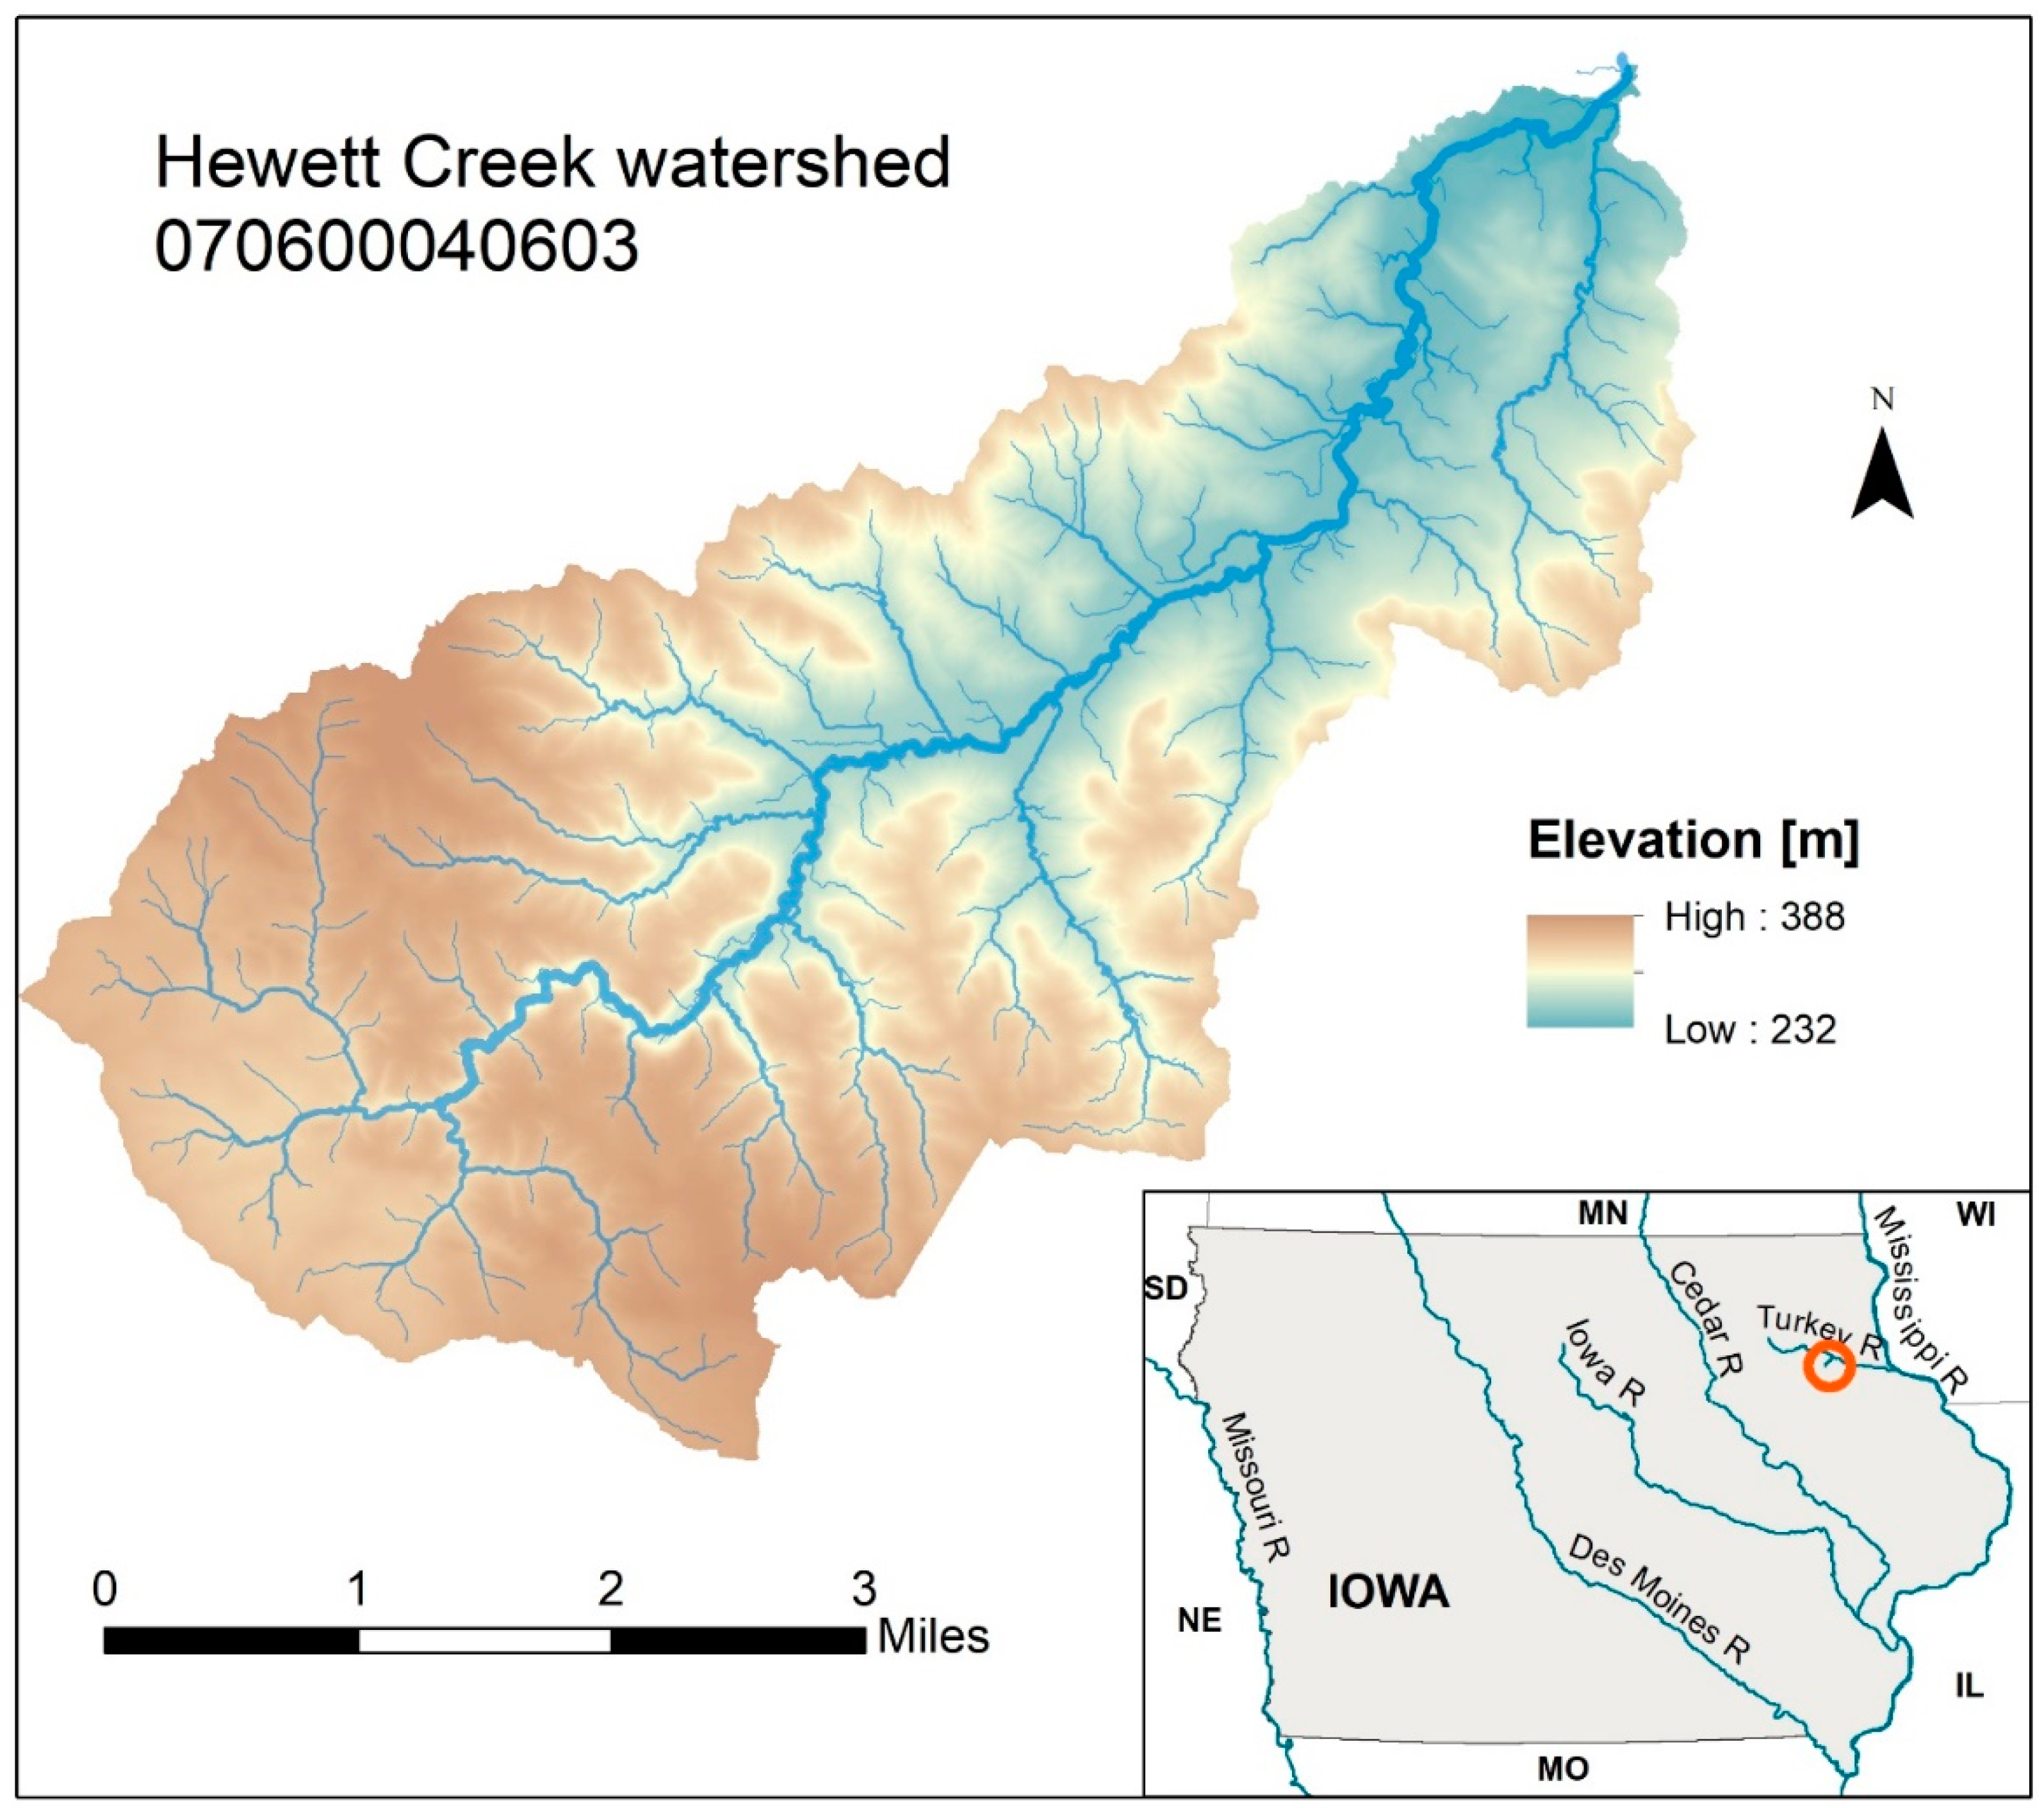
The study area is the Hewett Creek watershed, 12-digit Hydrological Unit Code (HUC) 070600040603, in northeast Iowa (Figure 2). Hewett Creek is a tributary of the Volga and Turkey River system. The watershed has a drainage area of 42.6 km2 (10,580 acres). The landscape is characterized by hills, with an elevation ranging from 385 m to 232 m, and an average slope of 10% calculated from a 1 m DEM. The watershed is rural and there are no inhabited centers. Approximately 36% of the area is cultivated, mainly in corn and soybean rotation. Grassland and pasture make up about 33% of the area, while forests cover 27%.
We hydrologically corrected the DEM by lowering elevation values of roads to establish the continuity of elevation values on both sides of a bridge. We then ran a watershed analysis on the hydrologically corrected DEM using the CUENCAS software [78] to extract the drainage network and drainage areas for each point in the watershed. The extracted network of reaches (Figure 2) was classified by Strahler order, which assigns an integer number to each reach of the network, in a hierarchical fashion. All source reaches have order 1. When two reaches of order i and j (i ≠ j) join, the outflowing reach has the higher of the two orders. When two reaches of the same order i join, the outflowing reach has order i + 1. In this classification, the main stem has the highest order. The Strahler order on Hewett Creek ranges from 1 to 6. After visual comparison with satellite images, reaches of order 1 were excluded from further analysis since a majority of them was either not perennial or too small to host an inline pond.
4.2. Runoff Attenuating Features
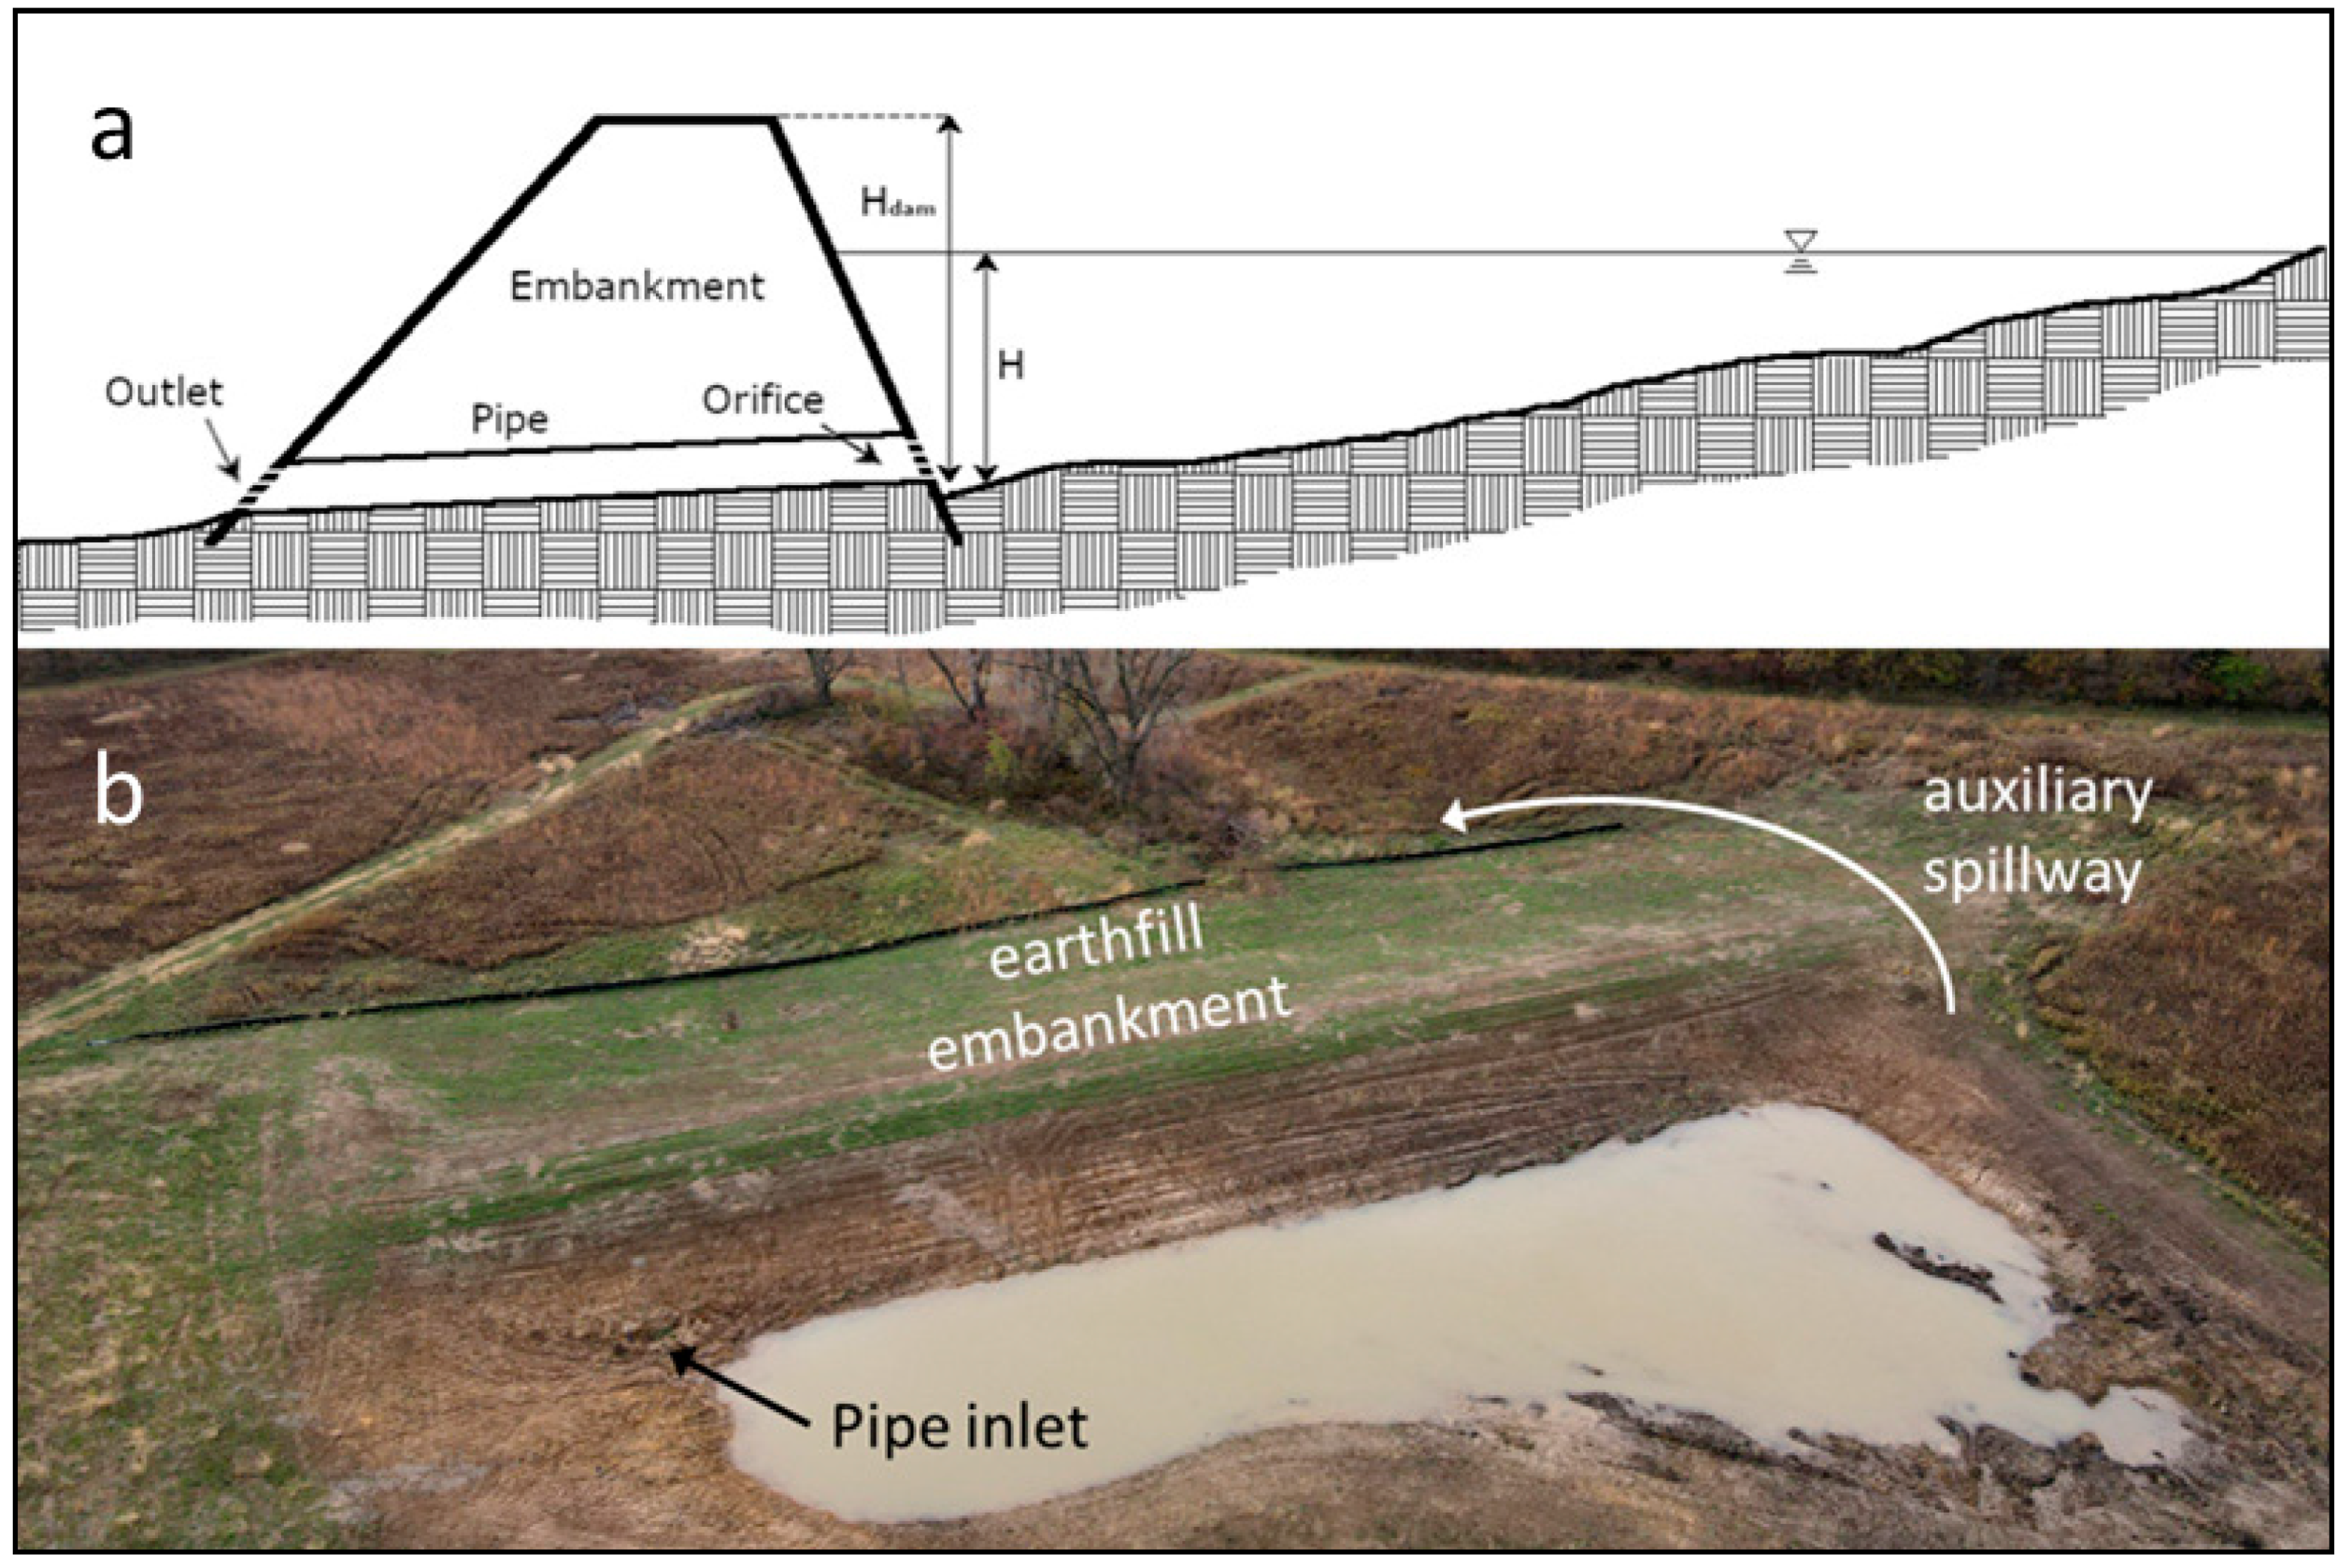
The runoff attenuating feature is a small inline reservoir that allows lower discharges to flow through, and fills when the waters rise. A transversal dam acts as a barrier and generates an impoundment (Figure 3). The dam has an orifice and a pipe conduit to discharge water when the reservoir is not completely full. At full capacity, an auxiliary spillway discharges water past the dam (Figure 3b). As such, the reservoir works as a passive mitigation system [79,80]. Despite being a common practice when building a small reservoir, excavation behind the dam was excluded to keep this application simple and avoid differing enhancements of storage among locations.
4.3. Potential Locations
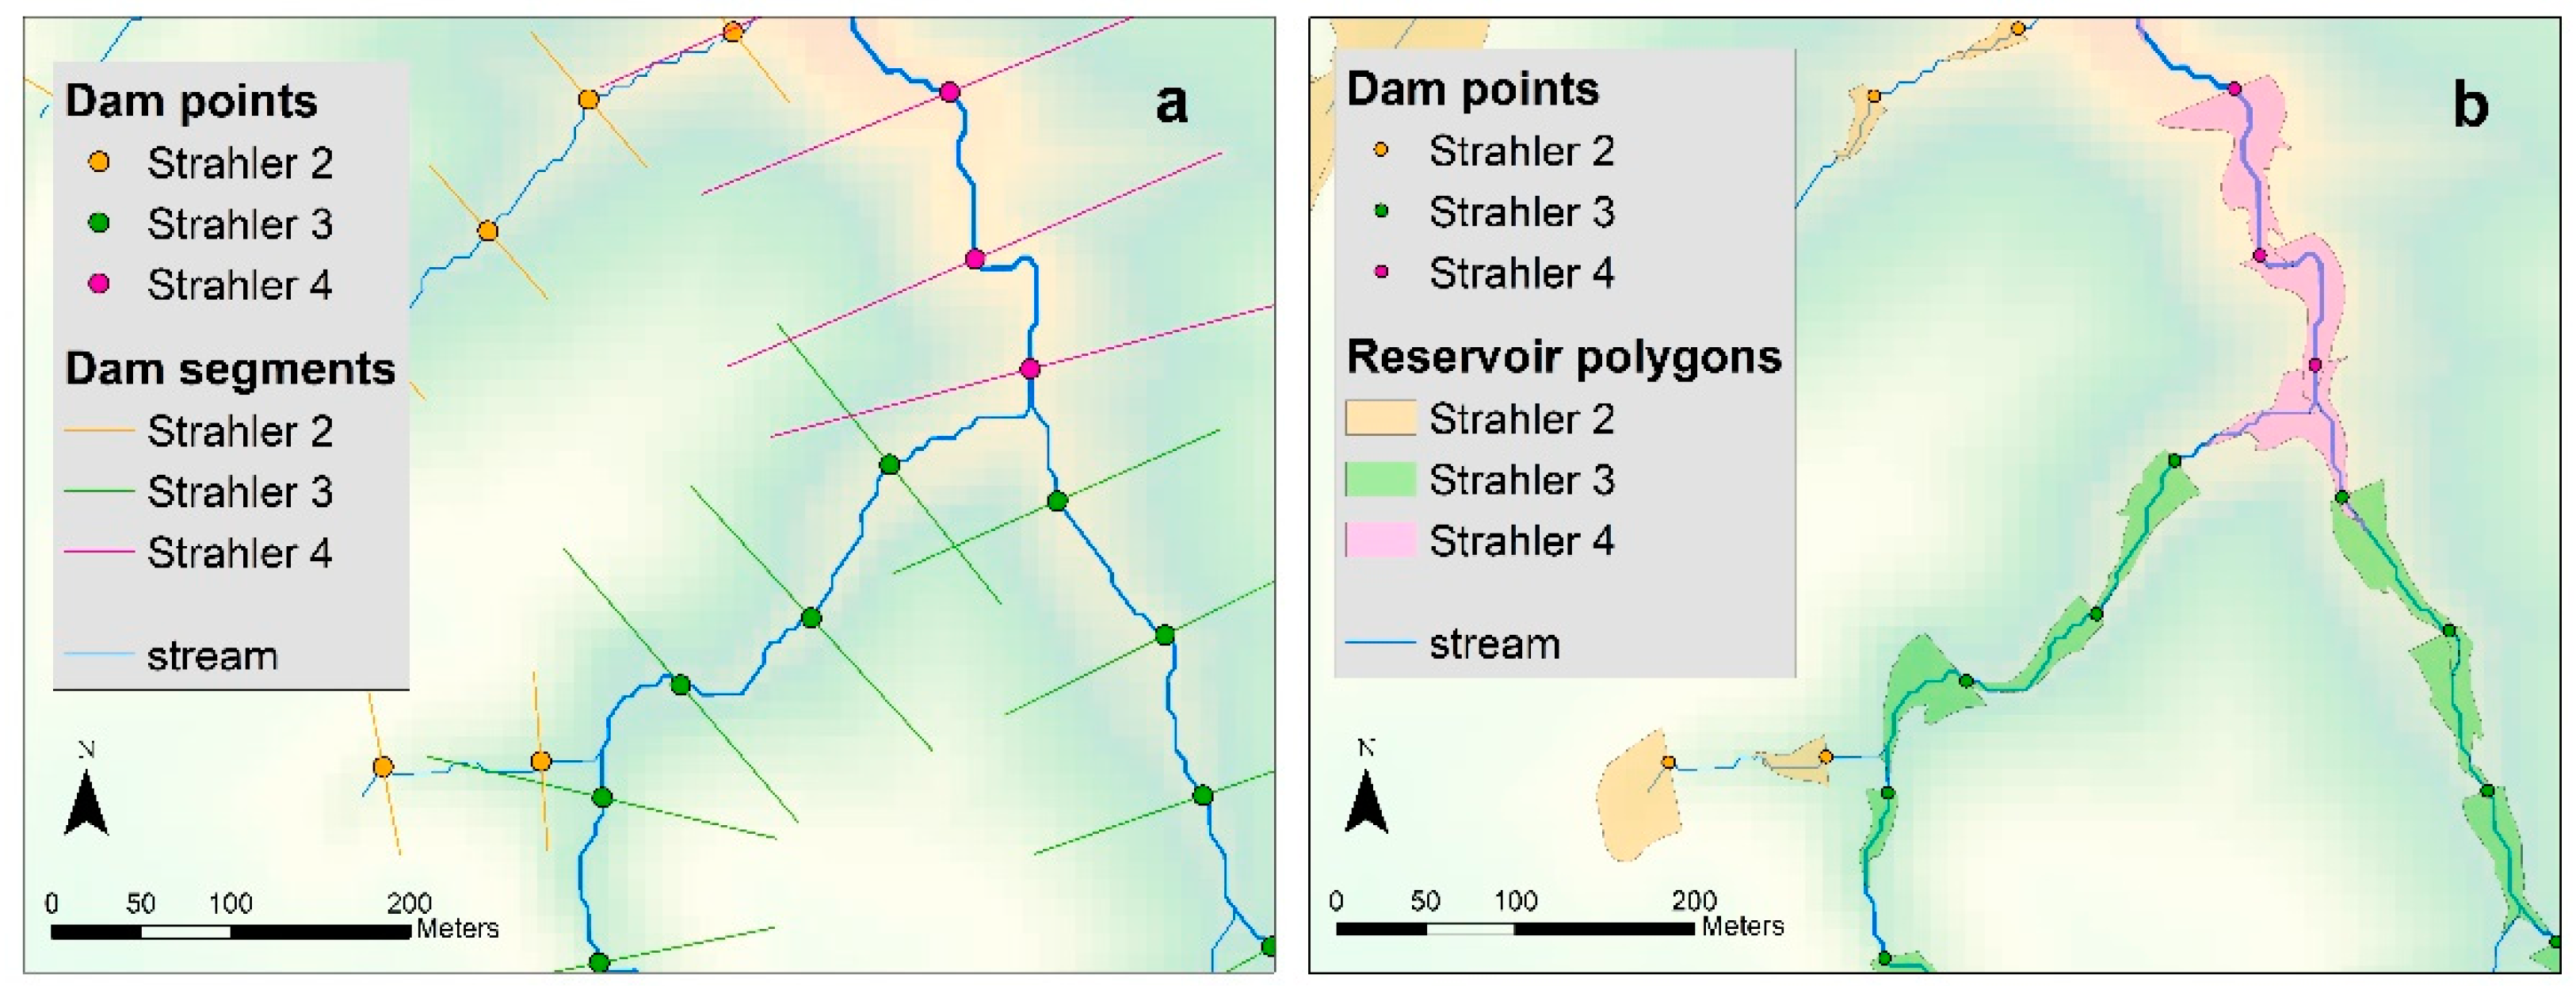
All reaches of Strahler order from 2 to 6 were considered for potentially installing a reservoir. We used ESRI ArcPy and GDAL [81] libraries to develop an algorithm generating reservoir objects in three steps. The first step identified points for locating dams and placed a dam segment across the streamline (Figure 4a). To maximize the number of reaches with at least one reservoir, we set a regular spacing between points of 100 m, starting 20 m from the start point of each reach. These choices resulted in 1154 locations.
In the second step, the algorithm delineated the reservoir footprint based on contour lines (Figure 4b). The assumption is that in steady-state conditions, the stored water surface has the same elevation, which is reasonable given the limited extent of the temporary reservoirs. This exercise employed a dam height range between 1 and 5 m (about 3.5–17 feet), to align with the intent of having “small” reservoirs. There is no consensus definition for the size of a small dam, neither at the legislative level nor in practice [82,83]. As a reference, guidelines from the Natural Resources Conservation Service set a maximum dam height for ponds at 35 feet (10.7 m), although terrain excavation is generally expected. The algorithm searched for an upstream contour line intersecting the dam segment and within the drainage area of the dam location. The initial elevation value was 5 m above the bottom of the dam. The elevation was lowered by 0.5 m until a contour line was found, or the minimum dam height was reached. Dam points, lines, and reservoir polygons take the same Strahler order as the reach where they are modeled.
In the third step, the GIS-based algorithm calculated water volume and footprint extent for different water depths using ArcGIS’s Surface Volume function [84]. At this point, every reservoir was defined geographically and geometrically. A storage-outflow relationship sets the reservoir functioning. When the reservoir is not full, the outflow is discharged through the pipe. We applied the formula for the flow through a large rectangular orifice (Equation (1), [85]). When the reservoir is full, the outflow is equal to the inflow as per continuity equation (Equation (2)), and is discharged by the pipe and the auxiliary spillway.
where Qin and Qout are the inflow and outflow discharges respectively, Cd is a coefficient of discharge, g is the gravity acceleration constant, Lorif is the orifice width, H is the water height from the bottom of the dam, Hdam is the dam height, H1 and H2 are the head over the bottom and top of the orifice, respectively. From Equations (1) and (2) outflow is a function of water level H, which was calculated for the same water depths as storage volume. Thus, outflow could be expressed as a function of storage.
In engineering practice, dams would be designed individually for a discharge with a certain return period, and orifice size would likely vary by location affecting the functioning of each dam. While the objective of this exercise is to determine if reservoirs have a higher attenuation power due to their location, dam characteristics, including orifice size, represent a confounding factor. Assigning the same geometric characteristics to all dams, from source stream to main stem, would be unrealistic, so we set the dam orifice size proportionally to the local channel width. As the channel section widens proceeding downstream, dam dimensions and orifice size also increase.
4.4. Hydrologic Model
Reservoirs defined in terms of location and functioning become a component of a hydrologic-hydraulic model. Many such models exist, differing in modeled processes, domain of applicability, input data requirement, programming language, and license [86,87]. For this application we chose wflow, a collection of distributed models for hydrological simulation developed at Deltares, written in Python 3.6, and made available under the General Public License 3.0 [88]. Simulations ran the wflow_sbm module, which models subsurface and overland flow, with inputs of a DEM, land cover, and precipitation data in raster format. We chose this model because (1) the possibility of modifying the original code allowed for the best integration of the GIS-based reservoir objects into the model, and (2) wflow_sbm is a distributed model where variables are spatially explicit. Hence, wflow_sbm was able to accommodate geographically defined reservoirs.
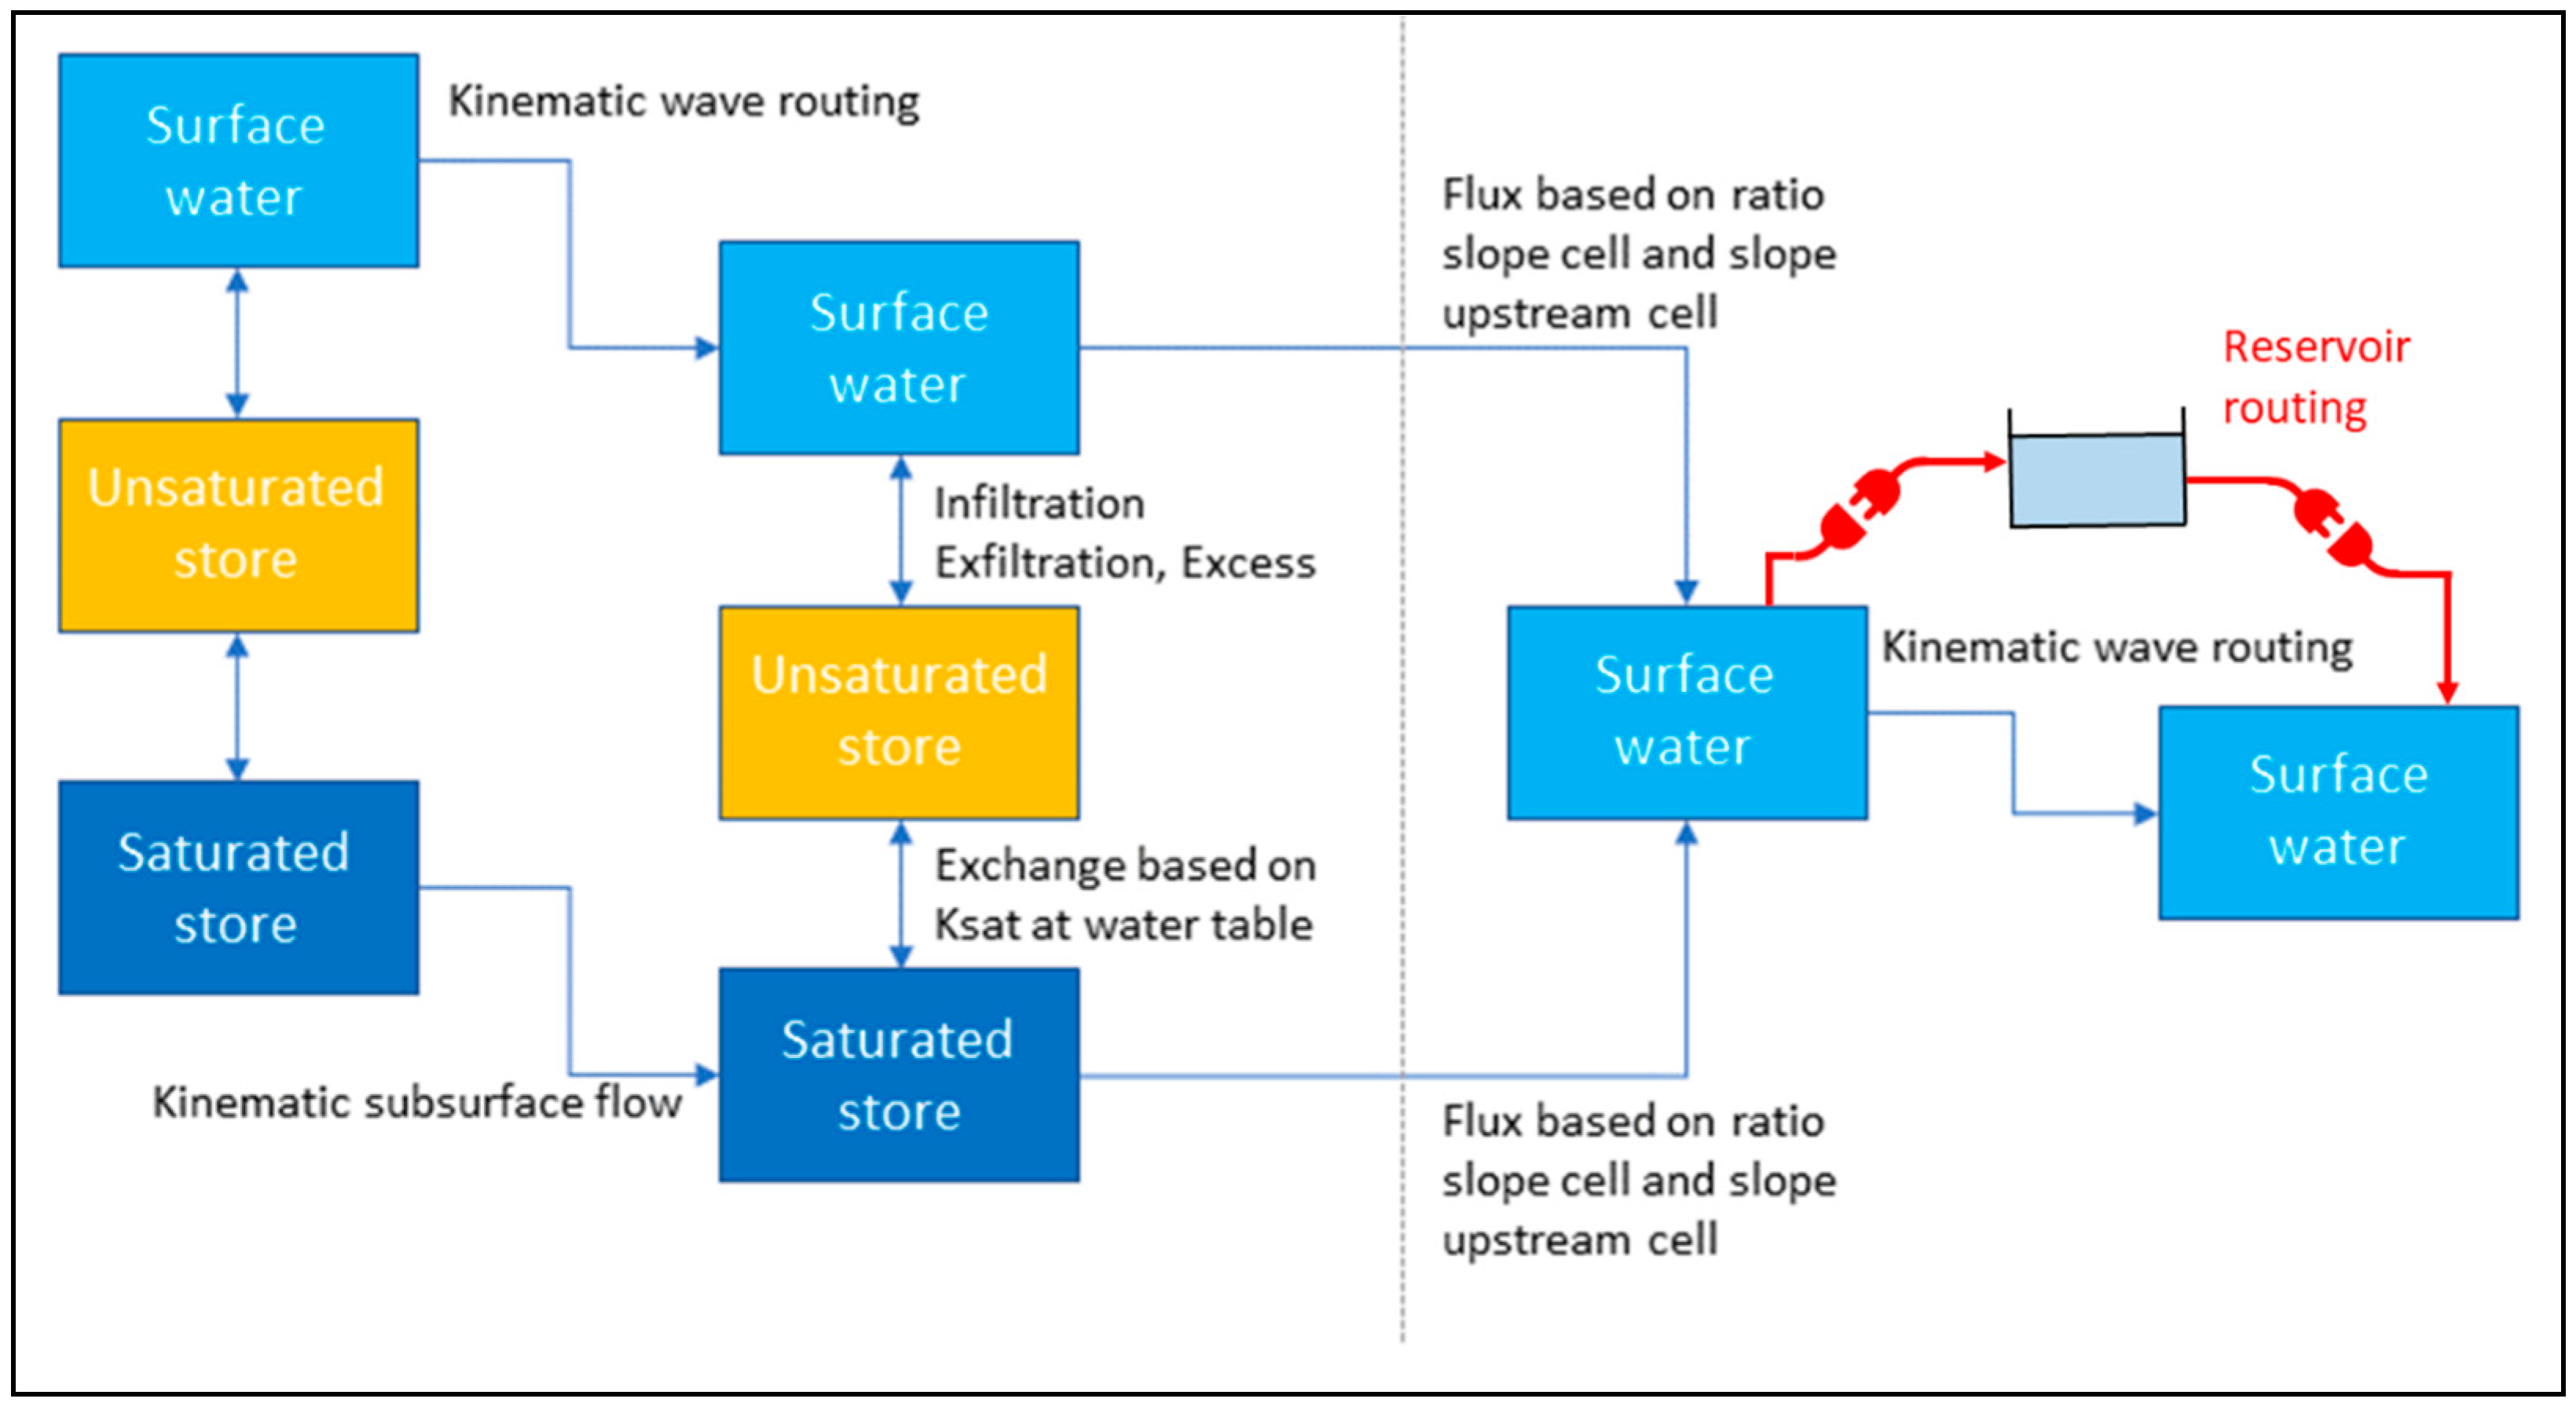
We wrote a module for routing water through reservoir objects by implementing a continuity equation among inflow Qin, outflow Qout, and storage S [85]:
where subscripts indicate previous and current timesteps, separated by time interval Δt. Unknown quantities are on the right-hand side of Equation (3), since all terms from the previous timestep are known and inflow is calculated by the kinematic wave routing module. Using the storage-outflow relationship previously calculated, one can determine both Scurr and Qout,curr at every timestep. The reservoir routing module was plugged into the existing wflow_sbm model, as shown in Figure 5.
In this application of the framework, the modified wflow_sbm was used to simulate a 1 h long, spatially uniform rainfall event. The spatial uniformity of precipitation likely does not hold for a region as large as an HUC 12 watershed. However, assuming uniform rainfall is an acceptable modeling choice at the beginning of a study and prevents the confounding effects of spatially varying precipitation. We set rainfall intensity at 70 mm/h, which corresponds to a 1 h event with a return period between 25 and 50 years in northeast Iowa [89]. We set the timestep to 1 min, after finding that a bigger timestep triggered numerical instability when reservoirs approached full capacity.
Values for wflow_sbm parameters were based on watershed characteristics (topography, soil type, land cover) and the recommendations of wflow developers. The model however was not calibrated. Hewett Creek, similar to many other HUC 12 watersheds in Iowa, is ungauged. Scaling down measured discharge from a larger catchment proved to be complicated and carried many uncertainties. The Turkey-Volga River system lies across two geological formations with distinct topographies. There are marked differences in land cover composition between the two regions, complicating the regionalization process. While calibration is fundamental to the setup of a hydrologic model, the purpose of this application is not to reproduce the natural hydrologic processes and design a DSR, but to explore and detect differences in watershed response to different DSRs.
4.5. Spatial Distributions of Reservoirs
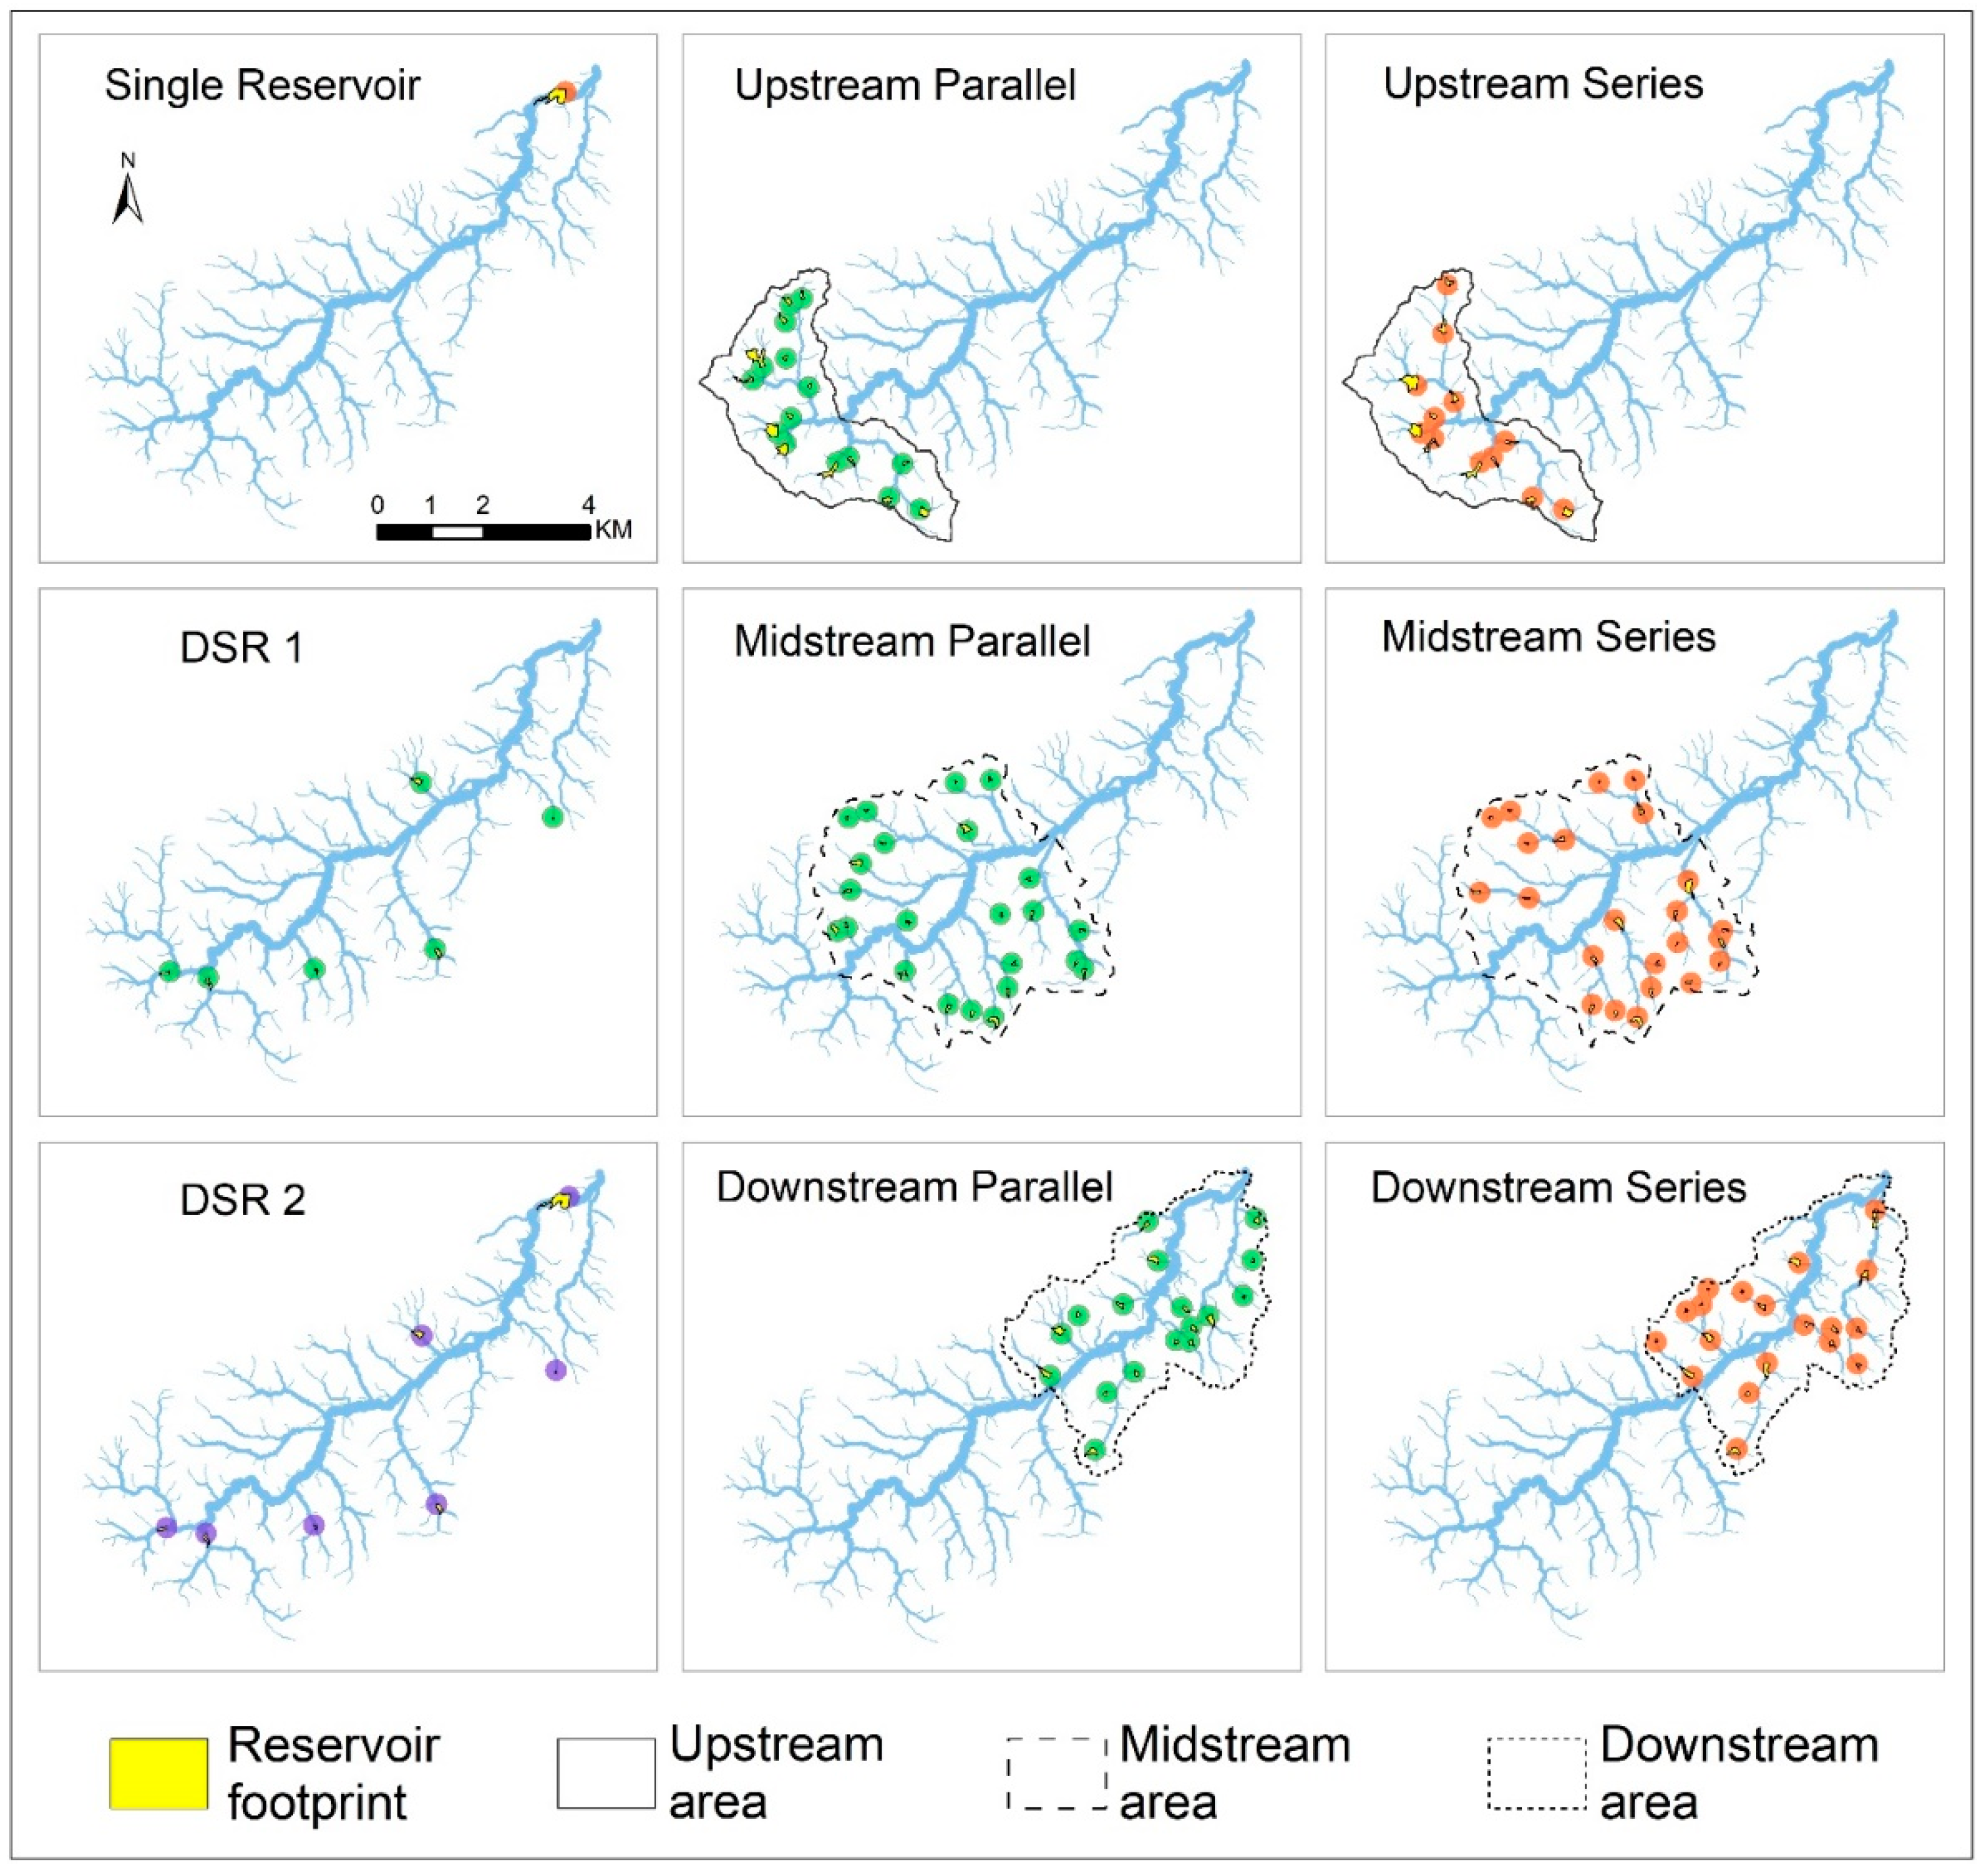
A spatial distribution of reservoirs, or DSR, is any feasible subset from the set of reservoirs modeled with the GIS-based algorithm. The only condition for feasibility is that no two reservoirs have overlapping footprints. Among the many possible distributions, we chose nine for this case study; they are displayed in Figure 6 and summarized in Table 1. The subsets have distinct spatial patterns to help understand the effect of the spatial dimension on the hydrograph.
The Baseline distribution represents the reference scenario where no reservoir is installed. Single Reservoir consists of one large reservoir regulating the whole watershed, and represents a traditional engineering approach to flood control. DSR 1 and DSR 2 are used to compare DSRs against a single reservoir; DSR 2 is equal to DSR 1 with the addition of Single Reservoir. This choice can help understand the benefit of having some small reservoirs upstream in addition to a large one downstream. Single Reservoir and DSR 1 have a similar value of overall storage capacity to make the contrast unbiased (Table 1).
There are six distributions of in-parallel and in-series reservoirs on upstream, midstream, and downstream regions of the watershed. In-parallel reservoirs control streams draining from completely different areas, whereas in-series reservoirs control the same drainage path, and their drainage areas partially overlap. The upstream, midstream, and downstream regions depicted in Figure 6 were determined as follows. The region draining to the beginning of the main stem (Strahler 6) is the upstream region; the rest of the watershed is divided approximately in half into midstream and downstream areas. Table 2 lists geometric characteristics of upstream, midstream, and downstream regions and of the distributions selected within each.
Previous studies on distributed attenuation considered in-parallel vs. in-series configurations and proximity to the outlet to be influential in flood control. It was natural to explicitly include those patterns in this application. The novel aspect here is that DSRs consist of multiple reservoirs (≥12, Table 1) selected from a large initial set. This has two implications. First, it allowed selection of enough reservoirs to strongly characterize DSRs according to spatial patterns, e.g., multiple reservoirs in-parallel, in the upstream region. Second, it was possible to fine tune the selection to equalize certain attributes, i.e., similar storage capacity for all DSRs (Table 1), and similar drainage area for the in-parallel distributions (Table 2). Since the spatial patterns are DSRs’ most distinctive trait, it is plausible to expect that they are responsible for hydrograph differences.
5. Results and Discussion
Wflow_sbm simulated a 1 h rainfall event independently for each distribution, generating output discharge values at the watershed outlet at 1 min timesteps. The simulation lasted five hours after the end of the rainfall. Discharge values were plotted as hydrographs. Given the small size and quick response of the catchment, the peak flow rate showed attenuation more clearly than lag time and was used to compare watershed responses under different DSRs.
5.1. Single Reservoir vs. Distributed Reservoirs
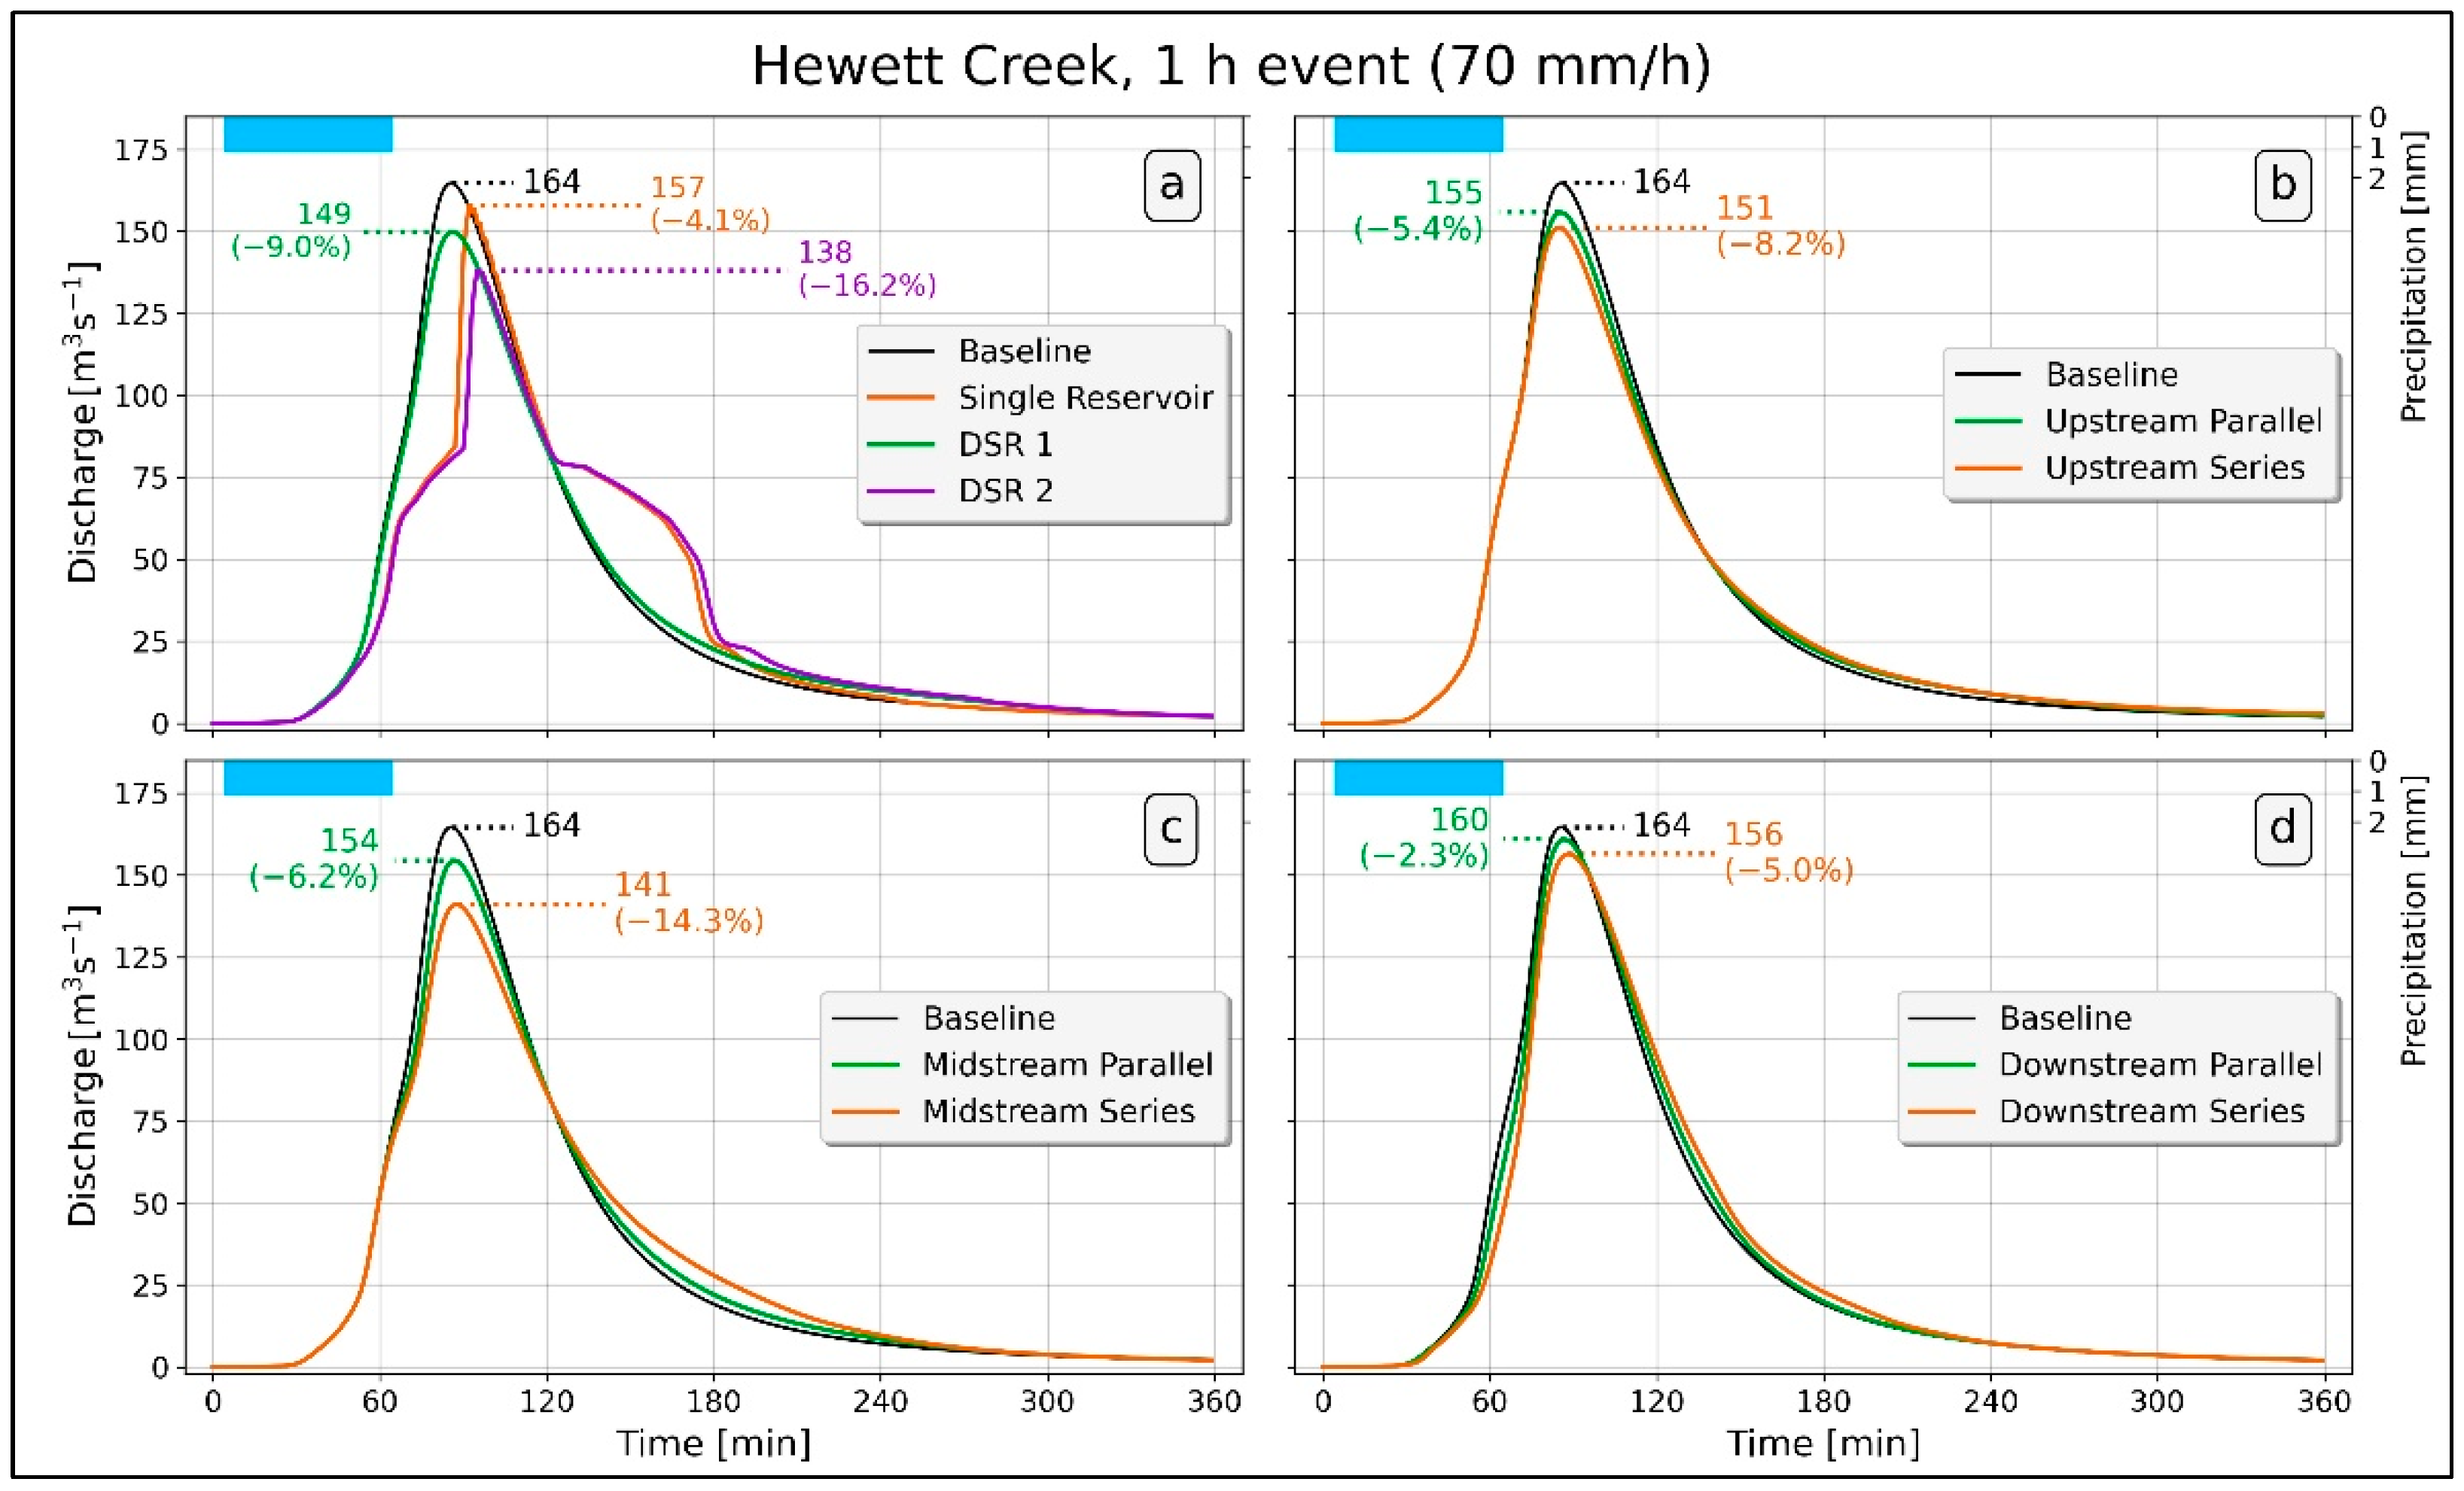
Figure 7a shows hydrographs for the Baseline, Single Reservoir, DSR 1, and DSR 2 distributions. As expected, the presence of reservoirs reduced the peak flow. A less obvious result is that DSR 1 generated a larger reduction in peak flow than Single Reservoir, even though the two have about the same storage capacity. Single Reservoir strongly regulated incoming flow at the beginning. Once it was full, discharge increased sharply, as no regulation occurred and the auxiliary spillway discharged water excess. By contrast, in DSR 1, attenuation occurred at multiple points and smoothed the flow to generate a lower peak than in Single Reservoir.
The peak flow reduction in DSR 2 (26 m3/s) is greater than the sum of Single Reservoir (7 m3/s) and DSR 1 (15 m3/s) reductions. In fact, in DSR 2, the attenuation generated by upstream reservoirs decreased the inflow for the larger reservoir at the outlet. This filled more slowly than when it operated alone, it worked less time at full capacity and attenuated the flow for a longer time. This is an example of how a reservoir attenuation power is tightly related to the presence of other reservoirs. A given reservoir can be more or less effective in association with other reservoirs of a distributed system.
5.2. In-Parallel vs. In-Series Distributions
In-series distributions performed consistently better than in-parallel in all the regions of the watershed (Figure 7b–d), despite having approximately the same total storage capacity (Table 1). Similar to that in DSR 2, one or more upstream reservoirs generated a peak reduction that lowered the inflow for the next reservoir in the series. This further slowed and reduced water discharge, and so on until the last element of the series. On the contrary, in-parallel reservoirs reduced peak independently, and the presence of a reservoir, or lack thereof, did not affect the functioning of other in-parallel reservoirs.
The main criterion for in-series DSRs reservoir selection was the total storage capacity, as for all the other DSRs. A second criterion was to place in-series reservoirs only on longer tributaries. After experimenting with in-series distributions, we found that two or more in-series reservoirs on short tributaries overregulated flow without contributing to peak flow reduction at the outlet. In fact, close in-series reservoirs generate inefficiencies in DSR functioning [90] because (1) the downstream reservoir does not work at full capacity due to the small inflow received, and (2) most of the drainage area regulated by the downstream reservoir is already regulated by the upstream one. In-series reservoirs ended up being 800 m apart or more.
The better performance of in-series over in-parallel DSRs may not be generalizable. While other in-parallel and in-series distributions were modeled and showed similar results, the number of analyzed distributions is small compared to the population of possible in-parallel and in-series DSRs. Furthermore, it is unknown where the modeled flow peaks fall in the statistical distribution of flow peaks generated by all the existing in-parallel/in-series DSRs with the same capacity and/or same drainage criteria. Notably, both Del Giudice, Rasulo, Siciliano, and Padulano [90] and Ayalew, Krajewski, and Mantilla [35] found that in-parallel configurations performed better than in-series. They used reservoirs on the main stem, without constraints on capacity, drainage, and distancing between reservoirs. In this exercise, in-series reservoirs were sufficiently distanced from each other, attenuation was likely better distributed along a channel, and inefficiencies were minimized.
Downstream distributions showed a smaller reduction than midstream or upstream configurations (Figure 7b–d). Two circumstances can explain this result. First, attenuation on downstream tributaries has a limited effect on the flood wave on the main stem, which flows unattenuated from upstream and midstream regions. A second reason is the delay introduced by downstream reservoirs can synchronize the peak flow of downstream tributaries, with the peak or near-to-peak flow on the main stem. A downstream DSR attenuation benefit would then be partially offset by the flow’s synchronization, resulting in a small peak reduction at the outlet. Other downstream DSRs might increase the Baseline peak flow by synchronization, as found by Goff and Gentry [34], in elongated watersheds.
In-parallel upstream and midstream DSRs were equivalent, whereas the in-series midstream DSR was superior to the in-series upstream DSR (Figure 7b,c). Midstream long tributaries drain elongated areas, while the drainage areas of the two main upstream tributaries (Strahler 5) have more of a compact shape. For this reason, and despite efforts of aligning regulated drainage area for both DSRs, Midstream Series regulates a larger drainage area, and about 43% of the reaches compared to 34% regulated by Upstream Series (Table 2). Midstream Series reservoirs regulate a larger portion of the drainage network, have a higher attenuation power, and reduce peak flow at the outlet more. Apparently, the synchronization of midstream reservoirs with waters from upstream was not substantial.
5.3. Framework Role and Future Development
The framework allows for the exploration of opportunities for flood attenuation that otherwise would not be apparent. The application presented example distributions, but numerous other distributions of small reservoirs are possible. For example, other DSRs with the same storage capacity as DSR 1 might produce a larger (or smaller) attenuation because of the spatial arrangements of their elements. One key aspect of the framework is the availability of many potential locations, which enables numerous combinations of features and spatial distributions. Runoff attenuating features in places that are not typically considered, such as source streams and small tributaries, can highlight potentially novel and even counterintuitive results. The stronger attenuation power found for in-series DSRs is an eminent example. It shows that the parallel vs. series dichotomy is worthy of further analysis in the future.
Thoroughly investigating the spatial dimension of distributed attenuation requires the systematic analysis of many distributions. Eventually the modeler wants to identify a few spatial distributions, realizing the desired attenuation at the minimum cost. Spatial patterns or specific features in common among the best performing distributions can then guide the design of distributed attenuation for a given study area. The problem of identifying the optimal set of attenuating features is already present in the literature [39,91,92,93,94,95], but it has so far been limited to specific case studies without generalization. Future work may develop heuristic search methods to efficiently solve the optimization problem. Our framework supports the solution of the optimization problem, because heuristic methods leverage the set of many locations and attenuating features.
The engineering dimension of a system of attenuating features also influences attenuation at the watershed scale. The design of a single feature determines its functioning locally and within the system. In the case study for example, changing dam geometry or allowing excavation behind the dam would likely lead to different results. Some previous research has addressed the optimization of dam design in DSRs [37,96,97,98] and GI type and design [99,100]. The engineering dimension represents an additional set of parameters that can be optimized for flood attenuation.
Rainfall magnitude and spatial pattern also influence runoff attenuation. A spatial uniform rainfall is a convenient initial assumption, but generally it is not acceptable for HUC12 catchments, even less for larger watersheds. The hydrologic model should be related to a stochastic model for rainfall event generation, accounting for rain spatial and temporal variability [101,102]. In general, future enhancement of the framework should consider the robustness of systems of attenuating features, and check if these systems are still effective given different events and conditions (e.g., soil moisture, snowmelt).
Finally, when designing distributed attenuation, it is important to consider the scale of interventions. Attenuated flow effectively realized in one catchment might synchronize with flow from other adjacent and/or parallel catchments, and worsen flood effects downstream. While the impact of a single feature is relatively modest, the combination of effects cannot be neglected and might extend beyond the study area boundary initially considered. The framework is general enough that it can be applied to any spatial scale. Further research might take advantage of the framework to determine if and how distributed attenuation can be down- or upscaled across catchments of different size.
6. Conclusions
Distributed attenuation represents a change from the dominant paradigm in flood control. While a single centralized structure controls flooding at a specific location, attenuating features reduce runoff and flooding in multiple places, closer to where runoff is generated. This article presents a framework for analyzing distributed attenuation, in which attenuating features are modeled on a large number of potential locations. Features are then combined into subsets and entered into a hydrologic model that simulates their effect on runoff.
This methodology was applied to study DSR configurations in a northeast Iowa watershed. The results showed that a DSR can yield the same or more attenuation compared to a larger reservoir of the same capacity. Further results suggested that upstream and midstream distributions yield a larger attenuation than downstream. Contrary to other previous studies, in-series reservoirs had a larger flow rate control than in-parallel, capacity being equal. This suggests that the positions of reservoirs, the streams they control, and their mutual distance along the flow path play an important role and deserve specific attention.
The framework’s main contribution is a methodology to analyze distributed attenuation, specifically in its spatial dimension. The combination of effects from each feature is influenced by spatial and topological components and cannot be determined algebraically. The geometry of the drainage network and where attenuating features are located in the network affect water flow in a manner that is challenging to predict and generalize. Our framework supports the systematic analysis of the spatial behavior of distributed attenuation. Future studies can use the framework to investigate the benefits and costs of attenuating features on catchments of varying scales and landscapes.
Author Contributions
Conceptualization, F.A.; methodology, F.A.; investigation, F.A.; writing—original draft, F.A.; writing—review and editing, E.T.; supervision, E.T. All authors have read and agreed to the published version of the manuscript.
Funding
This research received no external funding.
Institutional Review Board Statement
Not applicable.
Informed Consent Statement
Not applicable.
Data Availability Statement
Data, modeling code, parameters, and results presented in this study have been made openly available on a Github public repository [103].
Acknowledgments
We would like to acknowledge Antonio Arenas Amado, Nathan Young and David Bennett for their helpful comments, and Kate Giannini at the Iowa Flood Center for providing images and project data of existing small reservoirs.
Conflicts of Interest
The authors declare no conflict of interest.
References
- USACE. Available online: https://www.iwr.usace.army.mil/Missions/Value-to-the-Nation/Fast-Facts/Fast-Facts-Sources/ (accessed on 25 May 2021).
- Heine, R.A.; Pinter, N. Levee effects upon flood levels: An empirical assessment. Hydrol. Process. 2012, 26, 3225–3240. [Google Scholar] [CrossRef]
- Jacobson, R.B.; Lindner, G.; Bitner, C. The Role of Floodplain Restoration in Mitigating Flood Risk, Lower Missouri River, USA. In Geomorphic Approaches to Integrated Floodplain Management of Lowland Fluvial Systems in North America and Europe; Hudson, P.F., Middelkoop, H., Eds.; Springer: New York, NY, USA, 2015; pp. 203–243. [Google Scholar]
- Graf, W.L. Downstream hydrologic and geomorphic effects of large dams on American rivers. Geomorphology 2006, 79, 336–360. [Google Scholar] [CrossRef]
- Piqué, G.; Batalla, R.J.; López, R.; Sabater, S. The fluvial sediment budget of a dammed river (upper Muga, southern Pyrenees). Geomorphology 2017, 293, 211–226. [Google Scholar] [CrossRef] [Green Version]
- Walther, S.C.; Martinez, A.E.; Greenfield, B.K. Impact of Jordanelle Dam on sedimentological and ecohydrological regimes of the Provo River, Utah, USA. Int. J. River Basin Manag. 2021, 1–11. [Google Scholar] [CrossRef]
- Hauer, C.; Leitner, P.; Unfer, G.; Pulg, U.; Habersack, H.; Graf, W. The Role of Sediment and Sediment Dynamics in the Aquatic Environment. In Riverine Ecosystem Management; Springer International Publishing: Cham, Germany, 2018; pp. 151–169. [Google Scholar]
- McCluney, K.E.; Poff, N.L.; Palmer, M.A.; Thorp, J.H.; Poole, G.C.; Williams, B.S.; Williams, M.R.; Baron, J.S. Riverine macrosystems ecology: Sensitivity, resistance, and resilience of whole river basins with human alterations. Front. Ecol. Environ. 2014, 12, 48–58. [Google Scholar] [CrossRef]
- Ho, M.; Lall, U.; Allaire, M.; Devineni, N.; Kwon, H.H.; Pal, I.; Raff, D.; Wegner, D. The future role of dams in the United States of America. Water Resour. Res. 2017, 53, 982–998. [Google Scholar] [CrossRef]
- Silva, R.; Galloway, M.; Ritchey, J.; Smith, K.; Kula, J.; Ditchey, E.; McCormick, T.; Verigin, S. The cost of Rehabilitating Our Nation’s Dams. A Methodology, Estimate & Proposed Funding Mechanisms; Association of state dam safety officials: Lexington, KY, USA, 2019. [Google Scholar]
- Lovett, R.A. Dam removals: Rivers on the run. Nature 2014, 511, 521–523. [Google Scholar] [CrossRef] [Green Version]
- Castillo-Rodríguez, J.T.; Needham, J.T.; Morales-Torres, A.; Escuder-Bueno, I. A combined risk analysis approach for complex dam–levee systems. Struct. Infrastruct. Eng. 2017, 13, 1624–1638. [Google Scholar] [CrossRef]
- Aureli, F.; Maranzoni, A.; Petaccia, G. Review of Historical Dam-Break Events and Laboratory Tests on Real Topography for the Validation of Numerical Models. Water 2021, 13, 1968. [Google Scholar] [CrossRef]
- Adnan, M.S.G.; Haque, A.; Hall, J.W. Have coastal embankments reduced flooding in Bangladesh? Sci. Total Environ. 2019, 682, 405–416. [Google Scholar] [CrossRef]
- Abdulkareem, M.; Elkadi, H. From engineering to evolutionary, an overarching approach in identifying the resilience of urban design to flood. Int. J. Disaster Risk Reduct. 2018, 28, 176–190. [Google Scholar] [CrossRef]
- Manocha, N.; Babovic, V. Planning Flood Risk Infrastructure Development under Climate Change Uncertainty. Procedia Eng. 2016, 154, 1406–1413. [Google Scholar] [CrossRef] [Green Version]
- Sayers, P.; Galloway, G.; Penning-Rowsell, E.; Yuanyuan, L.; Fuxin, S.; Yiwei, C.; Kang, W.; Le Quesne, T.; Wang, L.; Guan, Y. Strategic flood management: Ten ‘golden rules’ to guide a sound approach. Int. J. River Basin Manag. 2015, 13, 137–151. [Google Scholar] [CrossRef]
- Jongman, B.; Ward, P.J.; Aerts, J.C. Global exposure to river and coastal flooding: Long term trends and changes. Glob. Environ. Chang. 2012, 22, 823–835. [Google Scholar] [CrossRef]
- Green, C.H.; Parker, D.J.; Tunstall, S.M. Assessment of Flood Control and Management Options; Thematic Review IV.4 prepared as an input to the World Commission on Dams; World Commission on Dams: Cape Town, South Africa, 2000. [Google Scholar]
- Ayalew, T.B.; Krajewski, W.F.; Mantilla, R.; Wright, D.B.; Small, S.J. Effect of Spatially Distributed Small Dams on Flood Frequency: Insights from the Soap Creek Watershed. J. Hydrol. Eng. 2017, 22, 04017011. [Google Scholar] [CrossRef]
- Berry, P.; Yassin, F.; Belcher, K.; Lindenschmidt, K.-E. An economic assessment of local farm multi-purpose surface water retention systems in a Canadian Prairie setting. Appl. Water Sci. 2017, 7, 4461–4478. [Google Scholar] [CrossRef] [Green Version]
- Lavers, T.; Charlesworth, S. Opportunity mapping of natural flood management measures: A case study from the headwaters of the Warwickshire-Avon. Environ. Sci. Pollut. Res. 2018, 25, 19313–19322. [Google Scholar] [CrossRef]
- Nicholson, A.R.; O’Donnell, G.M.; Wilkinson, M.E.; Quinn, P.F. The potential of runoff attenuation features as a Natural Flood Management approach. J. Flood Risk Manag. 2020, 13. [Google Scholar] [CrossRef] [Green Version]
- Fletcher, T.D.; Shuster, W.; Hunt, W.F.; Ashley, R.; Butler, D.; Arthur, S.; Trowsdale, S.; Barraud, S.; Semadeni-Davies, A.; Bertrand-Krajewski, J.-L.; et al. SUDS, LID, BMPs, WSUD and more—The evolution and application of terminology surrounding urban drainage. Urban Water J. 2015, 12, 525–542. [Google Scholar] [CrossRef]
- Davis, A.P.; Hunt, W.F.; Traver, R.G.; Clar, M. Bioretention Technology: Overview of Current Practice and Future Needs. J. Environ. Eng. 2009, 135, 109–117. [Google Scholar] [CrossRef]
- Berland, A.; Shiflett, S.A.; Shuster, W.D.; Garmestani, A.S.; Goddard, H.C.; Herrmann, D.L.; Hopton, M.E. The role of trees in urban stormwater management. Landsc. Urban Plan. 2017, 162, 167–177. [Google Scholar] [CrossRef] [Green Version]
- McCuen, R.H. A regional approach to urban storm water detention. Geophys. Res. Lett. 1974, 1, 2. [Google Scholar] [CrossRef]
- Ali, G. Keeping Water on the Land: How, Where and When? Presentation to CWRA Luncheon and AGM. 2013. Available online: http://umanitoba.ca/interdisciplinary/programs/watershed/media/CWRApresentation_14May2013_GA.pdf (accessed on 26 May 2021).
- Wunsch, M.J. Distributed Storage Modeling in Soap Creek for Flood Control and Agricultural Practices. Master’s Thesis, University of Iowa, Iowa City, IA, USA, 2013. [Google Scholar] [CrossRef] [Green Version]
- Sun, J. Hydrologic and Hydraulic Model Development for Flood Mitigation and Routing Method Comparison in Soap Creek Watershed. Master’s Thesis, University of Iowa, Iowa City, IA, USA, 2015. [Google Scholar] [CrossRef] [Green Version]
- Tiessen, K.H.D.; Elliott, J.A.; Stainton, M.; Yarotski, J.; Flaten, D.N.; Lobb, D.A. The effectiveness of small-scale headwater storage dams and reservoirs on stream water quality and quantity in the Canadian Prairies. J. Soil Water Conserv. 2011, 66, 158–171. [Google Scholar] [CrossRef]
- Liu, Y.B.; Yang, W.H.; Yu, Z.Q.; Lung, I.; Yarotski, J.; Elliott, J.; Tiessen, K. Assessing Effects of Small Dams on Stream Flow and Water Quality in an Agricultural Watershed. J. Hydrol. Eng. 2014, 19, 14. [Google Scholar] [CrossRef]
- Emerson, C.H.; Welty, C.; Traver, R.G. Watershed-scale evaluation of a system of storm water detention basins. J. Hydrol. Eng. 2005, 10, 237–242. [Google Scholar] [CrossRef]
- Goff, K.M.; Gentry, R.W. The Influence of Watershed and Development Characteristics on the Cumulative Impacts of Stormwater Detention Ponds. Water Resour. Manag. 2006, 20, 829–860. [Google Scholar] [CrossRef]
- Ayalew, T.B.; Krajewski, W.F.; Mantilla, R. Insights into Expected Changes in Regulated Flood Frequencies due to the Spatial Configuration of Flood Retention Ponds. J. Hydrol. Eng. 2015, 20, 10. [Google Scholar] [CrossRef]
- Chen, C.N.; Tsai, C.H.; Tsai, C.T. Reduction of discharge hydrograph and flood stage resulted from upstream detention ponds. Hydrol. Process. 2007, 21, 3492–3506. [Google Scholar] [CrossRef]
- Mays, L.W.; Bedient, P.B. Model for Optimal Size and Location of Detention. J. Water Resour. Plan. Manag. Div. 1982, 108, 270–285. [Google Scholar] [CrossRef]
- Ravazzani, G.; Gianoli, P.; Meucci, S.; Mancini, M. Assessing Downstream Impacts of Detention Basins in Urbanized River Basins Using a Distributed Hydrological Model. Water Resour. Manag. 2014, 28, 1033–1044. [Google Scholar] [CrossRef]
- Yazdi, J.; Salehi Neyshabouri, S.A.A. A Simulation-Based Optimization Model for Flood Management on a Watershed Scale. Water Resour. Manag. 2012, 26, 4569–4586. [Google Scholar] [CrossRef]
- Wilkinson, M.E.; Quinn, P.F.; Welton, P. Runoff management during the September 2008 floods in the Belford catchment, Northumberland. J. Flood Risk Manag. 2010, 3, 285–295. [Google Scholar] [CrossRef]
- Addy, S.; Wilkinson, M. An assessment of engineered log jam structures in response to a flood event in an upland gravel-bed river. Earth Surf. Process. Landf. 2016, 41, 1658–1670. [Google Scholar] [CrossRef]
- Nicholson, A.R.; Wilkinson, M.E.; O’Donnell, G.M.; Quinn, P.F. Runoff attenuation features: A sustainable flood mitigation strategy in the Belford catchment, UK. Area 2012, 44, 463–469. [Google Scholar] [CrossRef]
- Thomas, H.; Nisbet, T. Modelling the hydraulic impact of reintroducing large woody debris into watercourses. J. Flood Risk Manag. 2012, 5, 164–174. [Google Scholar] [CrossRef]
- Hartmann, T.; Slavíková, L.; McCarthy, S. Nature-Based Solutions in Flood Risk Management. In Nature-Based Flood Risk Management on Private Land: Disciplinary Perspectives on a Multidisciplinary Challenge; Hartmann, T., Slavíková, L., McCarthy, S., Eds.; Springer International Publishing: Cham, Germany, 2019; pp. 3–8. [Google Scholar]
- McIntyre, N.; Ballard, C.; Bulygina, N.; Frogbrook, Z.; Cluckie, I.; Dangerfield, S.; Ewen, J.; Geris, J.; Henshaw, A.; Jackson, B.; et al. The potential for reducing flood risk through changes to rural land management: Outcomes from the Flood Risk Management Research Consortium. In Proceedings of the BHS Eleventh National Symposium, Hydrology for a Changing World, Dundee, Scotland, 6–8 September 2012. [Google Scholar]
- Dadson, S.J.; Hall, J.W.; Murgatroyd, A.; Acreman, M.; Bates, P.; Beven, K.; Heathwaite, L.; Holden, J.; Holman, I.P.; Lane, S.N.; et al. A restatement of the natural science evidence concerning catchment-based ‘natural’ flood management in the UK. Proc. R. Soc. A Math. Phys. Eng. Sci. 2017, 473, 20160706. [Google Scholar] [CrossRef] [PubMed] [Green Version]
- Thomas, H.; Nisbet, T.R. An assessment of the impact of floodplain woodland on flood flows. Water Environ. J. 2007, 21, 114–126. [Google Scholar] [CrossRef]
- Wilkinson, M.E.; Quinn, P.F.; Barber, N.J.; Jonczyk, J. A framework for managing runoff and pollution in the rural landscape using a Catchment Systems Engineering approach. Sci. Total Environ. 2014, 468, 1245–1254. [Google Scholar] [CrossRef]
- Metcalfe, P.; Beven, K.; Hankin, B.; Lamb, R. A modelling framework for evaluation of the hydrological impacts of nature-based approaches to flood risk management, with application to in-channel interventions across a 29-km2 scale catchment in the United Kingdom. Hydrol. Process. 2017, 31, 1734–1748. [Google Scholar] [CrossRef] [Green Version]
- Pattison, I.; Lane, S.N.; Hardy, R.J.; Reaney, S.M. The role of tributary relative timing and sequencing in controlling large floods. Water Resour. Res. 2014, 50, 5444–5458. [Google Scholar] [CrossRef] [Green Version]
- Dixon, S.J.; Sear, D.A.; Odoni, N.A.; Sykes, T.; Lane, S.N. The effects of river restoration on catchment scale flood risk and flood hydrology. Earth Surf. Process. Landf. 2016, 41, 997–1008. [Google Scholar] [CrossRef]
- Roy, A.H.; Wenger, S.J.; Fletcher, T.D.; Walsh, C.J.; Ladson, A.R.; Shuster, W.D.; Thurston, H.W.; Brown, R.R. Impediments and solutions to sustainable, watershed-scale urban stormwater management: Lessons from Australia and the United States. Environ. Manag. 2008, 42, 344–359. [Google Scholar] [CrossRef]
- Huang, Y.J.; Tian, Z.; Ke, Q.; Liu, J.G.; Irannezhad, M.; Fan, D.L.; Hou, M.F.; Sun, L.X. Nature-based solutions for urban pluvial flood risk management. Wiley Interdiscip. Rev.-Water 2020, 7, 17. [Google Scholar] [CrossRef]
- Carmen, N.B.; Hunt William, F.; Anderson, A.R. Volume Reduction Provided by Eight Residential Disconnected Downspouts in Durham, North Carolina. J. Environ. Eng. 2016, 142, 05016002. [Google Scholar] [CrossRef]
- Jarden, K.M.; Jefferson, A.J.; Grieser, J.M. Assessing the effects of catchment-scale urban green infrastructure retrofits on hydrograph characteristics. Hydrol. Process. 2016, 30, 1536–1550. [Google Scholar] [CrossRef]
- Woznicki, S.A.; Hondula, K.L.; Jarnagin, S.T. Effectiveness of landscape-based green infrastructure for stormwater management in suburban catchments. Hydrol. Process. 2018, 32, 2346–2361. [Google Scholar] [CrossRef] [Green Version]
- Fahy, B.; Chang, H. Effects of Stormwater Green Infrastructure on Watershed Outflow: Does Spatial Distribution Matter? Int. J. Geospat. Environ. Res. 2019, 6, 5. [Google Scholar]
- Zellner, M.; Massey, D.; Minor, E.; Gonzalez-Meler, M. Exploring the effects of green infrastructure placement on neighborhood-level flooding via spatially explicit simulations. Comput. Environ. Urban Syst. 2016, 59, 116–128. [Google Scholar] [CrossRef] [Green Version]
- Shuster, W.; Rhea, L. Catchment-scale hydrologic implications of parcel-level stormwater management (Ohio USA). J. Hydrol. 2013, 485, 177–187. [Google Scholar] [CrossRef]
- Yang, B.; Li, S. Green Infrastructure Design for Stormwater Runoff and Water Quality: Empirical Evidence from Large Watershed-Scale Community Developments. Water 2013, 5, 2038–2057. [Google Scholar] [CrossRef]
- Pennino, M.J.; McDonald, R.I.; Jaffe, P.R. Watershed-scale impacts of stormwater green infrastructure on hydrology, nutrient fluxes, and combined sewer overflows in the mid-Atlantic region. Sci. Total Environ. 2016, 565, 1044–1053. [Google Scholar] [CrossRef] [PubMed] [Green Version]
- Mejia, A.I.; Moglen, G.E. Impact of the spatial distribution of imperviousness on the hydrologic response of an urbanizing basin. Hydrol. Process. 2010, 24, 3359–3373. [Google Scholar] [CrossRef]
- Loperfido, J.V.; Noe, G.B.; Jarnagin, S.T.; Hogan, D.M. Effects of distributed and centralized stormwater best management practices and land cover on urban stream hydrology at the catchment scale. J. Hydrol. 2014, 519, 2584–2595. [Google Scholar] [CrossRef]
- Fry, T.J.; Maxwell, R.M. Evaluation of distributed BMPs in an urban watershedHigh resolution modeling for stormwater management. Hydrol. Process. 2017, 31, 2700–2712. [Google Scholar] [CrossRef]
- Di Vittorio, D.; Ahiablame, L. Spatial Translation and Scaling Up of Low Impact Development Designs in an Urban Watershed. J. Water Manag. Model. 2015, 23, 9. [Google Scholar] [CrossRef] [Green Version]
- Potter, K.W. Small-scale, spatially distributed water management practices: Implications for research in the hydrologic sciences. Water Resour. Res. 2006, 42, 2. [Google Scholar] [CrossRef] [Green Version]
- Sitzenfrei, R.; Moderl, M.; Rauch, W. Assessing the impact of transitions from centralised to decentralised water solutions on existing infrastructures—Integrated city-scale analysis with VIBe. Water Res. 2013, 47, 7251–7263. [Google Scholar] [CrossRef] [Green Version]
- Lim, T.C.; Welty, C. Effects of spatial configuration of imperviousness and green infrastructure networks on hydrologic response in a residential sewershed. Water Resour. Res. 2017, 53, 8084–8104. [Google Scholar] [CrossRef]
- Golden, H.E.; Hoghooghi, N. Green infrastructure and its catchment-scale effects: An emerging science. Wiley Interdiscip. Rev.-Water 2018, 5, 14. [Google Scholar] [CrossRef] [Green Version]
- Rodak, C.M.; Moore, T.L.; David, R.; Jayakaran, A.D.; Vogel, J.R. Urban stormwater characterization, control, and treatment. Water Environ. Res. A Res. Publ. Water Environ. Fed. 2019, 91, 1034–1060. [Google Scholar] [CrossRef] [Green Version]
- Lane, S.N. Natural flood management. WIREs Water 2017, 4, e1211. [Google Scholar] [CrossRef] [Green Version]
- Wingfield, T.; Macdonald, N.; Peters, K.; Spees, J.; Potter, K. Natural Flood Management: Beyond the evidence debate. Area 2019, 51, 743–751. [Google Scholar] [CrossRef]
- Jenson, S.K.; Domingue, J.O. Extracting Topographic Structure from Digital Elevation Data for Geographic Information-System Analysis. Photogramm. Eng. Remote Sens. 1988, 54, 1593–1600. [Google Scholar]
- Li, J.; Wong, D.W.S. Effects of DEM sources on hydrologic applications. Comput. Environ. Urban Syst. 2010, 34, 251–261. [Google Scholar] [CrossRef]
- Guo James, C.Y. Off-Stream Detention Design for Storm-Water Management. J. Irrig. Drain. Eng-ASCE 2012, 138, 371–376. [Google Scholar] [CrossRef]
- Carlyle-Moses, D.E.; Gash, J.H.C. Rainfall Interception Loss by Forest Canopies. In Forest Hydrology and Biogeochemistry: Synthesis of Past Research and Future Directions; Levia, D.F., CarlyleMoses, D., Tanaka, T., Eds.; Ecological Studies-Analysis and Synthesis; Springer: Dordrecht, The Netherlands, 2011; Volume 216, pp. 407–423. [Google Scholar]
- Holder, C.D.; Gibbes, C. Influence of leaf and canopy characteristics on rainfall interception and urban hydrology. Hydrol. Sci. J.-J. Sci. Hydrol. 2017, 62, 182–190. [Google Scholar] [CrossRef]
- Mantilla, R.; Gupta, V.K. A GIS numerical framework to study the process basis of scaling statistics in river networks. Ieee Geosci. Remote Sens. Lett. 2005, 2, 404–408. [Google Scholar] [CrossRef]
- Sanders, B.F.; Pau, J.C.; Jaffe, D.A. Passive and active control of diversions to an off-line reservoir for flood stage reduction. Adv. Water Resour. 2006, 29, 861–871. [Google Scholar] [CrossRef]
- Marchese, D.; Johnson, J.; Akers, N.; Huffman, M.; Hlas, V. Quantitative Comparison of Active and Passive Stormwater Infrastructure: Case Study in Beckley, West Virginia. In Proceedings of the WEFTEC, New Orleans, LA, USA, 29 September–3 October 2018. [Google Scholar]
- Open Source Geospatial Foundation. GDAL/OGR Contributors GDAL/OGR Geospatial Data Abstraction Software Library. Available online: https://gdal.org/ (accessed on 28 September 2021).
- Poff, N.L.; Hart, D.D. How dams vary and why it matters for the emerging science of dam removal. Bioscience 2002, 52, 659–668. [Google Scholar] [CrossRef] [Green Version]
- Brewitt, P.K.; Colwyn, C.L.M. Little dams, big problems: The legal and policy issues of nonjurisdictional dams. Wiley Interdiscip. Rev.-Water 2020, 7, 16. [Google Scholar] [CrossRef]
- ESRI. Surface Volume. Available online: https://desktop.arcgis.com/en/arcmap/10.6/tools/3d-analyst-toolbox/surface-volume.htm (accessed on 23 September 2021).
- Gupta, R.S. Hydrology and Hydraulic Systems: Fourth Edition; Waveland Press: Long Grove, IL, USA, 2016. [Google Scholar]
- Devi, G.K.; Ganasri, B.P.; Dwarakish, G.S. A Review on Hydrological Models. Int. Conf. Water Resour. Coast. Ocean Eng. 2015, 4, 1001–1007. [Google Scholar] [CrossRef]
- Rigon, R. Python Resources for Hydrologists. Available online: https://abouthydrology.blogspot.com/2016/11/python-resources-for-hydrologists.html (accessed on 5 May 2021).
- Schellekens, J. OpenStreams Wflow Documentation Release 2019.1. Deltares. Available online: http://wflow.readthedocs.org/en/latest/ (accessed on 23 September 2021).
- Iowa Stormwater Urban Design and Specifications. Ch. 2-Stormwater. 2B-2 Rainfall and Runoff Periods. Iowa SUDAS Des. Man. 2013. Revised edition 2015. Available online: https://intrans.iastate.edu/app/uploads/sites/15/2020/03/2B-2.pdf (accessed on 23 September 2021).
- Del Giudice, G.; Rasulo, G.; Siciliano, D.; Padulano, R. Combined Effects of Parallel and Series Detention Basins for Flood Peak Reduction. Water Resour. Manag. 2014, 28, 3193–3205. [Google Scholar] [CrossRef]
- Babbar-Sebens, M.; Barr, R.C.; Tedesco, L.P.; Anderson, M. Spatial identification and optimization of upland wetlands in agricultural watersheds. Ecol. Eng. 2013, 52, 130–142. [Google Scholar] [CrossRef]
- Tao, T.; Wang, J.; Xin, K.; Li, S. Multi-objective optimal layout of distributed storm-water detention. Int. J. Environ. Sci. Technol. 2014, 11, 1473–1480. [Google Scholar] [CrossRef] [Green Version]
- Bellu, A.; Fernandes, L.F.S.; Cortes, R.M.V.; Pacheco, F.A.L. A framework model for the dimensioning and allocation of a detention basin system: The case of a flood-prone mountainous watershed. J. Hydrol. 2016, 533, 567–580. [Google Scholar] [CrossRef]
- Cimorelli, L.; Morlando, F.; Cozzolino, L.; Covelli, C.; Della Morte, R.; Pianese, D. Optimal Positioning and Sizing of Detention Tanks within Urban Drainage Networks. J. Irrig. Drain. Eng-ASCE 2016, 142, 12. [Google Scholar] [CrossRef]
- Liu, Y.Z.; Theller, L.O.; Pijanowski, B.C.; Engel, B.A. Optimal selection and placement of green infrastructure to reduce impacts of land use change and climate change on hydrology and water quality: An application to the Trail Creek Watershed, Indiana. Sci. Total Environ. 2016, 553, 149–163. [Google Scholar] [CrossRef] [PubMed]
- Bennett, M.S.; Mays, L.W. Optimal Design of Detention and Drainage Channel Systems. J. Water Resour. Plan. Manage.-ASCE 1985, 111, 99–112. [Google Scholar] [CrossRef]
- Park, M.; Chung, G.; Yoo, C.; Kim, J.H. Optimal design of stormwater detention basin using the genetic algorithm. KSCE J. Civ. Eng. 2012, 16, 660–666. [Google Scholar] [CrossRef]
- Ngo, T.T.; Yoo, D.G.; Lee, Y.S.; Kim, J.H. Optimization of Upstream Detention Reservoir Facilities for Downstream Flood Mitigation in Urban Areas. Water 2016, 8, 290. [Google Scholar] [CrossRef] [Green Version]
- Alves, A.; Vojinovic, Z.; Kapelan, Z.; Sanchez, A.; Gersonius, B. Exploring trade-offs among the multiple benefits of green-blue-grey infrastructure for urban flood mitigation. Sci. Total Environ. 2020, 703, 14. [Google Scholar] [CrossRef] [PubMed]
- Singh, A.; Sarma, A.K.; Hack, J. Cost-Effective Optimization of Nature-Based Solutions for Reducing Urban Floods Considering Limited Space Availability. Environ. Process. 2020, 7, 297–319. [Google Scholar] [CrossRef]
- Tarpanelli, A.; Franchini, M.; Brocca, L.; Camici, S.; Melone, F.; Moramarco, T. A simple approach for stochastic generation of spatial rainfall patterns. J. Hydrol. 2012, 472, 63–76. [Google Scholar] [CrossRef]
- Benoit, L.; Allard, D.; Mariethoz, G. Stochastic Rainfall Modeling at Sub-kilometer Scale. Water Resour. Res. 2018, 54, 4108–4130. [Google Scholar] [CrossRef]
- Antolini, F. Python Code for Distributed Attenuation. Available online: https://github.com/federicoantolini/distributed_attenuation (accessed on 23 September 2021).
Figure 1.
Proposed framework for studying the effect of distributed runoff attenuating features.

Figure 2.
Overview of the study area.

Figure 3.
Examples of inline reservoir used as runoff attenuating feature. (a) Simplified cross-section; (b) aerial view of a pond on Clear Creek, IA (courtesy of Iowa Flood Center).
Figure 3.
Examples of inline reservoir used as runoff attenuating feature. (a) Simplified cross-section; (b) aerial view of a pond on Clear Creek, IA (courtesy of Iowa Flood Center).

Figure 4.
Small reservoir modeling consists of (a) identifying locations along streamlines and (b) delineating reservoir footprints using elevation lines.
Figure 4.
Small reservoir modeling consists of (a) identifying locations along streamlines and (b) delineating reservoir footprints using elevation lines.

Figure 5.
Scheme of wflow hydrologic model with the addition of the reservoir routing module (modified from [88]).
Figure 5.
Scheme of wflow hydrologic model with the addition of the reservoir routing module (modified from [88]).

Figure 6.
Reservoir locations for the spatial distributions in Hewett Creek watershed.

Figure 7.
Hydrograph for (a) single large reservoir, DSR 1, and DSR 2 distributions, (b) upstream, (c) midstream, (d) downstream distributions.
Figure 7.
Hydrograph for (a) single large reservoir, DSR 1, and DSR 2 distributions, (b) upstream, (c) midstream, (d) downstream distributions.


Table 1.
Distributions of reservoirs used in the analysis.
| Distribution | Description | Number of Reservoirs | Capacity [m3] | Regulated Drainage [km2] |
|---|---|---|---|---|
| Baseline | No reservoir | 0 | 0 | 0 |
| Single Reservoir | One large reservoir (ID 601667) near the outlet | 1 | 87,258 | 39.13 |
| DSR 1 | Reservoirs on reaches of Strahler order 3, 4 and 5, scattered across the watershed | 6 | 87,819 | 8.03 |
| DSR 2 | Same as DSR 1, with the addition of Single Reservoir | 7 | 175,077 | 39.13 |
| Upstream Parallel | Reservoirs on reaches of Strahler order < 5, in the upstream region of the watershed; all reservoirs in parallel | 15 | 300,611 | 5.16 |
| Midstream Parallel | Reservoirs on reaches of Strahler order < 5, in the midstream region of the watershed; all reservoirs in parallel | 23 | 300,649 | 5.06 |
| Downstream Parallel | Reservoirs on reaches of Strahler order < 5 in the downstream region of the watershed; all reservoirs in parallel | 17 | 300,916 | 5.02 |
| Upstream Series | Reservoirs on reaches of Strahler order < 5, in the upstream region of the watershed; some reservoirs in series on longer reaches | 12 | 300,520 | 8.56 |
| Midstream Series | Reservoirs on reaches of Strahler order < 5, in the midstream region of the watershed; some reservoirs in series on longer reaches | 23 | 300,267 | 9.26 |
| Downstream Series | Reservoirs on reaches of Strahler order < 5, in the downstream region of the watershed; some reservoirs in series on longer reaches | 19 | 300,639 | 7.64 |
Table 2.
Geometric characteristics of regulated areas and reaches for in-parallel and in-series distributions.
Table 2.
Geometric characteristics of regulated areas and reaches for in-parallel and in-series distributions.
| Region | Upstream | Midstream | Downstream | |||
|---|---|---|---|---|---|---|
| Total reach length (Strahler < 5) | 29.70 | 55.01 | 50.08 | |||
| Distributions | parallel | series | parallel | series | parallel | series |
| Total length of regulated reaches [km] (% of total reaches) | 11.71 (39.4%) | 10.21 (34.4%) | 19.40 (35.3%) | 23.91 (43.5%) | 17.77 (35.5%) | 18.32 (36.6%) |
| Regulated drainage [km2] | 5.16 | 8.56 | 5.06 | 9.26 | 5.02 | 7.64 |
Publisher’s Note: MDPI stays neutral with regard to jurisdictional claims in published maps and institutional affiliations. |
© 2021 by the authors. Licensee MDPI, Basel, Switzerland. This article is an open access article distributed under the terms and conditions of the Creative Commons Attribution (CC BY) license (https://creativecommons.org/licenses/by/4.0/).
Share and Cite
MDPI and ACS Style
Antolini, F.; Tate, E. Location Matters: A Framework to Investigate the Spatial Characteristics of Distributed Flood Attenuation. Water 2021, 13, 2706. https://doi.org/10.3390/w13192706
AMA Style
Antolini F, Tate E. Location Matters: A Framework to Investigate the Spatial Characteristics of Distributed Flood Attenuation. Water. 2021; 13(19):2706. https://doi.org/10.3390/w13192706
Chicago/Turabian StyleAntolini, Federico, and Eric Tate. 2021. "Location Matters: A Framework to Investigate the Spatial Characteristics of Distributed Flood Attenuation" Water 13, no. 19: 2706. https://doi.org/10.3390/w13192706
Note that from the first issue of 2016, this journal uses article numbers instead of page numbers. See further details here.