
The Dynamic Change and Effect of Rainfall Induced Groundwater Flow


1
Faculty of Transportation Engineering, Kunming University of Science and Technology, Kunming 650500, China
2
Faculty of Architectural Engineering, Kunming University of Science and Technology, Kunming 650500, China
3
Faculty of Land and Resources, Kunming University of Science and Technology, Kunming 650093, China
*
Author to whom correspondence should be addressed.
Water 2021, 13(19), 2625; https://doi.org/10.3390/w13192625
Submission received: 7 September 2021
/
Accepted: 20 September 2021
/
Published: 24 September 2021
(This article belongs to the Section Hydrology)
Abstract
:This study aims to analyze the groundwater flow changes caused by rainfall and its influence on slope stability. Taking the slope in Dingjiafen, Chuxiong, Yunnan, China as the study area, the study monitored the data of rainfall and drew upon the calculation module of ArcGIS to predict the change of the groundwater flow and water level fluctuation in the soil. In this way, the visual simulation of groundwater flow distribution of the slope was realized; and the influence of groundwater flow distribution caused by rainfall seepage on the slope’s stability was also analyzed. The results indicate that: (1) the rainfall recharge rate is affected by the thickness of the soil layer, the slope, the rainfall intensity, and the initial water content of the soil; (2) the seepage flow of rainfall in per unit time is positively correlated with the soil layer thickness of the slope; (3) the groundwater is repeatedly raised, maintained, and dissipated by periodic rainfall which destroys the structure of the soil; and (4) the rainfall reduces the cohesion and internal friction angle of the soil resulting in the “muddy water softening effect” in the weak zone.
1. Introduction
Most slope instability is directly related to rainfall. For example, on 31 March 2017, in the city of Mocoa, the capital of Putumayo province in southwestern Colombia, rainfall caused a mudslide, leading to the collapse of many houses and bridges as well as traffic stagnation. As a result, 321 people were killed, and 103 people went missing [1]. On 30 May 2017, floods and landslides caused by heavy rains resulted in 180 deaths and more than 100 missing persons in Sri Lanka, where hundreds of thousands of families were affected by the disaster [2]. In 2017, the “6•24” landslide disaster in Maoxian County, Sichuan Province caused 10 deaths and 73 loss of contact [3,4]. On 1 July 2017, Wangjiawan Formation in Ningxiang County, Hunan Province, caused a landslide due to a long period of rare heavy rainfall, causing 9 deaths and 19 injuries [5]. The stability of natural and artificial slopes is particularly important for human life, urban planning, and infrastructure operation and management. The dynamic changes of groundwater flow caused by rainfall are important to the study of slope stability.
Many theories have been proposed to study the slope stability, such as the SINMAP model [6], the SHALSTAB model [7], the TRIG RS model [8], the SLIP model [9], etc. Different factors were considered in these theories (e.g., the characteristics of the soil, the slope, the vegetation cover, the rainfall intensity, and the initial water content of the soil) [10,11,12,13]. Thereinto, the rainfall is one of the most important factors influencing the slope stability [14,15,16]. Daniel Dourte et al. [17] believed that heavy rains increased runoff and reduced groundwater recharge. However, Wenbo Zheng et al. [18] believed that the first extreme rainfall contributed the most to groundwater and could effectively replenish groundwater in deep soil layers. The study of relationship between the distribution of groundwater and slope stability can provide the theoretical basis for an Early Warning System in cases of slope instability [19,20].
ArcGIS is a powerful software that includes many geographic information system (GIS) technologies, and it also allows users to perform secondary development [21,22]. It can be used to simulate complex numerical calculations as well. Junghwan Kim [23] et al. proposed a model to predict rainfall-induced landsides by using ArcGIS, and the model was verified by an actual slope failure case.
The relationship between the distribution of groundwater flow caused by rainfall and slope stability has not been fully studied. Hence, this paper uses ArcGIS to simulate the change in groundwater flow and groundwater level caused by rainfall seepage and utilizes the data to realize the visualization of groundwater flow distribution. On this basis, the impact of the rainfall seepage process and the distribution of water level and flow on slope stability is analyzed. Because the slope seepage zone and unsaturated zone are interrelated with the changes of groundwater level, the progress of rainfall and the passage of time, the distribution of groundwater in the slope will change. Some potential landslides that are more sensitive to rainfall seepage will change the rock and soil stress, which will lead to the instability of the slope.
2. The Study Area
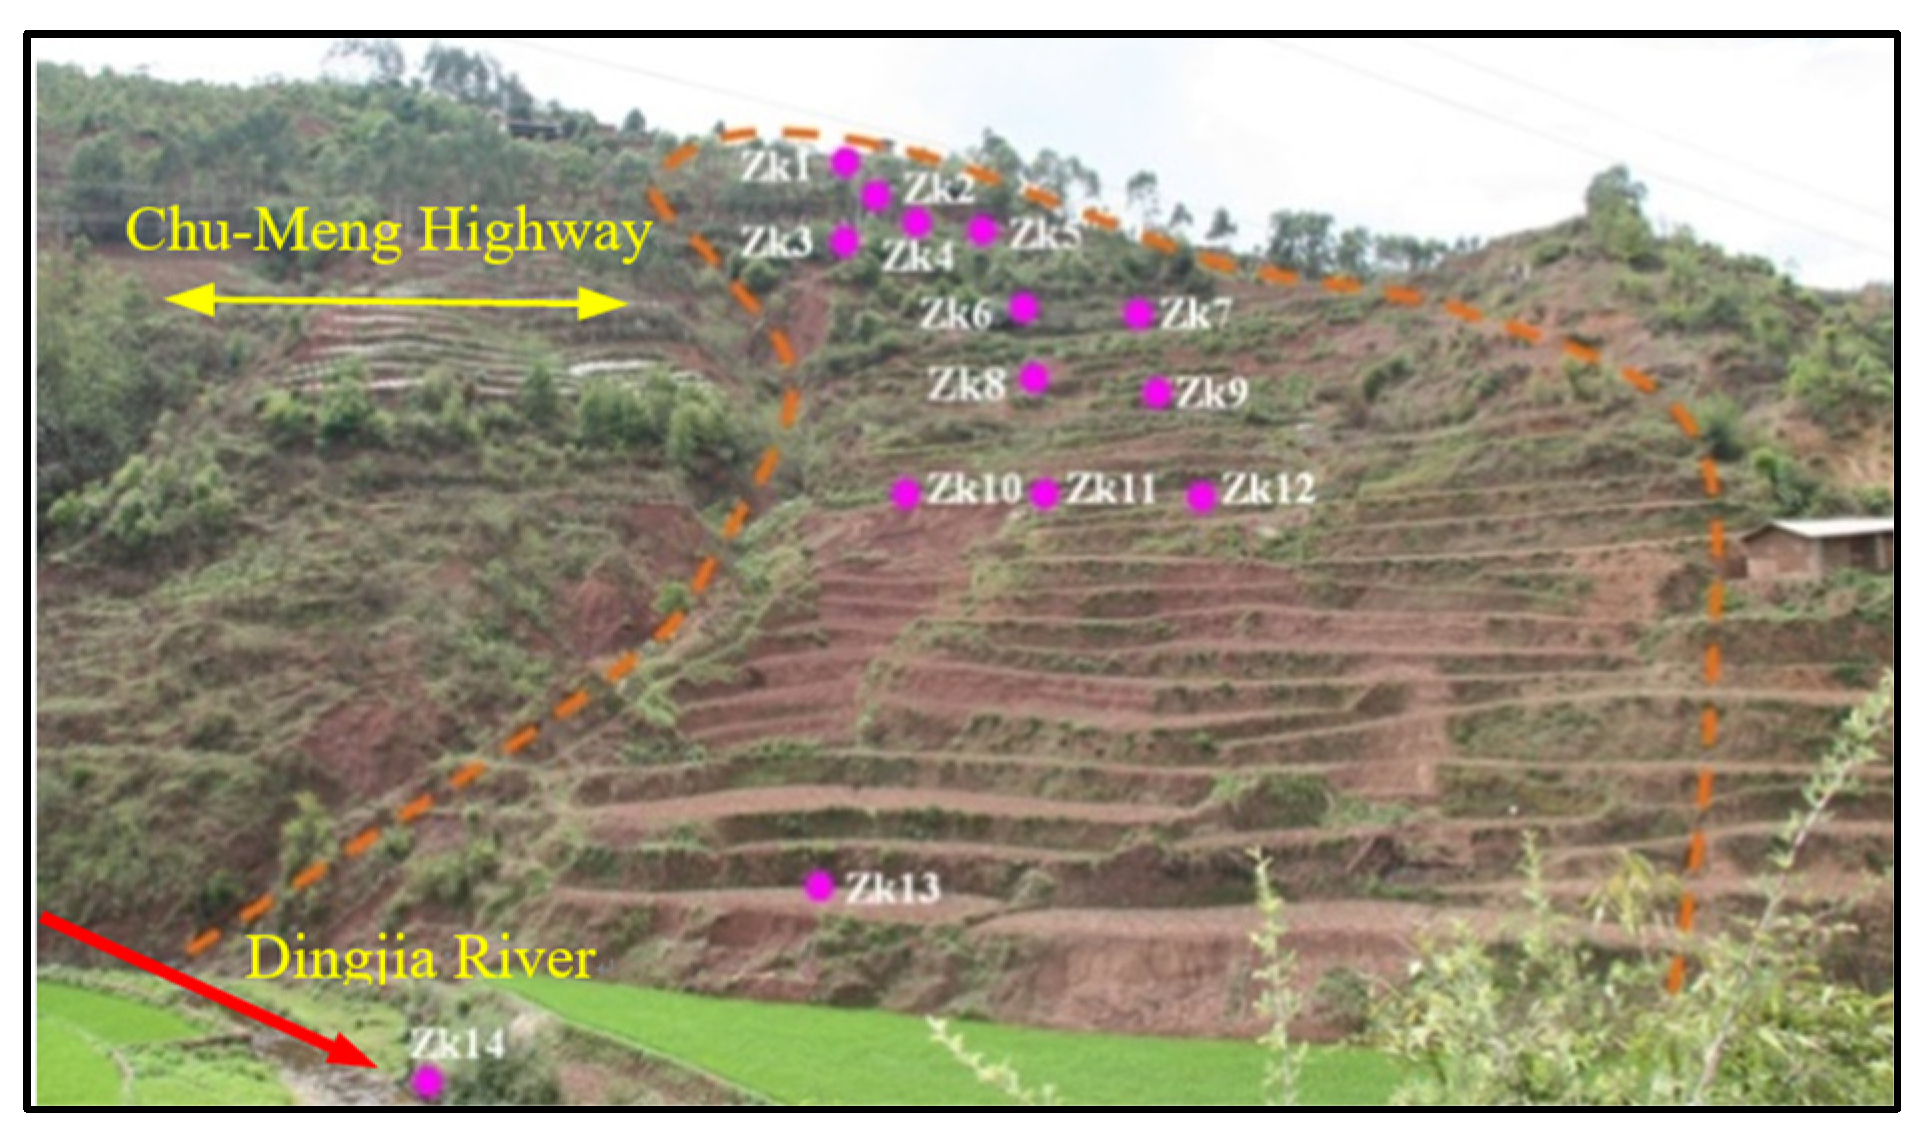
The natural slopes on both sides of the Chu-Meng Highway K64 + 200 (CMH-slopes) on the southwest side of Dingjiafen Village, Shuangbai County, Yunnan Province, China, is taken as the study area, as shown in Figure 1. The annual average temperature and rainfall in the area where the CMH-slopes are located is 15 °C and 700–800 mm, respectively. The steepness of the CMH-slopes is between 15° and 25°, and the altitude is between 1752.5–1875 m. Groundwater mainly occurs in the quaternary residual slope breccia-bearing silt clay layer, breccia soil layer and bedrock crack. The groundwater types are mainly pore water and fissure water. The surface water system is mainly the Dingjia River below the slope, but its impact on the slope is small, and it is mainly recharged by atmospheric precipitation.
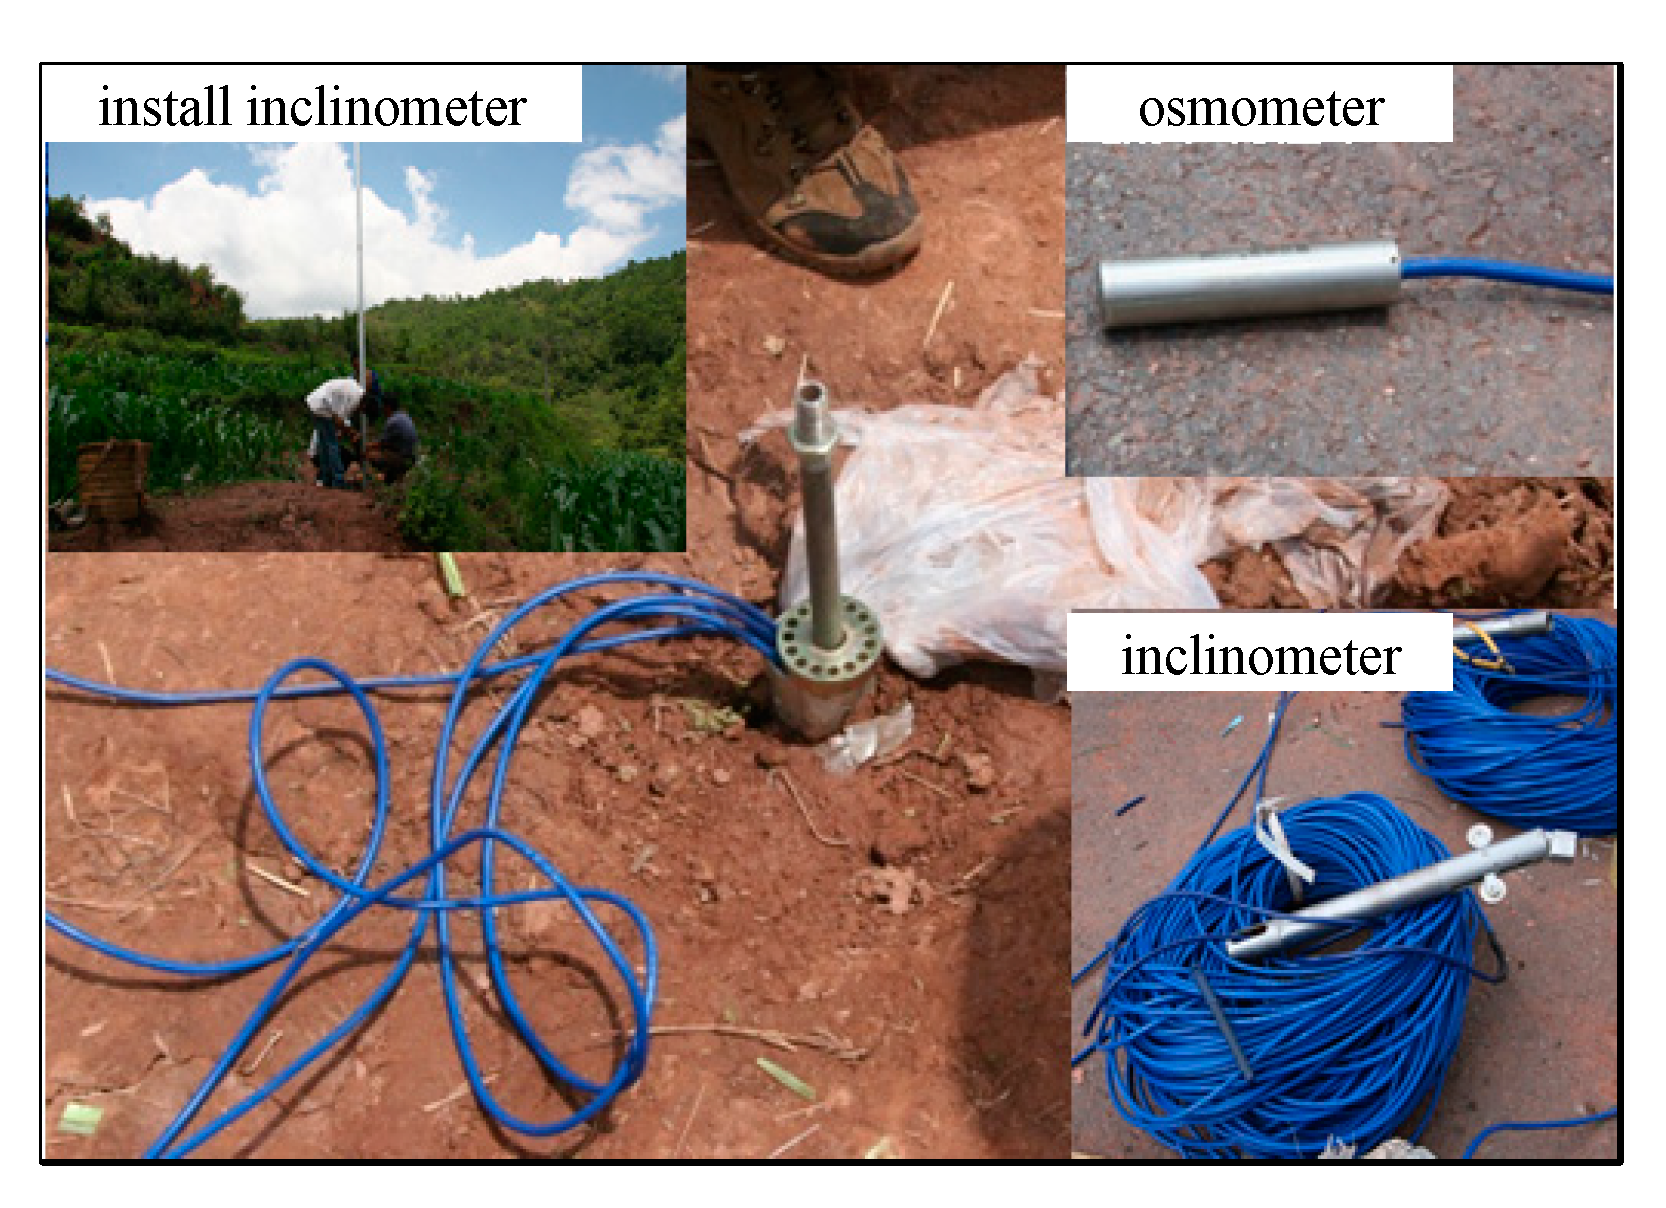
In order to analyze changes in the groundwater level and flow of CMH-slopes, the meteorological and hydrological data of the slope area were monitored, and the distribution characteristics and physical mechanical properties of the slope rock and soil were analyzed by drilling and sampling. The groundwater level, ground surface and underground displacement were measured. Relevant data, such as slope underground displacement, water level change, and physical and mechanical properties of the soil, were obtained by inclinometers and piezometers that are representative boreholes, as shown in Figure 2.
3. Analysis of Rainfall Recharge
3.1. Slope Hydrological Model
Rainfall seepage will cause changes in groundwater level and flow of the slope, and the stability of the CMH-slopes will be influenced by the amount of the groundwater that is converted by rainwater. According to Sangrey et al. [24], groundwater recharge is mainly affected by factors such as temperature, rainfall, and slope characteristics.
where R is the rainfall recharge; P is the rainfall; QR is the surface runoff; E is the evaporation; Sj is the rainfall interception; St is the water storage; S is the bedrock seepage.
Due to continuous rainfall, E is negligible compared to rainfall; the groundwater recharge can be estimated based on the storage time. St refers to rainfall seepage and the deficit of unsaturated soil water content, insomuch that St can be ignored. In addition, the sliding surface is generally a clayey soil layer, which can be considered as an impermeable layer, so the bedrock seepage volume (S), is zero; while QR is only related to P seepage volume (IR) and Sj is:
Substituting, E = 0, S = 0, St = 0, and Formula (2) into Formula (1), so:
That means R is equal to IR, and IR depends on the characteristics of the slope soil, the thickness of the soil layer, the rainfall intensity and characteristics, the slope, etc., and IR is related to the time of rainfall.
3.2. Rainfall Seepage Recharge Estimation
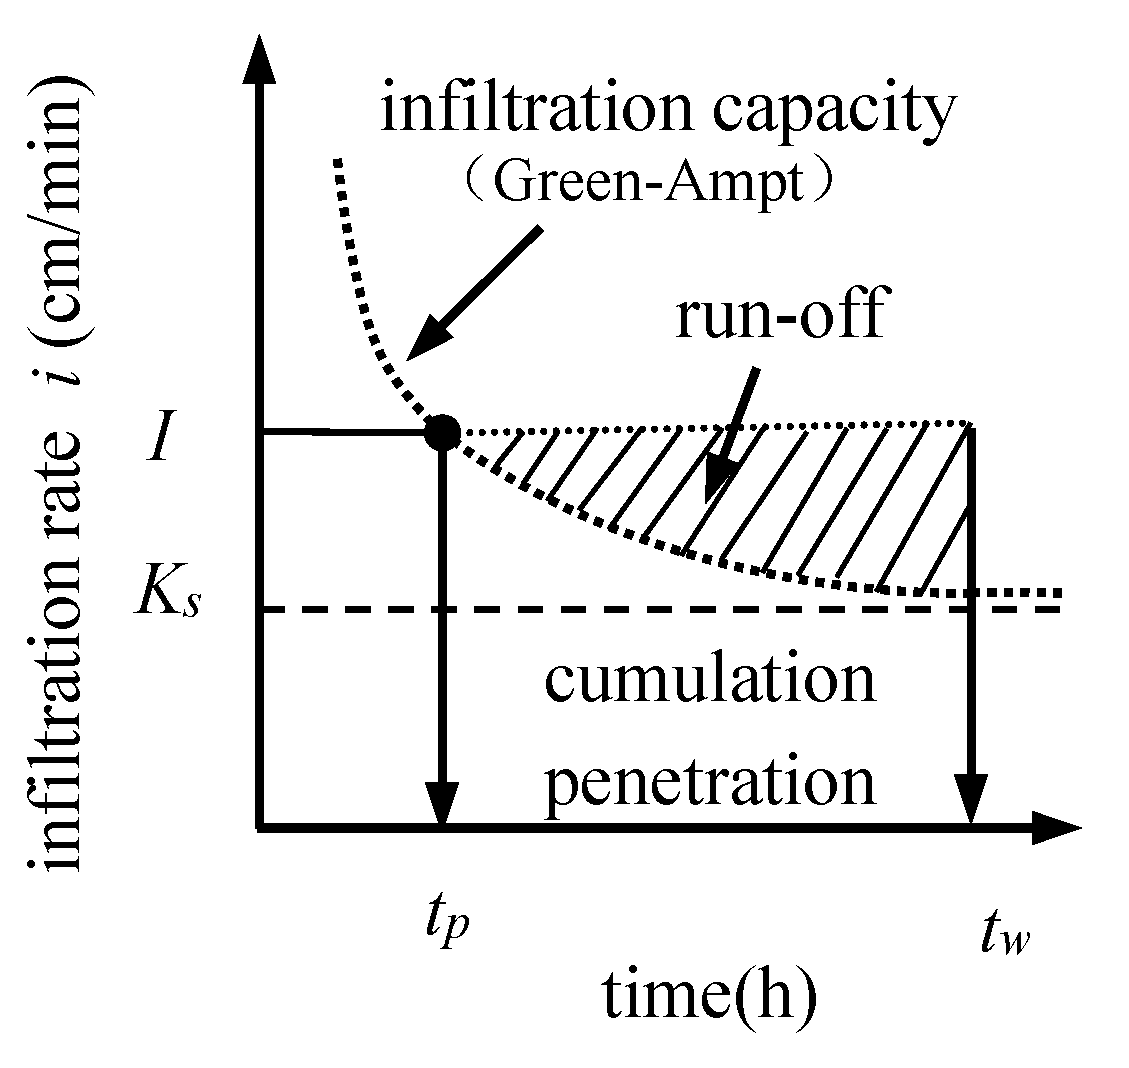
The stability of the slope is analyzed by comprehensively considering the changes of groundwater level and flow, and the downward movement of the wet front caused by rainfall seepage. The Mein and Larson (1973) rainfall seepage model [25] was used to make the calculation of rainfall seepage and surface runoff more accurate, and also IR, namely R, which as an input variable to calculate the groundwater flow, was estimated by considering the characteristics of unsaturated soil. It assumed that the volumetric water content and deficit water content before and after the wet front were kept constant. When I is greater than the saturated permeability coefficient (KS), the rainfall seepage changes with time, as shown in Figure 3.
In the early stage of rainfall, the soil moisture content of the slope is low, and the permeability of the soil is large. When the permeability is greater than the rainfall intensity, the rainfall will fully penetrate into the slope soil; meanwhile, the seepage rate is equal to the rainfall intensity; as the cumulative seepage volume gradually increases, the water content of slope seepage zone and unsaturated zone will also gradually increase, and the permeability of the soil will gradually decrease. After a certain degree, the permeability of the soil is less than the rainfall intensity, and surface water or runoff is formed, at this time, so the seepage rate is saturated seepage rate. Hydrops will be produced when the accumulated rainfall seepage reaches Ip [25]:
where KS stands for the saturated permeability coefficient; I stands for the rainfall intensity; θ0 stands for the initial volumetric water content; θS stands for the saturated volumetric water content; Sf stands for the suction at the wet front; Zp stands for the rainwater seepage depth when the water starts to accumulate, and the deficit water content is .
Hydrops occurs during the period between rainfall seepage and runoff. The time of hydrops can be expressed as:
When the rainfall intensity is greater than the seepage capacity of the soil, the accumulated seepage is:
where is the duration of rainfall.
The depth of the wet front in the unsaturated zone can be expressed as:
The recharge of groundwater by rainfall will increase the hydrodynamic pressure and hydrostatic pressure of the slope. When rainwater penetrates into the surface of weakly permeable bedrock or the water-resistant clay layer and stagnates, the soil within a certain range will be soaked by groundwater that is converted by rainfall to form a weak sliding surface, which will promote and accelerate the potentially instability of slopes.
4. Groundwater Flow Analysis
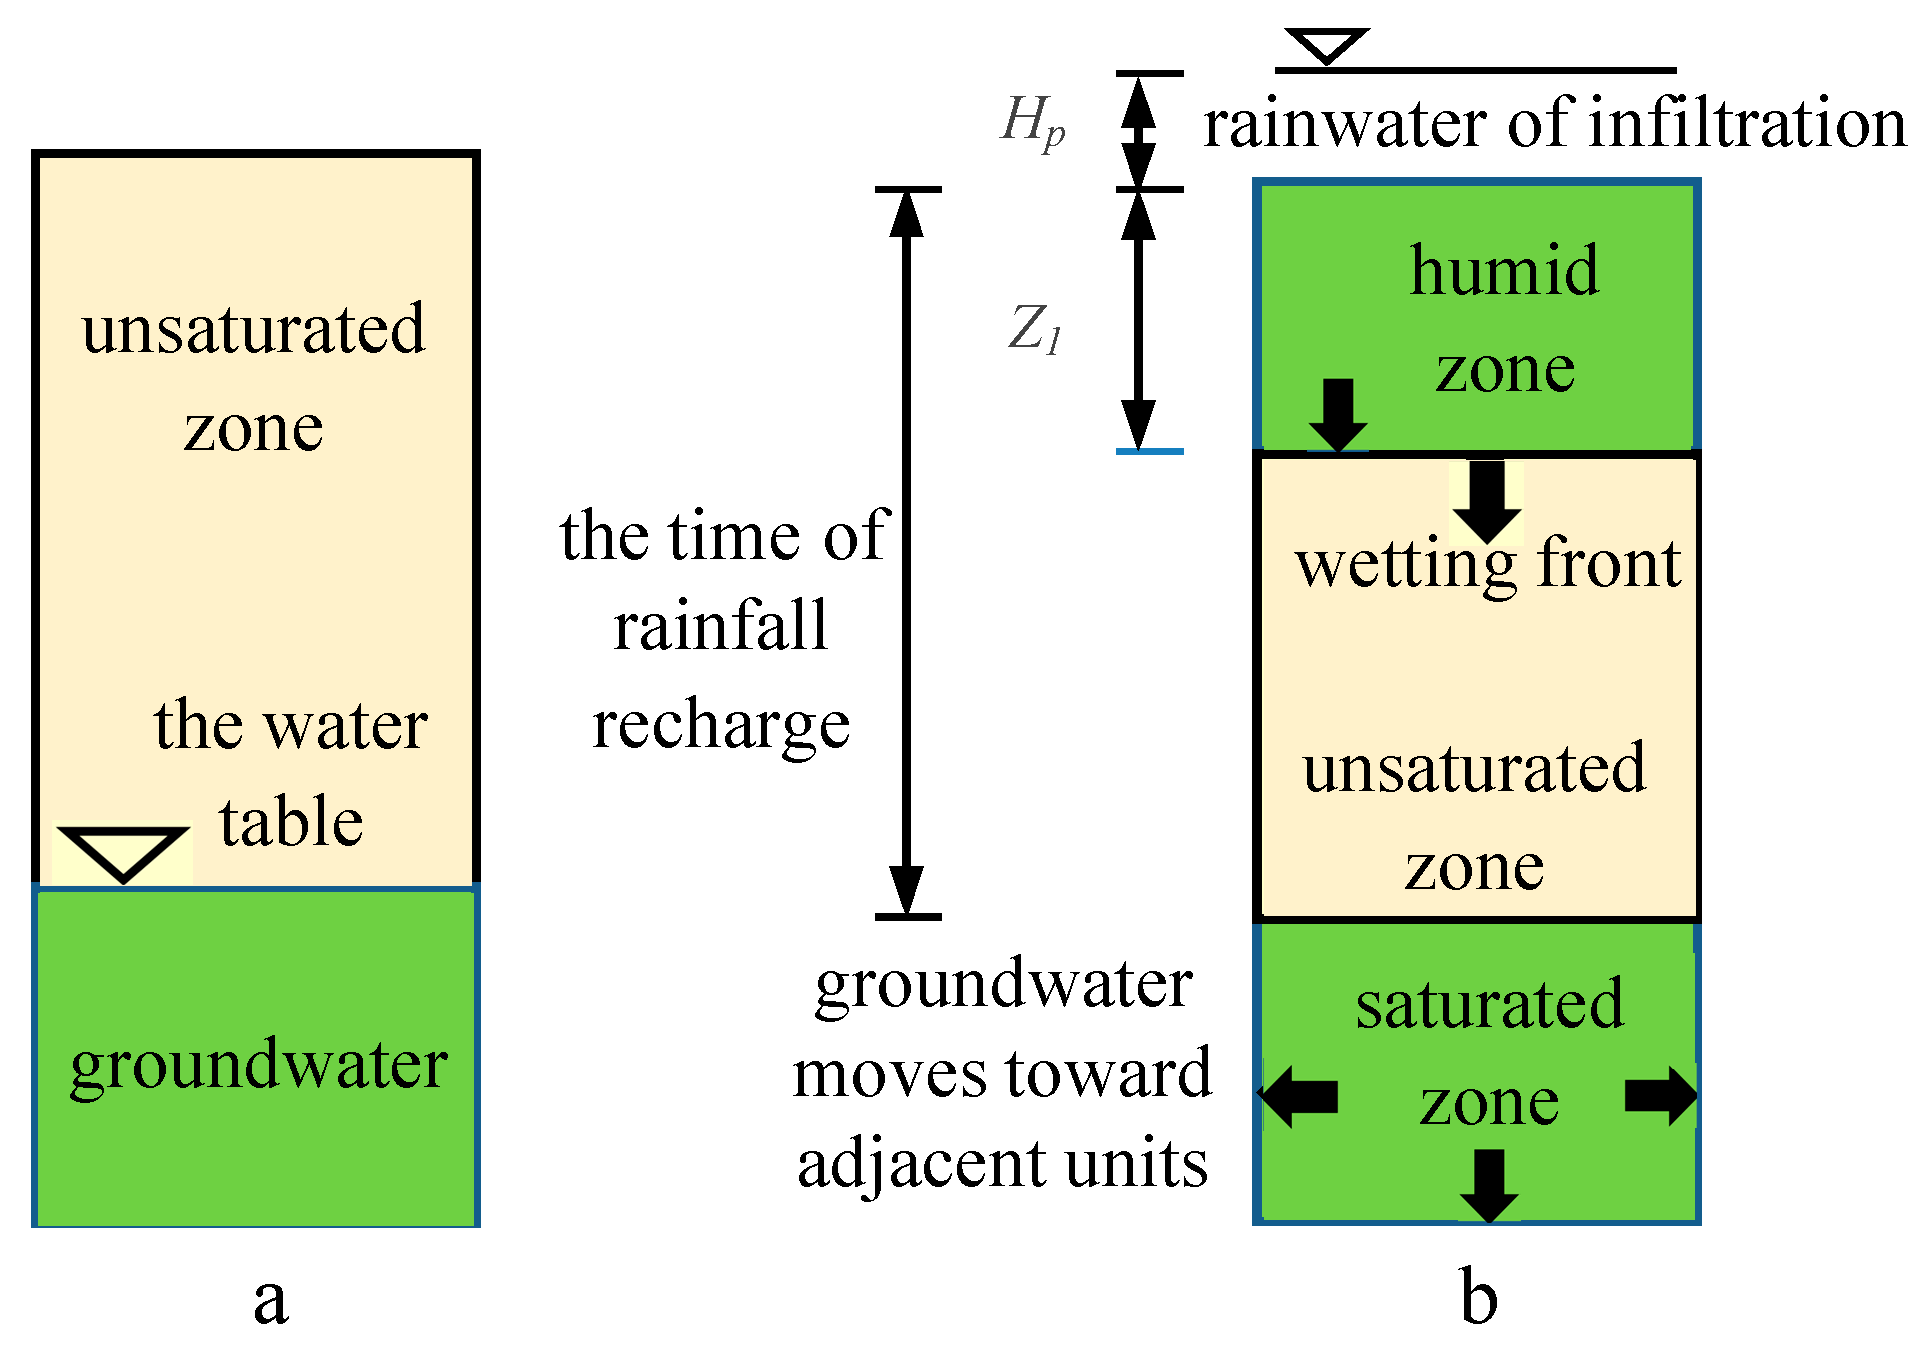
It is assumed that the soil layer of the slope is homogeneous. With the seepage of rainwater in the slope, it appears in the vertical direction of the slope in the sequence: rainwater-soaked zone, unsaturated zone and saturated zone, as shown in Figure 4.
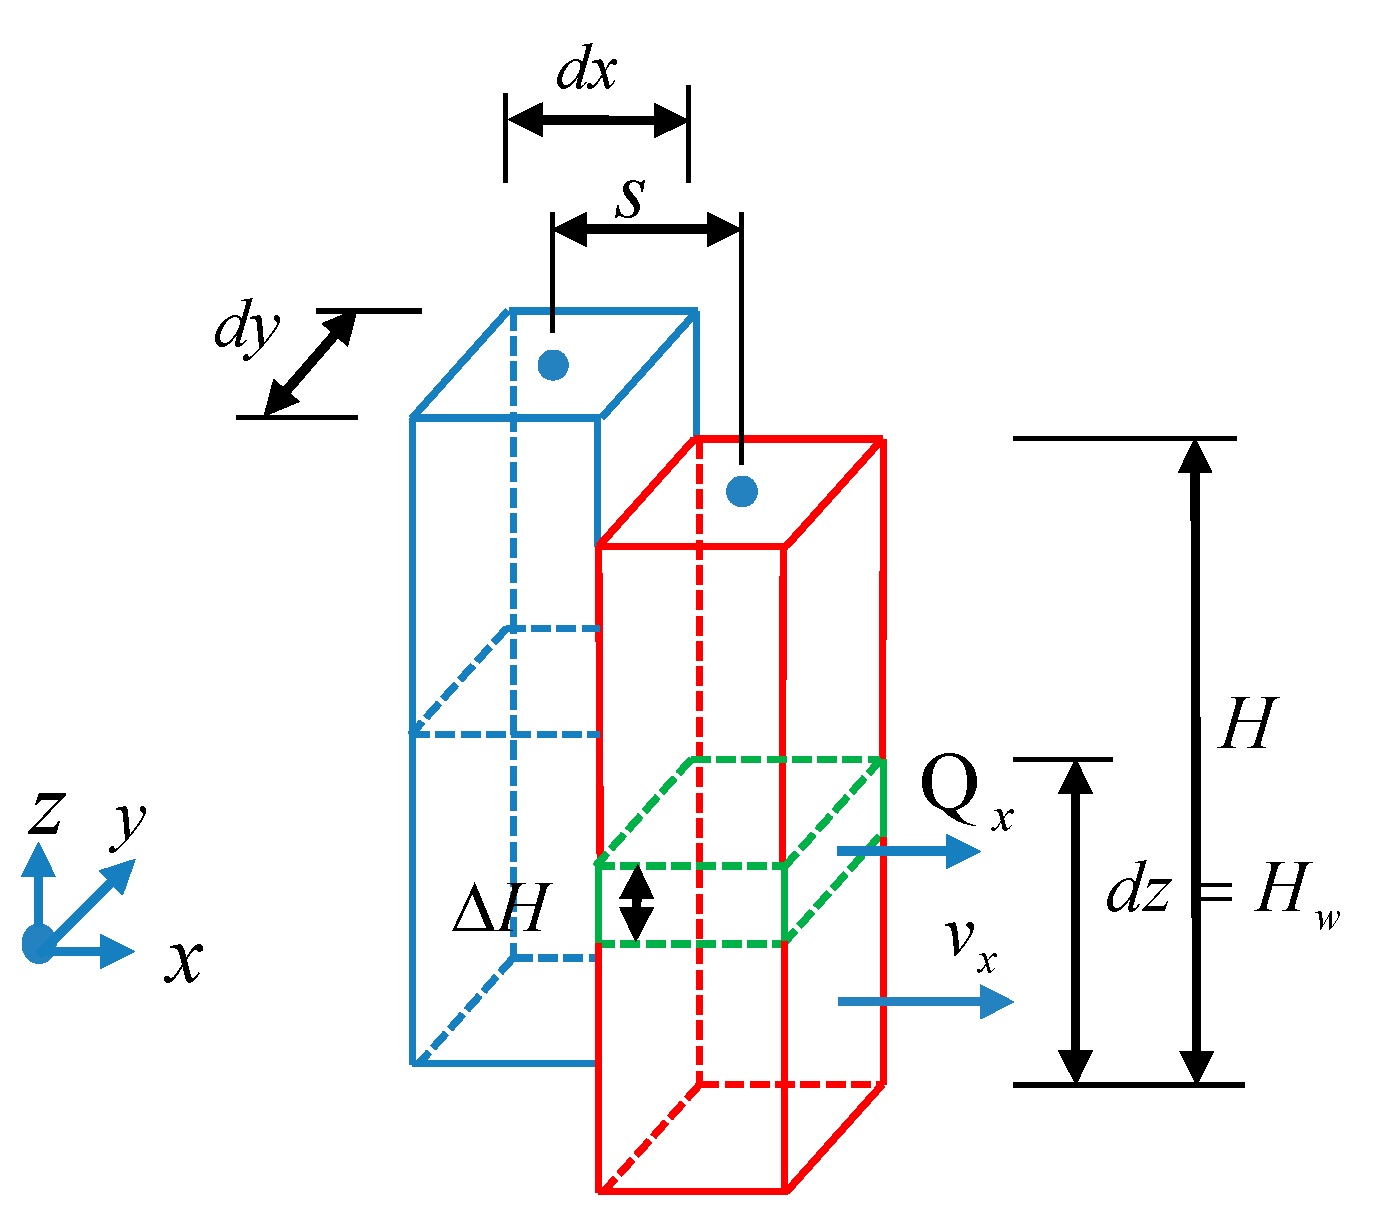
The storage time needs to be considered when rainfall seepage is transformed into groundwater, namely the time for rainwater to penetrate into the groundwater and flow through the unsaturated zone. When rainwater seeps and recharges into the saturation zone, the groundwater will cause horizontal and vertical seepage shift, simultaneously. IR is as an input variable used to calculate the flow of groundwater in this paper, and it assumes that: (1) the volumetric water content near the groundwater level is kept as a constant; (2) the aquifer is uniform; (3) the rainfall recharge is nonuniform and changes with time; (4) the groundwater only flows below the groundwater level. When rainwater flows through the seepage zone, the unsaturated zone, and the saturated zone, the rainwater is stored in the small pores of the slope soil. The inflow and outflow of the water in the small pores of the soil are kept in balance, and it means that the flow rate is regarded as a constant, and the steady state groundwater flow is described by Darcy’s law and the Laplace equation, as shown in Equations (8) and (9) and Figure 5.
where v is the seepage velocity; k is the permeability coefficient; i is the hydraulic gradient; s is the centering distance in each unit (); and h is the water head through the corresponding horizontal distance of the soil layer.
It is assumed that the pore water pressure is constant, so, the total flow through the unit in the direction per unit time (Figure 5) can be written as:
where is the hydraulic gradient; β is the surface slope; and Hw is the height of the groundwater level in the unit ().
The total flow out of the unit can be converted to the height in Equation (10):
It is assumed that the total flow out of the slope unit is only affected by the adjacent unit. Therefore, the groundwater flow can be calculated by changing the height of the groundwater level in the adjacent slope unit. The total permeation of recharge into the groundwater is calculated by Equation (6), and the change in time of each unit can be expressed by Equation (11). Considering the storage time from the ground surface through the groundwater level and the unsaturated zone, the change of groundwater level in each unit is as follows:
where βi indicates the surface slope of a unit; Hi indicates the height of the groundwater level in a unit.
5. Simulation Analysis and Discussion
According to the site survey and geotechnical test data, the initial water content of the slope soil is 19.2%; the saturated volumetric water content is 28.8%; and the saturated permeability coefficient, KS, is 0.84 cm/min.
5.1. Monitoring Data
5.1.1. Rainfall Data
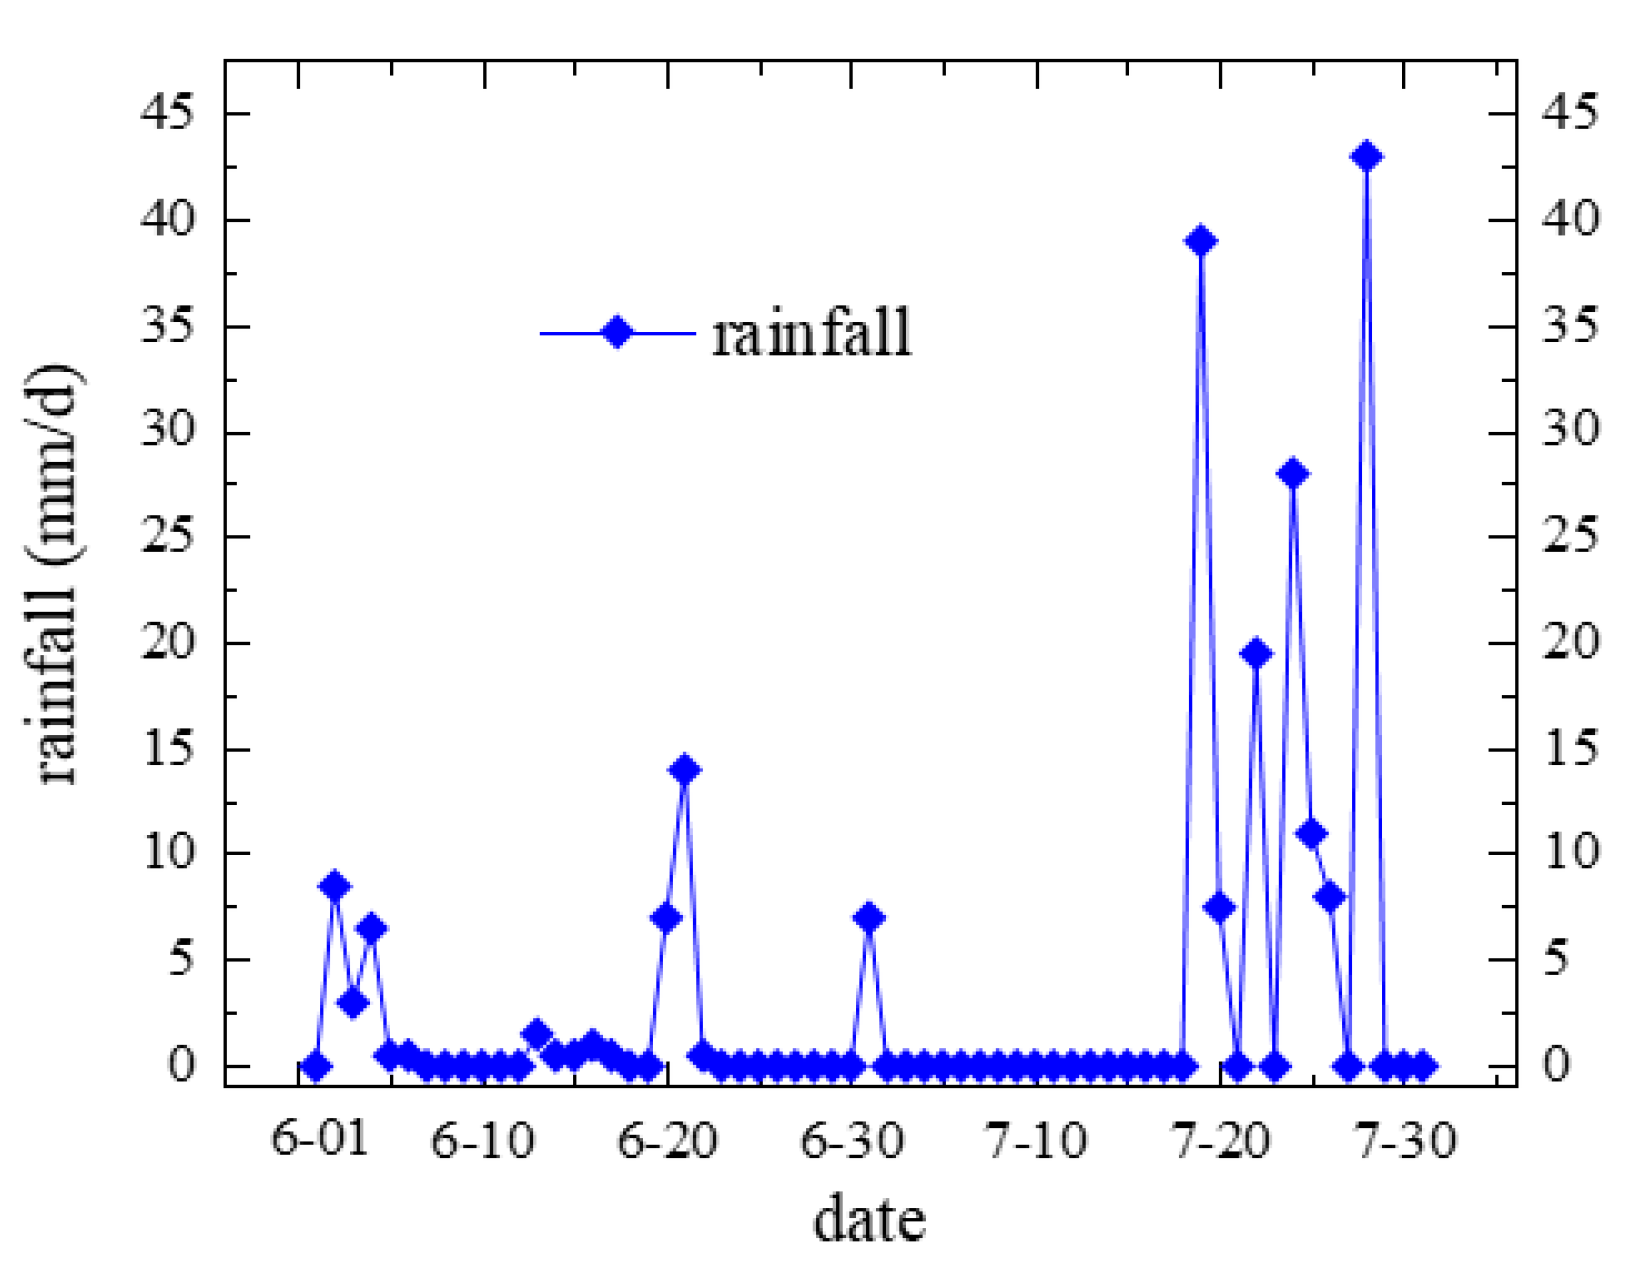
Based on the rainfall monitoring data in June and July, 2010 (Figure 6), the stability of the slope was calculated and analyzed. The cumulative rainfall was 44.5 mm in June, and the cumulative rainfall was 163 mm in July. The rainfall is 43 mm/d on July 28, which is the maximum daily rainfall in June and July.
5.1.2. Groundwater Level
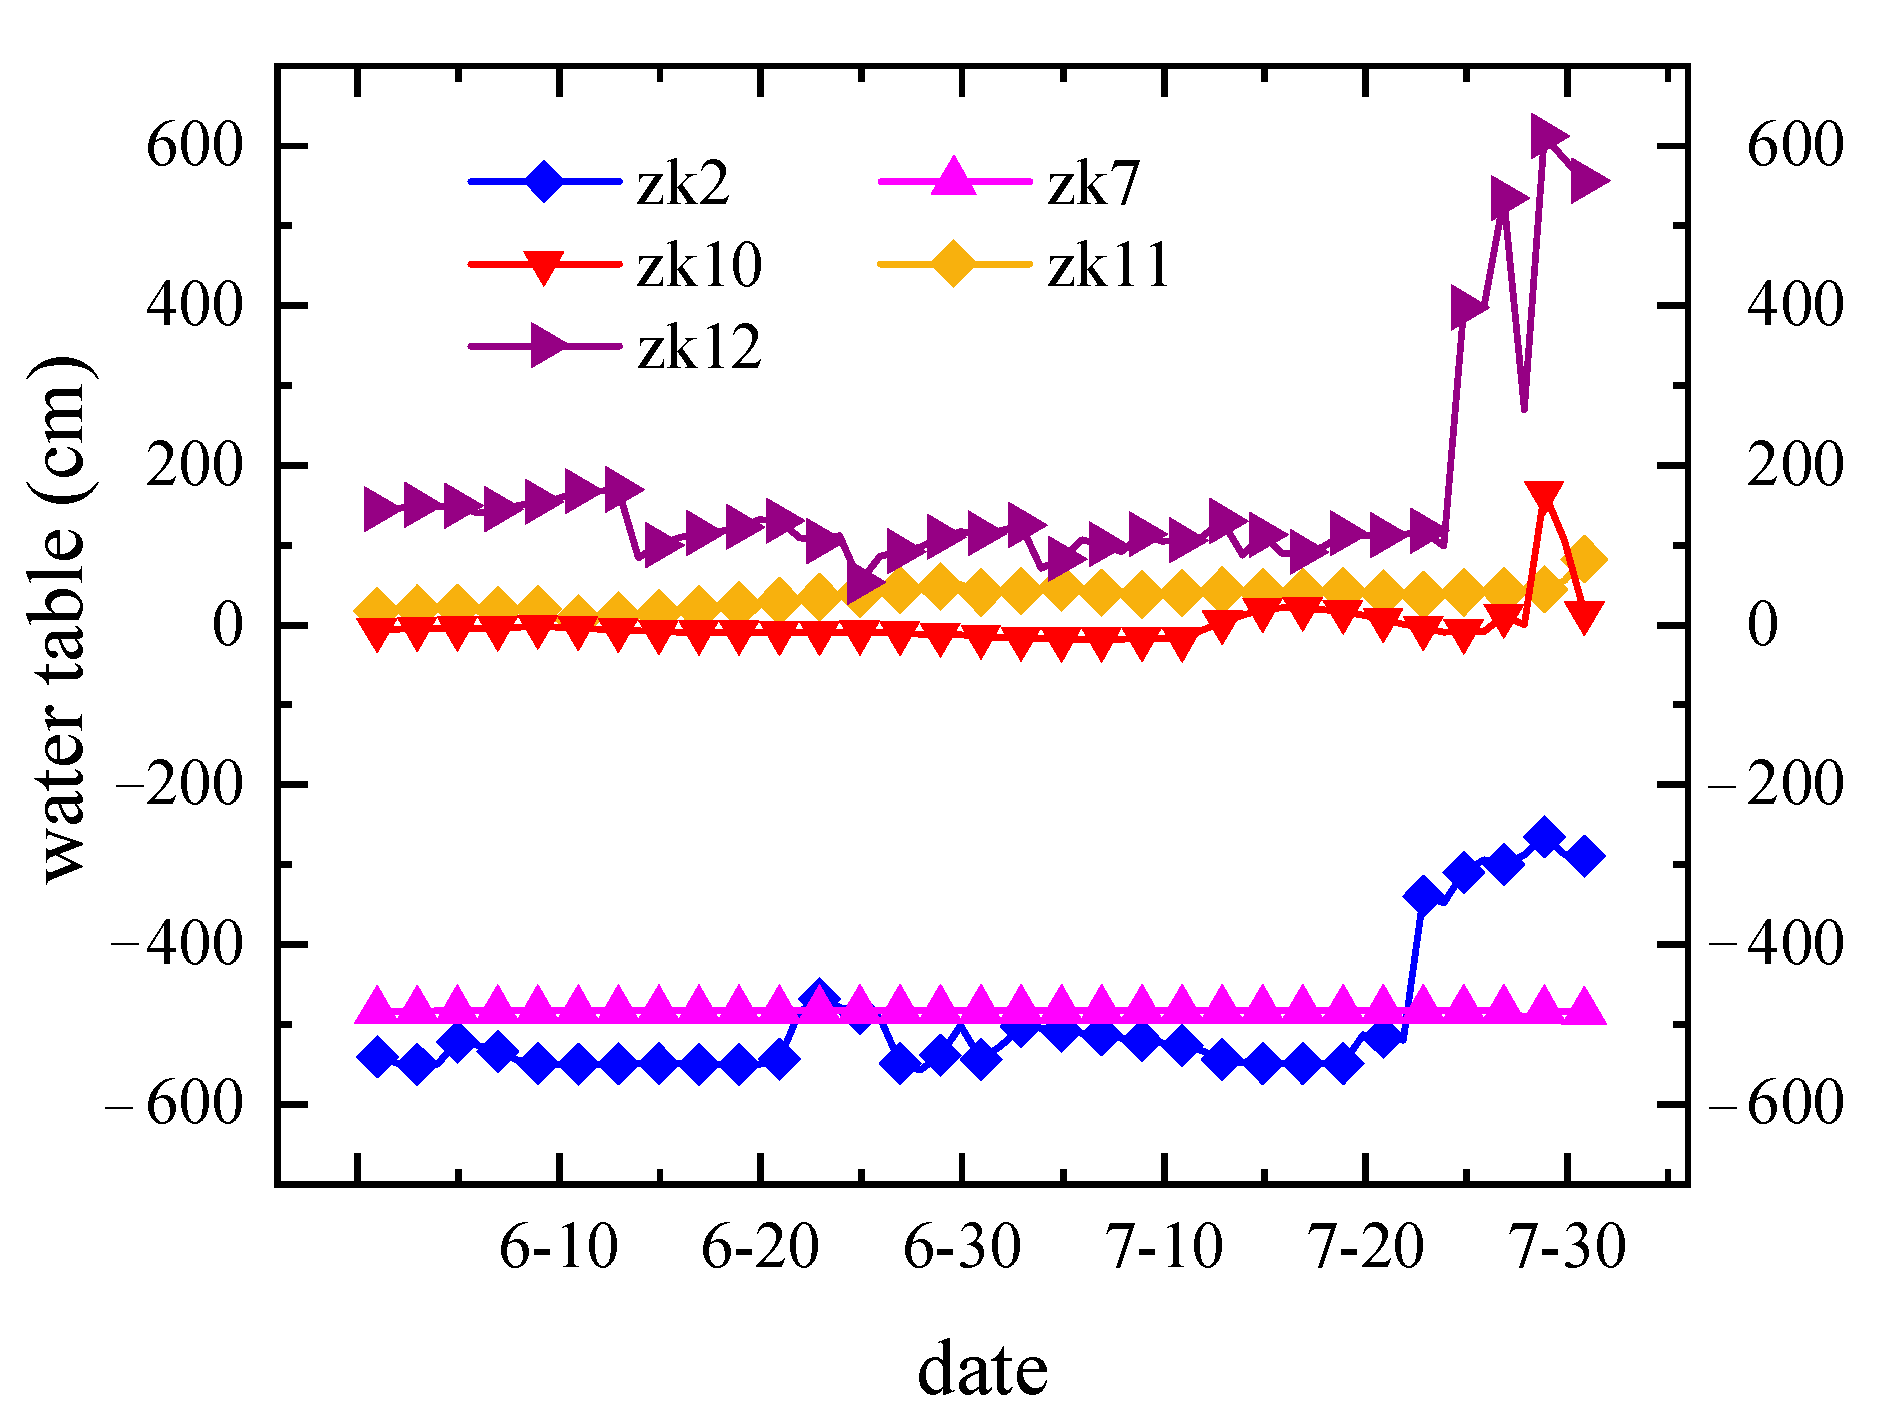
Monitored points of groundwater level are deployed on the slope of the study site, as shown in Figure 1. The groundwater level changes of each point corresponding to the rainfall time are shown in Figure 7; it is found that the groundwater level of each point has a rising trend after rainfall by comparing the curve trend of Figure 6 and Figure 7, and the rising time of the water level obviously lags behind the rainfall time. It shows that the flow path has a certain interception, absorption, and storage effect on rainwater in the process of rainwater seepage, and the rainwater cannot seep into the groundwater in time.
5.1.3. Underground Displacement
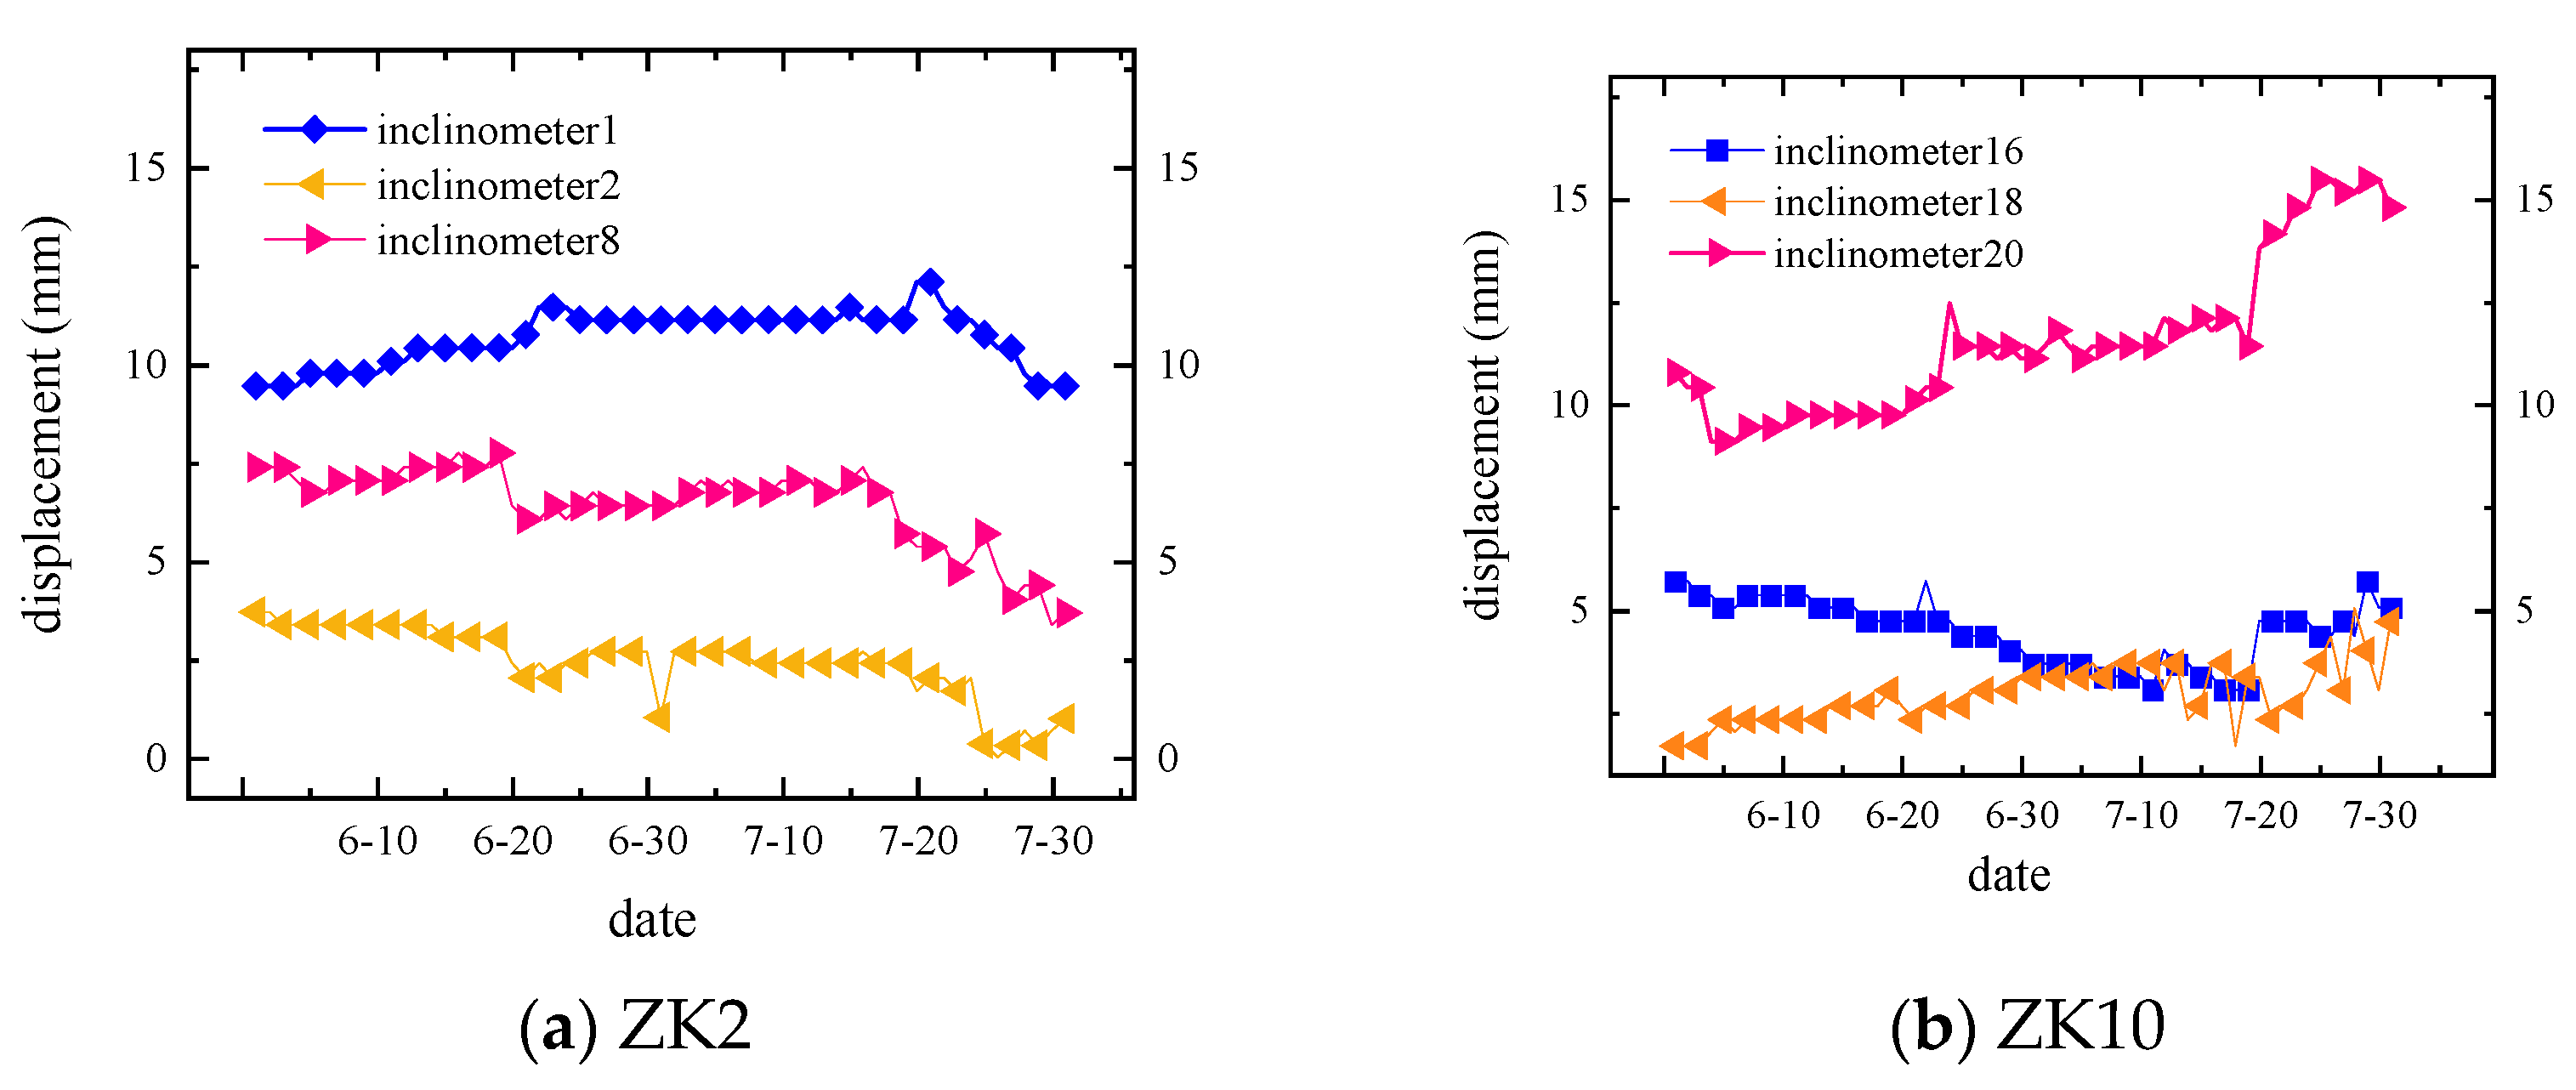
The underground displacement data of ZK2 in the top of the slope and ZK10 in the middle of the slope were taken as examples, and the relationship between the underground displacement and rainfall data was analyzed. Three inclinometers were arranged in the same borehole at different depths. The underground displacement in June and July, 2010, is shown in Figure 8. It can be seen that the deformation of the underground displacement (displacement of horizontal and vertical) was obvious during the rainfall period or later period, and indicated that the rainfall seepage process will cause the displacement of the soil in the deep part of the slope.
5.2. Rainfall Seepage Analysis
From the slope monitoring of the study site as shown in Figure 6 and Figure 7, it is noteworthy that the process of rainfall seepage and recharge of groundwater obviously lag behind the precipitation process, because: (1) the rainwater is intercepted by the vegetation covering the slope when the rainfall falls on the slope surface; (2) the rainwater needs to supplement the slope wetting belt and unsaturated zone; (3) the rainwater penetrates directly into the groundwater flow through the slope macropore network channel; (4) the rainwater flows away along the slope. Therefore, the conversion of rainwater into groundwater has a certain delayed effect.
The initial water content of the slope soil also has a significant impact on the delayed recharge of rainwater seepage. Because the water holding requirements of rainwater that flow through the soil body of the slope are satisfied, the water beyond its water holding capacity will seep, hence, the lower the water content of the slope soil at the initial stage of rainfall, the longer the lag time for the seepage and recharge of groundwater rise; the greater the water content of the slope soil at the beginning of rainfall, the shorter the lag time for the seepage and recharge of groundwater rise.
From the above analysis, it can be seen that the distribution of groundwater flow caused by rainfall is mainly affected by the thickness of the slope soil layer, permeability coefficient, pore structure, soil particle structure and rainfall intensity; the amount of rainwater seepage and recharge in the slope is related to the initial water content of the slope soil, water flow path, soil thickness, surface cover, slope angle, rainfall intensity and other factors.
5.3. Groundwater Flow Direction and Flow Simulation
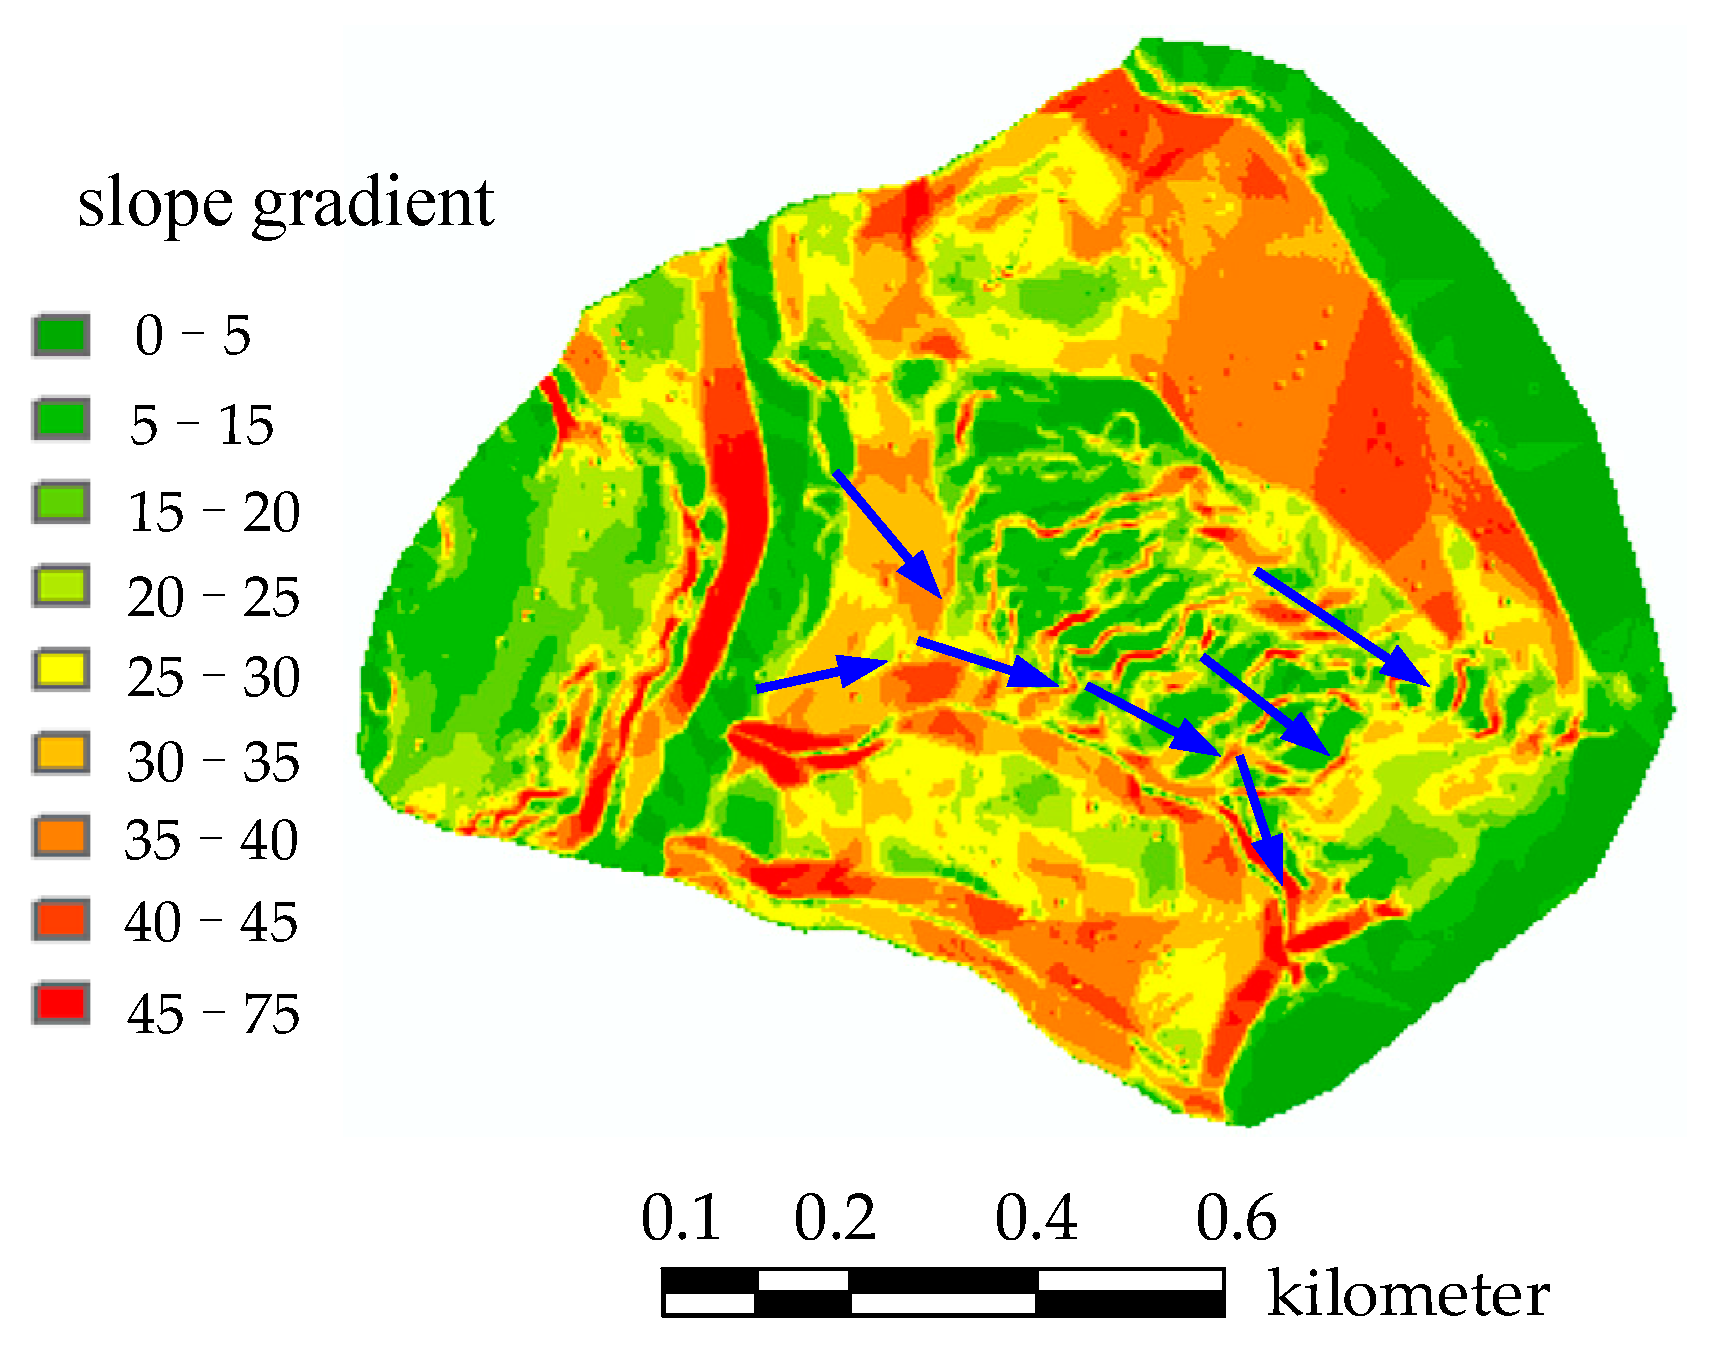
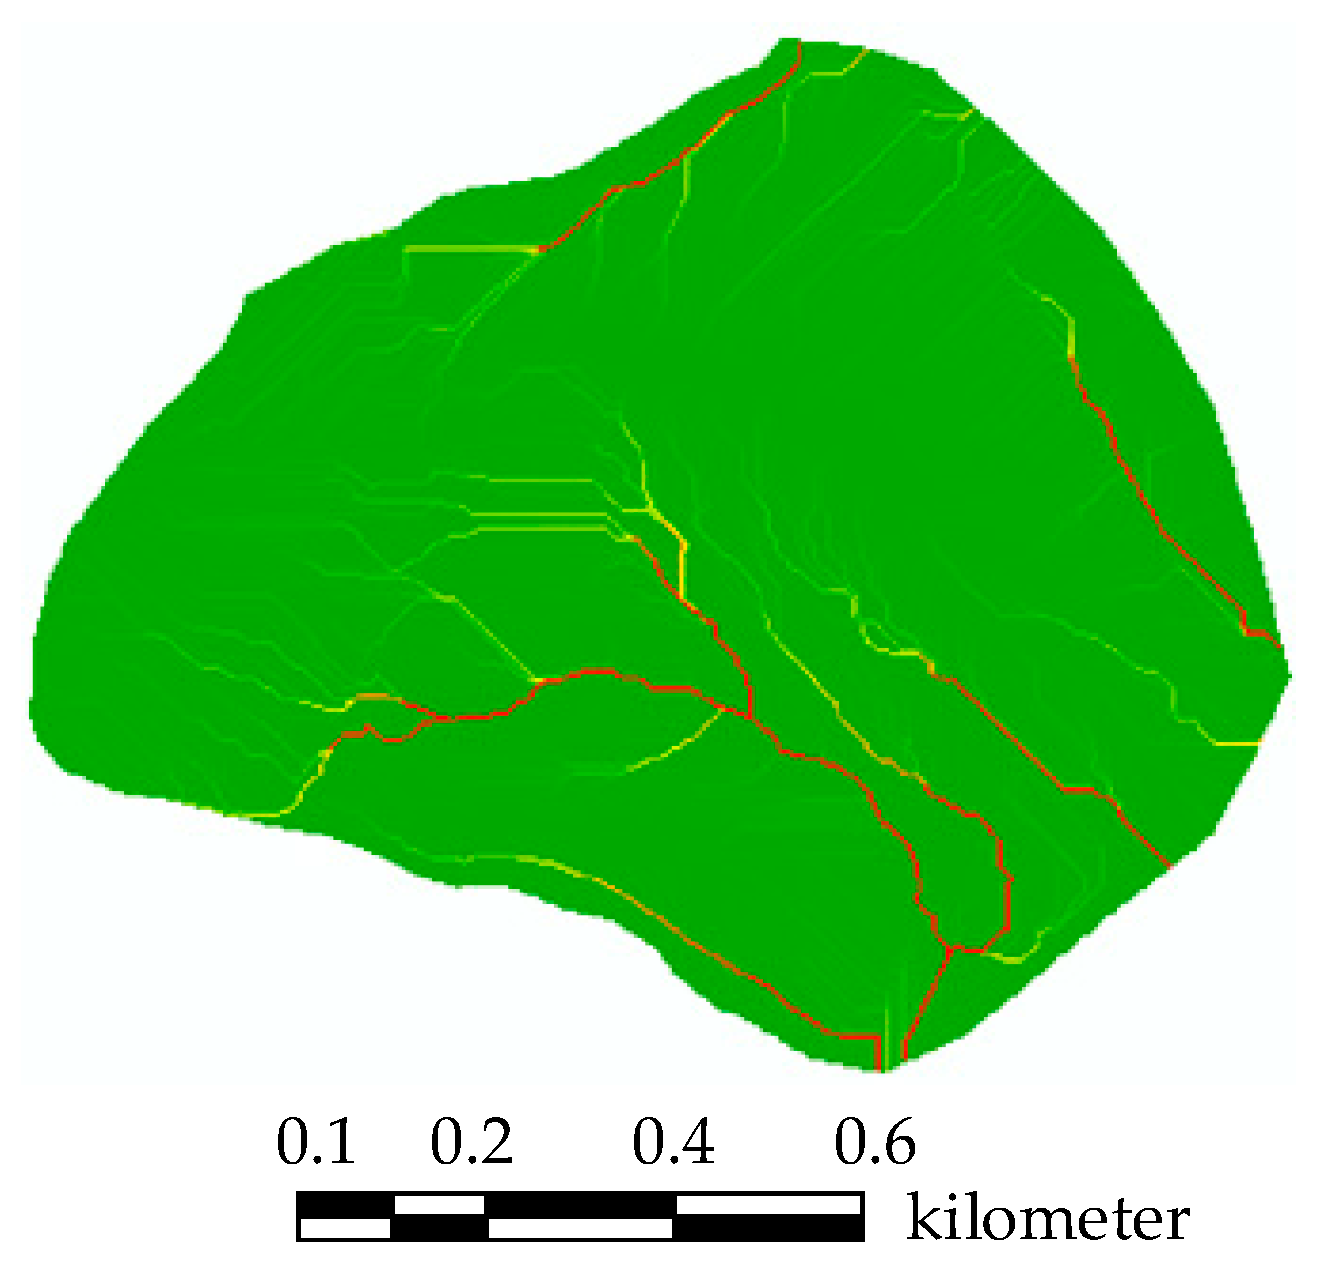
The flow and flow direction distribution caused by rainfall on the slope can be simulated and calculated on the basis of the Digital Elevation Model (DEM). In this paper, the slope is divided into 1 m × 1 m DEM units, and the angle of each unit on the slope and the related surface information can be determined by DEM extraction. The slope gradient map generated by ArcGIS is shown in Figure 9. On this basis, the flow trend of surface and groundwater collection is simulated as shown in Figure 10. From Figure 9 and Figure 10, it can be seen that surface water and groundwater flow along the low-lying terrain, namely slope depressions and valleys, into the Dingjia River, is consistent with the actual path of rainwater flowing through the slope.
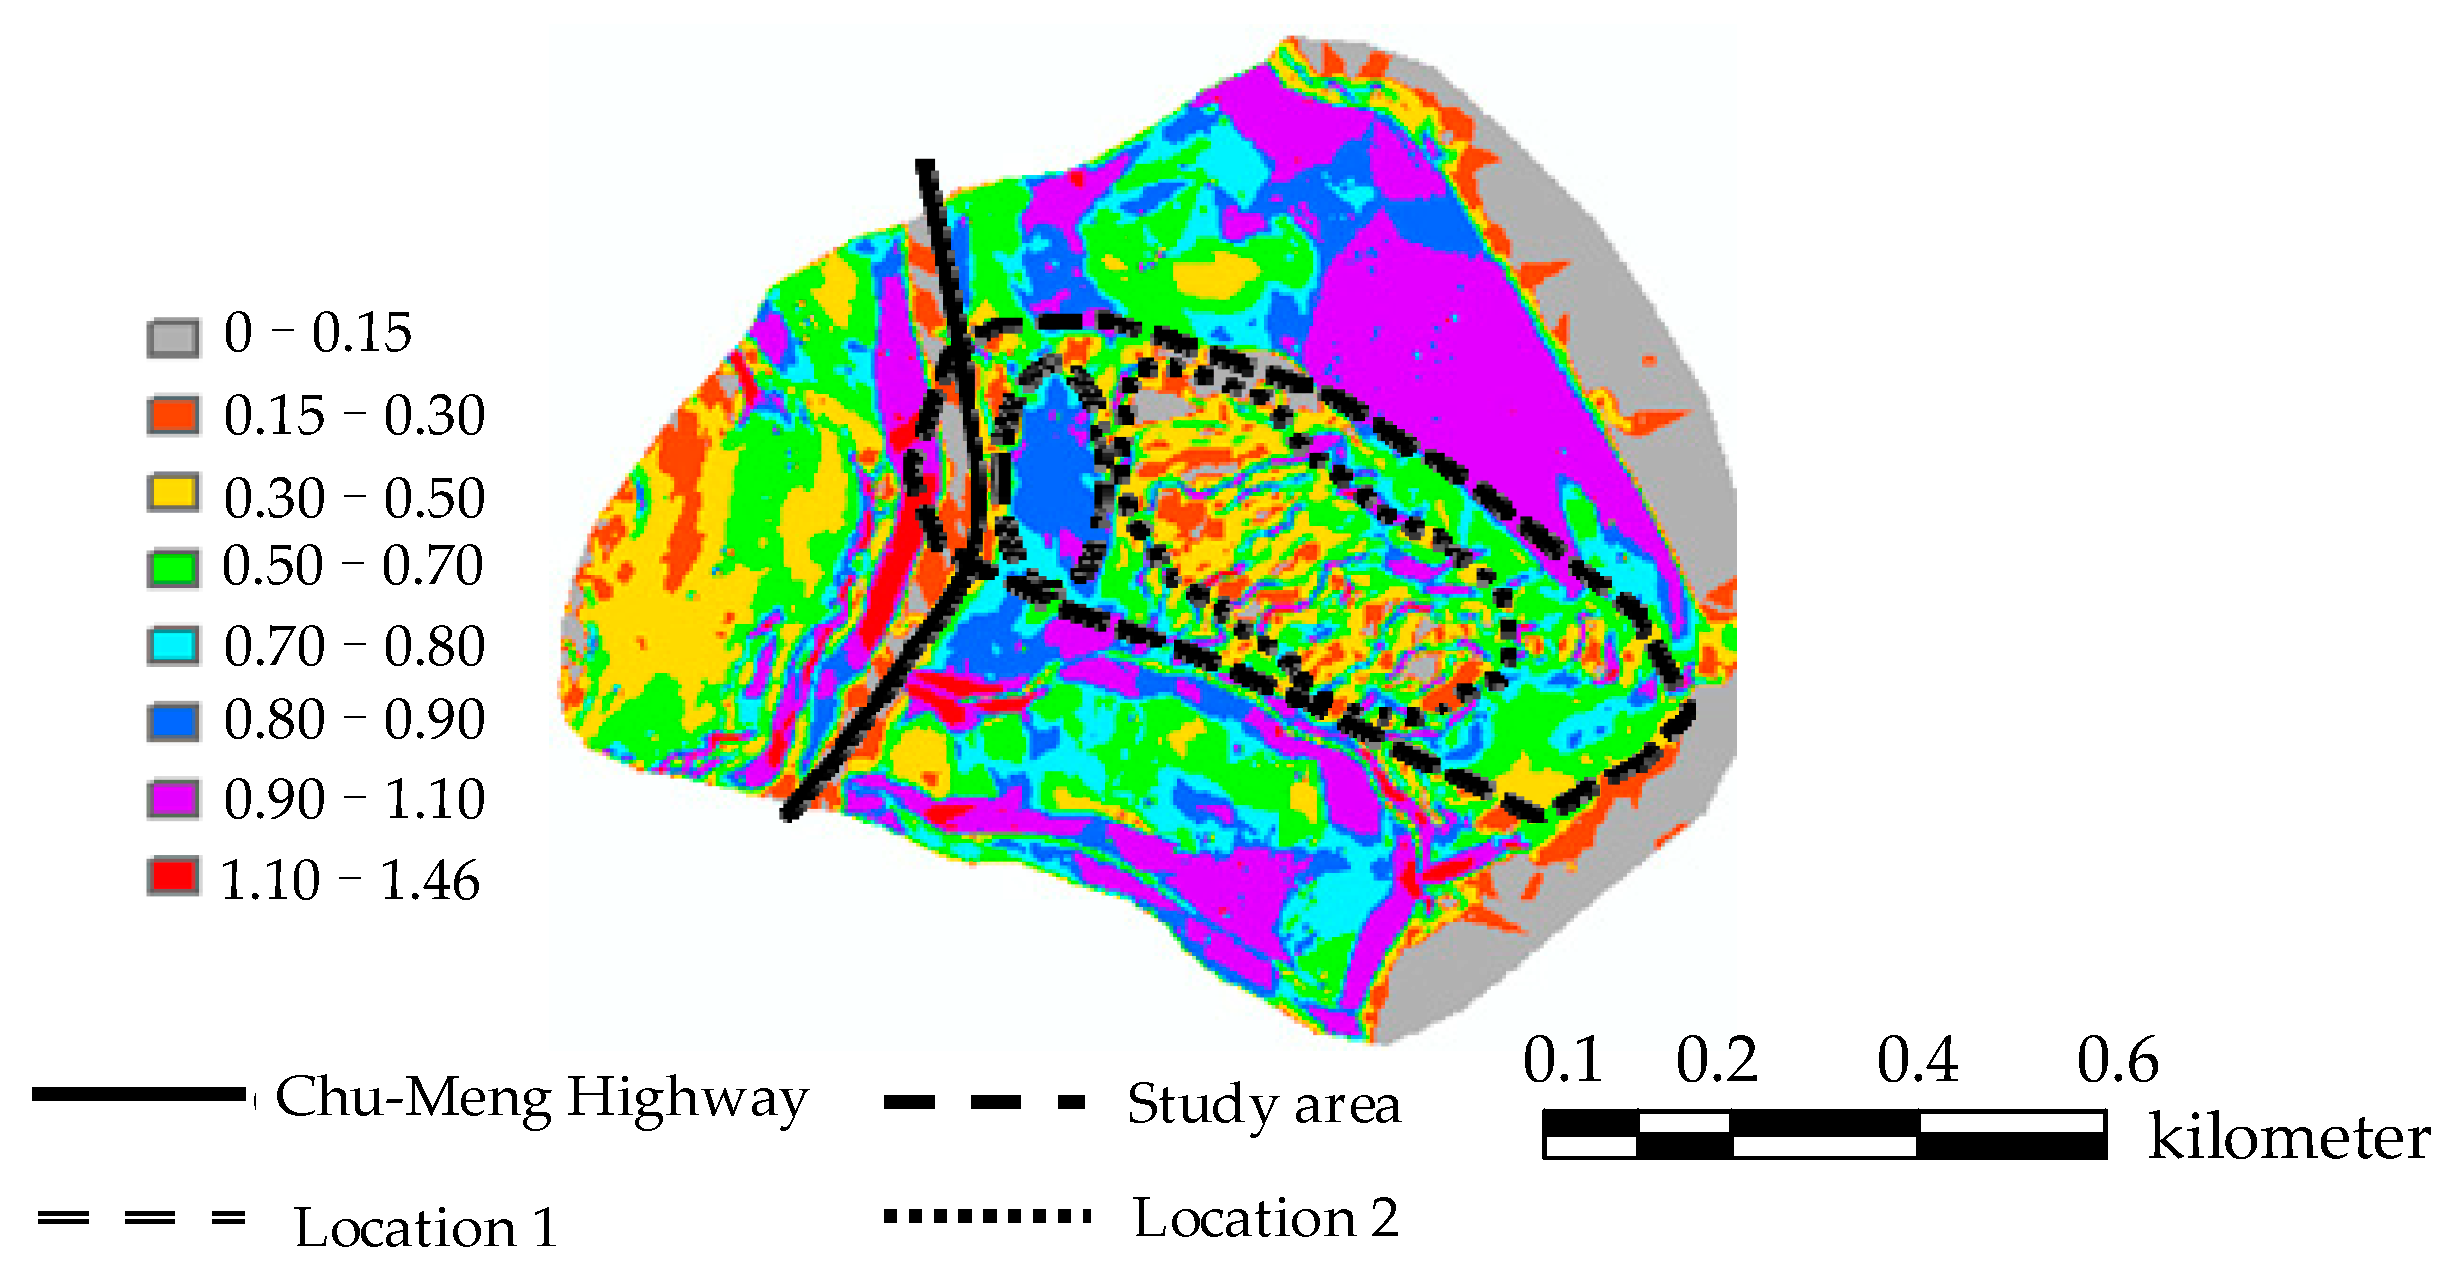
Rainfall during the period from 19–28 July 2010, indicates that rainwater seepage made the unsaturated zone full of water and reached saturation, and the surface water and surface runoff appeared. The groundwater flow through each slope unit is simulated and calculated by formula (9), as shown in Figure 11. In the slope of the study site, the groundwater flow in area 1 of CMH-Slopes is relatively concentrated. The groundwater flow is 0.7–0.9 m3/d, which is relatively large. Notably, it is a potentially slippery area when there is a weak layer. Field investigation showed that there are some cracks on the ground surface in area 1 on the slope below the road. The cracks on the edge are 0.1–0.4 m wide, and the slope has been obviously sheared and deformed. Some parts have also slipped, and there is a trend of further development in the depths. In the process of seepage, when the anti-sliding force of the slope soil is less than the sliding force, it is prone to sliding instability. The groundwater flow of each slope unit in the area below the second road slope is different and scattered, which is mainly related to the different surface slopes of the area. Because this location is mainly terrace farmland, the surface slope is steep and uneven, and also a slippery area. The field investigation shows that the shear deformation on the slope in Location 2 area is obvious, causing partial collapse, but the possibility of collapse in the deeper areas is limited. Position 1 and Position 2 of the slope below the road were calculated and simulated by ArcGIS, and the results basically coincide with the position where there are signs of instability.
When simulating the groundwater flow, the permeability of the slope soil and storage time of the water flow are considered. Under the same rainfall conditions, the groundwater flow per unit of time on the same slope increases with the increase in thickness of the soil layer because the slope covering a thinner soil layer has limited space and capacity for rainwater seepage, so part of the rainwater seeps into the soil in a short period of time. Therefore, the amount of rainfall recharge on the slope depends on the thickness of the soil layer of the corresponding slope unit, rainfall intensity, rainfall duration, the initial water content of the soil, the surface cover, the surface slope, etc., and the groundwater flow is positively correlated with the thickness of the soil layer. When the rainfall continues, the groundwater level will rise continually, which causes the slope to appear full and saturated. At this time, the groundwater flow will be discharged from the slope through large pores or other drainage channels, which is also collected at the gully and the toe of the slope. Some groundwater is discharged in the depressions to form surface runoff into the Dingjia River. If there is no continuous seepage and recharge of rainwater, the groundwater level will drop and dissipate. In the next rainfall cycle, the groundwater on the slope will repeatedly rise–maintain–dissipate, so that the strength of the slope soil will be repeatedly reduced–recovered, which reduces the overall strength of the weak layer of the slope. This phenomenon is similar to the “rubber band fatigue effect”. Any external force factors (such as rain, vehicle load, artificial load, vibration, etc.) that exceed the slope soil’s self-stability will break the stress balance of the slope, and directly destroy the stability of the slope, which will slide down along the weak surface causing a loss of stability.
5.4. Groundwater Level Change Simulation
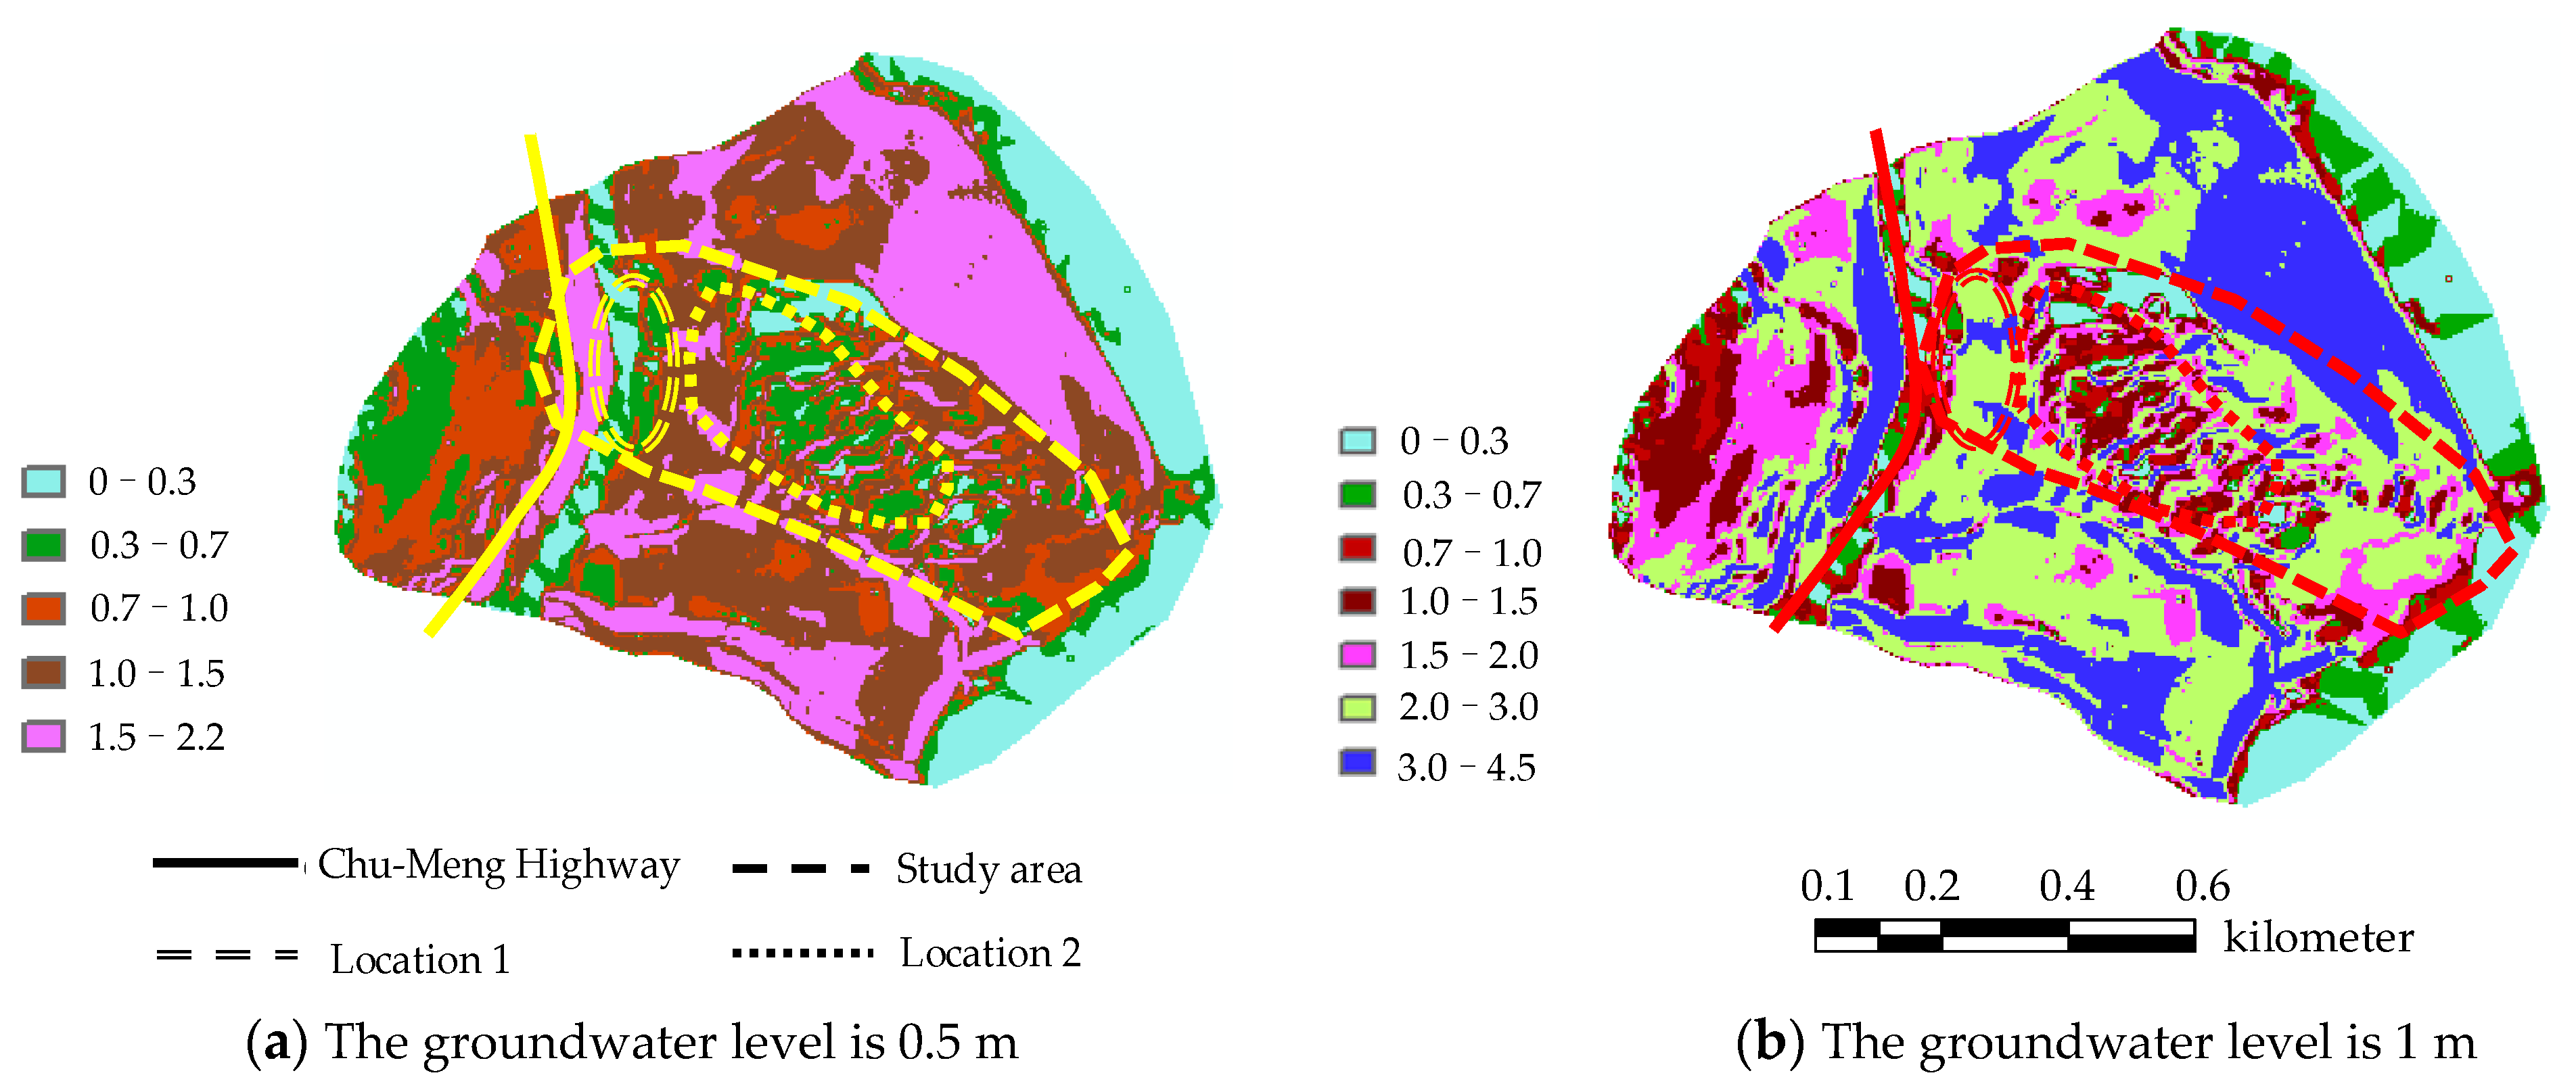
The groundwater level of the slope soil layer is calculated by Formula (11) when the groundwater level of the slope soil is 0.5 m and 1.0 m before the rainfall (above the bedrock or impervious layer), the water permeability of the underlying bedrock is relatively weak, and the groundwater level of each slope unit rises and changes per unit of time as shown in Figure 12. The groundwater level at location 1 of CMH-Slopes has risen significantly. When the original groundwater level is 0.5 m, the water level in Location 1 will rise to 1.0–2.0 m, and the water level in Location 2 will mostly rise to 0.3–0.7 m. When the original groundwater level is 1 m, the water level in the Location 1 rises to 2.0–3.5 m, and the water level in the Location 2 rises to 1.0–2.0 m mostly, and it is noteworthy that the groundwater level has a tendency to connect into one piece. This phenomenon is mainly due to the fact that location 2 is cascaded farmland with different angles, so the groundwater levels generated during rainfall are different.
It can be observed from Figure 12 that for the same slope soil thickness and unit time, the groundwater level rises slowly when the original groundwater level of the slope is low, and the water level rises faster when the groundwater level is high, because the rainwater seepage process flows through the seepage zone, unsaturated zone, and the soil in the seepage path must be fully soaked before it diffuses to the periphery or downwards and then flows into the groundwater. However, some rainwater can directly pass through the macro pores (vegetation root holes, wormholes, microbial channels, etc.) network channels seeping into the groundwater. In the process of rainwater seeping into the groundwater level, the path it travels in a slope with a low groundwater level is longer than that of a slope with a higher groundwater level. Therefore, when the original groundwater level is low, the groundwater level caused by rainfall seepage will rise slowly per unit of time, and vice versa. In addition, the groundwater level near the slope valleys and gullies rises faster because rainwater seepage can not only seep into various pore channels in the slope soil, but seepage also occurs along the terrain in the direction of gravity. During the rainfall period, because the rainfall is intermittent, the groundwater level is repeatedly raised–maintained–dissipated, which changes the soil structure in the slope at this location, reduces the effective stress, and makes the potential landslide unit prone to instability.
5.5. Muddy Water Effect of Underground Weak Layer
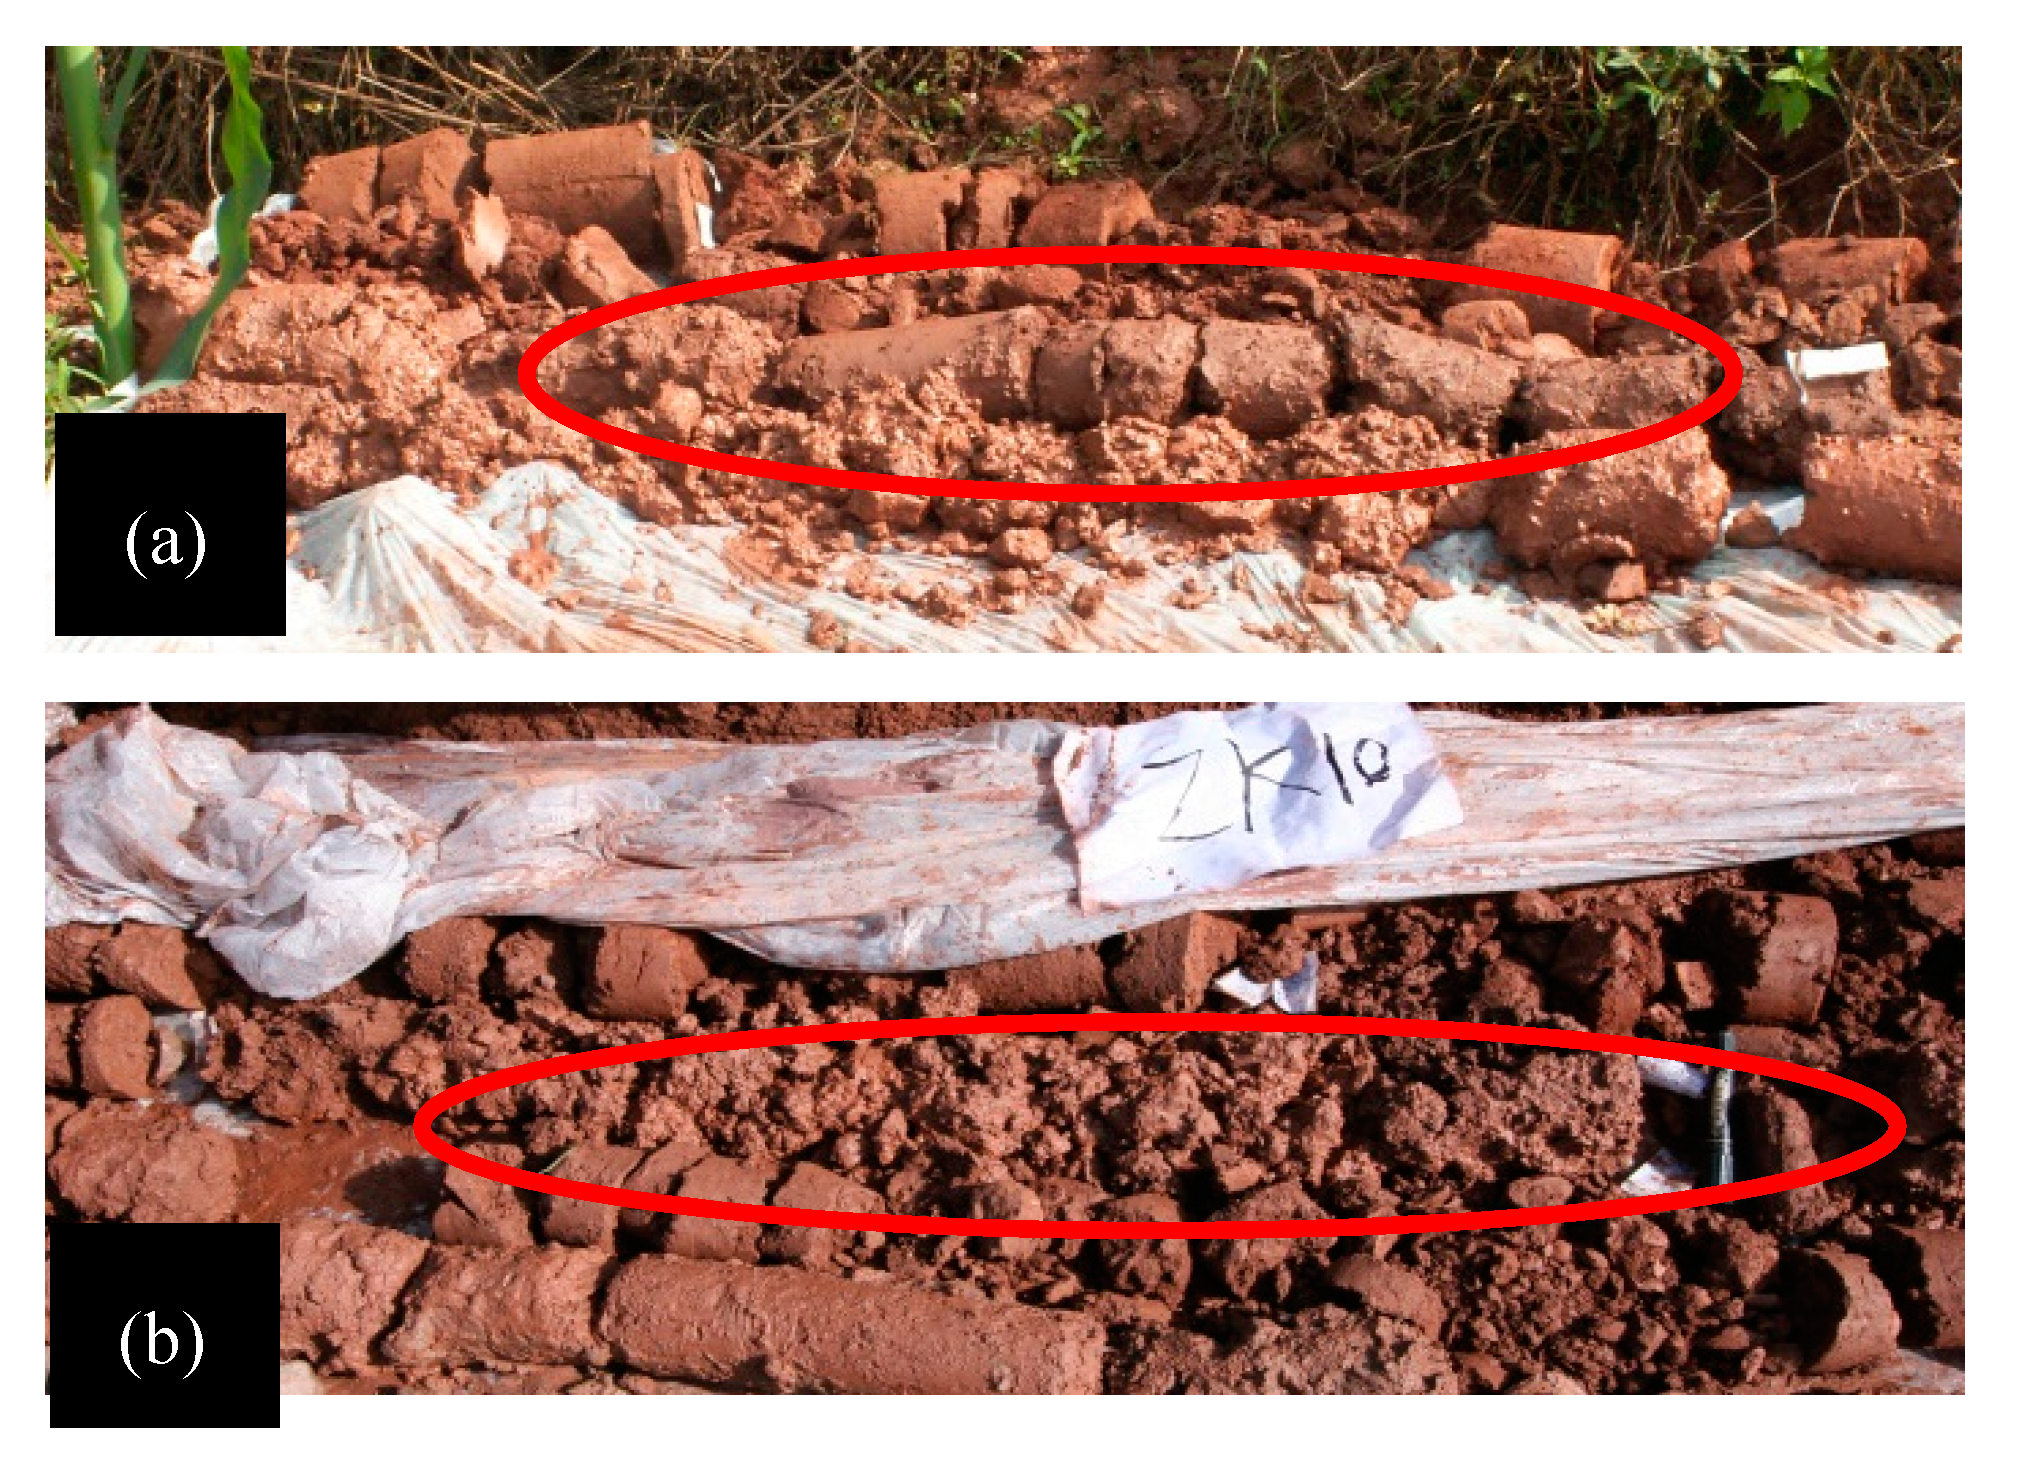
On the one hand, during the rainfall period, rainwater must seep downwards. On the other hand, after being transformed into groundwater, rainwater will promote the uplift of the groundwater level. The repeated up and down action of rainwater on the slope will reduce the internal friction angle and cohesion in the soil and increase the floating force of the soil when the water level rises, changing the soil structure of the slope. During the repeated up and down movement of the rainwater and groundwater levels, the strength of the soil layer of the slope decreases and is easily deformed, causing it to produce the “muddy water softening effect” in the weak zone, as shown in Figure 13. The core sample drilled out is muddy water, mainly due to the rainwater seepage which makes the slope containing breccia silt clay, breccia soil and fully weathered mudstone intercalated with siltstone soften in contact with water, reduce its strength, and reduce cohesion and the internal friction angle. It can be seen from drilling sampling and indoor analysis data that the cohesion and the internal friction angle of the soil in the potential sliding zone of the slope has dropped from 15.8 KPa to 7.8 KPa, from 28.7° to 21°, respectively. If the anti-skid force of the potentially sliding slope unit is less than the sliding force, any external factors (such as rain, vehicle load, artificial stacking, vibration, etc.) will cause the slope to lose stability.
5.6. Discussion
(1) The recharge of groundwater by rainfall depends on the intensity of the rainfall, the initial water content of the soil, the thickness of the soil layer on the slope, etc. During rainfall seepage, the two factors of downward wet front and upward groundwater lead to an increase in the hydrodynamic pressure and hydrostatic pressure of the slope, which changes the structural characteristics of the slope soil. When rainfall seeps into the bedrock surface, or stagnates in the various clay layers that play a role in preventing seepage, the slope soil will be soaked and softened to form a soft sliding surface exhibiting the “muddy-water softening effect” to promote and accelerate the sliding of potentially unstable slope units.
(2) The seepage of rainwater is transformed into groundwater, and the soil in the infiltration zone of the slope surface gradually becomes saturated during the infiltration process of rainwater. Softening or argillization and a shearing motion occur, forming a sliding body that slides downward. While the soil in the unsaturated zone of the slope is in an unsaturated state before the rainwater seeps, the pores in the soil are not filled with water under a negative pressure state. If the rainwater seeps into it, the pores of the unsaturated soil will be filled, and when it exceeds the weight that its adsorption capacity can bear, it moves downwards. At this time it will reduce the adsorption capacity between soil particles, and weaken the stability of the slope soil. In addition, the original groundwater level in the process of rainwater seepage will rise and increase the float, and the support force softens the soil in the unsaturated zone. During the repeated uplift and dissipation of the groundwater level, the physical and mechanical properties of the soil will change, and cause slope instability.
(3) The visual simulation of changes in the groundwater level and flow provides a new way for analyzing the changes in the groundwater level and flow of each slope unit as well as the stability of the slope. The simulation of this slope shows that Position 1 (see Figure 11), where the groundwater level and flow change greatly, is located on the down slope of the highway, and the sliding body above the potential sliding surface is in a state of limited equilibrium [26]. The cohesive force of the rock and soil layer at position 1 is worse than that of silt clay and easily hydrated calcareous mudstone. In the case of a large amount of rainwater seepage, it is easy to cause the landslide body to produce weak structural surfaces, and the stress balance of the original slope body is destroyed, which induces the sliding failure of the landslide body and forms the phenomenon of landslide instability. However, the slope gradient at Position 2 (see Figure 11) is relatively gentle, and the possibility of sliding failure is less given the condition of no external load. The simulation results are consistent with the actual sliding position on site, indicating that the simulation of groundwater level and flow changes is feasible for slope stability analysis.
(4) Rainfall recharge is related to the one-dimensional seepage and water storage time of the soil in the unsaturated zone, i.e., the time reflecting the upward change of the groundwater level and the downward change of the wet zone depth. When the rainwater seepage increases the weight of the soil over its self-stability, instability may occur. Therefore, it is feasible to combine with rainwater seepage, recharge, and groundwater level and flow changes to analyze the influence of groundwater flow distribution changes on slope stability.
(5) When the rise and change of the groundwater level of each slope unit was simulated, since the actual measurement of the actual groundwater level of each unit is difficult, a unified assumption is made. It is assumed that the groundwater level of each slope unit is 0.5 m or 1 m above the bedrock or impervious layer, which is simplified in the process of measuring the actual ground water level of each slope unit that may cause deviation of the calculated value of the model and affect its accuracy. However, the study aims to provide a new idea to analyze the law of the original groundwater level to the rainfall seepage caused by the groundwater level change.
(6) Slope Position 1 (see Figure 11) under the highway is a potentially unstable position. In order to prevent the slope in this area from causing landslide instability due to rainwater seepage, the slope can be reinforced with anti-slide retaining walls or anti-slide piles. The potential sliding layer at the slope location should be found, and the bottom of the anti-skid retaining wall or anti-slide pile should be buried deep below the potential sliding layer. Corresponding engineering measures should be taken to remove the surface and groundwater. The intercepting ditch and drainage ditch can be used to drain the surface water, and the inclined drainage pipe can be used with the surface drainage facility to drain the groundwater, so as to prevent water damage, landslide, and slope instability as well as ensuring the stability of the road.
6. Conclusions
(1) Rainwater recharge and its characteristics in water flow take into account the changes in the depth of the wet zone caused by the seepage of rainwater and the movement in the two directions of the rise of the groundwater level. Since the generation of shallow translational landslides is mainly controlled by the groundwater flow and the wet zone, the calculation simulation in this paper is feasible.
(2) It is more reasonable to analyze the stability of the slope considering factors such as rainfall seepage and groundwater flow distribution changes. The process of rainwater seepage and uplift will change the original equilibrium state of the soil structure, forming a “rubber band fatigue effect” which decreases slope self-stabilization ability. Slope instability usually occurs in slope units with reduced soil suction, reduced effective vertical pressure, and higher water content.
(3) The rainfall recharge rate at different locations depends on the thickness of the soil layer of the slope, the intensity of the rainfall, the initial water content of the soil, etc. During the repeated up and down movement of the rainwater and the groundwater level, the strength of the soil layer of the slope decreases and is easily deformed. The weak zone forms a “muddy water softening effect” which leads to slope instability.
(4) During the rainfall period, the stability of the slope can be evaluated and analyzed according to the simulation of the groundwater flow change of the slope, and corresponding engineering protection measures can be taken for the potentially unstable slope. This method can realize the visualization of changes in groundwater level and flow caused by rainwater seepage, and provides a new idea for simulating slope instability caused by changes in groundwater flow. The research results can also provide theoretical support for the Early Warning System of slope instability.
Author Contributions
Conceptualization, R.S. and Y.H.; methodology, R.S.; software, R.S.; validation, Y.H. and Z.X.; writing—original draft preparation, R.S.; writing—review and editing, Y.H.; visualization, W.T.; supervision, Z.X. All authors have read and agreed to the published version of the manuscript.
Funding
This research was funded by the National Natural Science Foundation for Young Scientists of China, grant number 41807258.
Institutional Review Board Statement
Not applicable.
Informed Consent Statement
Not applicable.
Data Availability Statement
Data sharing not applicable.
Conflicts of Interest
The authors declare no conflict of interest.
References
- Garcia-Delgado, H.; Machuca, S.; Medina, E. Dynamic and geomorphic characterizations of the Mocoa debris flow (March 31, 2017, Putumayo Department, southern Colombia). Landslides 2019, 16, 597–609. [Google Scholar] [CrossRef]
- Chandrasekhar, S.S.K.; Uranchimeg, S.; Kwon, H.H.; Lee, S.O. Coastal flood disaster in Sri Lanka-May 2017: Exploring distributional changes in rainfall and their impacts on flood risk. J. Coastal. Res. 2018, 1476–1480. [Google Scholar] [CrossRef]
- Qiu, J.L.; Wang, X.L.; He, S.Y.; Liu, H.Q.; Lai, J.X.; Wang, L.X. The catastrophic landside in Maoxian County, Sichuan, SW China, on June 24, 2017. Nat. Hazards 2017, 89, 1485–1493. [Google Scholar] [CrossRef] [Green Version]
- Shao, C.J.; Li, Y.; Lan, H.X.; Li, P.Y.; Zhou, R.J.; Ding, H.R.; Yan, Z.K.; Dong, S.L.; Yan, L.; Deng, T. The role of active faults and sliding mechanism analysis of the 2017 Maoxian postseismic landslide in Sichuan, China. Bull. Eng. Geol. Environ. 2019, 78, 5635–5651. [Google Scholar] [CrossRef]
- Zhang, Y.E.; Li, D.Y.; Yin, K.L.; Chen, L.X.; Xu, Y.; Woldai, T.; Lian, Z.P. The July 1, 2017 Wangjiawan landslide in Ningxiang County, China. Landslides 2018, 15, 1657–1662. [Google Scholar] [CrossRef]
- Pack, R.T.; Tarboton, D.G.; Goodwin, C.N. The SINMAP approach to terrain stability mapping. In Proceedings of the 8th Congress of the International Association of Engineering Geology, Vancouver, BC, Canada, 21–25 September 1998; pp. 1157–1165. [Google Scholar]
- Montgomery, D.R.; Dietrich, W.E. A physically based model for the topographic control on shallow landsliding. Water. Resour. Res. 1994, 30, 1153–1171. [Google Scholar] [CrossRef]
- Baum, R.L.; Savage, W.Z.; Godt, J.W. TRIGRS-A fortran program for transient rainfall seepage and grid-based regional slope-stability analysis. Version 2.0.U.S. Geol. Surv. Open-file. Report. 2008, 1159, 75. [Google Scholar]
- Montrasio, L.; Valentino, R.; Losi, G.L. Towards a real-time susceptibility assessment of rainfall-induced shallow landslides on a regional scale. Nat. Hazards. Earth. Syst. Sci. 2011, 11, 1927–1947. [Google Scholar] [CrossRef] [Green Version]
- Li, L.Q.; Li, C.L.L.; He, C. Analysis of mechanical response for a reinforced bedded rock slope under rainfall. Adv. Civ. Eng. 2019, 9864230. [Google Scholar] [CrossRef] [Green Version]
- Li, L.Q.; Ju, N.P. Effect of the inclined weak interlayers on the rainfall response of a bedded rock slope. J. Mt. Sci.-Engl. 2016, 13, 1663–1674. [Google Scholar] [CrossRef]
- Balzano, B.; Tarantino, A.; Ridley, A. Preliminary analysis on the impacts of the rhizosphere on occurrence of rainfall-induced shallow landslides. Landslides 2019, 16, 885–1901. [Google Scholar] [CrossRef] [Green Version]
- Guns, M.; Vanacker, V. Forest cover change trajectories and their impact on landslide occurrence in the tropical Andes. Environ. Earth Sci. 2013, 70, 7. [Google Scholar] [CrossRef]
- Wang, H.; Gao, J.E.; Zhang, M.J.; Li, X.H.; Shao-long, Z.D.; Jia, L.Z. Effects of rainfall intensity on groundwater recharge based on simulated rainfall experiments and a groundwater flow model. Catena 2015, 127, 80–91. [Google Scholar] [CrossRef]
- Dores, D.; Glenn, C.R.; Torri, G.; Whittier, R.B.; Popp, B.N. Implications for groundwater recharge from stable isotopic composition of precipitation in Hawai2′i during the 2017–2018 La Nina. Hydrol. Process. 2020, 34, 4675–4696. [Google Scholar] [CrossRef]
- Chen, H.E.; Tsai, T.L.; Yang, J.C. Threshold of Slope Instability Induced by Rainfall and Lateral Flow. Water 2017, 9, 722. [Google Scholar] [CrossRef] [Green Version]
- Dourte, D.; Shukla, S.; Singh, P.; Haman, D. Rainfall intensity-duration-frequency relationships for Andhra Pradesh, India: Changing rainfall patterns and implications for runoff and groundwater recharge. J. Hydrol. Eng. 2013, 18, 324–330. [Google Scholar] [CrossRef] [Green Version]
- Zheng, W.B.; Wang, S.Q.; Sprenger, M.; Liu, B.X.; Cao, J.S. Response of soil water movement and groundwater recharge to extreme precipitation in a headwater catchment in the North China Plain. J. Hydrol. 2019, 576, 466–477. [Google Scholar] [CrossRef]
- Kelman, I.; Glantz, M.H. 2014 Early Warning Systems Defined. In Reducing Disaster: Early Warning Systems for Climate Change; Singh, A., Zommers, Z., Eds.; Springer: Dordrecht, The Netherlands. [CrossRef]
- De Luca, D.L.; Versace, P. Diversity of Rainfall Thresholds for early warning of hydro-geological disasters. Adv. Geosci. 2017, 44, 53–60. [Google Scholar] [CrossRef] [Green Version]
- Al-Shaar, W.; Nehme, N.; Adjizian Gérard, J. The Applicability of the Extended Markov Chain Model to the Land Use Dynamics in Lebanon. Arab. J. Sci. Eng. 2021, 46, 495–508. [Google Scholar] [CrossRef]
- Xia, J.S.; Li, J.N.; Dong, P.L.; Yang, K.C. An ArcGIS add-in for spatiotemporal data mining in climate data. Earth Sci. Inform. 2020, 13, 185–190. [Google Scholar] [CrossRef]
- Kim, J.; Lee, K.; Jeong, S.; Kim, G. GIS-based prediction method of landslide susceptibility using a rainfall infiltration-groundwater flow model. Eng. Geol. 2014, 182, 63–78. [Google Scholar] [CrossRef]
- Sangrey, D.A.; Harrop-Williams, K.O.; Klaiber, J.A. Predicting ground-water response to precipitation. J. Geotech. Eng. 1984, 110, 957–975. [Google Scholar] [CrossRef]
- Mein, R.G.; Larson, C.L. Modeling infiltration during a steady rain. Water. Resour. Res. 1973, 9, 384–394. [Google Scholar] [CrossRef] [Green Version]
- Qi, P.; Zhang, G.X.; Xu, Y.J.; Wang, L.; Ding, C.C.; Cheng, C.Y. Assessing the influence of precipitation on shallow groundwater table response using a combination of singular value decomposition and cross-wavelet approaches. Water 2018, 10, 598. [Google Scholar] [CrossRef] [Green Version]
Figure 1.
Slope drilling arrangement diagram.

Figure 2.
Embedded inclinometer and osmometer.

Figure 3.
Sketch map of rainfall seepage (modified according to Mein and larson (1973)).

Figure 4.
Slope rain seepage schematic diagram. (a) Initial stage rainfall. (b) Rainfall seepage path.
Figure 4.
Slope rain seepage schematic diagram. (a) Initial stage rainfall. (b) Rainfall seepage path.

Figure 5.
Sketch map of groundwater flow.

Figure 6.
Rainfall graph.

Figure 7.
The underground water level variations.

Figure 8.
Sketch map of underground displacement.

Figure 9.
Surface slope map.

Figure 10.
The water flow simulation diagram.

Figure 11.
Slope unit flow diagram (unit: m3/d).

Figure 12.
Schematic diagram of variation of groundwater level in each slope unit.

Figure 13.
Mud softening phenomenon.

Publisher’s Note: MDPI stays neutral with regard to jurisdictional claims in published maps and institutional affiliations. |
© 2021 by the authors. Licensee MDPI, Basel, Switzerland. This article is an open access article distributed under the terms and conditions of the Creative Commons Attribution (CC BY) license (https://creativecommons.org/licenses/by/4.0/).
Share and Cite
MDPI and ACS Style
He, Y.; Sun, R.; Xu, Z.; Tang, W. The Dynamic Change and Effect of Rainfall Induced Groundwater Flow. Water 2021, 13, 2625. https://doi.org/10.3390/w13192625
AMA Style
He Y, Sun R, Xu Z, Tang W. The Dynamic Change and Effect of Rainfall Induced Groundwater Flow. Water. 2021; 13(19):2625. https://doi.org/10.3390/w13192625
Chicago/Turabian StyleHe, Yuqiong, Rong Sun, Zemin Xu, and Weijia Tang. 2021. "The Dynamic Change and Effect of Rainfall Induced Groundwater Flow" Water 13, no. 19: 2625. https://doi.org/10.3390/w13192625
Note that from the first issue of 2016, this journal uses article numbers instead of page numbers. See further details here.