
Low Cost Activated Carbon for Removal of NOM and DBPs: Optimization and Comparison


1
Faculty of Engineering and Applied Science, Memorial University of Newfoundland, St. John’s, NL A1B3X7, Canada
2
Department of Civil and Environmental Engineering, King Fahd University of Petroleum & Minerals, Dhahran 31261, Saudi Arabia
3
Interdisciplinary Research Center for Membranes and Water Security, King Fahd University of Petroleum & Minerals, Dhahran 31261, Saudi Arabia
*
Author to whom correspondence should be addressed.
Water 2021, 13(16), 2244; https://doi.org/10.3390/w13162244
Submission received: 19 July 2021
/
Revised: 13 August 2021
/
Accepted: 13 August 2021
/
Published: 17 August 2021
(This article belongs to the Special Issue Water Quality Optimization)
Abstract
:Higher concentrations of disinfection byproducts (DBPs) in small water systems have been a challenge. Adsorption by tailored activated carbon (AC), developed from waste materials of a pulp and paper company using optimization of chemical activation by nitric acid followed by physical activation and metal coating, was tested for the removal of natural organic matter from water using synthetic and natural water. AC was coated with aluminum and iron salts in a ratio of 0.25 to 10.0% of metal: AC (wt:wt%). The optimization of dosage, pH, and time was performed to achieve the highest adsorption capacity. The modified AC of 0.75% Fe-AC and 1.0% Al-AC showed 35–44% improvement in DOC removal from natural water. An enhancement of 40.7% in THMs removal and 77.1% in HAAs removal, compared to non-modified, AC were achieved. The pseudo-second order was the best fitted kinetic model for DOC removal, representing a physiochemical mechanism of adsorption.
1. Introduction
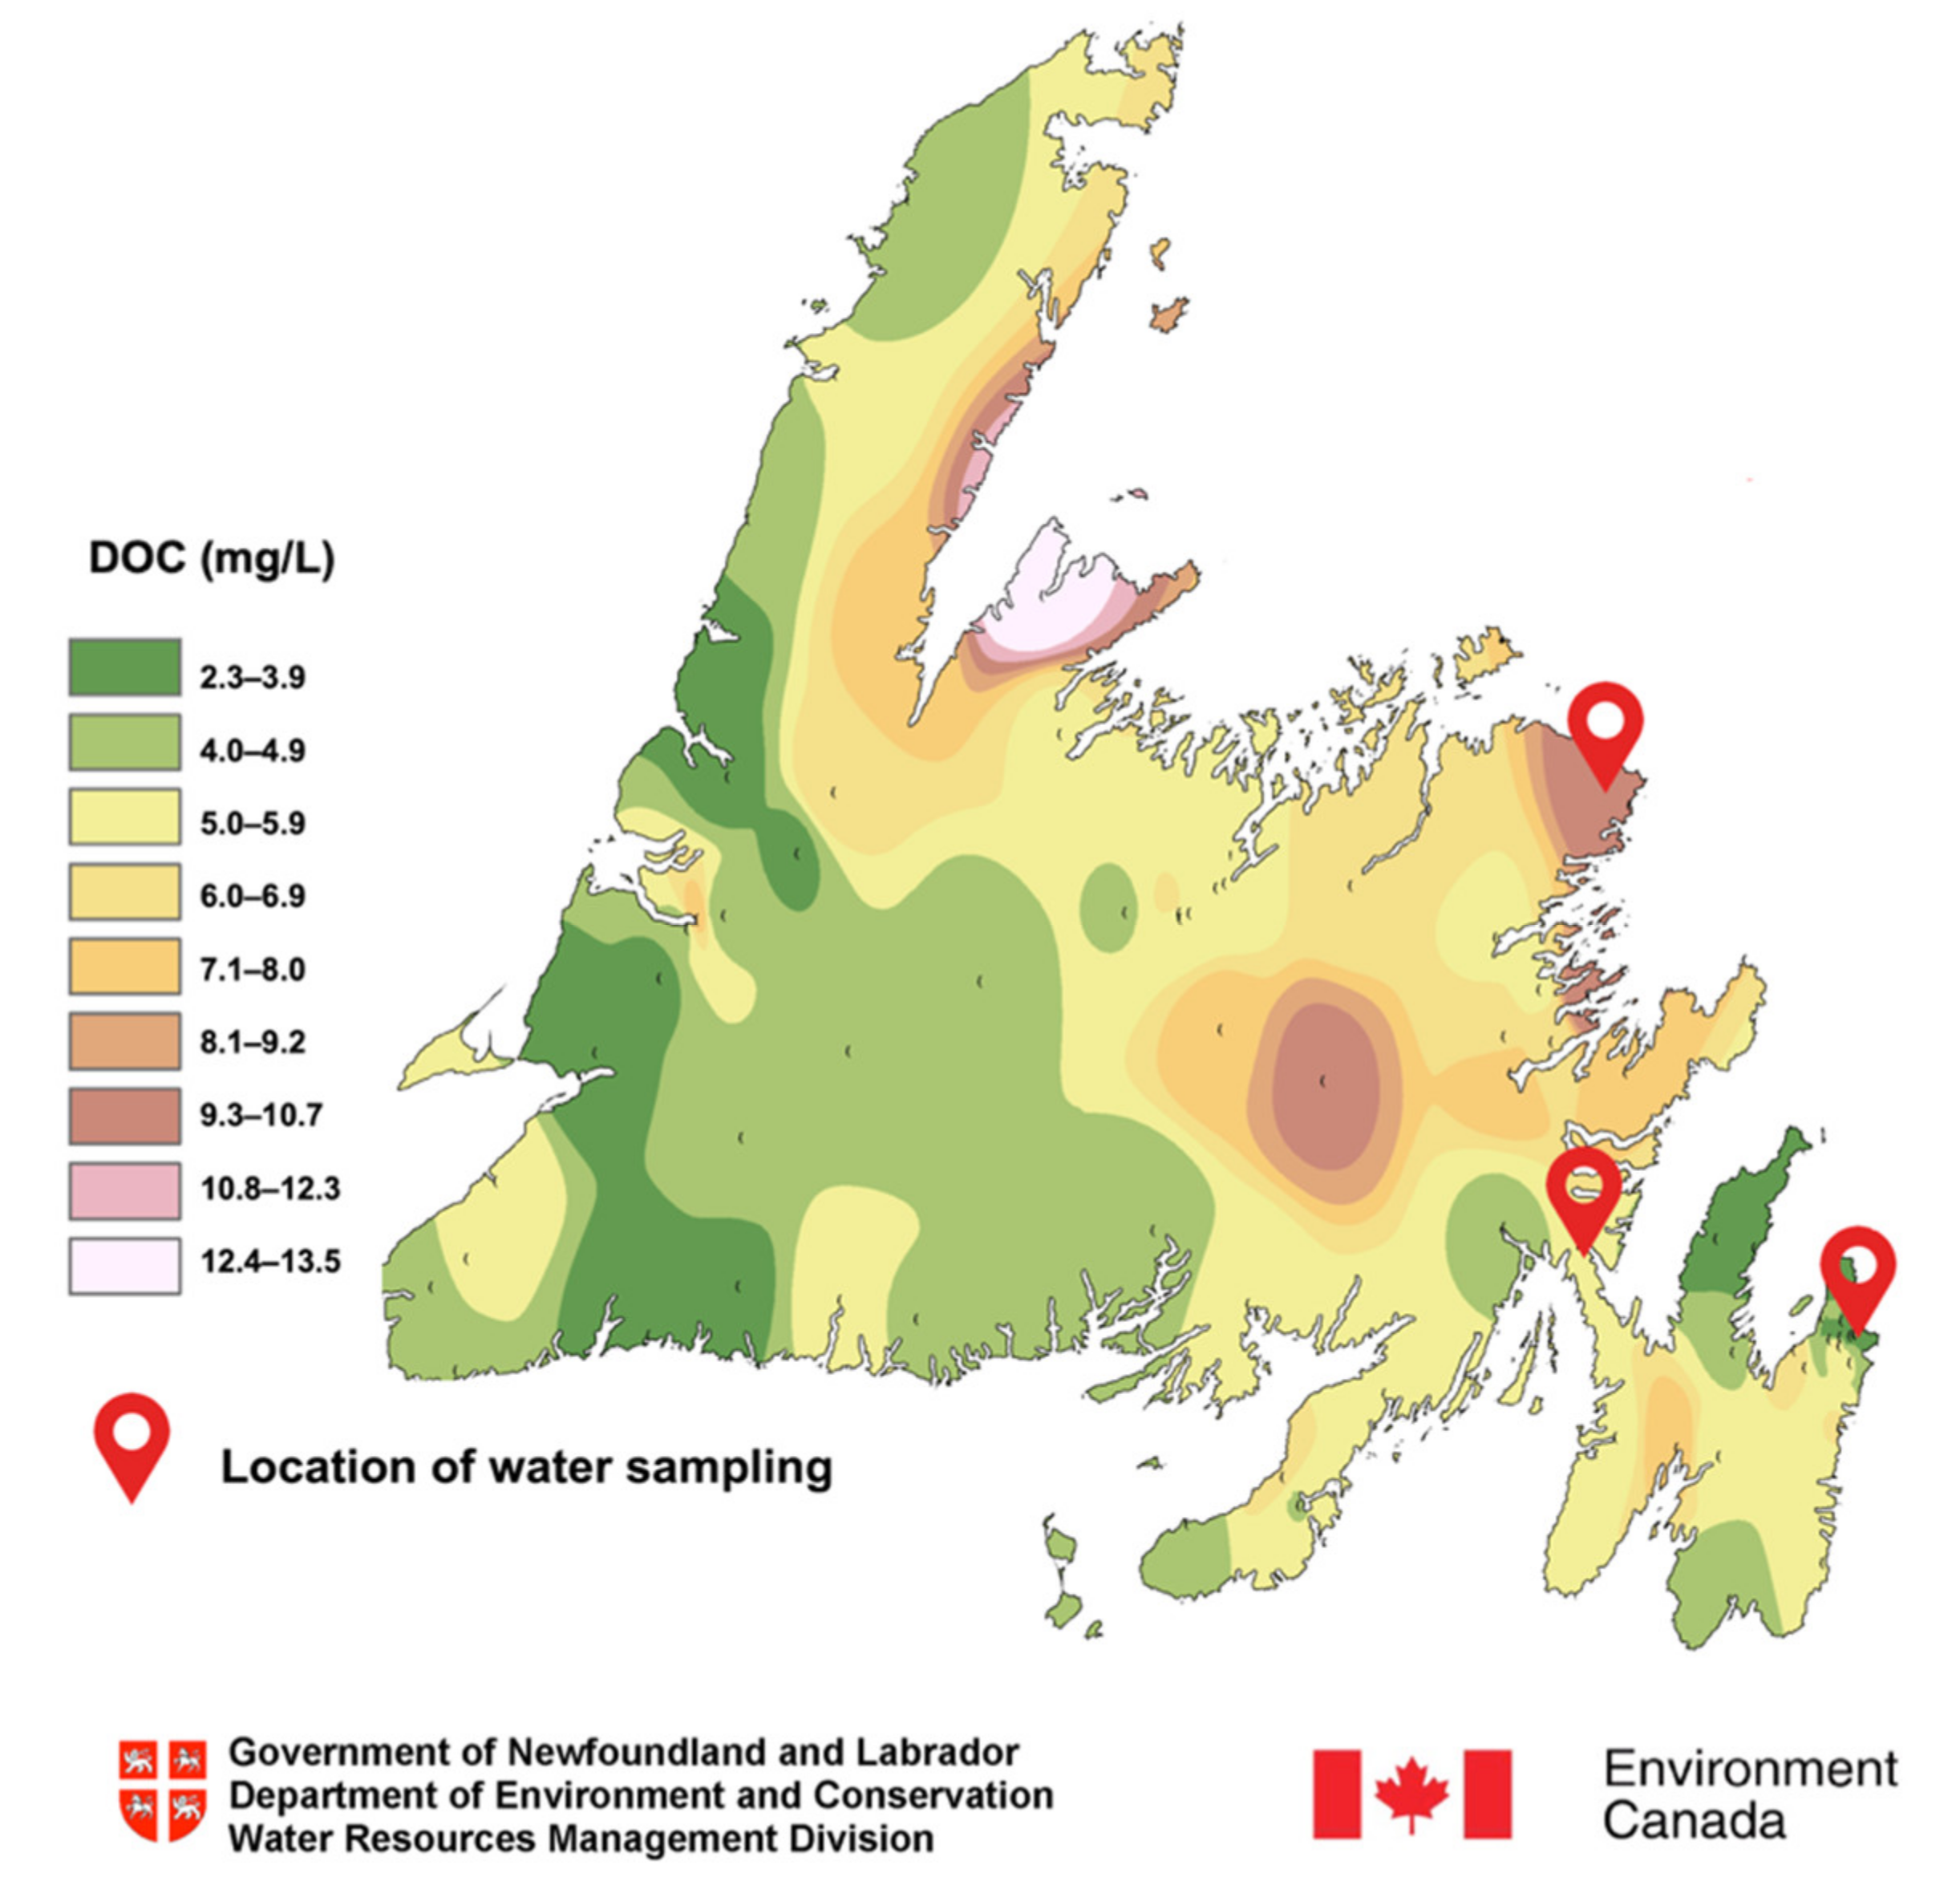
Chronic exposure to disinfection byproducts (e.g., trihalomethanes (THMs) and halo acetic acids (HAAs)) in drinking water through ingestion, inhalation, and dermal contact increases the risk of adverse health effects. The International Agency for Research on Cancer (IARC) categorizes certain types of THMs and HAAs in Group 2B with the possible increase of the risk for liver cancers [1,2]. The US EPA suggests the maximum allowable levels of 80 ppb (parts per billion) for four THMs (THM4) (i.e., chloroform, bromoform, bromodichloromethane, dibromochloromethane) and 60 ppb for five HAAs (HAA5) (i.e., monochloroacetic acids, dichloroacetic acids, trichloroacetic acids, monobromoacetic acids, dibromoacetic acids) [3]. The formation of disinfection byproducts (DBPs) occurs continuously in the municipal water as long as natural organic matter (NOM) is in contact with chlorine-based disinfectants [2]. An increased level of NOM in the last two decades [4,5,6,7] due to global warming, acute raining, soil erosion [8,9], and water contamination has led to reduced or worsened effectiveness of water treatment processes by decreasing the lifespan of activated carbon pores [10]. Of the residents in Newfoundland and Labrador (NL), 79% are serviced by the public water distribution system, where 15% of the consumers are in contact with high levels of THM4 and HAA5 in their drinking water [1]. The average of the dissolved organic carbon (DOC), a surrogate indicator of NOM content, in two-thirds of the surface waters of NL is more than 5 mg/L, with an average of 9 mg/L in some areas of the province. Figure 1 displays a contour plot of the variation of DOC in surface water samples in NL. To reduce DBPs in compliance with regulations and to overcome the challenges in municipal water systems, water treatment facilities are looking for new and affordable advanced treatment methods.
In recent years, the most famous technologies for the removal of NOM from water are enhanced coagulation (EC) [11], electrochemical methods [12], advanced oxidation methods (AOM) [13], membrane [14], and adsorption [15]. Adsorption by carbon-based adsorbents has been used since the 18th century [16]. This is one of the most favorable and promising methods in water treatment for the removal of DOC and hazardous contaminants in low concentrations owing to the convenient operation, low maintenance, [17] high efficiency, and simple design [15,18]. However, the cost-efficiency of adsorption methods is highly dependent on the accessibility and the price of the carbon-rich precursor materials, i.e., wood, oil, coal, and coconut shells [16,19]. Industrial activated carbon for the removal of odor, hazardous materials, and water treatment has burnt thousands of tons of wood, coal, and oil per year [20]. Considering the financial and environmental obstacles, new technologies are available for producing activated carbon from inexpensive carbon-rich materials, such as agricultural waste (e.g., barley husk, rice husk, eggshells, palm seed shell, silkworm excrement) [20,21,22,23], sewage sludge [24], used coffee grounds [25], and industrial solid wastes [21]. The Corner Brook Pulp and Paper Limited (CBPPL) is the principal manufacturer of standard newsprint in western Newfoundland, Canada, with an average newsprint production of 700 tons per day. The boiler and bottom ash of the factory have been recognized as accessible local sources of high carbon content material for the development of porous activated carbon that is capable of resolving the waste management impediments (i.e., thousands of tons of fly ash disposal to landfill yearly) and water treatment issues in the province [18,26,27]. Investigations to date have proved the capability of AC derived from the fly ash of CBPPL in removing low to moderate levels of DOC [26,28] and arsenic [18].
Using a mixture of steam and CO2 at 850 °C, the developed AC showed a microporous structure [18], which can be beneficial for the removal of small- to moderate-sized NOM molecules. The high molecular weight NOM that are the main precursors for the halogenated DBPs (i.e., THMs and HAAs) can be better eliminated by a mesopore structure [30,31]. However, the absorptivity of AC is highly dependent on the surface charge and surface functional groups [32], which has not been considered thus far. To overcome the inefficacy of pore size distribution in removing certain toxic chemicals, surface modification of AC by optimization of the oxidizing agent (i.e., acid mixture) [33] and developing more O-functional groups on the surface of AC, as well as alterations of surface charge by metal ions, were suggested to increase the affinity of high molecular weight NOM. Previous studies on the pore structure of AC have shown the positive effect of oxidization by nitric acid on increased mesopore volume of AC. A study by El-Hindawy in 2003 showed that the oxidation of corncob using nitric acid with a ratio of 50 cm3:5 g of HNO3:carbon for 1 h at 60 °C increased the mesoporosity of surface pores [34]. In another research, HNO3 at 5.2 N was used for 3 h at boiling point, and the oxidization of ash in the waste material (i.e., refuse-derived oil) resulted in the dissolution of ash to nitric acid, hence the mesopore volume was increased [35].
Studies on metal impregnation of AC using iron oxide [17,36] and ferric chloride following high temperature treatment have, thus far, shown improvements in the removal of NOM [37], arsenic [18], bisphenol [38], and aluminum [39]. Aluminum-coated AC has also been used for the removal of arsenate [40] and dye [41]. Aluminum sulfate (alum) and ferric chloride are promising and cost-efficient coagulants with high capabilities in removing DOC and humic acids (HA) in water treatment plants during coagulation–flocculation and sedimentation processes [42]. However, coagulation is not effective in removing low molecular weight and hydrophilic NOM [43], while coagulation in combination with AC has resulted in enhanced removal of DOC and HA [44,45]. Besides, the combination of the two processes reduces the requirement of coagulant doses for water treatment [46]. Many studies have compared the capability of ferric chloride and aluminum sulfate on the removal of NOM as coagulants. However, to the best of the authors’ knowledge, no study has made an attempt to consider ferric chloride as a coating agent without high temperature (i.e., T > 200 °C) activation for NOM removal. Besides, studies thus far have not used Al impregnated AC for NOM removal. Moreover, no comprehensive study has been carried out to compare the efficiencies of aluminum sulfate and ferric chloride coated AC on NOM removal without employing high temperature chemical activation. The objectives of this study are to: enhance the pore structure of AC produced from pulp and paper waste materials for NOM removal; maximize adsorption capacity by a central composite statistical design of experiment and consider the factors of pH, time, and dosage; optimize metal (i.e., Al and Fe) coating on AC considering the levels of metal leaching, dye removal, iodine number, and surface area; and increase the removal of HA as the main precursor of THM4 and HAA5 using metal-coated AC.
2. Materials and Methods
2.1. Production of Activated Carbon
The carbonaceous waste (i.e., fly ash) of CBPPL at Corner Brook, NL, was chosen as the source of AC because of its abundance. The fly ash was first crushed and sieved by a No. 50 mesh to remove the particles larger than 300 microns. Then the sieved fly ash was washed with hot water at 80 °C and was filtered through a 0.45 µm nylon filter. The process was followed by drying the fly ash slurry in an oven overnight at 110 °C. The ground fly ash before washing with nitric acid is named CBPP-R in this paper. The suggested process by Shawabkeh et al. [33] for chemical activation and wash with nitric acid was followed with some modifications. The fly ash was immersed in nitric acid at the concentrations of 0% wt:wt, 5%, and 10% for hydrolysis and removing metals. The fly ash was in contact with acid in the ratio of 1 g to 10 mL, and the mixture was heated and stirred magnetically for four hours at the boiling temperature of 110 °C. Then the fly ash was rinsed with double deionized water (DDIW) several times to reach a stable pH (i.e., delta pH < 0.5). After that, the sample was dried overnight (i.e., more than 12 h) in an oven at 110 °C until the weight was stabilized. The samples after drying are called CBPP-A0, CBPP-A5, and CBPP-A10, respectively. The washed samples were tested for elemental analysis, methylene blue adsorption, iodine number, and BET surface area.
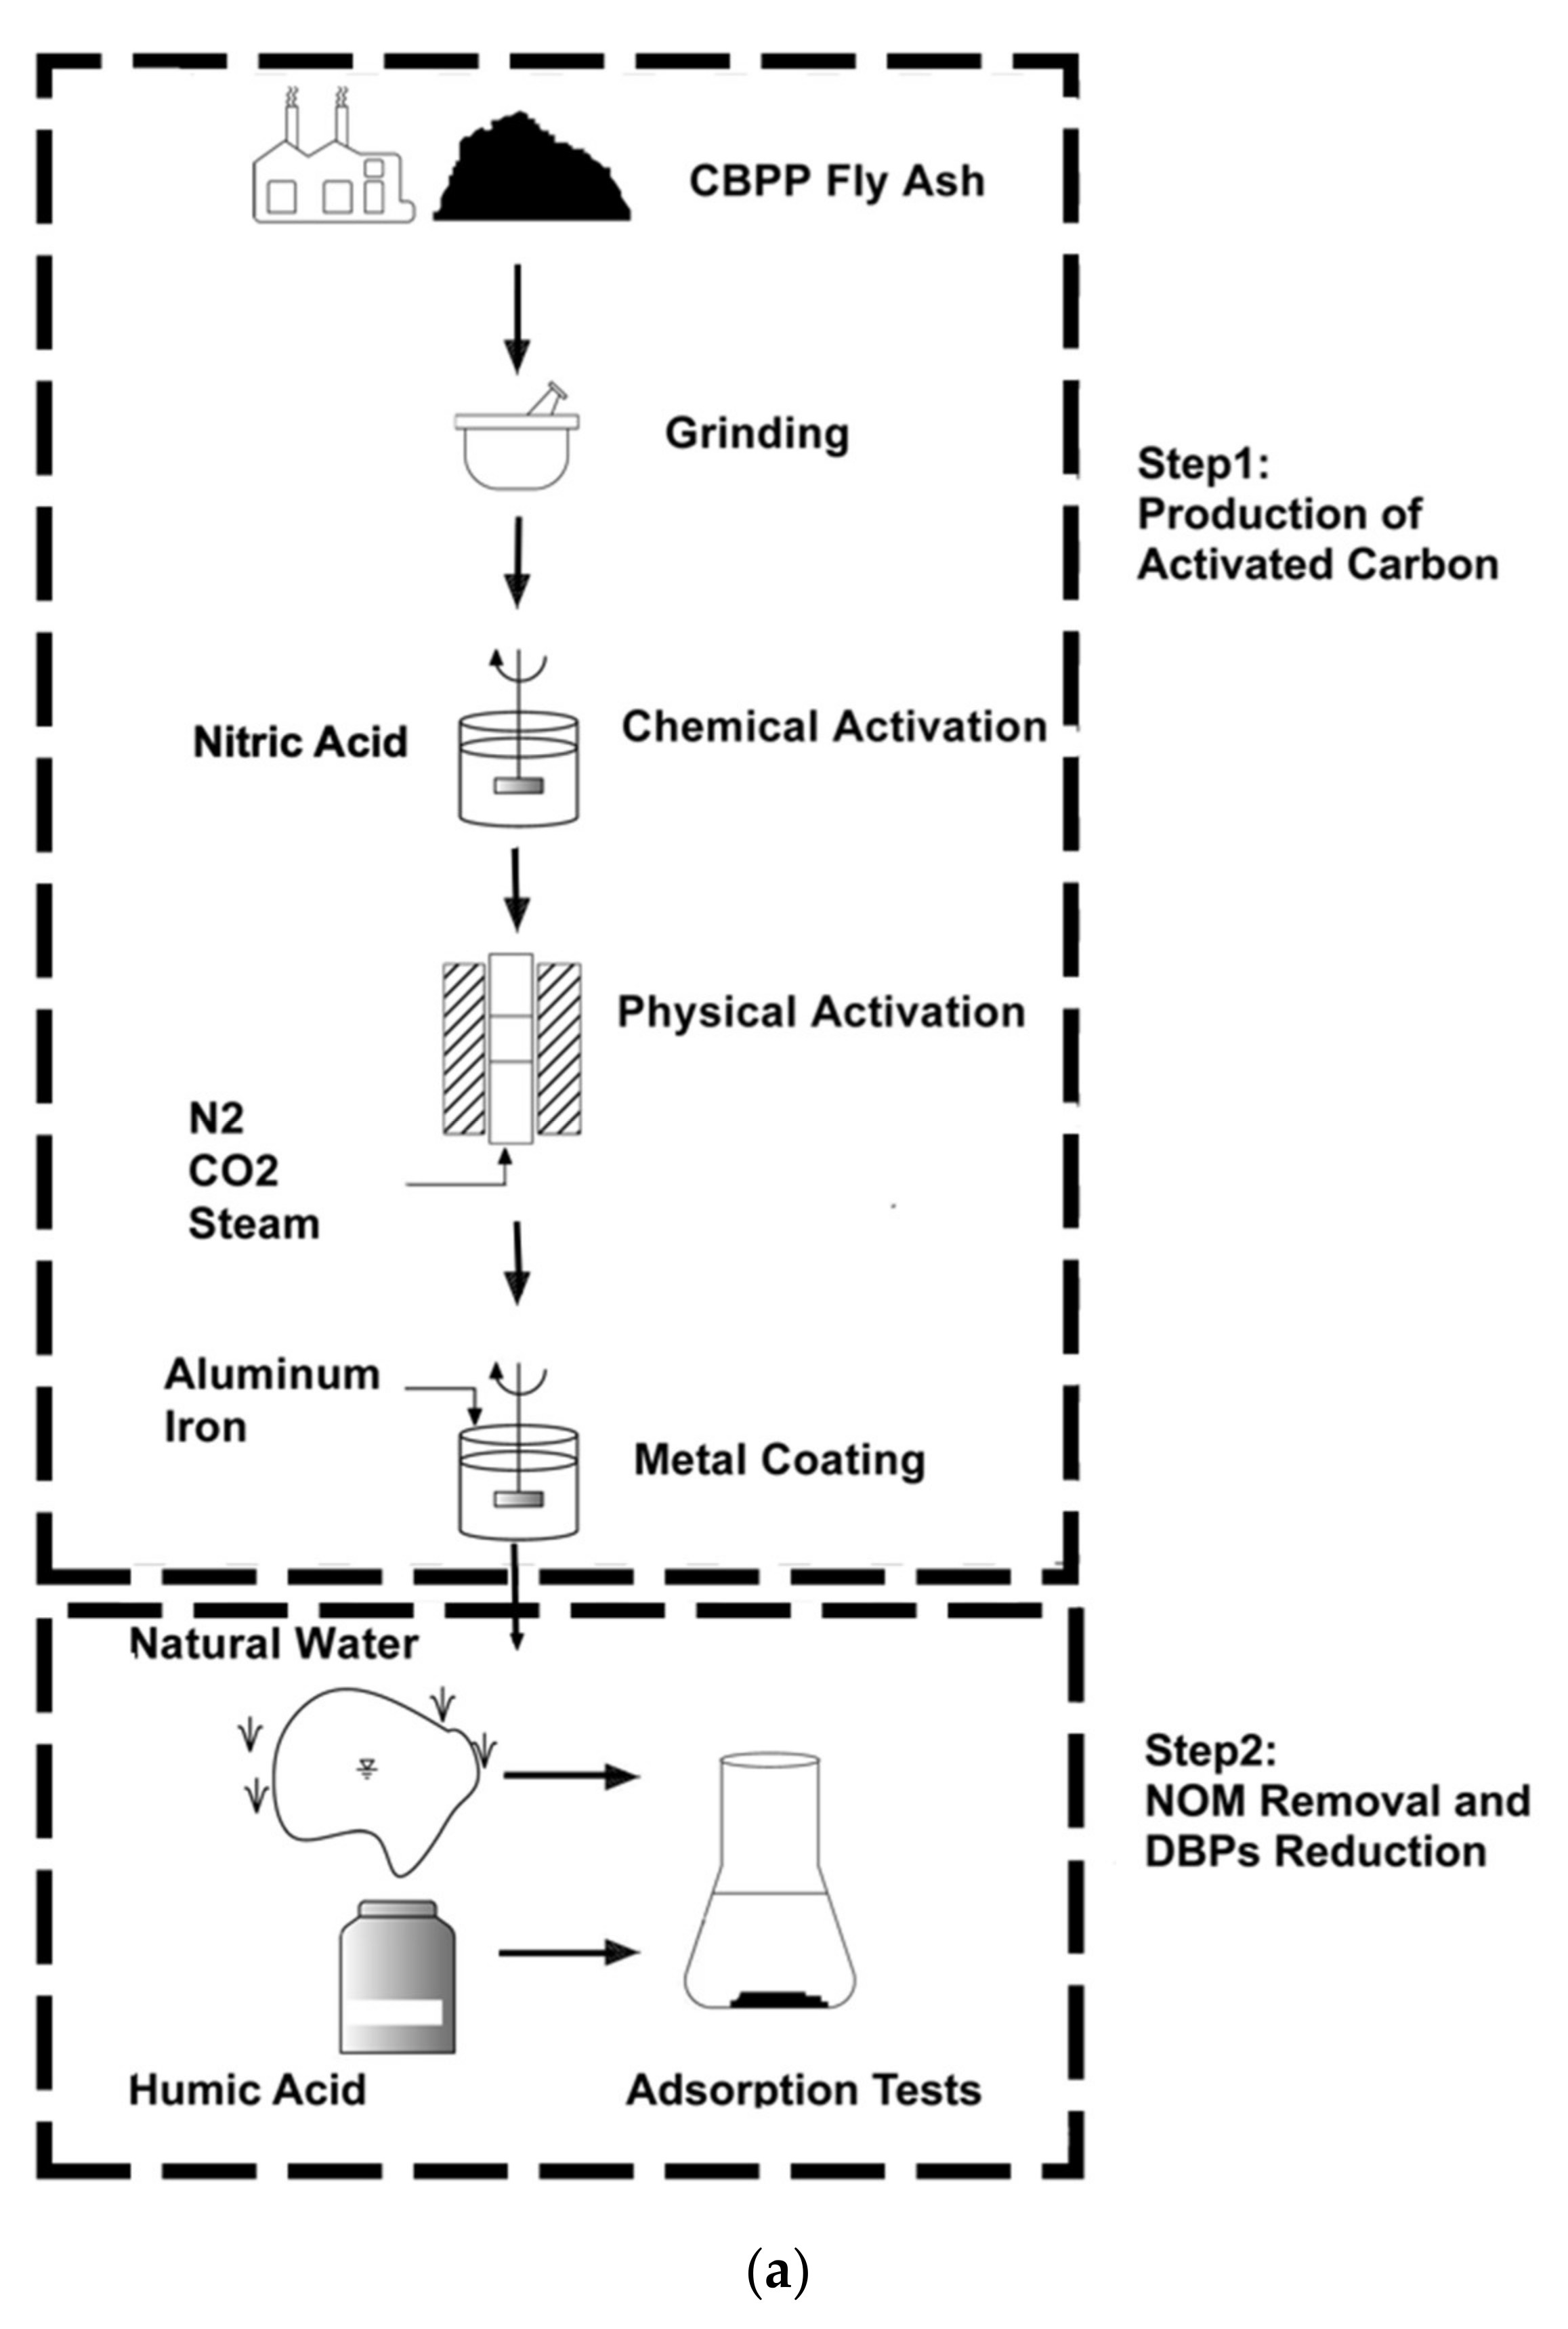
Carbonization and activation are the important steps for increasing pore volume and surface area of AC. Previous studies have shown that increasing temperature during carbonization increases pore volume and surface area of AC and decreases the yield [18,27]. The past study on CBPP waste management showed that increasing temperature under N2 flow at the rate of 500 cm3 min−1 at 15 °C per min to reach 850 °C and continuing carbonization for 1 h at the target temperature followed by 2 h of activation at 850 °C using a mixture of CO2 and steam resulted in a reasonable yield (i.e., less than 50%) and high surface area (SA) (i.e., SA of 1146 g/m2) [18]. However, the CBPP activation resulted in a microporous structure, which is not favorable for removing high molecular weight NOM. The method for physical activation suggested by Tanthapanichakoon et al. [32] and modified by Shadbahr et al. [18] was followed to produce AC in this study. Figure 2a,b illustrates a schematic diagram of the steps of experiments in this study. The first step includes the production of AC (i.e., fly ash, grinding, chemical activation, physical activation, and metal coating), and the second step was performed to evaluate the performance of the metal-coated AC in NOM removal using natural water samples and humic acid solutions.
2.2. Metal Impregnation on AC
The preparation of AC was followed by the metal coating of AC with iron 3 valent capacity and aluminum ions using ferric chloride and aluminum sulfate. The dried AC was added to 50 mL of prepared solutions of metal ions with different concentrations at an AC: metal ion ratio of 0.25, 0.50, 0.75, 1.00, 3.25, 5.50, 7.75, and 10.00% wt:wt. The mixture of AC and metal ions was shaken at 150 rpm on a shaker for 72 h at 25 °C to allow metal ions to penetrate the pores and the surface of the AC. Then the mixture was filtered by a 0.45 µm nylon filter and was dried in an oven at 110 °C for hydrolysis. The coated AC with iron (Fe-AC) and aluminum (Al-AC) were washed with DDIW several times to remove excess metal ions from the surface. The process was completed by drying the AC in an oven at 110 °C until the moisture was removed, and the weight of the AC was stabilized.
2.3. Reagents, Materials, and Instruments
Only analytical grade chemicals, including nitric acid (HNO3) at the concentrations 5% and 10% wt:wt, were purchased from VWR, Canada, for oxidizing the carbon. The stock solutions of ferric chloride anhydrous (FeCl3) and aluminum sulfate (Al2(SO4)3·18 H2O) were prepared daily as sources of Fe and Al for metal-coated AC and coagulation. Hydrochloric acid (HCl) 37% wt:wt, iodine solution (0.1 N), and sodium thiosulfate (Na2S2O3) (0.1 N) were also purchased. Methylene blue (1500 ppm) was used forsingle-point isotherm” indicating maximum adsorption of adsorbent within 30 min at 25 °C [47]. NaClO at 30% wt:wt was used for chlorination. Methyl tert-butyl ether (MTBE) purchased from J.T. Baker, USA, was used for extraction of THM4 and HAA5 following the methods: EPA 551.1 [48] and EPA 552.2 [49] with an Agilent 6890 gas chromatograph equipped with ECD. UV absorbance was measured using a Genesys 10S UV/Vis’s spectrophotometer (Thermo Fisher Scientific, USA). pH was measured using a benchtop FE20 pH meter (Mettler Toledo, USA). Carbon dioxide and nitrogen were of 99.99% purity and were purchased from Praxair Canada Inc. for AC generation.
2.4. Optimization
To find the most efficient operational conditions for the highest adsorption capacity, an optimization was carried out through the following steps: choosing the factors and levels; statistical design of experiment (SDE) and developing a run sheet; analysis of the results and recognition of effective factors; developing the regression models through analysis of variances (ANOVA); evaluation of model accuracy; and projection of the optimized condition. The independent variables, i.e., time (A), AC dosage (B), and pH (C), were selected for investigating the DOC removal and equilibrium adsorption (qe). The AC dose was estimated based on the preliminary experiments [28]. Table 1 demonstrates the factors and corresponding levels for the experiment.
To acquire the lowest number of runs corresponding to clear effects, a response surface methodology (RSM) and central composite design (CCD) were chosen. The CCD design for 3 factors and 17 runs (13 runs and 4 center points) provides a resolution V design where the main and two-factor interactions are aliased with high order interactions [50]. The experiments were performed in triplicate. A second-order quadratic model can correlate the factors to the responses (i.e., DOC removal and qe) using Equation (1).
Similitude analysis and estimation of the coefficients in the quadratic model were performed using ANOVA via a backward elimination of insignificant factors (p-value > 0.10) with the Design-Expert, Stat-Ease, Inc., Minneapolis, MN, USA, version 10.0.8.0 (2017). This software was also used for the generation of contour plots.
2.5. Characterization of AC and Methods
The methods that were used for characterization of AC were: ASTM method D3838-05 for pH value, ASTM method D2867-09 for moisture content, ASTM method D2866-11 for ash content, single point isotherm within 30 min at 25 °C [47] for methylene blue adsorption, ASTM method D4607-1 for iodine value, pH of zero potential, and particle size using a Zetasizer Nano ZS (Malvern); Brunauer, Emmett, and Teller (BET) using a Micrometric Tristar II 3020 (Micromeritics Instrument Corporation, GA, USA) for nitrogen adsorption–desorption at 77 K for measuring specific surface area and pore volume; ASTM method D8371-20 for metal content (Al and Fe) in AC using incineration; strong acid digestion, and ICP-OES for elemental analysis; scanning electron microscopy (SEM) using TERRA instruments for the investigation of surface microstructure and surface metal analysis.
2.6. Water Sample Analysis
Raw water samples were collected from three lakes that were the sources of small drinking water systems (i.e., serving less than 3000 people [51]) in NL, Canada. The selected water samples were collected from August 2016 to July 2019 for evaluating the efficiency of AC in the removal of moderate to high levels of DOC and a VHA: DOC fraction of NOM (i.e., 0.67 to 0.81). Synthetic water samples containing model compounds of very hydrophobic acids and neutral hydrophilic fractions were prepared using HA and polysucrose with different mixing ratios as reported in Table 2. The stock solutions were prepared at a concentration of 1 g of the target chemical into 250 mL DDIW and stirring at 200 rpm overnight. The procedure was followed by passing the stock solution through a 0.45 µm nylon filter and slowly increasing the volume to 1 L before analysis by a DOC analyzer according to ASTM D7573 (2013). All raw and treated water samples were analyzed for pH, UV absorbance at the wavelength of 254 nm, DOC, and NOM fractionation based on hydrophobicity as described in [42]. DBPs (i.e., regulated THMs and HAA5) were measured according to the formation potential content within 72 h after chlorination to minimize the noise/signal ratio of subjected parameters. The levels of free chlorine after 72 h were measured following N-diethyl-p-phenylenediamine (DPD) colorimetric method. The free chlorine levels were in the range of 0.05–0.20 mg/L.
2.7. NOM Characterization
The water samples were characterized for NOM content with measuring DOC according to ASTM D7573 method [52], and NOM fractionation was performed based on hydrophobicity and acidity. NOM fractions were identified by adsorption into resins in four categories (i.e., very hydrophobic acids (VHA), slightly hydrophobic acids (SHA), charged hydrophilic (CHI), and neutral hydrophilic (NHI)) following therapid fractionation technique” [53,54] with modification in previous research [42]. NOM removal was evaluated using the modified AC with metal coating using iron and aluminum (i.e., Fe-AC and Al-AC) and non-modified AC. The NOM removal and DBPs reduction were calculated as:
where Ci and Cf and are the initial and final concentrations of the water samples. The NOM removal was evaluated using natural water samples. The adsorbents were shaken in 200 mL of water samples at a concentration of 150 mg/L for 15 to 1440 min at the ambient temperature of 22 2 °C. The process was followed by filtration of the mixture through 0.45 µm membrane. Then, the NOM removal was measured for all the metal-coated AC and raw AC. The metal-coated AC with Fe and Al showed the highest NOM removal efficiencies, which were selected for the equilibrium adsorption isotherms and kinetic studies.
2.8. Equilibrium Adsorption Isotherms
The adsorption of DOC in humic acid solution and natural water samples were investigated on the selected metal-coated ACs in synthesized and natural water samples. The synthetic water samples containing humic acids at a concentration of 10 mg/L and natural water samples were used for this step. Selected adsorbents at a concentration of 0.02 to 1 g/L were in contact with 200 mL of water samples on a shaker at a rotation speed of 150 rpm for 24 h to reach the equilibrium. Then the samples were passed through a 0.45 µm membrane filter and were tested for DOC content. The nonlinear form of Langmuir, Freundlich, and Temkin was used for the analyses using MATLAB (MATLAB R2020b, 2020). The amount of adsorbed DOC at time t, qt (mg/g) was calculated using the following equation:
where Ci and Cf and the initial and final concentrations of DOC (mg/L) in the water samples, W (g) is the weight of tested adsorbent in the mixture, V (L) is the volume of the synthetic or natural water sample.
2.9. Adsorption Kinetic Models
To investigate the sorption kinetic models, AC and the optimized metal-coated ACs were added to the humic acid solution and natural water samples at a dosage of 0.15 g/L. The mixtures were shaken on a shaker for 5 to 1440 min. Then, the mixtures were filtered through a 0.45 µm filter and were tested for DOC and UV254. Pseudo-first order (PSO), pseudo-second order, and Evolich models were fitted to the data to figure out the best kinetic models.
3. Results and Discussion
3.1. Characterization of Adsorbents
3.1.1. Effect of Nitric Acid
Fly Ash
To evaluate the effect of nitric acid on the pore structure of adsorbents before physical and thermal activation, elemental analysis was performed on CBPP-A0, CBPP-A5, and CBPP-A10. The effects were also investigated through measurement of IN, MBV, BET surface area, mesopore, and micropore volumes of adsorbents after physical activation. The results of elemental analysis are presented in Table 3. The data from the treatment with nitric acid at concentrations of 5 and 10% show a decrease in the levels of iron, aluminum, copper, and calcium. The increase in the concentration of nitric acid shows 0.97 to 23.60 (mol) improvement in the removal of metals from the fly ash. However, the doubled intensity of acid washing (i.e., from 5 to 10%) did not have the same effects in the removal of all elements (i.e., zinc and copper). The magnitude of metal removal depends on the type of metal (i.e., reduction potential) and strength of the acid. Nitric acid solution with 0–10% concentration is categorized as very diluted with the capability of dissolving most reactive metals (i.e., reduction potential < −0.4 V) [55]. The results show that the chemical treatment of fly ash with nitric acid is a crucial step before activation. The highest level of metal removal (mol) from the adsorbent precursor (i.e., CBPP before activation) belongs to calcium that poses the lowest reduction potential value among the listed metals in Table 3 [56] and the highest concentration of metal in the fly ash. An increase in the concentration of nitric acid from 5 to 10% does not affect the reactivity of the nitric acid [55]. However, an increase in the available oxidant in the acid solution has resulted in an obvious improvement in the removal of calcium, magnesium, and aluminum from the fly ash. The measured pH for three different types of nitric acid-washed fly ash (i.e., CBPP A0, CBPP-A5, and CBPP A10) after several rinses with DDIW are 11.05, 3.45, and 3.24. The ash and moisture contents for CBPP-A0 are 13.88 and 1.72 , respectively. The values for CBPP-A5 are 3.92 and 0.47, respectively. The ash and moisture content for CBPP-A10 are 3.62 and 0.43, respectively.
Activated Carbon
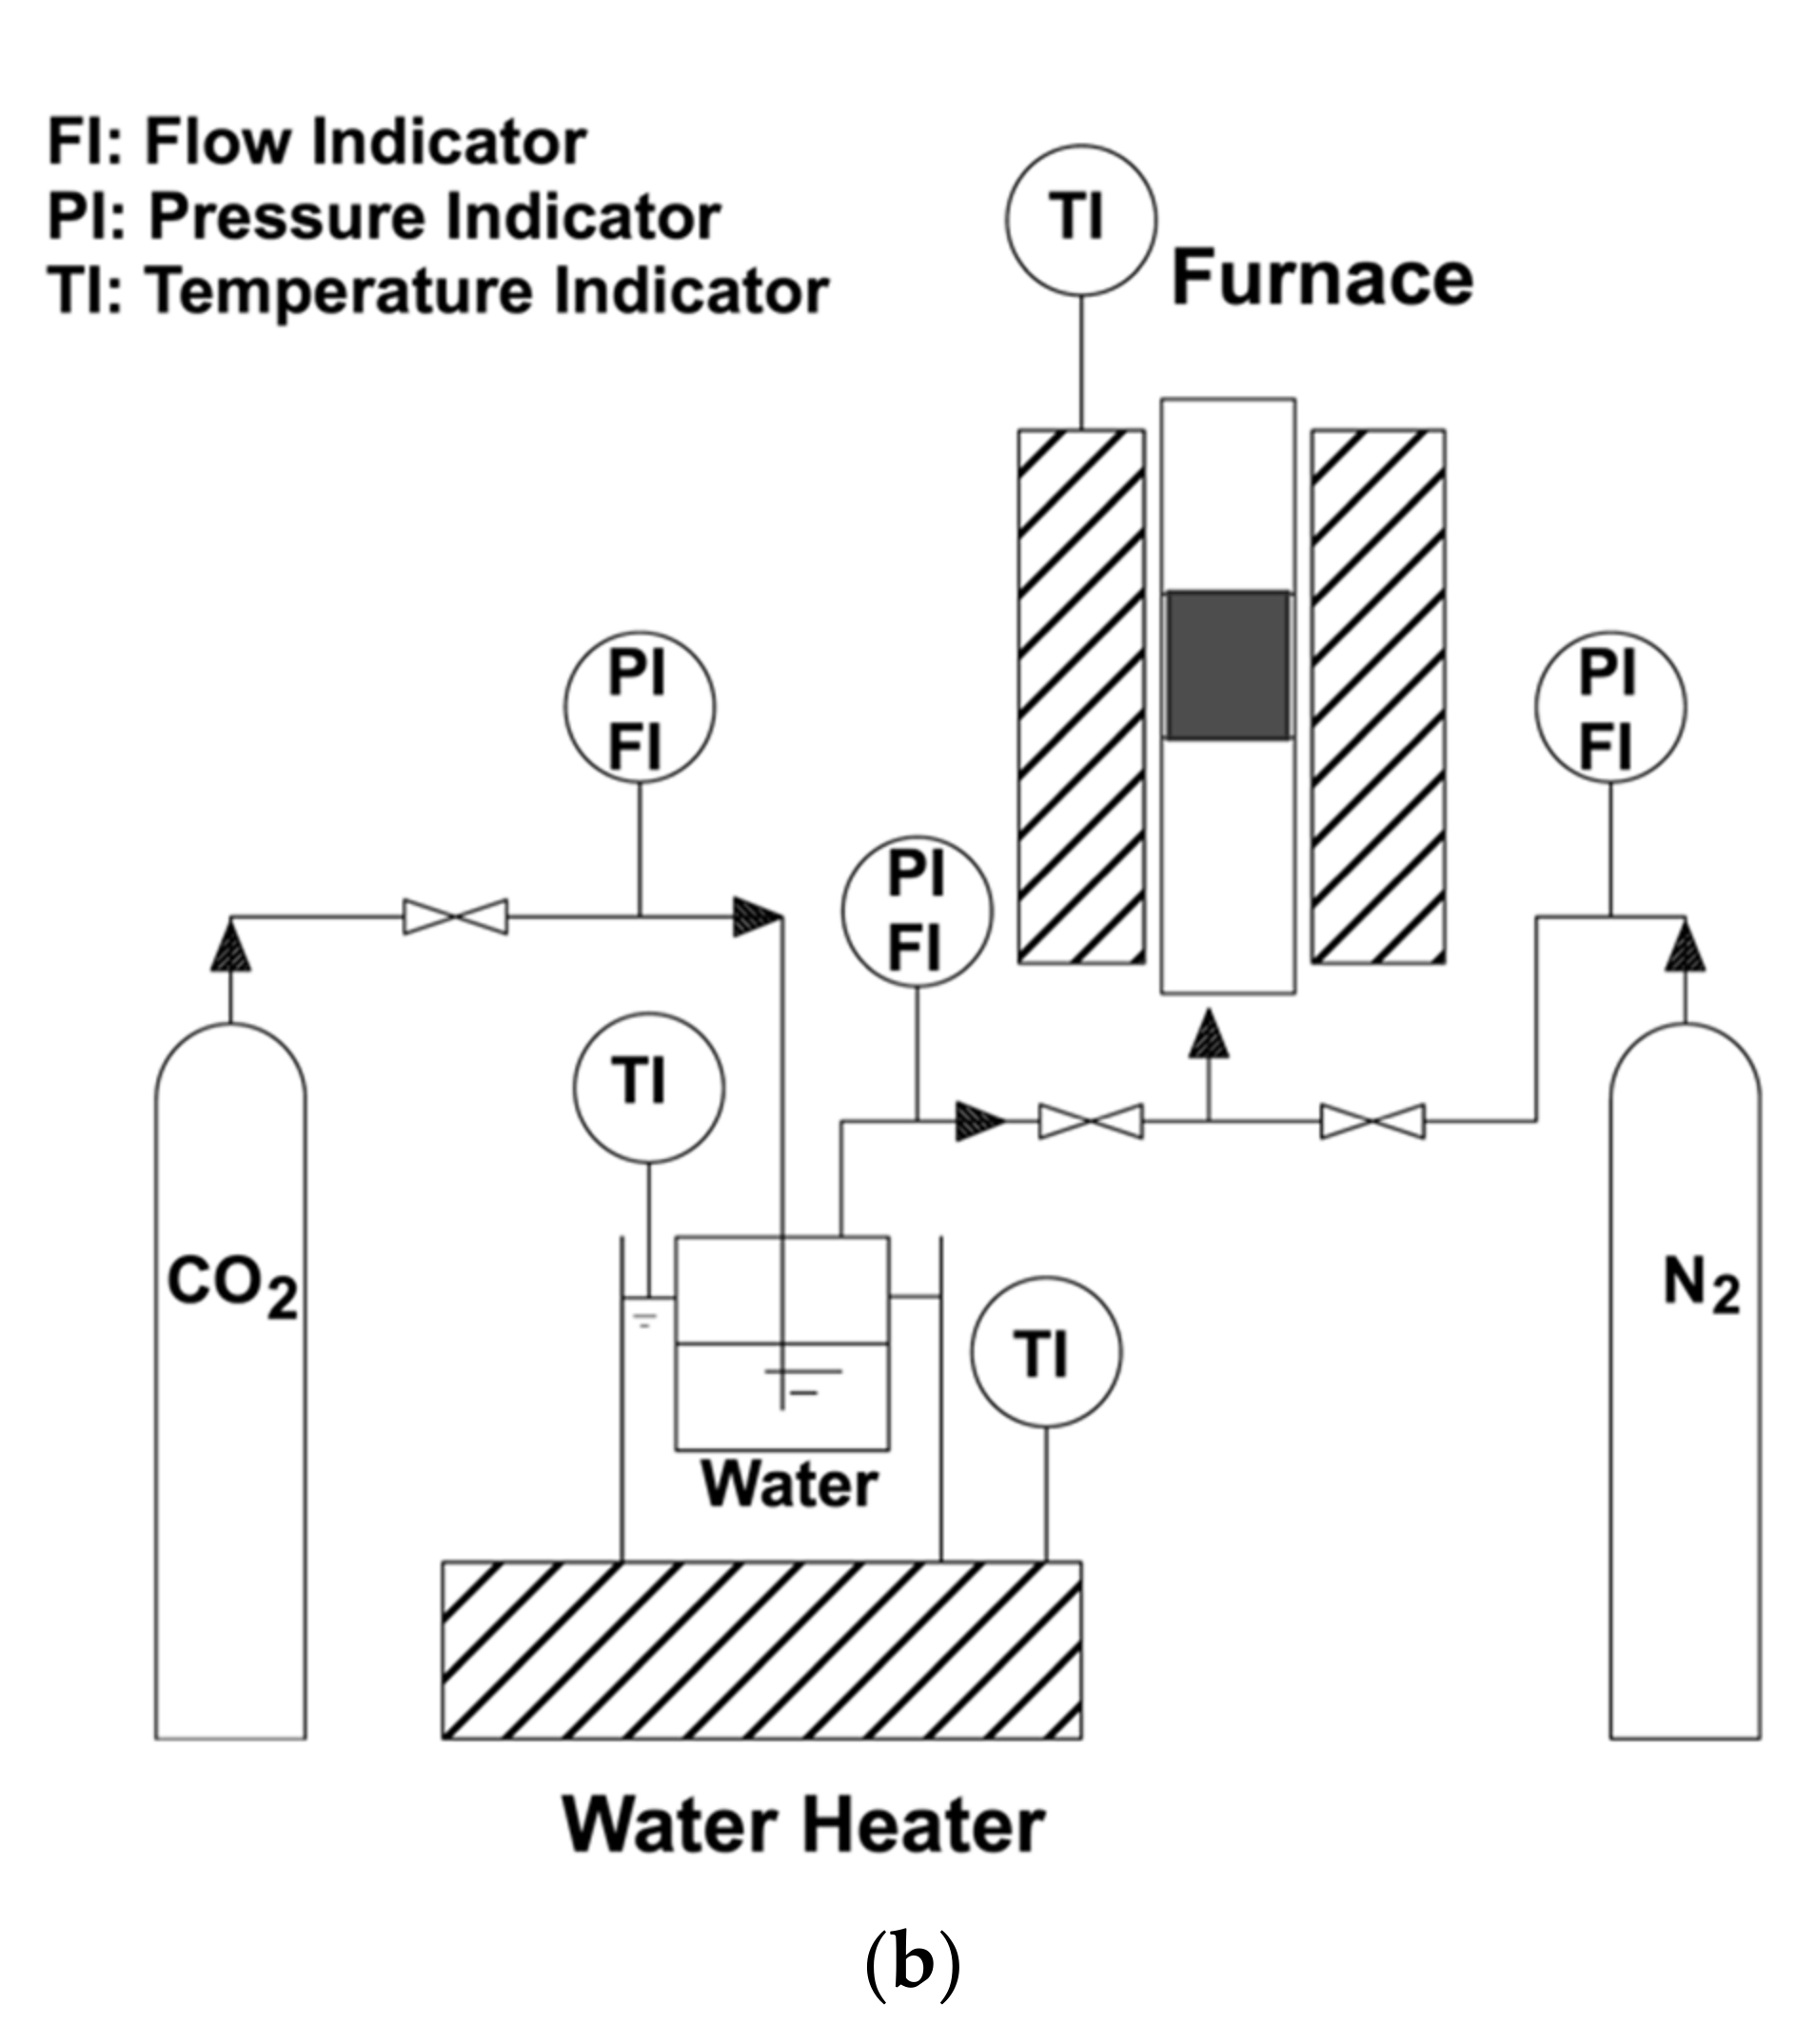
To increase the absorption properties of acid-washed fly ash, 10 g of the samples (CBPP-A0, CBPP-A5, and CBPP-A10) were placed in the tube furnace (Carbolite Gero, Germany). The furnace was programmed to increase the temperature at a rate of 15 °C/min using nitrogen gas, with a rate of 500 cm3/min, to reach 850 °C for carbonization. Then, the nitrogen flow was switched to a mixture of CO2 gas (purity > 99.99%) and water vapor, with a flow of 500 cm3/min, for two hours at the temperature of 850 °C, to perform the activation process and to increase the porosity, which was described in the previous research [18,26]. The importance of the surface area and the characteristics of the porous structure of activated carbon are inevitable for the evaluation of adsorbents, which can be measured by BET sorption. Methylene blue dye and iodine can be used as easy methods for the estimation of the surface area and the porous structure of AC. MBV can express estimation of the mesoporous volume and IN shows the microporous structure of AC [57]. The results of IN and MBV for activated samples are presented in Figure 3. An increase in the concentration of nitric acid has increased both MBV and IN. MBV for the activated carbon that was cleaned by 5 and 10% nitric acid are 214 and 265 mg/g, while the related IN adsorption were 1023 and 1212 mg/g, respectively. Thus, a 23.77 and 18.47% increase for MBV and IN, respectively, were obtained by increasing the concentration of nitric acid from 5 to 10%. Thus, an increase in the concentration of nitric acid (i.e., from 5 to 10%) resulted in better development of mesopore structure rather than micropores. The results agree with earlier findings. El-Hindawy found that nitric acid increased the mesoporous structure of activated corncob of the surface pores [34].Another study on oil waste also showed that treatment with HNO3, even in moderate concentrations (i.e., at 5.2 N), improved the mesoporosity of adsorbent [35]. As a result, AC-A10 was selected for further investigations and metal coating.
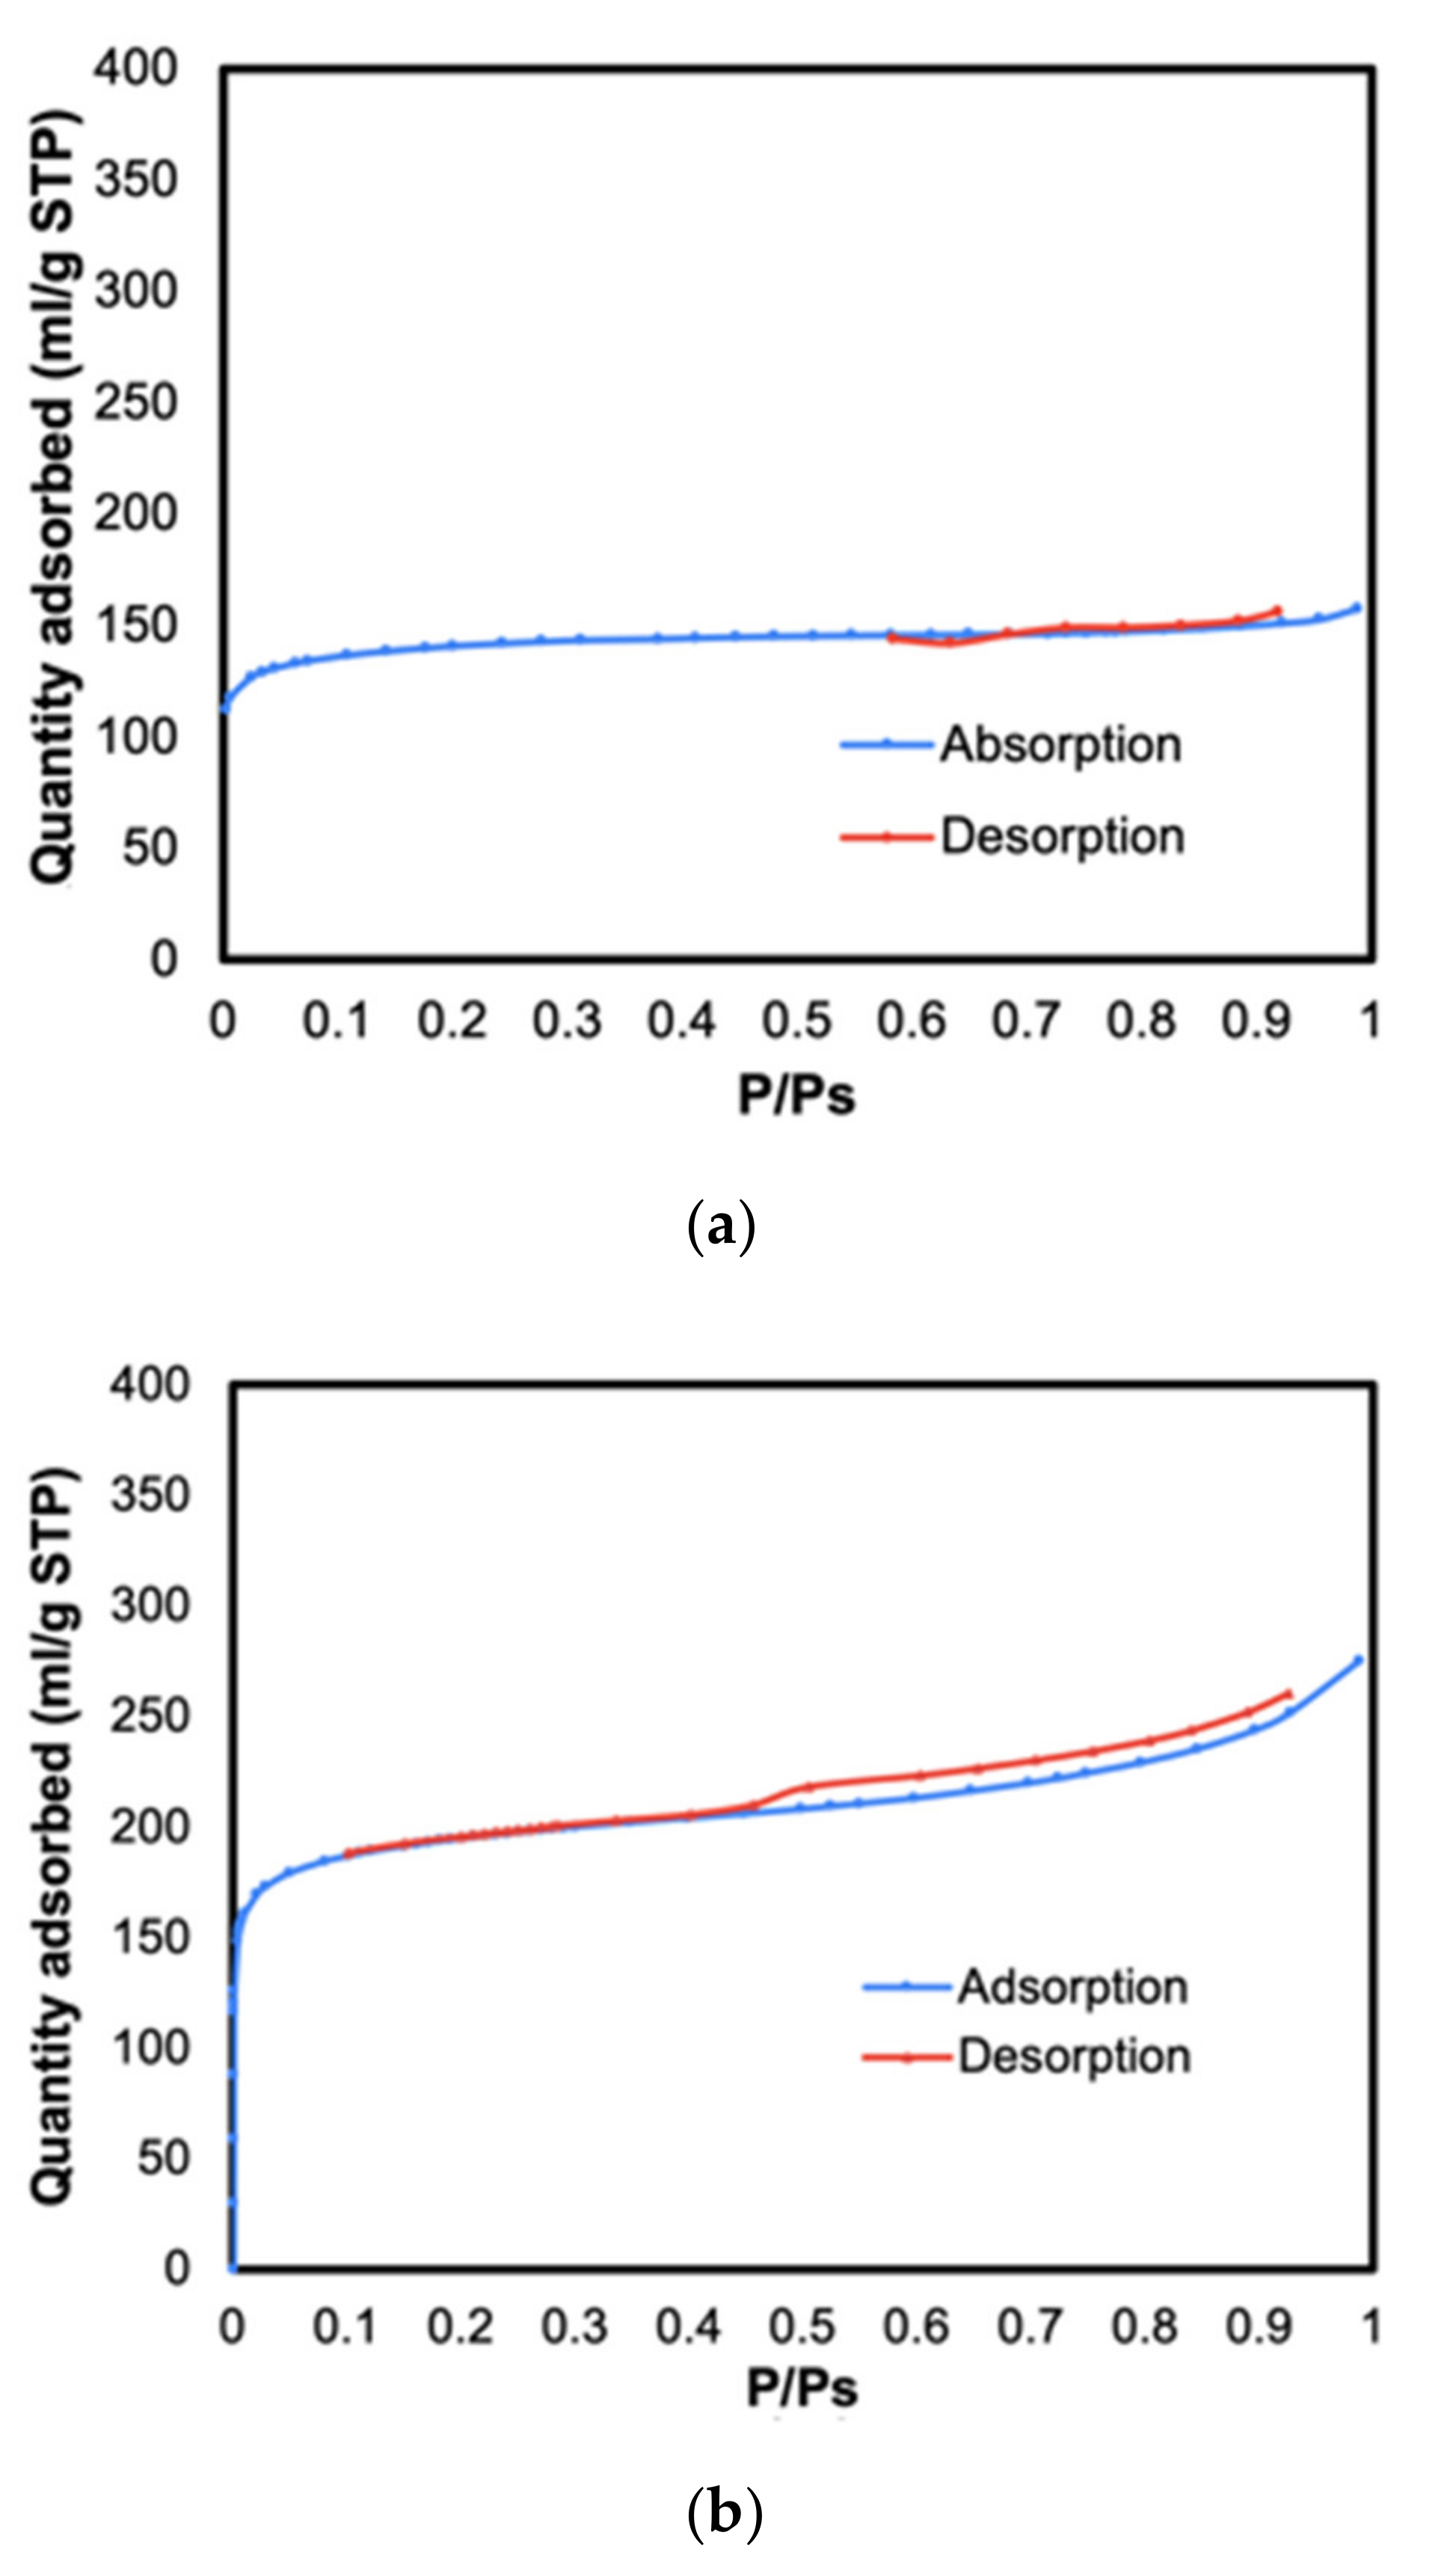
The BET surface area and pore size distribution are ruling characteristics that show the ability of the medium to remove the adsorbates [58]. N2 adsorption isotherms of AC-A0, AC-A5, and AC-A10 are presented in Figure 4a–c. BET surface areas of 455.79, 726.83, and 808.29 m2/g were obtained for AC-A0, AC-A5, and AC-A10 accordingly. The pore volumes of 0.11, 0.18, and 0.21 cm3/g have resulted, respectively. An increase in the concentration of nitric acid solution increased the pore volume and BET surface area. The pore width analysis for AC-A5 showed an average pore width of 9.2 nm, while the pore width for AC-A10 was 10.5 nm. Thus, nitric acid positively contributed to the development of a more porous surface structure and wider pores. The N2 adsorption–desorption isotherm for AC-A0 in Figure 4a belongs to type I isotherms, indicating a microporous structure. An increase in the concentration of nitric acid in Figure 4b,c demonstrates the change of isotherm to type II with an increase in the amount of macropores and a mixture of monolayer and multilayer adsorptions [59]. The results in gas adsorption agree with soaring values of MBV with an increase in nitric acid concentrations, which confirms the positive effect of nitric acid in increasing the mesopores and macropores in AC-A10.
3.1.2. Metal Coating on Activated Carbon
Optimization and Metal Leach
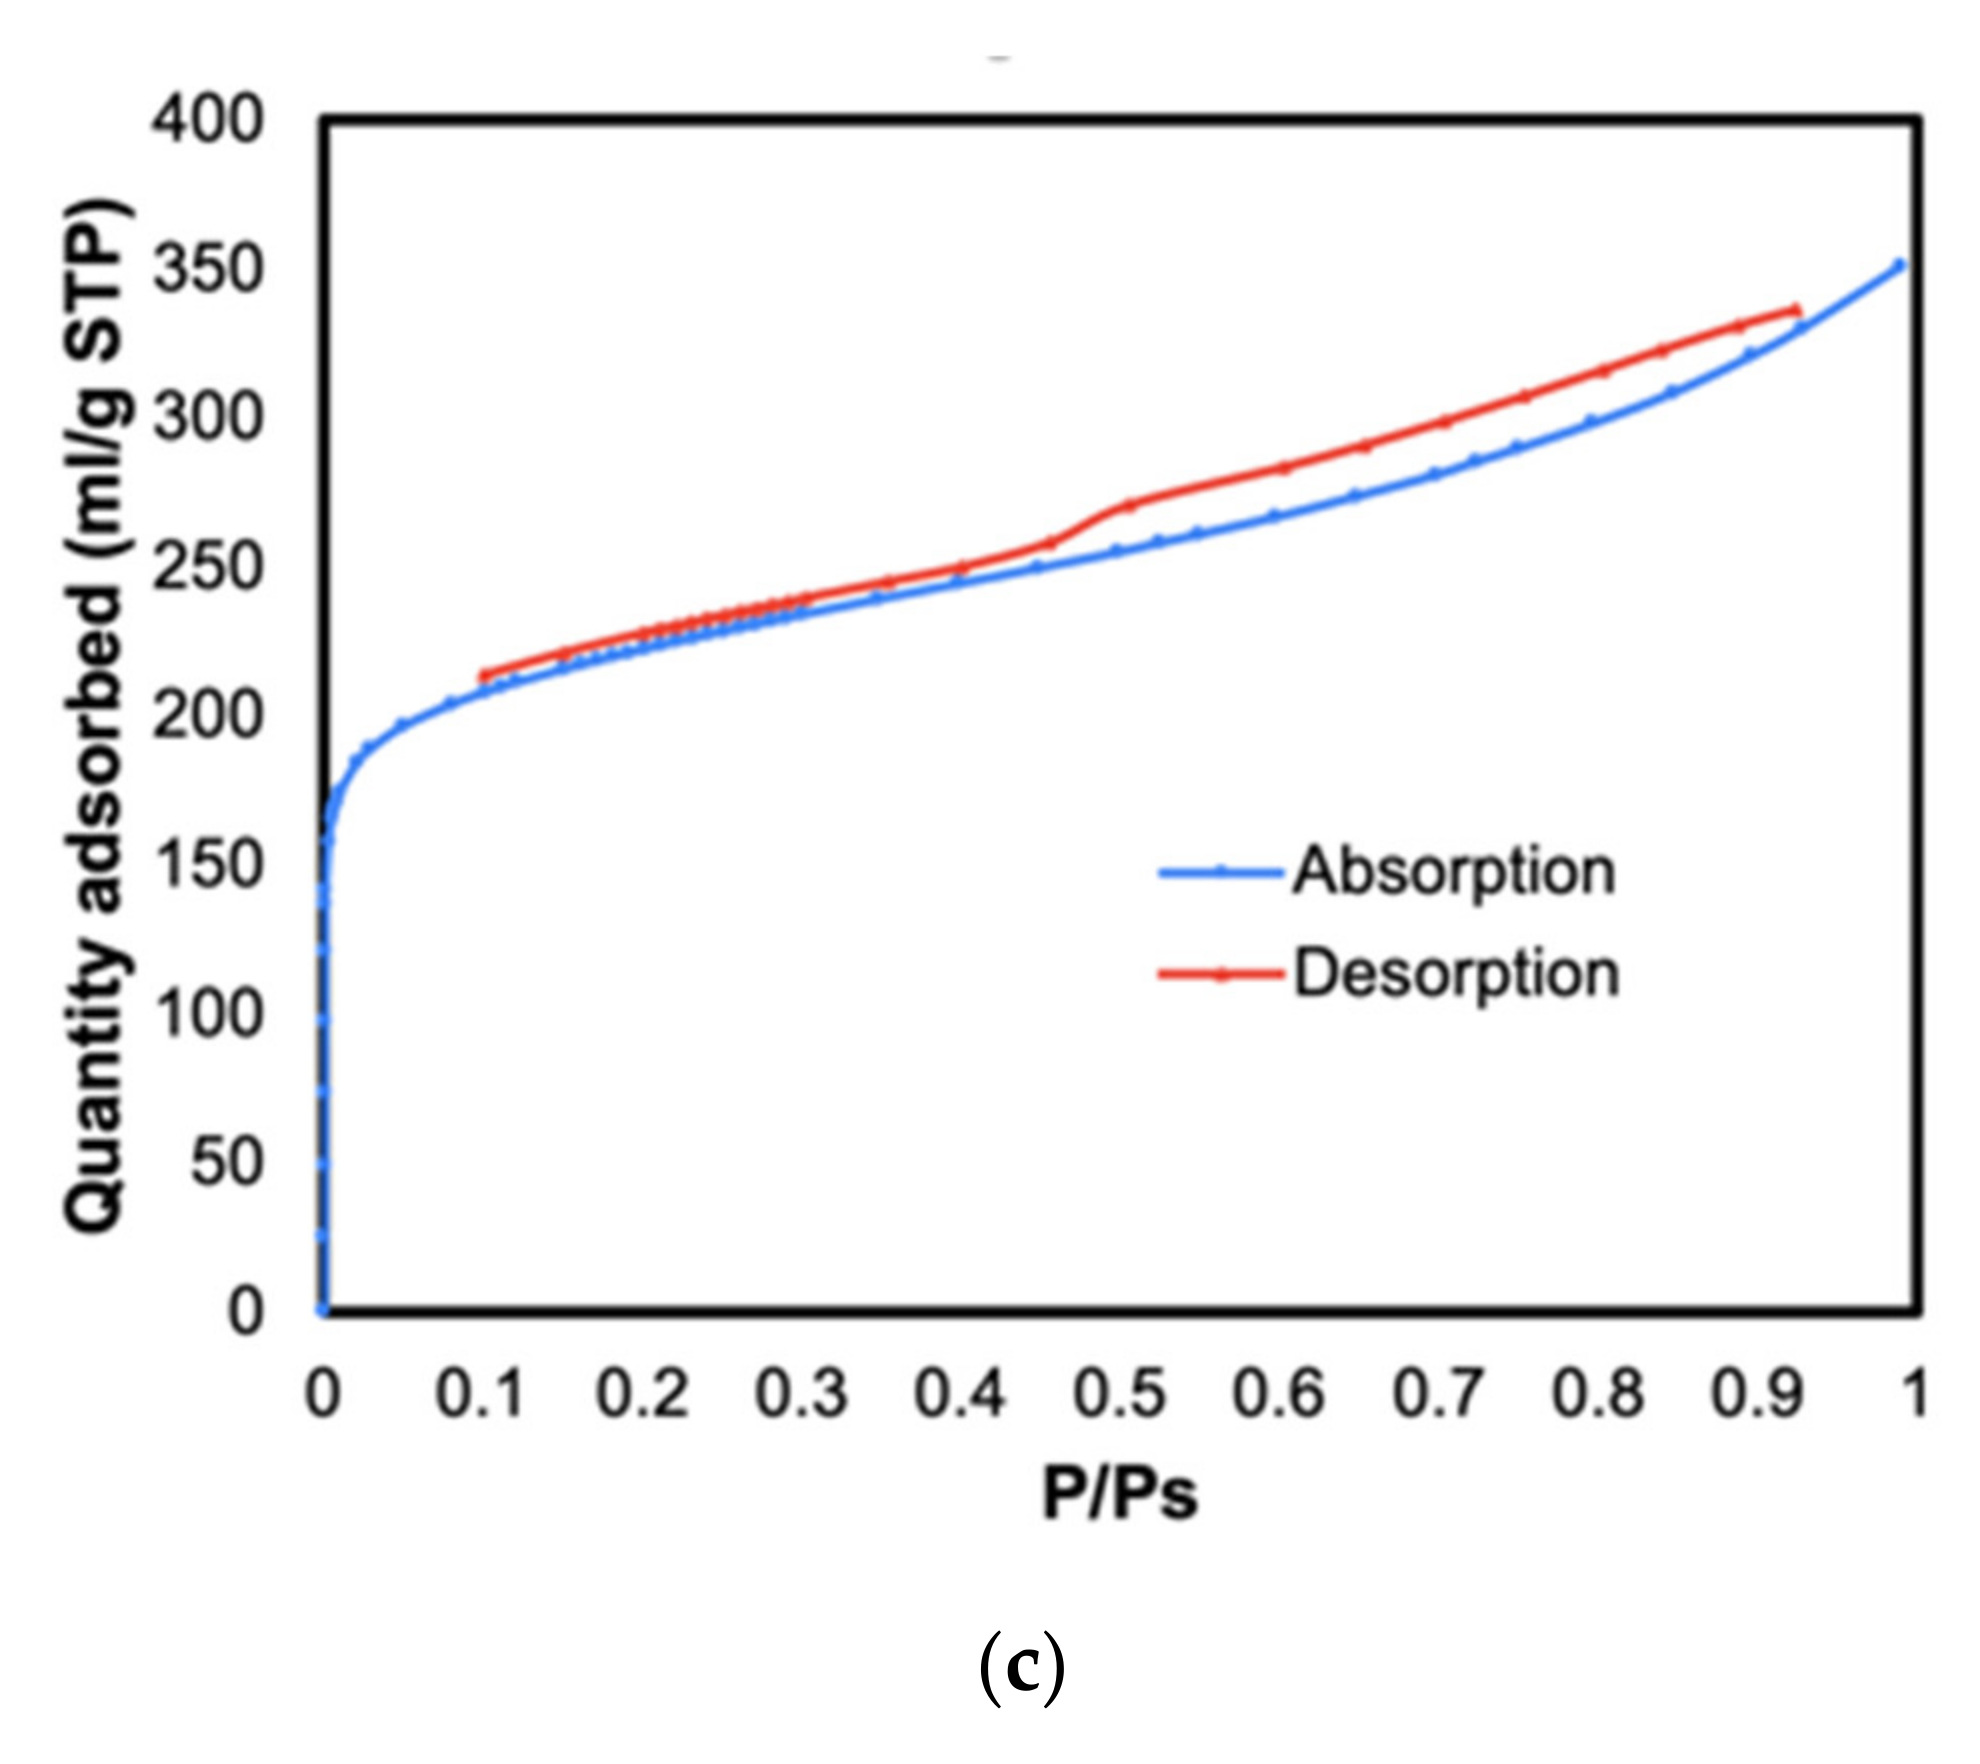
Adsorption tests were performed in triplicate testing using natural water (i.e., water samples 1 and 2) to determine the best dosage of metal impregnation on the fly ash-based AC-A10 using ferric chloride and aluminum sulfate. Thus, AC-A10, Fe-AC, and Al-AC with impregnation rates of 0.25 to 10.00% (wt:wt) of AC to metal ions were mixed with water sample 1 at a dosage of 0.15 g/L. Adsorbents were in contact with water for 24 h to employ the highest adsorption capacity of developed AC, as was resulted in the optimization step. The performance of AC-A10 and modified AC (i.e., metal-coated) in DOC removal are presented in Figure 5a,b. The highest NOM removal by Al-AC of 71.09 and 84.40% was obtained by metal: AC ratio of 1% in water samples 1 and 2, respectively. The best performance of Fe-AC has resulted in a metal: AC ratio of 0.75% with 63.07 and 74.32% in water samples 1 and 2, respectively. The adsorption results on both water samples revealed that modified AC with iron and aluminum had an increased DOC removal with increasing metal to AC ratio up to 0.75% and 1.00% iron and aluminum, respectively. A decrease in NOM removal was observed with higher impregnation rates. However, the deviations in the removal of DOC in water sample 1 by Fe-AC were not as obvious as the results obtained in water sample 2. Generally, Al-AC showed a higher NOM removal in comparison to the iron-coated ACs in both water samples. Thus, the best modified AC with metals is Al-AC 1% and Fe-AC 0.75%.
The results of ICP-OES on raw and treated water samples by Al-AC and Fe-AC with metal: AC ratio of 0.25 to 5.5% are presented in Table 4. The results of the treated water samples show that the highest concentrations of Al and Fe are 100 and 70 ppb, respectively. The maximum allowable concentration of aluminum and iron in treated waters according tosecondary drinking water regulation” are 200 and 300 ppb, respectively [60]. Thus, even with high levels of metal coating on the activated carbon (i.e., 10%), the metal leaching from developed AC in this study was not observed. Further, the concentrations of Al, Fe, and Ca in treated water samples were decreased. The results of Fe and Al concentration show that Fe concentration has dropped to 0.05 mg/L in the treated water sample by 1.00% Al-AC (i.e., removal = 68%) in comparison with the removal efficiency of 56% by 0.75% Fe-AC. Therefore, the produced adsorbents in this research are safe for water treatment.
Characterization of Metal Coated Activated Carbon
The BET surface area, micropore volume, Langmuir surface area, MBV, IN, zero potential pH, and particle size by Zetasizer for AC-A10, 0.75% Fe-AC, and 1.00% Al-AC are presented in Table 5. The results from the N2 adsorption isotherm show that the metal coating of AC decreases surface area and micropore volume (i.e., AC-A10 > 1.00Al-AC > 0.75% Fe-AC). The results of DOC adsorption by Al-AC and Fe-AC showed higher NOM removal by Al-AC compared to Fe-AC. The results agree with the lower surface area and Langmuir surface area of 0.75% Fe-AC in comparison to Al-AC. In addition, the iodine numbers of 931 and 925 mg/g for Fe-AC and 1.00 Al-AC demonstrate a more microporous structure for 0.75 Fe-AC. The iodine adsorption showed a significant decrease by metal coating on AC, which shows that a small portion of micropores (i.e., 4.7 to 10.8% of Langmuir surface area) have been blocked by metal oxides.
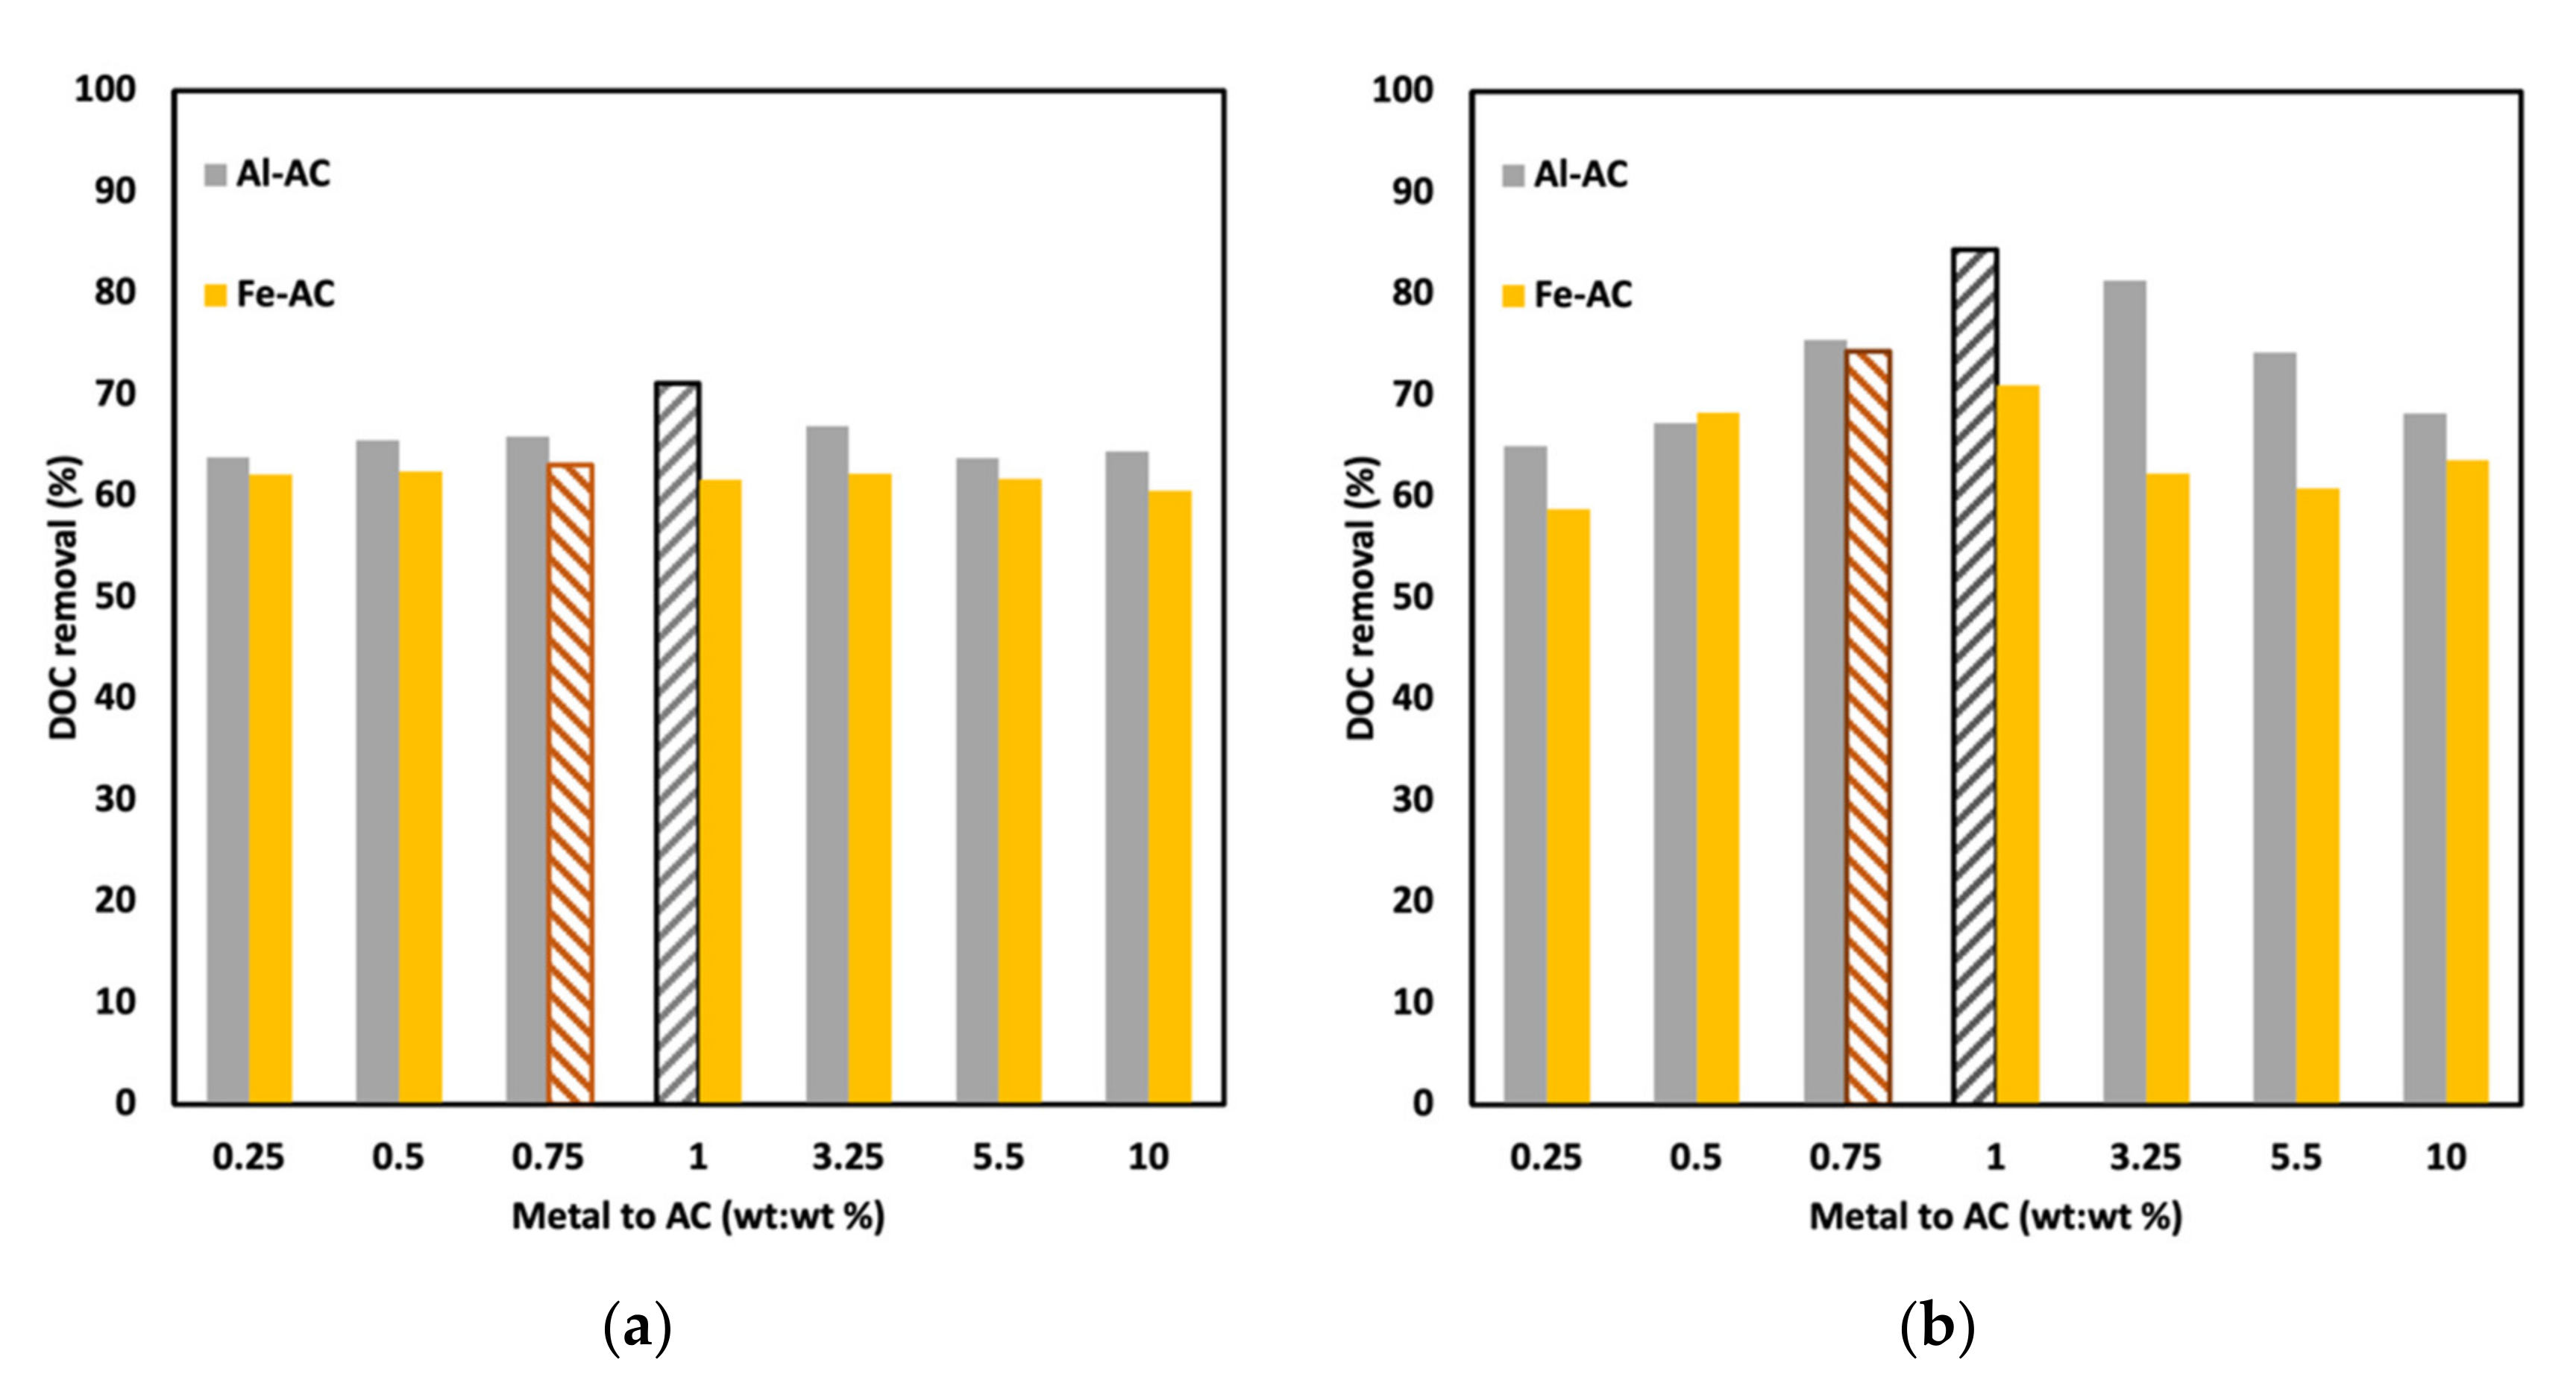
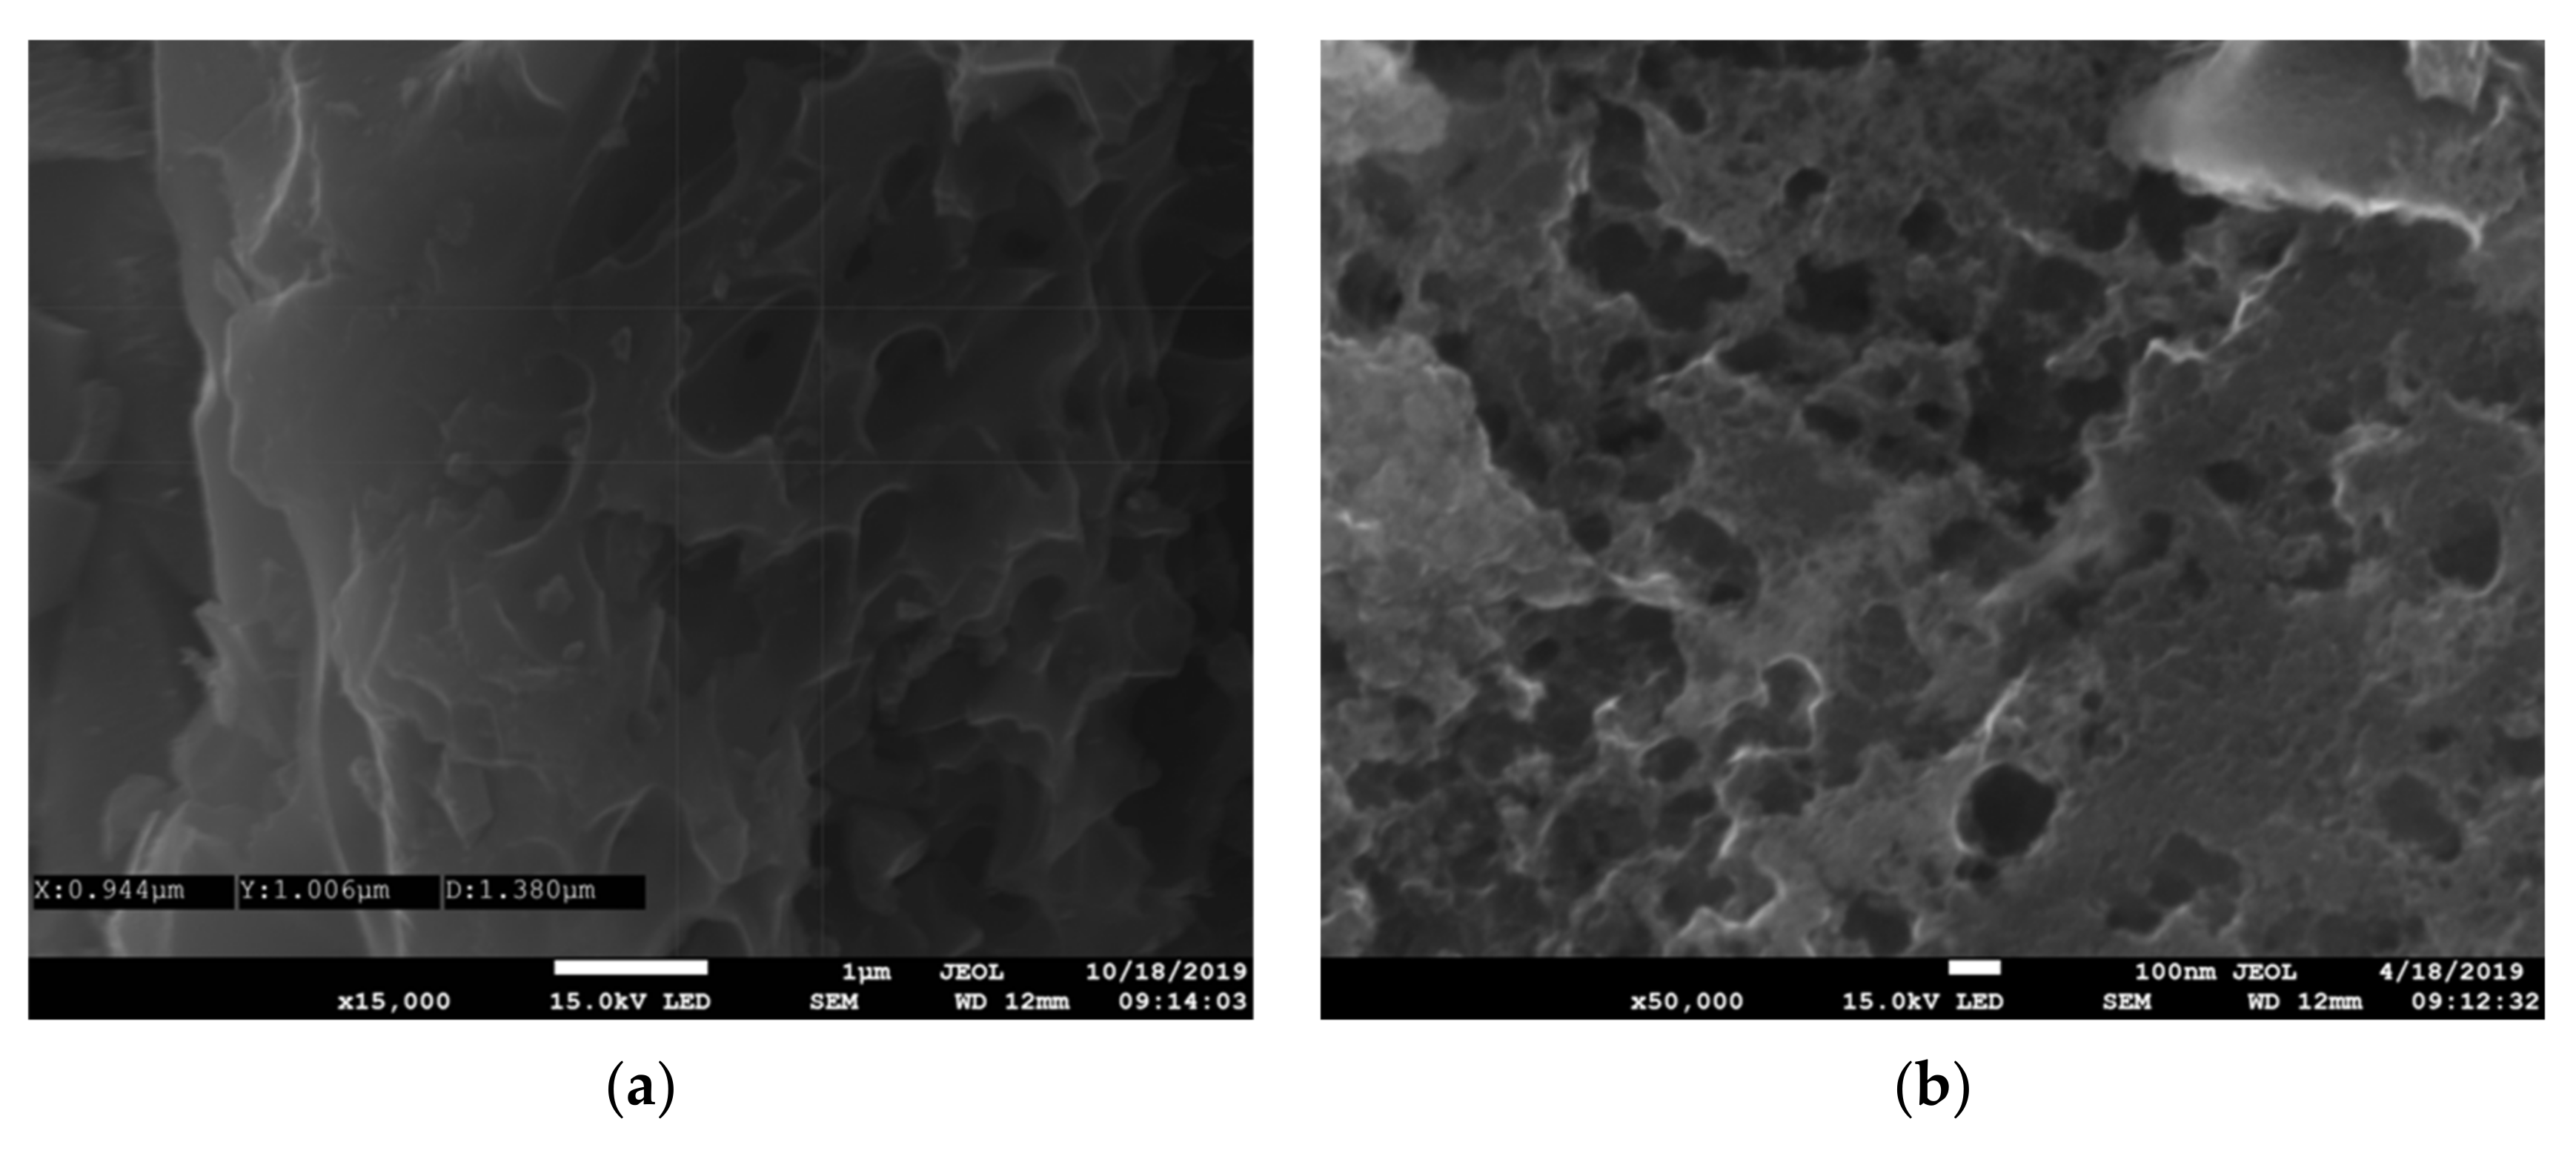
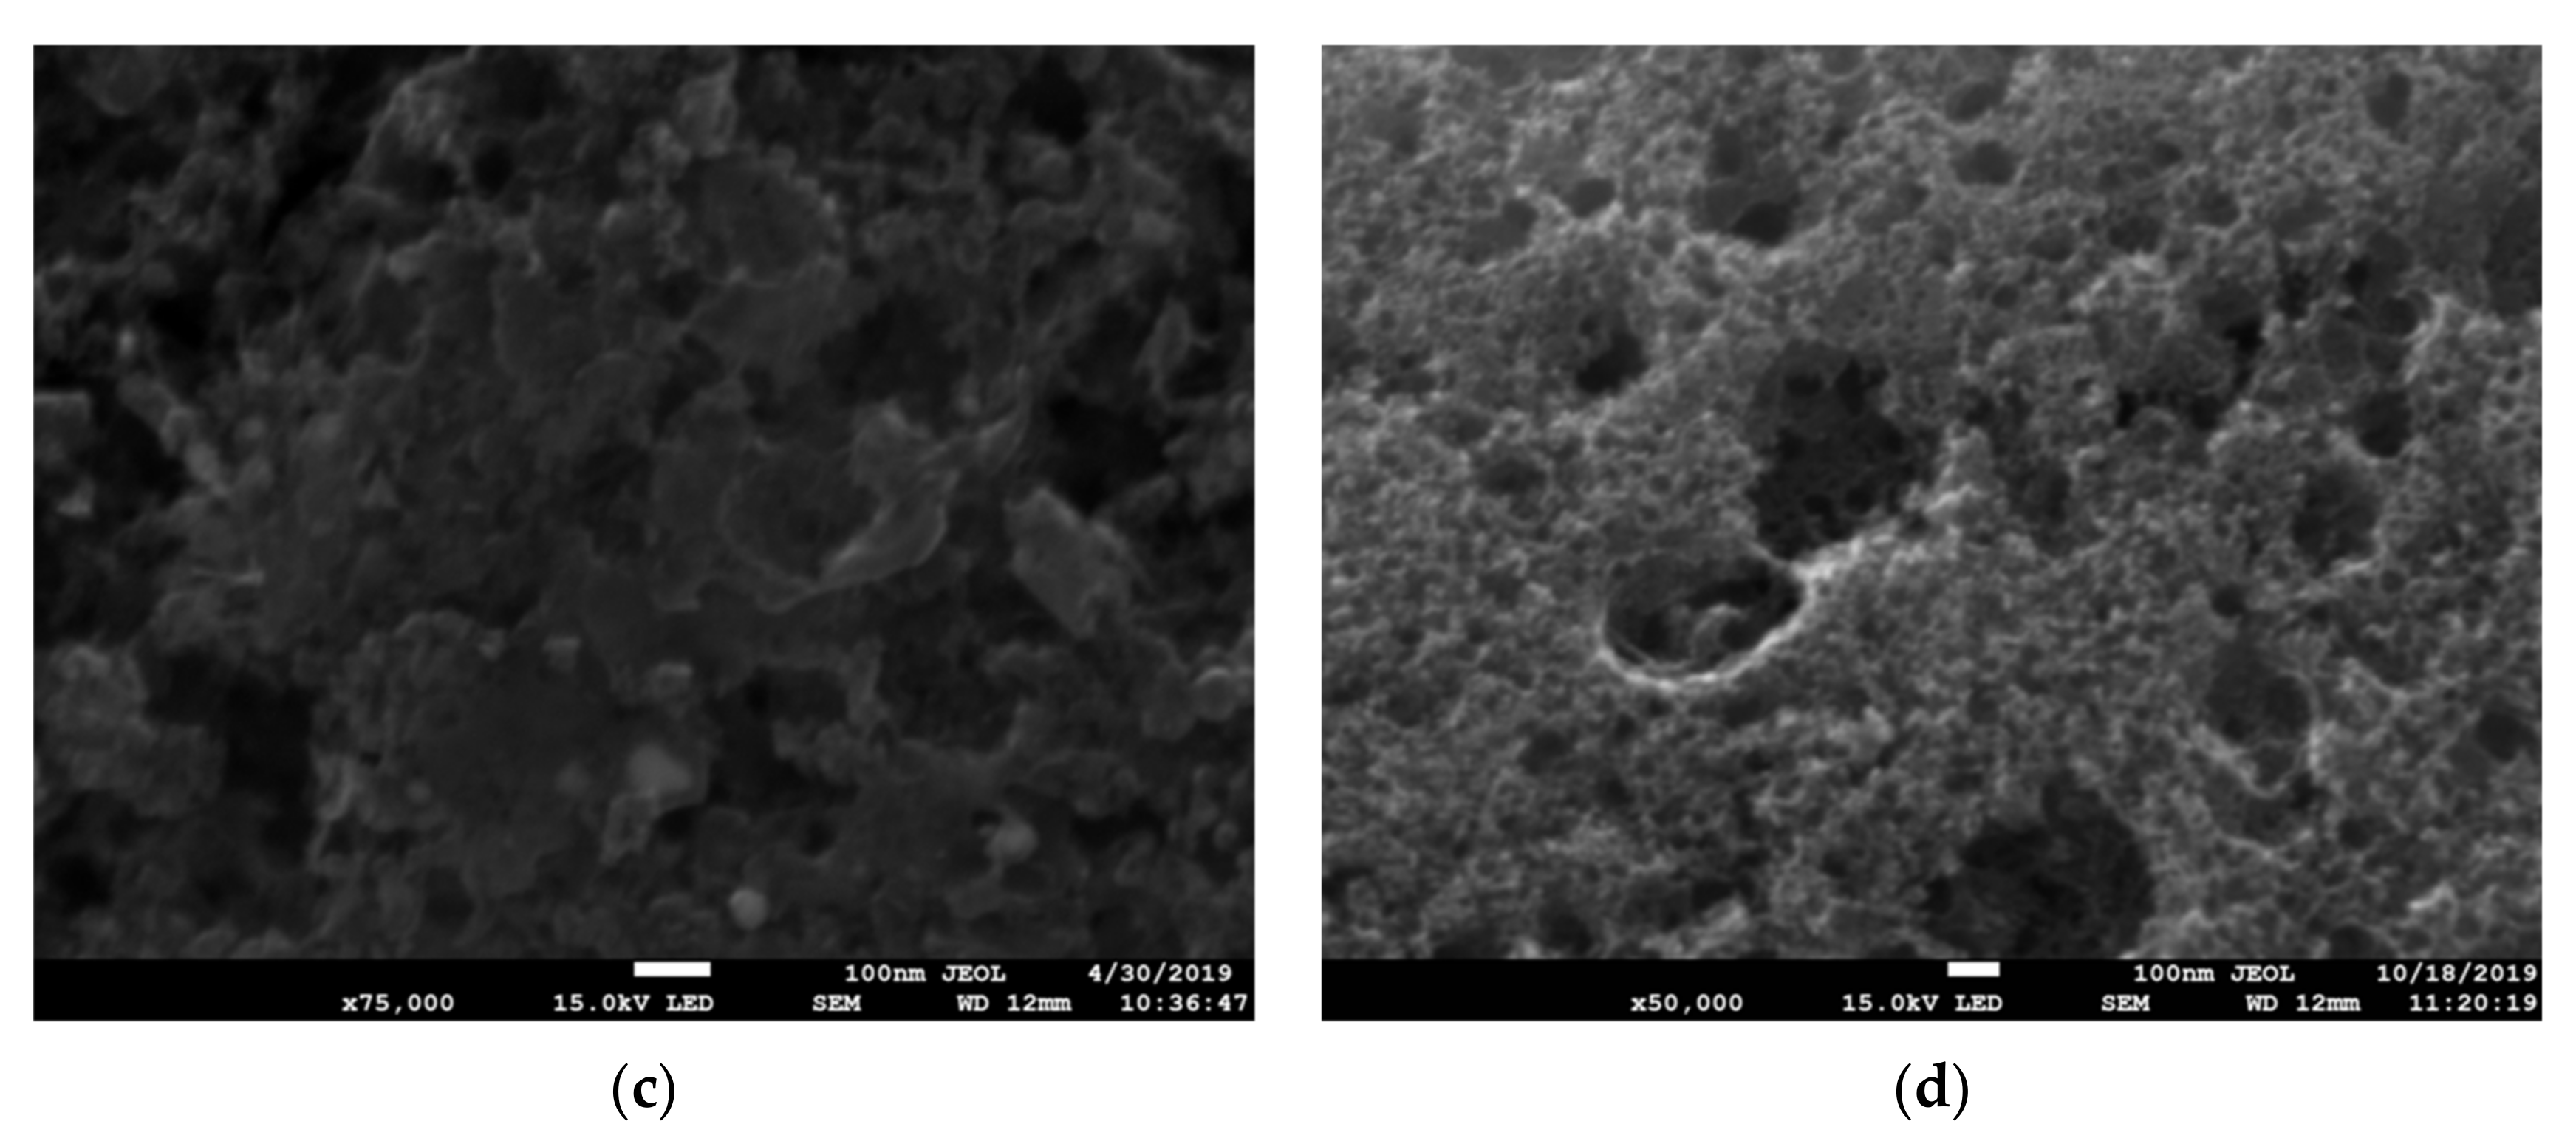
The SEM results for CBPP-A10, AC-A10, 1.00% Al-AC, and 0.75% Fe-AC are presented in Figure 6a–d. The captured images demonstrate a high share of macropores and mesopores in a high surface area (808.29 m2/g) of AC with 10% nitric acid (Figure 6b). Metal coatings on AC have decreased the porous structure of the surface of AC (Figure 6c,d). The captured images agree with the results for BET surface areas. The images demonstrate an uneven morphological structure in metal-coated AC with aluminum and iron. The surface of CBPP-A10 and AC-A10 are smoother with wider pores.
3.2. Optimization of Dose
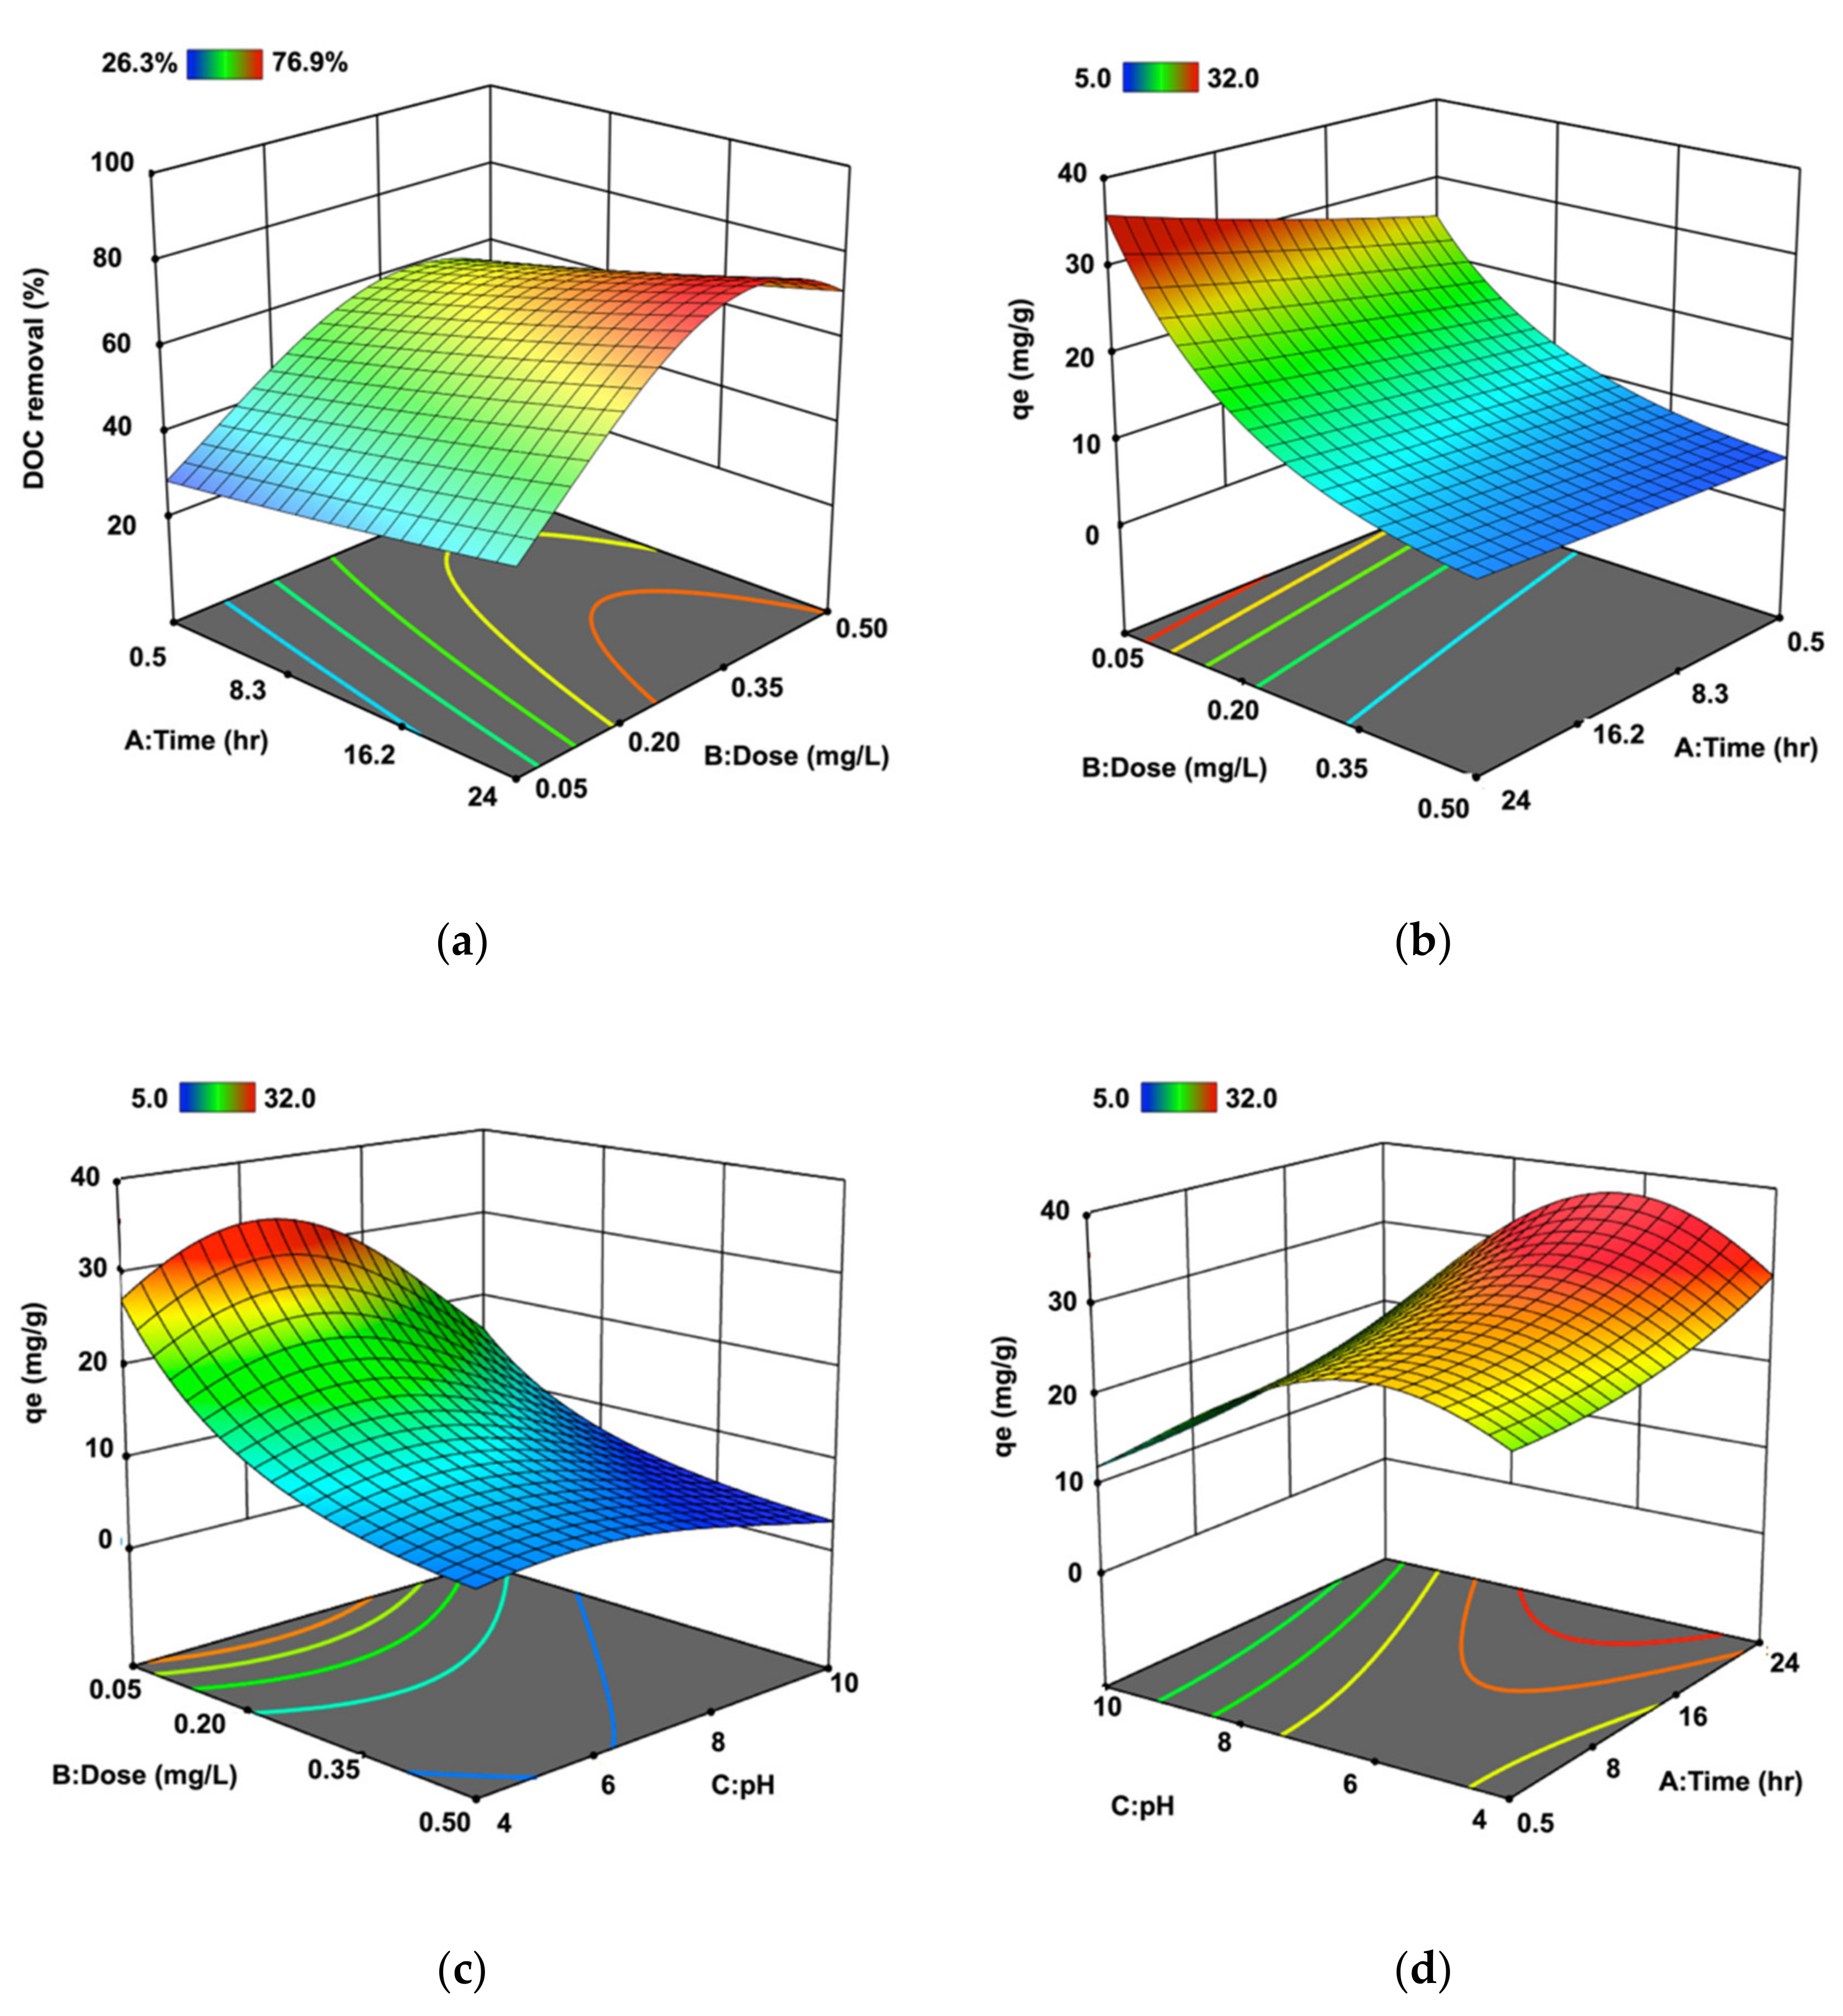
Optimization was performed for finding the most efficient dosage (i.e., highest adsorption capacity and lowest dosage resulting in DOC removal > 50%) of developed ACs. The experimental design included 23 factorial runs, six CCD experiments, and three center points that were randomized and combined using Design Expert (version 10.0.8, 2017). Three factors of pH, dosage and contact time were investigated, where the studied ranges for variables are: pH: 4–10; time (h): 0.5–24; and dosage (g/L): 0.05–0.50. The results of the experiments on DOC removal (response 1) and adsorption capacity (response 2) are presented in Table S1 in the Supplementary Material (SM). The maximized adsorption capacity was 18.25 mg/g that was obtained in a combination of variables (dosage: 0.14 g/L; pH: 5.26; and contact time: 19 h). The highest removal efficiency for DOC was 76.92% at pH of 7, a dosage of 0.275 g/L of AC, and a contact time of 24 h. In general, the efficiency of DOC removal increased with the increase of AC dosage (i.e., 0.25–0.50 g/L) and contact time (i.e., 24 h). A 3D plot of the responses versus time and dosage is presented in Figure 7a,b. The ANOVA for qe and DOC removal are presented in Table 6. The models’ terms with p-value < 0.05 were significant and were included in the regression. However, the ANOVA table for all the main factors, two-factor interactions, and quadratic terms are presented in Tables S2 and S3 in Supplementary Materials. The R2, R2adjusted, and R2predicted were used to investigate the precision of the models. No substantial variation was observed between the terms, which demonstrates the precision of models in fitting data and prediction of new points using the models. The adequacy of models was investigated with the normality of residuals. The normal plots for the residuals are presented in Figure S1a,b in Supplementary Materials. The main significant factors in both models in the order of magnitude are concentration > pH > contact time. Moreover, the quadratic terms of Dose2 and pH2 had p-values less than 0.05 and were included in the models in Equations (2) and (3).
where the actual levels of the variables are mentioned in Table 1. Adsorption can be an economical process if the cost efficiency of the adsorbent can be maintained. To prevent consumption of excess adsorbent, an optimization of AC was performed to minimize adsorbent dosage and maximize the efficiency of adsorption (i.e., highest adsorption capacity and lowest adsorbent dosage). A desirability function using Design-Expert software was performed to find the optimal conditions. The best result at the highest desirability value revealed that 0.141 g/L of AC and the maximum contact time of 24 h can result in a qe of 32 mg DOC/g. The results were used for the kinetic studies on AC, 0.75% Fe-AC, and 1.00% Al-AC.
3.3. Equilibrium Adsorption Isotherms
Langmuir and Freundlich are the widely used models in studies related to water treatment using AC [61] and removal of HA from water using adsorption [62]. The Temkin model has also been used in previous studies [63]. In this research, Langmuir, Freundlich, and Temkin models were investigated. The models are represented as:
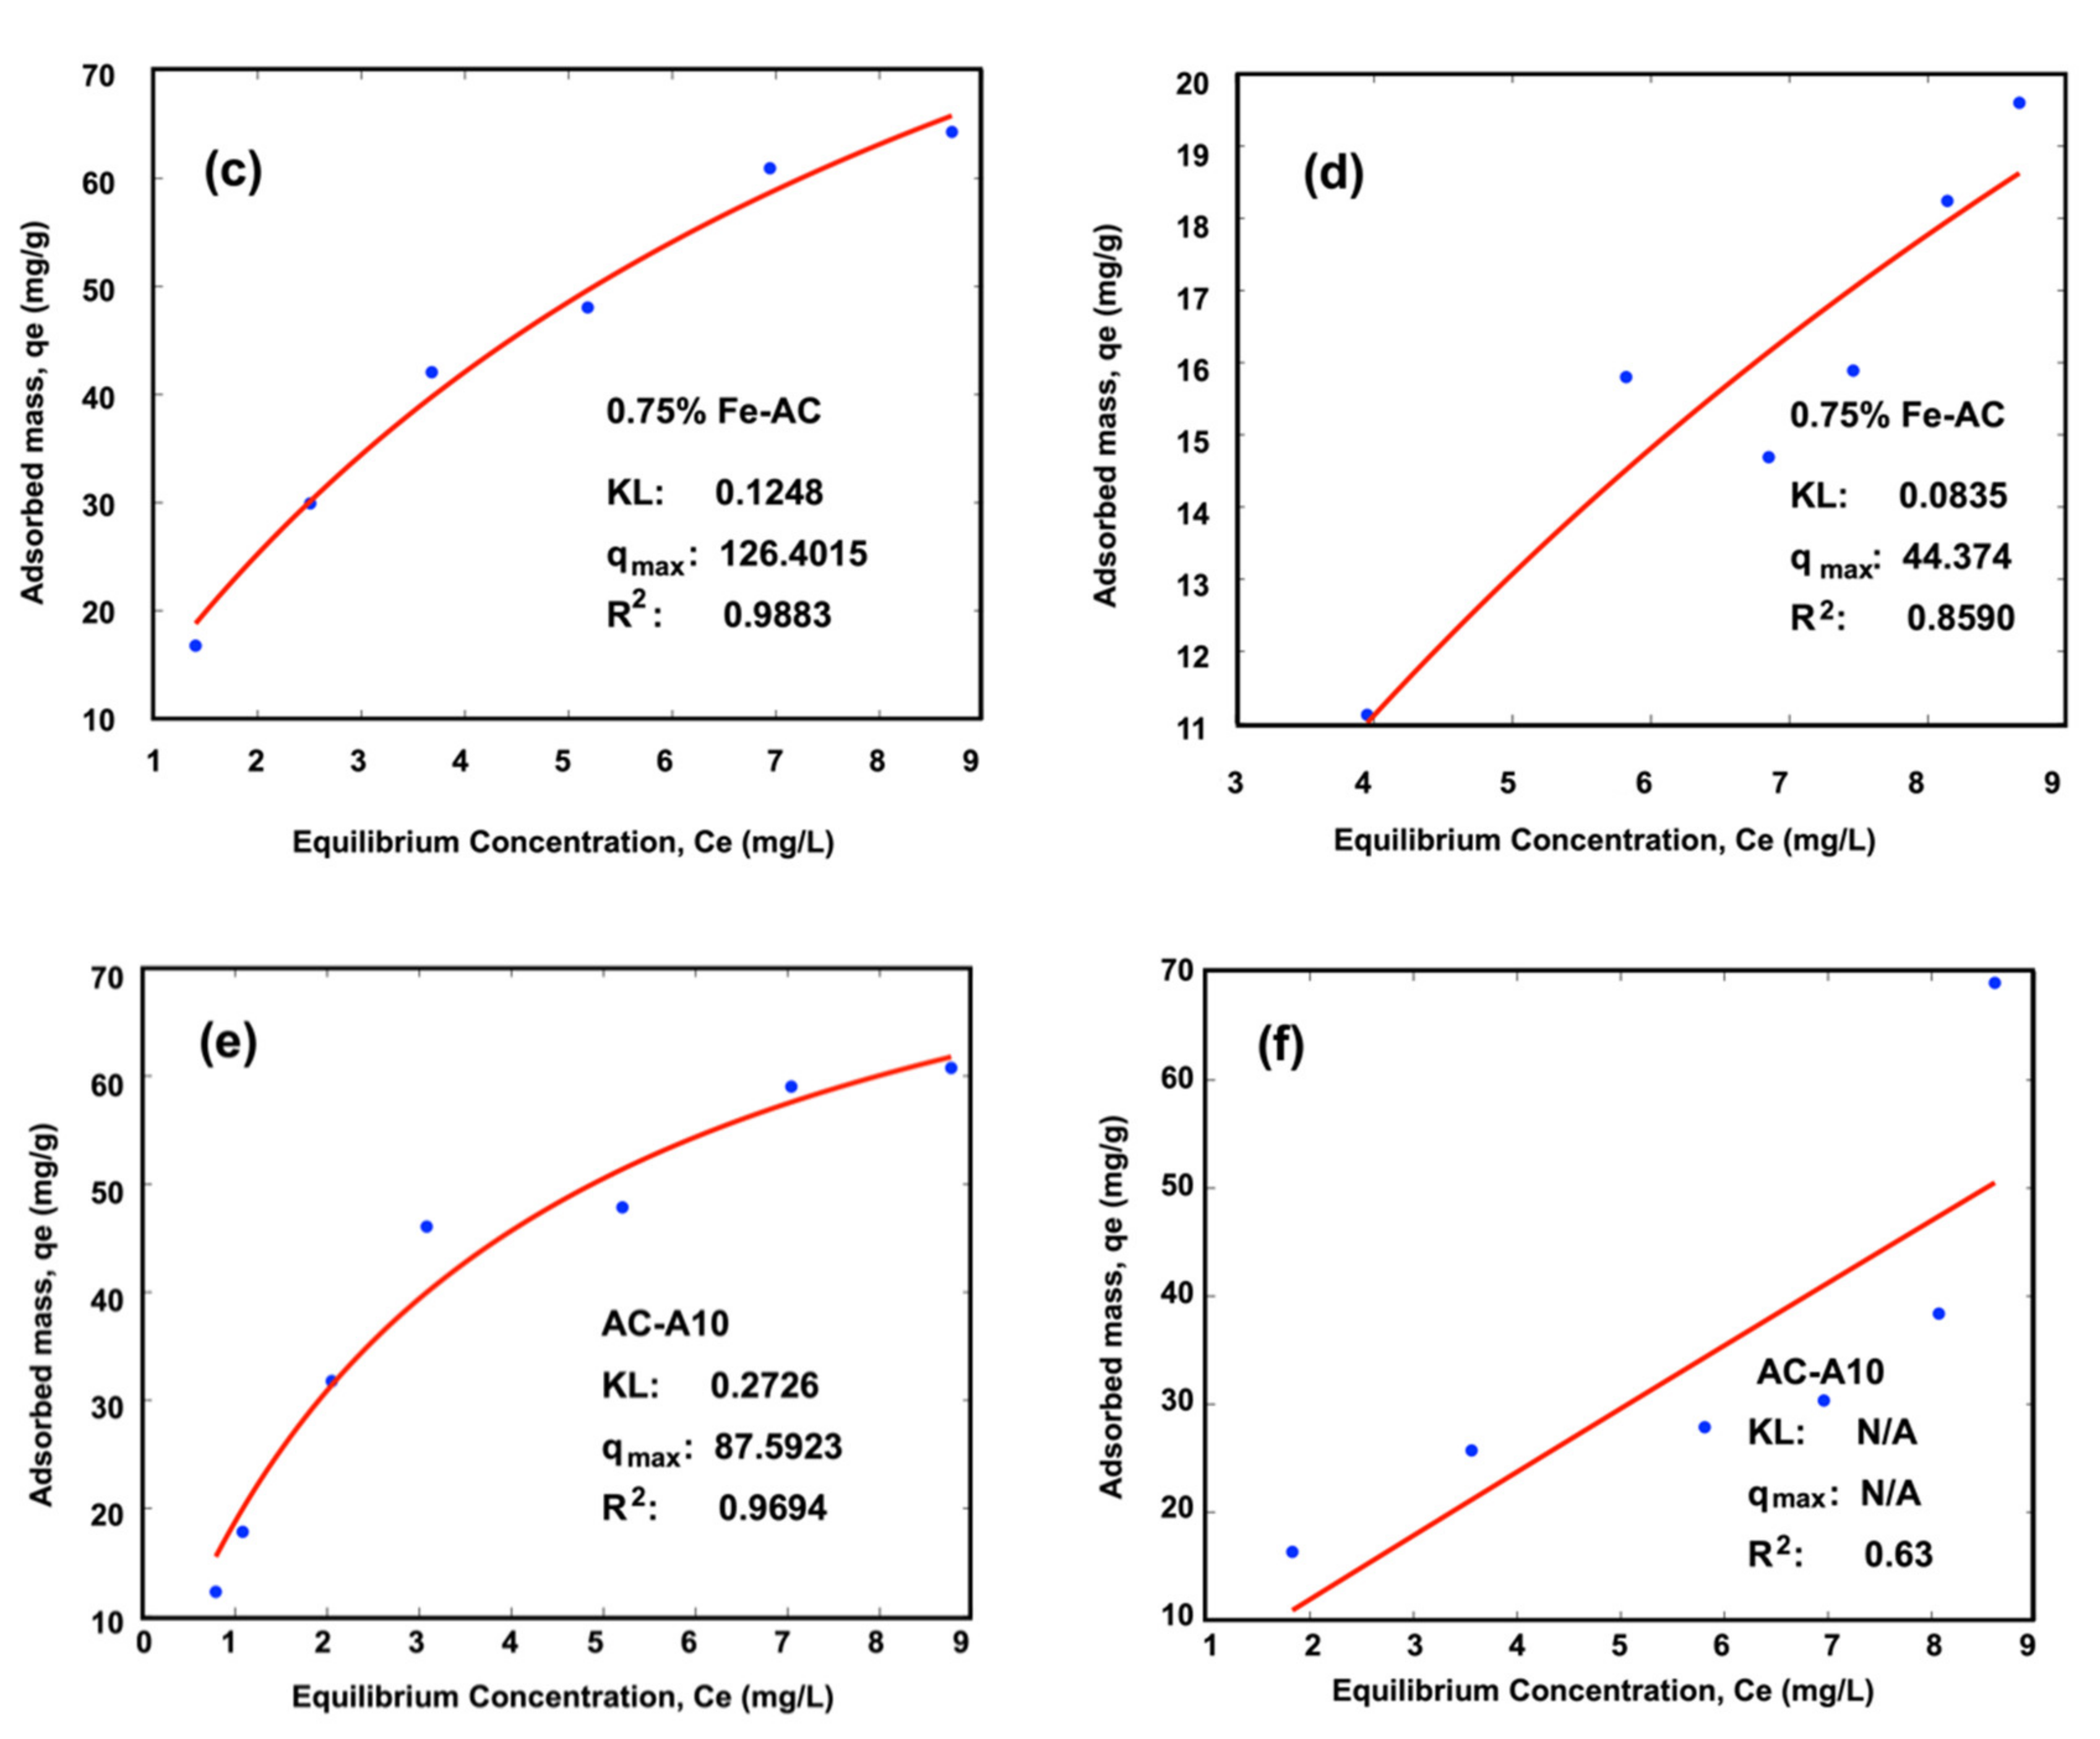
where, (mg/g) = equilibrium adsorption capacity, (mg/g) = maximum adsorption capacity, (mg/L) = concentration of adsorbate (i.e., DOC) at equilibrium, (L/mg) = Langmuir equilibrium constant, an indicator of affinity of the binding sites, (L/g) = Freundlich constant, B = RT/b, b (J/mol) = Temkin sorption heat constant, A is isotherm constant in Temkin model [62,63,64]. The data from adsorption isotherms for 1% Al-AC, 0.75% Fe-AC, and AC-A10 were best fitted to the Langmuir model. The Langmuir isotherm is a dynamic equilibrium, which relates the adsorption to the available open sites in the surface and indicates a proportional relationship between desorption and blocked pores [64]. The adsorption isotherms for DOC removal from natural and synthetic water samples are presented in Figure 8a–f. The results indicate that the adsorption capacity of AC in natural water (i.e., the mixture of all NOM fractions (VHA, SHA, CHI, and NHI)) is higher than HA-synthesized water. Past studies showed that the adsorption of NOM to AC depended on the molecular size and NOM type [65]. NOM with low molecular weight is more prone to be removed from water by adsorption [61], which is consistent with the findings in this study [66]. The higher adsorption capacities of metal-modified ACs (i.e., 1% Al-AC and 0.75% Fe-AC) than non-modified AC (i.e., AC-A10) can be justified by a more positive charge on metal-coated AC. The negative surface charge of AC-A10 results in less affinity of AC to NOM. Metal ions (i.e., Al3+ and Fe3+) on the surface of AC affect NOM adsorption positively in natural water’s pH due to the negative charge of NOM molecules with carboxyl and hydroxyl groups. Thus, NOM are adsorbed to the metal-coated AC [67]. The parameters for Freundlich and Temkin models are presented in Table S4 of Supplementary Materials.
A comparison of the maximum adsorption capacity, BET, and sources of AC are presented in Table 7. In the past studies, qmax for HA and DOC adsorption was in the ranges of 18.91–76.92 and 2.21–51.81 mg/g, respectively. A comprehensive study on eight different commercial granular-activated carbons with a specific surface area of 809 to 1419 m2/g in batch and microcolumn tests revealed that qe were in a range of 1.19–27.1 mg DOC/g [31]. Impregnation of commercial AC with maghemite (MPAC) showed that the modified AC had a lower affinity in NOM, and the BET surface area was decreased from 769 m2/g in non-modified AC to 575 m2/g in MPAC [17]. However, the obtained results showed that the metal impregnation on AC increased the adsorption capacity of AC by 35.06 to 44.31%.
3.4. Kinetic Studies
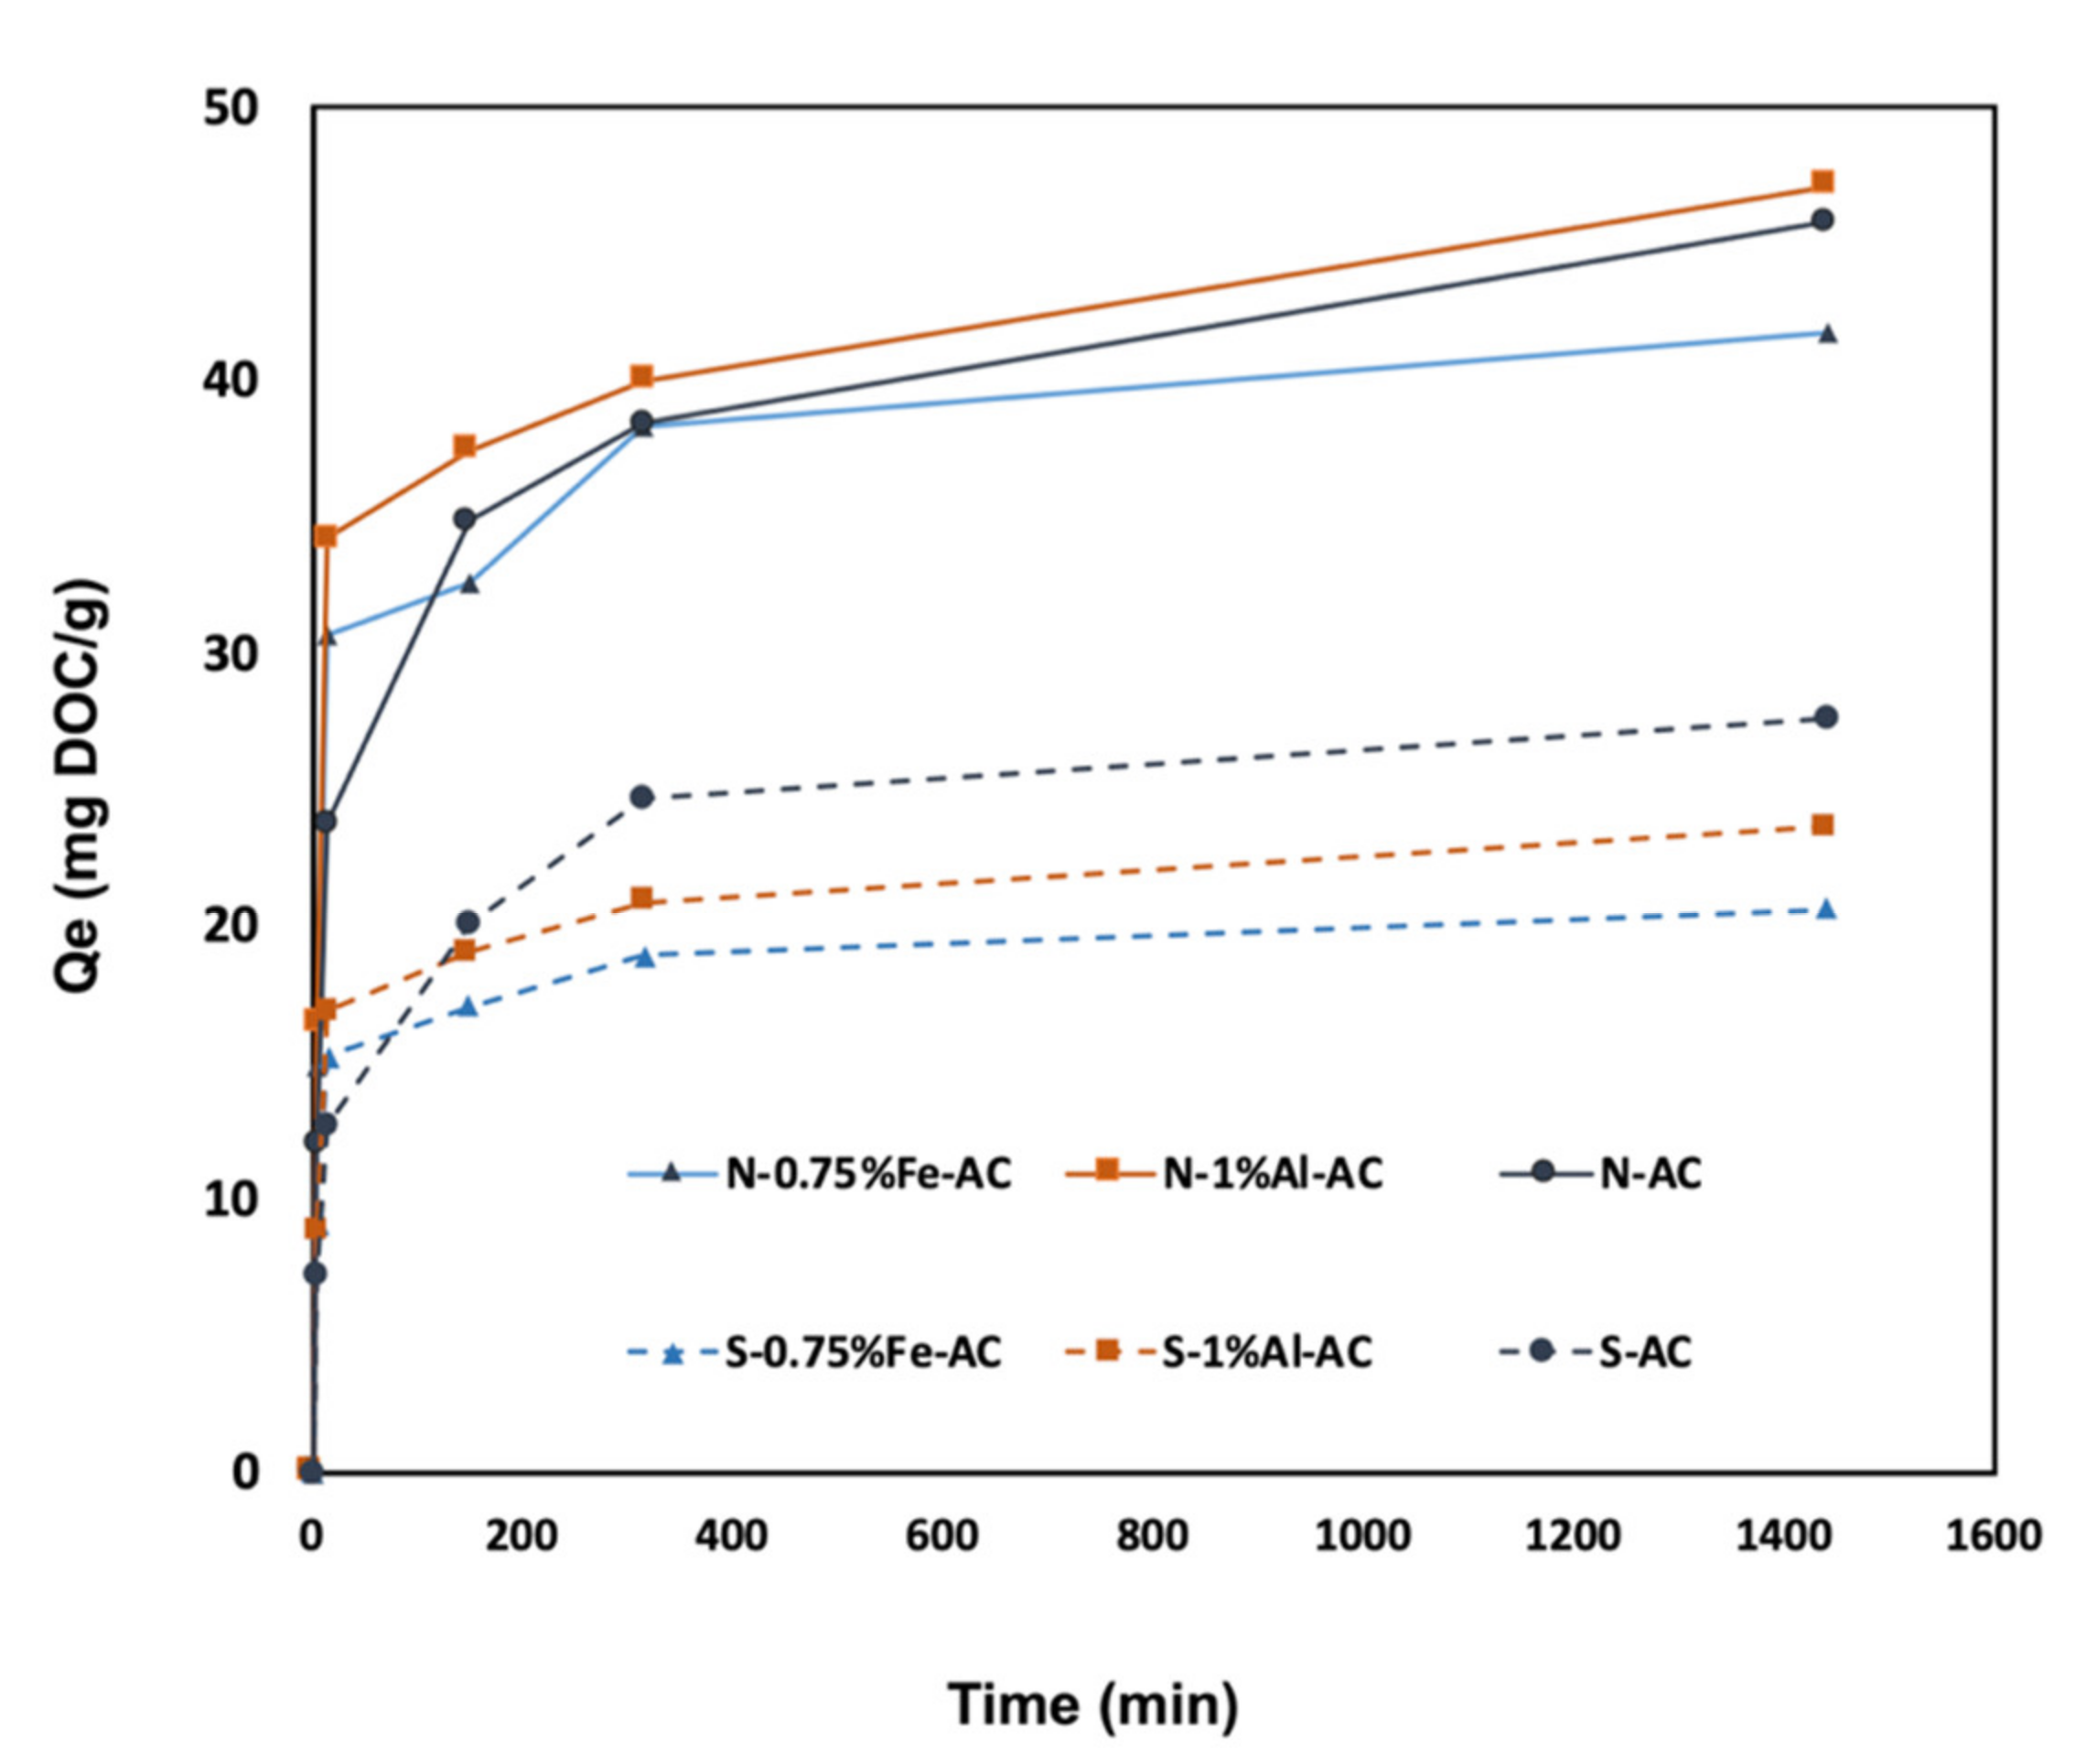
The performance of the developed AC (i.e., AC-A10, 0.75% Fe-AC, and 1% Al-AC) was evaluated by adding 0.15 g/L of AC (optimum dosage) to natural and synthetic water samples, and DOC was measured between 5–1440 min of dosing. The results are plotted in Figure 9. The widely used kinetic models, including pseudo-first order (PFO) (Equation (9)) and pseudo-second order (PSO) (Equation (10)), were assessed to investigate the adsorption mechanism of NOM removal [73].
where qt = adsorbed amount of adsorbate at time (t); k1 = PFO rate constant (h−1); k2 = PSO rate constant (g/mg·h); qe = the adsorption capacity at equilibrium.
PSO describes an adsorption process corresponding to the available sites on the adsorbent. The motivative force in PSO is proportional to the non-blocked adsorbent sites. The results showed that PSO was the best fitted kinetic model for all three ACs in this study and the calculated parameters are presented in Table 8. The highest efficiency in DOC removal was related to 1.00% Al-AC with the lowest k2 of 0.0011 g/mg.h. The constant rates for 0.75% Fe-AC and AC-A10 are 0.0014 and 0.0082 g/mg.h, respectively. The high adsorption rate of metal-coated AC is in agreement with previous studies, which showed that iron species were effective in removing NOM and HA from water through catalyzing effects on oxidation and adsorption [74]. The surface chemistry of AC also influences the absorptivity of NOM. A positive charge on the surface of modified AC enhances NOM removal [37].
Figure 9 demonstrates higher adsorption rates of metal-coated AC in the first 30 min of adsorption in comparison with AC-A10. To evaluate the adsorption rates of ACs, the constant rates for the first 30 min k1 are reported (Table 8) as 0.077, 0.086, and 0.048 for 0.75% Fe-AC, 1.00% Al-AC, and AC-A10, accordingly. The metal coating improved the adsorption of DOC by up to 43% in the first 30 min. Previous studies reported that iron oxide enhanced the removal of high molecular weight NOM with UV absorbance higher than 280 through adsorption. The obtained results showed a higher initial DOC uptake in iron-coated pumices [75,76]. A past study reported that 60–70% of FA were adsorbed to the magnetic oxides in the first 10–20 min, and a pseudo-second order kinetic model was fitted to the data showing the effect of physiochemical adsorption [76]. Their reported data showed that more than 50% of HA was adsorbed to the adsorbent in the first 10 min. This is possibly due to the break of high molecular weight because of oxidation and the ligand exchange between functional groups of NOM (i.e., carboxyl/hydroxyl) and cations (i.e., aluminum and iron oxides) [77]. In addition, the break-in HMW NOM makes the hidden proper functional groups available [76] and increases the adsorption kinetic rates. The adsorption results for DOC in natural water for all three selected ACs in the present study were higher than the synthesized water containing HA. This can be due to better adsorption of low molecular weight NOM into ACs pores comparing to HA with large molecular sizes.
To evaluate the performance of AC-A10 and metal-coated ACs on the removal of the precursors of HAA5 and THM4 from natural water samples, the formation potential of HAA5 and THM4 was measured within 72 h of chlorination. The developed AC was mixed with natural water samples at a dosage of 0.02 to 0.50 g/L for 24 h. The treated water samples were tested for HAA5 and THM4. The results showed that the maximum adsorption capacities of HAA5 precursors at equilibrium (qe) were 39.74, 34.03, and 22.44 mg/g for 1.00% Al-AC, 0.75% Fe-AC, and AC-A10, respectively. The qe values for THM4 were 60.20, 52.25, and 42.78 mg/g, indicating that metal-coated ACs showed enhanced removal of THM4 (22.1% and 40.7% for Fe-AC and Al-AC, respectively) and HAA5 precursors (51.6% and 77.1% for Fe-AC and Al-AC, respectively). Beyond the first 30 min, no model was found to satisfy the data (Figure 9 and Table S2)
4. Conclusions
Low cost activated carbon was developed using fly ash from a local pulp and paper company for removing NOM from natural and synthetic water samples. The chemical activation using nitric acid concentration of 10% increased the surface area and improved mesoporosity of the developed AC-A10. Optimization of adsorption capacity showed that a dosage of 0.15 g/L of AC for 24 h would result in the maximized adsorption of DOC. Metal coating on AC-A10 using three valent ions of Fe and Al derived from ferric chloride and aluminum sulfate were optimized for the adsorption of DOC. The ratio of Al: AC of 1.00% and Fe: AC of 0.75% resulted in 44 and 35%, respectively, improvements in the adsorption capacities for DOC in comparison to AC-A10. However, a decrease in the surface area of the ACs was observed. The ACs were more effective in removing NOM from natural water samples than the synthetic water samples, which can be related to the better performance of AC in removing the low molecular weight NOM. The adsorption capacity of 1.00% Al-AC and 0.75% Fe-AC showed 77 and 51% improvement in HAA5 reduction, and their performances in THM4 reduction were 40.7 and 22.1%, respectively. The adsorption characteristics of 1.00% Al-AC outweigh the performance of 0.75% Fe-AC in NOM removal. The elemental analysis on the natural and treated water samples showed the ability of 1.00% Al-AC in removing Fe from water, which can be beneficial to the small water systems in NL with high levels of iron in the sources of drinking water.
Supplementary Materials
The following are available online at https://www.mdpi.com/article/10.3390/w13162244/s1, Figure S1: Plots of the normal probability of residuals (a) DOC removal, (b) adsorption capacity (qe), Table S1: Experimental results for the optimization of adsorption capacity considering time, dose, and pH in terms of actual levels., Table S2: ANOVA for quadratic model of DOC removal, Table S3: ANOVA for quadratic model of qe, Table S4: Modeling results for equilibrium isotherms of natural and synthesized water sample.
Author Contributions
Conceptualization, H.T. and T.H.; methodology, H.T.; software, H.T. and S.C.; validation, H.T.; formal analysis, H.T. and S.C.; investigation, H.T. and S.C.; writing original draft preparation, H.T.; writing—review and editing, S.C. and T.H.; visualization, H.T. and S.C.; supervision, T.H.; project administration, T.H.; funding acquisition, T.H. All authors have read and agreed to the published version of the manuscript.
Funding
This research was funded by Natural Sciences and Engineering Research Council of Canada (NSERC), grant number 210412, Research and Development Corporation (RDC) Collaborative Research and Development, grant number 211517, and the Royal Bank of Canada funding through the Harris Center at the Memorial University of Newfoundland under grant number 209281.
Institutional Review Board Statement
Not applicable.
Informed Consent Statement
Not applicable.
Data Availability Statement
Our data are all presented in the paper and Supplementary Information.
Acknowledgments
The authors express their gratitude to Core Research Equipment and Instrument Training Network (CREAIT). Appreciation is also extended to all NRPOP lab members at Memorial University of Newfoundland, especially Jiabin Liu and Lidan Tao, for their sincere cooperation during the COVID-19 pandemic. Moreover, we appreciate the liaison of mayors and water treatment facility operators of the towns of Pouch Cove, Sunnyside, and New-Wes-Valley, as well as Salar Fallahian for water sampling.
Conflicts of Interest
The authors declare no conflict of interest. The funders had no role in the design of the study; in the collection, analyses, or interpretation of data; in the writing of the manuscript, or in the decision to publish the results.
References
- Rahman, A.; Sarkar, A.; Sathya, J.; McCrate, F. Additional Burden of Cancers Due to Environmental Carcinogens in Newfoundland and Labrador: A Spatial Analysis. Environ. Health Rev. 2020, 63, 77–86. [Google Scholar] [CrossRef]
- Chowdhury, S.; Mazumder, M.A.J.; Alhooshani, K.; Al-Suwaiyan, M.S. Reduction of DBPs in Synthetic Water by Indoor Techniques and Its Implications on Exposure and Health Risk. Sci. Total Environ. 2019, 691, 621–630. [Google Scholar] [CrossRef]
- EPA. 40 CFR Parts 9, 141, and 142 National Primary Drinking Water Regulations: Disinfectants and the Disinfection by-Products; Environmental Protection Agency: Washington, DC, USA, 2002; p. 351.
- Rodríguez-Murillo, J.; Zobrist, J.; Filella, M. Temporal Trends in Organic Carbon Content in the Main Swiss Rivers, 1974–2010. Sci. Total Environ. 2015, 502, 206–217. [Google Scholar] [CrossRef] [PubMed]
- Worrall, F.; Burt, T.P. Time Series Analysis of Long-Term River Dissolved Organic Carbon Records. Hydrol. Process. 2004, 18, 893–911. [Google Scholar] [CrossRef]
- Evans, C.; Monteith, D.; Cooper, D. Long-Term Increases in Surface Water Dissolved Organic Carbon: Observations, Possible Causes and Environmental Impacts. Environ. Pollut. 2005, 137, 55–71. [Google Scholar] [CrossRef]
- A Molot, L.; Dillon, P.J. Long-Term Trends in Catchment Export and Lake Concentrations of Base Cations in the Dorset Study Area, Central Ontario. Can. J. Fish. Aquat. Sci. 2008, 65, 809–820. [Google Scholar] [CrossRef]
- O’Driscoll, C.; Ledesma, J.L.; Coll, J.; Murnane, J.; Nolan, P.; Mockler, E.M.; Futter, M.N.; Xiao, L.W. Minimal Climate Change Impacts on Natural Organic Matter Forecasted for a Potable Water Supply in Ireland. Sci. Total Environ. 2018, 630, 869–877. [Google Scholar] [CrossRef]
- Nkambule, T.T.; Krause, R.; Haarhoff, J.; Mamba, B. A Three Step Approach for Removing Organic Matter from South African Water Sources and Treatment Plants. Phys. Chem. Earth, Parts A/B/C 2012, 50–52, 132–139. [Google Scholar] [CrossRef]
- Hong, S.; Kim, S.; Bae, C. Efficiency of Enhanced Coagulation for Removal of NOM and for Adsorbability of NOM on GAC. Desalination Water Treat. 2009, 2, 90–95. [Google Scholar] [CrossRef]
- Sillanpää, M.; Ncibi, M.C.; Matilainen, A.; Vepsalainen, M. Removal of Natural Organic Matter in Drinking Water Treatment by Coagulation: A Comprehensive Review. Chemosphere 2018, 190, 54–71. [Google Scholar] [CrossRef]
- Särkkä, H.; Vepsalainen, M.; Sillanpää, M. Natural Organic Matter (NOM) Removal by Electrochemical Methods—A Review. J. Electroanal. Chem. 2015, 755, 100–108. [Google Scholar] [CrossRef]
- Sillanpää, M.; Ncibi, M.C.; Matilainen, A. Advanced Oxidation Processes for the Removal of Natural Organic Matter from Drinking Water Sources: A Comprehensive Review. J. Environ. Manag. 2018, 208, 56–76. [Google Scholar] [CrossRef]
- Lidén, A.; Persson, K.M. Comparison between Ultrafiltration and Nanofiltration Hollow-Fiber Membranes for Removal of Natural Organic matter—A Pilot Study. J. Water Supply Res. Technol. 2015, 65, jws2015065. [Google Scholar] [CrossRef]
- Bhatnagar, A.; Sillanpää, M. Removal of Natural Organic Matter (NOM) and Its Constituents from Water by Adsorption—A Review. Chemosphere 2017, 166, 497–510. [Google Scholar] [CrossRef]
- Bhatnagar, A.; Hogland, W.; Marques, M.; Sillanpää, M. An Overview of the Modification Methods of Activated Carbon for Its Water Treatment Applications. Chem. Eng. J. 2013, 219, 499–511. [Google Scholar] [CrossRef]
- Lompe, K.M.; Menard, D.; Barbeau, B. The Influence of Iron Oxide Nanoparticles upon the Adsorption of Organic Matter on Magnetic Powdered Activated Carbon. Water Res. 2017, 123, 30–39. [Google Scholar] [CrossRef]
- Shadbahr, J.; Husain, T. Affordable and Efficient Adsorbent for Arsenic Removal from Rural Water Supply Systems in Newfoundland. Sci. Total Environ. 2019, 660, 158–168. [Google Scholar] [CrossRef]
- Amaral, P.; Partlan, E.; Li, M.; Lapolli, F.; Mefford, O.; Karanfil, T.; Ladner, D.A. Superfine Powdered Activated Carbon (S-PAC) Coatings on Microfiltration Membranes: Effects of Milling Time on Contaminant Removal and Flux. Water Res. 2016, 100, 429–438. [Google Scholar] [CrossRef] [PubMed] [Green Version]
- Canales-Flores, R.; Prieto-García, F. Taguchi Optimization for Production of Activated Carbon from Phosphoric Acid Impregnated Agricultural Waste by Microwave Heating for the Removal of Methylene Blue. Diam. Relat. Mater. 2020, 109, 108027. [Google Scholar] [CrossRef]
- Ali, G.A.M.; Habeeb, O.A.; Algarni, H.; Chong, K.F. CaO Impregnated Highly Porous Honeycomb Activated Carbon from Agriculture Waste: Symmetrical Supercapacitor Study. J. Mater. Sci. 2018, 54, 683–692. [Google Scholar] [CrossRef]
- Isoda, N.; Rodrigues, R.; Silva, A.; Gonçalves, M.; Mandelli, D.; Figueiredo, F.; Carvalho, W. Optimization of Preparation Conditions of Activated Carbon from Agriculture Waste Utilizing Factorial Design. Powder Technol. 2014, 256, 175–181. [Google Scholar] [CrossRef]
- ElShafei, G.M.; ElSherbiny, I.M.; Darwish, A.S.; Philip, C.A. Silkworms’ Feces-Based Activated Carbons As Cheap Adsorbents for Removal of Cadmium and Methylene Blue from Aqueous Solutions. Chem. Eng. Res. Des. 2014, 92, 461–470. [Google Scholar] [CrossRef]
- Zeng, F.; Liao, X.; Pan, D.; Shi, H. Adsorption of Dissolved Organic Matter from Landfill Leachate Using Activated Carbon Prepared from Sewage Sludge and Cabbage by ZnCl2. Environ. Sci. Pollut. Res. 2019, 27, 4891–4904. [Google Scholar] [CrossRef] [PubMed]
- Zięzio, M.; Charmas, B.; Jedynak, K.; Hawryluk, M.; Kucio, K. Preparation and Characterization of Activated Carbons Obtained from the Waste Materials Impregnated With Phosphoric acid(V). Appl. Nanosci. 2020, 10, 4703–4716. [Google Scholar] [CrossRef]
- Husain, T.; Taghizadehgan, A. Granulation of Powdered Activated Carbon Generated from Corner Brook Pulp and Paper Mill Ash Waste; Memorial University of Newfoundland: St. John’s, NL, Canada, 2019. [Google Scholar]
- Zhang, H.; Husain, T.; Chen, Y. Corner Brook Pulp and Paper Mill Waste Management; Memorial University of Newfoundland: St. John’s, NL, Canada, 2017. [Google Scholar]
- Zhang, H.; Tafvizi, H.; Husain, T.; Chen, Y. Affordable Water Filtration Technology for Small Rural Communities; Memorial University of Newfoundland: St. John’s, NL, Canada, 2017. [Google Scholar]
- Department of Environment and Conservation. Study on Characteristics and Removal of Natural Organic Matter in Drink-Ing Water Systems in Newfoundland and Labrador; CBCL Limited: Halifax, NS, Canada, 2011.
- Golea, D.; Upton, A.; Jarvis, P.; Moore, G.; Sutherland, S.; Parsons, S.; Judd, S. THM and HAA Formation from NOM in Raw and Treated Surface Waters. Water Res. 2017, 112, 226–235. [Google Scholar] [CrossRef] [PubMed] [Green Version]
- Golea, D.; Jarvis, P.; Jefferson, B.; Moore, G.; Sutherland, S.; Parsons, S.; Judd, S. Influence of Granular Activated Carbon Media Properties on Natural Organic Matter and Disinfection by-Product Precursor Removal from Drinking Water. Water Res. 2020, 174, 115613. [Google Scholar] [CrossRef]
- Tanthapanichakoon, W.; Ariyadejwanich, P.; Japthong, P.; Nakagawa, K.; Mukai, S.; Tamon, H. Adsorption–desorption Characteristics of Phenol and Reactive Dyes from Aqueous Solution on Mesoporous Activated Carbon Prepared from Waste Tires. Water Res. 2005, 39, 1347–1353. [Google Scholar] [CrossRef] [PubMed]
- Shawabkeh, R.; Aslam, Z.; Hussien, I.A. Thermochemical Treatment of Fly Ash for Synthesis of Mesoporous Activated Carbon. J. Therm. Anal. Calorim. 2015, 122, 1191–1201. [Google Scholar] [CrossRef]
- El-Hendawy, A.-N.A. Influence of HNO3 Oxidation on the Structure and Adsorptive Properties of Corncob-Based Activated Carbon. Carbon 2003, 41, 713–722. [Google Scholar] [CrossRef]
- Nagano, S.; Tamon, H.; Adzumi, T.; Nakagawa, K.; Suzuki, T. Activated Carbon from Municipal Waste. Carbon 2000, 38, 915–920. [Google Scholar] [CrossRef]
- Kim, S.; Kim, J.; Seo, G. Iron Oxide Nanoparticle-Impregnated Powder-Activated Carbon (IPAC) for NOM Removal in MF Membrane Water Treatment System. Desalination Water Treat. 2013, 51, 6392–6400. [Google Scholar] [CrossRef]
- Dastgheib, S.; Karanfil, T.; Cheng, W. Tailoring Activated Carbons for Enhanced Removal of Natural Organic Matter from Natural Waters. Carbon 2004, 42, 547–557. [Google Scholar] [CrossRef]
- Arampatzidou, A.; Voutsa, D.; Deliyanni, E. Removal of Bisphenol A by Fe-Impregnated Activated Carbons. Environ. Sci. Pollut. Res. 2018, 25, 25869–25879. [Google Scholar] [CrossRef] [PubMed]
- Mahdavi, M.; Ebrahimi, A.; Mahvi, A.H.; Fatehizadeh, A.; Karakani, F.; Azarpira, H. Experimental Data for Aluminum Removal from Aqueous Solution by Raw and Iron-Modified Granular Activated Carbon. Data Brief 2018, 17, 731–738. [Google Scholar] [CrossRef] [PubMed]
- Sawood, G.M.; Mishra, A.; Gupta, S.K. Optimization of Arsenate Adsorption over Aluminum-Impregnated Tea Waste Biochar Using RSM–Central Composite Design and Adsorption Mechanism. J. Hazard. Toxic Radioact. Waste 2021, 25, 04020075. [Google Scholar] [CrossRef]
- Kazeem, T.S.; Lateef, S.A.; Ganiyu, S.A.; Qamaruddin, M.; Tanimu, A.; Sulaiman, K.O.; Jillani, S.M.S.; Alhooshani, K. Aluminium-Modified Activated Carbon As Efficient Adsorbent for Cleaning of Cationic Dye in Wastewater. J. Clean. Prod. 2018, 205, 303–312. [Google Scholar] [CrossRef]
- Tafvizi, H.; Husain, T. Enhanced Coagulation for Removal of Natural Organic Matter and Disinfection Byproducts: Multivariate Optimization. Environ. Eng. Sci. 2021, 1–13. [Google Scholar] [CrossRef]
- Chow, C.W.; van Leeuwen, J.A.; Fabris, R.; Drikas, M. Optimised Coagulation Using Aluminium Sulfate for the Removal of Dissolved Organic Carbon. Desalination 2009, 245, 120–134. [Google Scholar] [CrossRef]
- Kristiana, I.; Joll, C.; Heitz, A. Powdered Activated Carbon Coupled With Enhanced Coagulation for Natural Organic Matter Removal and Disinfection by-Product Control: Application in a Western Australian Water Treatment Plant. Chemosphere 2011, 83, 661–667. [Google Scholar] [CrossRef] [PubMed] [Green Version]
- Xing, J.; Liang, H.; Cheng, X.; Yang, H.; Xu, D.; Gan, Z.; Luo, X.; Zhu, X.; Li, G. Combined effects of coagulation and adsorption on ultrafiltration membrane fouling control and subsequent disinfection in drinking water treatment. Environ. Sci. Pollut. Res. 2019, 26, 33770–33780. [Google Scholar] [CrossRef]
- Szlachta, M.; Adamski, W. Effects of Natural Organic Matter Removal by Integrated Processes: Alum Coagulation and PAC-Adsorption. Water Sci. Technol. 2009, 59, 1951–1957. [Google Scholar] [CrossRef]
- Raposo, F.; de la Rubia, M.A.; Borja, R. Methylene Blue Number as Useful Indicator to Evaluate the Adsorptive Capacity of Granular Activated Carbon in Batch Mode: Influence of adsorbate/Adsorbent Mass Ratio and Particle Size. J. Hazard. Mater. 2009, 165, 291–299. [Google Scholar] [CrossRef]
- Hautman, D.P.; Munch, D.J. Development of U.S.; EPA: Washington, DC, USA, 1997.
- Pawlecki-Vonderheide, A.M.; Munch, D.J.; Munch, J.W. Research Associated With the Development of EPA Method 552.2. J. Chromatogr. Sci. 1997, 35, 293–301. [Google Scholar] [CrossRef] [Green Version]
- Montgomery, D.C. Design and Analysis of Experiments, 3rd ed.; John Wiley & Sons: New York, NY, USA, 1991; pp. 521–568. [Google Scholar]
- Chowdhury, S. Impact of Source Waters, Disinfectants, Seasons and Treatment Approaches on Trihalomethanes in Drinking Water: A Comparison Based on the Size of Municipal Systems. Water Environ. J. 2013, 27, 197–206. [Google Scholar] [CrossRef]
- ASTM D7573. Standard Test Method for Total Carbon and Organic Carbon in Water by High Temperature Catalytic Com-Bustion and Infrared Detection; ASTM International: Conshohocken, PA, USA, 2013; pp. 1–8. [Google Scholar]
- Chow, C.W.K.; Fabris, R.; Drikas, M. A Rapid Fractionation Technique to Characterise Natural Organic Matter for the Optimisation of Water Treatment Processes. J. Water Supply Res. Technol. 2004, 53, 85–92. [Google Scholar] [CrossRef]
- Vieira, R.F.; Berenguel, A.T.; Silva, M.A.; Vilaca, J.S.; Domingues, V.F.; Figueiredo, S.A. Natural Organic Matter Fractionation along the Treatment of Water for Human Consumption. Glob. NEST J. 2013, 14, 399–406. [Google Scholar] [CrossRef] [Green Version]
- Kurushkin, M. Writing Reactions of Metals with Nitric Acid: A Mnemonic Device for Introductory Chemistry Students. J. Chem. Educ. 2015, 92, 1125–1126. [Google Scholar] [CrossRef]
- Swift, E.H.; Butler, E.A. Quantitative Measurements and Chemical Equilibria; W. H. Freeman & Company: New York, NY, USA, 1972. [Google Scholar]
- Nunes, C.A.; Guerreiro, M.C. Estimation of Surface Area and Pore Volume of Activated Carbons by Methylene Blue and Iodine Numbers. Química Nova 2011, 34, 472–476. [Google Scholar] [CrossRef] [Green Version]
- Auta, M.; Hameed, B.H. Modified Mesoporous Clay Adsorbent for Adsorption Isotherm and Kinetics of Methylene Blue. Chem. Eng. J. 2012, 198–199, 219–227. [Google Scholar] [CrossRef]
- Thommes, M.; Kaneko, K.; Neimark, A.V.; Olivier, J.P.; Rodriguez-Reinoso, F.; Rouquerol, J.; Sing, K.S.W. Physisorption of gases, with special reference to the evaluation of surface area and pore size distribution (IUPAC Technical Report). Pure Appl. Chem. 2015, 87, 1051–1069. [Google Scholar] [CrossRef] [Green Version]
- EPA. 2018 Edition of the Drinking Water Standards and Health Advisories Tables; U.S. Environmental Protection Agency: Washington, DC, USA, 2018.
- Menya, E.; Olupot, P.W.; Storz, H.; Lubwama, M.; Kiros, Y. Production and Performance of Activated Carbon from Rice Husks for Removal of Natural Organic Matter from Water: A Review. Chem. Eng. Res. Des. 2018, 129, 271–296. [Google Scholar] [CrossRef]
- Dehghani, M.H.; Zarei, A.; Mesdaghinia, A.; Nabizadeh, R.; Alimohammadi, M.; Afsharnia, M.; McKay, G. Production and Application of a Treated bentonite–chitosan Composite for the Efficient Removal of Humic Acid from Aqueous Solution. Chem. Eng. Res. Des. 2018, 140, 102–115. [Google Scholar] [CrossRef]
- Dehghani, M.H.; Zarei, A.; Mesdaghinia, A.; Nabizadeh, R.; Alimohammadi, M.; Afsharnia, M. Response Surface Modeling, Isotherm, Thermodynamic and Optimization Study of Arsenic (V) Removal from Aqueous Solutions Using Modified Bentonite-Chitosan (MBC). Korean J. Chem. Eng. 2017, 34, 757–767. [Google Scholar] [CrossRef]
- Ayawei, N.; Ebelegi, A.N.; Wankasi, D. Modelling and Interpretation of Adsorption Isotherms. J. Chem. 2017, 2017, 3039817. [Google Scholar] [CrossRef]
- Newcombe, G.; Morrison, J.; Hepplewhite, C.; Knappe, D. Simultaneous Adsorption of MIB and NOM onto Activated Carbon: II. Competitive Effects. Carbon 2002, 40, 2147–2156. [Google Scholar] [CrossRef]
- Parsons, S.; Goslan, E.; McGrath, S.; Jarvis, P.; Jefferson, B. Disinfection Byproduct Control. In Comprehensive Water Quality and Purification; Elsevier BV: Amsterdam, The Netherlands, 2013; pp. 120–147. [Google Scholar] [CrossRef]
- Park, H.-S.; Koduru, J.R.; Choo, K.-H.; Lee, B. Activated Carbons Impregnated With Iron Oxide Nanoparticles for Enhanced Removal of Bisphenol A and Natural Organic Matter. J. Hazard. Mater. 2015, 286, 315–324. [Google Scholar] [CrossRef]
- Teixeira, M.R.; Camacho, F.P.; Sousa, V.S.; Bergamasco, R. Green Technologies for Cyanobacteria and Natural Organic Matter Water Treatment Using Natural Based Products. J. Clean. Prod. 2017, 162, 484–490. [Google Scholar] [CrossRef]
- Iriarte-Velasco, U.; Álvarez-Uriarte, J.I.; Chimeno-Alanís, N.; González-Velasco, J.R. Natural Organic Matter Adsorption onto Granular Activated Carbons: Implications in the Molecular Weight and Disinfection Byproducts Formation. Ind. Eng. Chem. Res. 2008, 47, 7868–7876. [Google Scholar] [CrossRef]
- Eustáquio, H.; Lopes, C.; Da Rocha, R.S.; Cardoso, B.D.; Pergher, S. Modification of Activated Carbon for the Adsorption of Humic Acid. Adsorpt. Sci. Technol. 2015, 33, 117–126. [Google Scholar] [CrossRef]
- Bouras, H.D.; Benturki, O.; Bouras, N.; Attou, M.; Donnot, A.; Merlin, A.; Addoun, F.; Holtz, M.D. The Use of an Agricultural Waste Material from Ziziphus Jujuba as a Novel Adsorbent for Humic Acid Removal from Aqueous Solutions. J. Mol. Liq. 2015, 211, 1039–1046. [Google Scholar] [CrossRef]
- Yang, K.; Fox, J.T. Adsorption of Humic Acid by Acid-Modified Granular Activated Carbon and Powder Activated Carbon. J. Environ. Eng. 2018, 144, 04018104. [Google Scholar] [CrossRef]
- Wang, J.; Guo, X. Adsorption Kinetic Models: Physical Meanings, Applications, and Solving Methods. J. Hazard. Mater. 2020, 390, 122156. [Google Scholar] [CrossRef]
- Bekaroglu, S.S.K.; Yigit, N.O.; Harman, B.I.; Kitis, M. Hybrid Adsorptive and Oxidative Removal of Natural Organic Matter Using Iron Oxide-Coated Pumice Particles. J. Chem. 2016, 2016, 3108034. [Google Scholar] [CrossRef] [Green Version]
- Kitis, M.; Kaplan, S.; Karakaya, E.; Yigit, N.; Civelekoglu, G. Adsorption of Natural Organic Matter from Waters by Iron Coated Pumice. Chemosphere 2007, 66, 130–138. [Google Scholar] [CrossRef]
- Świetlik, J.; Laskowski, T.; Kozyatnyk, I. Adsorption of Natural Organic Matter onto the Products of Water-Pipe Corrosion. Water Air Soil Pollut. 2015, 226, 225. [Google Scholar] [CrossRef]
- Rahman, M.S.; Whalen, M.; Gagnon, G.A. Adsorption of Dissolved Organic Matter (DOM) onto the Synthetic Iron Pipe Corrosion Scales (goethite and magnetite): Effect of pH. Chem. Eng. J. 2013, 234, 149–157. [Google Scholar] [CrossRef]
Figure 1.
Contour map of dissolved organic carbon (DOC) in surface water of Newfoundland and Labrador (NL) and the locations of water sampling in this study (adapted from [29]).
Figure 1.
Contour map of dissolved organic carbon (DOC) in surface water of Newfoundland and Labrador (NL) and the locations of water sampling in this study (adapted from [29]).

Figure 2.
Schematic of (a) the steps of production of activated carbons and evaluation of their performances in NOM and DBPs removal, (b) physical activation.
Figure 2.
Schematic of (a) the steps of production of activated carbons and evaluation of their performances in NOM and DBPs removal, (b) physical activation.


Figure 3.
The effect of nitric acid on methylene blue value and iodine number after activation.

Figure 4.
N2 adsorption isotherm: (a) AC-A0, (b) AC-A5, (c) AC-A10.


Figure 5.
DOC removal by metal-coated activated carbons: (a) water sample 1, (b) water sample 2.

Figure 6.
Scanning electron microscopy images for (a) CBPP A-10, (b) AC-A10, (c) 1% Al-AC, (d) 0.75% Fe-AC.
Figure 6.
Scanning electron microscopy images for (a) CBPP A-10, (b) AC-A10, (c) 1% Al-AC, (d) 0.75% Fe-AC.


Figure 7.
3D surface plots for (a) the effect of Dose x Time on DOC removal (%), (b) Dose and Time on adsorption capacity, qe, (mg/g), (c) Dose and pH on qe (mg/g), and (d) Time and pH on qe.
Figure 7.
3D surface plots for (a) the effect of Dose x Time on DOC removal (%), (b) Dose and Time on adsorption capacity, qe, (mg/g), (c) Dose and pH on qe (mg/g), and (d) Time and pH on qe.

Figure 8.
Langmuir equilibrium isotherm models for NOM removal by (a) 1% Al-AC in natural water, (b) 1% Al-AC in synthesized water, (c) 0.75% Fe-AC in natural water, (d) 0.75% Fe-AC in synthesized water, (e) AC-A10 in natural water, (f) AC-A10 in synthesized water. AC: activated carbon, KL: Langmuir equilibrium constant (L/mg), qmax: maximum adsorption capacity (mg/g), R2: coefficient of determination.


Figure 9.
Adsorption kinetics for 0.75% Fe-AC, 1%Al-AC, and AC-A10. N: natural water, S: synthesized water, AC: activated carbon, qe: adsorbed mass (mg DOC/g).
Figure 9.
Adsorption kinetics for 0.75% Fe-AC, 1%Al-AC, and AC-A10. N: natural water, S: synthesized water, AC: activated carbon, qe: adsorbed mass (mg DOC/g).


Table 1.
The factors and their levels.
| Factors | Symbol | Levels | ||||
|---|---|---|---|---|---|---|
| (–α) | Lowest (–1) | Center (0) | Highest (+1) | (+α) | ||
| Contact Time (h) | A | 0.50 | 5.26 | 12.25 | 19.23 | 24.00 |
| Dosage (g/L) | B | 0.05 | 0.14 | 0.27 | 0.40 | 0.50 |
| pH | C | 4.00 | 5.20 | 7.00 | 8.80 | 10.00 |
Table 2.
Characteristics of water samples.
| Sources | DOC (Mg L−1) | UV254 (C m−1) | THM4 (ppb) | HAA5 (ppb) | VHA (%) | SHA (%) | CHI (%) | NHI (%) |
|---|---|---|---|---|---|---|---|---|
| Natural | 5.22–10.31 | 0.237–0.557 | 1639.35–2485.10 | 327.69–2157.70 | 67.05–81.20 | 5.56–7.41 | 1.92–3.11 | 8.21–25.09 |
| Synthetic | 9.05–9.42 | 1.063 | 1088.17 | 2213.49 | 100.00 | 0.00 | 0.00 | 0.00 |
DOC: dissolved organic carbon, UV254: ultraviolet absorbance at wavelength 254 nm, THM4: four regulated trihalomethanes, HAA5: five regulated haloacetic acids, VHA: very hydrophobic acids, SHA: slightly hydrophobic acids, CHI: charged hydrophilic, NHI: neutral hydrophilic.
Table 3.
The effect of nitric acid on elemental analysis.
| Element | Metal Content (ppm) | Metal Removal (mol × 10−6) | |||||
|---|---|---|---|---|---|---|---|
| CBPP-A0 1 | CBPP-A5 1 | CBPP-A10 | A0 | A5 | A10 | Diff. | |
| Iron | 784 | 175.19 | 121 | 0.00 | 10.90 | 11.87 | 0.97 |
| Aluminum | 947 | 281.31 | 201 | 0.00 | 24.75 | 27.73 | 2.98 |
| Magnesium | 511 | 185.33 | 86 | 0.00 | 13.40 | 17.49 | 4.09 |
| Zinc | 11.72 | 9.07 | 6.75 | 0.00 | <1 | <1 | NA |
| Copper | 7.28 | <2 | <2 | 0.00 | <1 | <1 | NA |
| Calcium | 2656 | 1481 | 535 | 0.00 | 29.31 | 52.92 | 23.60 |
Table 4.
Metal leaching by modified activated carbon during water treatment.
| Water Sample | Metal Content (mg/L) | ||||||||
|---|---|---|---|---|---|---|---|---|---|
| Fe | Al | Mg | Ca | Zn | Cu | As | Mn | Hg | |
| Raw Water | 0.16 | 0.13 | 6.66 | 2.41 | 0.017 | <0.01 | <0.02 | 0.009 | <0.1 |
| 0.25% Al-AC 1 | 0.06 | 0.05 | 6.60 | 2.28 | 0.015 | 0.03 | <0.02 | 0.036 | <0.1 |
| 0.50% Al-AC 1 | 0.06 | 0.06 | 6.65 | 2.30 | 0.016 | <0.01 | <0.02 | 0.023 | <0.2 |
| 0.75% Al-AC 1 | 0.06 | 0.08 | 6.59 | 2.31 | 0.016 | 0.05 | <0.02 | 0.011 | <0.1 |
| 1.00% Al-AC 1 | 0.05 | 0.08 | 6.66 | 2.36 | 0.018 | 0.01 | <0.02 | 0.011 | <0.1 |
| 3.25% Al-AC 1 | 0.06 | 0.09 | 6.57 | 2.30 | 0.016 | <0.01 | <0.02 | 0.009 | <0.1 |
| 5.50% Al-AC 1 | 0.06 | 0.10 | 6.54 | 2.31 | 0.018 | 0.04 | <0.02 | 0.008 | <0.1 |
| 0.25% Fe-AC 1 | 0.06 | 0.04 | 6.63 | 2.48 | 0.017 | <0.01 | <0.02 | 0.053 | <0.1 |
| 0.50% Fe-AC 1 | 0.07 | 0.04 | 6.81 | 2.42 | 0.016 | <0.01 | <0.02 | 0.044 | <0.1 |
| 0.75% Fe-AC 1 | 0.07 | 0.04 | 6.63 | 2.34 | 0.012 | <0.01 | <0.02 | 0.037 | <0.1 |
| 1.00% Fe-AC 1 | 0.07 | 0.05 | 6.56 | 2.33 | 0.013 | 0.03 | <0.02 | 0.024 | <0.1 |
| 3.25% Fe-AC 1 | 0.07 | 0.04 | 6.62 | 2.30 | 0.012 | 0.06 | <0.02 | 0.009 | <0.1 |
| 5.50% Fe-AC 1 | 0.06 | 0.05 | 6.56 | 2.34 | 0.013 | 0.04 | <0.02 | 0.023 | <0.1 |
1 Treated water samples with modified activated carbon. Al-AC: aluminum coated activated carbon, Fe-AC: iron coated activated carbon.
Table 5.
Metal leaching by modified activated carbon during water treatment.
| Sample | Surface Area (BET) (m2/g) | Micropore Volume (cm3/g) | Langmuir Surface Area (m2/g) | MBV (mg/g) | IN (mg/g) | pHpzc | Size (d.nm) * |
|---|---|---|---|---|---|---|---|
| AC-A10 | 808.29 | 0.21 | 995.65 | 265 | 1212 | 5.98 | 2039 |
| 1.00% Al-AC | 783.29 | 0.18 | 948.92 | 234 | 925 | 6.61 | 1976 |
| 0.75% Fe-AC | 709.89 | 0.19 | 888.09 | 226 | 931 | 6.43 | 2620 |
AC: activated carbon, BET: Brunauer, Emmett, and Teller, IN: iodine number, MBV: methylene blue value, pHpzc: pH of zero potential charges, Al-AC: aluminum coated activated carbon, Fe-AC: iron coated activated carbon, * size (d. m): measured particle size by Zetasizer.
Table 6.
ANOVA results obtained for DOC removal and adsorption capacity.
| Responses | F-Valuemodel | p-Valuemodel | |||
|---|---|---|---|---|---|
| DOC removal | 0.95 | 0.93 | 0.87 | 46.10 | <0.0001 |
| qe | 0.97 | 0.96 | 0.93 | 92.65 | <0.0001 |
DOC: dissolved organic carbon, qe: adsorption capacity (mg/g).
Table 7.
The characteristics of AC for DOC adsorption in recent studies.
| Adsorbent | Source of Adsorbent | Surface Area (BET) (m2/g) | Water Sample | Target Adsorbate | Langmuir Constant (KL) | Qmax (mg/g) | Reference |
|---|---|---|---|---|---|---|---|
| AC-A10 | Fly ash | 808.29 | Natural | DOC | 0.2726 | 87.59 | This study |
| 1.00% Al-AC | Fly ash | 783.29 | Natural | DOC | 0.2598 | 118.30 | This study |
| 0.75% Fe-AC | Fly ash | 709.89 | Natural | DOC | 0.1248 | 126.40 | This study |
| AC-A5 | Fly ash | 847.26 | Natural | DOC | N/A | 3.70 | [28] |
| AC | Coconut palm | 715.50 | Synthesized | DOC | 0.489 | 51.81 | [68] |
| AC | Coconut shell | 808 | Synthesized | DOC | 1.17 | 2.21 | [69] |
| AC | Bituminous coal | 852 | Synthesized | DOC | 7.34 | 27.60 | [69] |
| Non-modified GACs | 8 CAC | 809–1419 | Synthesized | DOC | N/A | 1.19 1–27.1 | [31] |
| Non-modified | CAC | 659 | Synthesized | Humic Acid | N/A | 20.39 | [70] |
| H3PO4 AC | CAC | 711 | Synthesized | Humic Acid | N/A | 25.64 | [70] |
| H2SO4 AC | CAC | 724 | Synthesized | Humic Acid | N/A | 18.91 | [70] |
| ZnCl2 AC | Agricultural waste | 970 | Synthesized | Humic Acid | 0.22 | 76.92 | [71] |
| GAC | CAC | 1100 | Synthesized | Humic Acid | 0.004 | 16.66 | [72] |
| HNO3 PAC | CAC | N/A | Synthesized | Humic Acid | 0.0086 | 76.92 | [72] |
AC: activated carbon, DOC: dissolved organic carbon, qmax: maximum adsorption capacity (mg/g), KL: Langmuir equilibrium constant (L/mg), CAC: commercial activated carbon, GAC: granular activated carbon, MPAC: maghemite impregnated powder activated carbon. 1 Equilibrium adsorption capacity is reported.
Table 8.
The fitted kinetic model for the adsorption.
| Adsorbent | Water Sample | Model | Target Adsorbate | k2 and k1 | R2 |
|---|---|---|---|---|---|
| 0.75% Fe-AC | Natural | PSO | DOC | 0.0014 | 0.9981 |
| 1.00% Al-AC | Natural | PSO | DOC | 0.0011 | 0.9983 |
| AC-A10 | Natural | PSO | DOC | 0.0082 | 0.9992 |
| 0.75% Fe-AC | Natural | 30 min-PFO | DOC | 0.077 | 0.9971 |
| 1.00% Al-AC | Natural | 30 min-PFO | DOC | 0.086 | 0.9999 |
| AC-A10 | Natural | 30 min-PFO | DOC | 0.048 | 0.9971 |
AC: activated carbon, PSO: pseudo-second order, DOC: dissolver organic carbon, k1: PFO constant (h−1), k2: PSO constant (g/mg·h), R2: correlation coefficient.
Publisher’s Note: MDPI stays neutral with regard to jurisdictional claims in published maps and institutional affiliations. |
© 2021 by the authors. Licensee MDPI, Basel, Switzerland. This article is an open access article distributed under the terms and conditions of the Creative Commons Attribution (CC BY) license (https://creativecommons.org/licenses/by/4.0/).
Share and Cite
MDPI and ACS Style
Tafvizi, H.; Chowdhury, S.; Husain, T. Low Cost Activated Carbon for Removal of NOM and DBPs: Optimization and Comparison. Water 2021, 13, 2244. https://doi.org/10.3390/w13162244
AMA Style
Tafvizi H, Chowdhury S, Husain T. Low Cost Activated Carbon for Removal of NOM and DBPs: Optimization and Comparison. Water. 2021; 13(16):2244. https://doi.org/10.3390/w13162244
Chicago/Turabian StyleTafvizi, Hoda, Shakhawat Chowdhury, and Tahir Husain. 2021. "Low Cost Activated Carbon for Removal of NOM and DBPs: Optimization and Comparison" Water 13, no. 16: 2244. https://doi.org/10.3390/w13162244
Note that from the first issue of 2016, this journal uses article numbers instead of page numbers. See further details here.