Assessment of Causes and Effects of Groundwater Level Change in an Urban Area (Warsaw, Poland)


Faculty of Geology, University of Warsaw, Żwirki i Wigury 93, 02-089 Warsaw, Poland
*
Author to whom correspondence should be addressed.
Water 2020, 12(11), 3107; https://doi.org/10.3390/w12113107
Submission received: 14 August 2020
/
Revised: 31 October 2020
/
Accepted: 3 November 2020
/
Published: 5 November 2020
(This article belongs to the Special Issue Sustainable Management of Urban Water Resources)
Abstract
:Monitoring the data of groundwater level in long-term measurement series has allowed for assessment of the impact of natural and anthropogenic factors on groundwater recharge. It allows for assessing the actual groundwater quantity, which constitutes the basis for balanced and sustainable groundwater planning and management in an urban area. Groundwater levels in three aquifers were studied: the shallow and deeper Quaternary aquifers and the Oligocene aquifer in Warsaw (Poland). Statistical analysis was performed on a 27-year (1993–2019) cycle of daily measurements of groundwater levels. The studies focused on determining the range and causes of groundwater level changes in urban-area aquifers. The groundwater table position in the Quaternary aquifer pointed to variable long-term recharge and allowed for the identification of homogenous intervals with identification of water table fluctuation trends. A decrease in the water table was observed within the Quaternary aquifers. The Oligocene aquifer displayed an opposite trend.
1. Introduction
Urban development, resulting in changes in spatial management, drought, and extreme flood events caused by climate change, significantly influences hydrogeological conditions and water efficiency [1,2]. Changes in spatial management directly influence groundwater recharge, including the infiltration, lateral inflow, surface runoff, evapotranspiration, and other elements of groundwater balance [3,4]. Urban development, therefore, results in serious problems in many areas, e.g., seawater intrusion beneath coastal cities [5,6], changes in groundwater recharge and discharge [7], and groundwater pollution [8,9,10].
A separate problem is the water supply in urban areas in the context of changing hydrogeological conditions. During the last 50 years, the water demand in Europe has risen gradually, which is related to the increase in the human population. Around 55% of the world’s human population lives in urban areas. The population living in 17 capital cities of the EU was 71.1 million in 2014, and a stable increase in population was observed in all large European cities except Athens in the last decade [11]. This has led to a general decrease in renewable groundwater resources by 24% per person in Europe [12]. An indispensable element in preventing such hazards is groundwater valorization in urban areas, with regard to both its quantity and chemical status assessment. According to the assessment rules determined by the Water Framework Directive [13], poor chemical status was observed in 9% of groundwater bodies, and, in 75% of cases, the main reason was the decrease in groundwater levels [14]. Despite the increased population and problems related to water supply in urban areas, stabilization of water abstraction has been observed in some large European cities [14]. Diversified possibilities of water supply in a particular area, local hydrogeological conditions and uneven social–economic and industry activities result in various ranges of groundwater level positions and recharge are possible in many urban areas.
In the studies of urban areas, the recharge assessment is extremely important but difficult. The usual methods of estimating recharge are available for use in urban areas as described by Lerner [15], Spalvins [16], and Schirmer [17]. Natural infiltration is modified as a result of land use, and the total balance should include the amount of water from leaks in water supply and sewage networks, which are difficult to estimate. Water loss in numerous underground water systems in Poland and the world is large, and the actual loss varies widely [18]. As much as 60% of distributed water may be lost through leakage from the distribution system [14], and losses in the water system reach, e.g., 18% in Great Britain, 30% in France, 20–34% in Spain and the Czech Republic, 30–60% in Croatia, and as much as 75% in Albania. Based on studies in 1998, the mean loss for 195 cities in Poland was 18.6% [19]. The cumulative impact of natural and anthropogenic factors, difficult to quantify individually, is reflected in the position of the groundwater table. Determining the range of dynamics of groundwater level change and their causes in short- and long-term scales is of crucial significance for social-economic activities, politics, and planning for sustainable development [1]. The influence of changes in land use and the climate on the hydrogeological conditions in urban areas depends on the location of the study area and the hydrogeological conditions [1,20]. This requires individualized studies with regard to specific known hydrogeological conditions. Methods of analyzing the impact on hydrological and hydrogeological conditions may be subdivided into three categories: experimental studies, statistical analysis, and modelling [20].
The aim of the study was to identify cumulative natural and anthropogenic causes controlling groundwater recharge and to assess their effects reflected in the groundwater table location. The cumulative impact of natural and anthropogenic factors on groundwater in an urban area and the dynamics of groundwater levels in particular aquifers have been determined by analysis of groundwater levels based on a 27-year (1993–2019) cycle of daily measurements of groundwater levels position derived from a monitoring system located in the centre of Warsaw (Poland). The analysis was focused on three aquifers: the shallow and deeper Quaternary aquifers and the Oligocene aquifer. The reliability of this analysis was assessed on standard measurements of groundwater levels in piezometers and wells, excluding the consideration of arbitrary elements or schematization of conditions for modelling studies. Direct measurements were subject to detailed statistical analysis. Assessment of the dynamics of groundwater level changes and trends of changes in various time intervals on a long-term basis allows for determining the range and variability of groundwater recharge in an urban area. Defining the variability of groundwater level changes, particularly aquifers, change trends, and range of groundwater recharge, points to the cumulative impact of factors characteristic of urban areas. The combined influence of both geogenic and anthropogenic factors shaping groundwater levels has been analyzed.
2. Background of the Study Area
2.1. Location of the Study Area
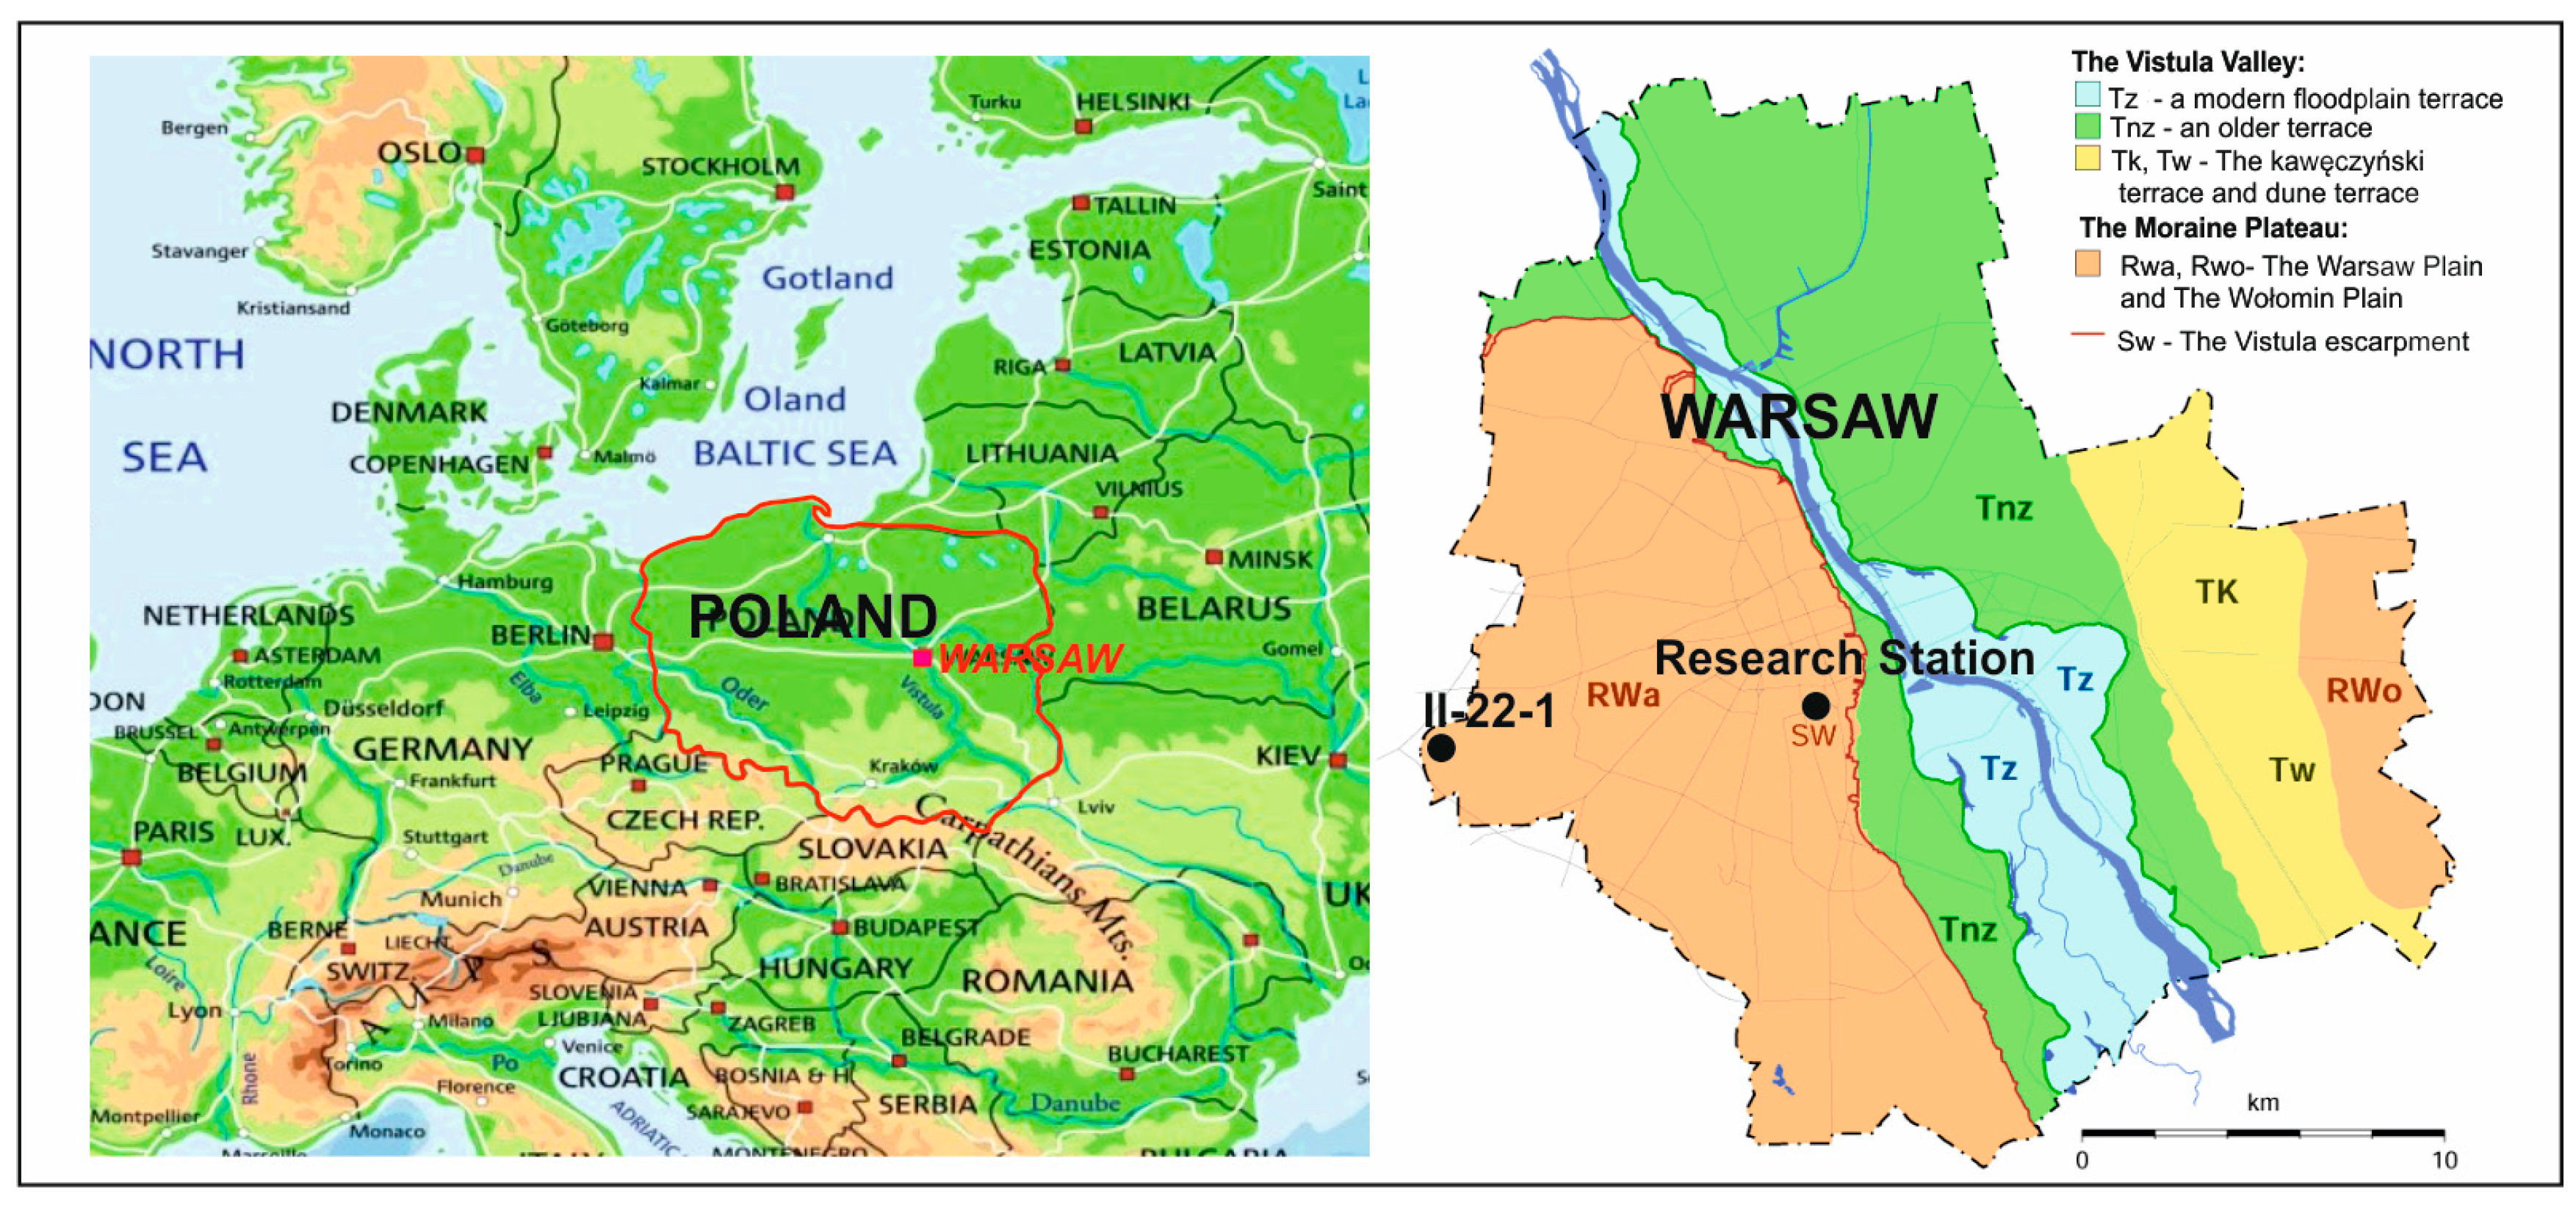
The groundwater monitoring system is located in the center of Warsaw (Poland) in the Research Station of the Faculty of Geology at the University of Warsaw. The research station is located on the crossroads of two busy streets, Żwirki i Wigury and Banacha, in the Ochota district. The district is characterized by the prevalence of multifamily buildings, similarly to most of left-bank Warsaw. In turn, single-family houses dominate right-bank Warsaw. Larger areas of undeveloped zones (park and forest complexes) are found in the urban area peripheries (Figure 1). Warsaw is located on two sides of the Vistula River and is slightly elongated along its banks (extending ca. 30 km along the N–S direction and at ca. 28 km along the W–E direction). The urban area covers an area of 517.24 km2. The population is 1.8 million at a density of 3500 people/km2.
The city is located on two sides of the Vistula River, the largest river in Poland. Two types of terraces can be distinguished along the river: a modern floodplain covering a larger surface area in the southern part of the city and older terraces with the largest surface area in the northern part of right-bank Warsaw. Moraine plateaus extend from the river to the west as the Warsaw Plain and to the east as the Wołomin Plain. The research station is located on the Warsaw Plain (Figure 1).
Groundwater recharge and drainage are variable within the urban area. In the centre of Warsaw, infiltration and its drainage are restricted by spatial management and a sewage system (stormwater drainage) typical for urban infrastructure. Precipitation from surfaces covered by non-permeable materials (roads, pavements, and roofs) is distributed by the sewage system, and thus effective infiltration is completely reduced. Groundwater recharge takes place through lateral inflow from the neighboring areas and to a large degree through water loss from the water–sewage system of the urban area [21,22]. Infiltration has a significant contribution to groundwater recharge and resource formation in other parts of the urban area.
2.2. Geology and Hydrogeological Conditions
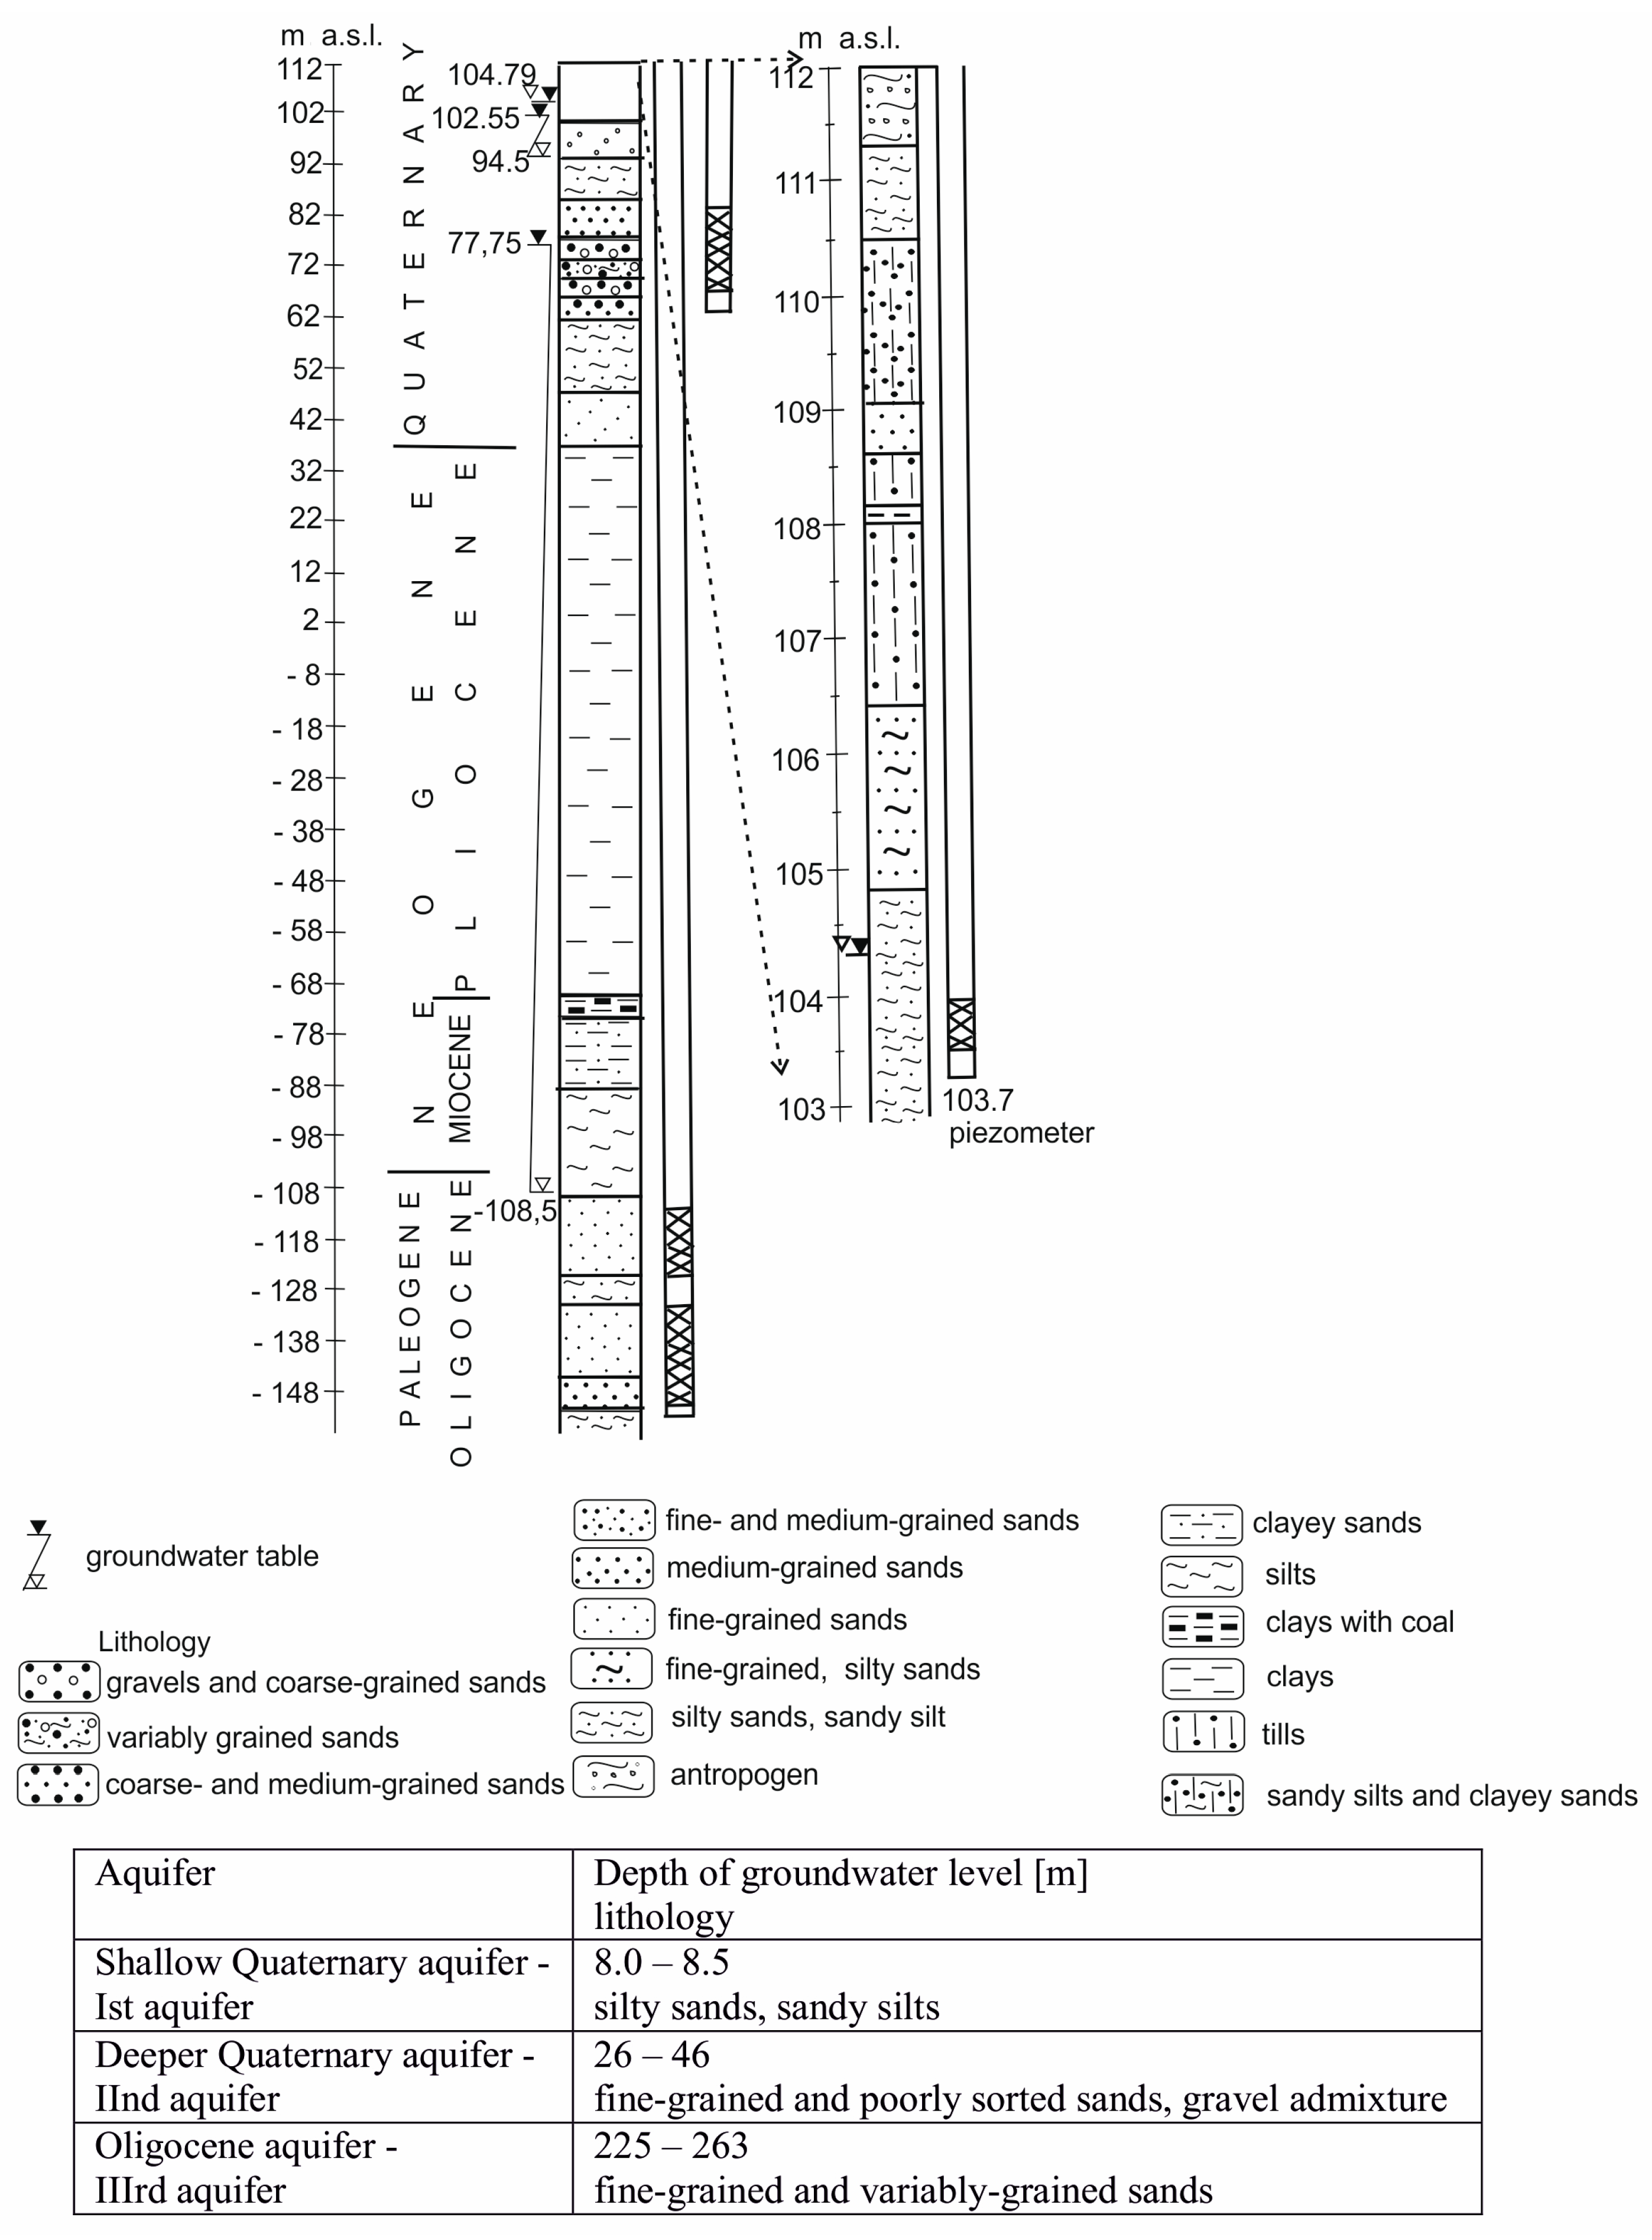
The research station is located within a denuded post-glacial plateau located at an elevation of 108–115 m a.s.l. and incised by a glacial valley. The oldest series drilled in the Warsaw region are Upper Cretaceous strata, developed as grey marls interbedded with limestones and covered by Oligocene strata developed as sands, silts, and clays with glauconite and phosphorites. Miocene deposits include sands, silts, and clays with interbeds of lignite. The Pliocene comprises variably colored compact clays, the so-called variegated clays, and clay and sandy silts. The Pleistocene includes glacial, fluvioglacial, and ice-dammed deposits of the Podlasian, Sanian, Odranian, and Vistulian glaciations, and the Cromerian, Mazovian, and Eemian interglacials. In the vicinity of the research station, these deposits are developed as glacial tills located on silts, sands, and ice-dammed clays (Figure 2). The geological succession of the subsurface zone comprises (from the top) anthropogenic embankment deposits, sandy silts, clayey sands, glacial tills, and fine-grained and silty sands (Figure 2). At a depth of about 7.6 m b.g.l. within fine-grained and silty sands is the first Quaternary aquifer (first aquifer) with a water table monitored by piezometers. The deeper Quaternary aquifer (second aquifer) with a confined water table is located within fine-grained and poorly sorted sands at a depth interval from 26 to 46 m b.g.l. The water table drilled during the well construction at the depth of 18 m b.g.l. became stabilized at 9.95 m b.g.l. (Figure 2).
Within the Warsaw agglomeration, waters of the Quaternary aquifer remain in hydraulic contact and are combined in one aquifer in the northern part of the urban area. Generally, groundwater in Quaternary deposits with hydraulic conductivity in the range of 25–30 m/day, whose thickness increases northwards and flows from the east with a velocity of 30–100 m/year [23].
Below the Quaternary aquifers is a 100-m thick series of Pliocene clays and Miocene silty sands, silts, and clays with lignite interbeds, with variable thicknesses. The deepest Oligocene aquifer (third aquifer) recognized in Warsaw in the monitoring system is found in fine- and medium-grained sands with glauconite at a depth interval from 225 to 263 m b.g.l. The groundwater table drilled at a depth of 221 m b.g.l. became stabilized at the depth of 35.75 m b.g.l. during the drilling.
2.3. Water Supply in Warsaw
The Warsaw agglomeration is supplied about 96% of its water from surface water sources, and the remaining 4% is from groundwater sources. Surface water comes from the Vistula River and the Zegrze Reservoir (located 7 km north of the Warsaw border). The water system, with a total length of 4215.7 km, covers almost the entire area of the Warsaw urban agglomeration. The population of Warsaw uses about 340,000 m3 of water per day [24], and the daily use of water is about 135 L/person [25]. Groundwater is exploited mainly by industrial plants. About 500 intakes from the Quaternary aquifers and about 100 intakes from the Oligocene aquifer, exploiting almost 25,000 m3/day, are located in the Warsaw agglomeration. Due to its quantity and quality, groundwater represents the strategic groundwater resources of the urban area. In the entire Mazovian voivodeship, of which Warsaw is the largest urban area, the exploitable groundwater resources from Quaternary deposits are in the range of about 205,000 m3/h, and from the Palaeogene-Neogene deposits, they are in the range of 17,500 m3/h [26].
3. Materials and Methods
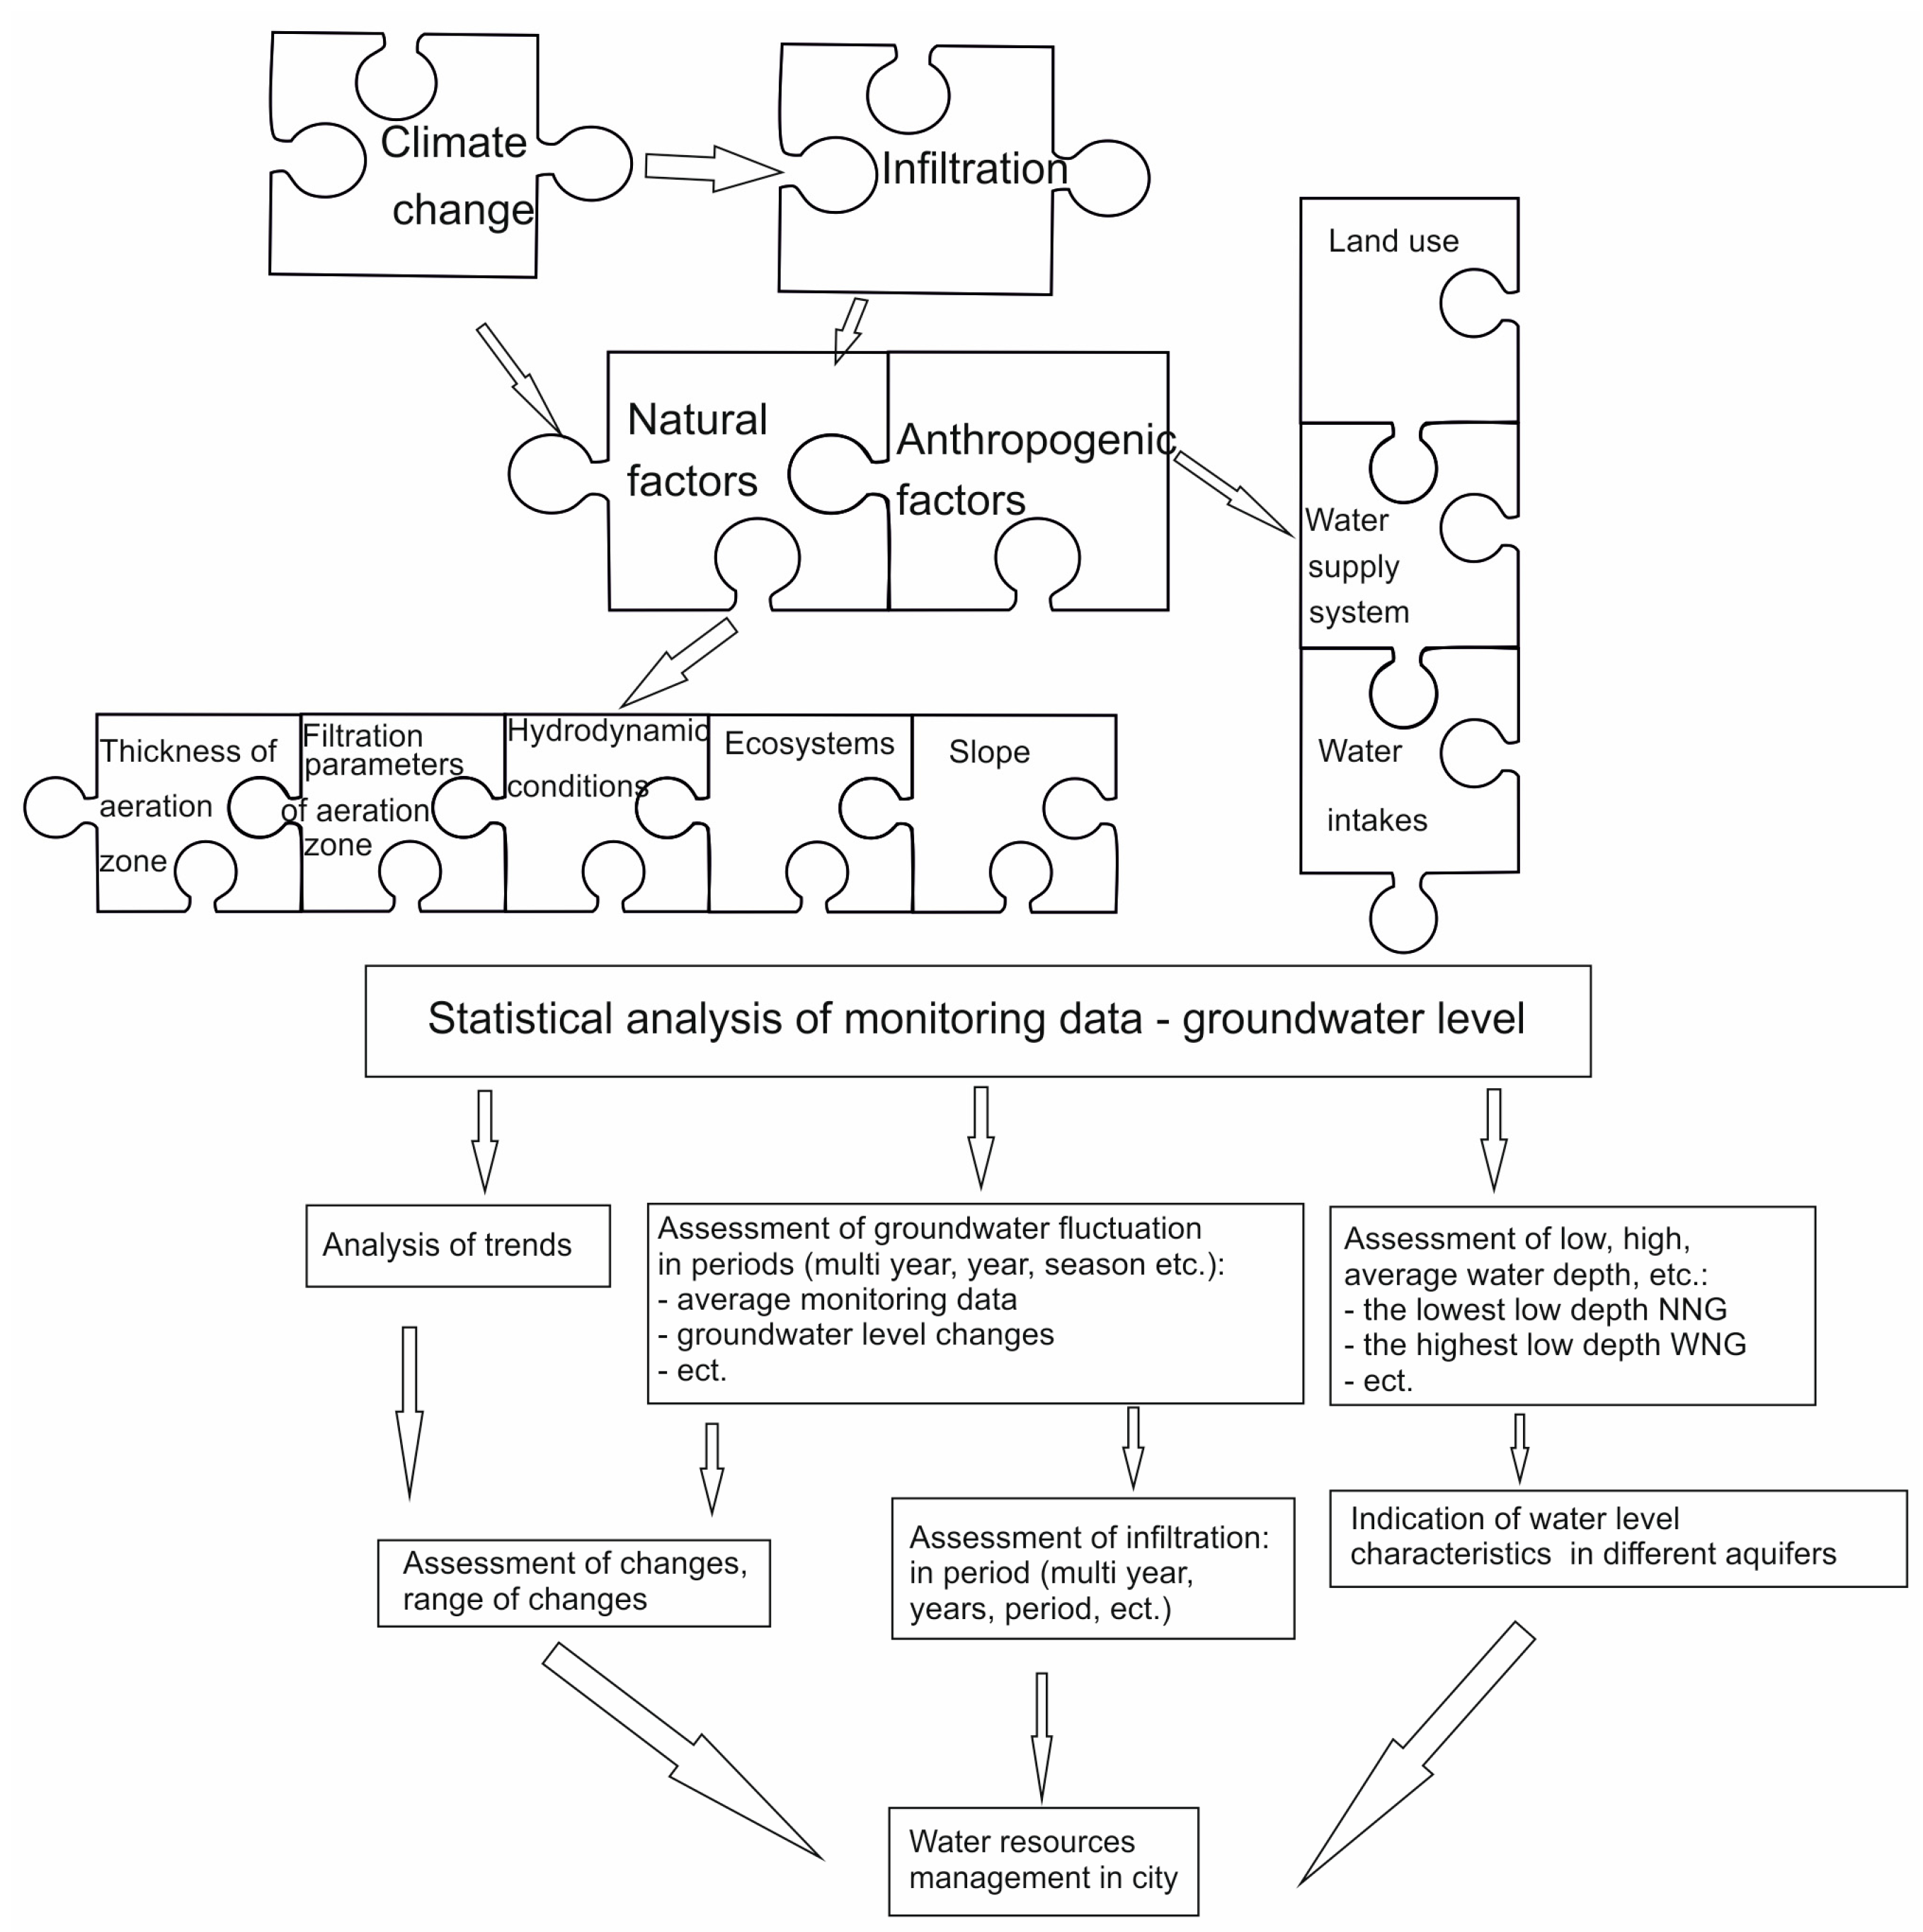
Changes in groundwater levels in Warsaw have been studied by means of the following (Figure 3):
- statistical analysis of monitoring data from aquifers;
- comparison of groundwater level fluctuations in different aquifers;
- assessment of the trend of groundwater level changes in different aquifers;
- assessment of the variability of groundwater levels and their causes;
- characterizing groundwater-level changes in time;
- assessment of the range of groundwater recharge;
- determining the reasons for groundwater level changes in Warsaw.
Measurements of the water table depth are made automatically with continuous control. The research station monitors three aquifers: two Quaternary aquifers (shallow and deeper) and the Oligocene aquifer (Figure 2), using 1 piezometer and 2 wells. The analysis was performed on a 27-year measurement series in hydrogeological years 1993–2019; therefore, the total number of daily observations was 9861 for each aquifer. In the frame of the groundwater monitoring system in Poland, the observation site of water levels is located in Warsaw (II-22-1, the western part of the city; Figure 1) in the deeper Quaternary aquifer. Measurements of groundwater levels have been performed at this site since 1994 [28].
Analysis of the changes of groundwater levels was performed using statistical methods most commonly applied in assessment studies of monitoring data [29,30,31,32,33,34]. The performed analysis allows the determination and characterization of statistical data and prediction of groundwater level changes.
Seasonal variability of the water level results from cyclic climate changes. It was characterized by annual amplitude, median value and analysis of charts with water table fluctuations. The annual amplitude was calculated as the difference between the highest and lowest multiannual mean water level, or as the difference between the absolute highest and the absolute lowest registered water level. The coefficient of variation, i.e., ratio of the standard deviation to the mean value, was also calculated. The measure of multiannual change of groundwater levels is the value of standard deviation of mean annual groundwater levels [35].
The magnitudes of estimated changes in the trend of meteorological variables in this study were estimated by the application of the Sen slope method. This technique calculates the gradient as a change in the measurements correlated with units of temporal change. The advantages of this method include an allowance for missing data, avoidance of assumptions about the distribution of tested data, and averting the effects of gross data errors and outliers [36]. Therefore, the method reduces the consequences of missing data and/or anomalous trends therein using the median values of the time series of various slopes that were detected as an evaluation tool [36,37]:
In this equation, Xj and Xi denote values dated at times j and i, and time j is after time i. The estimator β is the median overall combination of the recorded pairs for the entire dataset where trend analysis is performed, and a positive β indicates an increasing trend, while a negative value indicates a decreasing trend [37].
Assessment of the trend of changes in the water table level in the studied aquifers using the Sen slope method was based on the average monthly positions of the water table.
The magnitude of infiltration was determined based on measurements of groundwater levels. The methodology of assessing the magnitude of recharge at a regional scale is the focus of many hydrogeological investigations, and their synthesis has been presented e.g., by de Vries, Simmers [38], Scanlon et al. [39], and Assouline [40].
Observations of the groundwater levels of the shallow Quaternary aquifer (first aquifer) allowed the determination of the recharge using the water table fluctuation (WTF) method (e.g., [41,42]). The method is based on an assumption that the increase in groundwater level is caused by infiltration. In intervals with no recharge, the water level decreases. Recharge is calculated as follows:
where
- R—recharge [L/T] (mm/year)
- Sy—specific yield [-]
- h—hydraulic head [l] (mm)
- t—time [T] (year)
The method is mainly used for short observation periods in areas with a shallow groundwater level, which causes quite large changes in its position over time [39].
The mean annual sum of precipitation from the multiannual interval 1993–2019 in the Warsaw area at 570 mm was used in the calculations of the infiltration coefficient [43]. The meteorological data came from the Warszawa-Okęcie Station, located in the south of Warsaw. A similar average amount of rainfall (571 mm) was recorded in the years 2001–2010 in Warsaw [44]
4. Results
The depth of the water table of the shallow Quaternary aquifer was at intervals from 3.62 to 7.76 m and a mean depth of 5.91 m over the period of 1993–2019. The deeper Quaternary aquifer had a depth of 6.40 to 10.13 m and a mean depth of 8.21 m. In the Oligocene aquifer, the extreme values of the depth to the water table were from 21.75 to 32.28 m, at a mean depth of 25.44 m (Table 1). The characteristic groundwater levels in three aquifers were determined in order to recognize the dynamics of changes indicating similarities and differences in the hydrodynamic conditions.
The value of the 1st quartile (5.56) and 3rd quartile (6.28) was exceeded over 2440 times in the case of depth to groundwater of shallow Quaternary aquifer (Table 1). Exceedance of the 1st quartile was found in two periods: March 1993 to October 1996 and June 2010 to October 2012. Exceedance of the 3rd quartile was found in two periods: September 2005–March 2007 and June 2016–October 2019. The value of the 1st quartile (7.78) and the 3rd quartile (8.70) was exceeded also over 2440 times in the case of depth of groundwater of the deeper Quaternary aquifer (Table 1). Exceedance of the 1st quartile occurred in two periods: March 2006 to October 2007 and June 2009 to August 2012. Exceedance of the 3rd quartile occurred in two periods: June 1996 to July 2000 and October 2017 to October 2019. The Oligocene aquifer is different compared to Quaternary aquifers in the case of the 1st and 3rd quartiles. The 1st quartile was exceeded from October 2013 to October 2019, while the 3rd quartile was exceeded from January 1993 to July 1999.
Taking into consideration the coefficient of variation, it can be seen that variability of depth of the groundwater table is statistically significant in the case of shallow Quaternary and Oligocene aquifers (Table 1).
A similarity can be observed between the Quaternary aquifers with regard to low groundwater depths. The amplitudes (WNG-NNG; highest low groundwater depth to lowermost low groundwater depth) were similar in the first and second aquifers and reached a maximum of 3 m (Table 2). In both aquifers, there were similar differences between the mean depth to the water table in the multiannual interval and the mean depth at low levels (SNG; average low groundwater depth). In the case of the Oligocene aquifer, the amplitude (WNG-NNG) exceeded 10.5 m, whereas the difference between the mean depth to the water table in the multiannual interval and at low levels was 1 m. This indicator points to the similarity of hydrodynamic conditions in the Quaternary aquifers and the distinctiveness of the Oligocene aquifer.
The ratio of annual mean to multiannual mean is 0.17 in the first aquifer, 0.20 in the second aquifer and 0.13 in the third aquifer, which indicates significant multiannual changes at small seasonal amplitudes.
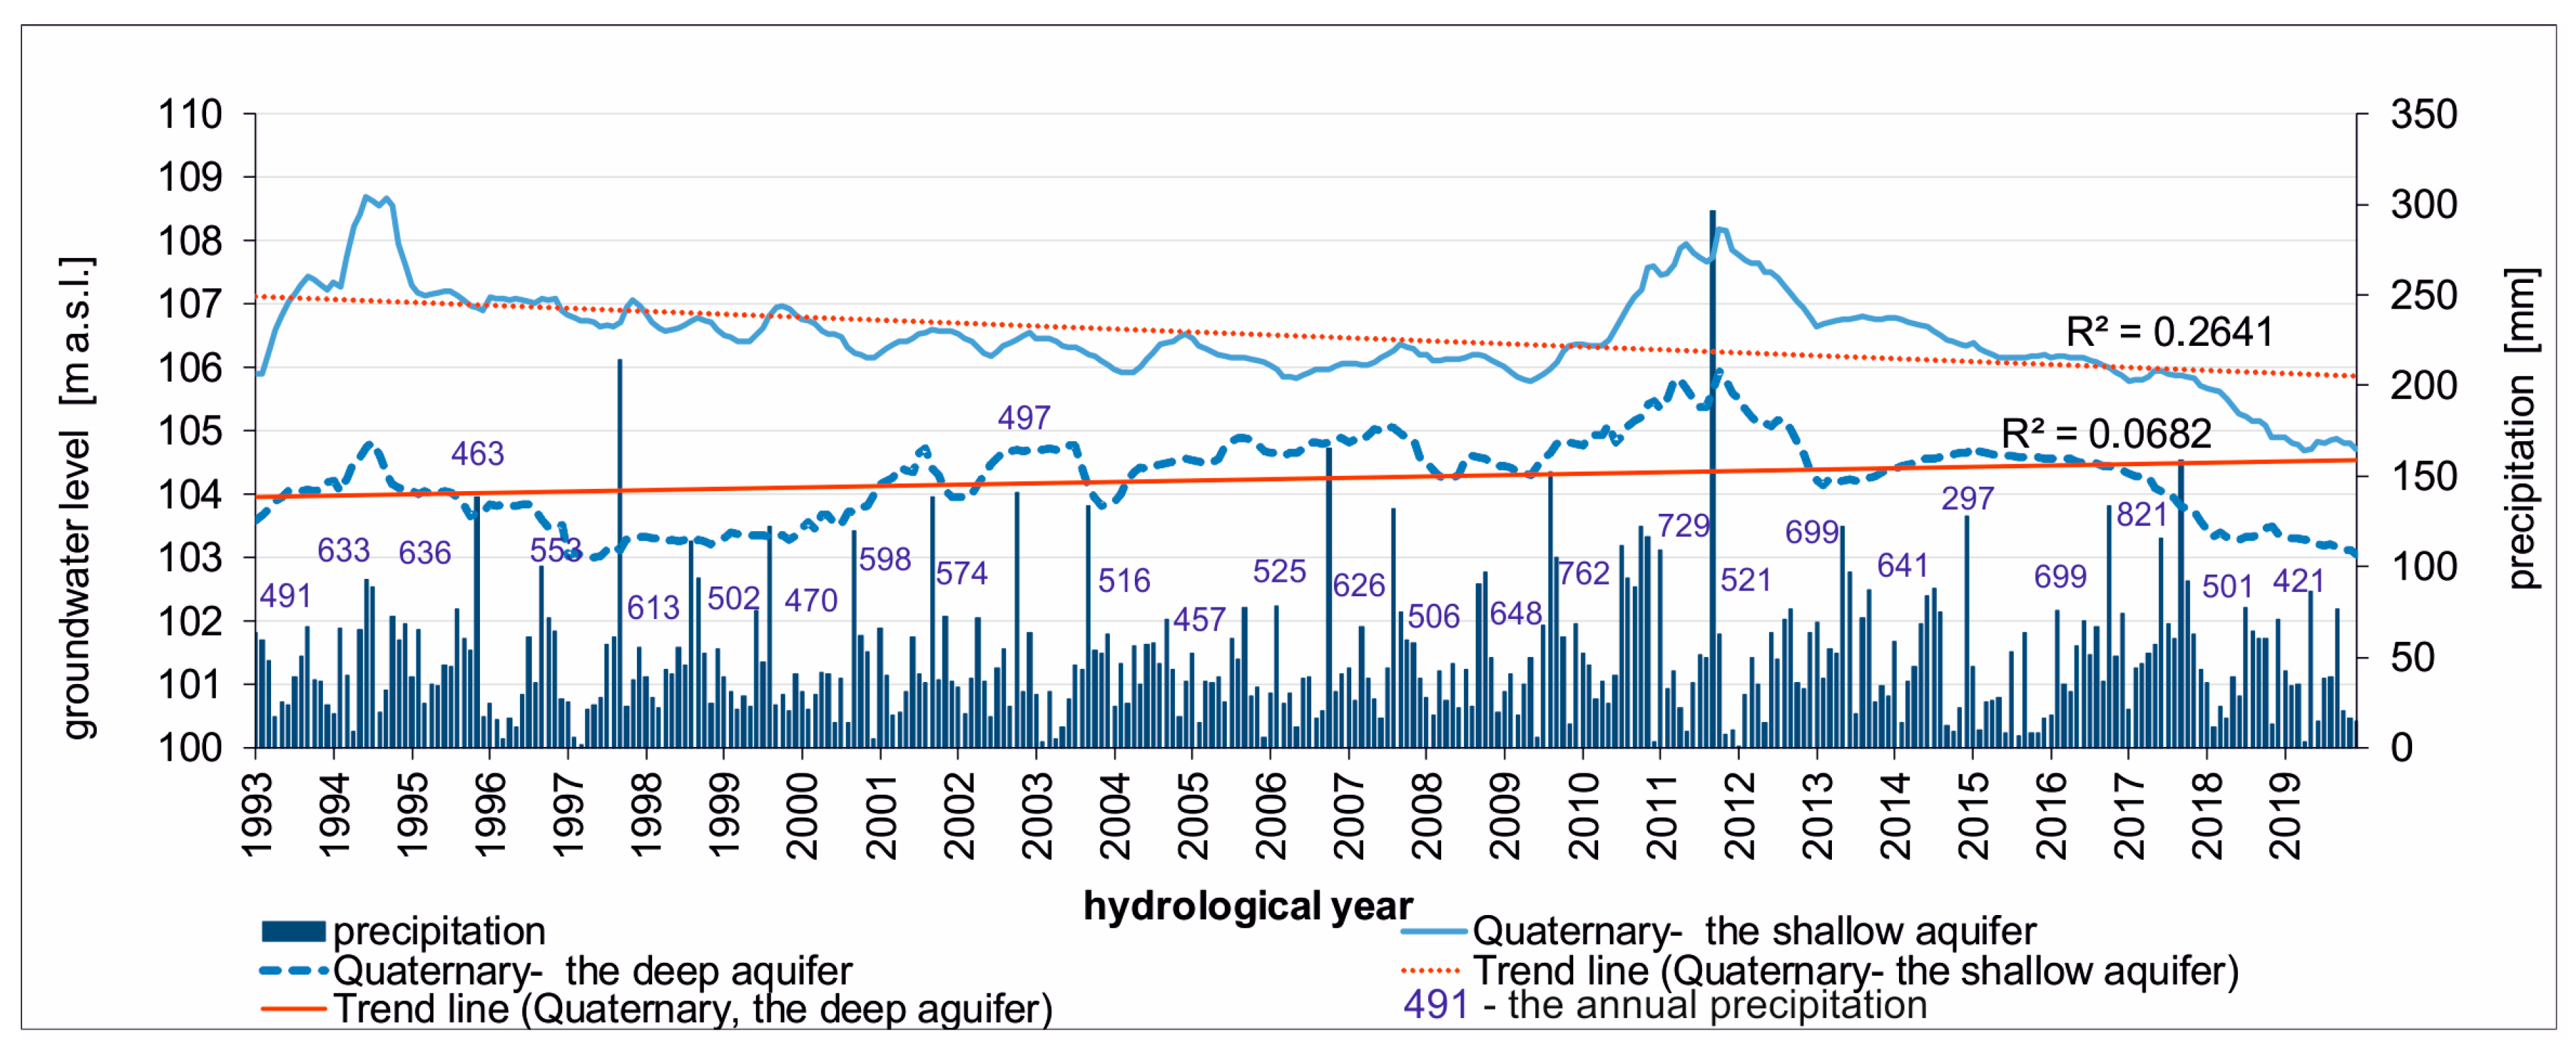
A comparison of daily measurements from both Quaternary aquifers shows that larger amplitudes occur in the shallow aquifer (4.14 m) than in the deeper aquifer (3.73 m). Analysis of the water table position on an annual basis did not reveal cyclic changes related to seasonal fluctuations of the water table, with typical high levels in spring–summer and low levels in autumn–winter. The water table position was not affected by seasonal infiltration changes. There was no direct relationship between precipitation and groundwater levels of the Quaternary aquifers (Figure 4). The analysis of trends of long-term changes carried out using the Sen’s slope method indicates a decreasing trend of the water table in a shallow Quaternary aquifer (Table 3).
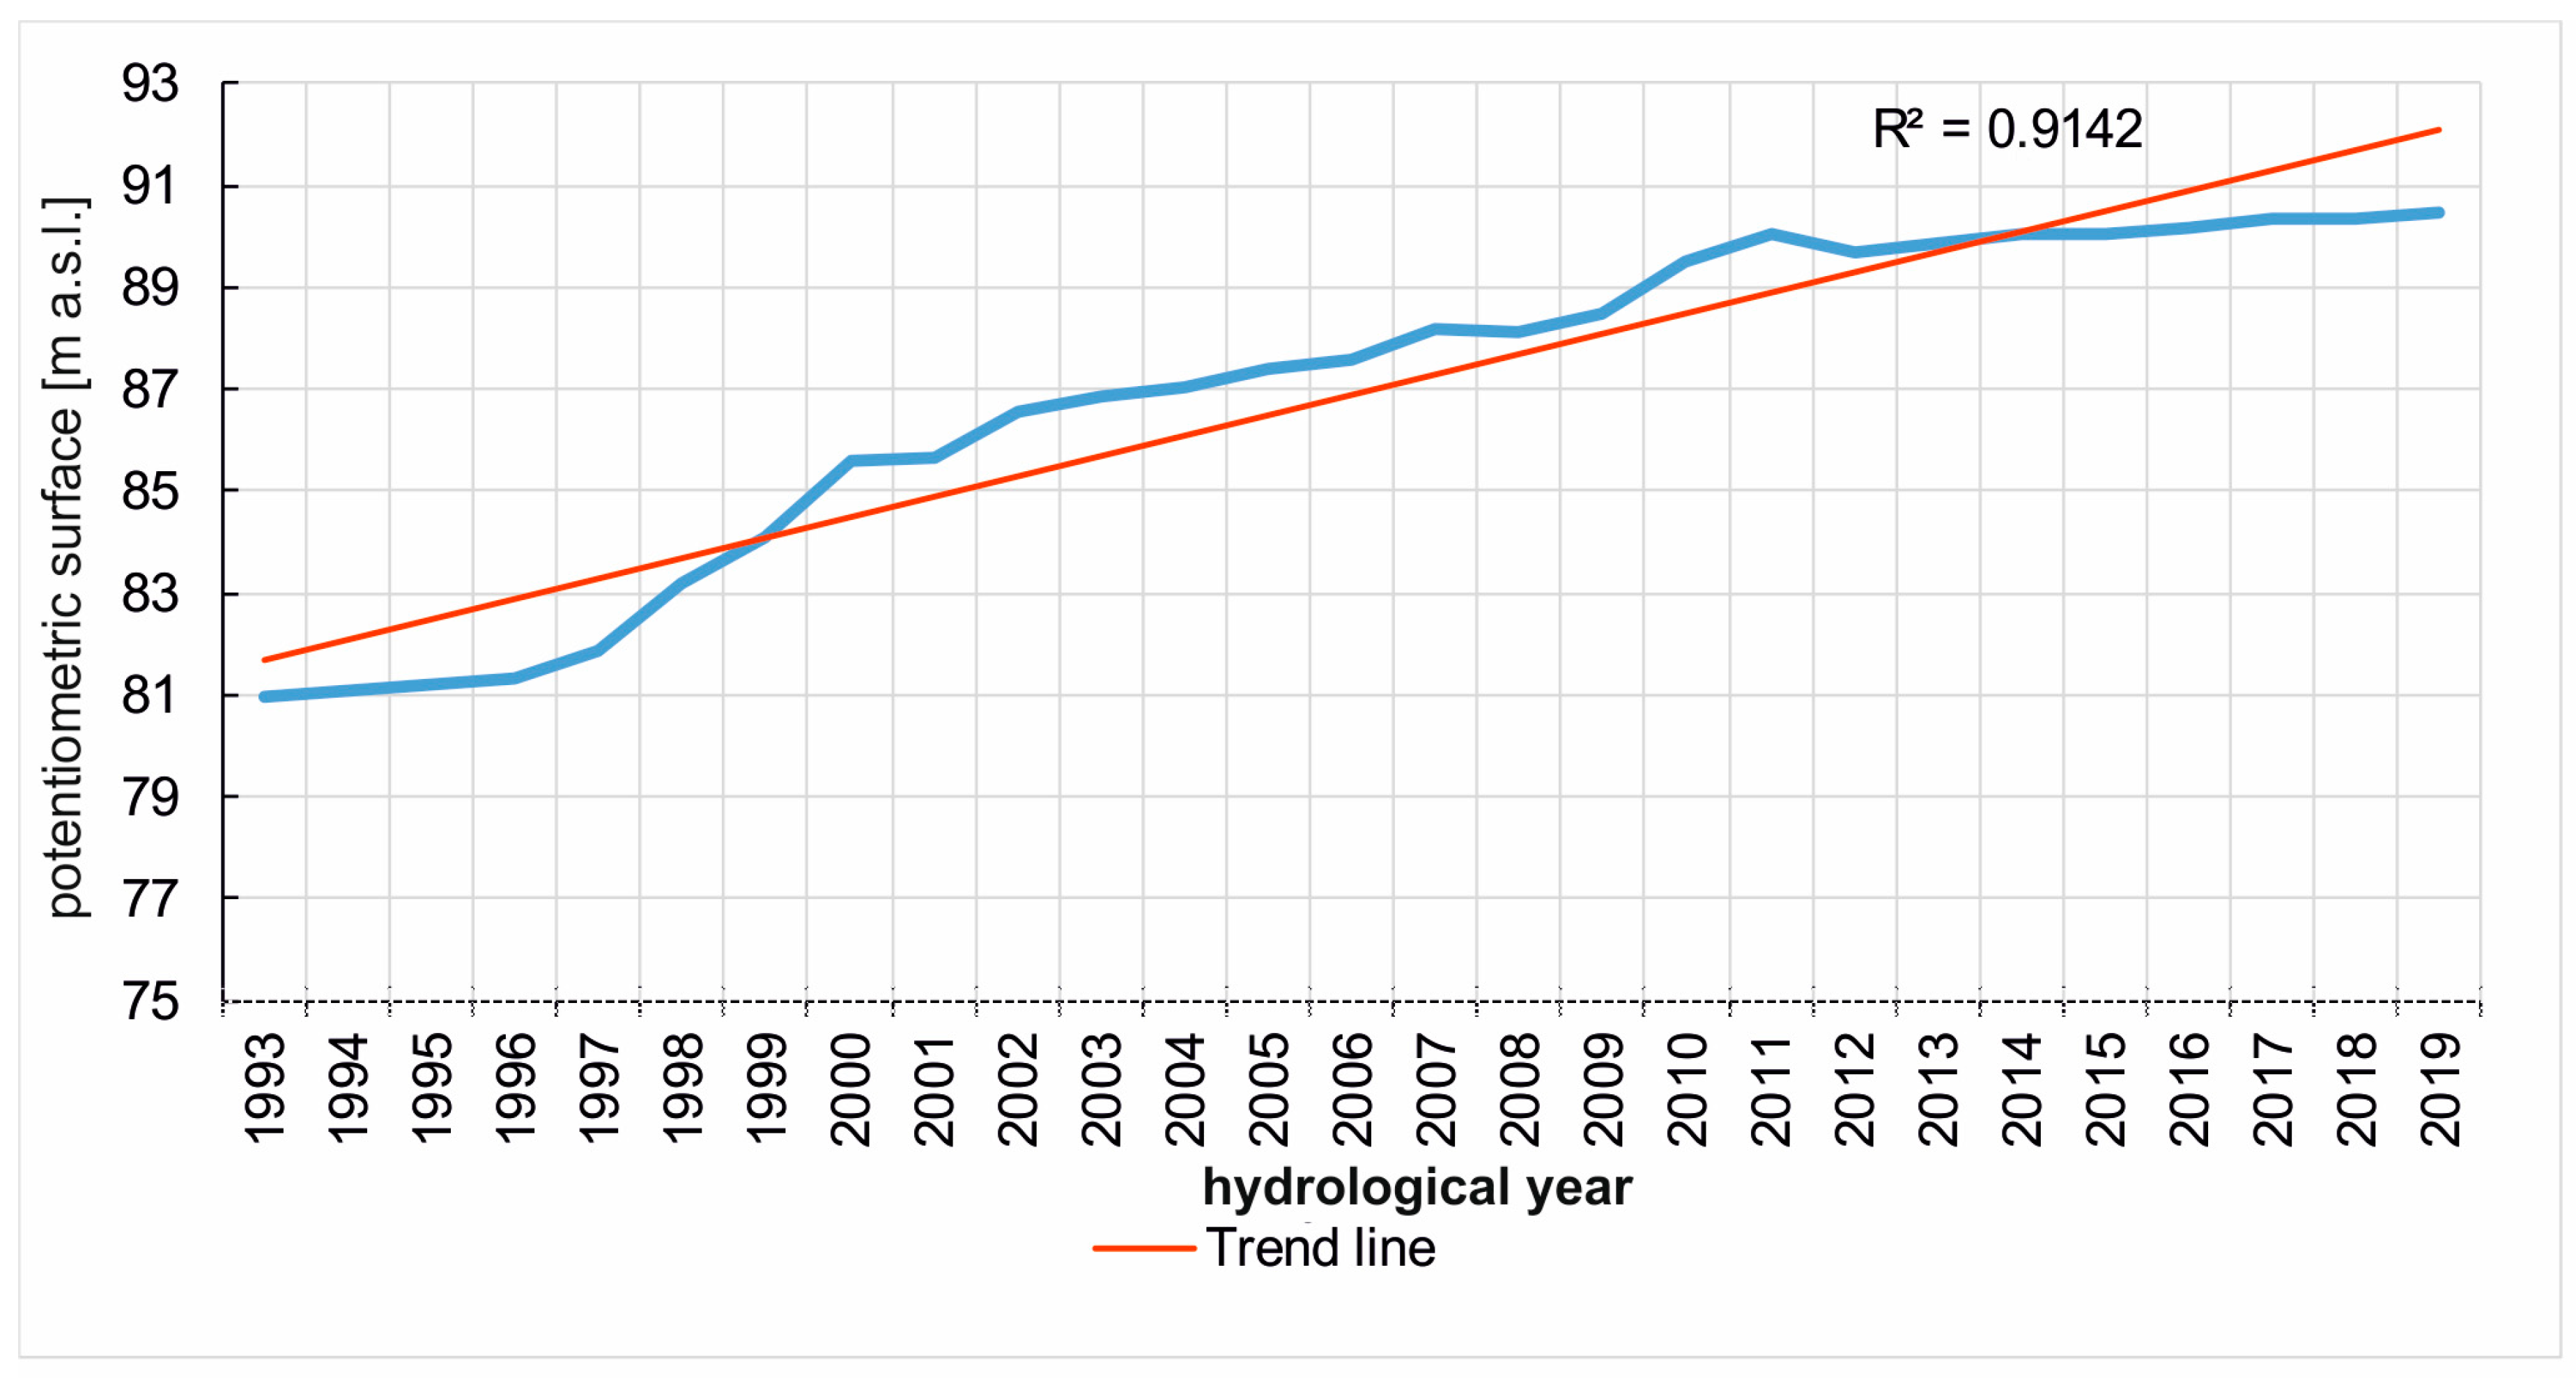
In the deeper Quaternary aquifer, the trend of changes of the water table position was opposite in the multiannual interval. However, detailed analysis of the groundwater levels in both aquifers shows that only in the first part of the multiannual interval (when the Quaternary aquifer was intensively exploited for industrial requirements), the water table of the deeper aquifer was at a lower level, indicating larger differences between both aquifers. After reducing the exploitation of groundwater due to the economic transformation in Poland in the early 1990s, since 1997 the water table of the deeper Quaternary aquifer began to increase systematically, and since 2001, its position has been analogous to the fluctuations in the shallow Quaternary aquifer. Similar dynamics of fluctuations in the multiannual interval 2001–2019 may indicate that after reducing exploitation in the deeper Quaternary aquifer, they are influenced by the same factors (recharge, drainage) that decide on the analogous water table position. The similarity between the water table positions of both Quaternary aquifers suggests the existence of a hydraulic connection between them in zones beyond the area of the research station (Figure 5).
Assessment of the reliability of accumulated data allowing for spatial interpretations in the Warsaw city was achieved by analysing changes of water table positions of the deeper Quaternary aquifer in well no. II-22-1 [28], located in the westernmost part of the city (Figure 5). Comparison of the water table fluctuations in both Quaternary wells indicates their clear similarity, which allows the local observations in the research station to be transferred to spatial assessments (Figure 4 and Figure 5, Table 3).
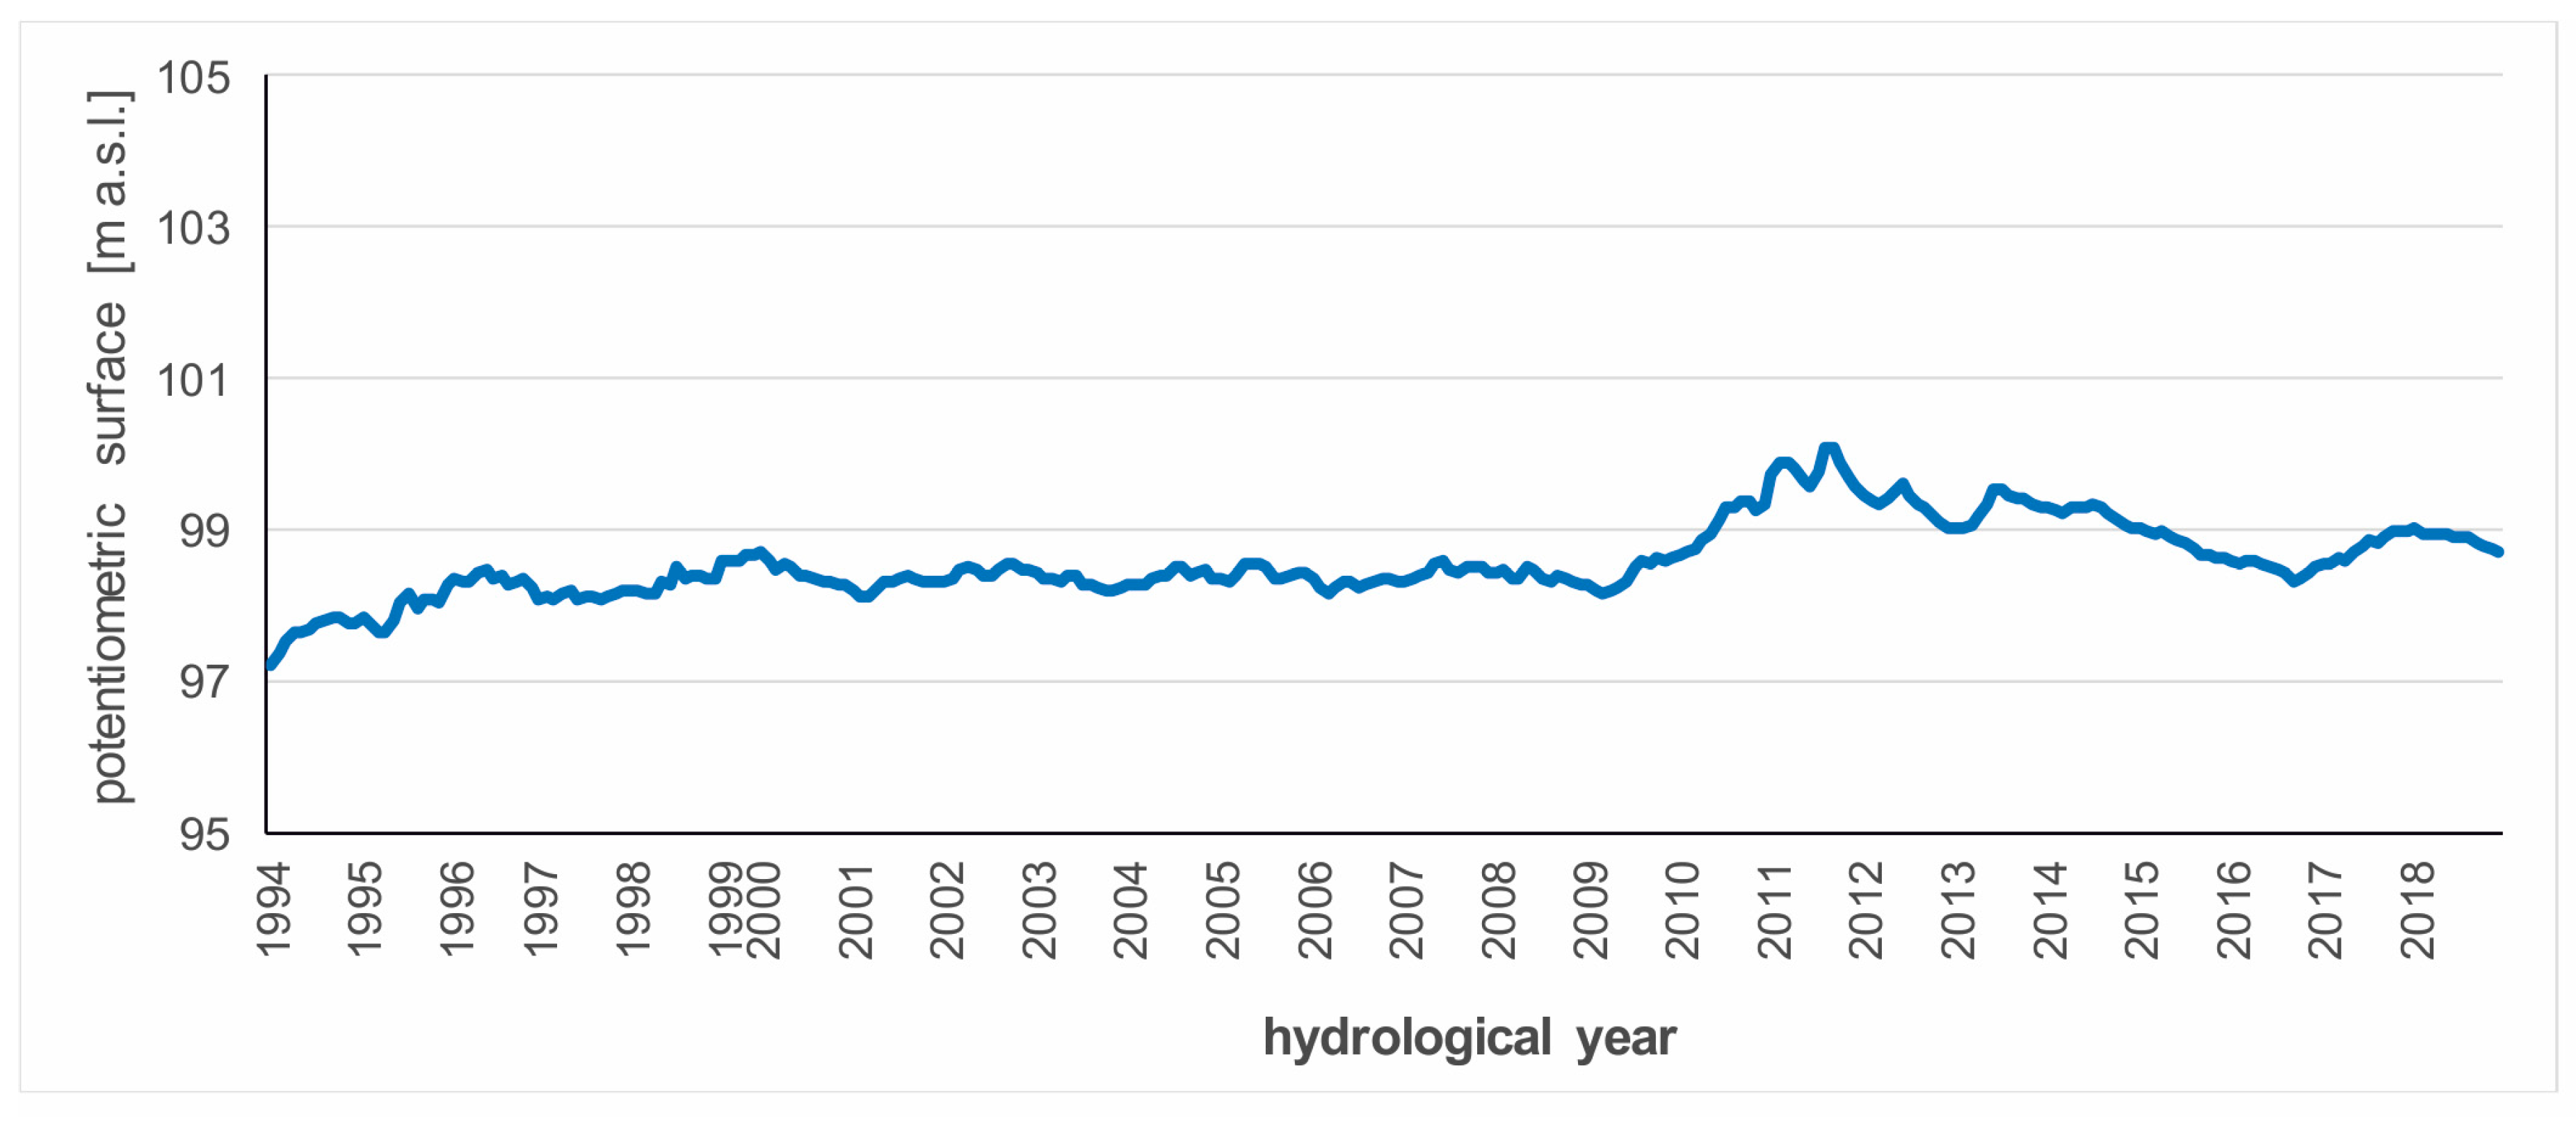
The potentiometric surface of the Oligocene aquifer displays an opposite trend compared to both Quaternary aquifers. The trend of changes in the potentiometric surface of the Oligocene aquifer in the multiannual interval 1993–2019 points to the gradual restoration of hydrostatic pressure. In 1993, the potentiometric surface became stabilized at 80.83 m a.s.l., whereas it presently stabilizes at 90.72 m a.s.l., which shows a rise of the potentiometric surface in the multiannual interval by about 10 m (Figure 6).
Trend analysis of the water table levels using Sen’s slope method confirms the rising trend of the Oligocene potentiometric surface (Table 3).
The gradual restoration of pressure in the Oligocene aquifer results from reduced exploitation. The largest increase in the potentiometric surface was observed in 1997–2003 (Figure 6 and Figure 7). After 2003, the potentiometric surface position changed in a much narrower range. There was excessive exploitation of groundwater from the Oligocene aquifer in Warsaw in the 1970s, reaching 50,000–60,000 m3/d, resulting in the formation of a vast depression cone. Following the protection of these waters, in 1977, the construction of new water intakes for industrial purposes was banned, and the intake by existing industrial plants was strongly limited [45,46]. At present, 53 public sources rely on groundwater from Oligocene aquifer in the Warsaw city (as of 13.12.2019) [47]. Water from this aquifer is also used by hospitals and industries requiring water of the highest quality. The introduced restrictions have brought expected effects. A similar case took place in Barcelona, in which the intensive extraction of water from deltaic aquifers caused large drawdowns, leading to seawater intrusion [48]. Since the 1970s, many industries have migrated from the city, which reduced water demand, resulting in a progressive recovery of heads.
Accepting the urban area as the watershed-scale balance area and undertaking the attempt to identify the causes of groundwater level changes on a short-term and long-term basis, the basin water budget was evaluated for the shallow Quaternary aquifer. Recharge was assessed based on the analysis of changes of the water table position monitored in the first aquifer using the water table fluctuation (WTF) method. The specific yield taken for the calculations was at 0.10 [41,49,50,51]. This value is typical for sediments with low hydraulic conductivity (the aeration zone comprises sands with the addition of the silt fraction and clay).
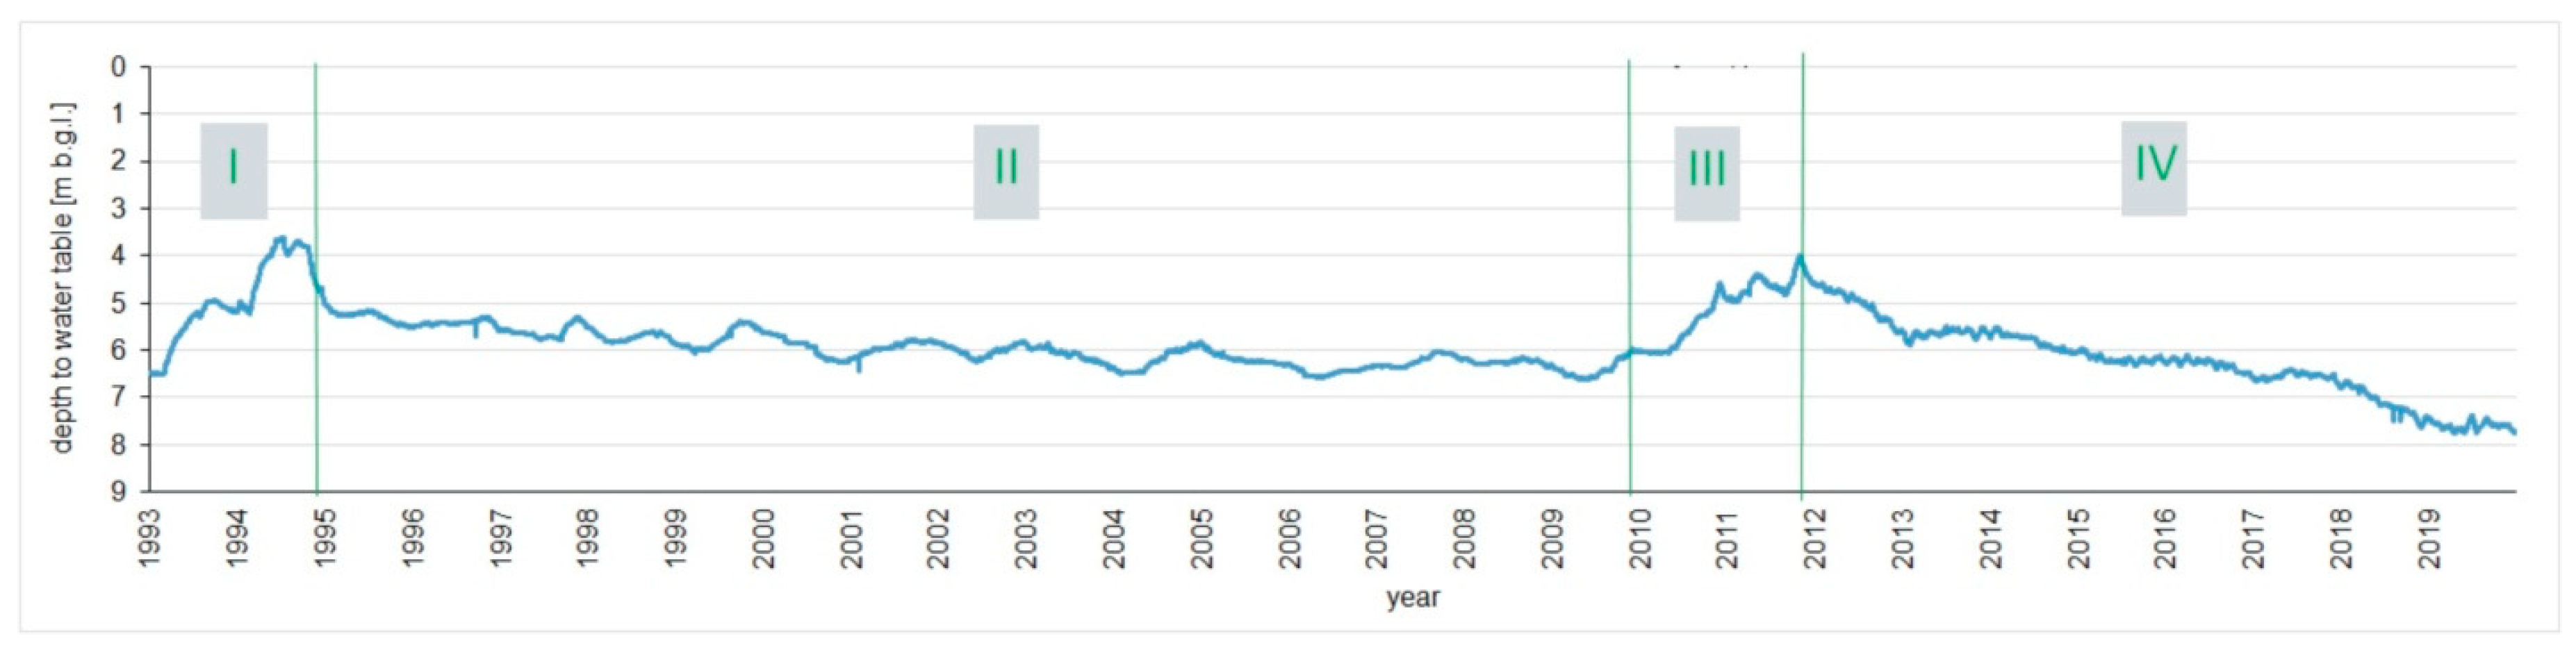
Due to the lack of seasonal water table fluctuations, annual recharge was not discussed; instead, the method was modified by assessing recharge in intervals similar with regard to the dynamics of the water table. Based on the analysis of the water table position, four intervals were distinguished, differing in water table fluctuations as reflected in the magnitude of recharge (Figure 8).
In the first interval, in the hydrological years 1993–1994, and in the third interval, in 2010–2011, infiltration was a long-term process (from 2 to 9 months), which caused a significant rise of the water table (1.2–2.9 m). The recharge coefficient was calculated as the percentage contribution of recharge (R) in the mean precipitation (P), assuming 570 mm/year of the precipitation for Warsaw. In these intervals, the annual recharge was from 130 to 160 mm, at a recharge coefficient from 23 to 28% (Table 4). In the second interval, in 1995–2009, the infiltration time was much shorter (1 to 2 months) and caused smaller seasonal fluctuations of the water table. Annual recharge was about 80 mm, and the recharge coefficient was 14%. For 16 years, the water table fell by almost 2 m. The fourth interval, in 2012–2019, was characterized by slightly lower values of parameters; infiltration was short-term (5–20 days), and despite a few such episodes during the year, systematic fall of the water table was observed. In 2019, the water table was at 7.71 m, i.e., 1.8 m below the mean value for the entire multiannual interval 1993–2019.
In the first aquifer, only long-term recharge lasting several months can result in changes in the water table position. The observed differences in the water table position and its gradual decrease from 2012 are not caused entirely by climate change as reflected in precipitation recharge. The distribution of annual totals of precipitation did not differ significantly from the remaining intervals during this period (Figure 4). This factor is not the only reason for long-term and non-cyclic changes. The lack of typical seasonality is the cumulative effect of many elements, which are interdependent and cannot be analyzed separately.
5. Discussion
Recharge in urban areas depends on a number of factors, including climate conditions and the dynamics of their changes [52,53], lithology of subsurface sediments [54,55], topography [56], land use and land cover [52,57], and thickness of the aeration zone [55,58].
The change of climate conditions in Warsaw was recorded as anomalously high precipitation in 2017 (821 mm) and anomalously low precipitation in 2015 (297 mm) (Figure 4). Measurements of groundwater levels in the research station have indicated that this change has no direct impact on the change of groundwater levels, even in the case of the shallowest Quaternary aquifer. In all analyzed aquifers, the influence of precipitation on water table fluctuations was insignificant due to the rather unfavourable filtration parameters in the aeration zone and the impact of urban infrastructure, especially in the subsurface zone. The reaction of the water table, even after intense precipitation, was greatly delayed. Multiannual trends of changes in the position of the water table in Quaternary aquifers and a stable trend of increasing potentiometric surface in the Oligocene aquifer are notable.
In urban areas, the magnitude of recharge depends on land use. The research station is located in Warsaw’s centre and was developed at a time when there was hardly any infrastructure around it. However, in the 27-year interval, numerous changes in its surroundings have taken place, particularly related to the development of the University of Warsaw, Ochota Campus infrastructure, which may have had a significant impact on groundwater recharge and flow in the shallowest zone. The recharge zone also includes more distant regions, covered by typical urban housing. New multi-family buildings, parking lots and streets were constructed, modifying direct recharge from the surface, which is typical of urban agglomerations. The construction of multi-story buildings requiring deep foundations permanently modified the structure of groundwater flow [59,60]. Some buildings required drainage during construction, which periodically changed the hydrodynamic system. This factor is difficult to estimate because of construction activities in the urban area, but has a significant influence on the local position of the water table.
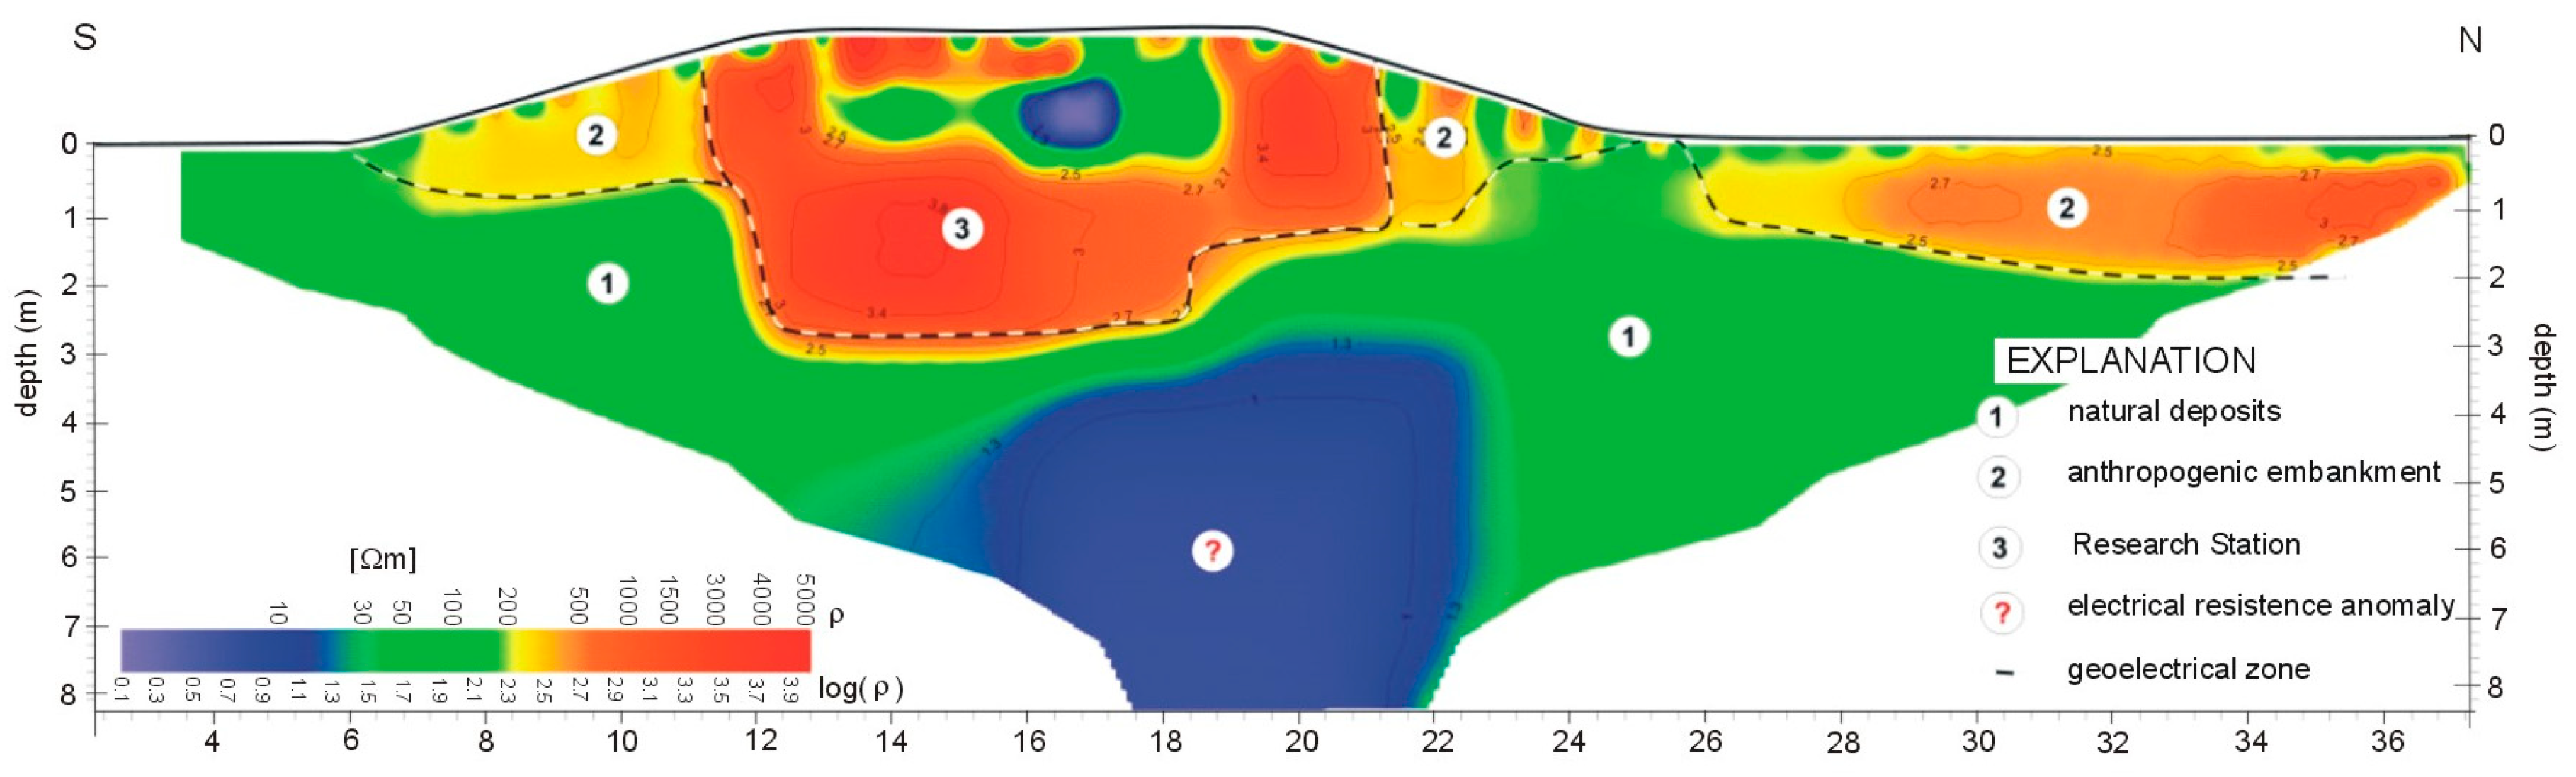
In urban areas with high water demands, the hydrodynamic conditions are modified due to significant, focused groundwater sources. There are only a few groundwater sources near the research station and in all of Warsaw; therefore, restoration of piezometric surfaces was documented in the Oligocene aquifer. Leakage of the water supply system and infiltration of water from the leaking network to the aquifer, documented even in the vicinity of the research station (Figure 9), can be observed in Warsaw.
The content of water leaking from the water supply system due to leakage or failure is roughly estimated in Warsaw at about 18% (mean value of water loss for Poland according to the Central Statistical Office for 2006), which gives the absolute value of 61,200 m3 water per day. This value should be increased by another 18% resulting from leakage from the sewage system, which is 4160.7 km long in the Warsaw agglomeration [24]. Taking into account that these are estimates in many cases are understated, it can be concluded that a total of about 125,000 m3 of water per day recharges the shallow Quaternary aquifer within this urban area. In Barcelona, the water supply network losses provide 22% of the total recharge of aquifers [48].
Water use does not increase proportionally with the increasing population of Warsaw. This may result from more economical water use due to rising costs and ecological lifestyles. This lower water source results in smaller amounts of water potentially recharging the subsurface zone due to leakage of the water system. The cumulative impact of many elements causing periodical rise or fall of recharge in urban areas allows for an assessment of their impact on the groundwater environment. In the case of the three analyzed aquifers, water level fluctuations are slow and occur over longer periods. Quaternary aquifers are characterized by multiannual intervals with higher recharge and much longer episodes of water table fall, which, compared to the entire 27-year interval, results in a falling trend towards decreasing water table levels. Such a case is very distinct in the shallow Quaternary aquifer since 2012. The Oligocene aquifer displays a trend of gradual but uneven restoration of hydrostatic pressure over the analyzed time span. The highest increase in the potentiometric surface was found in 1997–2003, after which the increase was much slower. The restoration of pressure in the Oligocene aquifer in the Warsaw area is confirmed by monitoring observations performed by the Polish Hydrogeological Survey [61].
6. Conclusions
Analysis of the changes in groundwater levels in several aquifers—two Quaternary ones and an Oligocene one—points to diverse factors controlling their location. In Quaternary aquifers, recharge conditions and dynamics of changes depend on local factors: infiltration conditions in the region of the monitoring system and development of the area, including elements characteristic of urbanized regions. In the case of the deep Oligocene aquifer, the position of the potentiometric surface depends on water circulation in the regional hydrogeological system, which covers a much larger area than the Warsaw agglomeration. Statistical analysis is a useful tool for interpreting multiannual measurements, although numerous natural and anthropogenic aspects need to be considered for its correct application. Groundwater monitoring systems usually exist in urban areas for several years, whereas statistical analysis requires long-term measurement series to analyse the trend of changes. The position of the water tables of the Quaternary aquifers across a long-term interval showed their fall, whereas the deep Oligocene aquifer displayed an opposite trend, with the restoration of hydrostatic pressure resulting in a rise in the potentiometric pressure by about 10 m.
Analysis of the changes in groundwater levels in time and factors influencing them in Warsaw does not show the impact of climate change (e.g., through extreme precipitation) on groundwater. Seasonal trends and long-term changes in levels have not been observed in the studied aquifers in the urban area.
The studies have shown that groundwater recharge and drainage in urban areas are components of natural processes related to hydrogeological and climate conditions and anthropogenic factors resulting from the groundwater source, water distribution, and changes in spatial management. When analysing the cumulative impact of these factors, often with opposite effects with regard to groundwater recharge, a relatively rapid decrease in the water table position may be observed in the shallowest groundwater aquifer. Therefore, it is critical to correctly manage water resources and increase water retention conditions through increased area covered by green zones, increased application of precipitation for urban green management and application of innovative solutions to enhance the infiltration of precipitation in high-density urban zones. Analysis of data sets containing long-term measurement series allows for a reliable assessment of the existing conditions (water efficiency), aids in planning sustainable water management and, to some degree, allows for the prediction of the effects of irrational water management or inappropriate development of urban infrastructure.
Author Contributions
Conceptualization, E.K. and J.J.M.; methodology, E.K., J.J.M., D.P. and A.W.; software, D.P. and A.W.; validation, E.K., J.J.M., D.P. and A.W.; resources, J.J.M. and A.W.; data curation, J.J.M. and A.W.; writing—original draft preparation E.K., J.J.M., D.P. and A.W.; visualization, D.P. and A.W. All authors have read and agreed to the published version of the manuscript.
Funding
This research received funding from the University of Warsaw.
Conflicts of Interest
The authors declare no conflict of interest.
References
- Yang, L.; Feng, Q.; Yin, Z.; Wen, X.; Si, J.; Li, C.; Deo, R.C. Identifying separate impacts of climate and land use/cover change on hydrological processes in upper stream of Heihe River, Northwest China. Hydrol. Proces. 2017, 31, 1100–1112. [Google Scholar] [CrossRef]
- Butler, D.; Digman, C.J.; Makropoulos, C.; Davies, J.W. Urban Drainage; Imprint CRC Press: Boca Raton, FL, USA, 2018; p. 592. ISBN 9781351174305. [Google Scholar] [CrossRef]
- Fang, X.; Ren, L.; Li, Q.; Zhu, Q.; Shi, P.; Zhu, Y. Hydrologic response to land use and land cover changes within the context of catchment-scale spatial information. J. Hydrol. Eng. 2013, 18, 1539–1548. [Google Scholar] [CrossRef]
- Gashaw, T.; Tulu, T.; Argaw, M.; Worqlul, A. Modeling the hydrological impacts of land use/land cover changes in the Andassa watershed, Blue Nile Basin, Ethiopia. Sci. Total. Environ. 2018, 619–620, 1394–1408. [Google Scholar] [CrossRef]
- Ozler, H.M. Controlling seawater intrusion beneath coastal cities. In Current Problems of Hydrogeology in Urban Areas, Urban Agglomerates and Industrial Centres; Howard, K.W.F., Israfilov, R.G., Eds.; Nato Science Series (Series IV: Earth and Environmental Sciences); Springer: Dordrecht, The Netherlands, 2002; Volume 8. [Google Scholar] [CrossRef]
- Foster, S. Global Policy Overview of Groundwater in Urban Development—A Tale of 10 Cities! Water 2020, 12, 456. [Google Scholar] [CrossRef] [Green Version]
- Duque, J.; Chambel, A.; Madeira, M. The influence of urbanisation on groundwater recharge and discharge in the city of Evora, South Portugal. In Current Problems of Hydrogeology in Urban Areas, Urban Agglomerates and Industrial Centres; Nato Science Series (Series IV: Earth and Environmental, Sciences); Howard, K.W.F., Israfilov, R.G., Eds.; Springer: Dordrecht, The Netherlands, 2002; Volume 8. [Google Scholar] [CrossRef]
- Tellam, H.; Thomas, A. Well water quality and pollutant source distributions in an urban aquifer. In Current Problems of Hydrogeology in Urban Areas, Urban Agglomerates and Industrial Centres; Nato Science Series (Series IV: Earth and Environmental, Sciences); Howard, K.W.F., Israfilov, R.G., Eds.; Springer: Dordrecht, The Netherlands, 2002; Volume 8. [Google Scholar] [CrossRef]
- Magmedov, V.G.; Galetsky, L.S.; Yakovlev, Y.A. Urban groundwater contamination: Lessons from the Donbass Region, Ukraine. In Current Problems of Hydrogeology in Urban Areas, Urban Agglomerates and Industrial Centres; Nato Science Series (Series IV: Earth and Environmental Sciences); Howard, K.W.F., Israfilov, R.G., Eds.; Springer: Dordrecht, The Netherlands, 2002; Volume 8. [Google Scholar] [CrossRef]
- Turkman, A.; Aslan, A.; Yilmaz, Z. Groundwater quality and pollution problems in-the Izmir Region of Turkey. In Current Problems of Hydrogeology in Urban Areas, Urban Agglomerates and Industrial Centres; Nato Science Series (Series IV: Earth and Environmental, Sciences); Howard, K.W.F., Israfilov, R.G., Eds.; Springer: Dordrecht, The Netherlands, 2002; Volume 8. [Google Scholar] [CrossRef]
- Urban Europe—Statisticson cities, towns and suburbs—The dominance of capital cities. Available online: https://ec.europa.eu/eurostat/statistics-explained/pdfscache/50932.pdf (accessed on 10 May 2020).
- Preciuk, WaterPIX/EEA. 2018. Available online: https://www.eea.europa.eu/pl/sygna142y/sygnaly-2018/artykuly/zuzycie-wody-w-europie-2014 (accessed on 10 May 2020).
- WFD (Water Framework Directive). Directive 2000/60/EC of the European Parliament and of the Council of 23 October 2000; Official Journal of the European Communities L 327/1; WFD: Rome, Italy, 2000. [Google Scholar]
- European Environment Agency. Water in the city, 2019 Copyright: D. Aydemir/EEA. Available online: https://www.eea.europa.eu/signals/signals-2018-content-list/articles/close-up-2014-water-in (accessed on 15 April 2020).
- Lerner, D.N. Identifying and quantifying urban recharge: A review. Hydrogeol. J. 2002, 10, 143–152. [Google Scholar] [CrossRef]
- Spalvins, A. Modelling as a Powerful Tool for Predicting Hydrogeological Change in Urban and Industrial Areas. In Current Problems of Hydrogeology in Urban Areas, Urban Agglomerates and Industrial Centres; Nato Science Series (Series IV: Earth and Environmental, Sciences); Howard, K.W.F., Israfilov, R.G., Eds.; Springer: Dordrecht, The Netherlands, 2002; Volume 8. [Google Scholar] [CrossRef]
- Schirmer, M.; Leschik, S.; Musolff, A. Current research in urban hydrogeology: A review. Adv. Water Resour. 2013, 51, 280–291. [Google Scholar] [CrossRef]
- Karpf, C.; Krebs, P. Modelling of groundwater infiltration into sewer systems. Urban Water J. 2013, 10, 221–229. [Google Scholar] [CrossRef]
- Dohnalik, P. Water Losses in Municipal Water Supply Networks; PFOZW: Bydgoszcz, Poland, 2000. (In Polish) [Google Scholar]
- Li, H.; Zhang, Y.; Vaze, J.; Wang, B. Separating effects of vegetation change and climate variability using hydrological modelling andsensitivity-based approaches. J. Hydrol. 2012, 420, 403–418. [Google Scholar] [CrossRef]
- Małecki, J.J. The impact of urbanization on the specific levels of groundwater table–an analysis of the results of study conducted in the research station of the Faculty of Geology, University of Warsaw. Biul. PGI 2013, 456, 377–383. (In Polish) [Google Scholar]
- Petrucci, G.; De Bondt, K.; Claeys, P. Toward better practices in infiltration regulations for urban stormwater management. Urban Water J. 2017, 14, 546–550. [Google Scholar] [CrossRef]
- Dominko, L.; Kobyliński, A.; Kaliński, I.; Brodecki, A. Hydrogeological Documentation of the Groundwater Basin of the Central Vistula Pradolina (GZWP–220); Arch. PGI-NRI: Warsaw, Poland, 1998. (In Polish)
- Annual Report; Municipal Water and Sewage; Warsaw. 2017. Available online: https://mpwik.com.pl/download.php?id=2068 (accessed on 10 April 2020). (In Polish).
- Office of Warsaw Infrastructure. The policy of water and sewage system development in the Capital City of Warsaw until 2025. In Public Information Bulletin of the Capital City of Warsaw; Ministry of Digital AffairsService Development Department: Warsaw, Poland, 2018. (In Polish) [Google Scholar]
- Polish Geological Institute—National Research Institute. Available online: https://www.pgi.gov.pl/psh/zadania-psh/9010-zadanie-psh-zasoby-eksploatacyjne-wod-podziemnych.html (accessed on 10 April 2020).
- Krogulec, E. Evaluating the risk of groundwater drought in groundwater-dependent ecosystems in the central part of the Vistula River Valley, Poland. Ecohydrol. Hydrobiol. 2018, 18, 82–91. [Google Scholar] [CrossRef]
- PGI-NRI Database. Available online: http://spdpsh.pgi.gov.pl/PSHv7/ (accessed on 5 May 2020).
- Helsel, D.R.; Hirsch, R.M. Statistical methods in water resources. In Techniques of Water Resources; Investigations of the United States; USGS: Reston, VA, USA, 2002; p. 510. [Google Scholar] [CrossRef]
- Moon, S.K.; Woo, N.C.; Lee, K.S. Statistical Analysis of Hydrograph and Water-Table Fluctuation to Estimate Groundwater Recharge. J. Hydrol. 2004, 292, 198–209. [Google Scholar] [CrossRef]
- Coppola, E.A.; Rana, A.; Poulton, M.; Szidarovszky, F. A neural network model for predicting water table elevations. Ground Water 2005, 43, 231–241. [Google Scholar] [CrossRef]
- Shiria, J.; Kisi, O.; Yoon, H.; Lee, K.-K.; Nazemia, A.H. Predicting groundwater level fluctuations with meteorological effect implications-A comparative study among soft computing techniques. Comput. Geosci. 2013, 56, 32–44. [Google Scholar] [CrossRef]
- Krogulec, E.; Zabłocki, S. Relationship between the environmental and hydrogeological elements characterizing groundwater-dependent ecosystems in central Poland. Hydrogeol. J. 2015, 23, 1587–1602. [Google Scholar] [CrossRef] [Green Version]
- Krogulec, E.; Zabłocki, S.; Sawicka, K. Changes in groundwater regime during vegetation period in groundwater dependent ecosystems. Acta Geol. Pol. 2016, 66, 525–540. [Google Scholar] [CrossRef] [Green Version]
- Chełmicki, W. Selected methods of assessing groundwater level fluctuations. Pol. Geogr. Rev. 1989, 61, 63–76. (In Polish) [Google Scholar]
- Sen, P.K. Estimates of the regression coefficient based on Kendall’s Tau. J. Am. Stat. Assoc. 1968, 63, 1379–1389. [Google Scholar] [CrossRef]
- Deo, R.; McAlpine, C.; Syktus, J.; McGowan, H.; Phinn, S. On Australian heat waves: Time series analysis of extreme temperature events in Australia, 1950–2005. In Proceedings of the International Congress on Modelling and Simulation (MODSIM07), Christchurch, New Zealand, 10–13 December 2007; pp. 626–635. [Google Scholar]
- De Vries, J.J.; Simmers, I. Groundwater recharge: An overview of processes and challenges. Hydrogeol. J. 2002, 10, 5–17. [Google Scholar] [CrossRef]
- Scanlon, B.R.; Healy, R.W.; Cook, P.G. Choosing appropriate techniques for quantifying groundwater recharge. Hydrogeol. J. 2002, 10, 18–39. [Google Scholar] [CrossRef]
- Assouline, S. Infiltration into soil: Conceptual approaches and solutions. Water Resour. Res. 2013, 49, 1–18. [Google Scholar] [CrossRef]
- Healy, R.W.; Cook, P.G. Using groundwater levels to estimate recharge. Hydrogeol. J. 2002, 10, 91–109. [Google Scholar] [CrossRef]
- Krogulec, E. Vulnerability Assessment of Groundwater Pollution in the River Valley on the Basis of Hydrodynamic Evidence; Warsaw University Print: Warsaw, Poland, 2004. (In Polish) [Google Scholar]
- Weather Online. Available online: https://www.weatheronline.pl/ (accessed on 10 January 2020).
- Environment Statistical Analyses, Statistics Poland. 2019. Available online: https://stat.gov.pl/obszary-tematyczne/srodowisko-energia/srodowisko/ochrona-srodowiska-2019,1,20.html (accessed on 5 May 2020). (In Polish)
- Macioszczyk, T.; Rodzoch, A.; Frączek, E. Projektowanie stref ochronnych źródeł i ujęćwód podziemnych. (Designing Buffer Zones of Sources and Intakes of Ground Waters); Ministerstwo Ochrony Środowiska, Zasobów Naturalnych i Leśnictwa, Departament Geologii: Warsaw, Poland, 1993. (In Polish) [Google Scholar]
- Nowicki, Z. (Ed.) Groundwater of Voivodship Cities in Poland; PGI: Warsaw, Poland, 2007; ISBN 978-83-7538-152-8. (In Polish) [Google Scholar]
- City of Warsaw. Available online: https://warszawa19115.pl/-/ujecia-wody-oligocenskiej (accessed on 5 March 2020).
- Vazquez-Sune, E.; Carrera, J.; Tubau, I.; Sanchez-Vila, X.; Soler, A. An approach to identify urban groundwater recharge. Hydrol. Earth Syst. Sci. 2010, 14, 2085–2097. [Google Scholar] [CrossRef] [Green Version]
- Crosbie, R.S.; Binning, P.; Kalma, J.D. A time series approach to inferring groundwater recharge using the water table fluctuation method. Water Resour. Res. 2005, 41. [Google Scholar] [CrossRef]
- Gehman, C.l.; Harry, D.L.; Sanford, W.E.; Stednick, J.D.; Beckman, N.A. Estimating specific yield and storage change in an unconfined aquifer using temporal gravity surveys. Water Resour. Res. 2009, 45, W00D21. [Google Scholar] [CrossRef]
- Walker, D.; Parkin, G.; Schmitter, P.; Gowing, J.; Tilahun, S.A.; Haile, A.T.; Yimam, A.Y. Insights from a Multi-Method Recharge Estimation Comparison Study. Groundwater 2019, 57, 245–258. [Google Scholar] [CrossRef] [Green Version]
- Crosbie, R.S.; Scanlon, B.R.; Mpelasoka, F.S.; Reedy, R.C.; Gates, J.B.; Zhang, L. Potential climate change effects on groundwater recharge in the High Plains Aquifer, USA. Water Resour. Res. 2013, 49, 3936–3951. [Google Scholar] [CrossRef] [Green Version]
- Meixner, T.; Manning, A.H.; Stonestrom, D.A.; Allen, D.M.; Ajami, H.; Blasch, K.W.; Brookfield, A.E. Implications of projected climate change for groundwater recharge in the western United States. J. Hydrol. 2016, 534, 124–138. [Google Scholar] [CrossRef] [Green Version]
- Acharya, S.; Jawitz, J.W.; Mylavarap, R.S. Analytical expressions for drainable and fillable porosity of phreatic aquifers under vertical fluxes from evapotranspiration and recharge. Water Resour. Res. 2012, 48, W11526. [Google Scholar] [CrossRef]
- Cao, G.; Scanlon, B.R.; Han, D. Impacts of thickening unsaturated zone on groundwater recharge in the North China Plain. J. Hydrol. 2016, 537, 260–270. [Google Scholar] [CrossRef]
- Huang, H.; Huang, T.; Pang, Z.; Liu, J.; Yin, J.L.; Edmunds, W.M. Groundwater recharge in an arid grassland as indicated by soil chloride profile and multiple tracers. Hydrogeol. Process. 2017, 31, 1047–1057. [Google Scholar] [CrossRef]
- Scanlon, B.R.; Reedy, R.C.; Gates, J.B. Effects of irrigated agroecosystems: 1. Quantity of soil water and groundwater in the southern High Plains, Texas. Water Resour. Res. 2010, 46. [Google Scholar] [CrossRef] [Green Version]
- Zhang, G.H.; Fei, Y.H.; Yang, L.Z. Influence of unsaturated zone thickness on precipitation infiltration for recharge of groundwater. J. Hydraul. Eng. 2007. Available online: http://en.cnki.com.cn/Article_en/CJFDTotal-SLXB200705015.htm (accessed on 5 May 2020).
- Attard, G.; Winiarski, T.; Rossier, Y.; Eisenlohr, L. Review: Impact of underground structures on the flow of urban groundwater. Hydrogeol. J. 2015, 24, 5–19. [Google Scholar] [CrossRef]
- Opęchowski, K.; Krogulec, E. Impact of deep foundations on the groundwater flow structure in the hydrogeodynamically vulnerable area. Geol. Rev. 2019, 67, 478–486. (In Polish) [Google Scholar] [CrossRef]
- Karta Informacyjna JCWPd 65. Available online: https://www.pgi.gov.pl/dokumenty-pig-pib-all/psh/zadania-psh/jcwpd/jcwpd-60-79/4425-karta-informacyjna-jcwpd-nr-65/file.html (accessed on 5 May 2020). (In Polish)
Figure 1.
Location of the study area.

Figure 2.
Geological profile and location of the groundwater tables in aquifers.

Figure 3.
Factors and methods controlling groundwater infiltration and recharge in an urban area ([27], modified).
Figure 3.
Factors and methods controlling groundwater infiltration and recharge in an urban area ([27], modified).

Figure 4.
Monthly average groundwater levels of Quaternary aquifers.

Figure 5.
Monthly average potentiometric surface of the Quaternary aquifer in well no. II-22-1 [20].
Figure 5.
Monthly average potentiometric surface of the Quaternary aquifer in well no. II-22-1 [20].

Figure 6.
Monthly average potentiometric surface of Oligocene aquifer.

Figure 7.
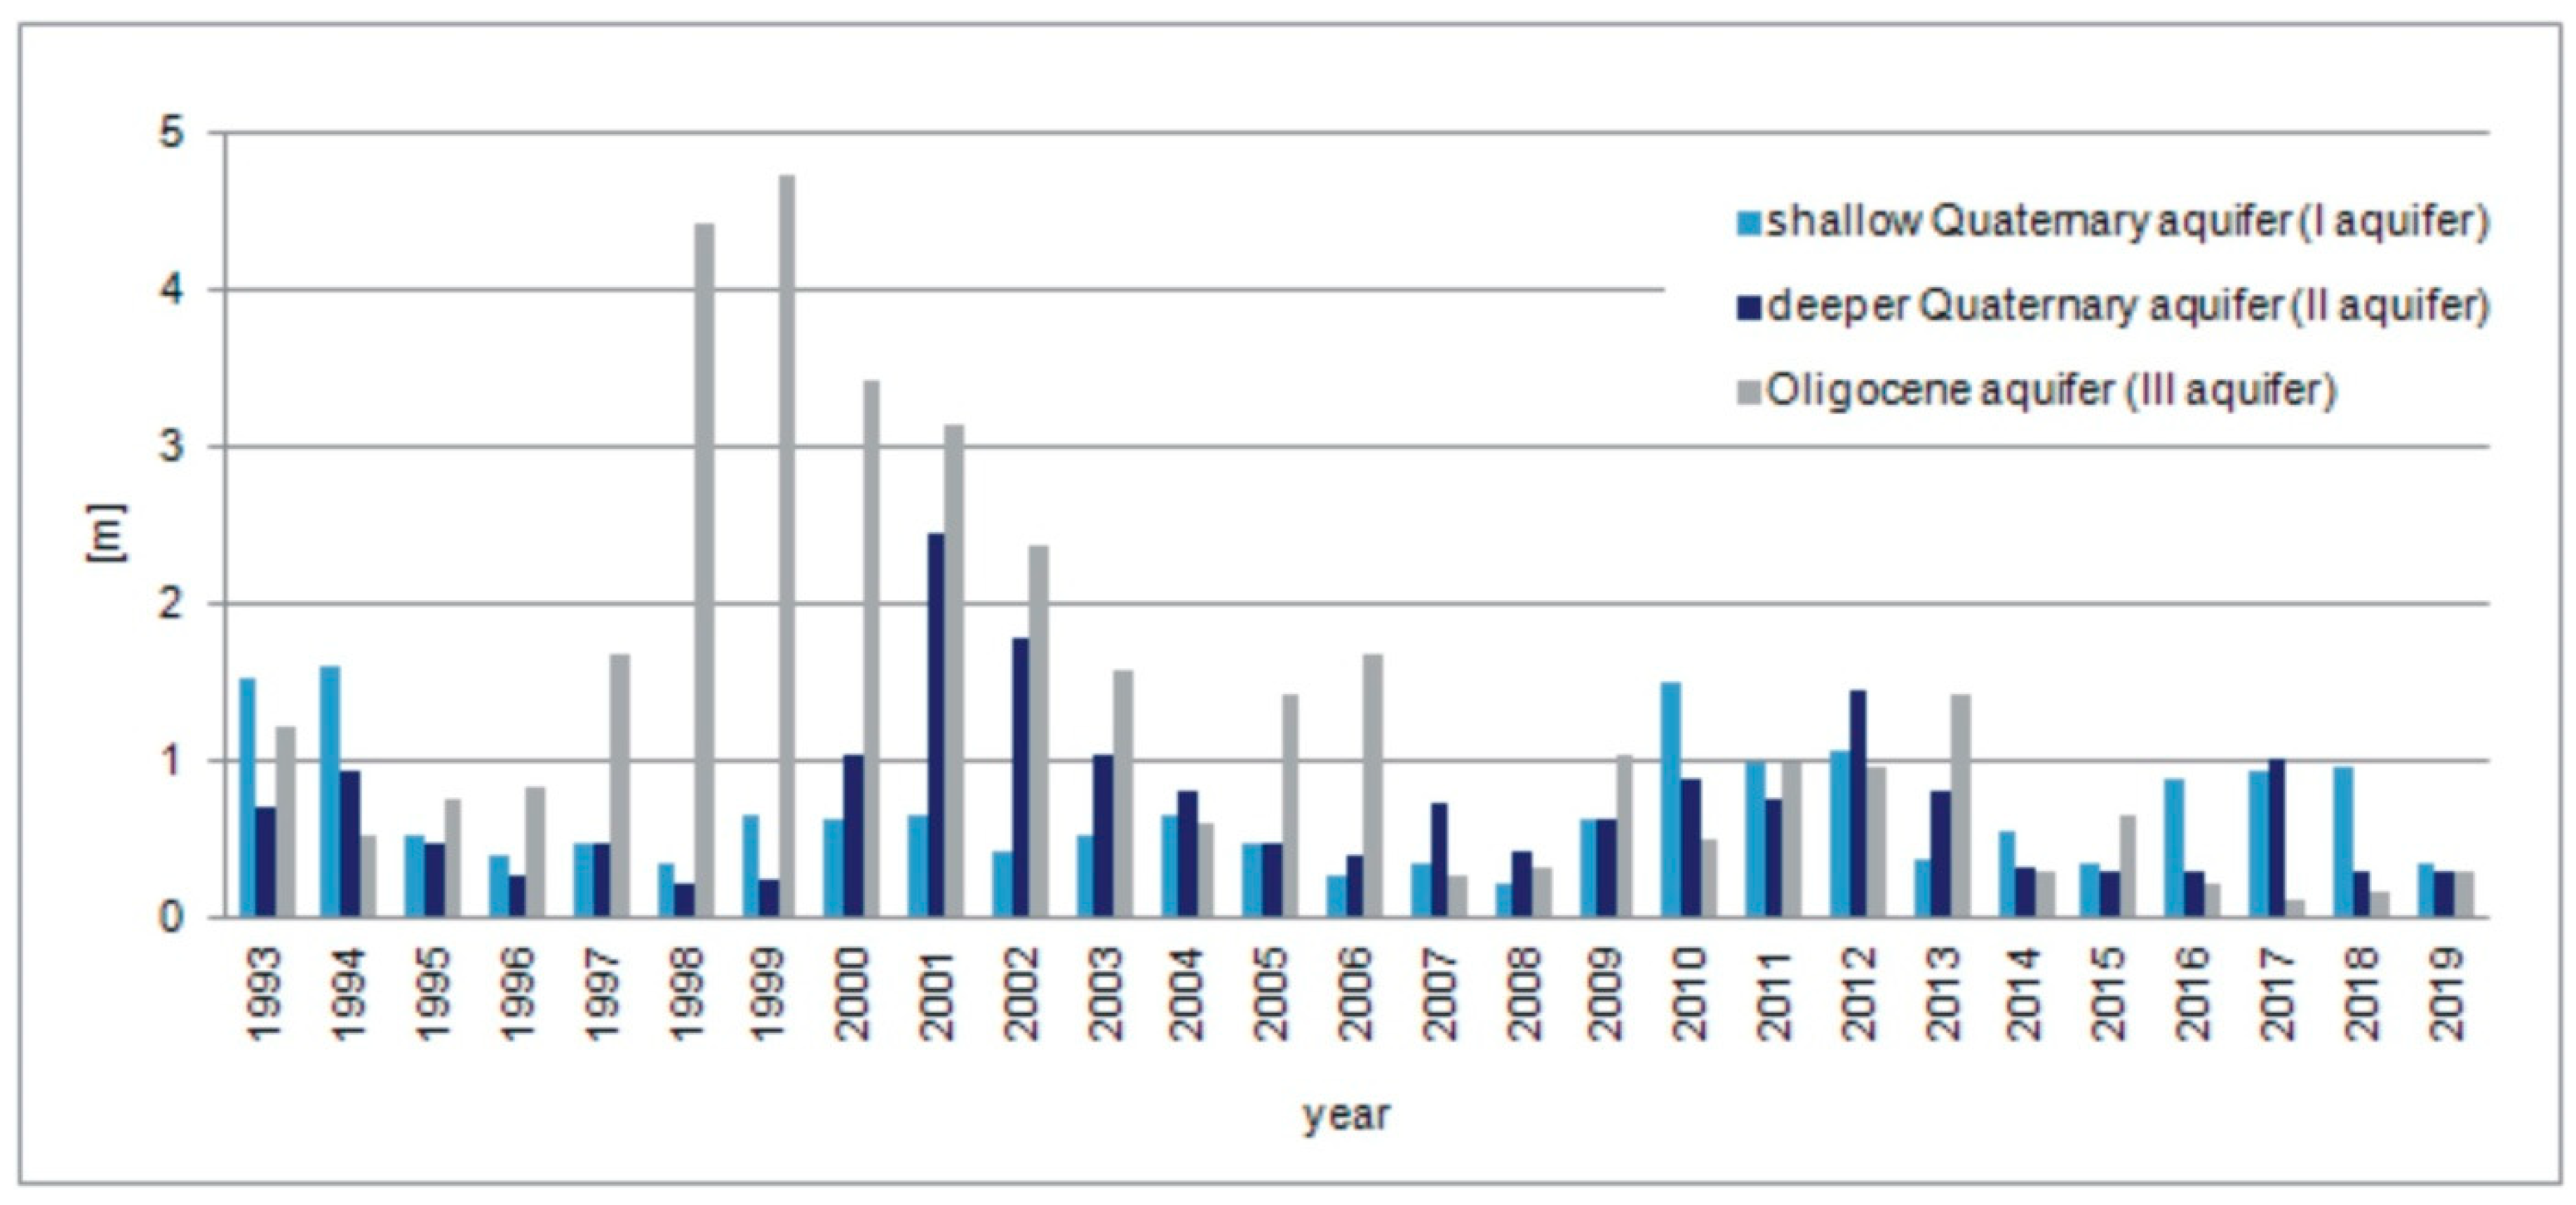
Annual amplitudes of the water table in Quaternary and Oligocene aquifers.

Figure 8.
Water table in the shallow Quaternary aquifer in the selected research periods.

Figure 9.
Electrical resistivity tomography profile in the research station area (January 2020).


Table 1.
Basic statistical parameters of the analyzed aquifers.
| Depth to Water Table * | Shallow Quaternary Aquifer—First Aquifer n = 9861 | Deeper Quaternary Aquifer—Second Aquifer n = 9861 | Oligocene Aquifer—Third Aquifer n = 9861 | |
|---|---|---|---|---|
| Parameters | ||||
| Average (m) | 5.91 | 8.21 | 25.44 | |
| Median (m) | 5.99 | 8.11 | 24.48 | |
| Maximum (m) | 7.76 | 10.13 | 32.28 | |
| Minimum (m) | 3.62 | 6.40 | 21.75 | |
| Amplitude (m) (difference between the absolute highest and the absolute lowest registered water level) | 4.14 | 3.73 | 10.53 | |
| Amplitude (m) (difference between the highest and lowest multiannual mean water level) | 1.38 | 2.22 | 4.62 | |
| 1 quartile | 5.56 (n = 2444) | 7.78 (n = 2444) | 22.51 (n = 2201) | |
| 3 quartile | 6.28 (n = 2472) | 8.70 (n = 2455) | 27.46 (n = 2451) | |
| Standard deviation (m) | 0.71 | 0.64 | 3.22 | |
| Skewness (-) | −0.27 | 0.05 | 0.73 | |
| Coefficient of variation (%) | 11.98 | 7.85 | 12.65 | |
* based on daily measurements.
Table 2.
Characteristic groundwater levels.
| Characteristic Levels | Shallow Quaternary Aquifer—First Aquifer | Deeper Quaternary Aquifer—Second Aquifer | Oligocene Aquifer—Third Aquifer |
|---|---|---|---|
| Average groundwater depth in 1993–2019 (m) (daily data) | 5.91 | 8.21 | 25.44 |
| WNG—highest low groundwater depth (m b.g.s.) (annual data) | 4.99 | 7.13 | 22.06 |
| SNG—average low groundwater depth (m b.g.s.) (annual data) | 6.28 | 8.66 | 26.44 |
| NNG—lowermost low groundwater depth (m b.g.s.) (annual data) | 7.76 | 10.13 | 32.28 |
| Amplitude WNG-NNG (m) | 2.77 | 3.00 | 10.53 |
| Amplitude (m) (multiannual mean) | 4.14 | 3.73 | 10.53 |
| Amplitude (m) (annual mean) | 0.69 | 0.73 | 1.38 |
| Ratio of annual mean to multiannual mean | 0.17 | 0.20 | 0.13 |
Table 3.
Sen’s slope trend water table position.
| Sen’s Slope Trend | Shallow Quaternary Aquifer—First Aquifer | Deeper Quaternary Aquifer—Second Aquifer | Oligocene Aquifer—Third Aquifer | Deeper Quaternary Aquifer—Well No. II-22-1 |
|---|---|---|---|---|
| Slope | −0.00433 | 0.00218 | 0.03045 | 0.00408 |
| Lower | −0.00458 | 0.00192 | 0.02983 | 0.00384 |
| Upper | −0.00411 | 0.00247 | 0.03102 | 0.00431 |
Table 4.
Assessment of recharge of the shallow Quaternary aquifer using the WTF method.
| Interval | Period | Depth to Water Table (m) | Infiltration Time (Days) | Infiltration during Water Table Rise (R) (mm) | Annual Recharge (mm) | Recharge Coefficient (%) (R/P) | |||
|---|---|---|---|---|---|---|---|---|---|
| min | max | min | max | min | max | ||||
| I | 1993–1994 | 3.62 | 6.51 | 133 | 254 | 155 | 160 | ~160 | 28 |
| II | 1995–2009 | 5.29 | 6.48 | 71 | 194 | 30 | 56 | ~80 | 14 |
| III | 2010–2011 | 4.88 | 6.08 | 61 | 286 | 84 | 120 | ~130 | 23 |
| IV | 2012–2019 | 6.39 | 5.86 | 5 | 20 | 5 | 17 | ~60 | 11 |
Publisher’s Note: MDPI stays neutral with regard to jurisdictional claims in published maps and institutional affiliations. |
© 2020 by the authors. Licensee MDPI, Basel, Switzerland. This article is an open access article distributed under the terms and conditions of the Creative Commons Attribution (CC BY) license (http://creativecommons.org/licenses/by/4.0/).
Share and Cite
MDPI and ACS Style
Krogulec, E.; Małecki, J.J.; Porowska, D.; Wojdalska, A. Assessment of Causes and Effects of Groundwater Level Change in an Urban Area (Warsaw, Poland). Water 2020, 12, 3107. https://doi.org/10.3390/w12113107
AMA Style
Krogulec E, Małecki JJ, Porowska D, Wojdalska A. Assessment of Causes and Effects of Groundwater Level Change in an Urban Area (Warsaw, Poland). Water. 2020; 12(11):3107. https://doi.org/10.3390/w12113107
Chicago/Turabian StyleKrogulec, Ewa, Jerzy J. Małecki, Dorota Porowska, and Anna Wojdalska. 2020. "Assessment of Causes and Effects of Groundwater Level Change in an Urban Area (Warsaw, Poland)" Water 12, no. 11: 3107. https://doi.org/10.3390/w12113107
Note that from the first issue of 2016, this journal uses article numbers instead of page numbers. See further details here.