Spatial Distribution of Integrated Nitrate Reduction across the Unsaturated Zone and the Groundwater Body in Germany


1
Institute for Landscape Ecology and Resources Management (ILR), Research Centre for BioSystems, Land Use and Nutrition (iFZ), Justus Liebig University Giessen, Heinrich-Buff-Ring 26, 35392 Giessen, Germany
2
Centre for International Development and Environmental Research (ZEU), Justus Liebig University Giessen, Senckenbergstraße 3, 35390 Giessen, Germany
*
Author to whom correspondence should be addressed.
Water 2020, 12(9), 2456; https://doi.org/10.3390/w12092456
Submission received: 2 July 2020
/
Revised: 1 August 2020
/
Accepted: 10 August 2020
/
Published: 1 September 2020
(This article belongs to the Section Water Resources Management, Policy and Governance)
Abstract
:Nitrate pollution in groundwater and its mitigation strategies is currently a topic of controversial debate in Germany, and the demand for harmonised approaches for the implementation of regulations is increasing. Important factors that need to be considered when planning mitigation measures are the nitrogen inputs into water bodies and the natural nitrate reduction capacity. The present study introduces a nationwide, harmonised and simplified approach for estimating nitrate reduction as an integral quantity across the unsaturated zone and the groundwater body. The nitrate reduction rates vary from 0% to 100%, and are on average 57%, with high values in the north of Germany and low values in the south. Hydrogeological characteristics are associated with the estimated nitrate reduction rates, whereby the influence of aquifer type and redox conditions are particularly relevant. The nitrate reduction rates are substantially higher in porous aquifers and under anaerobic conditions than in fractured, consolidated aquifers and under aerobic conditions. This contribution presents a harmonised conceptual approach to derive the nitrate reduction rate at a 1 km × 1 km resolution. This information can be used when planning and designing mitigation measures to meet the groundwater nitrate limits.
1. Introduction
Human interference in the natural nitrogen (N) cycle has serious environmental consequences. Reactive nitrogen is a macronutrient essential for plant growth, but it also has a negative impact on human health, is involved in global warming and negatively affects terrestrial and aquatic ecosystems [1]. Therefore, there is an urgent need for sustainable, integrated nitrogen management at all levels, from the field site up to the global scale [2,3]. The pollution of water systems is seen as a major challenge by the European Commission. A total of 25% of the groundwater bodies in the EU have a poor chemical status, with 18% mainly affected by nitrate pollution [4]. The EU Water Framework Directive 2000/60/EC (WFD) was implemented with the aim of maintaining or restoring the “good status” of water bodies. Key to achieving this goal are effective strategies to reduce N inputs into groundwater and surface water. According to Fuchs et al. [5], 80% of the N load in surface waters in Germany originates from anthropogenic sources, with agriculture as the largest factor. The agricultural sector accounts for nearly 90% of the nitrate leaching into water systems [6]. Since the inputs largely result from diffuse N surpluses, initial measures are needed to reduce or optimise fertiliser management.
The pollution of groundwater bodies with nitrate depends considerably on the properties of the subsurface. These properties have to be taken into account in order to be able to decide where and to what extent mitigation measures are required to achieve a good water status. Seitzinger et al. [7] states that about 46% of nitrogen newly fixed by technical ammonia synthesis is removed by biogeochemical turnover processes in terrestrial soils on a global scale. This corresponds to a similar removal rate of 40% estimated for Europe [8]. In a study for the German federal state of North Rhine-Westphalia, an average denitrification rate of around 45% for the mobile N surplus in soils is deduced by Wendland et al. [9] and Kuhr et al. [10] have determined a range for N load reduction from 20% up to 80%. Moreover, groundwater bodies can have a substantial capacity for nitrate reduction, but this can vary widely in space and between 0% to 100% of the N loads can be removed in aquifers [7,11]. For Denmark, mean reduction rates in the groundwater of 63% were stated [12]. For the federal states of Mecklenburg-Vorpommern and a catchment in the north of Saxony-Anhalt (both in Germany), it was reported that 80% of the N input load was removed in the aquifers [13,14]. A mean reduction rate of the N loads of 46% and maximum values above 80% in some marsh regions were modelled for the large river Weser catchment in Germany [15]. Nitrate reduction rates in the groundwater from 65–83% were measured for different arable land systems in eastern China [16]. Højberg [12] reviewed studies on different scales (local to national) dealing with groundwater nitrate reduction in the Baltic Sea basin, concluding that the spatial variation can be significant in most countries. The studies showed that information of the heterogeneous distribution of nitrate reduction in soils and aquifers based on harmonised approaches with a high spatial resolution is needed to substantially improve the estimation of the fate of N loads in groundwater bodies on national scales.
Nitrate reduction in groundwater is primarily governed by denitrification processes. Knowles [17] describes denitrification as a microbial reduction process of N oxides to molecular nitrogen as the end product (NO3− → NO2− → NO → N2O → N2). Denitrification depends on the prevailing biogeochemical aquifer conditions and only occurs under anaerobic conditions when electron donors are available [7,18]. Further, the groundwater residence time influences the denitrification [7]. In general, a distinction is made between heterotrophic and autotrophic denitrification, depending on the type of denitrifying bacteria [18,19]. In heterotrophic denitrification, the bacteria use organic carbon as an electron donor, whereas in autotrophic denitrification they obtain the electrons from the oxidation of inorganic species, e.g., iron sulphide (pyrite, FeS2) [18,20]. Both processes have been identified in several studies on nitrate degradation in groundwater [21,22,23,24]. Other studies have found that the nitrate concentration in groundwater strongly depends on the hydrogeological conditions and the prevailing redox conditions [25,26].
Due to the complexity of the environmental conditions that favour degradation processes and the difficulty of measuring these in the field, models are useful tools to estimate the magnitude of nitrate reduction at different scales [27]. Various studies have modelled and analysed denitrification on the catchment scale [15,28,29,30,31,32]. Wriedt and Rode [14] successfully simulated nitrate transport and turnover processes in a small lowland catchment using a process-based model that considers detailed geochemical reactions to describe the denitrification. In studies on larger scales, e.g., on a regional or national level, a simplified representation of the nitrate reduction processes is needed due to limited data availability and the spatial resolution. Wendland et al. [9] and Kunkel et al. [13] coupled several models (GROWA–DENUZ–WEKU) to assess the denitrification in soils at a federal state level, depending on the soil type and residence time of the percolation water according to the Michaelis–Menten kinetics, as well as the denitrification during groundwater transport assuming the first order. Hirt et al. [15] used the same approach and coupled their model chain with a nutrient emission model (MONERIS) for modelling the nitrogen loads in surface water. In nationwide studies for Germany, simplified exponential functions, depending on the seepage water rate and hydrogeological conditions, were used to describe the reduction in N loads [33,34]. These functions were derived by comparing the nitrate concentration in the seepage water and groundwater for different rock types [34]. The concentration data from 217 groundwater monitoring sites were taken into account and four hydrogeological rock types were distinguished. With regard to the large-scale problem and the heterogeneous landscapes in Germany, an improved approximation of the actual nitrate reduction rates could be achieved by a more comprehensive representation of the distribution of the nitrate concentration in the groundwater and a stronger differentiation of the hydrogeological conditions.
Through the implementation of the EU Nitrates Directive and the EU Water Framework Directive, EU Member States have undertaken to report regularly on the implementation of the guidelines, which requires nationwide harmonised assessment of the water quality status. National assessments of groundwater quality and of nitrate reduction, can contribute to further studies, such as national assessments of the nutrient inputs into surface waters [33]. Due to the limitations of modelling complex nitrate reduction processes on a large scale (national level), this study combines nationwide data sets with a simplified conceptual approach to derive the nitrate reduction rates across the unsaturated zone and the groundwater body. The aims of the present study are (1) to determine the nitrate-nitrogen input loads to the unsaturated zone and in the groundwater; (2) to quantify the reduction rates describing the integrated nitrate reduction across the unsaturated zone and the groundwater body; and (3) to analyse the relationships between the hydrogeological conditions and the resulting reduction rates.
2. Materials and Methods
This study focuses on the regionalisation of Germany, with a spatial resolution of 1 km × 1 km grid size [35], which in total is approximately 360,000 grid cells. All data used in the study were handled in the geographical information system ArcGIS (v. 10.4). All analyses of the present study concerning the possible relationships between the nitrate reduction and the hydrogeological parameters were made using R (v. 3.4.1).
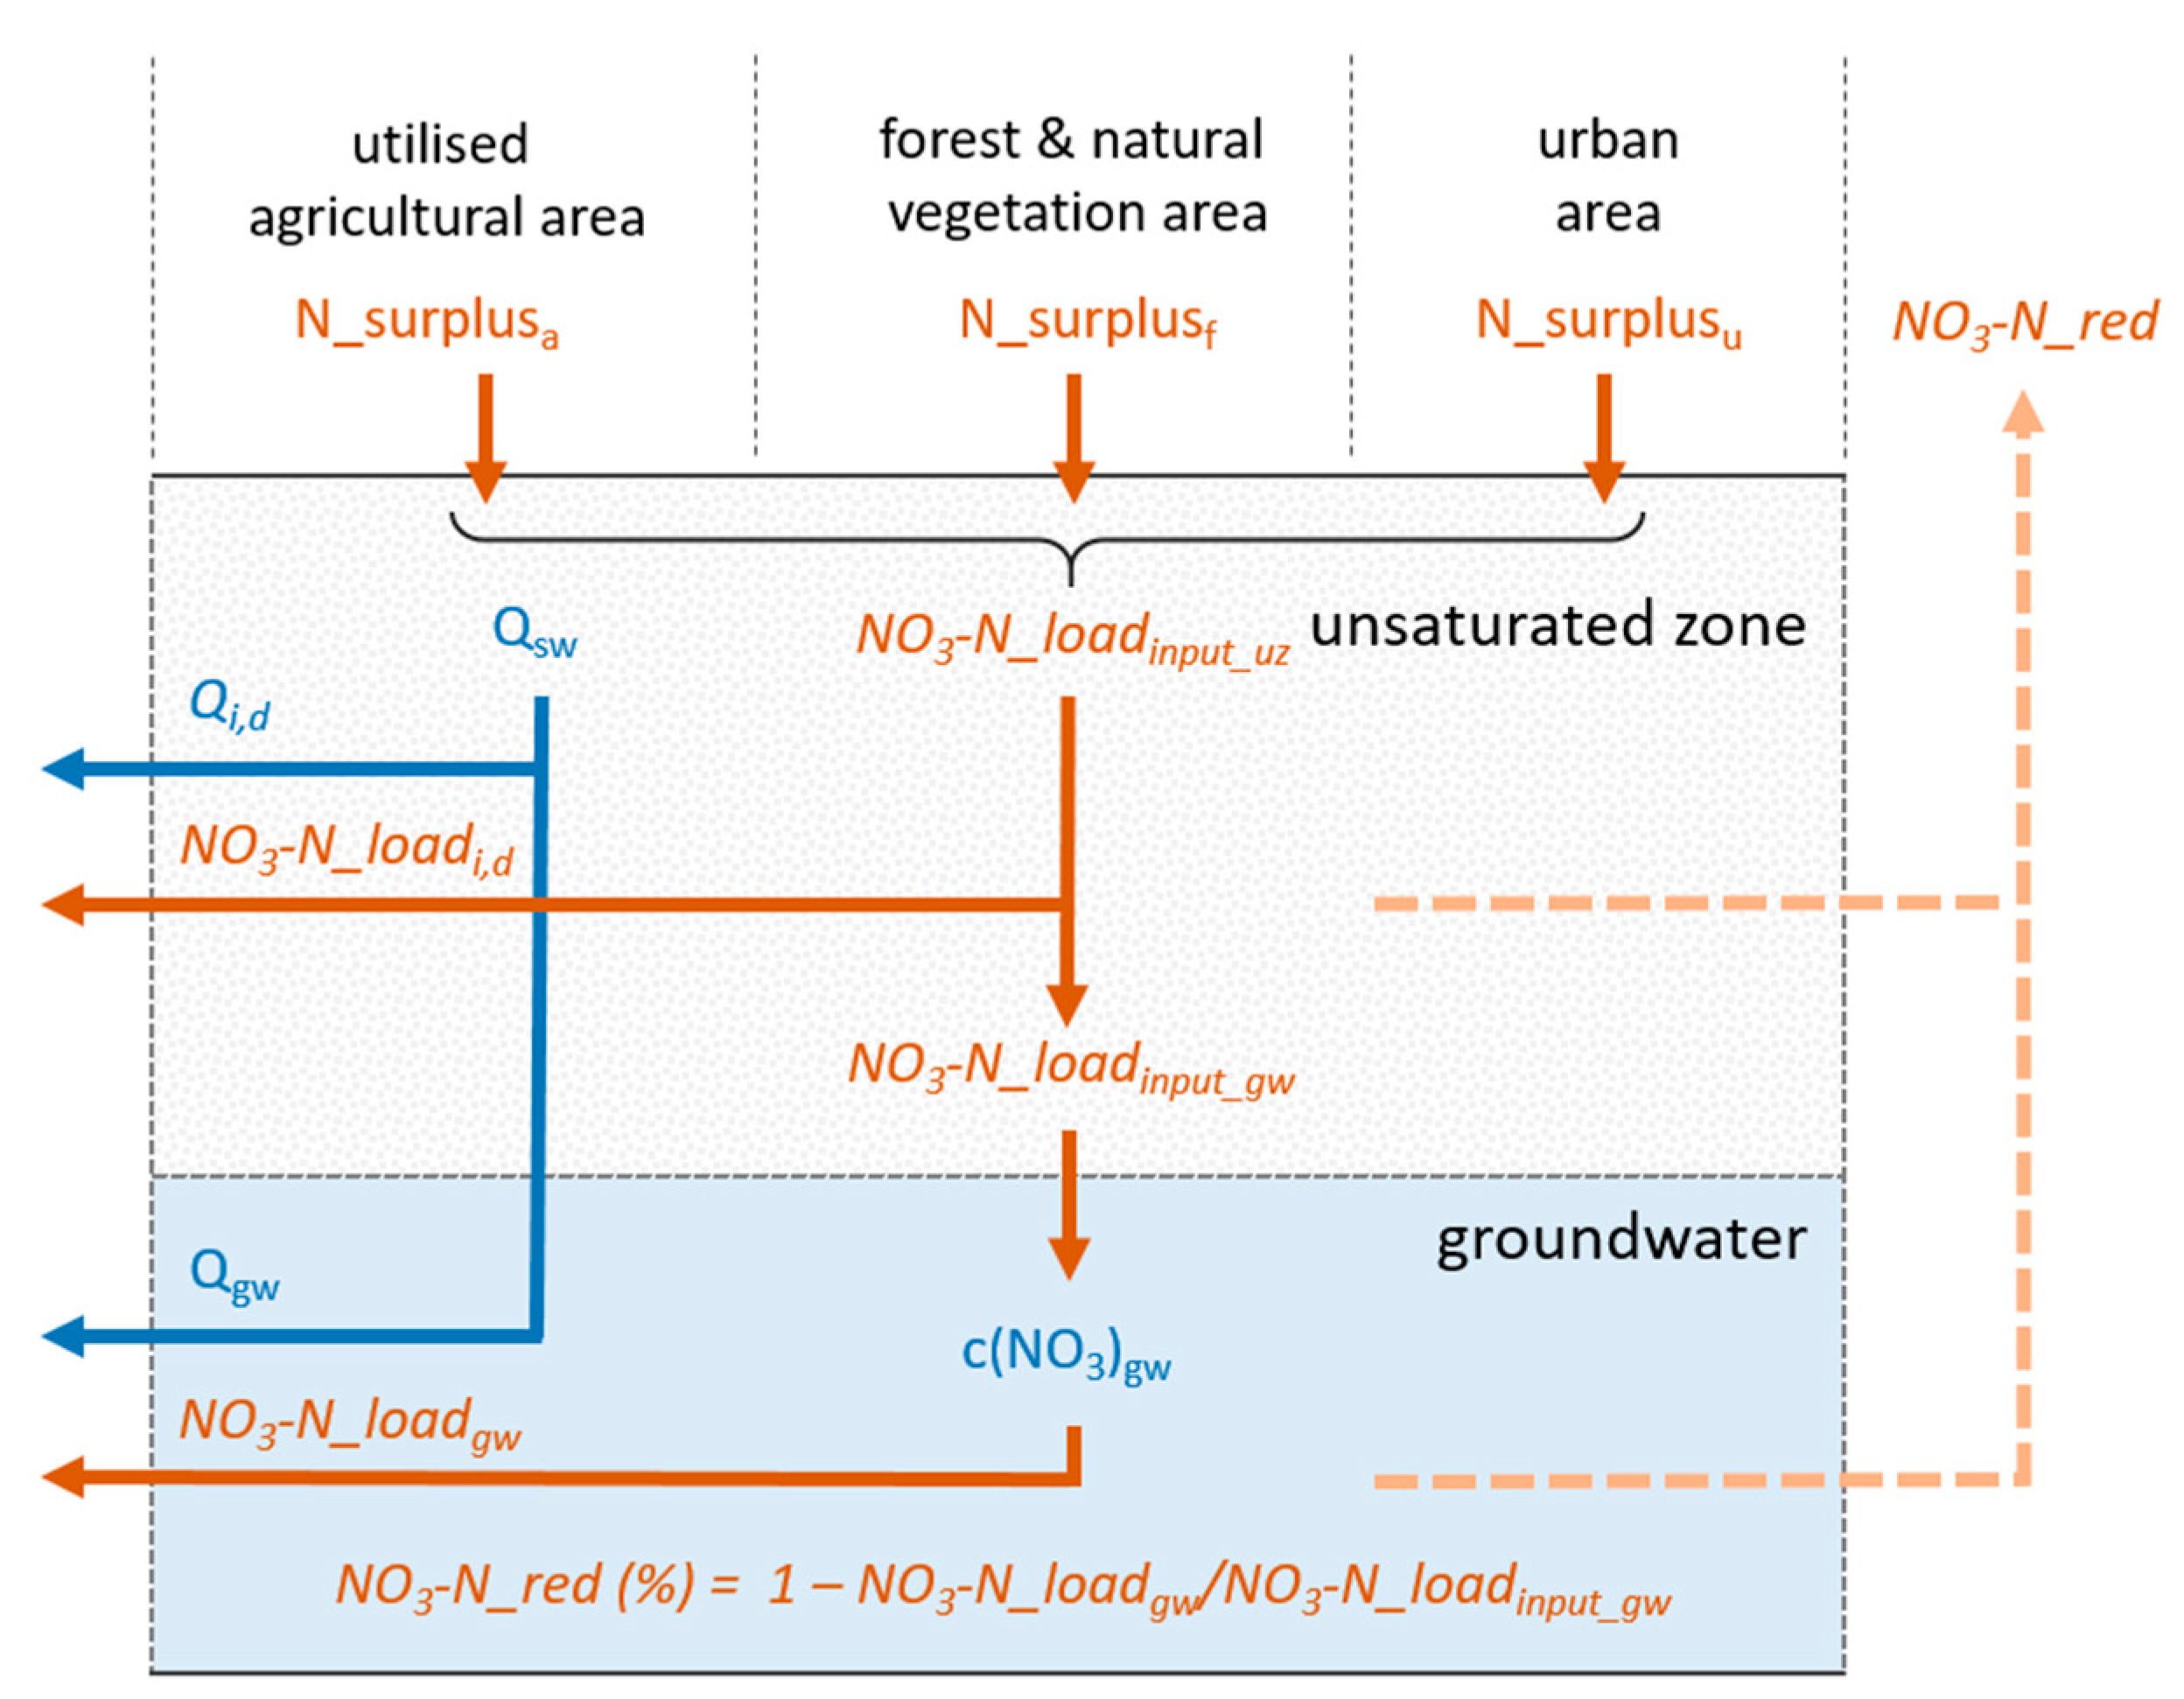
Figure 1 shows the simulated flow paths of the water and nitrogen loads in our model. Nitrogen (N) is supplied to the soil in different reactive forms of N: as mineral nitrogen (nitrate, ammonium) and organic nitrogen. Under the typical soil and climate conditions in Germany, only nitrate-nitrogen (NO3-N) in quantifiable quantities is displaced by the seepage water. The concentrations of ammonium and organic N in the soil solution are usually very low below the root zone. For simplification, it is therefore justified to assume NO3-N for the entire N load in the seepage water (NO3-N load). On the basis of the hydrospheric N surplus of different land uses (agricultural and urban areas as well as forests; N_surplusa,f,u), the potential NO3-N input load into the unsaturated zone (NO3−N_loadinput_uz) is derived from a previous study [36]. This is transported through the unsaturated zone with seepage water (Qsw), depending on the seepage water rate [37]. Due to interflow and tile drains (Qi,d), some of the seepage water and thus also some of the NO3-N load (NO3-N_loadi,d) does not reach the groundwater. The remaining share represents the given groundwater recharge (Qgw) [38] and the estimated NO3-N input load transported across the unsaturated zone to the groundwater by Qgw (NO3-N_loadinput_gw). For the groundwater body, a groundwater nitrate concentration map (c(NO3)gw) is taken from a previous study [26]. Given the groundwater recharge Qgw, the NO3-N load in the groundwater (NO3-N_loadgw) can be calculated. In order to describe the reduction processes in the unsaturated zone and in the groundwater body, the integrated nitrate reduction, the NO3-N load reduction rate (NO3-N_red), is defined as the ratio of NO3-N_loadgw to NO3-N_loadinput_uz. The parameters and calculations are further described in the following sections.
2.1. Nitrogen Input Load
The hydrospheric N surplus is defined as the N surface budget surplus reduced by the gaseous N losses during and after application of organic and mineral fertilizer. The hydrospheric N surplus describes the amount of nitrogen potentially translocated to the hydrosphere; it is used as a key indicator characterising possible water pollution with nitrate from agricultural systems. The annual N budgets and the hydrospheric N surplus for the utilised agricultural area (UAA) were calculated on the basis of administrative units (district regions) [36]. The average hydrospheric N surplus in Germany in the period 2007–2016 was calculated as 56 kg N ha−1 a−1 UAA, ranging from 13 to 146 kg N ha−1 a−1 UAA for the districts. As these values refer only to the inputs from agricultural land (arable land, grassland and special crops), constant values for the N surplus have been assumed for the remaining areas. Forest and natural areas have been assigned with 5 kg N ha−1 a−1, and urban land with 18 kg N ha−1 a−1; for special crops on agricultural land, the N surplus was multiplied by the factor 1.5. The spatial distribution of the five land-use types was given by the land cover model [39] and their area proportions were assigned to the grid cells. An area-weighted and land-use-specific hydrospheric N surplus was calculated according to Knoll et al. [26] and is considered to be equivalent to the NO3-N input load into the unsaturated zone (NO3−N_loadinput_uz):
NO3-N_loadinput_uz = Nsurplusa wa + Nsurplusu wu + Nsurplusf wf + Nsurpluss ws
- NO3-N_loadinput_uz = NO3-N input load into the unsaturated zone (kg N ha−1 a−1)
- Nsurplusa = hydrospheric N-urplus arable land (kg N ha−1 a−1) [36]
- Nsurplusu = N-surplus urban land = 18 (kg N ha−1 a−1)
- Nsurplusf = N-surplus forest = 5 (kg N ha−1 a−1)
- Nsurpluss = N-surplus special crops = Nsurplusa × 1.5 (kg N ha−1 a−1)
- wa,u,f,s = area weighting factor (-) with ∑wi = 1.
Much of the NO3-N load is transported with seepage water via interflow or drains (Qi,d) into surface waters (NO3-N_loadi,d), so that only the remaining load is transported across the unsaturated zone to the groundwater (NO3-N_loadinput_gw). For example, Kunkel et al. [13] reported that for the federal state of Mecklenburg-Vorpommern, around 35% of the N load is transported via drainage systems into surface waters without any substantial nitrate reduction. The ratio of groundwater recharge Qgw [38] and the seepage water rate Qsw [37] were used here as a proxy to estimate the interflow proportion and hence the NO3-N input load to the groundwater via the unsaturated zone:
NO3-N_loadinput_gw = (Qgw/Qsw) × NO3-N_loadinput_uz
- NO3-N_loadinput_gw = NO3-N input load to the groundwater (kg N ha−1 a−1)
- NO3-N_loadinput_uz = NO3-N input load into the unsaturated zone (kg N ha−1 a−1)
- Qgw = mean annual groundwater recharge rate (mm a−1) [38]
- Qsw = mean annual seepage water rate (mm a−1) [37]
Due to differences in the ways of estimation of the seepage water [37] and groundwater recharge rates [38], it can happen that lower seepage water rates than groundwater recharge rates occur, particularly in some lowland areas. In this case, the rates are considered equivalent (Qgw/Qsw = 1), since the groundwater recharge rate can only be as high as the seepage water rate.
2.2. Groundwater Nitrate Nitrogen Load
In a study by Knoll et al. [26], a 1 km × 1 km grid map of the groundwater nitrate concentrations in Germany was estimated using a data-driven approach based on the measured concentrations from the period 2009 to 2018. Applying the “random forest” machine learning technique, the groundwater nitrate concentration map was modelled using several spatial predictors, such as the land use, hydrogeology and redox conditions throughout Germany. These predictions are applied in this study, since they provide a good assumption for the nationwide estimates of groundwater NO3-N loads. In order to calculate the groundwater loads, the groundwater recharge rate as an approximated value for the groundwater volume flow is used. Taking into account the conversion from nitrate to nitrate-nitrogen per hectare, the groundwater NO3-N load is calculated as follows:
NO3-N_loadgw = (cgw × Qgw)/443
2.3. Nitrate Reduction
Considering the spatial resolution and the size of the study area, a straightforward approach is developed to estimate the integrated nitrate reduction across the unsaturated zone and the groundwater body. Such an approach is appropriate because data for the validation of the reduction processes in the unsaturated zone are very limited. Since both the initial value (NO3-N input load) and the resulting value (groundwater NO3-N load) are available from previous studies [26,36], all possible natural degradation processes are taken into account when determining the nitrate reduction. The integrated nitrate reduction, the reduction of the NO3-N loads, is quantified as the ratio of the groundwater NO3-N load to the NO3-N input load to the groundwater:
NO3-N_red = (1 − (NO3-N_loadgw/NO3-N_loadinput_gw)) × 100
- NO3-N_red = nitrate reduction (%)
- NO3-N_loadgw = groundwater NO3-N load (kg N ha−1 a−1)
- NO3-N_loadinput_gw = NO3-N input load to the groundwater (kg N ha−1 a−1)
2.4. Hydrogeological Conditions
In the hydrogeological shape map of Germany (HUEK200 [40]), the hydrogeology of the upper aquifer is described by the attributes “aquifer type”, “consolidation”, “rock type”, “geochemical rock type” and “conductivity”. These five attributes are linked to the grid cells by the ArcGIS add-in tool “Spatial join–largest overlap”, which assigns the attributes with the dominant area that overlaps with the respective grid cell. As an additional hydrogeological parameter, the redox conditions are used as modelled by Knoll et al. [26], which has four redox classes, namely, “strong anaerobic”, “anaerobic”, “intermediate” and “aerobic”, based on the groundwater oxygen and iron concentrations (specific limits are shown in Table 1).
3. Results
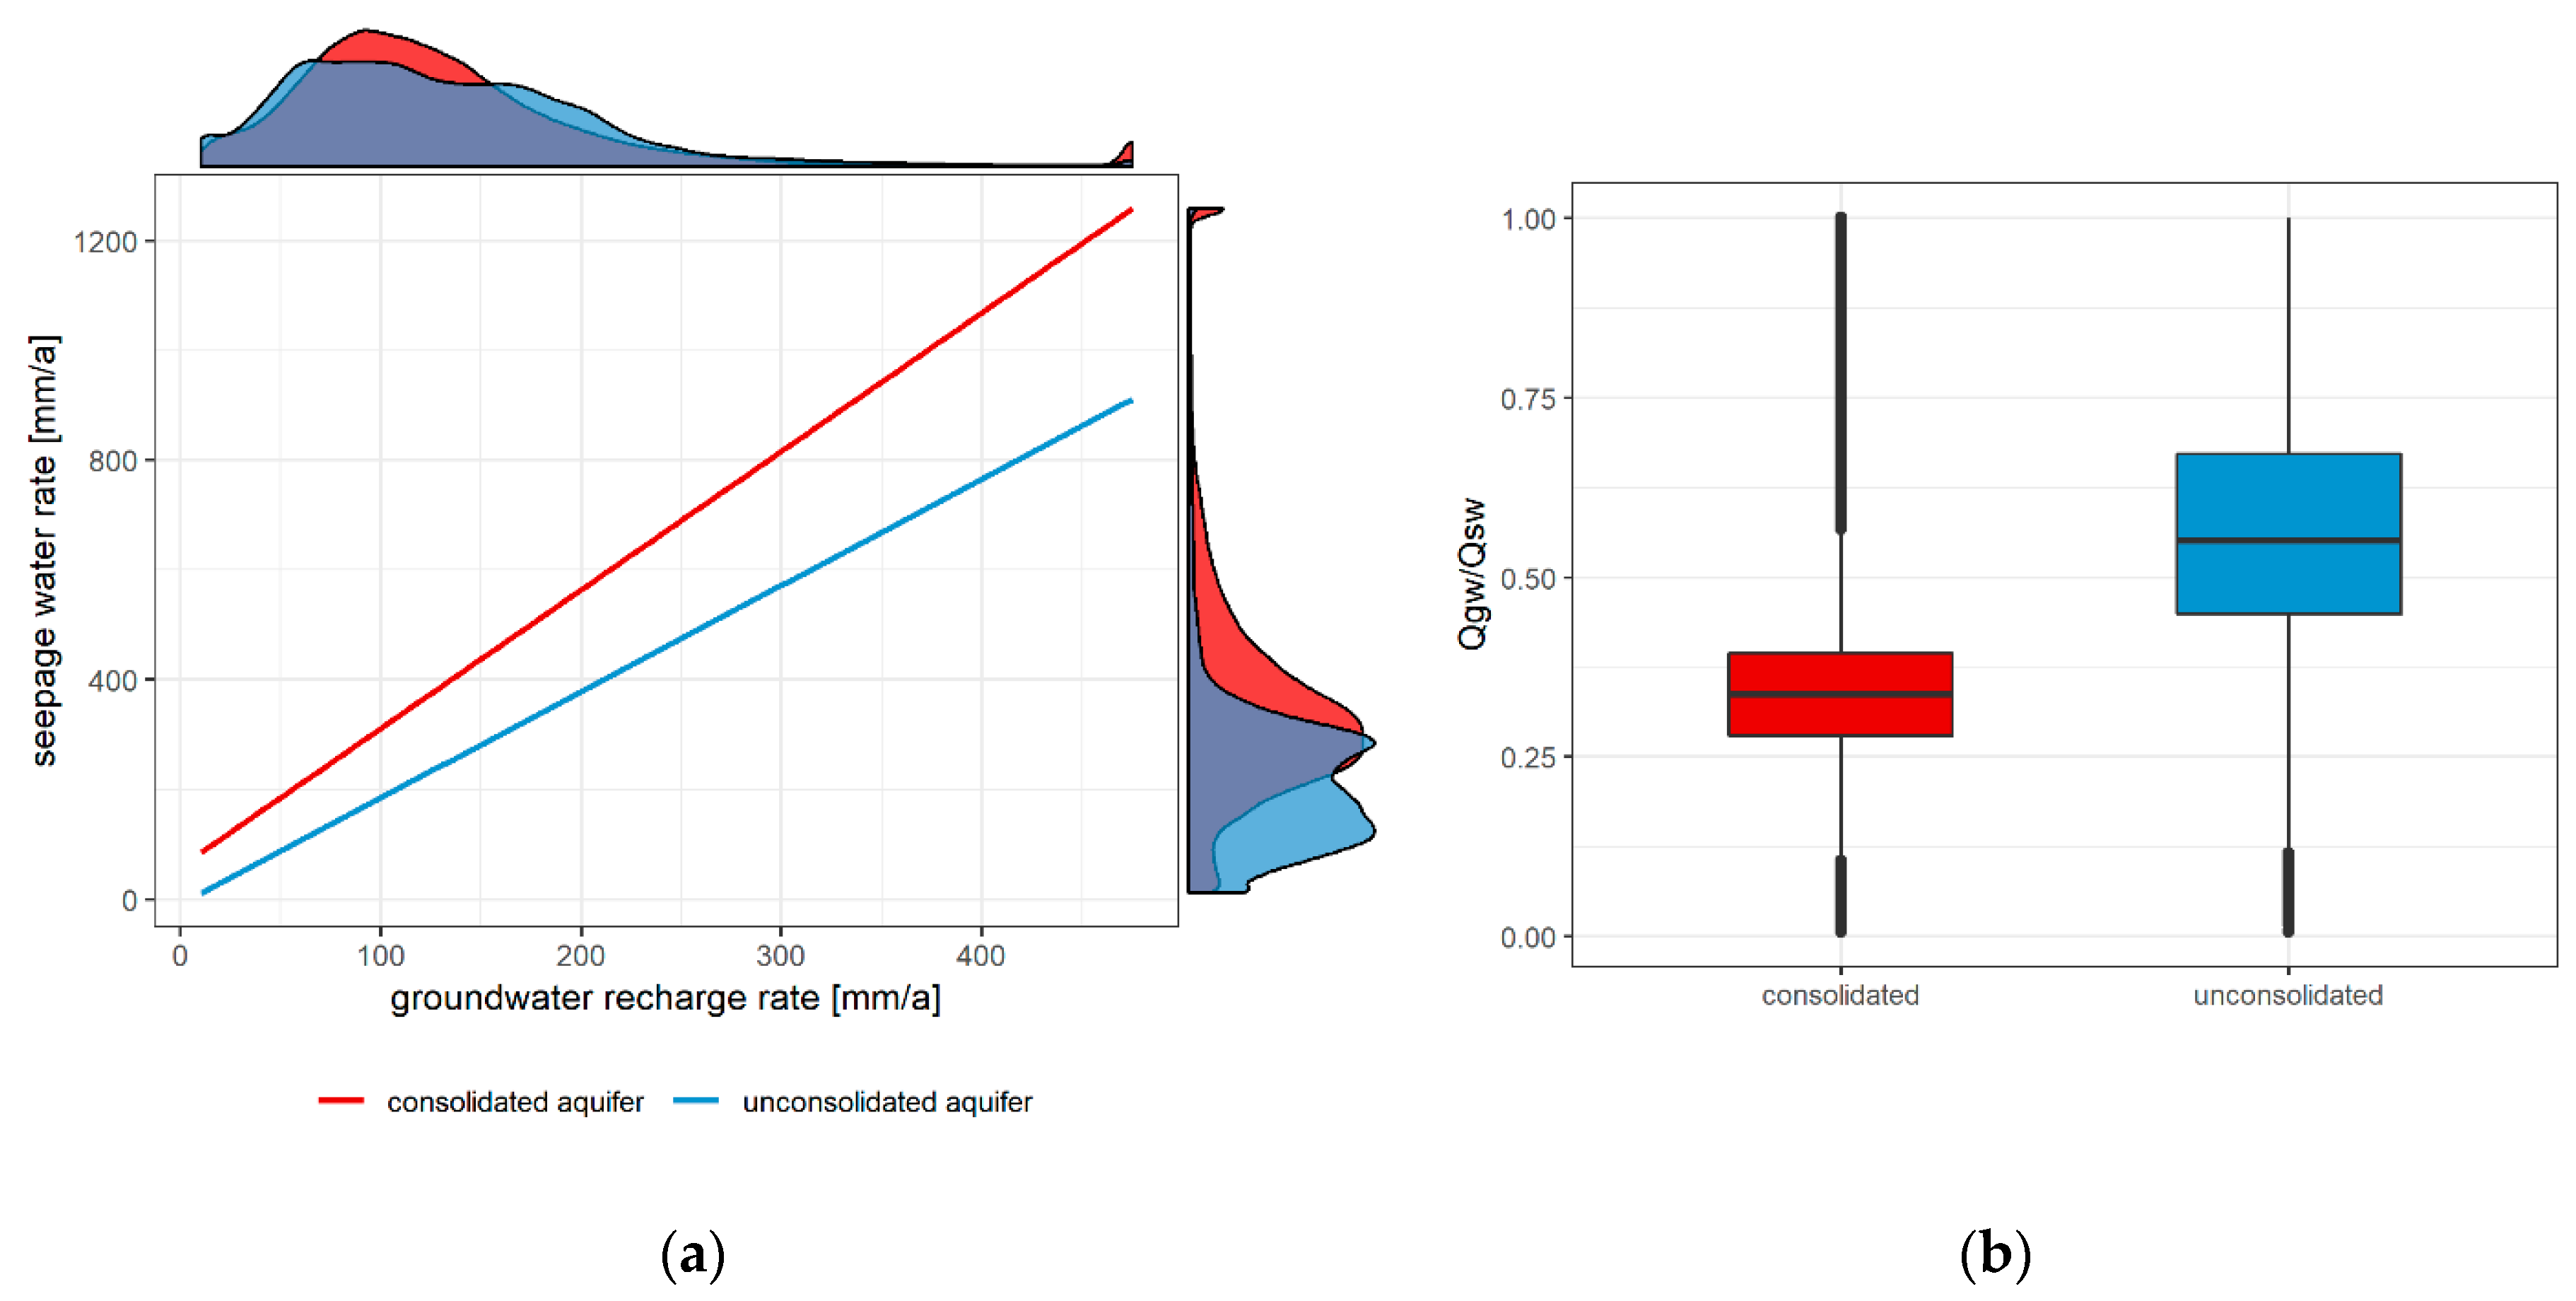
To calculate the NO3-N input loads to the groundwater, the ratio of Qgw to Qsw is estimated (Figure 2). The seepage water rate is generally higher than the groundwater recharge rate and the difference between both is greater in the consolidated aquifers compared to the unconsolidated aquifers. Therefore, the ratio Qgw/Qsw for the consolidated aquifers is also considerably lower than for the unconsolidated aquifers. This can probably be attributed to the morphological aspects of the mountain regions and the associated higher depth to the groundwater table, thus causing a greater susceptibility to interflow. Agriculturally used areas are often tile drained, which also leads to lower Qgw/Qsw values; however, this is generally the case in less mountainous areas and lowlands. The average seepage water rate for Germany is about 287 mm a−1 [37], and the average groundwater recharge rate is 125 mm a−1 [38]. Therefore, considering the assumptions for Equation (2), more than 50% of the seepage water reaches the surface waters via interflow or drainage.
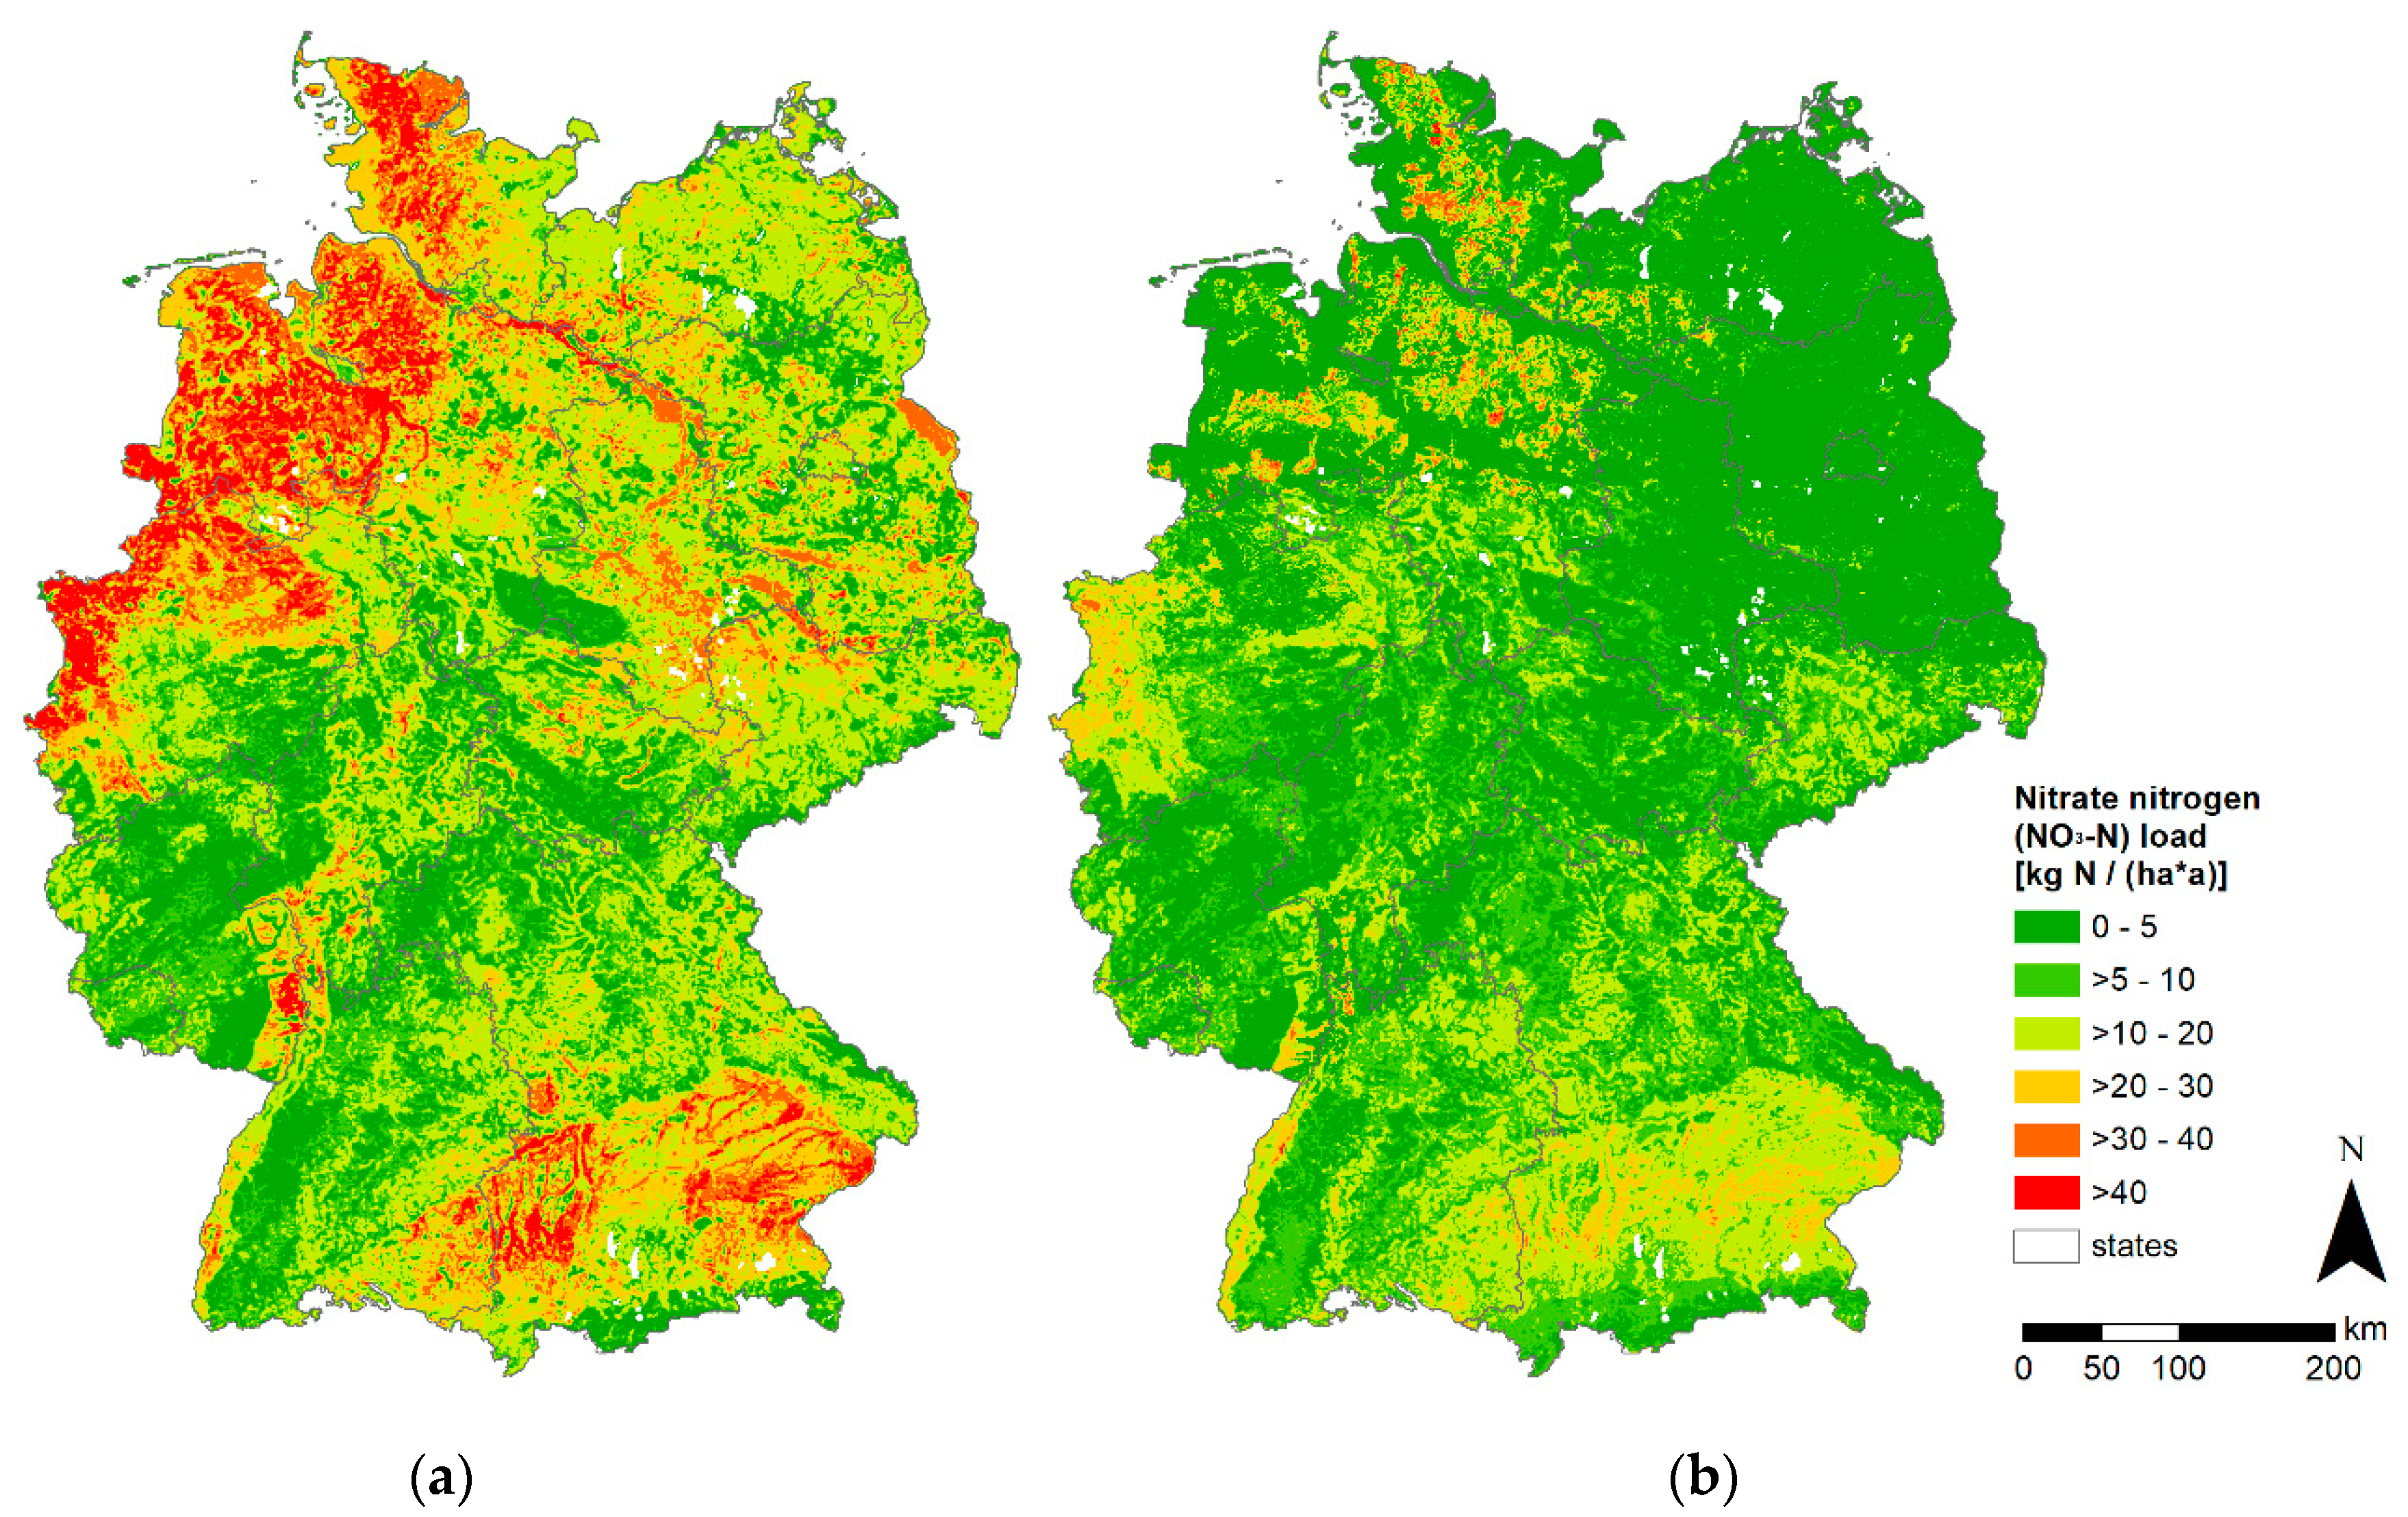
The NO3-N input loads calculated according to Equation (2) are shown in Figure 3a. The mean NO3-N input load into the unsaturated zone (N_loadinput_uz) is around 36 kg N ha−1 a−1. Considering the proportional reduction by interflow and drainage, the mean NO3-N_loadinput_gw is only about 17 kg N ha−1 a−1. Intensively managed agricultural systems are apparent in north, north-west and south-east Germany, as well as in some preferential regions, mainly in the lowlands (Figure 3a). The highest loads in these regions are greater than 40 kg N ha−1 a−1.
In Figure 3b, the NO3-N loads in the groundwater derived according to Equation (3) are shown. It should be noted again that these are the NO3-N loads and not the groundwater nitrate concentrations and therefore cannot be linked to the limit value of 50 mg NO3 L−1. It is already evident that the NO3-N_loadgw (mean 6 kg N ha−1 a−1) is in most cases substantially lower than the NO3-N_loadinput_gw (mean 17 kg N ha−1 a−1). The spatial distribution of the high NO3-N_loadgw is not spatially correlated with a high NO3-N_loadinput_gw.
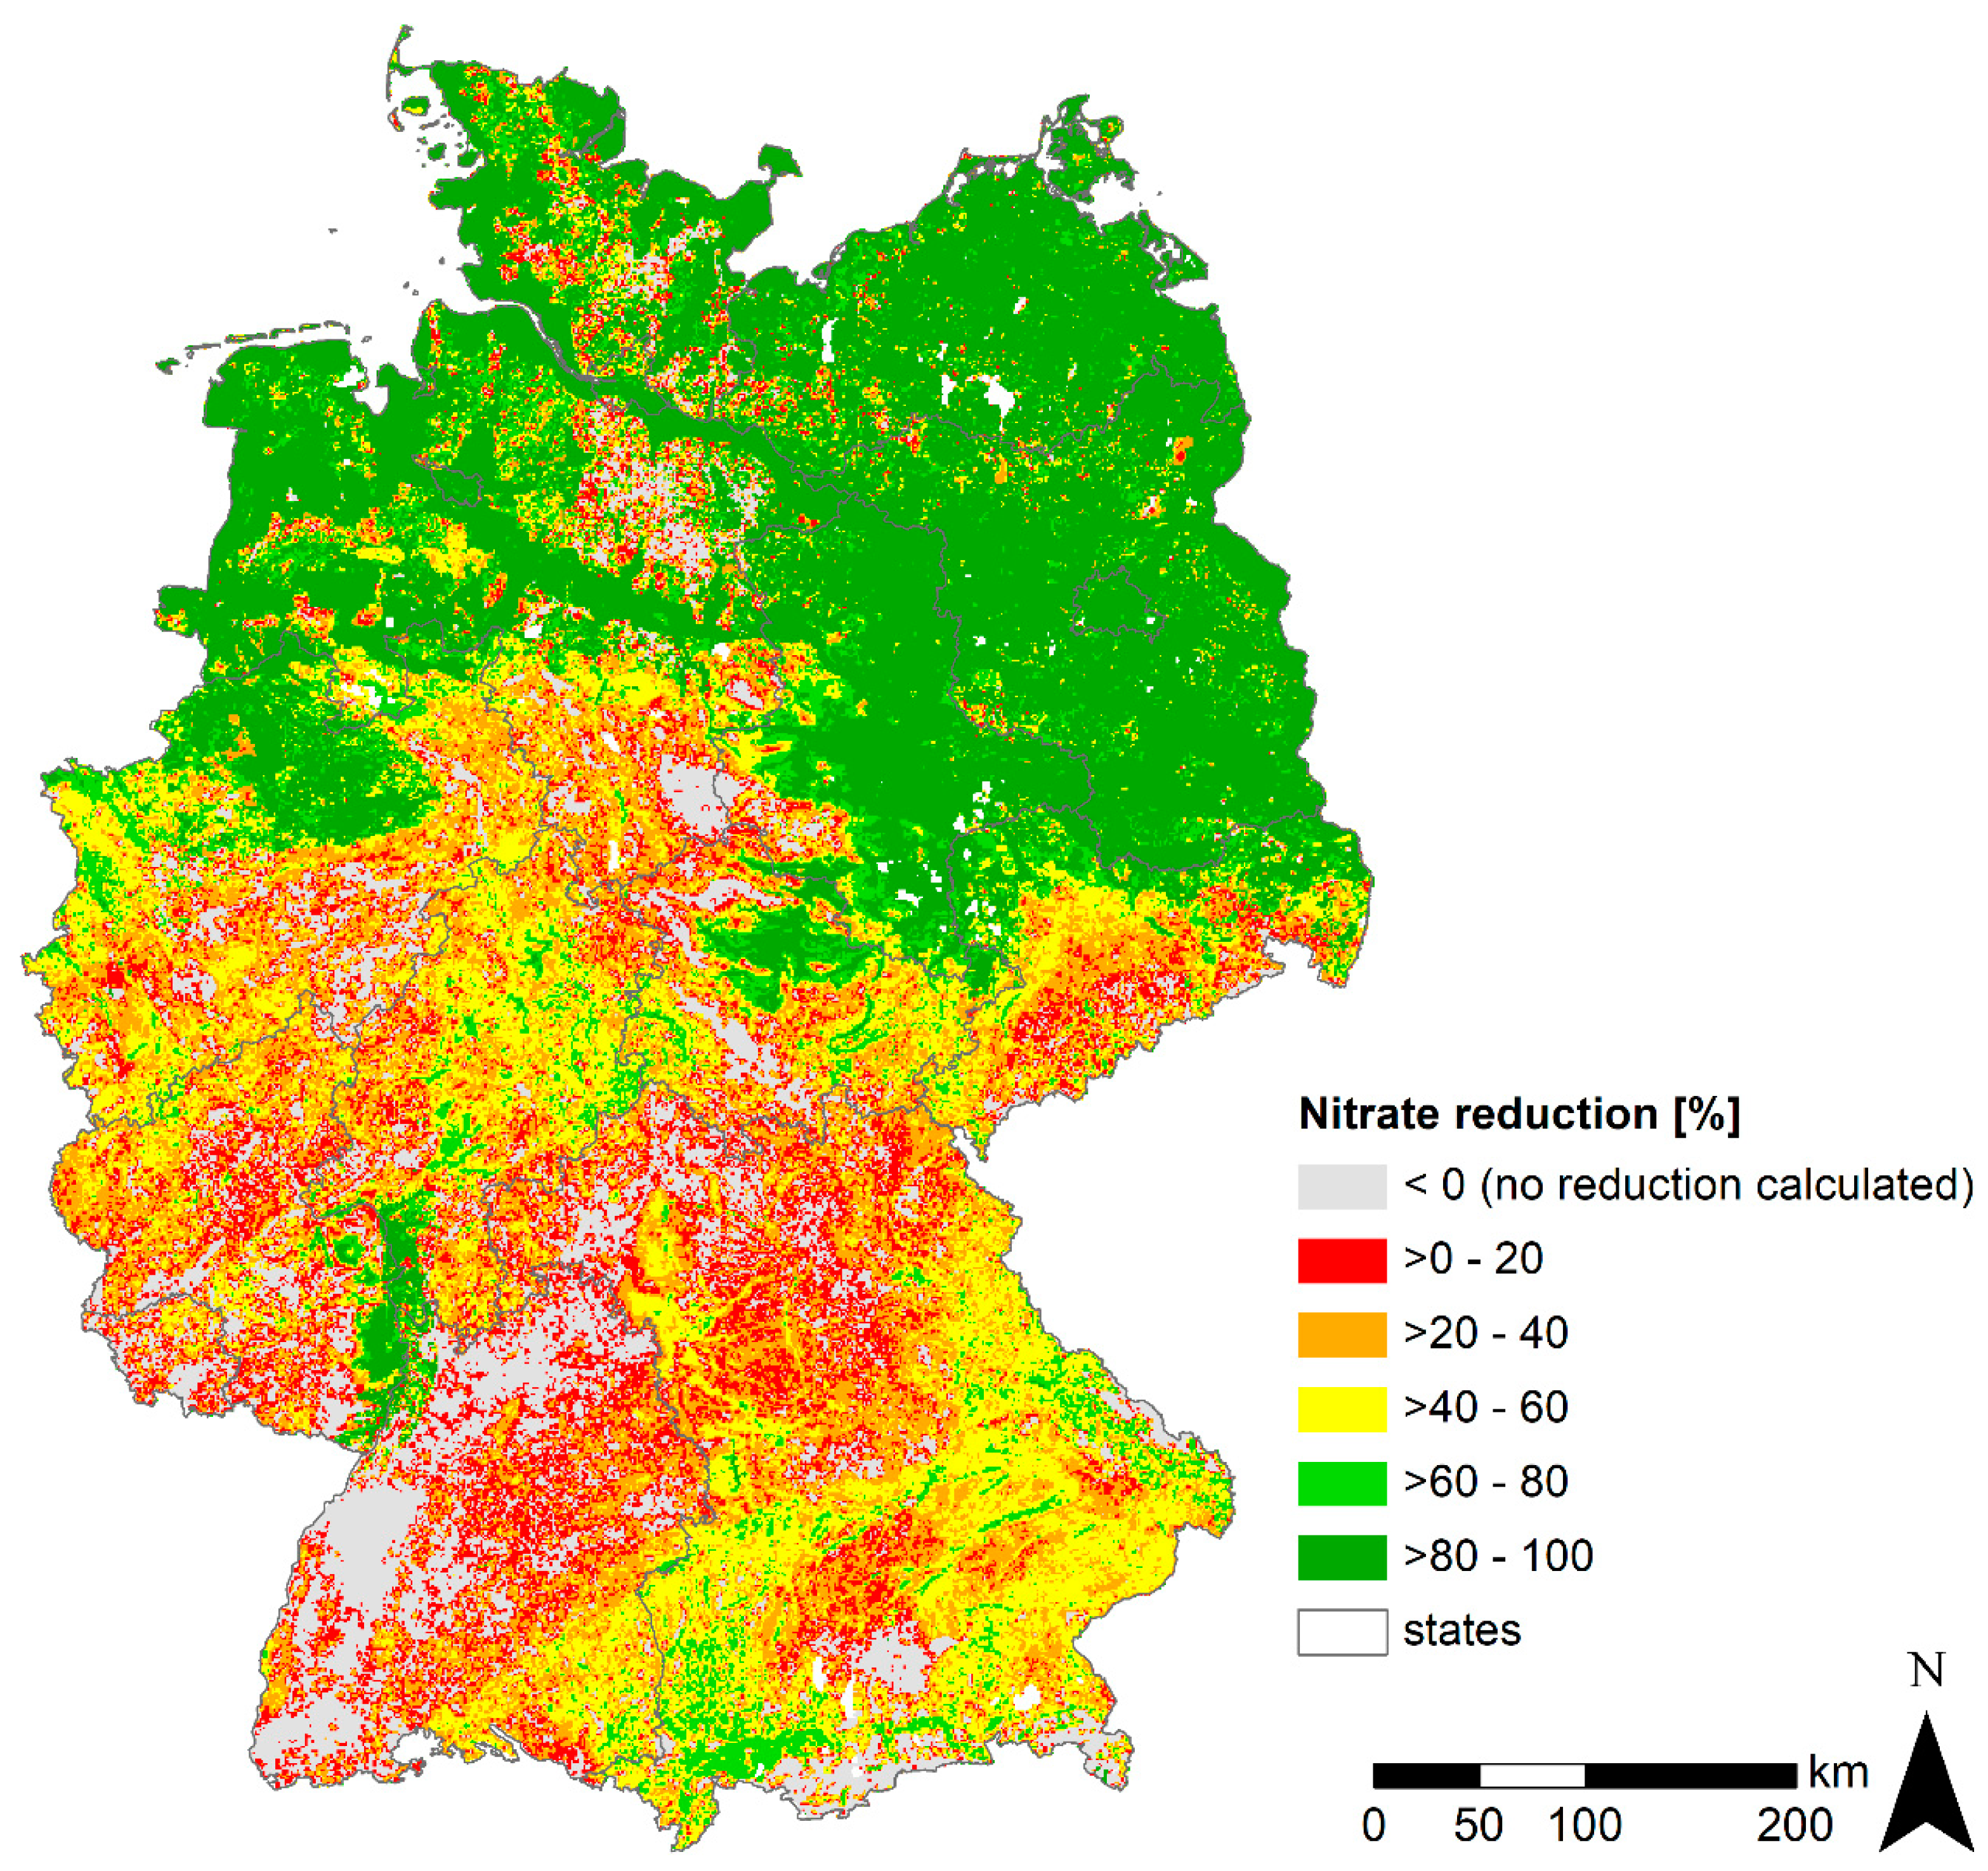
In summary, for Germany, the annual NO3-N input into the unsaturated zone (NO3-N_loadinput_uz) amounts to 1196 kt N a−1. The NO3-N_loadinput_gw accounts for 580 kt N a−1, of which 236 kt N a−1 are discharged from the groundwater (NO3-N_loadgw) into the surface waters. Thus, the difference of 344 kt N a−1 is due to the NO3-N load reduction (NO3-N_red) in the unsaturated zone and the groundwater body. Figure 3 shows that the NO3-N loads in the groundwater body are substantially reduced compared to the NO3-N input loads. The reduction in NO3-N loads was quantified based on Equation (4), where the percentage of removed NO3-N load was calculated. The spatial distribution of the reduction rate (%) is shown in Figure 4. There is a marked north–south contrast with high reduction rates of up to 100% in the North German Plain and low to zero reduction in central and southern Germany. In some regions, predominantly in mountainous areas but also for example in the Geest regions in northern Germany, the reduction rates are at or below zero. Excluding the areas with no NO3-N reduction, the average reduction rate from NO3-N input across the unsaturated zone and the groundwater body is 57%.
The nitrate reduction rates were further analysed regarding their dominant hydrogeological features. In Table 1, the mean values and the standard deviations for the NO3-N load reduction are summarised for the attributes “aquifer types”, “consolidation”, “rock type”, “geochemical rock type”, “conductivity” and “redox conditions”. The differences between the characteristics within the hydrogeological features were statistically analysed using a post-hoc test (Tukey HSD) (see Tables S1–S6 in the Supplementary Materials). It is obvious that porous unconsolidated aquifers tend to have significantly higher reduction rates (>70%) than consolidated, fractured and karstified aquifers with below average reduction rates (32.8–36.1%) (Figure 5a). Since the porous aquifers predominantly have sedimentary origins, this difference in NO3-N load reduction is also apparent in the rock type, with significantly higher reduction rates being observed for sedimentary rocks than for metamorphic and magmatic rocks. Looking at the geochemical rock type, “silicatic” rocks tend to have a significantly higher NO3-N load reduction potential; “anthropogenic” and “sulphatic/halitic” rocks show the highest and the lowest reductions rates, respectively. However, both classes are rare, occurring with a share of <0.5%. No obvious trend can be deduced for “conductivity”. The highest mean NO3-N load reduction rates of 77.6% are found for high conductivities, as well as for the overlapping class medium to moderate with 73.9%. However, medium conductivities only show an NO3-N load reduction rate below the average of 42.6%, and for moderate conductivities even lower. The lowest mean NO3-N load reduction values (28.5%) occur for the class “very low”, but both the class “very low” and also “very high to high” are rare, with a share of <0.2% of the overall area. With regard to redox conditions, there is a clear trend of increasing reduction rates from aerobic (32.9%) to strongly anaerobic aquifer conditions (95.8%) (Figure 5b).
4. Discussion
To the best of our knowledge, this study provides for the first time a conceptual, parsimonious modelling approach for estimating the spatial distribution, at a high resolution (1 km), of the integrated nitrate reduction in the unsaturated zone and within the groundwater body on a large scale, applied here for Germany. Previous studies on N fluxes in Germany have shown that a significant fraction of the N loads in the surface waters originate from the groundwater. However, the order of magnitude of the N load reduction rates during the groundwater transfer is a major unknown [41]. Although the approach presented here is simplified, the results provide a valuable approximation for estimating the potential losses of N loads via the groundwater path. It is not possible to estimate the uncertainties involved in the approach due to the assumptions made. For the hydrospheric N surplus on agriculturally utilised areas, uncertainties of ±10 kg N ha−1 a−1 are stated [36]. Large uncertainties are also found for groundwater nitrate concentrations, with prediction intervals of 53 mg L−1 and a mean absolute error of 12.7 mg L−1 [26]. No uncertainty analyses are available for the estimates of the N surplus on non-agricultural areas, the seepage water rate, or groundwater recharge rate. It can be argued that both the input variables NO3-N_loadinput_gw and NO3-N_loadgw are technically well established and documented. They therefore provide the best available and state-of-the-art data sets for Germany. If it is accepted that the estimates of NO3-N_loadinput_gw and NO3-N_loadgw are reliable, and it could be concluded that the results of Equation (4) are also reliable within the scope of the overall uncertainties of the approach, which however cannot be determined quantitatively. In order to examine the reliability of the results, the N2/Ar-method could be applied. The N2/Ar ratio is used to calculate the concentration of excess N2 in the groundwater, which can be used to derive the denitrification rate. Since corresponding nationwide measurement programs have not yet been established, a validation of the approach presented here can currently not be carried out with the N2/Ar-method, but offers great potential for further research.
A conceptual approach for estimating the nitrate reduction along its transport paths from the source through the groundwater body includes many processes. Studies dealing with this topic [13,15] usually distinguish between a reduction in the unsaturated zone and the groundwater. However, for the unsaturated zone, a small decrease in nitrate concentration or a conservative transport can be assumed [42,43]. The capability of validating the nitrate reduction in the unsaturated zone is limited to a very small number of measured nitrate concentrations in seepage water [44]. Since the groundwater nitrate concentration data are available in a much higher density than the measured values for nitrate concentration in the seepage water, Wendland et al. [9] compared modelled nitrate concentrations in seepage water with the observed nitrate concentrations in groundwater, and found good agreement. However, they note that in regions with increased denitrification capacity, the measured groundwater concentrations are considerably lower than the simulated seepage water concentrations. In the present study, it was done the other way round, where the nitrate concentration in the groundwater was used as the input data to derive the overall nitrate reduction. This approach provides a simple, uniform and robust method for the quantification of nitrate reduction, depending on existing nationwide data sets.
The nitrate reduction for Germany in the present study ranges from 0% to 100%, which was also the case in the study by Seitzinger et al. [7]. Comparing the overall mean integrated nitrate reduction of 57% calculated for Germany, with other studies indicating similar dimensions, throughout Germany there is however a very heterogeneous spatial distribution of nitrate reduction. For example, looking at the federal state of Mecklenburg-Vorpommern with its widespread glacially formed Late Pleistocene units, a mean integrated nitrate reduction of around 89% was calculated, while Kunkel et al. [13] estimated around 40% of the N input being denitrified in the soil, and 85% of the N load transported via groundwater being removed within the aquifer. From this, one can infer an integrated reduction rate for the transport path from the soil to the groundwater and within the groundwater body of around 74%, which is in a similar range to the reduction rates determined in the present study. For the Weser catchment, a mean NO3-N load reduction of about 46% was calculated, which is exactly the same as stated in Hirt et al. [15]. The Weser catchment covers the typical hydrogeological characteristics occurring in Germany, from the Central German uplands to the North German Plain. According to Fuchs et al. [41], the mean N input between 2006 to 2011 into surface waters in Germany via the groundwater path amounted to 283 kt N, which is in line with the 236 kt N estimated in this study. At this point, it has to be considered that these loads can be further reduced by the nitrate reduction capacity of the riparian zone when entering the surface waters. Hill [45] reviewed research studies from the recent decades dealing with nitrate removal in the riparian zone and found considerable variation in the reduction capacity, depending on the hydrogeological properties.
While Häußermann et al. [36] report maximum values of the N surplus of up to 162 kg N ha−1 a−1 (mean 77 kg N ha−1 a−1), the values of the area-weighted land-use-specific hydrospheric N input loads are considerably lower. This reflects the impact on the NO3-N input loads of areas with less anthropogenic control, such as natural or forested land. For some 12% of the area of Germany no reduction was calculated, which is due to the straightforward nature of our approach. When the N inputs are underestimated or the groundwater loads are overestimated, a reduction of less than zero results. A closer look at the regions with “no reduction” shows that this mainly concerns forested areas or natural vegetation, e.g., the Alps or the Black Forest. In any case, these areas are not relevant with respect to anthropogenic water pollution.
The spatial distribution of the nitrate reduction rates reflects very well the spatial hydrogeological structure in Germany. Rivas et al. [31] concluded that the factors “soil texture”, “drainage class”, “aquifer material” and “rock types” influence the groundwater denitrification potential. They found that well drained soils and rocks are unsuitable for denitrification processes. However, in contrast to Rivas et al. [31], the conductivities in this study do not show a clear effect on nitrate reduction. The present study further shows that, for Germany, the parameters “aquifer type”, “consolidation” and in particular “redox conditions” significantly affect the intensity of the nitrate reduction.
Groundwater bodies with anaerobic conditions show a distinct influence on nitrate reduction, which is to be expected since anaerobic conditions favour denitrification processes [18]. The unconsolidated porous aquifers occurring in the North German Plain are characterised by largely confined aquifers, low flow velocities, long groundwater residence times and, due to the thick covers of the till layers, strongly anaerobic conditions [26,46,47]. As a result, the North German Plain is dominated by high nitrate reduction rates. The Central German uplands are predominantly formed by fractured or karstified consolidated aquifers with mainly aerobic to intermediate redox conditions, which are unsuitable for the denitrification processes, and thus lead to low reduction rates compared to the Quaternary deposits [48]. The Alpine foreland in the south of Germany show a rather heterogeneous distribution in nitrate reduction. The southern part, mainly characterised by Late Pleistocene glacial deposits, has higher reduction rates. Further north, there are Quaternary fluviatile gravel deposits with high conductivities and, in contrast to the pore aquifers in northern Germany, very low to no nitrate reduction occur, which however is in line with the findings for well-drained rocks [31]. The Tertiary sedimentary deposits in the northern Alpine foreland have in places thick loess covers, which again lead to higher nitrate reduction rates in this area.
The spatial distribution of the natural nitrate reduction has to be taken into account when discussing management strategies for groundwater bodies that do not meet the “good status” according to the Water Framework Directive with respect to nitrate concentration. Mitigation measures are principally intended to reduce the N surplus, mainly by restrictions on fertiliser use. In accordance with the German Groundwater Ordinance [49], groundwater bodies are to be evaluated entirely according to the precautionary principle. In the context of the current revision of the Fertiliser Ordinance, the issue of an internal differentiation between nitrate-sensitive areas, which requires making a 20% reduction in N fertilising, is gaining more and more relevance. For planning and designing mitigation measures, information on the NO3-N input load, the groundwater nitrate concentrations or the groundwater NO3-N load, as well as the NO3-N load reduction quantified in the present study, could be applied to determine the N fertilising reduction necessary to meet the groundwater nitrate limit (50 mg NO3 L−1).
Looking at the potential nitrate reduction rates, finally one must also consider that the denitrification processes are not inexhaustible [21,50]. Water management experts in Germany regularly draw attention to the lack of knowledge about the denitrification capacity in the unsaturated zone and in groundwater in the regions of Germany [51], and whether similar rates of subsurface nitrate reduction can be expected in the longer term [52].
5. Conclusions
In the present study, a parsimonious modelling approach has been developed to estimate the nationwide nitrate reduction or NO3-N load reduction rates from existing data sets on the N surplus calculations, water fluxes and estimates of groundwater nitrate concentrations. The method follows a simplified conceptual approach without the need to simulate complex biogeochemical processes. The nitrate reduction is considered as an integrated measure across the unsaturated zone and the groundwater body.
Besides a clear spatial differentiation with high nitrate reduction rates in north Germany and low nitrate reduction rates in the south, it could also be shown that the hydrogeological characteristics have a substantial influence on the degree of reduction. The nitrate reduction quantified in the present study could be taken into account in the planning and design of mitigation measures. Particularly in the current debate on the designation of vulnerable areas, the demand for harmonised approaches is growing.
Supplementary Materials
The following are available online at https://www.mdpi.com/2073-4441/12/9/2456/s1, Table S1: Post-Hoc-Test results aquifer type, Table S2: Post-Hoc-Test results consolidation, Table S3: Post-Hoc-Test results rock type, Table S4: Post-Hoc-Test results geochemical rock type, Table S5: Post-Hoc-Test results conductivity, Table S6: Post-Hoc-Test results redox conditions.
Author Contributions
Conceptualization, L.K. and M.B.; formal analysis, L.K.; funding acquisition, L.B. and M.B.; investigation, L.K.; methodology, L.K.; project administration, M.B.; resources, L.K., U.H. and M.B.; validation, L.K.; visualization, L.K.; writing—original draft, L.K.; writing—review and editing, U.H., L.B. and M.B. All authors have read and agreed to the published version of the manuscript.
Funding
This research was funded by the German Environment Agency in the framework of the environment research plan of the Federal Ministry for the Environment, Nature Conservation and Nuclear Safety (project no. 3715 22 2200).
Acknowledgments
The hydrogeological data used are available from the Federal Institute for Geosciences and Natural Resources (BGR) in Hanover (https://www.bgr.bund.de/EN/Themen/Wasser/Produkte/produkte_node_en.html).
Conflicts of Interest
The authors have no conflict of interest to declare.
References
- Erisman, J.W.; Galloway, J.N.; Seitzinger, S.; Bleeker, A.; Dise, N.B.; Petrescu, A.M.R.; Leach, A.M.; de Vries, W. Consequences of human modification of the global nitrogen cycle. Philos. Trans. R. Soc. Lond. B. Biol. Sci. 2013, 368, 20130116. [Google Scholar] [CrossRef] [PubMed] [Green Version]
- Reis, S.; Bekunda, M.; Howard, C.M.; Karanja, N.; Winiwarter, W.; Yan, X.; Bleeker, A.; Sutton, M.A. Synthesis and review: Tackling the nitrogen management challenge: From global to local scales. Environ. Res. Lett. 2016, 11, 120205. [Google Scholar] [CrossRef]
- Sutton, M.A.; Bleeker, A.; Howard, C.M.; Bekunda, M.; Grizzetti, B.; de Vries, W.; van Grinsven, H.J.M.; Abro, Y.P.; Adhya, T.K.; Billen, G.; et al. Our Nutrient World-The Challenge to Produce More Food and Energy with Less Pollution; Centre for Ecology and Hydrology (CEH): Edinburgh, UK, 2013. [Google Scholar]
- EEA. European Waters–Assessment of Status and Pressures. 2018. Available online: https://www.eea.europa.eu/publications/state-of-water (accessed on 21 June 2019).
- Fuchs, S.; Scherer, U.; Wander, R.; Behrendt, H.; Venohr, M.; Opitz, D.; Hillenbrand, T.; Marscheider-Weidemann, F.; Götz, T. Berechnung von Stoffeinträgen in die Fließgewässer Deutschlands mit dem Modell MONERIS; UBA-Texte 45/2010; German Environment Agency (UBA): Dessau-Rosslau, Germany, 2010. [Google Scholar]
- Bach, M.; Häußermann, U.; Klement, L.; Knoll, L.; Breuer, L.; Weber, T.; Fuchs, S.; Heldstab, J.; Reutimann, J.; Schäppi, B. Reactive Nitrogen Flows in Germany 2010–2014 (DESTINO Report 2); UBA-Texte 65/2020; Umweltbundesamt: Dessau-Rosslau, Germany, 2020. [Google Scholar]
- Seitzinger, S.; Harrison, J.A.; Böhlke, J.K.; Bouwman, A.F.; Lowrance, R.; Peterson, B.; Tobias, C.; Drecht, G.V. Denitrification Across Landscapes and Waterscapes: A Synthesis. Ecol. Appl. 2006, 16, 2064–2090. [Google Scholar] [CrossRef] [Green Version]
- Van Egmond, K.; Bresser, T.; Bouwman, L. The European Nitrogen Case. AMBIO J. Hum. Environ. 2002, 31, 72–78. [Google Scholar] [CrossRef]
- Wendland, F.; Bergmann, S.; Eisele, M.; Gömann, H.; Herrmann, F.; Kreins, P.; Kunkel, R. Model-Based Analysis of Nitrate Concentration in the Leachate—The North Rhine-Westfalia Case Study, Germany. Water 2020, 12, 550. [Google Scholar] [CrossRef] [Green Version]
- Kuhr, P.; Haider, J.; Kreins, P.; Kunkel, R.; Tetzlaff, B.; Vereecken, H.; Wendland, F. Model Based Assessment of Nitrate Pollution of Water Resources on a Federal State Level for the Dimensioning of Agro-environmental Reduction Strategies. Water Resour. Manag. 2013, 27, 885–909. [Google Scholar] [CrossRef]
- McAleer, E.B.; Coxon, C.E.; Richards, K.G.; Jahangir, M.M.R.; Grant, J.; Mellander, P.E. Groundwater nitrate reduction versus dissolved gas production: A tale of two catchments. Sci. Total Environ. 2017, 586, 372–389. [Google Scholar] [CrossRef] [Green Version]
- Højberg, A.L.; Hansen, A.L.; Wachniew, P.; Żurek, A.J.; Virtanen, S.; Arustiene, J.; Strömqvist, J.; Rankinen, K.; Refsgaard, J.C. Review and assessment of nitrate reduction in groundwater in the Baltic Sea Basin. J. Hydrol. Reg. Stud. 2017, 12, 50–68. [Google Scholar] [CrossRef]
- Kunkel, R.; Herrmann, F.; Kape, H.E.; Keller, L.; Koch, F.; Tetzlaff, B.; Wendland, F. Simulation of terrestrial nitrogen fluxes in Mecklenburg-Vorpommern and scenario analyses how to reach N-quality targets for groundwater and the coastal waters. Environ. Earth Sci. 2017, 76, 146. [Google Scholar] [CrossRef]
- Wriedt, G.; Rode, M. Modelling nitrate transport and turnover in a lowland catchment system. J. Hydrol. 2006, 328, 157–176. [Google Scholar] [CrossRef]
- Hirt, U.; Kreins, P.; Kuhn, U.; Mahnkopf, J.; Venohr, M.; Wendland, F. Management options to reduce future nitrogen emissions into rivers: A case study of the Weser river basin, Germany. Agric. Water Manag. 2012, 115, 118–131. [Google Scholar] [CrossRef]
- Zhou, W.; Ma, Y.; Well, R.; Wang, H.; Yan, X. Denitrification in Shallow Groundwater below Different Arable Land Systems in a High Nitrogen-Loading Region. J. Geophys. Res. Biogeosci. 2018, 123, 991–1004. [Google Scholar] [CrossRef]
- Knowles, R. Denitrification. Microbiol. Rev. 1982, 46, 43–70. [Google Scholar] [CrossRef] [PubMed]
- Rivett, M.O.; Buss, S.R.; Morgan, P.; Smith, J.W.N.; Bemment, C.D. Nitrate attenuation in groundwater: A review of biogeochemical controlling processes. Water Res. 2008, 42, 4215–4232. [Google Scholar] [CrossRef]
- Durand, P.; Breuer, L.; Johnes, P.J.; Billen, G.; de Klein, J.J.M. Nitrogen processes in aquatic ecosystems. In European Nitrogen Assessment; Sutton, M.A., Howard, C.M., Erisman, J.W., Billen, G., Bleeker, A., Grennfelt, P., van Grinsven, H., Grizzetti, B., Eds.; Cambridge University Press: Cambridge, UK, 2011; pp. 126–146. [Google Scholar]
- Korom, S.F. Natural denitrification in the saturated zone: A review. Water Resour. Res. 1992, 28, 1657–1668. [Google Scholar] [CrossRef]
- Kludt, C.; Weber, F.A.; Bergmann, A.; Knöller, K.; Berthold, G.; Schüth, C. Identifizierung der Nitratabbauprozesse und Prognose des Nitratabbaupotenzials in den Sedimenten des Hessischen Rieds. Grundwasser 2016, 21, 227–241. [Google Scholar] [CrossRef]
- Schwientek, M.; Einsiedl, F.; Stichler, W.; Stögbauer, A.; Strauss, H.; Maloszewski, P. Evidence for denitrification regulated by pyrite oxidation in a heterogeneous porous groundwater system. Chem. Geol. 2008, 255, 60–67. [Google Scholar] [CrossRef]
- Wisotzky, F.; Wohnlich, S.; Böddeker, M. Nitratreduktion in einem quartären Grundwasserleiter in Ostwestfalen, NRW. Grundwasser 2018, 23, 167–176. [Google Scholar] [CrossRef]
- Zhang, Y.C.; Slomp, C.P.; Broers, H.P.; Bostick, B.; Passier, H.F.; Böttcher, M.E.; Omoregie, E.O.; Lloyd, J.R.; Polya, D.A.; Van Cappellen, P. Isotopic and microbiological signatures of pyrite-driven denitrification in a sandy aquifer. Chem. Geol. 2012, 300–301, 123–132. [Google Scholar] [CrossRef]
- Ransom, K.M.; Nolan, B.T.; Traum, A.J.; Faunt, C.C.; Bell, A.M.; Gronberg, J.A.M.; Wheeler, D.C.; Rosecrans, Z.C.; Jurgens, B.; Schwarz, G.E.; et al. A hybrid machine learning model to predict and visualize nitrate concentration throughout the Central Valley aquifer, California, USA. Sci. Total Environ. 2017, 601–602, 1160–1172. [Google Scholar] [CrossRef]
- Knoll, L.; Breuer, L.; Bach, M. Nation-wide estimation of groundwater redox conditions and nitrate concentrations through machine learning. Environ. Res. Lett. 2020, 15, 064004. [Google Scholar] [CrossRef]
- Boyer, E.W.; Alexander, R.B.; Parton, W.J.; Li, C.; Butterbach-Bahl, K.; Donner, S.D.; Skaggs, R.W.; Grosso, S.J.D. Modeling Denitrification in Terrestrial and Aquatic Ecosystems at Regional Scales. Ecol. Appl. 2006, 16, 2123–2142. [Google Scholar] [CrossRef]
- Durand, P.; Moreau, P.; Salmon-Monviola, J.; Ruiz, L.; Vertes, F.; Gascuel-Odoux, C. Modelling the interplay between nitrogen cycling processes and mitigation options in farming catchments. J. Agric. Sci. 2015, 153, 959–974. [Google Scholar] [CrossRef]
- Green, C.T.; Jurgens, B.C.; Zhang, Y.; Starn, J.J.; Singleton, M.J.; Esser, B.K. Regional oxygen reduction and denitrification rates in groundwater from multi-model residence time distributions, San Joaquin Valley, USA. J. Hydrol. 2016, 543, 155–166. [Google Scholar] [CrossRef] [Green Version]
- Oehler, F.; Durand, P.; Bordenave, P.; Saadi, Z.; Salmon-Monviola, J. Modelling denitrification at the catchment scale. Sci. Total Environ. 2009, 407, 1726–1737. [Google Scholar] [CrossRef]
- Rivas, A.; Singh, R.; Horne, D.; Roygard, J.; Matthews, A.; Hedley, M.J. Denitrification potential in the subsurface environment in the Manawatu River catchment, New Zealand: Indications from oxidation-reduction conditions, hydrogeological factors, and implications for nutrient management. J. Environ. Manag. 2017, 197, 476–489. [Google Scholar] [CrossRef]
- Whelan, M.J.; Gandolfi, C. Modelling of spatial controls on denitrification at the landscape scale. Hydrol. Process. 2002, 16, 1437–1450. [Google Scholar] [CrossRef]
- Fuchs, S.; Kaiser, M.; Kiemle, L.; Kittlaus, S.; Rothvoß, S.; Toshovski, S.; Wagner, A.; Wander, R.; Weber, T.; Ziegler, S. Modeling of Regionalized Emissions (MoRE) into Water Bodies: An Open-Source River Basin Management System. Water 2017, 9, 239. [Google Scholar] [CrossRef]
- Venohr, M.; Hirt, U.; Hofmann, J.; Opitz, D.; Gericke, A.; Wetzig, A.; Natho, S.; Neumann, F.; Hürdler, J.; Matranga, M.; et al. Modelling of Nutrient Emissions in River Systems—MONERIS—Methods and Background. Int. Rev. Hydrobiol. 2011, 96, 435–483. [Google Scholar] [CrossRef]
- BKG. Geographische Gitter für Deutschland in UTM-Projektion (GeoGitter national)-DE_Grid_ETRS89-UTM32_1km, Frankfurt a.M. 2018. Available online: https://gdz.bkg.bund.de/index.php/default/geographische-gitter-fur-deutschland-in-utm-projektion-geogitter-national.html (accessed on 28 February 2020).
- Häußermann, U.; Bach, M.; Klement, L.; Breuer, L. Stickstoff-Flächenbilanzen für Deutschland mit Regionalgliederung Bundesländer und Kreise—Jahre 1995 bis 2017; Umweltbundesamt: Dessau-Roßlau, Germany, 2019. [Google Scholar]
- BGR. Mean Annual Rate of Percolation from the Soil in Germany (SWR1000); Hydrogeologischer Atlas von Deutschland; Federal Institute for Geosciences and Natural Resources (BGR): Hannover, Germany, 2003; Available online: https://www.bgr.bund.de/DE/Themen/Boden/Bilder/Bod_Themenkarten_HAD_4-5_g.html (accessed on 2 November 2018).
- BGR. Mean Annual Groundwater Recharge of Germany at the Scale of 1:1,000,000 (HAD 5.5); Hydrogeologischer Atlas von Deutschland; Federal Institute for Geosciences and Natural Resources (BGR): Hannover, Germany, 2003; Available online: https://produktcenter.bgr.de/terraCatalog/OpenSearch.do?search=5a75335e-ba46-452f-8792-ac7e9b49da88&type=/Query/OpenSearch.do (accessed on 2 November 2018).
- BKG. Digitales Landbedeckungsmodell für Deutschland (LBM-DE2012); Federal Agency for Cartography and Geodesy (BKG): Frankfurt, Germany, 2016; Available online: https://www.bkg.bund.de/DE/Ueber-das-BKG/Geoinformation/Fernerkundung/Landbedeckungsmodell/landbedeckungsmodell.html (accessed on 2 November 2018).
- BGR; SGD. Hydrogeologische Übersichtskarte von Deutschland 1:200.000, Oberer Grundwasserleiter (HÜK200 OGWL); Digitaler Datenbestand, Version 3.0; Federal Institute for Geosciences and Natural Resources (BGR): Hannover, Germany, 2016. [Google Scholar]
- Fuchs, S.; Weber, T.; Wander, R.; Toshovski, S.; Kittlaus, S.; Reid, L.; Bach, M.; Klement, L.; Hillenbrand, T.; Tettenborn, F. Effizienz von Maßnahmen zur Reduktion von Stoffeinträgen; UBA-Texte 05/2017; German Environment Agency (UBA): Dessau-Rosslau, Germany, 2017. [Google Scholar]
- Ascott, M.J.; Gooddy, D.C.; Wang, L.; Stuart, M.E.; Lewis, M.A.; Ward, R.S.; Binley, A.M. Global patterns of nitrate storage in the vadose zone. Nat. Commun. 2017, 8, 1416. [Google Scholar] [CrossRef]
- Rivett, M.O.; Smith, J.W.N.; Buss, S.R.; Morgan, P. Nitrate occurrence and attenuation in the major aquifers of England and Wales. Q. J. Eng. Geol. Hydrogeol. 2007, 40, 335–352. [Google Scholar] [CrossRef]
- Kreins, P.; Behrendt, H.; Gömann, H.; Hirt, U.; Kunkel, R.; Seidel, K.; Tetzlaff, B.; Wendland, F. Analyse von Agrar- und Umweltmaßnahmen im Bereich des landwirtschaftlichen Gewässerschutzes vor dem Hintergrund der EG-Wasserrahmenrichtlinie in der Flussgebietseinheit Weser—AGRUM Weser. In Landbauforschung—vTI Agriculture and Forestry Research; Johann Heinrich von Thünen-Institut: Braunschweig, Germany, 2010; p. 342. Available online: https://literatur.thuenen.de/digbib_extern/dk043299.pdf (accessed on 3 April 2020).
- Hill, A.R. Groundwater nitrate removal in riparian buffer zones: A review of research progress in the past 20 years. Biogeochemistry 2019, 143, 347–369. [Google Scholar] [CrossRef]
- Merz, C.; Steidl, J.; Dannowski, R. Parameterization and regionalization of redox based denitrification for GIS-embedded nitrate transport modeling in Pleistocene aquifer systems. Environ. Geol. 2009, 58, 1587. [Google Scholar] [CrossRef]
- Wendland, F.; Blum, A.; Coetsiers, M.; Gorova, R.; Griffioen, J.; Grima, J.; Hinsby, K.; Kunkel, R.; Marandi, A.; Melo, T.; et al. European aquifer typology: A practical framework for an overview of major groundwater composition at European scale. Environ. Geol. 2008, 55, 77–85. [Google Scholar] [CrossRef]
- Hannappel, S.; Köpp, C.; Bach, T. Charakterisierung des Nitratabbauvermögens der Grundwasserleiter in Sachsen-Anhalt. Grundwasser 2018, 23, 311–321. [Google Scholar] [CrossRef]
- GrwV. Grundwasserverordnung vom 9. In November 2010 (BGBl. I S. 1513), Zuletzt Geändert Durch Artikel 1 der Verordnung vom 4; Mai 2017, BGBl. I S. 1044; GrwV: Berlin, Germany, 2010. [Google Scholar]
- Wilde, S.; Hansen, C.; Bergmann, A. Decreasing denitrification capacity in aquifers: Scaled model-based evaluation. Grundwasser 2017, 22, 293–308. [Google Scholar] [CrossRef]
- Bergmann, A.; Dietrich, P.; van Straaten, L.; Frabko, U.; van Berk, W.; Kiefer, J. Konsequenzen Nachlassenden Nitratabbauvermögens in Grundwasserleitern; Deutscher Verein Gas- u. Wasserfach (DVGW): Bonn, Germany, 2013; p. 179. [Google Scholar]
- UBA. Quantifizierung der Landwirtschaftlich Verursachten Kosten zur Sicherung der Trinkwasserbereitstellung; UBA-Texte 43/2017; Umweltbundesamt: Dessau-Rosslau, Germany, 2017; p. 252. [Google Scholar]
Figure 1.
Flow paths and nitrate nitrogen loads (NO3-N loads) through the unsaturated zone and the groundwater body with N_surplusa,f,u = hydrospheric N surplus for different land-use types (a = agriculture (including arable land, grassland and special crops), f = forest, and u = urban) (kg N ha−1 a−1)); Qsw = seepage water (mm a−1); Qgw = groundwater recharge (mm a−1); Qi,d = interflow, drainage (mm a−1); c(NO3)gw = NO3 concentration in the groundwater (mg l−1); NO3−N_loadinput_uz = NO3-N input load in the unsaturated zone (kg N ha−1 a−1); NO3−N_loadinput_gw = NO3-N input load in the groundwater (kg N ha−1 a−1); NO3−N_loadgw = groundwater NO3-N load (kg N ha−1 a−1); NO3−N_red = nitrate reduction rate (%). Calculated values in italic; blue arrows represents water fluxes and orange arrows represents NO3-N_loads.

Figure 2.
(a) Combined regression and density plot of the seepage water [37] and groundwater recharge rate [38]; (b) boxplot of the ratio of the groundwater recharge and seepage water rate grouped by the consolidated and unconsolidated aquifers.

Figure 3.
(a) Nitrate-nitrogen input load in the groundwater (NO3-N_loadinput_gw). (b) Groundwater nitrate-nitrogen load (NO3-N_loadgw), based on a 1 km × 1 km grid map of Germany (federal state borders: © GeoBasis-DE/BKG, 2017).
Figure 3.
(a) Nitrate-nitrogen input load in the groundwater (NO3-N_loadinput_gw). (b) Groundwater nitrate-nitrogen load (NO3-N_loadgw), based on a 1 km × 1 km grid map of Germany (federal state borders: © GeoBasis-DE/BKG, 2017).

Figure 4.
Map of mean nitrate reduction (NO3-N_red) across the unsaturated zone and the groundwater based on a 1 km × 1 km grid map of Germany (federal state borders: © GeoBasis-DE/BKG, 2017).
Figure 4.
Map of mean nitrate reduction (NO3-N_red) across the unsaturated zone and the groundwater based on a 1 km × 1 km grid map of Germany (federal state borders: © GeoBasis-DE/BKG, 2017).

Figure 5.
Boxplots of the NO3-N load reduction rates (%) for (a) aquifer type and (b) redox conditions.
Figure 5.
Boxplots of the NO3-N load reduction rates (%) for (a) aquifer type and (b) redox conditions.


Table 1.
Mean NO3-N load reduction rates and standard deviation for the different hydrogeological attributes.
Table 1.
Mean NO3-N load reduction rates and standard deviation for the different hydrogeological attributes.
| Hydrogeology | NO3-N Load Reduction [%] | |
|---|---|---|
| Mean | Standard Deviation | |
| Aquifer type 1 | ||
| Fractured | 36.1 | 21.3 |
| fractured/karstified | 32.9 | 21.7 |
| fractured/porous | 32.8 | 18.9 |
| Porous | 72.5 | 28.4 |
| Consolidation 1 | ||
| consolidated | 35.4 | 21.3 |
| unconsolidated | 72.6 | 28.4 |
| Rock type 1 | ||
| magmatic | 37.6 | 16.9 |
| metamorphic | 36.1 | 17.8 |
| sedimentary | 58.9 | 31.9 |
| Geochemical rock type 1 | ||
| anthropogenic | 67.1 | 24.0 |
| sulphatic | 37.9 | 23.5 |
| sulphatic/halitic | 20.0 | 11.2 |
| carbonatic | 35.1 | 20.2 |
| silicatic/carbonatic | 42.6 | 23.2 |
| silicatic | 64.6 | 32.1 |
| silicatic/organic | 55.3 | 25.1 |
| Conductivity 1 | ||
| very high (>10−2 m s−1) | 46.5 | 22.2 |
| high (10−2–10−3 m s−1) | 77.6 | 27.1 |
| medium (10−3–10−4 m s−1) | 42.6 | 27.1 |
| moderate (10−4–10−5 m s−1) | 39.2 | 22.9 |
| low (10−5–10−7 m s−1) | 40.3 | 23.3 |
| very low (10−7–10−9 m s−1) | 28.5 | 14.7 |
| Overlapping classes | ||
| very high to high (>10−3 m s−1) | 27.4 | 14.8 |
| medium to moderate (10−3–10−5 m s-1) | 73.9 | 31.6 |
| low to very low (<10−5 m s−1) | 37.4 | 21.0 |
| moderate to low (10−4–10−7 m s−1) | 38.1 | 21.5 |
| variable | 56.0 | 27.6 |
| Redox conditions 2 | ||
| aerobic (O2 > 5 mg L−1 and Fe < 0.2 mg L−1) | 32.9 | 17.2 |
| intermediate (O2 > 5 mg L−1 and Fe ≥ 0.2 mg L−1 or O2 2–5 mg L−1 and Fe < 0.2 mg L−1) | 44.8 | 22.7 |
| anaerobic (O2 2–5 mg L−1 and Fe ≥ 0.2 mg L−1 or O2 < 2 mg L−1 and Fe < 0.2 mg L−1) | 69.1 | 16.6 |
| strongly anaerobic (O2 < 2 mg L−1 and Fe ≥ 0.2 mg L−1) | 95.8 | 5.7 |
© 2020 by the authors. Licensee MDPI, Basel, Switzerland. This article is an open access article distributed under the terms and conditions of the Creative Commons Attribution (CC BY) license (http://creativecommons.org/licenses/by/4.0/).
Share and Cite
MDPI and ACS Style
Knoll, L.; Häußermann, U.; Breuer, L.; Bach, M. Spatial Distribution of Integrated Nitrate Reduction across the Unsaturated Zone and the Groundwater Body in Germany. Water 2020, 12, 2456. https://doi.org/10.3390/w12092456
AMA Style
Knoll L, Häußermann U, Breuer L, Bach M. Spatial Distribution of Integrated Nitrate Reduction across the Unsaturated Zone and the Groundwater Body in Germany. Water. 2020; 12(9):2456. https://doi.org/10.3390/w12092456
Chicago/Turabian StyleKnoll, Lukas, Uwe Häußermann, Lutz Breuer, and Martin Bach. 2020. "Spatial Distribution of Integrated Nitrate Reduction across the Unsaturated Zone and the Groundwater Body in Germany" Water 12, no. 9: 2456. https://doi.org/10.3390/w12092456
Note that from the first issue of 2016, this journal uses article numbers instead of page numbers. See further details here.