Article

Optimization of the Biomonitoring Technique with the Aquatic Moss Fontinalis antipyretica Hedw.: Selection of Shoot Segment Length for Determining Trace Element Concentrations

Área Ecoloxía, Cretus Institute, Departamento de Bioloxía Funcional, Escola Politécnica Superior de Enxeñaría (EPSE), Universidade de Santiago de Compostela, Rúa Benigno Ledo, Campus Universitario, 27002 Lugo, Spain
*
Author to whom correspondence should be addressed.
Water 2020, 12(9), 2389; https://doi.org/10.3390/w12092389
Submission received: 30 July 2020 / Revised: 21 August 2020 / Accepted: 24 August 2020 / Published: 26 August 2020
(This article belongs to the Special Issue Biomonitors in Water Quality Control)

Abstract

:
Bryophytes, including Fontinalis antipyretica Hedw., are widely used for biomonitoring aquatic environments. However, some methodological aspects, such as the fraction of shoot analysed, have not yet been standardized. The main objective of this study was to establish the length of segments of F. antipyretica shoots that should be used for trace element determination in monitoring studies. For this purpose, we determined the concentrations of 12 different trace elements (11 metals and one metalloid) in five successive 1 cm-long segments of the shoots of F. antipyretica collected from four different locations. We found that the concentrations of most elements increased steadily towards the basal part of the shoots without becoming stable. Sometimes, these increasing trends were concealed by another underlying trend of increasing dry/fresh weight ratios, caused by morphological changes (leaf density, shoot thickness) related with shoot development. The concentration trends were due to factors such as the deposition of Mn oxides on the moss surface. This element showed the largest increases in concentration towards the basal part of the shoot and its concentrations were closely correlated with those of most of the other elements. Considering the results obtained, we recommend the use of 3 cm-long apical segments for determining trace element concentrations in F. antipyretica. This recommendation is based on the following: (1) The change in dry weight beyond this length of segment is small; (2) the workload and the quantity of material to collect in the river is acceptable; (3) Most previous studies have used shoot segments of similar lengths.

1. Introduction

Aquatic bryophytes have been used for decades to biomonitor freshwater environments, as they meet the requirements for such use [1,2,3,4,5]. One of the most widely used species is the aquatic moss Fontinalis antipyretica Hedw. [6,7,8]. Aquatic mosses in general, and F. antipyretica in particular, accumulate pollutants such as heavy metals and other trace elements [9,10,11,12,13,14]. As the element concentrations are influenced by multiple factors, biomonitoring studies must share a methodological basis to produce robust and comparable results. Unfortunately, although some attempts have been made to standardize sample collection, pretreatment and analytical preparation methods [8,15,16], a wide variety of methods are still in use. Moreover, some studies provide few or no details about the methods used [17]. Measuring accumulated elements in aquatic bryophytes is increasingly used for pollution monitoring in aquatic environments [18,19,20,21,22], and it is therefore essential to establish the effects of various factors on the final concentrations of the elements measured and to standardize the methodology as far as possible.
One factor that can influence the results of monitoring surveys is the length of the segment of moss shoot that is analysed to determine pollutant concentrations. Some studies have reported significant differences in the concentrations of some elements (e.g., Ca, Cd, Cu, Fe, K, Mg, N, P, Pb, Zn) along the length of the moss shoot, both in F. antipyretica and in other mosses [23,24]. Although trends may vary depending on the bryophyte species and the element considered [7], it is generally accepted that the highest concentrations of monovalent cations and anions occur in young tissue close to the apices of bryophyte shoots, whereas divalent cations and heavy metals tend to accumulate in the older segments close to the base of the plant [25]. The element concentrations will therefore vary depending on the shoot segment analysed.
The material analysed varies widely, ranging from the complete plant to 1 cm-long apical segments. After conducting a review of 73 articles, Debén et al. [17] showed that in 62% of the studies no information was given about the part of moss analysed and in the other 38%, different sizes of shoot segments were used. In addition, the material most used was shoot segments of between 2 and 3 cm (23% of the articles analysed) [17].
To make further advancements in optimizing and standardizing the monitoring technique with aquatic bryophytes, the longitudinal patterns of accumulation of the different elements in different species must be established. This will enable a more accurate interpretation of the element concentrations in moss and will provide the information required to select the optimal length of shoot segments for biomonitoring studies.
The main objective of this study was therefore to establish the length of F. antipyretica shoot segments that should be considered adequate for trace element determination in monitoring studies. For this purpose, the patterns in the element concentrations in relation to distance from the tip were first established for different trace elements and for samples collected in river sections with different chemical characteristics.

2. Materials and Methods
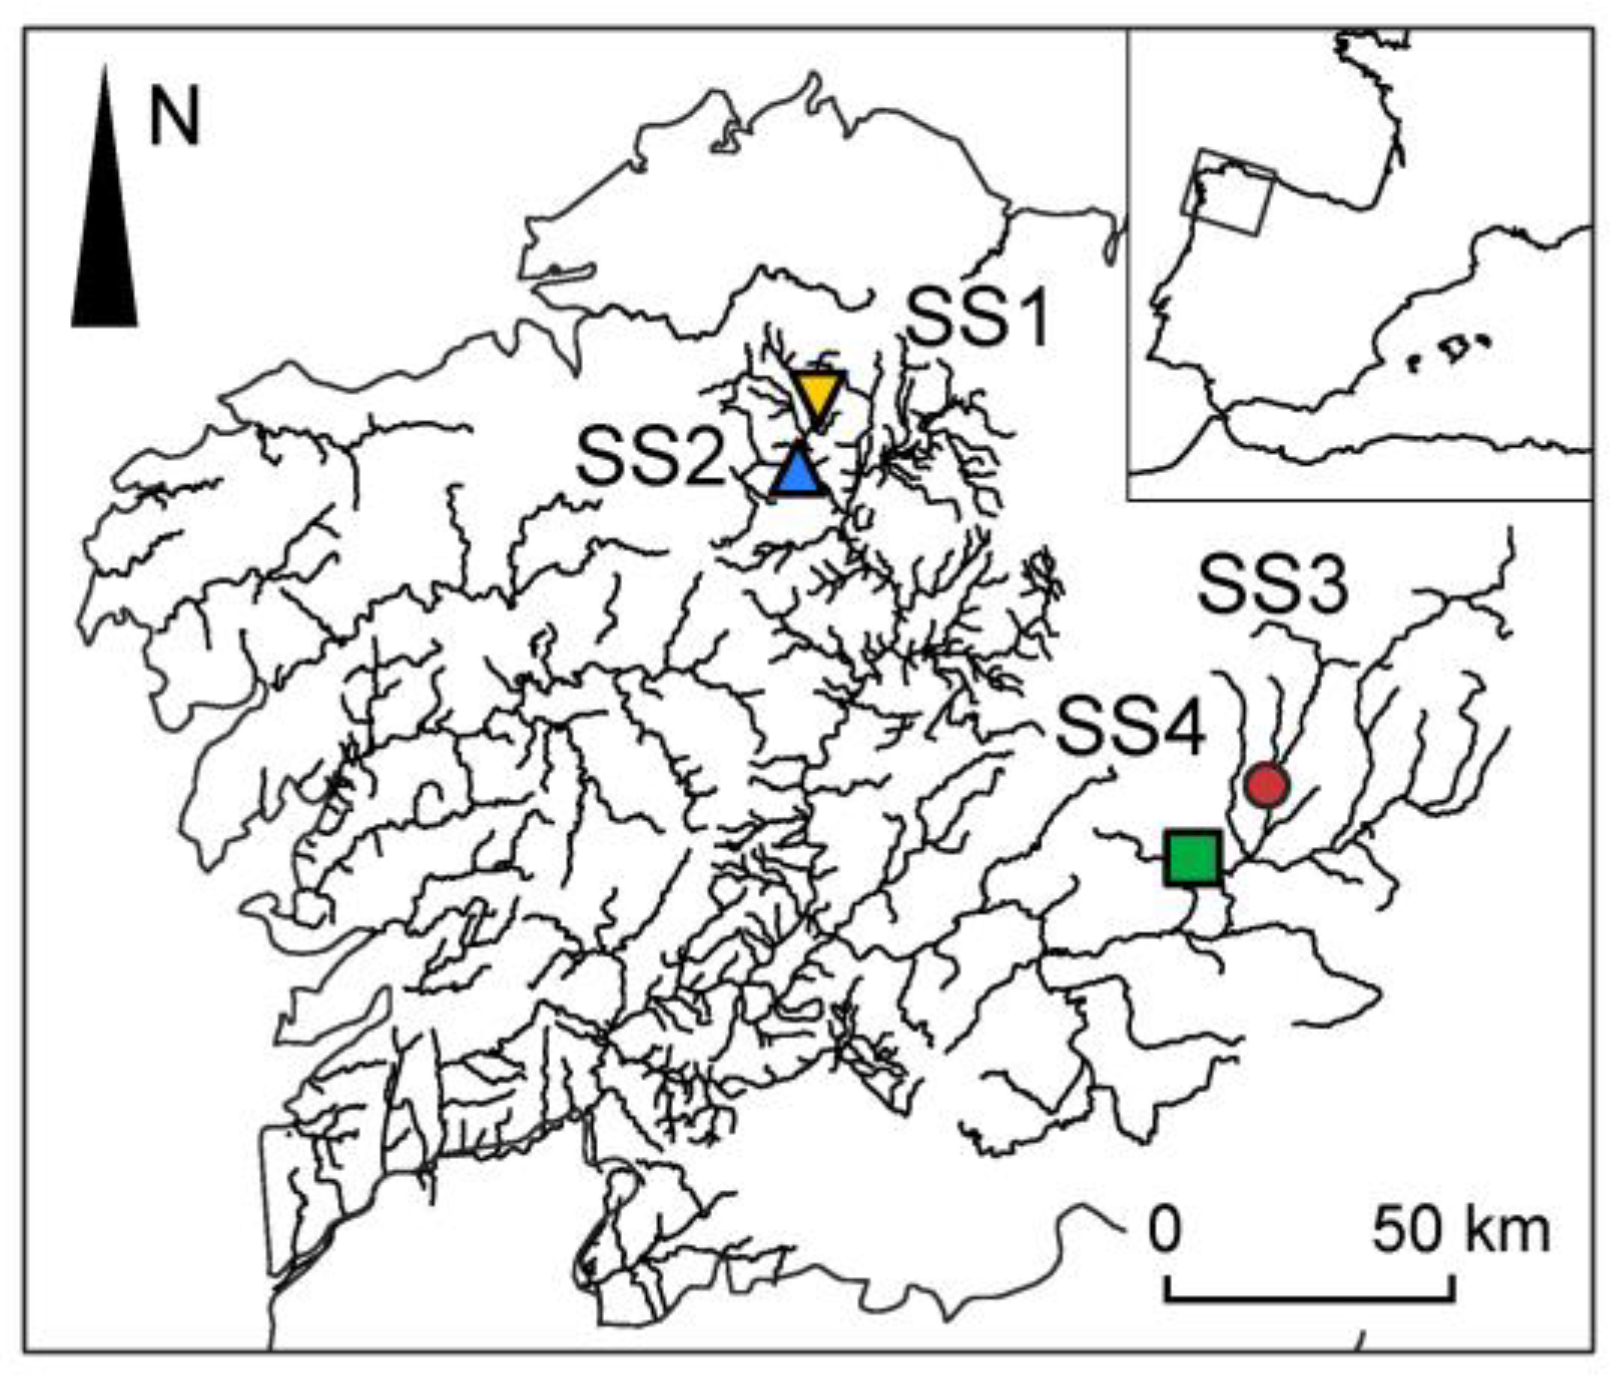
2.1. Sampling Sites

Samples of the moss F. antipyretica were collected at four sampling sites (SS) in the Miño and Sil river basins (NW Spain), in the summer of 2017 (Figure 1).
All of them were easily accessible, the moss grew abundantly in them, and the environmental conditions (see below) were different from each other. Each location, 100 m long, was divided into three stretches of equal length, and one moss sample was collected from each stretch. Electrical conductivity, pH and temperature were measured on the day of sampling with a portable pH/conductivity/temperature meter (HI9811-5, Hanna, Sarmeola di Rubano, Italy); and the percent saturation of dissolved oxygen with an oxygen meter (Oxi 320, Crison, Weilheim, Germany).
SS1 was located in the Madalena river, downstream from the town of Vilalba, and nearly 1 km downstream from a sewage treatment plant (43°17′13.00″ N, 7°41′17.00″ W—WGS84; altitude: 425 m.a.s.l.). The current velocity varied throughout the sampling station, and the following values were obtained for the water quality parameters: pH = 6.5; electrical conductivity, EC = 150 µS cm−1; percent saturation of dissolved oxygen, %DO = 65%; temperature, T = 17.6 °C.
SS2 was located in the Ladra river (43°9′48.30″ N, 7°43′5.80″ W; 395 m.a.s.l). The station extended up- and downstream from an old weir that had partially collapsed. In this area the current velocity was variable (slower upstream and faster downstream from the dam). The values for water quality parameters were: pH = 7.1, EC = 100 µS cm−1, %DO = 82%, T = 17.5 °C.
SS3 was located in the Cúa river (42°38′5.00″ N, 6°43′54.15″ W, 610 m.a.s.l). Here, the moss was growing in an irrigation channel which collected water from the river 250 m upstream of the study area. Aquatic vegetation was growing abundantly throughout the channel. The values for water quality parameters were: pH = 7.0, EC = 100 µS cm−1, %DO = 104%, T = 14.8 °C.
SS4 was a karstic spring arising from a limestone outcrop (42°35′23.63″ N, 7°3′25.35″ W; 820 m.a.s.l.). The water is alkaline in this location, which is unusual in the extreme NW Iberian Peninsula as most of the region lies on acidic rocks. F. antipyretica was growing luxuriously along the first 10 m of the spring. The values for water quality parameters were: pH = 8.0, EC = 100 µS cm−1, DO% = 133%, T = 9.6 °C.

2.2. Collection and Preparation of Samples

The distribution of the moss in the sampling stations depended on the presence of tree roots, boulders or bedrock to which it could attach, and it was always irregular. Where possible, material was collected from over ten clumps of moss to make a composite sample representative of the whole stretch. The material collected was restricted to fully submerged plants. Each sample was first washed several times in river water to remove any loosely attached sediment, debris and invertebrates, and it was then squeezed gently to remove excess water.
The moss samples collected were stored in plastic bags, transported to the laboratory in refrigerated containers and stored in a refrigerator (6 °C) until further processing. The material was always processed within 24 h of collection, to prevent alterations in element concentrations. Approximately 20 g (fresh weight) of 5 cm-long apical segments of shoots were separated from each moss sample. We did not bother to remove water from the sample at this point because that weight ensured a more than sufficient quantity of sample for the following analyses. Only the main shoots were included in the sample, i.e., branches were discarded to homogenise the age and morphology of the selected tissue. Damaged tissues or broken shoots without tips were also discarded. The segments were placed in plastic vessels with 200 mL of distilled water and shaken by hand for one minute to dislodge attached particles. The water was discarded, and the washing procedure was repeated. Finally, they were partially dried by gently squeezing them between filter paper sheets.
The shoots were cut into five 1-cm-long segments (which we will refer to as segments 1 to 5, starting from the shoot tip), the material of each segment placed in a paper bag, weighed, dried at 50 °C for 48 h, and reweighed. Dry/fresh weight ratios for each segment were calculated with these data. Finally, they were ground in a tangential mill (MM400, Retsch, Haan, Germany), with zirconium oxide grinding containers and balls, and stored until analysis.

2.3. Chemical Analysis

Aliquots of approximately 0.300 g of each ground sub-sample of moss were digested with a mixture of 8 mL of HNO3 (69%) and 2 mL of H2O2 (33%) in a microwave oven (Ethos1 Plus, Milestone, Sorisole, Italy) for 15 min at 190 °C and 1000 W. Distilled water (Milli-Q, Millipore, Bedford, MA, USA) was then added to produce 50 mL of extract. The concentrations of Al, As, Ba, Cd, Cr, Cu, Hg, Fe, Mn, Ni, Pb and Zn in the extracts were then determined by Inductively Coupled Plasm-Mass Spectrometry (ICP-MS, mod. 7700x, Agilent, Santa Clara, CA, USA).
Four samples of standard reference material (M2, Pleurozium schreberi) [26] were analysed at the same time as the samples to control the quality of the extraction procedure. The percentage recoveries varied depending on the element (Table 1).
The digestion procedure does not warrant the complete destruction of the mineral fraction in the samples, and this could cause the low recoveries of some elements, especially Cr. However, the measurements were reproducible, showing mostly low standard deviations.

2.4. Statistical Analysis

We calculated Kendall rank correlation coefficients (τ) [27] between the element concentrations in the segments and (a) themselves, (b) segment position along the shoot and (c) dry/fresh weight ratios. Function cor.test in the R statistical package [28] was used to calculate the coefficients and their significance. Note that this test does not assume normality and can be used to test for monotone but non-linear relationships between variables. Therefore, it was more appropriate for our data than Pearson’s coefficient. However, we applied both tests to the correlations between elements, which were approximately linear in most cases, and obtained very similar results, so we present only the Kendall’s test results to simplify the presentation of the results.
Most times the element concentrations of the replicates followed parallel lines when plotted against shoot position because of overall differences in element concentrations between replicates. These differences increased the dispersion in the bivariate plots (i.e., there were several parallel lines instead of a single line). To prevent these differences affecting the correlation tests, the concentration of each replicate was divided by the maximum value prior to the correlation analysis.

3. Results

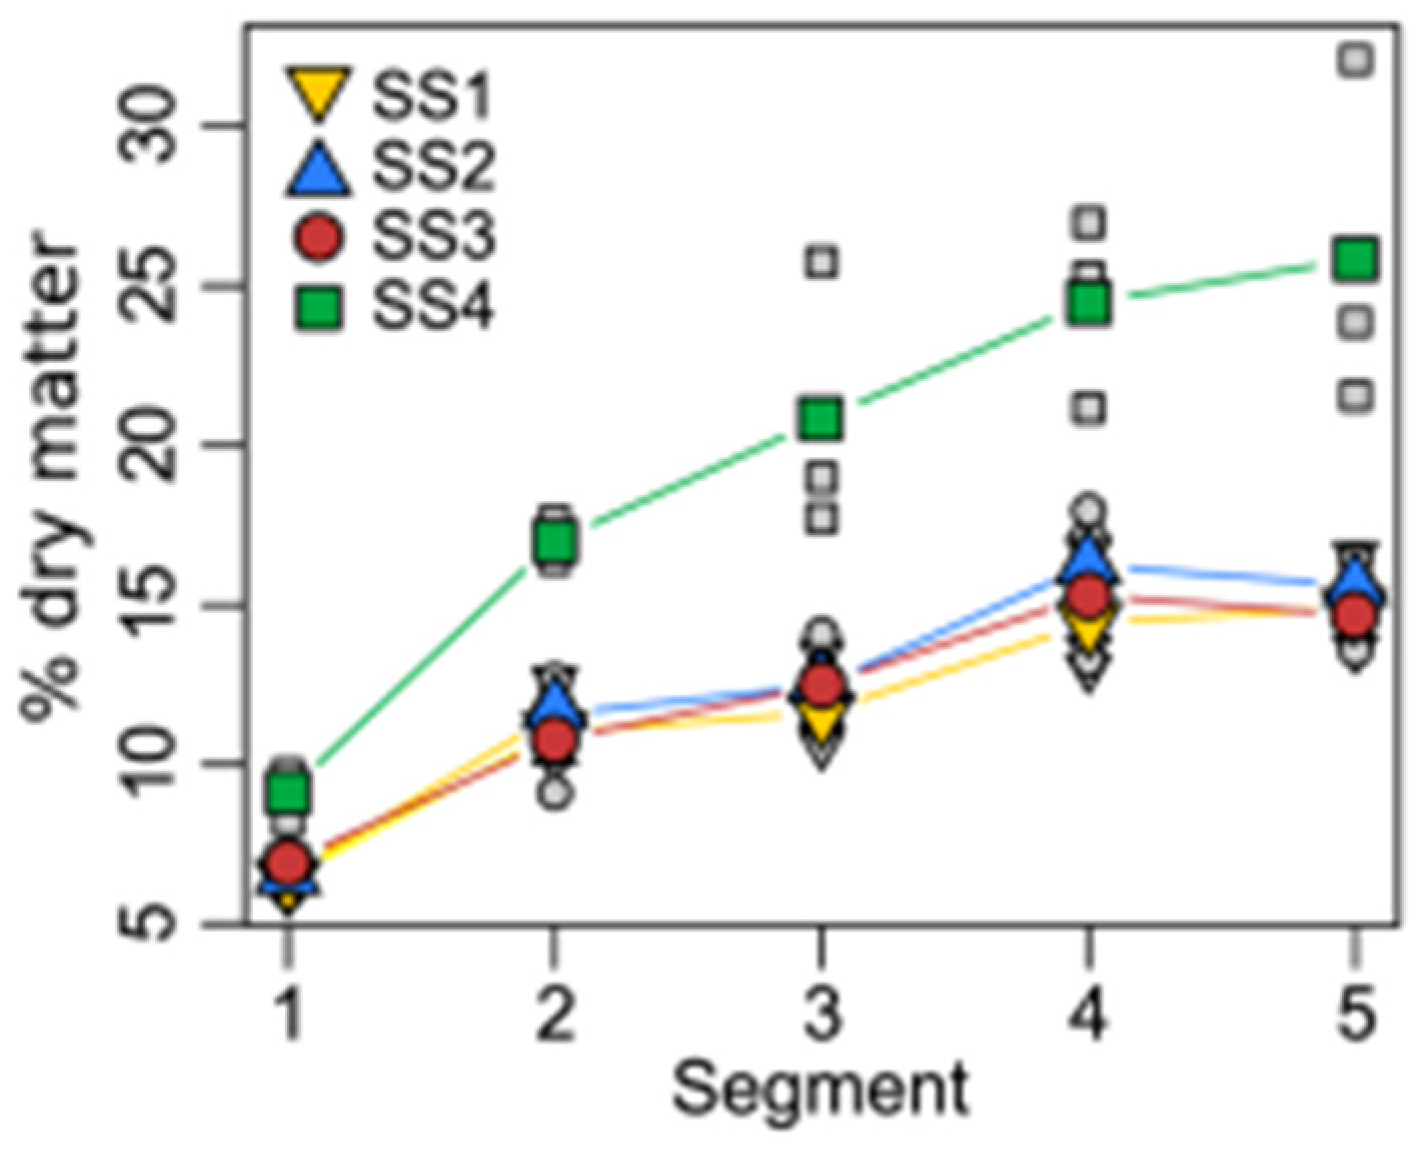
3.1. Trends in Dry/Fresh Weight Ratios

Trends in dry/fresh weight ratios were relevant for interpreting the results of the element analyses. Figure 2 shows the ratios expressed as a percentage. The trends were similar in all the SS: the ratio increased from segment 1 to 4 and stabilised from segment 4 to 5. In SS4 the dry weight/fresh weight ratios were higher than in the other SSs for all shoot segments, and the differences between segments were also greater.

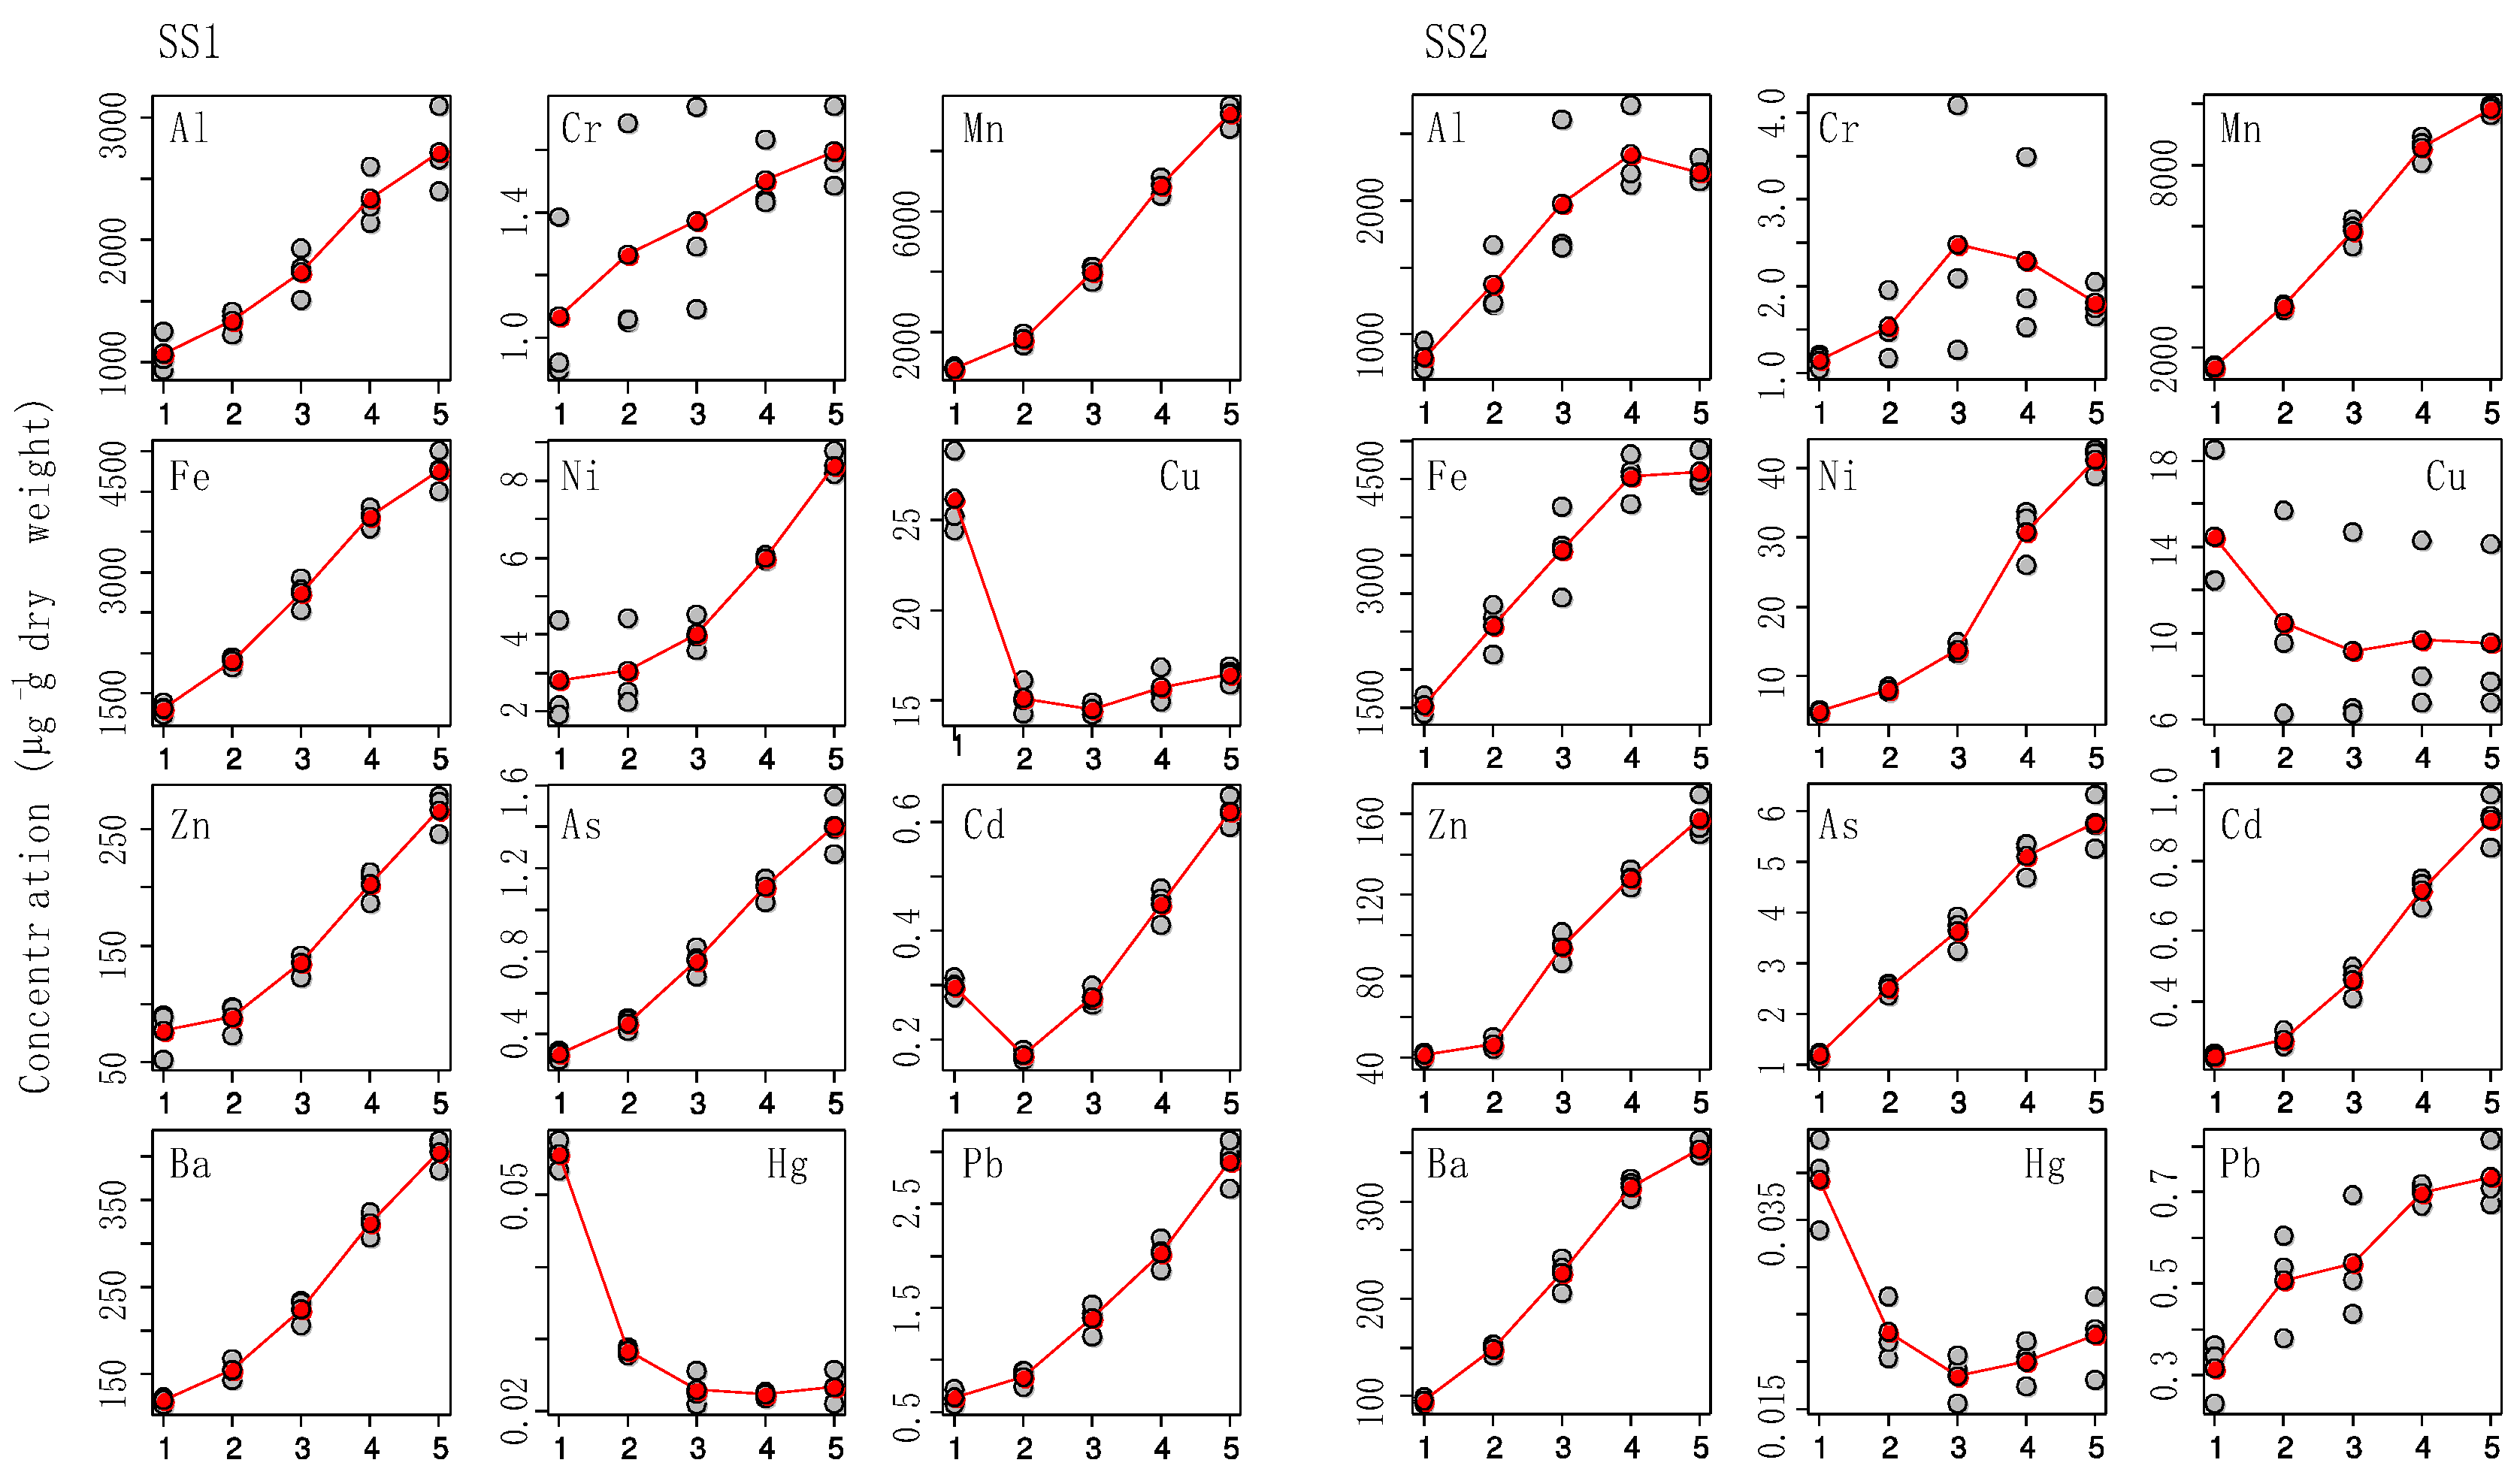
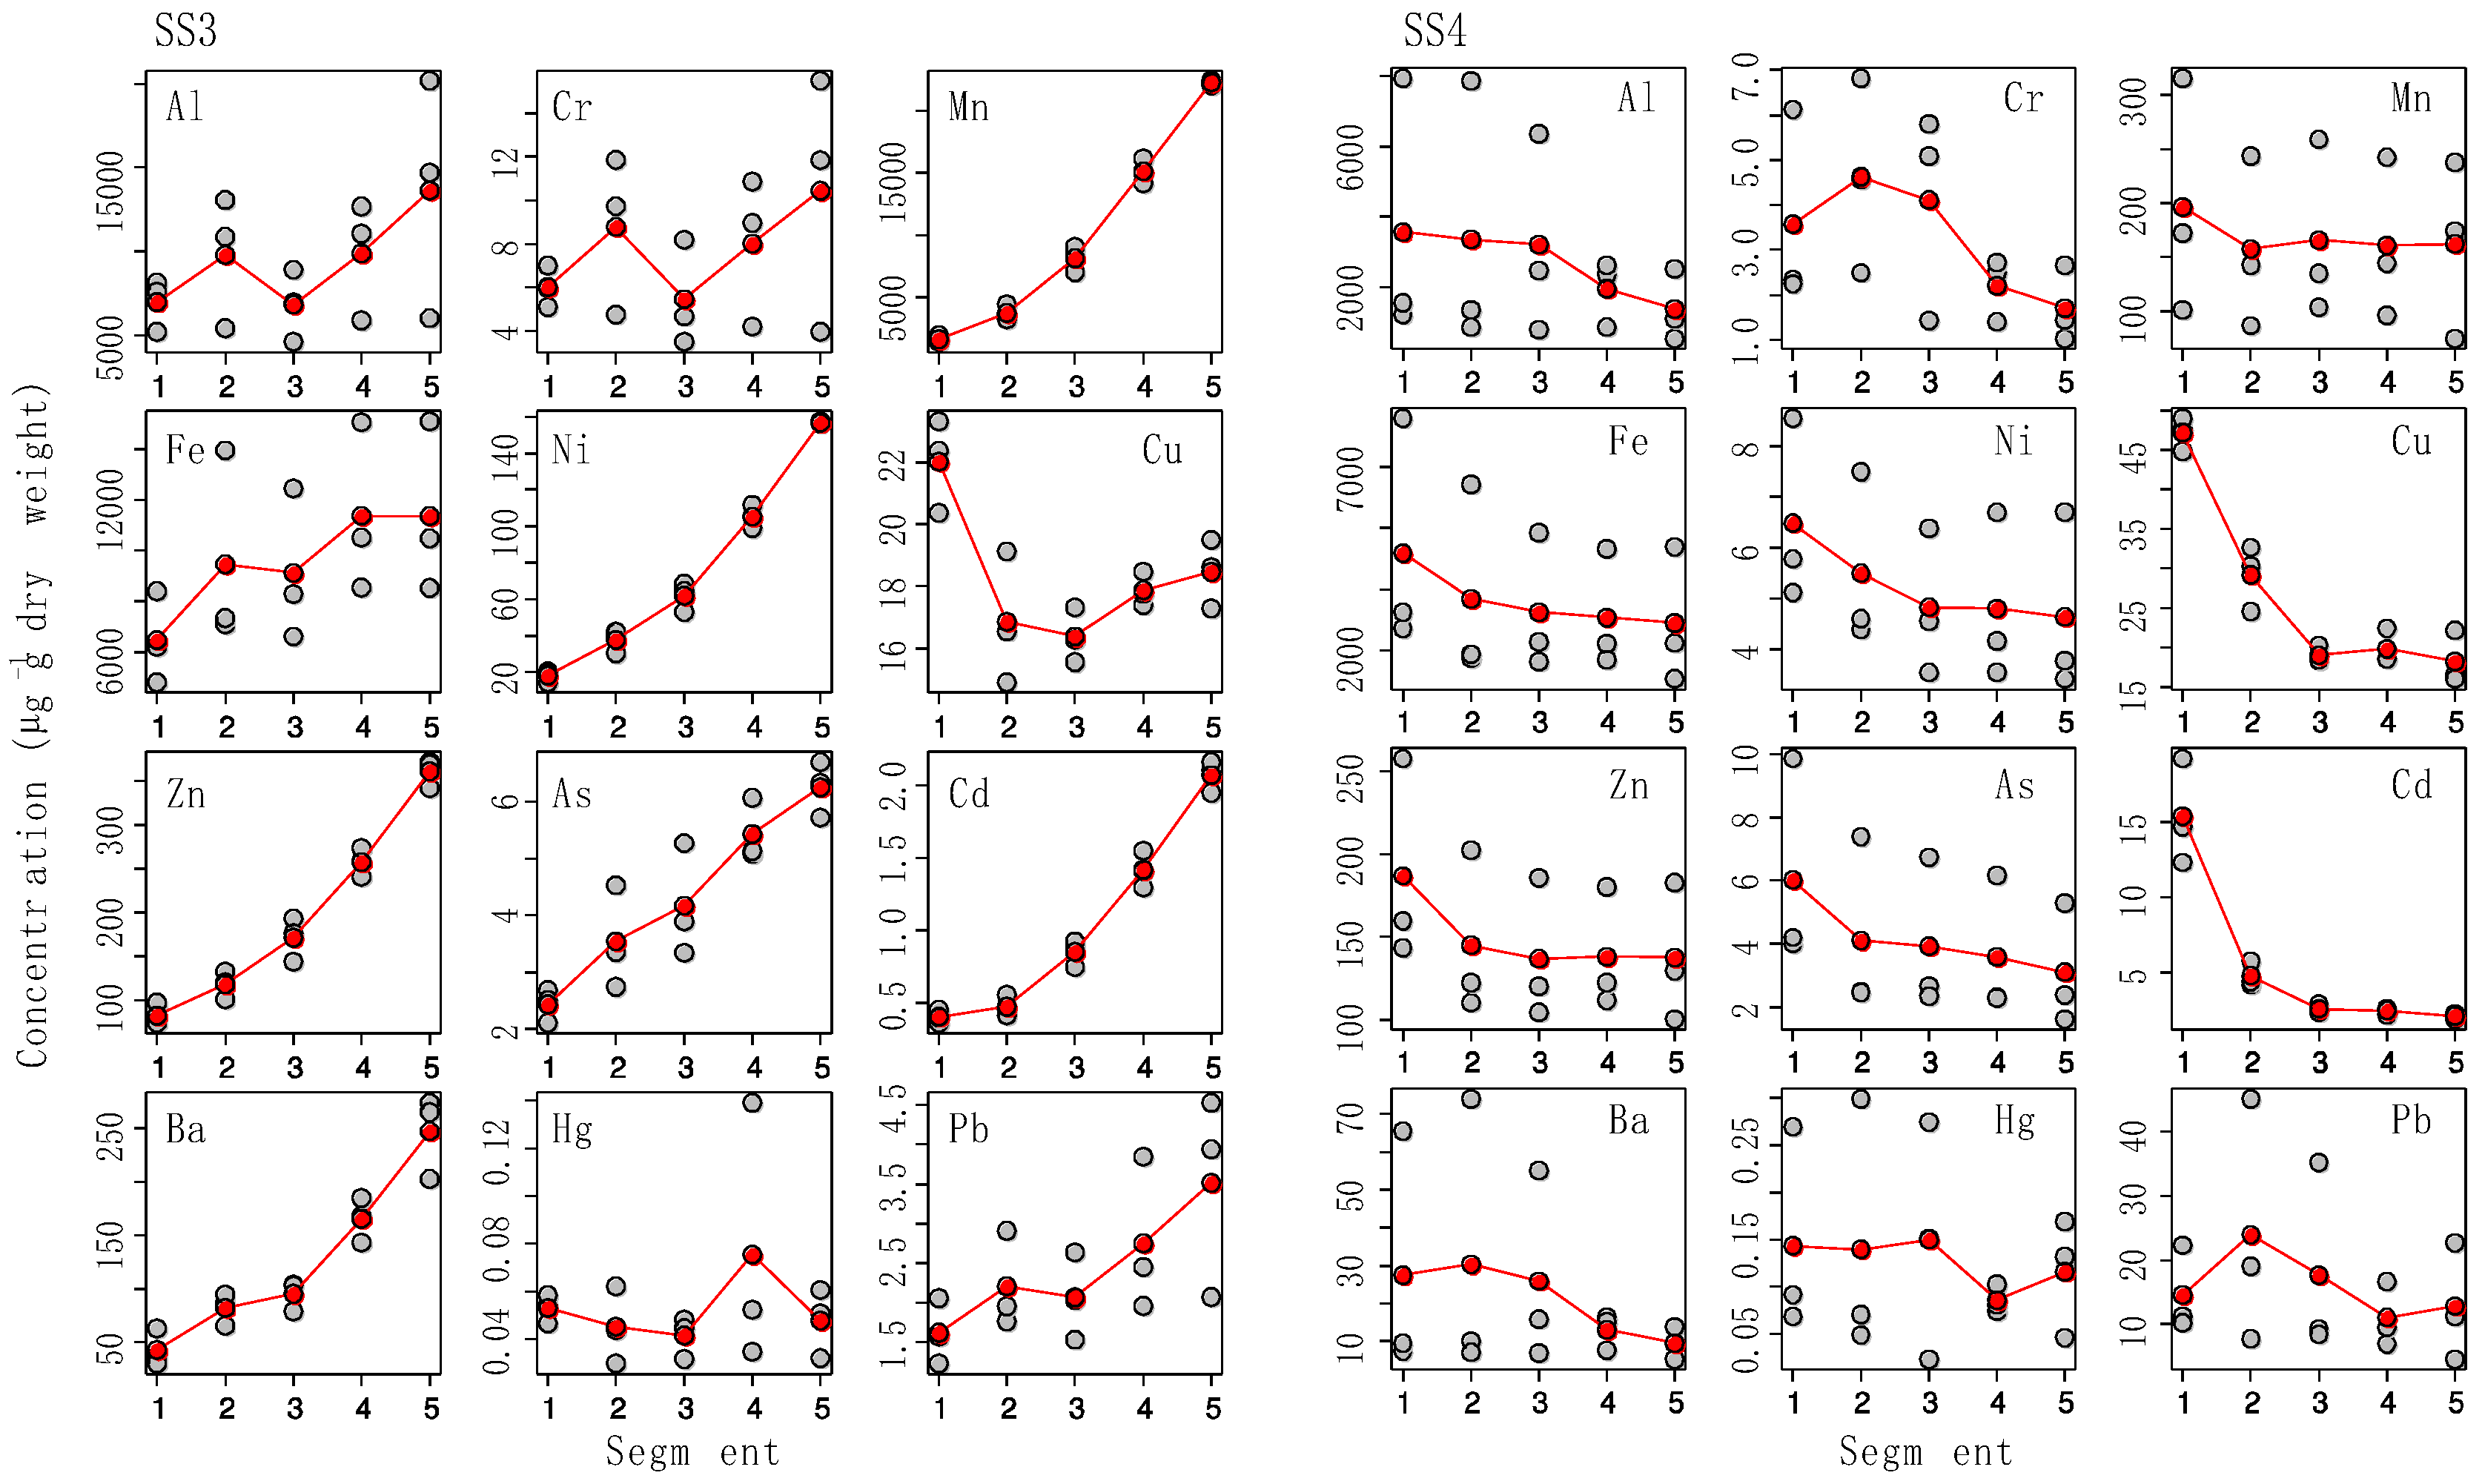
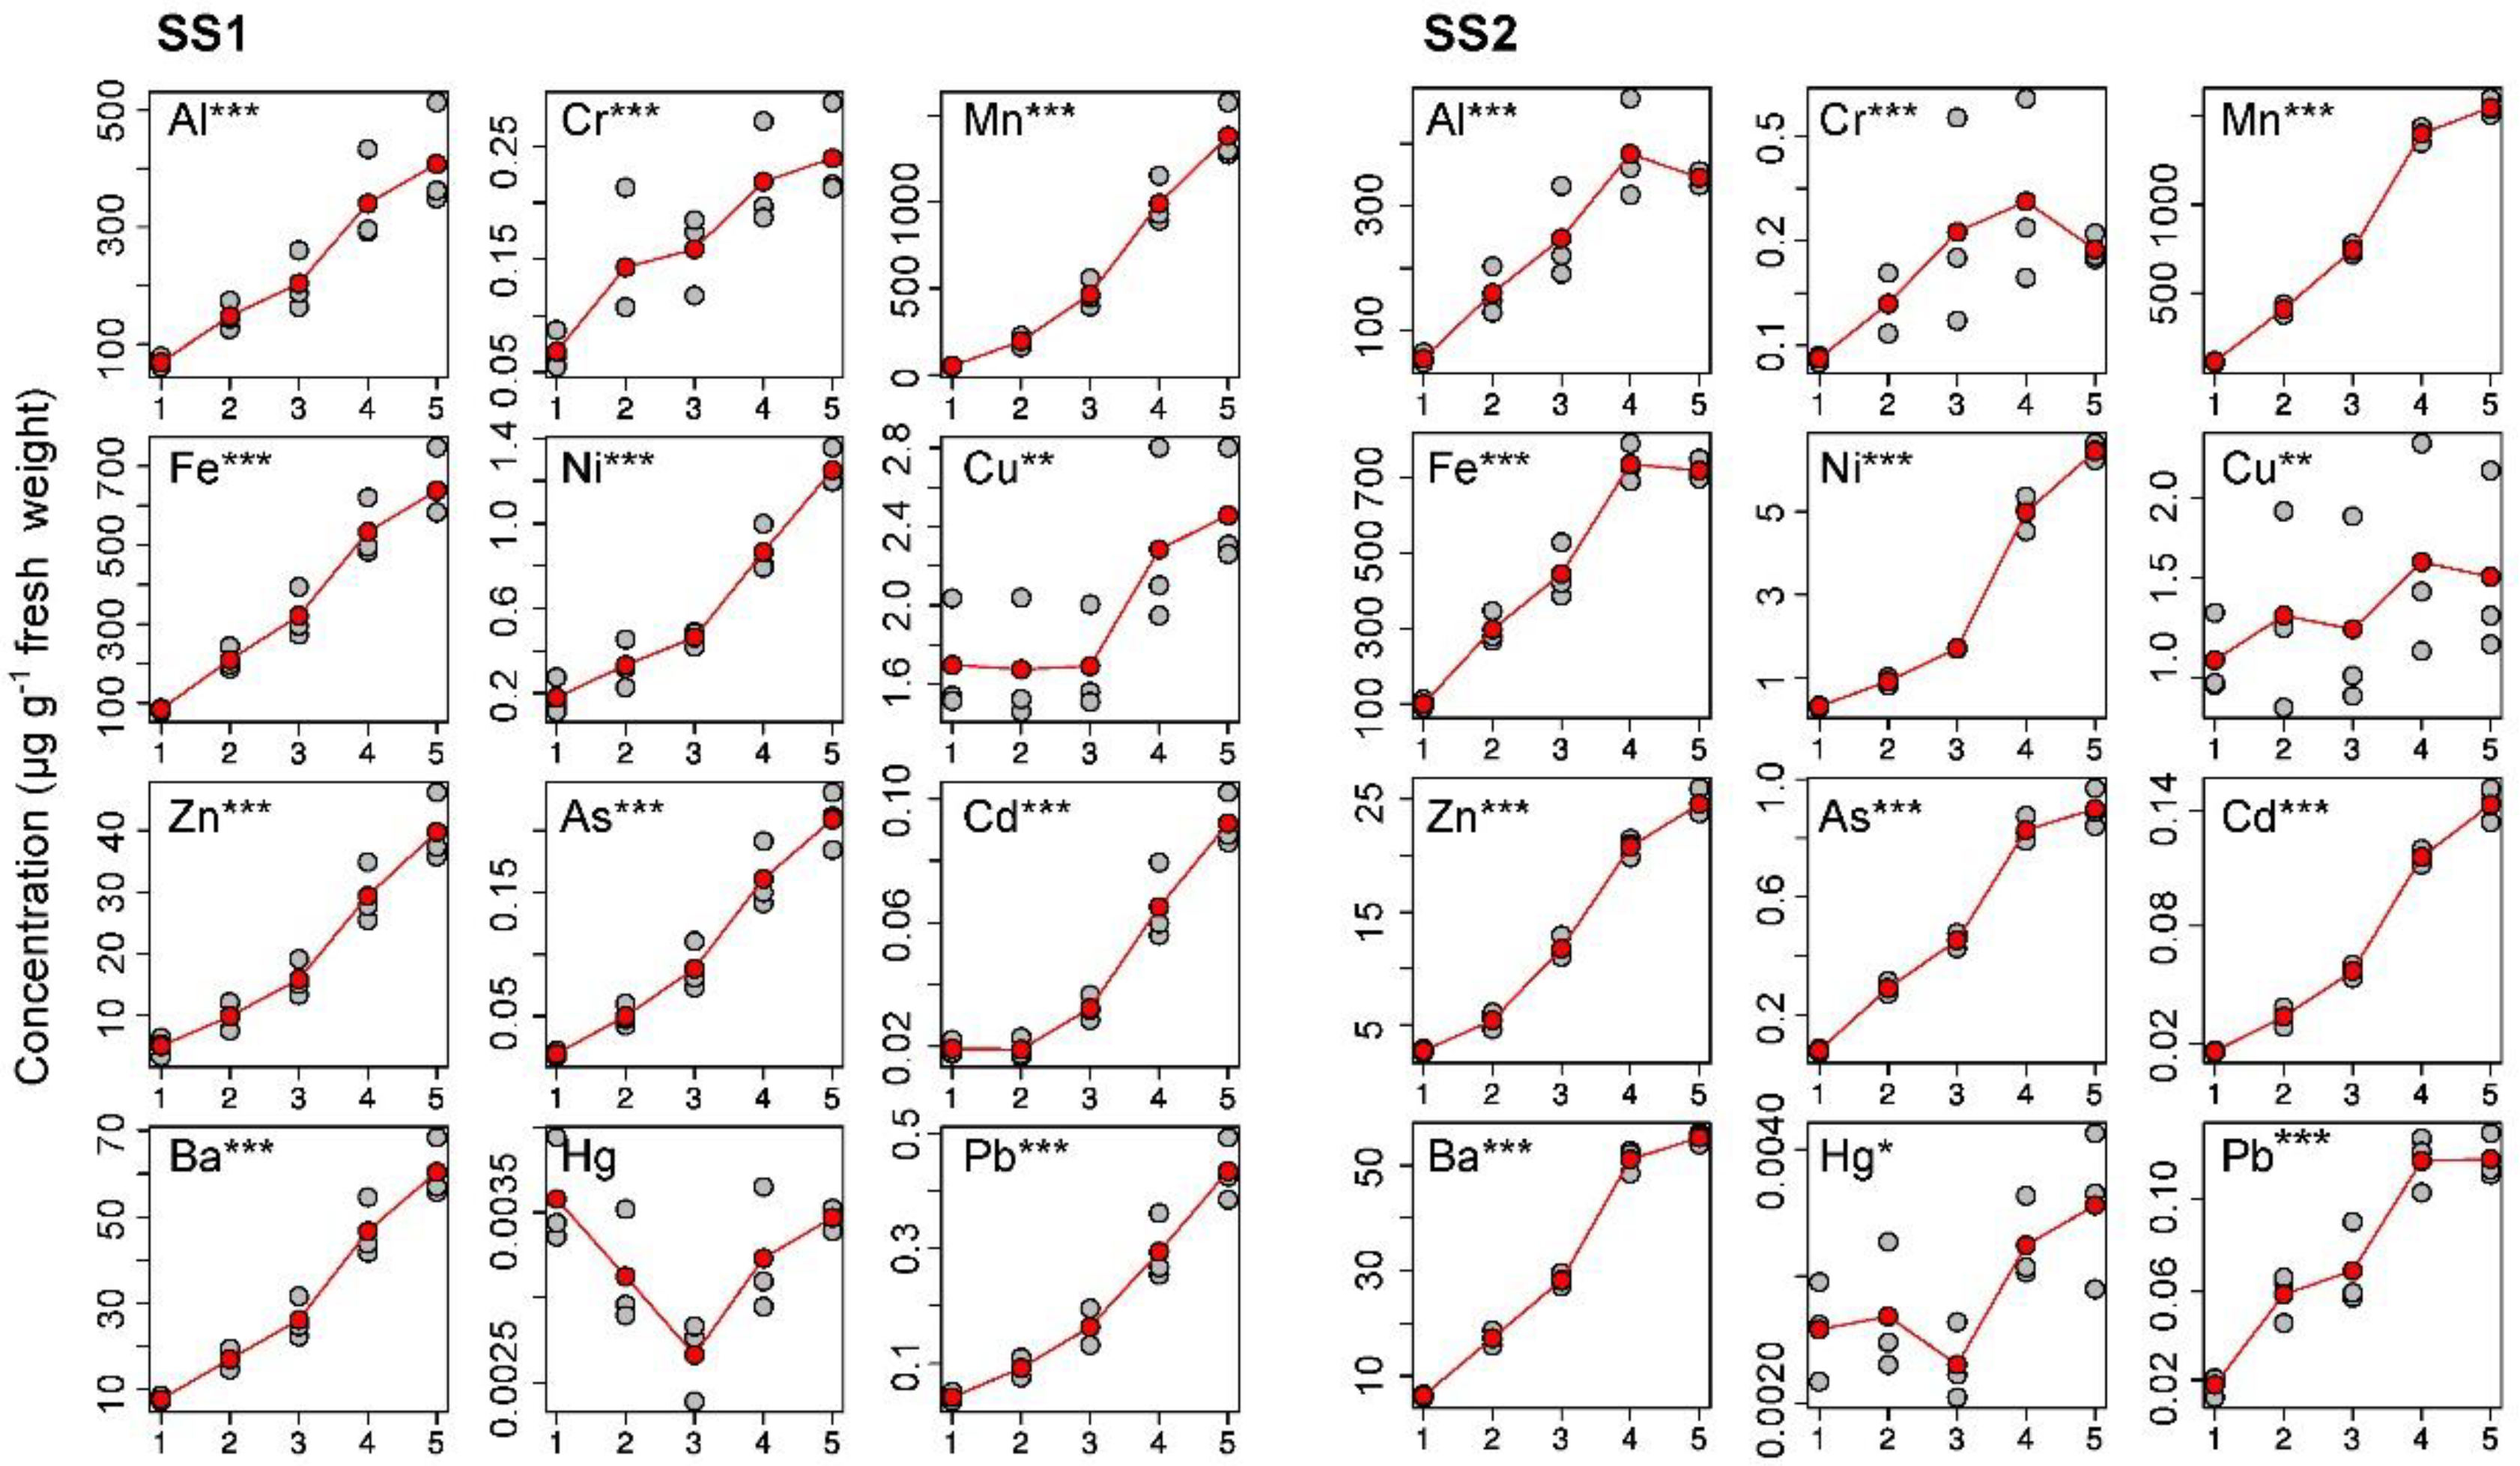
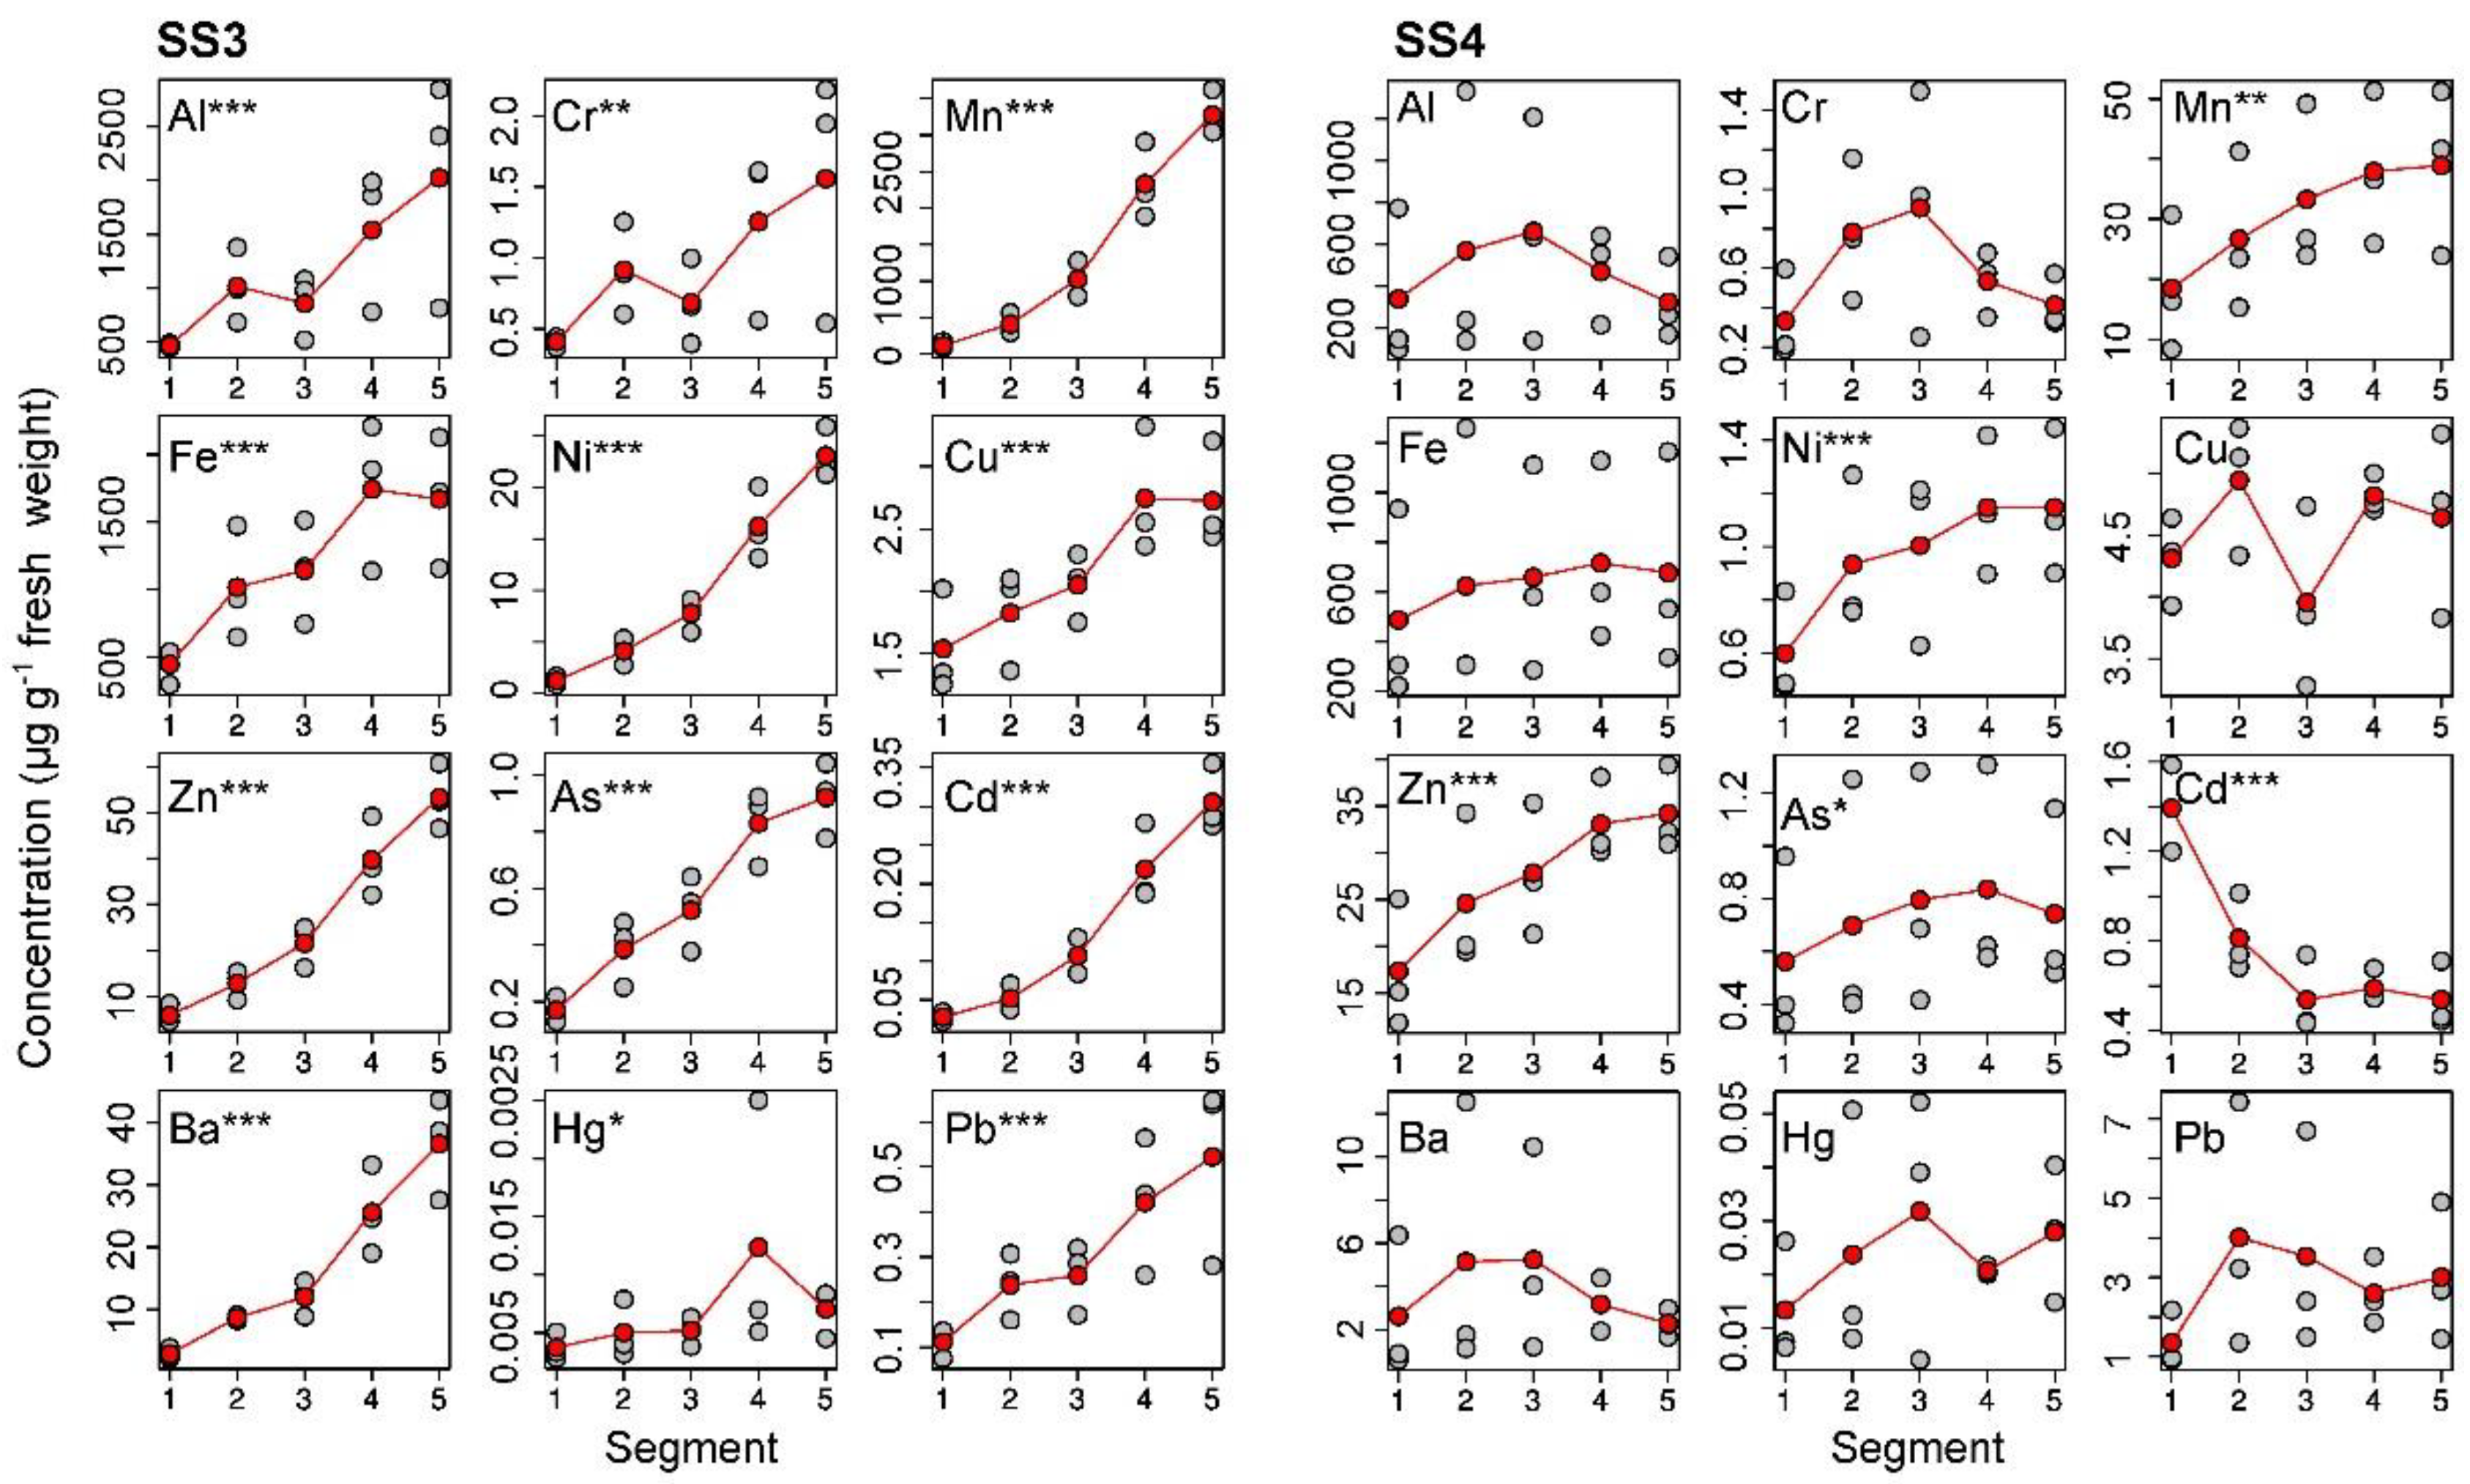
3.2. Trends in Element Concentration along the Shoots

We first considered the trends in dry weight concentrations (i.e., using dry weight as denominator, as usual) to determine whether they were stable or depended on the environmental conditions of each location. The results (Figure 3) showed that in moss samples from SS1-SS3, the concentrations of most of the elements increased from Segment 1 to 5, although Cu and Hg showed the opposite trend. In most cases the increases were gradual, and the curves did not show a limit in the accumulation process. Most elements in SS4 samples showed the reverse trend: the element concentrations decreased from the apical to basal parts of the shoots (Figure 3).
We suspected that these differences could be caused by the underlying trend in dry weight ratios. To verify this, we calculated the fresh weight element concentrations, which are shown in Figure 4. The descending trends turned into increasing ones in most cases, only the trend for Cd in SS4 remained as descending. We estimated the significance of these trends by calculating Kendall’s τ correlation coefficient for each combination SS/element and testing them against τ = 0 (Table S1). The correlations were significant and positive for all elements in SS1–SS3, except for Hg in SS1, and for Mn, Ni, Zn, Cd and As in SS4.

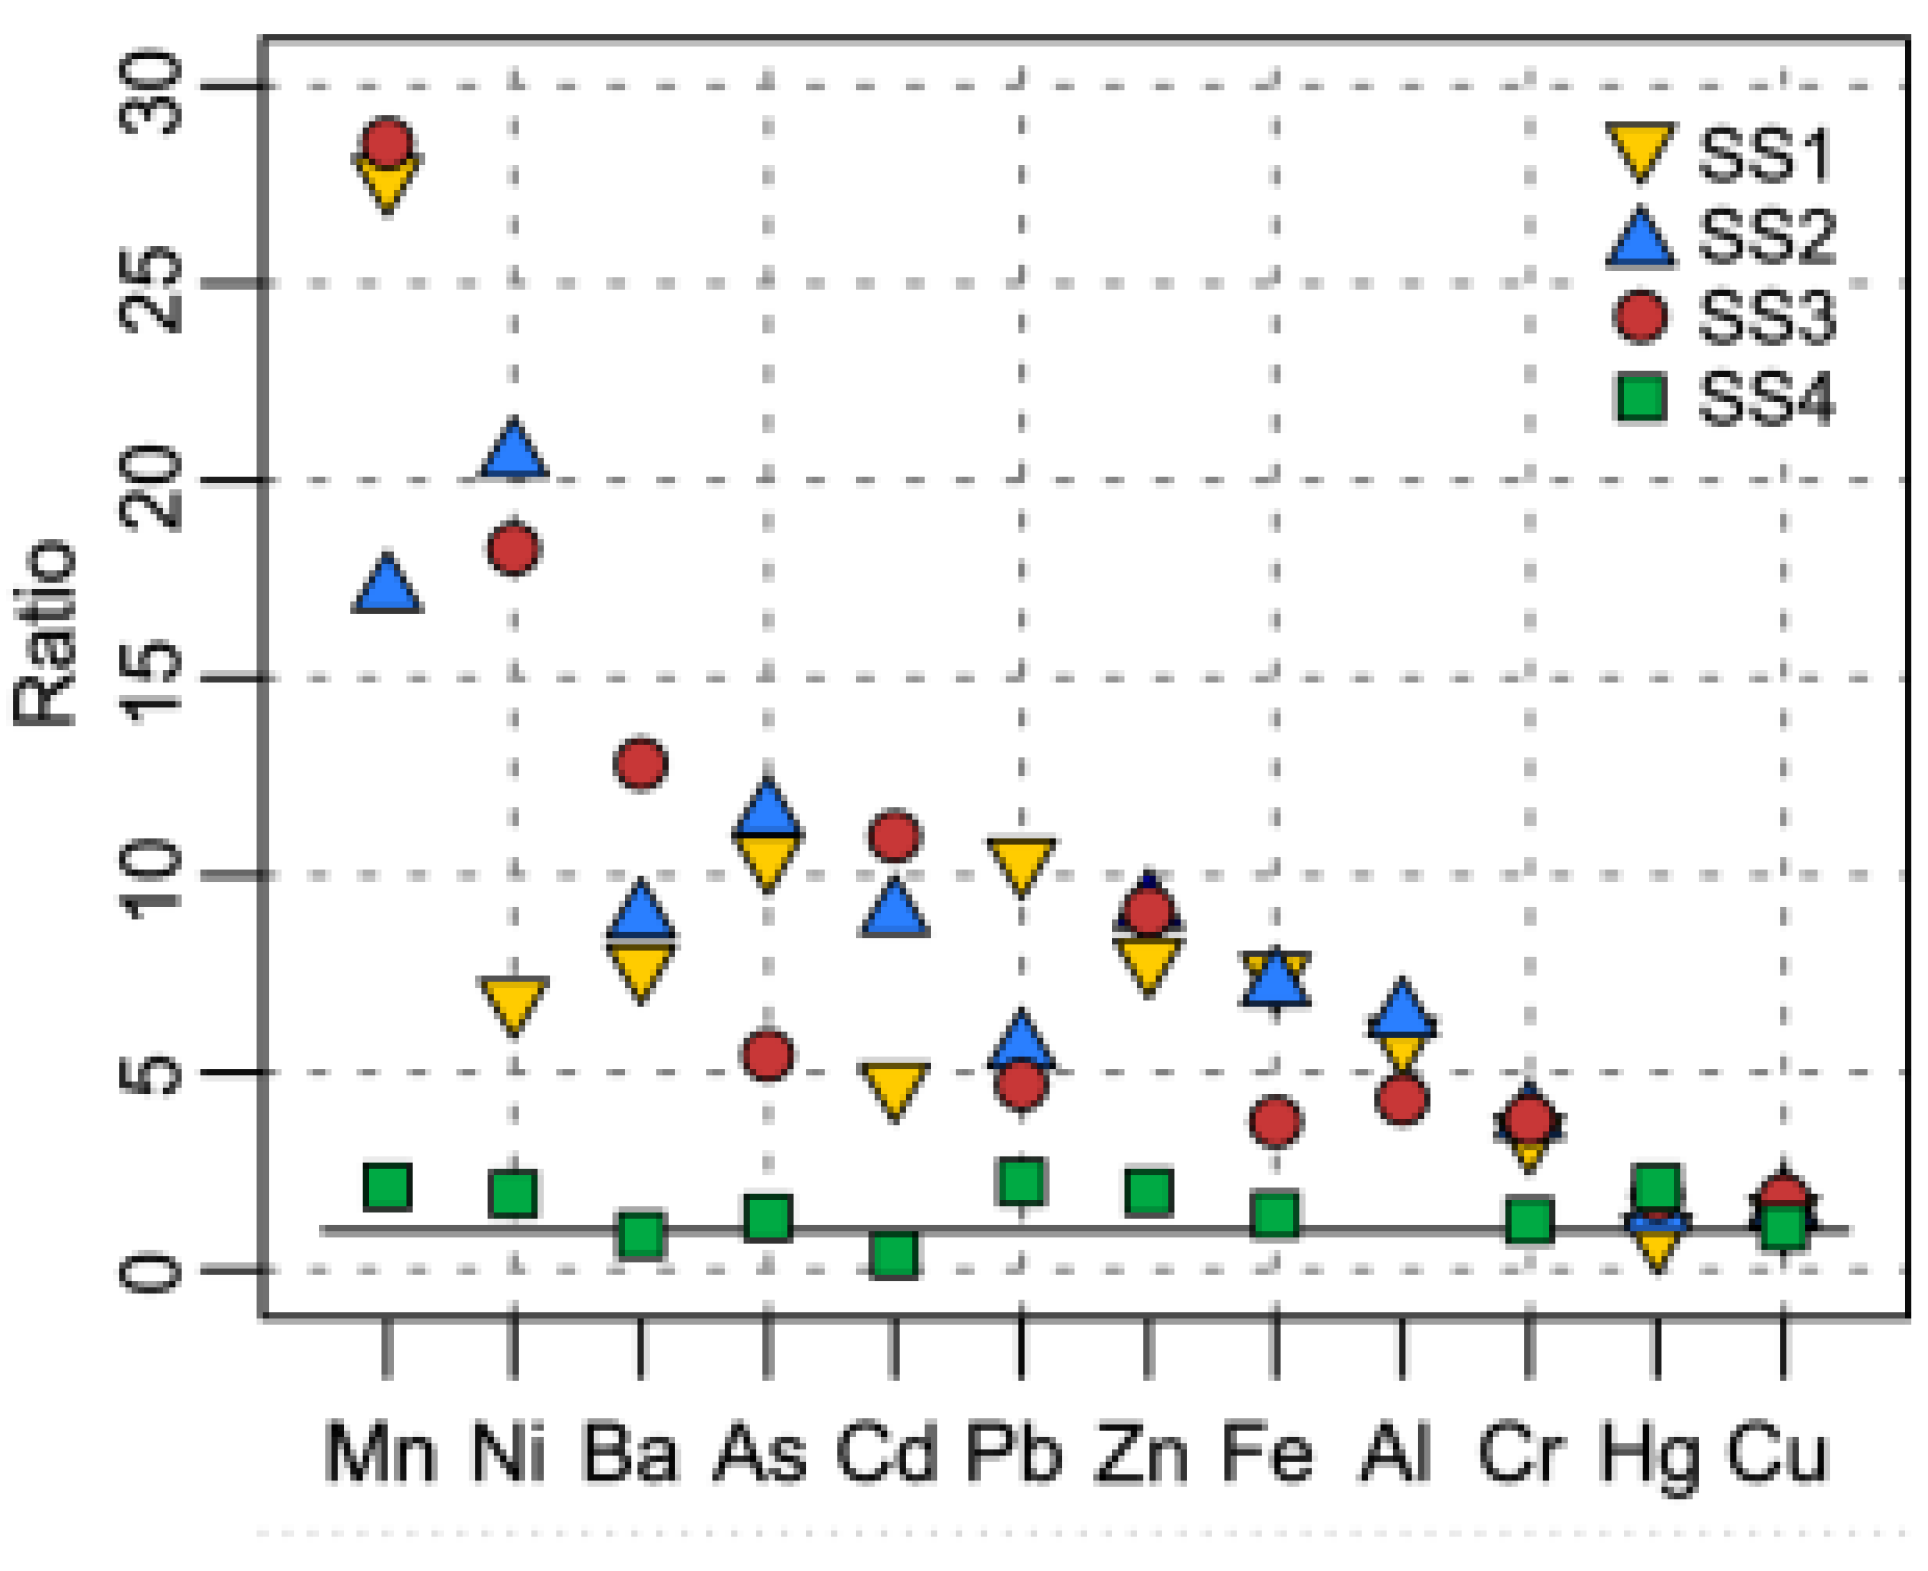
3.3. Covariation of Elements

The trends for most elements seemed to be similar for each SS. To verify this, we calculated the Kendall correlations between the concentrations of elements at each station and tested their significances (Table S2). We used fresh weight concentrations for this analysis to eliminate the distortions caused by the trends in dry weight ratio commented above. The concentrations of most elements were significantly and positively correlated (p < 0.05) with the exceptions of Cu (SS2, SS4), Hg (SS1) and Cd (SS4). The fact that most trace elements covaried with Mn and Fe in SS1-SS3 suggests that coprecipitation and adsorption on the Mn/Fe oxides deposited on the moss surface could be a cause of the observed correlations. To clarify the role of these two elements, we estimated the ratios between the mean concentrations in the 5th and the 1st segments, for the 12 elements analysed. The results are shown in Figure 5.
Mn usually showed the largest increases in concentration, but Fe showed only slight increases. This suggests a more relevant role for Mn oxides. SS4 showed slight increases for all elements and some decreased, as commented before.

4. Discussion

4.1. Trends of Elements along the Shoots

A relevant finding in this study was the effect of the trend in the dry weight ratio along the shoot on the trend in element concentrations, especially when these were low. After elimination of the effect of the dry weight trend on the element concentrations, these increased steadily from Segment 1 to Segment 5 for most elements and SSs, with no apparent upper limit (Figure 4).
Other studies found similar increasing trends towards the shoot base in the concentrations of divalent cations (including macronutrients such as Ca or Mg) in F. antipyretica and other mosses [7,10,23,24]. The dry weight ratio increases because of the morphological change caused by the development of the shoots. The younger parts (Segment 1) have slender shoots and crowded leaves, but the shoots become thicker and the leaves sparser as the shoot develops. So, older parts have larger proportions of tough tissues and larger dry/fresh weight ratios. Previous studies [2] showed that the cell wall/cytoplasm ratio increases towards the old basal tissue. Such differences add to the overall morphological changes commented before to increase the dry weight/fresh weight ratio from apical to basal parts of the moss shoots (Figure 2). Morphological differences also caused the higher ratios measured in SS4. F. antipyretica is a morphologically variable species (most aquatic mosses are) and its morphology varies depending on environmental conditions [29,30]. The mosses from SS4 were longer, had thicker shoots and bigger leaves than the mosses from SS1-SS3. The descending trends observed in the dry weight concentrations in SS4 (Figure 3) were therefore caused by the differences in moss morphology. Changes in dry weight ratios had more influence on the results obtained in SS4 samples because these had low concentrations of most elements and showed the largest increases in dry weight ratios towards the shoot base.
Several factors might cause the observed concentration trends. The significant correlations between most elements and Mn and Fe suggest that coprecipitation and adsorption of these elements on the Mn/Fe oxides deposited on the moss surface could be one. It has been observed that both elements could form coatings on the leaves and stems, leading to increased adsorption and coprecipitation of other elements in the oxygen-rich surroundings of the leaves [7,13,15,31]. These precipitates appear in greater quantity in the basal parts of the moss shoots, and only in few cases in apical parts [32]. Basal shoot parts are older and thus have been in contact with water for longer than younger parts, enabling greater accumulation of elements in general [2,24] and Mn and Fe in particular.
In our study, the ratios between segments 5 and 1 (Figure 5) were large for Mn and small for Fe. In addition, the Mn concentrations were high in SS1 to 3 and much lower in SS4 (the overall means of the concentrations were: SS1 = 616, SS2 = 827, SS3 = 1431 and SS4 = 31 µg g−1 (f. w.) Mn), while the concentrations of Fe were similar in all SS (SS1 = 357, SS2 = 459, SS3 = 1203, SS4 = 633 µg g−1 (f. w.) Fe). Therefore, the role of Fe seems to be secondary at most, with Mn being more important.
Another factor to consider is that differences at cellular and tissue level influence the distribution of elements along the shoot. The elements analysed in this study join preferentially to cation binding sites that are located on the wall and outer face of the cell membrane [33,34]. It has been observed that older leaves had greater permeability and access to interior cell wall binding sites than younger leaves [2]. The cation exchange capacity (CEC) of the older parts of the shoots will therefore be higher, as well as the concentration of elements bound to these cation exchange sites [4,16].

4.2. Shoot Length Selection

All these mechanisms can be present simultaneously and collaborate to produce the observed trends, but it was not our aim to assess their particular contributions. We studied the trends to find whether they could help in selecting a shoot length.
For most elements, the increasing trends in concentration did not show important discontinuities or levelling towards the shoot base. In relation to our objectives, this has two consequences. First, any decisions about the optimal length of shoot segment based on the pattern of concentrations will be arbitrary. Second, the decision will have a very important influence on the concentration measured. Longer segments will yield higher concentrations, and therefore, studies using shoot segments of different lengths would not be comparable, making standardisation of length necessary. We therefore recommend using 3 cm-long apical segments, based on the following practical criteria:
(1)
The change in dry weight beyond this length of segment is small, which indicates the stabilisation of the morphological characteristics and moss development from that point. In this way, the youngest part of the moss is used in the analysis
(2)
Using segments shorter than 3 cm increases the workload and the quantity of material to collect in the river. Reducing the impact of research on target populations is important, especially if conducting periodic and long-term sampling. In extensive studies, many samples are usually collected in a short time, and reducing the per sample work effort is a necessity.
(3)
Most previous studies have used shoot segments between 2 and 3 cm-long [17], and the use of 3 cm-long segments would therefore enable valid comparisons with these studies, which is an important advantage. Also, the last 3 cm apical segment has been frequently used for moss biomonitoring in terrestrial environments [35,36].
Using a standard shoot length does not eliminate the variability caused by differences in growth rate associated with the environmental conditions to which the mosses are exposed, or by the differences that may exist in the rate of deposition of Mn oxides. However, it would at least reduce that variability and would improve the comparability of the data.
Although this study focused on the patterns of concentration along the moss shoots, the results showed the important role of Mn in the accumulation of other elements, so Mn concentrations should be routinely measured in monitoring studies in freshwater ecosystems. The comparison could probably be improved by considering that the concentrations of this element in the tissues could be used as a standard against which to normalise the concentrations of other elements.

Supplementary Materials

The following are available online at https://www.mdpi.com/2073-4441/12/9/2389/s1, Table S1. Kendall correlations between position on the shoot and fresh weight concentrations of the elements. Table S2. Kendall correlations between elements (fresh weight concentrations).

Author Contributions

Conceptualization, M.D.V., C.R. and R.V.; formal analysis, C.R.; investigation, M.D.V., C.R. and R.V.; writing—original, M.D.V.; writing—review and editing, C.R. and R.V.; visualization, M.D.V.; project administration, C.R. All authors have read and agree to the published version of the manuscript.

Funding

This research was funded by MINECO project CTM2015-70578-P. The authors belong to the Galician Competitive Research Group GRC/GPC2016-002 and to the CRETUS Strategic Partnership (AGRUP2015/02). All these programs are co-funded by FEDER (EU).

Acknowledgments

The authors are very grateful to Veronica Fernández González and Marta Rodríguez Fernández for valuable assistance in the laboratory. The comments of three anonymous reviewers helped to improve the manuscript.

Conflicts of Interest

The authors declare that there are no conflicts of interest regarding the publication of this paper. The funders had no role in the design of the study; in the collection, analyses, or interpretation of data; in the writing of the manuscript, or in the decision to publish the results.

References

  1. Benson-Evans, K.; Williams, P.F. Transplanting aquatic bryophytes to assess river pollution. J. Bryol. 1976, 9, 81–91. [Google Scholar] [CrossRef]
  2. Glime, J.M. Effects of pollutants on aquatic species. In Bryophytes and Lichens in a Changing Environment; Bates, W., Farmer, A.M., Eds.; University Press: Oxford, UK, 1992; pp. 333–361. [Google Scholar]
  3. Cenci, R.M. The use of aquatic moss (Fontinalis antipyretica) as monitor of contamination in standing and running waters: Limits and advantages. J. Limnol. 2000, 60 (Suppl. 1), 53–61. [Google Scholar] [CrossRef]
  4. Zechmeister, H.G.; Grodzinska, K.; Szarek-Lukaszewska, G. Bryophytes. In Bioindicators and Biomonitors; Markert, B.A., Breure, A.M., Zechmeister, H.G., Eds.; Elsevier Science Ltd.: Amsterdam, The Netherlands, 2003; pp. 329–375. [Google Scholar]
  5. Ceschin, S.; Aleffi, M.; Bisceglie, S.; Savo, V.; Zuccarello, V. Aquatic bryophytes as ecological indicators of the water quality status in the Tiber River basin (Italy). Ecol. Indic. 2012, 14, 74–81. [Google Scholar] [CrossRef]
  6. Say, P.J.; Whitton, B.A. Accumulation of heavy metals by aquatic mosses. 1: Fontinalis antipyretica Hedw. Hydrobiologia 1983, 100, 245–260. [Google Scholar] [CrossRef]
  7. Siebert, A.; Bruns, I.; Krauss, G.J.; Miersch, J.; Markert, B. The use of the aquatic moss Fontinalis antipyretica L. ex Hedw. as a bioindicator for heavy metals. Sci. Total Environ. 1996, 177, 137–144. [Google Scholar] [CrossRef]
  8. Mersch, J.; Claveri, B. Les Bryophytes Aquatiques Comme Outil de Surveillance de la Contamination des Eaux Courantes par les Micropolluants Métalliques: Modalités D’interprétation des Données; [Aquatic bryophytes as a tool for surveillance of flowing water pollution with metallic micropollutants: Types of data interpretation] Etude Inter-Agences No. 55; Agences de l’Eau, Ministère de l’Environnement, Université de Metz: Metz, France, 1998; p. 145. [Google Scholar]
  9. Burton, M.A.S.; Peterson, P.J. Metal accumulation by aquatic bryophytes from polluted mine streams. Environ. Pollut. 1979, 19, 37–46. [Google Scholar] [CrossRef]
  10. Whitton, B.A.; Say, P.J.; Jupp, B.P. Accumulation of zinc, cadmium and lead by the aquatic liverwort Scapania. Environ. Pollut. (Ser. B) 1982, 3, 299–316. [Google Scholar] [CrossRef]
  11. Mouvet, C.; Morhain, E.; Sutter, C.; Couturieux, N. Aquatic mosses for the detection and follow-up of accidental discharges in surface waters. Water Air Soil Pollut. 1993, 66, 333–348. [Google Scholar] [CrossRef]
  12. Vázquez, M.D.; Wappelhorst, O.; Markert, B. Determination of 28 elements in aquatic moss Fontinalis antipyretica Hedw and water from the upper reaches of the river Nysa (CZ, D) by ICP-MS and AAS. Water Air Soil Pollut. 2004, 152, 153–172. [Google Scholar] [CrossRef]
  13. Tipping, E.; Vincent, C.D.; Lawlor, A.J.; Lofts, S. Metal accumulation by stream bryophytes, related to chemical speciation. Environ. Pollut. 2008, 156, 936–943. [Google Scholar] [CrossRef]
  14. Cesa, M.; Bizzotto, A.; Ferraro, C.; Fumagalli, F.; Nimis, P.L. Palladio, an index of trace element alteration for the river Bacchioglione based on Rhynchostegium riparioides moss bags. Water Air Soil Pollut. 2010, 208, 59–77. [Google Scholar] [CrossRef]
  15. Wehr, J.D.; Empain, A.; Mouvet, C.; Say, P.J.; Whitton, B.A. Methods for processing aquatic mosses used as monitors of heavy metals. Water Res. 1983, 17, 985–992. [Google Scholar] [CrossRef]
  16. Brown, D.H.; Brown, R.M. Reproducibility of sampling for element analysis using bryophytes. In Element Concentration Cadaster in Ecoystems: Methods of Assessment and Evaluation; Lieth, H., Markert, B.A., Eds.; VCH Publishers: Weinheim, Germany, 1990. [Google Scholar]
  17. Debén, S.; Aboal, J.R.; Carballeira, A.; Cesa, M.; Real, C.; Fernández, J.A. Inland water quality monitoring with native bryophytes: A methodological review. Ecol. Indic. 2015, 53, 115–124. [Google Scholar] [CrossRef]
  18. Gecheva, G.; Yurukova, L.; Ganeva, A. Assessment of pollution with aquatic bryophytes in Maritsa River (Bulgaria). Bull. Environ. Contam. Toxicol. 2011, 87, 480–485. [Google Scholar] [CrossRef] [PubMed]
  19. Kosior, G.; Samecka-Cymerman, A.; Kolon, K.; Brudzińska-Kosior, A.; Bena, W.; Kempers, A.J. Trace elements in the Fontinalis antipyretica from rivers receiving sewage of lignite and glass sand mining industry. Environ. Sci. Pollut. Res. 2015, 22, 9829–9838. [Google Scholar] [CrossRef] [Green Version]
  20. Pokorny, P.; Pokorny, J.; Dobicki, W.; Senze, M.; Kowalska-Góralska, M. Bioaccumulations of heavy metals in submerged macrophytes in the mountain river Biała Lądecka (Poland, Sudety Mts.). Arch. Environ. Prot. 2015, 41, 81–90. [Google Scholar] [CrossRef] [Green Version]
  21. Favas, P.J.C.; Pratas, J.; Rodrigues, N.; D’Souza, R.; Varun, M.S.; Paul, M. Metal(loid) accumulation in aquatic plants of a mining area: Potential for water quality biomonitoring and biogeochemical prospecting. Chemosphere 2018, 194, 158–170. [Google Scholar] [CrossRef]
  22. Vásquez, C.; Calva, J.; Morocho, R.; Donoso, D.A.; Benítez, A. Bryophyte communities along a tropical urban river respond to heavy metal and arsenic pollution. Water 2019, 11, 813. [Google Scholar] [CrossRef] [Green Version]
  23. Wehr, J.D.; Whitton, B.A. Accumulation of heavy metals by aquatic mosses. 2: Rhynchostegium riparioides. Hydrobiologia 1983, 100, 261–284. [Google Scholar] [CrossRef]
  24. Martínez-Abaigar, J.; García-Álvaro, M.A. Combined seasonal and longitudinal variations of element concentrations in two aquatic mosses (Fontinalis antipyretica and F. squamosa). Nova Hedwig. 2002, 74, 349–364. [Google Scholar] [CrossRef]
  25. Brown, D.H. Uptake of mineral elements and their use in pollution monitoring. In The Experimental Biology of Bryophytes; Dyer, F.A., Duckett, J.G., Eds.; Academic Press: London, UK, 1984; pp. 229–255. [Google Scholar]
  26. Steinnes, E.; Rühling, Å.; Lippo, H.; Mäkinen, A. Reference materials for large-scale metal deposition surveys. Accredit. Qual. Assur. 1997, 2, 243–249. [Google Scholar] [CrossRef]
  27. Kendall, M.G.; Gibbons, J.D. Rank Correlation Methods, 5th ed.; Edward Arnold: London, UK, 1990. [Google Scholar]
  28. R Core Team. R: A Language and Environment for Statistical Computing; R Foundation for Statistical Computing: Vienna, Austria, 2018. [Google Scholar]
  29. Welch, W.H. A Monograph of the Fontinalaceae; Martinus Ninjhoff: The Hague, The Netherlands, 1960; p. 357. [Google Scholar]
  30. Flora Briofítica Ibérica; Guerra, J.M.; Brugués, M.; Cros, R.M. (Eds.) Universidad de Murcia; Sociedad Española de Briología: Murcia, Spain, 2014; Volume V, p. 261. [Google Scholar]
  31. Vincent, C.D.; Lawlor, A.J.; Tipping, E. Accumulation of Al, Mn, Fe, Cu, Zn, Cd and Pb by the bryophyte Scapania undulata in three upland waters of different pH. Environ. Pollut. 2001, 114, 93–100. [Google Scholar] [CrossRef]
  32. Sérgio, C.; Figueira, R.; Viegas Crespo, A.M. Observations of heavy metal accumulation in the cell walls of Fontinalis antipyretica, in a Portuguese stream affected by mine effluent. J. Bryol. 2000, 22, 251–255. [Google Scholar] [CrossRef]
  33. Nieboer, E.; Richardson, D.H.S. Lichens as monitors of atmospheric deposition. In Atmospheric Pollutants and Natural Waters; Eisenreich, S.J., Ed.; Ann Arbor Science: Ann Arbor, MI, USA, 1981; pp. 339–388. [Google Scholar]
  34. Vázquez, M.D.; López, J.; Carballeira, A. Uptake of heavy metals to the extracellular and intracellular compartments in three species of aquatic bryophyte. Ecotoxicol. Environ. Saf. 1999, 44, 12–24. [Google Scholar] [CrossRef] [PubMed]
  35. Carballeira, C.B.; Aboal, J.R.; Fernández, J.A.; Carballeira, A. Comparison of the accumulation of elements in two terrestrial moss species. Atmos. Environ. 2008, 42, 4904–4917. [Google Scholar] [CrossRef]
  36. Carvajal, B.; Aboal, J.R.; Fernández, J.A.; Real, C.; Carballeira, A. Influence of roads and inhabited areas on metal concentrations in terrestrial mosses. Atmos. Environ. 2010, 44, 3432–3441. [Google Scholar] [CrossRef]
Figure 1. Locations of the four sampling stations in NW Spain.
Water 12 02389 g001
Figure 2. Dry/fresh weight ratio in the five 1 cm apical segments of F. antipyretica samples from the four sampling stations (SS). Segments are numbered from 1 to 5, starting at the shoot tip. The colored symbols are the means of the three replicates of the SS × segment combinations.
Water 12 02389 g002
Figure 3. Element concentrations per dry weight in the shoot segments of each SS. Segments are numbered from 1 to 5, starting at the shoot tip. The red symbols are the means of the three replicates.
Water 12 02389 g003aWater 12 02389 g003b
Figure 4. Element concentrations per fresh weight in the shoot segments of each SS. Segments are numbered from 1 to 5, starting at the shoot tip. Symbols as in Figure 3. Asterisks indicate the significance of the Kendall correlation between concentrations and segment number: * p ≤ 0.05; ** p ≤ 0.01; *** p ≤ 0.001.
Water 12 02389 g004aWater 12 02389 g004b
Figure 5. Ratios fresh weight concentration in Segment 5 (the most basal)/fresh weight concentration in Segment 1 (the most apical) in the shoots of F. antipyretica. The line at the bottom is at ratio = 1.
Water 12 02389 g005
Table 1. Measured, certified and recommended values of four samples of M2 reference material. All values in µg g−1.
ElementMeasured (n = 4)Certified
MeanSD% Recov.MeanSD
Al201.341.4119169 *10 *
Cr0.240.03350.670.19
Mn59351111535 *30 *
Fe1521711013812
Ni0.690.06730.950.08
Cu2.780.23743.760.23
Zn23.31.59225.41.1
As0.1120.0251070.1050.007
Cd0.0860.004810.1060.005
Ba12.40.69013.70.6
Hg0.0440.0051260.0350.004
Pb2.630.17793.330.25
* Recommended values.

