Article

Multi-Tissue Transcriptome Study of Innate Immune Gene Expression Profiling Reveals Negative Energy Balance Altered the Defense and Promoted System Inflammation of Dairy Cows

1
College of Animal Science, Inner Mongolia Agricultural University, Hohhot 010018, China
2
Veterinary Research Institute, Inner Mongolia Academy of Agricultural and Animal Husbandry Sciences, Hohhot 010031, China
3
College of Veterinary Medicine, Inner Mongolia Agricultural University, Hohhot 010018, China
4
School of Agriculture, Ningxia University, Yinchuan 750021, China
5
Inner Mongolia Engineering Research Center of Genomic Big Data for Agriculture, Hohhot 010018, China
6
College of Life Science, Inner Mongolia Agricultural University, Hohhot 010018, China
*
Authors to whom correspondence should be addressed.
Vet. Sci. 2023, 10(2), 107; https://doi.org/10.3390/vetsci10020107
Submission received: 13 December 2022 / Revised: 26 January 2023 / Accepted: 28 January 2023 / Published: 1 February 2023
(This article belongs to the Special Issue Genetic Analysis in Domestic Animal Breeds and Performance)

Abstract

:

Simple Summary

The perinatal period is very important for dairy cows. Dairy cows have higher energy and nutrient requirements during pregnancy and lactation than they do during the rest of their lives because of physiological changes like fast growth and uterine development. As a result, high-yielding dairy cows frequently experience severe negative energy balance (NEB) during the perinatal period. This NEB causes metabolic and immunological abnormalities in dairy cows, which in turn causes systemic inflammation and reduced resilience. In this study, transcriptome data from multiple tissues were utilized to analyze the impacts of NEB on innate immune genes, as well as the mechanism underlying the alteration of the ’host defense and systemic inflammation. According to studies, NEB downregulates the defensive function of innate immune genes in the endometrium, resulting in lower defense capability, upregulation of defense and inflammatory responses in other tissues, activation of systemic defense responses, and promotion of systemic inflammation. These findings provide crucial clues for the diagnosis and prevention of systemic inflammation brought upon by perinatal NEB.

Abstract

Negative energy balance (NEB) during the perinatal period leads to metabolic and immunological disorders in dairy cows, resulting in systemic responses and inflammation. The innate immune system is crucial for the host’s protection and inflammatory response. However, systematic research is still lacking on how NEB affects the innate immune system to alter the ’host defense capability and inflammatory response. In this investigation, raw transcriptome data of adipose, blood, endometrial, hypothalamus, and liver tissues were downloaded from a public database, cleaned, aligned, quantified, and batch-corrected. The innate immune gene list was retrieved from innateDB, followed by the expression matrix of innate immune genes in various tissues for differential expression analysis, principle component analysis (PCA), and gene set enrichment analysis (GSEA). Under the effect of NEB, adipose tissue had the most differentially expressed genes, which were predominantly up-regulated, whereas blood GSEA had the most enriched biological processes, which were predominantly down-regulated. The gene sets shared by different tissues, which are predominantly involved in biological processes associated with defense responses and inflammation, were dramatically down-regulated in endometrial tissues and highly up-regulated in other tissues. Under the impact of NEB, LBP, PTX3, S100A12, and LCN2 play essential roles in metabolism and immunological control. In conclusion, NEB can downregulate the defensive response of innate immune genes in endometrial, upregulate the immune and inflammatory response of other tissues, activate the host defense response, and increase the systemic inflammatory response. The analysis of the effects of NEB on innate immune genes from the multiple tissues analysis provides new insights into the crosstalk between metabolism and immunity and also provides potential molecular targets for disease diagnosis and disease resistance breeding in dairy cows.

1. Introduction

The perinatal period is one of the most crucial physiological stages for dairy cows. Due to physiological changes such as rapid fetal growth, parturition, and lactation, the demand for energy and nutrition increases while the appetite and feed intake of dairy cows decrease. This is why dairy cows generally experience different levels of negative energy balance (NEB) during the perinatal period, with high-yielding dairy cows frequently experiencing severe negative energy balance [1,2]. Despite the action of homeostatic mechanisms to maintain blood parameters within physiologic levels, changes in metabolites and hormones occur as a result of increased metabolic demands in lactating animals. These changes are not necessarily indicative of diseases but make animals physiologically unstable and more susceptible to a number of metabolic diseases at this stage than during other life periods compromising productivity [3,4]. In particular, dairy cattle are predisposed to sickness at any time, especially after calving and during early lactation [5]. Due to energy shortage, the host generates non-esterified fatty acids (NEFA) by adipose mobilization, which enter the liver through the blood to produce ketone body β-hydroxybutyric acid (BHBA) and are delivered to peripheral tissues with blood circulation to provide energy. If cows fail to adapt to such metabolic changes, severe NEB will lead to continuous blood accumulation of NEFA and BHBA, which will eventually evolve into ketosis [6] and affect the production and reproductive efficiency of cows [7,8].
NEB alters the normal physiological function of multiple tissues in dairy cows. NEB causes fat mobilization, and excessive lipolysis triggers an inflammatory response in adipose tissue. The accumulation of NEFA and BHBA in the blood causes immunosuppression of immune cells [9]. In difficult situations, NEB can lead to abnormal liver metabolism, increased oxidative stress, increased release of proinflammatory cytokines, and liver damage [10]. Cows with severe NEB are prone to endometriosis and endometritis after delivery due to obstructed endometrial repair [11,12,13]. Because of inflammation in the hypothalamus, cows consume less feed during NEB. This is because hypothalamic inflammation affects hypothalamic orexigenic and anorexigenic signaling in early lactation [14].
Additionally, aberrant hypothalamic activity influences neuropeptide release, which in turn modulates food intake and energy expenditure, which ultimately results in systemic reactions [15]. NEB is responsible for metabolic and immunological problems in dairy cows.
Severe NEB produces immunosuppression, which is frequently accompanied by systemic inflammation and makes individuals susceptible to a variety of infectious illnesses, including endometritis and mastitis [16]. Innate immunity plays an important role in the development of inflammation [17]. As the first line of immune defense, innate immunity plays an important role in resisting microbial invasion and maintaining homeostasis. The metabolic imbalance caused by NEB leads to immune disorders, which in turn further aggravate the metabolic disorders [17,18,19]. However, there is still a lack of systematic research on how innate immunity is affected during this process. In this study, we analyzed the effects of NEB on innate immune genes in adipose, blood, endometrium, hypothalamus, and liver through transcriptome data and systematically investigated the effects of NEB on innate immune genes on defense and systemic inflammation in dairy cows, in order to provide new insights for the study of the interaction mechanism between metabolism and immunity, and lay the foundation for the molecular diagnosis and disease resistance breeding of dairy cows.

2. Materials and Methods

2.1. RNA Sequencing Data and Data Grouping Information

  • RNA Sequencing Data Sources
The RNA-seq next-generation sequencing (NGS) data of negative energy balance and ketosis-associated transcriptome in dairy cows was obtained from a public database (GEO database). The original sequencing data for liver, adipose, hypothalamus, endometrial, and blood corresponded to the following GEO numbers: 24 adipose samples [20] (https://www.ncbi.nlm.nih.gov/geo/query/acc.cgi?acc=GSE159224; accessed on: 8 October 2020), 23 peripheral blood leukocyte samples [21] (PRJNA605719), 24 Endometrial samples [22] (https://www.ncbi.nlm.nih.gov/geo/query/acc.cgi?acc=GSE169638; accessed on: 25 March 2020), 21 hypothalamus samples [23] (https://www.ncbi.nlm.nih.gov/geo/query/acc.cgi?acc=GSE49540; accessed on: 5 August 2013), 18 liver samples [24] (https://www.ncbi.nlm.nih.gov/geo/query/acc.cgi?acc=GSE37544; accessed on: 24 April 2012). The raw fasta data from all the samples were used for the subsequent analysis.
  • Data grouping information
According to the progression of NEB, we separated the data from multiple tissues into two broad groups: normal and NEB. (1) Samples of adipose were collected from the abdomen Subcutaneous AT of perinatal (preP) and postpartum (PP1) dairy cows. Subcutaneous AT samples were collected from Holstein cows (n = 12) at 11 ± 3.6 d before calving date (PreP) and at 6 ± 1 d (PP1) after parturition. Significant postpartum blood ketone body, BHBA, and NEFA concentrations increased dramatically (BHBA from 6 mg/dL to 9 mg/dL on average, NEFA from 0.1 mEq/L to 0.45 mEq/L on average), whereas blood glucose declined significantly, indicating that cows had significant postpartum NEB. Accordingly, the preP adipose transcriptome data were separated into the normal group, and the postpartum (PP1) adipose sample data were separated into the NEB group. (2) Blood leukocyte transcriptome samples were collected from healthy cows, ketosis and subclinical ketosis cows, and sample data from the healthy cow (blood BHBA < 1.4 mmol/L) was classified as the normal group, whereas sample data from the ketosis and subclinical ketosis cow (blood BHBA ≥ 1.4 mmol/L) was classified as the NEB group. (3) Cows with mild NEB (MNEB) and severe NEB (SNEB) provided the endometrial samples, and the difference between the two sets of samples was the progression of NEB. Therefore, the data for MNEB cows were separated into the generally normal group, and the data for SNEB cows were separated into the NEB group. (4) The hypothalami of cows with an NEB condition caused by an 18-day dietary restriction model were collected. In this study, the data from the group treated with dietary restriction belonged to the NEB group, while the data from the control group with a higher level of feeding belonged to the normal group. (5) The liver samples were from MNEB cows which were fed ad libitum grass silage and 8 kg/day concentrates and milked once daily) and SNEB cows which were fed 25 kg/day silage and 4 kg/day concentrate and milked three times daily. Relative to MNEB cows, SNEB cows had undergone significant (p < 0.05) changes in energy balance (−3.6-fold), blood glucose (−1.5-fold), blood NEFA (+4.7-fold), blood BHBA (+7.4-fold), Similar to endometrial data, liver transcriptome data were grouped into MNEB and normal subgroups, and SNEB and NEB subgroups. The detailed information is shown in the following table (Table 1).
All the above data were taken from research examining ketosis or negative energy balance in dairy cows. Samples of adipose tissue and blood leukocytes were taken from prenatal and postpartum cows, respectively. The blood concentrations of BHBA and NEFA increased considerably, and the cows suffered NEB. The samples of endometrial tissue, hypothalamus tissue, and liver tissue used in this study came from cows that had negative energy balances following dietary energy restriction. All of the involved research focused on the influence of negative energy balance on the physiological condition of cows. Following the abovementioned classification, the data were analyzed as follows.

2.2. Reads Mapping and Quantification of Gene Expression

Fastp software [25] was used to filter the raw data (reads), yielding high-quality clean reads. Reads with linkers are deleted; reads with N (meaning the base information could not be determined) content greater than 10% are deleted; low-quality reads are deleted (reads with base quality less than 3 or average base quality less than 15). For the following analysis, only clean reads were used.
The bovine reference genome ARS-UCD1.2 [26] was obtained from the Ensembl genome browser (https://www.ensembl.org; accessed on: 1 March 2021) [27] and HISAT2 ver. 2.1.0 (Johns Hopkins University Center for Computational Biology, Baltimore, MD, USA) [28] was used to provide a reference genome index for the alignment. The clean readings were mapped to the reference genome before being assembled and quantified as transcripts. StringTie [29] was used for transcript construction and quantification. The total gene count list of the five tissues was de-batch corrected using the combat_seq command from the ‘sva’ [30] R package. Using the ‘GenomicFeature’ [31] R package, the TPM value of the corrected gene count list was calculated, obtaining the TPM matrix of five tissue gene expression levels. Subsequently, we performed differential gene expression analysis between NEB group versus normal group in every tissue using ‘DESeq2’ package [32] in R.

2.3. Innate Immune Gene Sets and Principal Component Analysis

We used OrthoFinder [33] to analyze and compare human innate immune gene data collected from the InnateDB database (https://www.innate.ca; accessed on: 15 May 2008) to discover bovine innate immune genes, and when combined with the bovine innate immune gene set from the InnateDB database, resulting in a total of 1232 bovine innate immune genes.
The above 1232 bovine innate immune genes were matched with gene expression levels in different tissues to generate a TPM data list of the expression levels of bovine innate immune genes in different tissues. Principal component analysis (PCA) was performed by using basic PCA tools in Hiplot (https://hiplot.org; accessed on: 23 September 2022), a comprehensive and easy-to-use web service for boosting publication-ready biomedical data visualization [34]. The ‘heatmap’ R package [35] was used to generate the gene expression heatmap in order to examine the expression of innate immune genes in tissues with negative energy balance.

2.4. Gene-Set Enrichment Analysis and Network Architecture

The list of innate immune gene expression in each tissue was analyzed using gene-set enrichment analysis (GSEA) [36] and compared between the NEB and normal groups. The GSEA software version 4.1.0 (The University of California San Diego, Baltimore, MD, USA) was utilized, and the c5.go.bp.v7.2.symbols database was employed. We used the obtained p-values to perform a GSEA based on the weighted Kolmogorov–Smirnov Test (WKS). The gene sets with p-values less than 0.05 were selected and imported into the Cytoscape [37,38] software for visualization. Using the merge method, biological processes enriched in different tissues were then clustered according to similarity. The shared genes associated with defense were entered into a string database to generate a protein–protein interaction (PPI) network, which was then loaded into the Cytoscape application for visual analysis.

3. Results

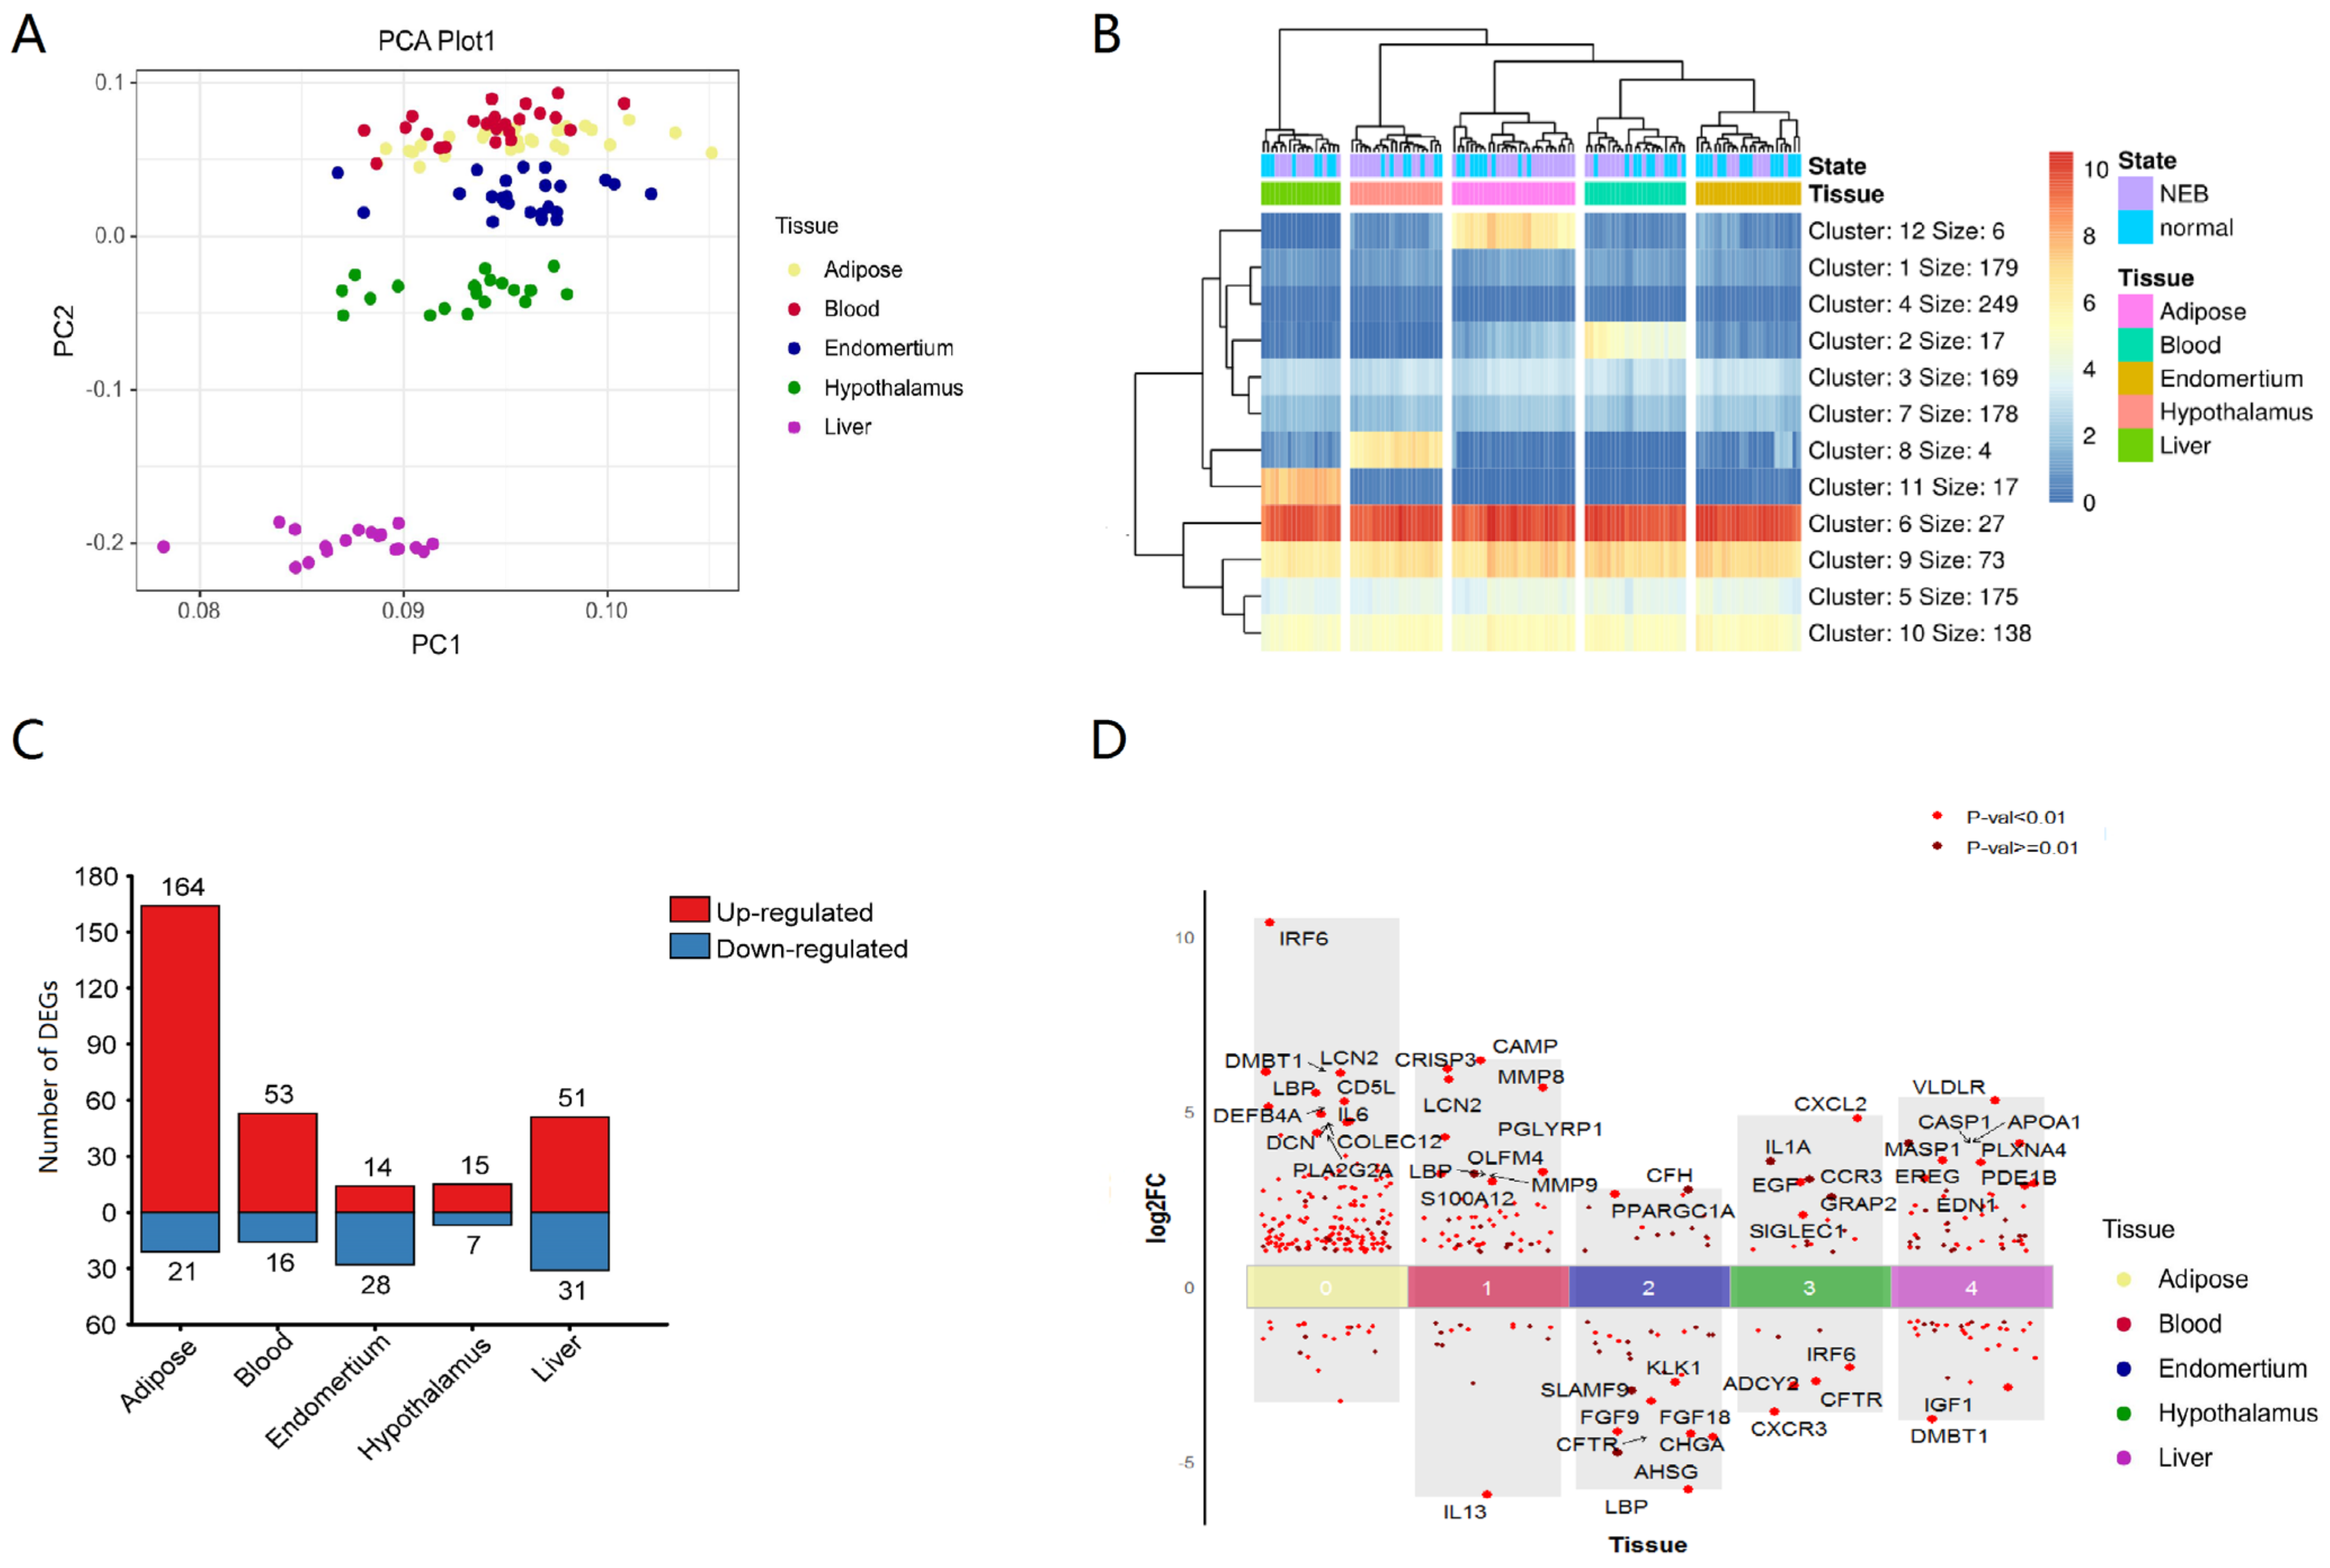
3.1. Expression of Innate Immune Genes in Different Tissues of Dairy Cows

To investigate global biological alteration and systemic whole-body impacts of innate immune genes related to NEB, we obtained the transcriptome data of adipose, blood, endometrial, hypothalamus, and liver tissue from a public database of dairy cows. The reads counts matrix of expressed genes from 141 samples was transformed into a TPM (Transcripts Per Million) matrix. The TPM of innate immune genes exhibited a closed grouping of adipose, blood, and endometrial samples in principal component analysis (PCA). Liver and hypothalamus samples distinguished out from other tissues (Figure 1A). This suggested that innate immune genes in different tissues had distinct patterns.
To confirm whether there were genes with specifically high expression in different tissues, a heatmap of gene expression was generated, the Minkowski distance between genes and samples was computed, and k-means clustering was done. The K value of 12 distinguishes each tissue. The other four tissues expressed innate immune genes at high levels except for endometrium (Figure 1B, Table S1). Innate immune genes were substantially expressed in some organs. The function of these genes was closely related to the function of tissues and organs. In blood, triggering receptor expressed on myeloid cells 1 (TREML1) [39,40], defensin beta 4 (DEFB4A) [41], fatty acid receptor 2 (FFAR2) [42], and interferon-stimulated exonuclease 20 (ISG20) [43] genes were greater, which affected blood cell immunity and metabolism. In the liver, genes associated to complement (C5, C6, C8A, C8B, C9, C4BPA) and forkhead transcription factors (FOXA1, FOXA2) were substantially elevated. The liver was a significant source of complement [44], and hence the high expression of complement-related genes was consistent with the physiological function of the liver. Forkhead transcription factors [45] control metabolism genes and are crucial to liver metabolism. Calcium/calmodulin-dependent protein kinase IIα (CAMK2A), chromogranin A (CHGA), arginine vasopressin (AVP), and atypical Notch ligand (DLK1) were abundantly expressed in the hypothalamus, and involved in signal transduction, hormone secretion, and other functions [46,47,48,49,50]. In adipose tissue, five genes, including transcription factors HOXA9, ADIPOQ, LEP, and CD209, were substantially expressed, which are connected to the maintenance of adipose tissue function and differentiation [51,52,53]. Thus, tissue-specific functions may be related to innate immune gene expression patterns.
The number of differentially expressed innate immune genes in different tissues affected by NEB was also different. Adipose tissue had the most DEGs and differentially expressed innate immune genes, whereas the hypothalamus had the least (Figure 1C), showing that NEB had the greatest effect on gene expression in adipose tissue. The differentially expressed innate immune genes were largely up-regulated in adipose, blood, and liver tissues and down-regulated in endometrial tissues (Figure 1D).
All of the top 10 DEGs of innate immune genes (IRF6, DMBT1, LCN2, LBP, CD5L, DEFB4A, IL-6, COLEC12, DCN, PLA2G2A) that were significantly differentially expressed in adipose tissue were up-regulated, with IRF6, LCN2, LBP, DEFB4A, and IL-6 also being differentially expressed in other tissues (Table S2). Nine genes (CAMP, CRISP3, MMP8, LCN2, PGLYRP1, OLFM4, MMP9, LBP, S100A12) were increased among the 10 most substantially differently expressed innate immune genes in the blood NEB group, while only IL13 was down-regulated. Two genes (CFH, PPARGC1A) were up-regulated, and eight were down-regulated in the NEB group of the endometrium (LBP, AHSG, CFTR, CHGA, FGF9, FGF18, SLAMF9, KLK1). Six genes (CXCL2, IL1A, CCR3, EGF, GRAP2, SIGLEC1) were increased in the hypothalamus, whereas four genes were down-regulated (CXCR3, CFTR, ADCY2, IRF6). Eight genes (VLDLR, APOA1, CASP1, MASP1, PLXNA4, EREG, PDE1B, and EDN1) were up-regulated in the liver, whereas two genes were down-regulated (DMBT1, IGF1).

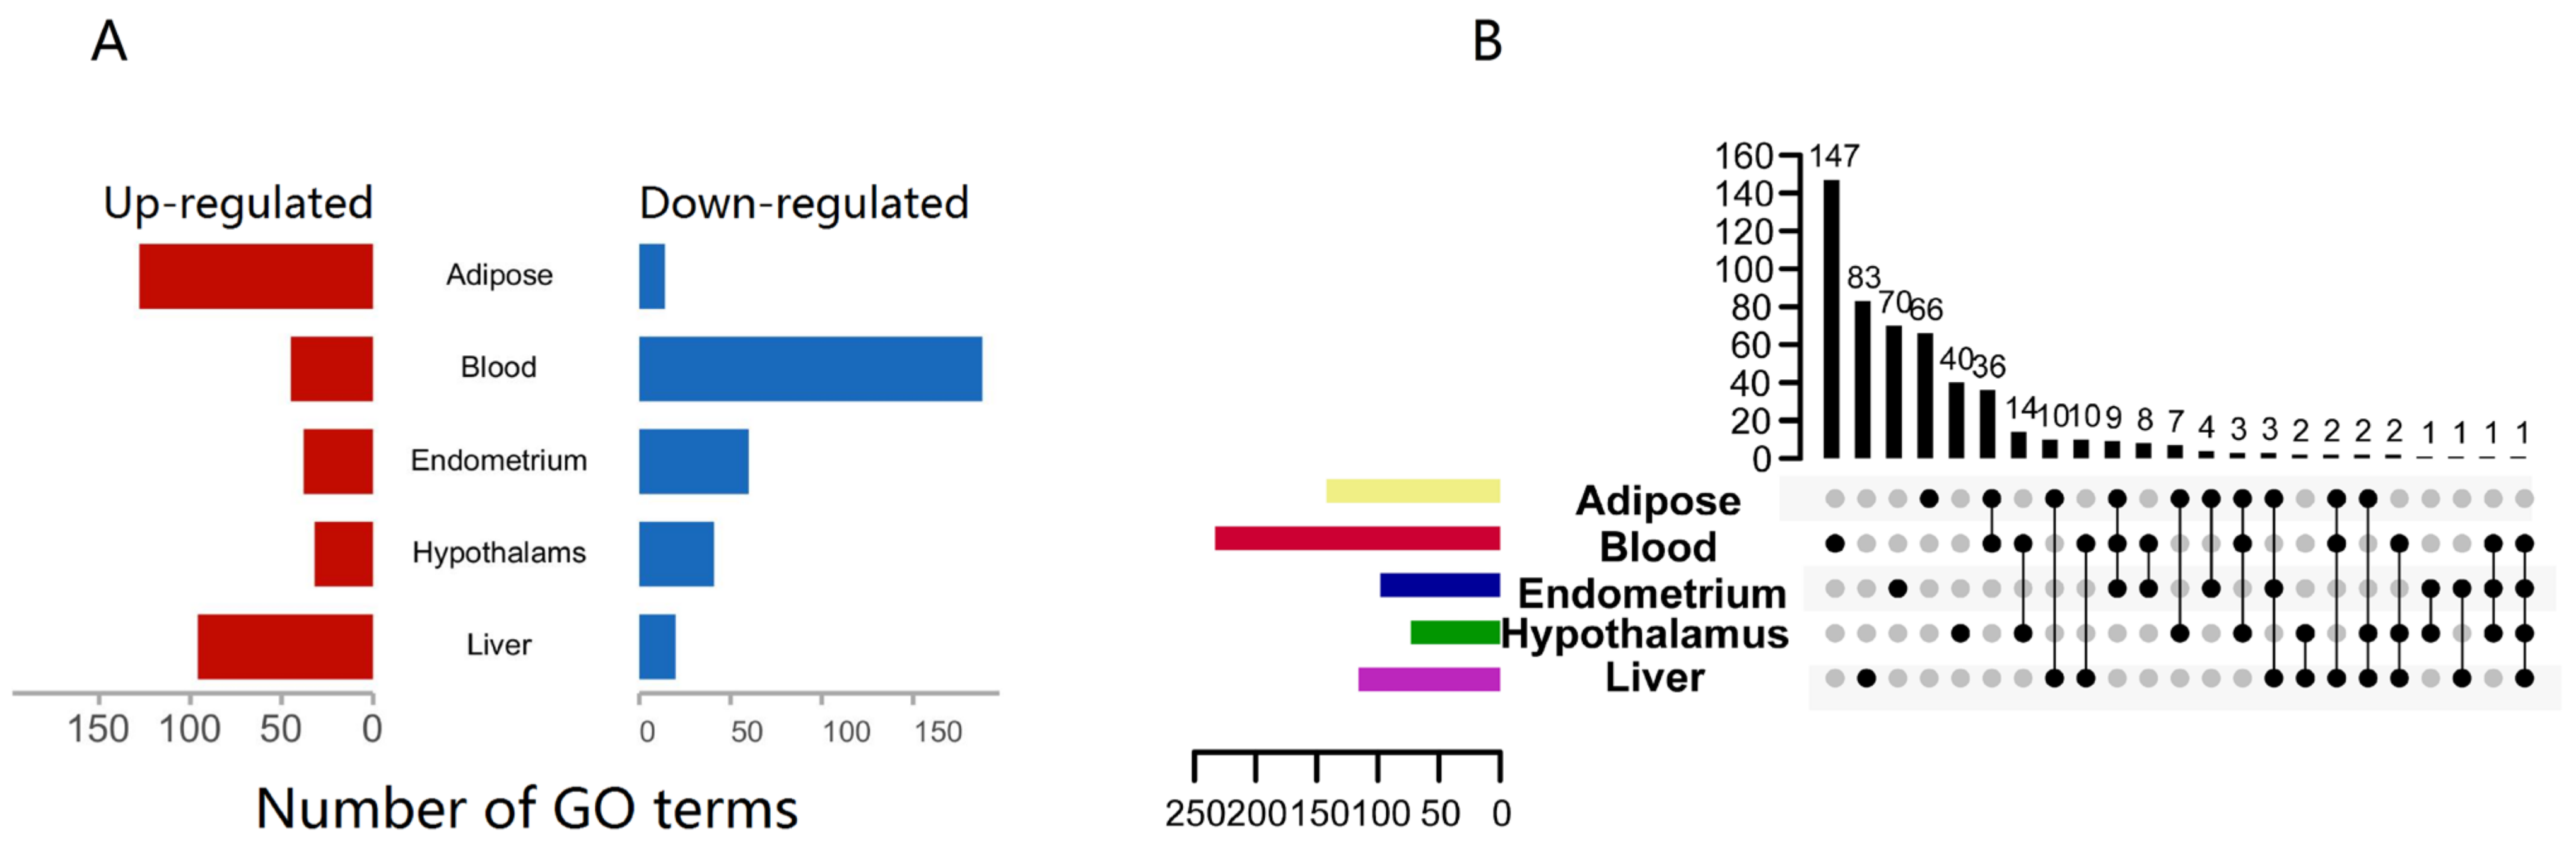
3.2. Functional Analysis Reveals Widespread Alterations of Biological Processes of Innate Immune Gene Post NEB Condition with Different Tissue

We utilized gene-set enrichment analysis (GSEA) with gene ontology (GO) biological processes to uncover NEB-impacted biological functions (BPs). We clustered GO terms with p-values below 0.05 when comparing NEB to normal in different tissues. Most pathways, 233, were enriched in the blood and mostly down-regulated, indicating that NEB inhibited blood innate immune gene activation (Figure 2A). Adipose and hepatic routes predominated over the hypothalamus and endometrial pathways. Few pathways were shared by several tissues, and most of the pathways enriched to innate immune genes were tissue-specific (Figure 2B).
The pathways enriched in different tissues were clustered according to similarity co-efficient (Figure 3). Processes related to immune response and inflammation were significantly up-regulated in the adipose and hypothalamus but down-regulated in the endometrium, related to defense reaction were up-regulated in the blood, and related to the response to the external stimulus were up-regulated in the liver. It was seen that pathways related to defense function were generally up-regulated and influenced by NEB, except in the endometrium, where they were mainly down-regulated.
We also observed that innate immune genes not only performed defense-related functions but were also involved in metabolic processes, signal transduction, and cell growth and differentiation. The pathways related to metabolism were significantly down-regulated by NEB in the adipose, blood, and liver. The pathways associated with signal transduction were mainly down-regulated in the blood and hypothalamus. The pathways associated with cell growth and differentiation were down-regulated in blood and the hypothalamus, with opposite trends in the liver.
These demonstrate that NEB extensively altered the defense, metabolic and signaling functions of innate immune genes.

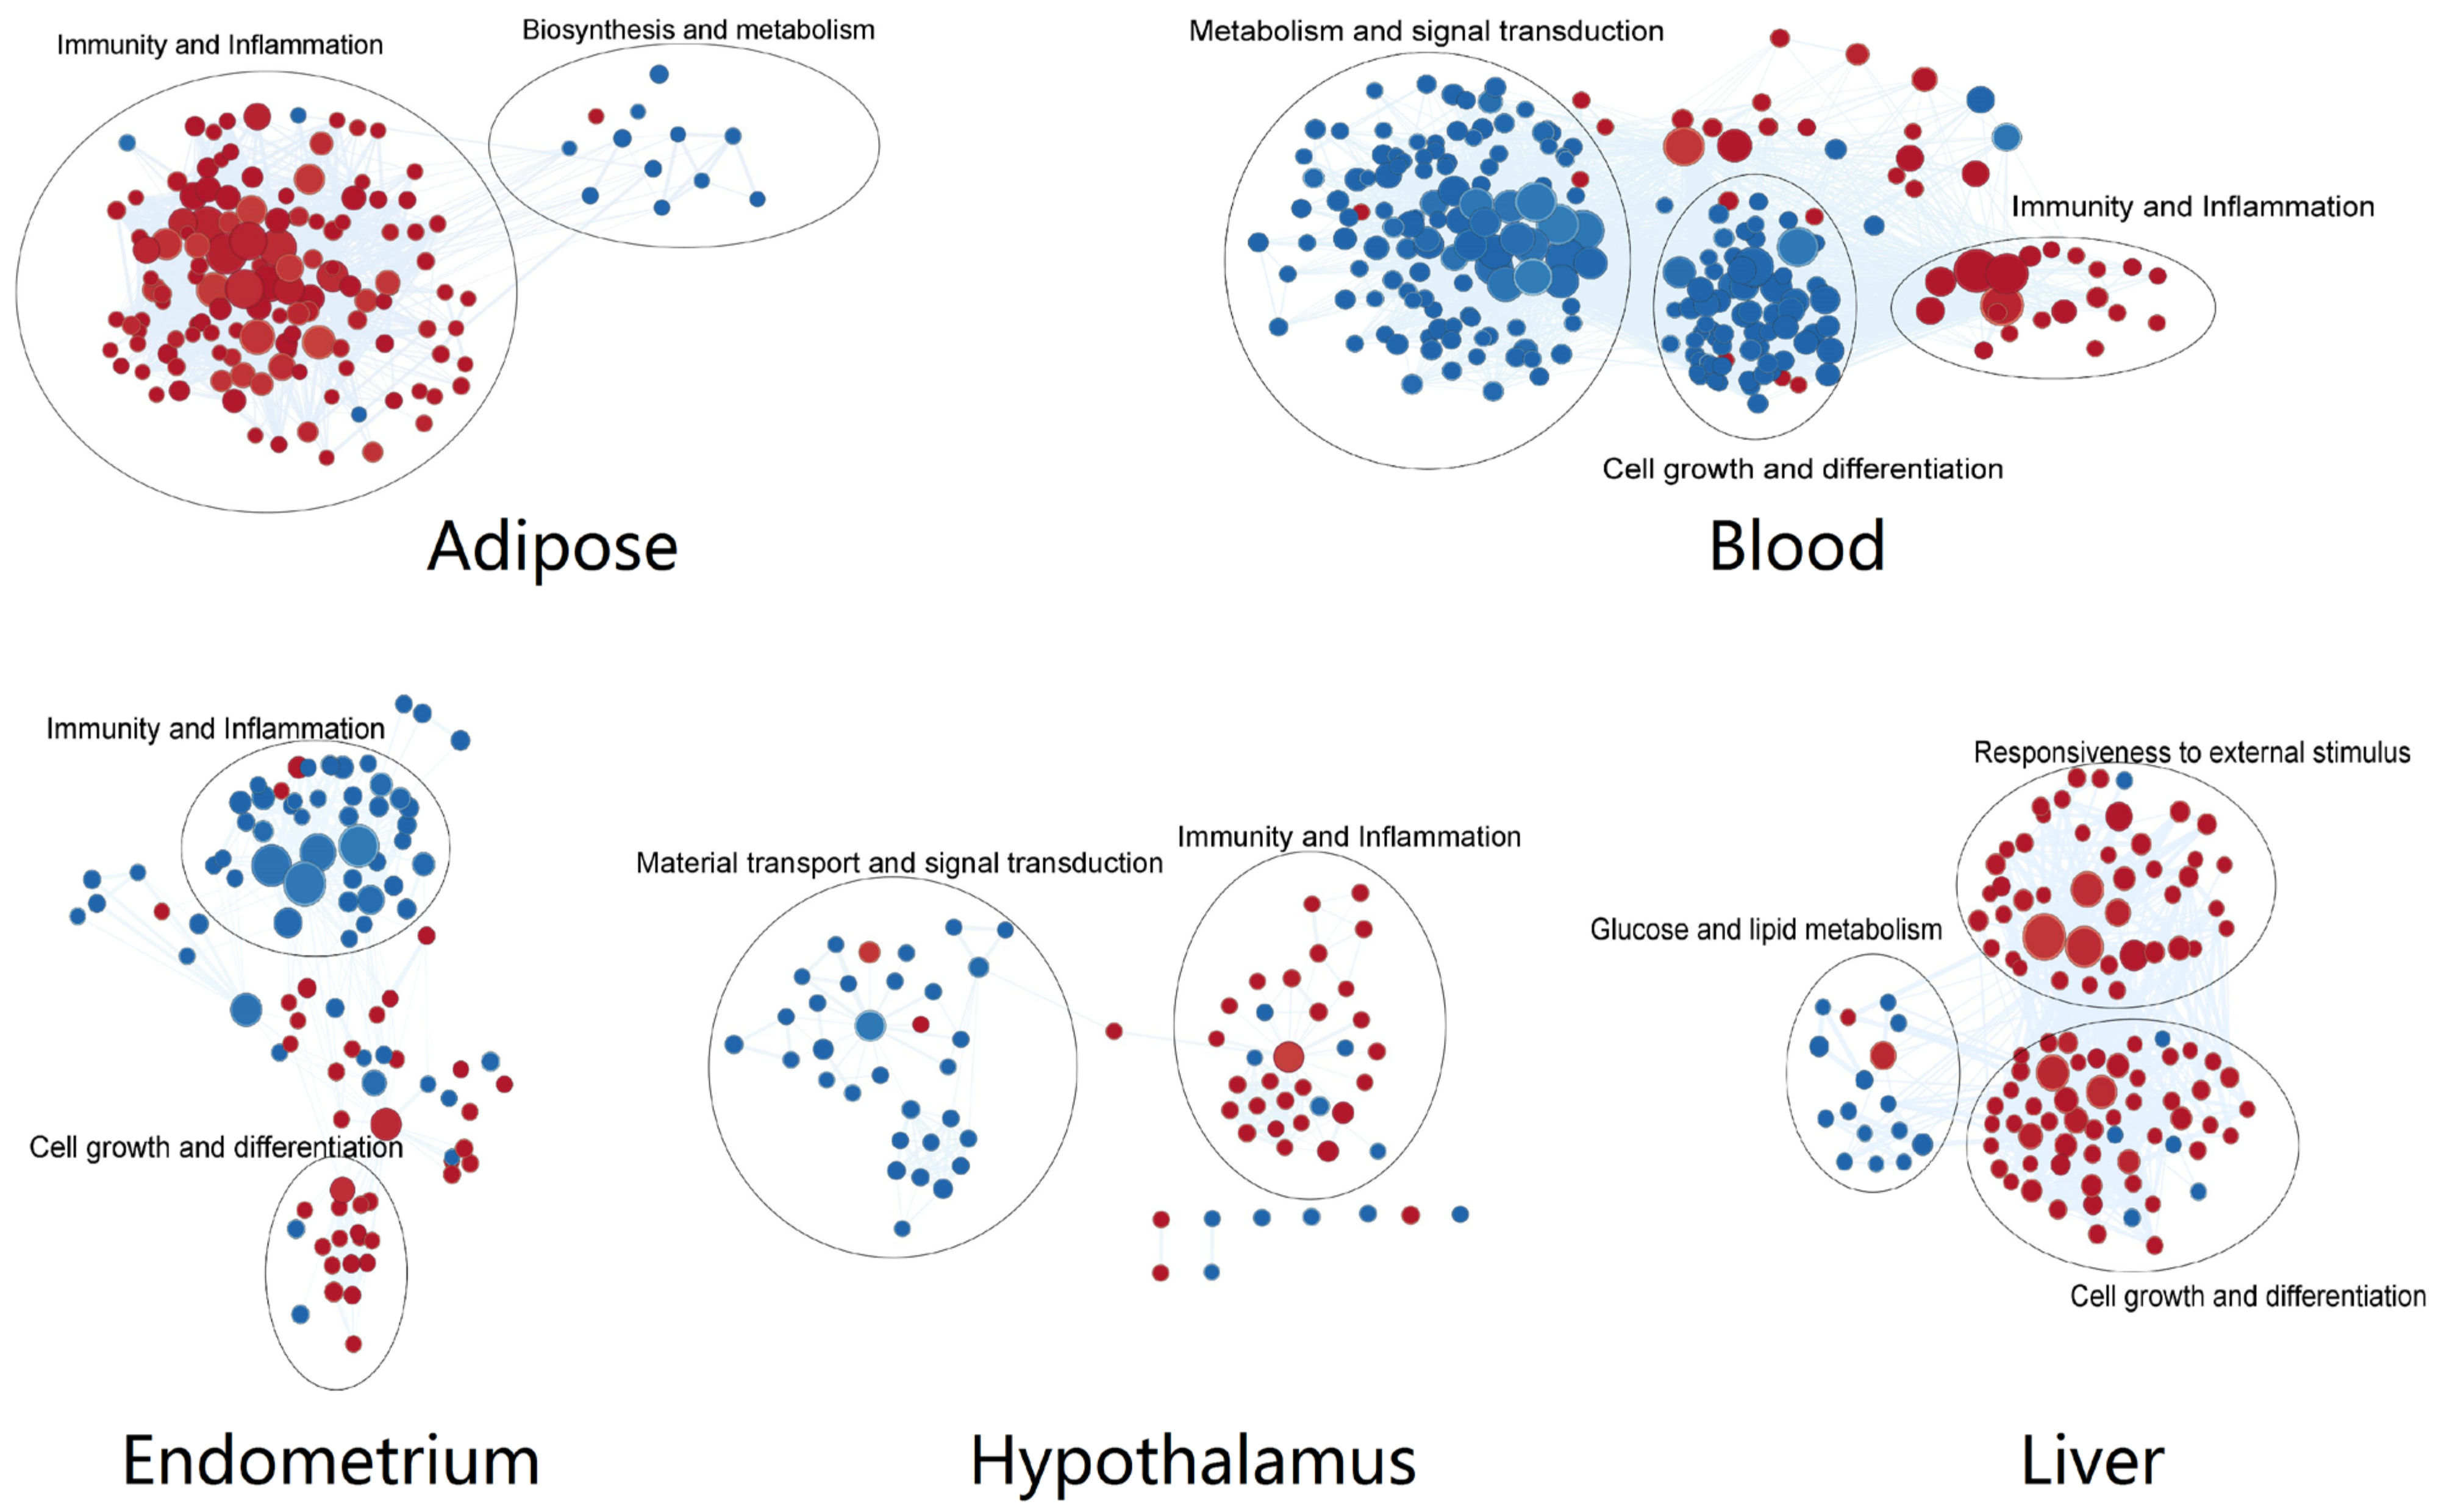
3.3. Tissue-Specific Altered Biological Functions Point to Specificity of Defensive, Metabolic, and Signaling Responses to NEB

Next, we looked at the specificity of biological processes that were significantly affected in various tissues as a result of NEB. According to the normalized enrichment score (NES) (p-value = 0.05), the gene sets were ordered. We concentrated on the top five and bottom five most significant GO terms (Table 2).
The adipose tissue had the most changes in humoral immune response, including humoral immune response mediated by circulating immunoglobulins, humoral immune response regulation, and complement activation, all of which were increased. The metabolism of fatty acids and sterols was markedly suppressed in adipose tissue.
In the blood, leukocyte-mediated immune response-related pathways were significantly up-regulated, such as myeloid leukocyte-mediated immunity, exocytosis, myeloid leukocyte activation, and defense response to Gram-positive bacterium. However, pathways related to humoral immunity, such as regulation of immunoglobulin production, B cell activation involved in the immune response, and immunoglobulin production, were suppressed.
Positive regulation of Jun kinase activity, which plays an important role in immune response and metabolism, was down-regulated in the endometrium, while both a cellular response to the virus and positive regulation of response to cytokine stimulus pathways were suppressed. But lymphocyte chemotaxis was enhanced. The same with the adipose, ‘Sterol Metabolic Process’ was also down-regulated.
In the hypothalamus, processes related to the regulation of CD4-positive T-cell differentiation and leukocyte homeostasis were significantly up-regulated. The pathways associated with signal transduction were down-regulated, such as the regulation of calcium-ion transmembrane transport, calcium-ion transmembrane import into the cytosol, and the non-canonical WNT signaling pathway. Interestingly, the cellular response to ketone was down-regulated in the hypothalamus due to NEB.
We observed that tissue migration [54] was up-regulated, and the glucose metabolic process was down-regulated in the liver. We found that the functions of innate immune genes affected by NEB were not identical and were related to the functional properties of the tissue.

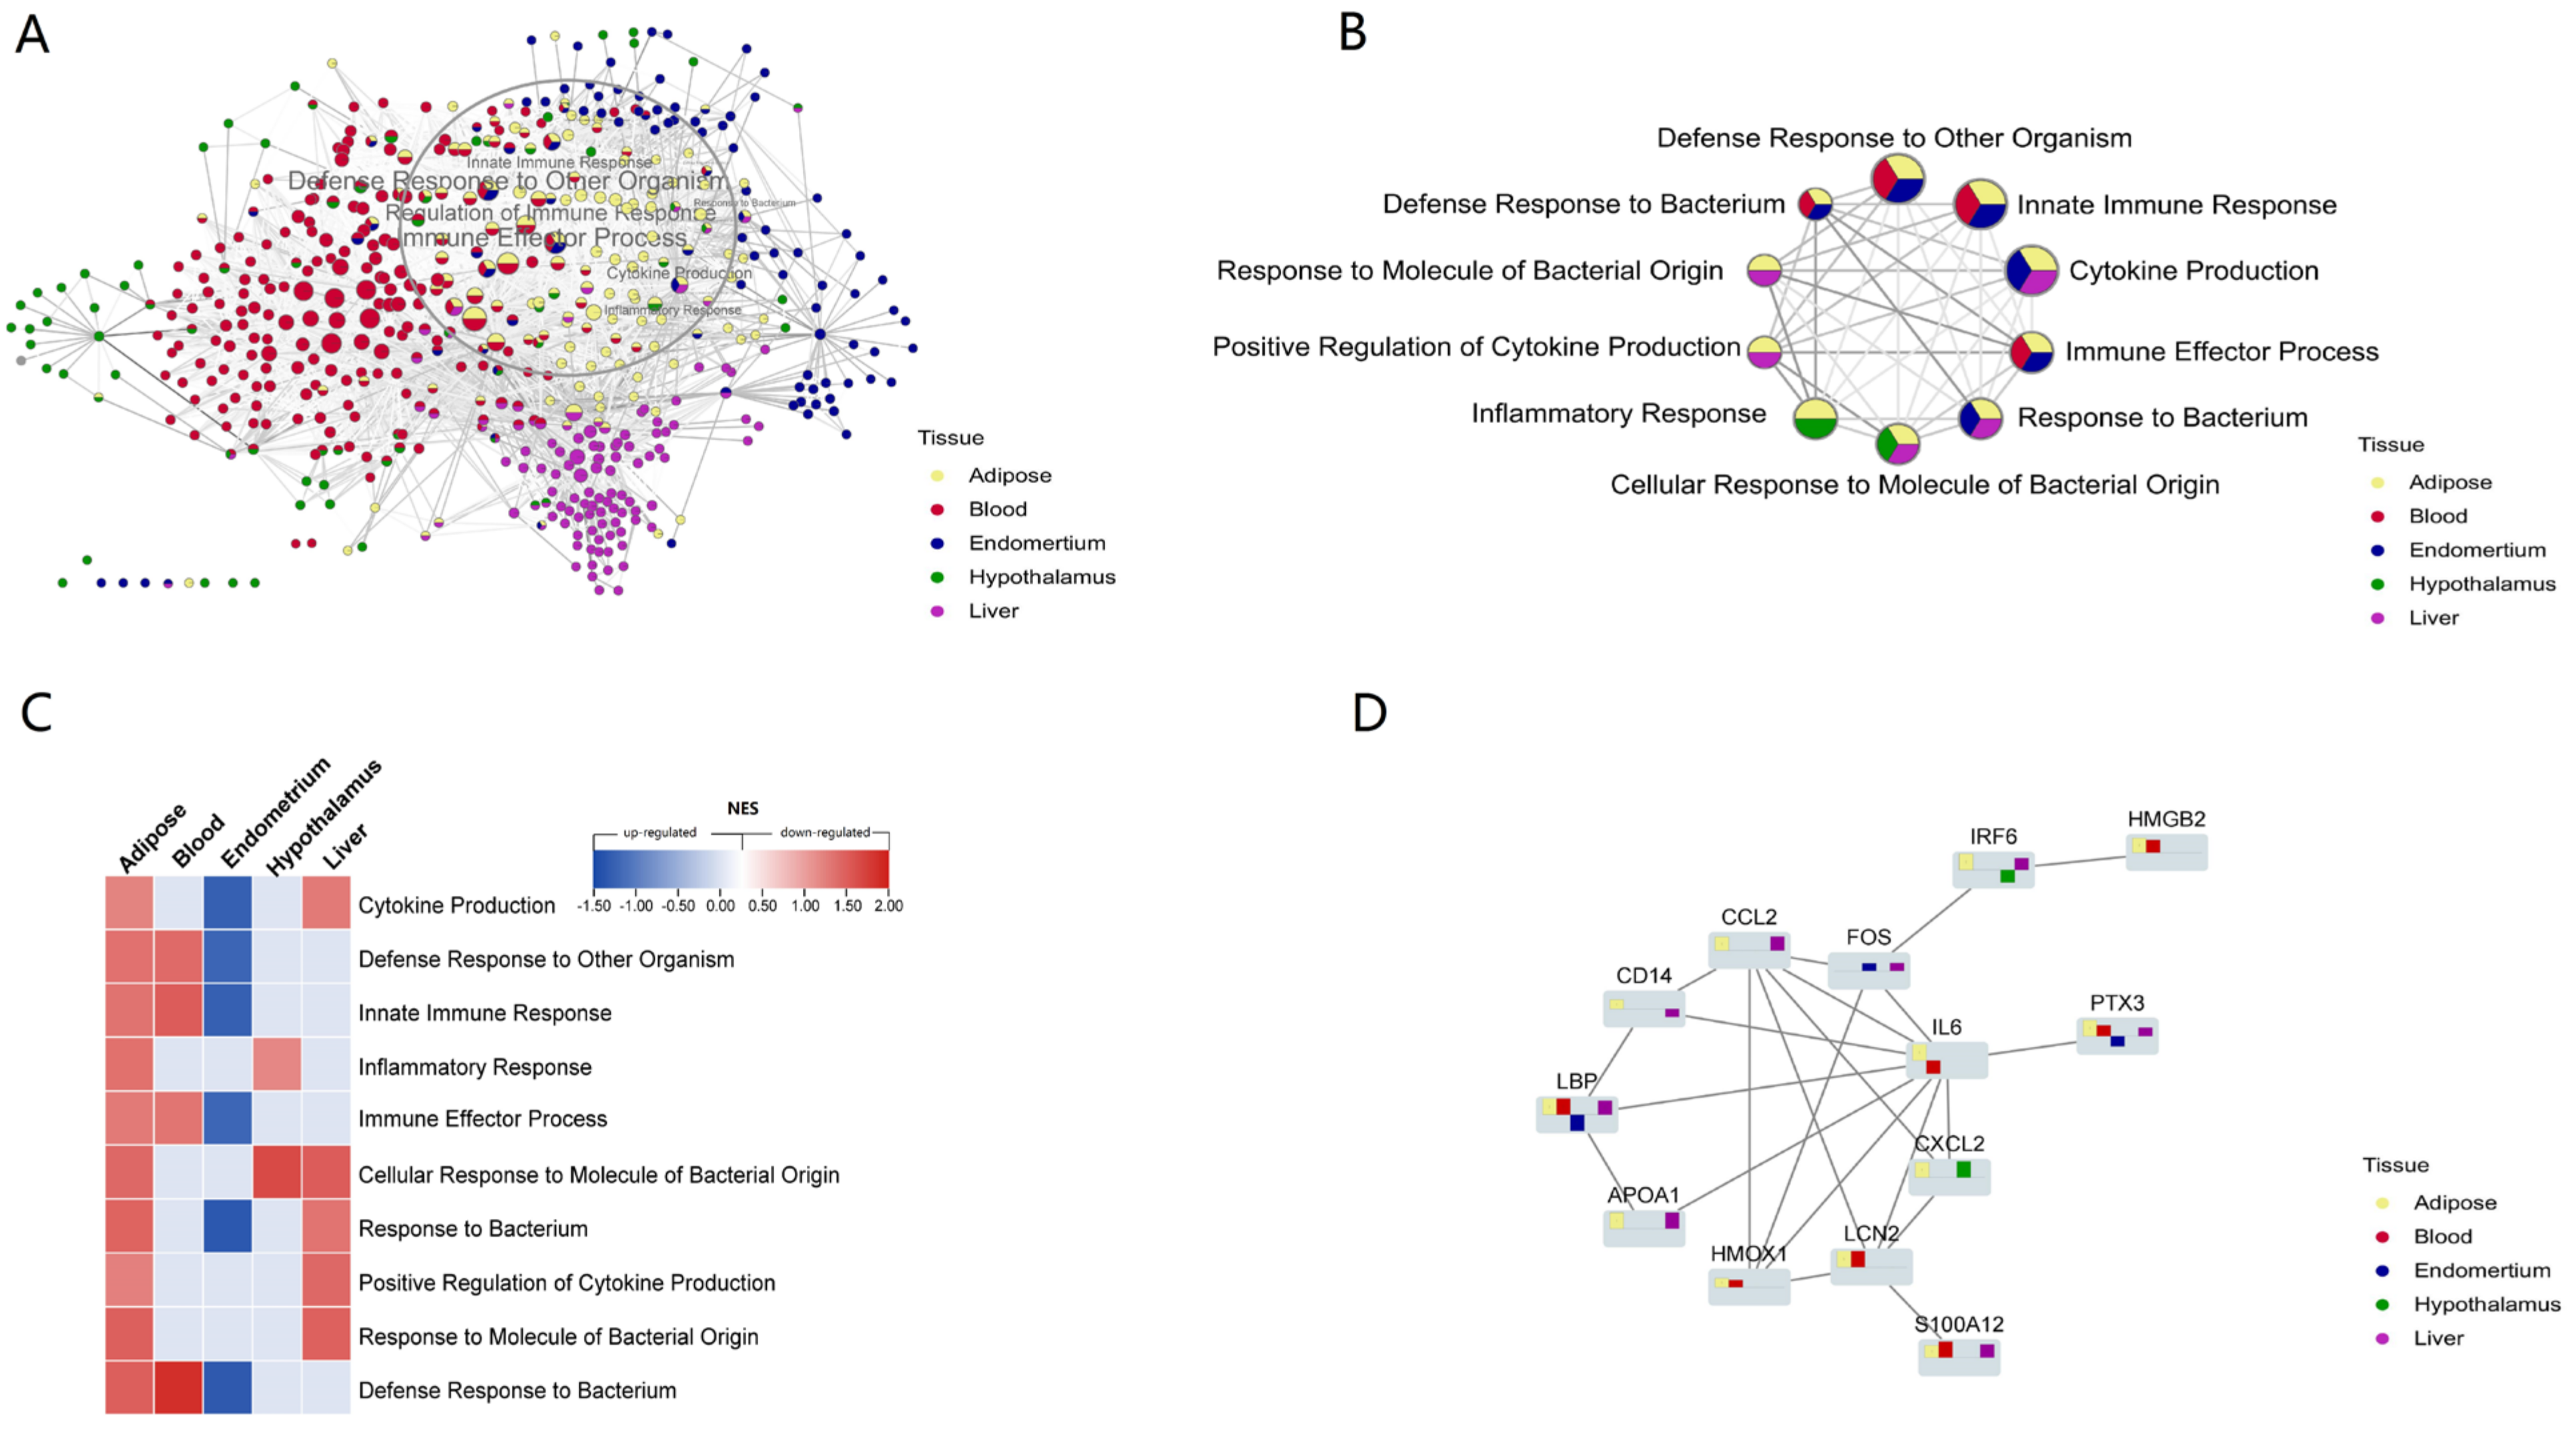
3.4. Network Analyses of Gene Sets from Multi-Tissue Unveils Universal Changes to the Defense Response Caused by NEB

Then, using the Cytoscape ‘merge’ tool, we combined all of the networks of routes enriched from different tissues based on similarity coefficients. Overall, these pathways were grouped according to tissue specificity, indicating that innate immune gene expression patterns were tissue specific. However, there were several common defense-related pathways enriched from diverse tissues that were practically concentrated in the same location (Figure 4A). These multi-tissue common pathways established a highly linked defensive network, all of which were elevated in adipose tissue (Figure 4B,C). NEB caused excessive fat mobilization and increased inflammation in adipose tissue [20,55], as well as a change in the overall defense state. The network’s highest weighted variable was ‘Defense Response to Other Organism,’ which was significantly affected in three tissues (adipose, blood, and endometrium). This suggested that NEB modifies the host defense mechanisms against foreign substances and influences how innate immune genes are expressed. We discovered that several common processes, such as ’Cytokine Production‘, ’Defensive Response to Bacterium‘ and ’Innate Immune Response‘ were down-regulated in the endometrium, decreasing the endometrial defense capability (Figure 4C). Four of these pathways—innate immune response, reaction to bacteria, response to other organisms, and defense response to bacterium—were present in adipose, blood, and endometrial and were elevated in all three tissues while being down-regulated in the latter. We noted that an ‘Inflammatory response’ was promoted both in the adipose and hypothalamus.
There were 54 related DEGs across the processes that these tissues shared. These DEGs were added to the STRING database (https://cn.string-db.org/; accessed on: 12 August 2021) to create a PPI network, which was then laid out in Cytoscape using the yfiles Hierachic layout method. We discovered that the PPI network was centered on IL-6 (Figure 4D). CXCL2, LCN2, APOA1, LBP, CCL2, IRF6, HMGB2, PTX3, and S100A12 genes were significantly differentially expressed and interacted with IL-6 in different tissues. HMOX1, FOS, and CD14 also connect these proteins to form an interaction network (Figure 4D).

4. Discussion

Traditional dairy cow breeding focuses on increasing milk or protein output while ignoring functional qualities and health-related traits [56]. Long-term selection to boost production causes physiological and immunological imbalance, especially in the early lactation period, when cows have the most severe metabolic imbalance and immune imbalance, making them more susceptible to environmental influences and secondary illnesses [57]. Negative energy balance has a variety of negative effects on dairy cow health. There have been a lot of investigations on how NEB affects dairy cows’ metabolism, reproduction, lactation, and other physiological processes, but there has not been any comprehensive study of the cows’ innate immunity. With a focus on the influence of NEB on the expression of innate immune genes, the transcriptome data of the adipose, blood, endometrium, hypothalamus, and liver of dairy cows were analyzed, and the effect on the host was investigated.
The biological processes enriched by GSEA analysis of innate immune genes in various tissues revealed that blood, endometrial, and hypothalamus gene functions were primarily down-regulated owing to the NEB effect, while adipose and liver tissues were primarily up-regulated, primarily because adipose is the primary energy storage tissue and liver is the main metabolic tissue, and negative energy balance primarily produced abnormal metabolic activity in adipose and liver.
Innate immune genes are engaged not only in host defense, immunity, and inflammatory processes but also in biological processes influenced by negative energy balance, such as synthesis and metabolism, substance transport, and signal transduction. NEB increases the inflammatory and immunological responses of adipose, which, as an energy-consuming process, will aggravate the negative energy balance. During cows’ perinatal stage, innate immune gene-related metabolic and substance production activities, such as the fatty acid metabolic process and the sterol metabolic process, were repressed [58,59,60,61]. These biological processes were down-regulated in the NEB group, which appears to contradict the high energy demands of immunity and inflammation and the exacerbation of lipolysis through fat mobilization. This is due to the fact that our research concentrated on innate immune genes. Adipose tissue also possesses many non-innate immune genes that compensate for innate immune gene-induced glucose and lipid metabolic downregulation. In adipose tissue, innate immunity up-regulates inflammatory and immune-related pathways but also down-regulates glucose and lipid metabolism and steroid production and metabolism pathways to counteract excessive inflammation and immune response, which is also a balancing strategy for tissues to transition from an imbalanced to a balanced state.
In endometrial tissue, innate immune genes are also involved in cell proliferation, differentiation, protein synthesis, and secretion, and NEB has a significant impact on these processes. Cows with severe NEB (ketosis) are sensitive to endometritis, which has a significant impact on reproductive performance. The endometrium is a tissue susceptible to serious harm from pathogenic bacteria. In this analysis, NEB regulates innate immune responses in the endometrium, manifesting predominantly as immunological down-regulation of ‘Cellular Response to Virus’, ‘Cytokine Production’, and ‘Bacterial Defense Response’. This indicates that the endometrium is immune-suppressed. Immunosuppression heightens the risk of infection from pathogens.
The tissue damage caused by a bacterial infection will accelerate the endometrial tissue repair process. Therefore, innate immune genes are up-regulated in the endometrium of NEB dairy cows with respect to cell proliferation and differentiation. In addition, we found that the endometrium’s innate immune genes function to synthesize proteins. The mucosal immune system is a vital endometrial defensive mechanism. The mucus secreted by the mucous membrane contains proteins such as antimicrobial peptides and cytokines, which act as physical barriers and immune cells [62]. By inhibiting protein production and secretion, the endometrial mucosa’s immunological capacity and susceptibility to infection will be reduced. Due to the lower resistance of the peripheral mucosal tissue, the invasion of pathogenic bacteria and their products is increased, leading to an increase in the systemic inflammatory response. As shown in this study, the blood, liver, and hypothalamus also increased inflammatory, immune, or defense responses in the NEB group.
Meanwhile, it was found that NEB decreased humoral immune-related biological processes in the blood, as ‘Immunoglobulin Production’ and ‘B Cell Activation Involved in Immunological Response’ were drastically inhibited, signaling that the host was suffering from immunosuppression. Specific immunity is also reduced. Innate immune cells’ activity is promoted by systemic inflammation, as shown by the up-regulation of myeloid leukocyte-mediated immunity and myeloid leukocyte activation. Severe NEB is frequently accompanied by low blood glucose and high blood ketones. Hypoglycemia impairs the proper metabolism of blood cells, and high blood ketone, particularly BHBA, inhibits the function of innate immune cells, which is the main cause of immune suppression.
The liver is a key organ of the body’s host metabolism, and liver metabolic abnormalities can cause systemic metabolic illnesses. NEB affects dairy cow liver metabolism, cell differentiation, and sensitivity to outside stimuli. These mechanisms, especially lipid metabolism and substance transport, are up-regulated due to increased demand on liver lipid metabolism due to adipose mobilization during the NEB period and a heightened stress reaction to environmental perturbations. The liver is not only the major metabolic organ, but it is also a vital immune-related organ. It produces complement and vital cytokines. The stress reaction is most directly expressed by an increase in inflammatory responses, which are stimuli that disrupt the liver’s homeostasis. Due to energy shortage, the liver also reduces glucose metabolism and the calcium-mediated signaling pathway. Calcium signaling is typically a crucial activation signal for innate immunity, and the down-regulation of the calcium-mediated signaling response also indicates that several of the processes associated with innate immunity in the liver are similarly down-regulated.
The hypothalamus controls feeding, energy expenditure, and secretion. Energy restriction disrupts the hypothalamic-pituitary-ovarian axis, affecting cow ovulation [23]. The hypothalamus is also affected by NEB. In this work, we investigated the effects of NEB on the hypothalamus using the expression patterns of innate immunity genes and discovered that NEB cows have up-regulated inflammatory and immune-related biological processes and down-regulated substance transport and signal transduction pathways. The hypothalamus and adipose had up-regulated innate immunity pathways related to inflammation and immunity, while other tissues showed significant functional suppression. As a result, we suggest that the hypothalamus is another early tissue impacted by NEB. Material transport and signal transduction in the hypothalamus is inhibited, which is a key functional inhibition for the neurological system. Hypothalamic function inhibition may be an early sign of NEB deteriorating, as well as the primary reason for the development of subclinical and clinical ketosis. Therefore, a thorough investigation of NEB in dairy cows from multiple tissues is of considerable significance in showing the complicated relationship between metabolism and immunity in dairy cows throughout the perinatal period.
The expression pattern of 10 defense-related biological processes shared by different tissues in response to NEB (Figure 4C) showed that the endometrium had a decreased defense capacity, which facilitated pathogenic microorganisms to invade, while other tissues up-regulated relevant processes, which caused a systemic inflammatory response [63]. This is consistent with the findings that NEB causes systemic inflammation. In addition, systemic inflammation exhibited a greater effect on adipose tissue than on blood, liver, or hypothalamus.
To identify the genes that regulate metabolism and immunity in response to NEB, a list of innate immune genes that are differentially expressed across many tissues and have defensive roles was created. Innate immune genes PPI analysis of these differentially expressed genes revealed that IL-6 is the network hub linked with lipid metabolism and inflammation in dairy cows [12,20,64,65]. Among the proteins that interacted with IL-6, LBP, S100A12, ANXA1, LCN2, PTX3, IRF6, and CXCL2 were significantly differentially enhanced in a variety of tissues.
In response to NEB, LBP, PTX3, and S100A12 were significantly up-regulated in adipose, blood, and liver but down-regulated in endometrial. Dairy cow LBP mRNA and protein levels are linked to local and systemic inflammation [66,67]. The gene’s endometrial expression decreases the host’s ability to recognize infections and increases invasion risk. In response to inflammatory stimuli, PTX3 is activated in endothelial cells and mononuclear phagocytes by inflammatory cytokines. The protein controls inflammation and complement activation. Furthermore, it boosts angiogenesis and tissue remodeling. The protein is also a biomarker for many inflammatory diseases [68,69,70]. Gene expression overexpression enhances liver, blood, and adipose complement activation and systemic inflammation. Endometrial repair and immunological function are impaired by low gene expression [71,72]. S100A12 regulates inflammation and immunity. It recruits leukocytes, elevates cytokines and chemokines, and controls leukocyte adhesion and migration [73]. In cows, S100A12 is a marker for inflammatory responses and subclinical mastitis [74]. The upregulation of LBP, PTX3, and S100A12 in multiple tissues suggests that NEB influences systemic inflammation, and these three genes may serve as diagnostic indicators of systemic inflammation caused by NEB.CXCL2 regulates and inflames inflammation [75]. CXCL2 increased neutrophil adherence to visceral WAT endothelial cells, causing WAT inflammation [76]. LPS-treated rats have higher hypothalamic CXCL2 genes [77]. In this study, the increased expression of CXCL2 in adipose and brain tissues showed inflammation in the NEB group for both tissues. LCN2 is involved in hunger, energy metabolism, and adipose tissue inflammation and can pass the blood-brain barrier [78,79,80]. LCN2 increases glucose metabolism [78], reduces fat mass, and suppresses appetite. Appetite loss is a major contributor to the negative energy balance of perinatal cows, which drives adipose mobilization and the synthesis of ketone bodies to compensate for the increased glucose absorption by extrahepatic tissues [81]. LCN2, a key gene that links energy metabolism and immunity, could be employed as a molecular marker and marker-assisted selection for early diagnosis of negative energy balance. LBP, PTX3, S100A12, and LCN2 are upregulated in blood and tissues by NEB. These genes affect systemic inflammation and immunology. These genes may detect energy-induced systemic inflammation.
Notably, the gene most significantly overexpressed in the adipose tissue NEB group (log2FC = −10.4) is IRF6, which belongs to the interferon regulatory transcription factor (IRF) [82]. It is linked to liver damage [83] and obesity-related metabolic and immunological homeostasis [84,85]. In addition, increased expression of IRF6 in adipose and liver may be related to the inflammatory tissue damage caused by severe NEB [81]. Further research is needed to fully understand the effect of IRF6 in the NEB process.
However, the raw data came from a public database, and the different tissue samples did not come from the same individual. Because of this, the systematic analysis may not have been entirely accurate. Despite this, our research was able to provide light on the connection between a negative energy balance and systemic inflammation in dairy cows without causing any additional harm to the animals that were used in the experiment. To fully investigate the interactions between NEB and systemic inflammation, further research in the form of carefully designed studies is required.

5. Conclusions

The current study revealed that negative energy balance altered the expression pattern of innate immune genes in different tissues. By regulating biological processes related to immunity and metabolism, innate immune genes alter the host’s defense capacity and systemic inflammation. NEB can decrease the resistance of mucosal barrier systems such as the endometrium, raise the invasion rate of pathogenic microorganisms, activate the host systemic defense mechanism, and exacerbate systemic inflammation. The mRNA expression levels of LBP, PTX3, S100A12, and LCN2 were considerably altered in numerous tissues impacted by NEB and notably up-regulated in the blood. These genes are related to immunology and metabolism and have the potential to be exploited as diagnostic markers for NEB-related systemic inflammation and as screening markers for disease-resistant breeding. In addition, future research should comprehensively examine the role of IRF6 in the process of NEB in perinatal cows. This is a meaningful integrative transcriptome analyzed study to investigate the effects of NEB on defense and inflammation from the perspective of multiple tissues, providing new insights into the interaction between metabolism and immunity.

Supplementary Materials

The following supporting information can be downloaded at: https://www.mdpi.com/article/10.3390/vetsci10020107/s1, Table S1: List of tissue-specific highly expressed innate immune genes; Table S2: DEGs of innate immune genes from multi-tissues.

Author Contributions

Conceptualization, C.S., Y.M. and W.Z.; data curation, L.D. and Y.Y.; formal analysis, Y.C. and Y.W.; investigation, L.D.; methodology, L.G. and Y.Y.; Project administration, W.Z. and C.S.; software, L.G. and Z.L.; visualization, L.D. and Z.L.; writing original draft, L.D. All authors have read and agreed to the published version of the manuscript.

Funding

The research was supported by the Inner Mongolia Natural Science Foundation project [2021ZD05], Inner Mongolia Natural Science Foundation project [2021ZD0009], Inner Mongolia science and technology plan project [2021GG0008], and [2021GG0025]. We thank all the research assistants and laboratory technicians who contributed to this work.

Institutional Review Board Statement

Not applicable.

Informed Consent Statement

Not applicable.

Data Availability Statement

The data presented in this study are available either within the article or as Supplementary Materials.

Conflicts of Interest

The authors declare no conflict of interest.

References

  1. Wankhade, P.R.; Manimaran, A.; Kumaresan, A.; Jeyakumar, S.; Ramesha, K.P.; Sejian, V.; Rajendran, D.; Varghese, M.R. Metabolic and immunological changes in transition dairy cows: A review. Vet. World 2017, 10, 1367–1377. [Google Scholar] [CrossRef] [PubMed]
  2. Ingvartsen, K.L.; Moyes, K. Nutrition, immune function and health of dairy cattle. Animal 2013, 7 (Suppl. S1), 112–122. [Google Scholar] [CrossRef] [PubMed]
  3. Fiore, E.; Gianesella, M.; Arfuso, F.; Giudice, E.; Piccione, G.; Lora, M.; Stefani, A.; Morgante, M. Glucose infusion response on some metabolic parameters in dairy cows during transition period. Arch. Anim. Breed. 2014, 57, 3. [Google Scholar] [CrossRef]
  4. Fiore, E.; Arfuso, F.; Gianesella, M.; Vecchio, D.; Morgante, M.; Mazzotta, E.; Badon, T.; Rossi, P.; Bedin, S.; Piccione, G. Metabolic and hormonal adaptation in Bubalus bubalis around calving and early lactation. PLoS ONE 2018, 13, e0193803. [Google Scholar] [CrossRef] [PubMed]
  5. Arfuso, F.; Minuti, A.; Liotta, L.; Giannetto, C.; Trevisi, E.; Piccione, G.; Lopreiato, V. Stress and inflammatory response of cows and their calves during peripartum and early neonatal period. Theriogenology 2023, 196, 157–166. [Google Scholar] [CrossRef]
  6. Gordon, J.L.; Leblanc, S.J.; Duffield, T.F. Ketosis treatment in lactating dairy cattle. Vet. Clin. N. Am. Food Anim. Pract. 2013, 29, 433–445. [Google Scholar] [CrossRef]
  7. Vanholder, T.; Papen, J.; Bemers, R.; Vertenten, G.; Berge, A.C. Risk factors for subclinical and clinical ketosis and association with production parameters in dairy cows in the Netherlands. J. Dairy Sci. 2015, 98, 880–888. [Google Scholar] [CrossRef]
  8. Suthar, V.S.; Canelas-Raposo, J.; Deniz, A.; Heuwieser, W. Prevalence of subclinical ketosis and relationships with postpartum diseases in European dairy cows. J. Dairy Sci. 2013, 96, 2925–2938. [Google Scholar] [CrossRef]
  9. Overton, T.R.; McArt, J.A.A.; Nydam, D.V. A 100-Year Review: Metabolic health indicators and management of dairy cattle. J. Dairy Sci. 2017, 100, 10398–10417. [Google Scholar] [CrossRef]
  10. Ringseis, R.; Gessner, D.K.; Eder, K. Molecular insights into the mechanisms of liver-associated diseases in early-lactating dairy cows: Hypothetical role of endoplasmic reticulum stress. J. Anim. Physiol. Anim. Nutr. 2015, 99, 626–645. [Google Scholar] [CrossRef]
  11. Morris, D.G.; Waters, S.M.; McCarthy, S.D.; Patton, J.; Earley, B.; Fitzpatrick, R.; Murphy, J.J.; Diskin, M.G.; Kenny, D.A.; Brass, A.; et al. Pleiotropic effects of negative energy balance in the postpartum dairy cow on splenic gene expression: Repercussions for innate and adaptive immunity. Physiol. Genom. 2009, 39, 28–37. [Google Scholar] [CrossRef] [PubMed]
  12. LeBlanc, S.J.; Osawa, T.; Dubuc, J. Reproductive tract defense and disease in postpartum dairy cows. Theriogenology 2011, 76, 1610–1618. [Google Scholar] [CrossRef] [PubMed]
  13. Yasui, T.; McCann, K.; Gilbert, R.O.; Nydam, D.V.; Overton, T.R. Associations of cytological endometritis with energy metabolism and inflammation during the periparturient period and early lactation in dairy cows. J. Dairy Sci. 2014, 97, 2763–2770. [Google Scholar] [CrossRef] [PubMed]
  14. Kuhla, B. Review: Pro-inflammatory cytokines and hypothalamic inflammation: Implications for insufficient feed intake of transition dairy cows. Animal 2020, 14, s65–s77. [Google Scholar] [CrossRef]
  15. Stanley, S.; Wynne, K.; McGowan, B.; Bloom, S. Hormonal regulation of food intake. Physiol. Rev. 2005, 85, 1131–1158. [Google Scholar] [CrossRef]
  16. Ferguson, J.D. Nutrition and reproduction in dairy herds. Vet. Clin. N. Am.-Food A 2005, 21, 325. [Google Scholar] [CrossRef]
  17. Dervishi, E.; Zhang, G.; Hailemariam, D.; Dunn, S.M.; Ametaj, B.N. Innate immunity and carbohydrate metabolism alterations precede occurrence of subclinical mastitis in transition dairy cows. J. Anim. Sci. Technol. 2015, 57, 46. [Google Scholar] [CrossRef]
  18. Esposito, G.; Irons, P.C.; Webb, E.C.; Chapwanya, A. Interactions between negative energy balance, metabolic diseases, uterine health and immune response in transition dairy cows. Anim. Reprod. Sci. 2014, 144, 60–71. [Google Scholar] [CrossRef]
  19. Trevisi, E.; Minuti, A. Assessment of the innate immune response in the periparturient cow. Res. Vet. Sci. 2018, 116, 47–54. [Google Scholar] [CrossRef]
  20. Salcedo-Tacuma, D.; Parales-Giron, J.; Prom, C.; Chirivi, M.; Laguna, J.; Lock, A.L.; Contreras, G.A. Transcriptomic profiling of adipose tissue inflammation, remodeling, and lipid metabolism in periparturient dairy cows (Bos taurus). BMC Genom. 2020, 21, 824. [Google Scholar] [CrossRef]
  21. Yan, Z.; Huang, H.; Freebern, E.; Santos, D.J.A.; Dai, D.; Si, J.; Ma, C.; Cao, J.; Guo, G.; Liu, G.E.; et al. Integrating RNA-Seq with GWAS reveals novel insights into the molecular mechanism underpinning ketosis in cattle. BMC Genom. 2020, 21, 489. [Google Scholar] [CrossRef] [PubMed]
  22. Chankeaw, W.; Lignier, S.; Richard, C.; Ntallaris, T.; Raliou, M.; Guo, Y.; Plassard, D.; Bevilacqua, C.; Sandra, O.; Andersson, G.; et al. Analysis of the transcriptome of bovine endometrial cells isolated by laser micro-dissection (2): Impacts of post-partum negative energy balance on stromal, glandular and luminal epithelial cells. BMC Genom. 2021, 22, 450. [Google Scholar] [CrossRef] [PubMed]
  23. Matthews, D.; Diskin, M.G.; Kenny, D.A.; Creevey, C.J.; Keogh, K.; Waters, S.M. Effect of short term diet restriction on gene expression in the bovine hypothalamus using next generation RNA sequencing technology. BMC Genom. 2017, 18, 857. [Google Scholar] [CrossRef]
  24. McCabe, M.; Waters, S.; Morris, D.; Kenny, D.; Lynn, D.; Creevey, C. RNA-seq analysis of differential gene expression in liver from lactating dairy cows divergent in negative energy balance. BMC Genom. 2012, 13, 193. [Google Scholar] [CrossRef] [PubMed]
  25. Chen, S.; Zhou, Y.; Chen, Y.; Gu, J. fastp: An ultra-fast all-in-one FASTQ preprocessor. Bioinformatics 2018, 34, i884–i890. [Google Scholar] [CrossRef]
  26. Rosen, B.D.; Bickhart, D.M.; Schnabel, R.D.; Koren, S.; Elsik, C.G.; Tseng, E.; Rowan, T.N.; Low, W.Y.; Zimin, A.; Couldrey, C.; et al. De novo assembly of the cattle reference genome with single-molecule sequencing. Gigascience 2020, 9, giaa021. [Google Scholar] [CrossRef]
  27. Howe, K.L.; Achuthan, P.; Allen, J.; Allen, J.; Alvarez-Jarreta, J.; Amode, M.R.; Armean, I.M.; Azov, A.G.; Bennett, R.; Bhai, J.; et al. Ensembl 2021. Nucleic Acids Res. 2021, 49, D884–D891. [Google Scholar] [CrossRef]
  28. Kim, D.; Langmead, B.; Salzberg, S.L. HISAT: A fast spliced aligner with low memory requirements. Nat. Methods 2015, 12, 357–360. [Google Scholar] [CrossRef]
  29. Pertea, M.; Pertea, G.M.; Antonescu, C.M.; Chang, T.C.; Mendell, J.T.; Salzberg, S.L. StringTie enables improved reconstruction of a transcriptome from RNA-seq reads. Nat. Biotechnol. 2015, 33, 290–295. [Google Scholar] [CrossRef]
  30. Leek, J.T.; Johnson, W.E.; Parker, H.S.; Jaffe, A.E.; Storey, J.D. The sva package for removing batch effects and other unwanted variation in high-throughput experiments. Bioinformatics 2012, 28, 882–883. [Google Scholar] [CrossRef] [Green Version]
  31. Lawrence, M.; Huber, W.; Pages, H.; Aboyoun, P.; Carlson, M.; Gentleman, R.; Morgan, M.T.; Carey, V.J. Software for computing and annotating genomic ranges. PLoS Comput. Biol. 2013, 9, e1003118. [Google Scholar] [CrossRef] [PubMed]
  32. Love, M.I.; Huber, W.; Anders, S. Moderated estimation of fold change and dispersion for RNA-seq data with DESeq2. Genome Biol. 2014, 15, 550. [Google Scholar] [CrossRef]
  33. Emms, D.M.; Kelly, S. OrthoFinder: Phylogenetic orthology inference for comparative genomics. Genome Biol. 2019, 20, 238. [Google Scholar] [CrossRef] [PubMed]
  34. Li, J.; Miao, B.; Wang, S.; Dong, W.; Xu, H.; Si, C.; Wang, W.; Duan, S.; Lou, J.; Bao, Z.; et al. Hiplot: A comprehensive and easy-to-use web service for boosting publication-ready biomedical data visualization. Brief Bioinform. 2022, 23, bbac261. [Google Scholar] [CrossRef]
  35. Kolde, R. Pheatmap: Pretty Heatmaps. R Package. Version 1.0.12. 2019. Available online: https://CRAN.R-project.org/package=pheatmap (accessed on 4 January 2019).
  36. Subramanian, A.; Tamayo, P.; Mootha, V.K.; Mukherjee, S.; Ebert, B.L.; Gillette, M.A.; Paulovich, A.; Pomeroy, S.L.; Golub, T.R.; Lander, E.S.; et al. Gene set enrichment analysis: A knowledge-based approach for interpreting genome-wide expression profiles. Proc. Natl. Acad. Sci. USA 2005, 102, 15545–15550. [Google Scholar] [CrossRef] [PubMed]
  37. Shannon, P.; Markiel, A.; Ozier, O.; Baliga, N.S.; Wang, J.T.; Ramage, D.; Amin, N.; Schwikowski, B.; Ideker, T. Cytoscape: A software environment for integrated models of biomolecular interaction networks. Genome Res. 2003, 13, 2498–2504. [Google Scholar] [CrossRef] [PubMed]
  38. Merico, D.; Isserlin, R.; Stueker, O.; Emili, A.; Bader, G.D. Enrichment map: A network-based method for gene-set enrichment visualization and interpretation. PLoS ONE 2010, 5, e13984. [Google Scholar] [CrossRef] [PubMed]
  39. Wang, M.; Li, X.; Wang, Q.; Zhang, M.; He, J.; Ming, S.; Wang, Z.; Cao, C.; Zhang, S.; Geng, L.; et al. TLT-1 Promotes Platelet-Monocyte Aggregate Formation to Induce IL-10-Producing B Cells in Tuberculosis. J. Immunol. 2022, 208, 1642–1651. [Google Scholar] [CrossRef]
  40. Derive, M.; Bouazza, Y.; Sennoun, N.; Marchionni, S.; Quigley, L.; Washington, V.; Massin, F.; Max, J.P.; Ford, J.; Alauzet, C.; et al. Soluble TREM-like transcript-1 regulates leukocyte activation and controls microbial sepsis. J. Immunol. 2012, 188, 5585–5592. [Google Scholar] [CrossRef]
  41. Harder, J.; Meyer-Hoffert, U.; Teran, L.M.; Schwichtenberg, L.; Bartels, J.; Maune, S.; Schroder, J.M. Mucoid Pseudomonas aeruginosa, TNF-alpha, and IL-1beta, but not IL-6, induce human beta-defensin-2 in respiratory epithelia. Am. J. Respir. Cell Mol. Biol. 2000, 22, 714–721. [Google Scholar] [CrossRef]
  42. Dahlstrand Rudin, A.; Khamzeh, A.; Venkatakrishnan, V.; Basic, A.; Christenson, K.; Bylund, J. Short chain fatty acids released by Fusobacterium nucleatum are neutrophil chemoattractants acting via free fatty acid receptor 2 (FFAR2). Cell. Microbiol. 2021, 23, e13348. [Google Scholar] [CrossRef] [PubMed]
  43. Degols, G.; Eldin, P.; Mechti, N. ISG20, an actor of the innate immune response. Biochimie 2007, 89, 831–835. [Google Scholar] [CrossRef] [PubMed]
  44. Unsworth, D.J. Complement deficiency and disease. J. Clin. Pathol. 2008, 61, 1013–1017. [Google Scholar] [CrossRef] [PubMed]
  45. Friedman, J.R.; Kaestner, K.H. The Foxa family of transcription factors in development and metabolism. Cell. Mol. Life Sci. 2006, 63, 2317–2328. [Google Scholar] [CrossRef] [PubMed]
  46. Alphonse, N.; Wanford, J.J.; Voak, A.A.; Gay, J.; Venkhaya, S.; Burroughs, O.; Mathew, S.; Lee, T.; Evans, S.L.; Zhao, W.; et al. A family of conserved bacterial virulence factors dampens interferon responses by blocking calcium signaling. Cell 2022, 185, 2354–2369.e17. [Google Scholar] [CrossRef]
  47. Nair, J.S.; DaFonseca, C.J.; Tjernberg, A.; Sun, W.; Darnell, J.E., Jr.; Chait, B.T.; Zhang, J.J. Requirement of Ca2+ and CaMKII for Stat1 Ser-727 phosphorylation in response to IFN-gamma. Proc. Natl. Acad. Sci. USA 2002, 99, 5971–5976. [Google Scholar] [CrossRef]
  48. Mahata, S.K.; Corti, A. Chromogranin A and its fragments in cardiovascular, immunometabolic, and cancer regulation. Ann. N. Y. Acad. Sci. 2019, 1455, 34–58. [Google Scholar] [CrossRef] [PubMed]
  49. Rotondo, F.; Butz, H.; Syro, L.V.; Yousef, G.M.; Di Ieva, A.; Restrepo, L.M.; Quintanar-Stephano, A.; Berczi, I.; Kovacs, K. Arginine vasopressin (AVP): A review of its historical perspectives, current research and multifunctional role in the hypothalamo-hypophysial system. Pituitary 2016, 19, 345–355. [Google Scholar] [CrossRef] [PubMed]
  50. Falix, F.A.; Aronson, D.C.; Lamers, W.H.; Gaemers, I.C. Possible roles of DLK1 in the Notch pathway during development and disease. Biochim. Biophys. Acta 2012, 1822, 988–995. [Google Scholar] [CrossRef]
  51. Dankel, S.N.; Fadnes, D.J.; Stavrum, A.K.; Stansberg, C.; Holdhus, R.; Hoang, T.; Veum, V.L.; Christensen, B.J.; Vage, V.; Sagen, J.V.; et al. Switch from stress response to homeobox transcription factors in adipose tissue after profound fat loss. PLoS ONE 2010, 5, e11033. [Google Scholar] [CrossRef] [Green Version]
  52. Hjort, L.; Jorgensen, S.W.; Gillberg, L.; Hall, E.; Brons, C.; Frystyk, J.; Vaag, A.A.; Ling, C. 36 h fasting of young men influences adipose tissue DNA methylation of LEP and ADIPOQ in a birth weight-dependent manner. Clin. Epigenetics 2017, 9, 40. [Google Scholar] [CrossRef] [PubMed]
  53. Ning, M.; Zhao, Y.; Li, Z.; Cao, J. Ketosis Alters Transcriptional Adaptations of Subcutaneous White Adipose Tissue in Holstein Cows during the Transition Period. Animals 2022, 12, 2238. [Google Scholar] [CrossRef]
  54. Wang, Y.H.; Liu, C.L.; Chiu, W.C.; Twu, Y.C.; Liao, Y.J. HMGCS2 Mediates Ketone Production and Regulates the Proliferation and Metastasis of Hepatocellular Carcinoma. Cancers 2019, 11, 1876. [Google Scholar] [CrossRef] [PubMed]
  55. Contreras, G.A.; Thelen, K.; Schmidt, S.E.; Strieder-Barboza, C.; Preseault, C.L.; Raphael, W.; Kiupel, M.; Caron, J.; Lock, A.L. Adipose tissue remodeling in late-lactation dairy cows during feed-restriction-induced negative energy balance. J. Dairy Sci. 2016, 99, 10009–10021. [Google Scholar] [CrossRef] [PubMed]
  56. Egger-Danner, C.; Cole, J.B.; Pryce, J.E.; Gengler, N.; Heringstad, B.; Bradley, A.; Stock, K.F. Invited review: Overview of new traits and phenotyping strategies in dairy cattle with a focus on functional traits. Animal 2015, 9, 191–207. [Google Scholar] [CrossRef]
  57. Rauw, W.M.; Gomez-Raya, L. Genotype by environment interaction and breeding for robustness in livestock. Front. Genet. 2015, 6, 310. [Google Scholar] [CrossRef] [PubMed]
  58. Contreras, G.A.; Sordillo, L.M. Lipid mobilization and inflammatory responses during the transition period of dairy cows. Comp. Immunol. Microbiol. Infect. Dis. 2011, 34, 281–289. [Google Scholar] [CrossRef]
  59. Dervishi, E.; Zhang, G.; Hailemariam, D.; Goldansaz, S.A.; Deng, Q.; Dunn, S.M.; Ametaj, B.N. Alterations in innate immunity reactants and carbohydrate and lipid metabolism precede occurrence of metritis in transition dairy cows. Res. Vet. Sci. 2016, 104, 30–39. [Google Scholar] [CrossRef]
  60. Zhang, G.; Hailemariam, D.; Dervishi, E.; Goldansaz, S.A.; Deng, Q.; Dunn, S.M.; Ametaj, B.N. Dairy cows affected by ketosis show alterations in innate immunity and lipid and carbohydrate metabolism during the dry off period and postpartum. Res. Vet. Sci. 2016, 107, 246–256. [Google Scholar] [CrossRef]
  61. McFadden, J.W. Review: Lipid biology in the periparturient dairy cow: Contemporary perspectives. Animal 2020, 14, s165–s175. [Google Scholar] [CrossRef] [Green Version]
  62. Dadarwal, D.; Palmer, C.; Griebel, P. Mucosal immunity of the postpartum bovine genital tract. Theriogenology 2017, 104, 62–71. [Google Scholar] [CrossRef] [PubMed]
  63. LeBlanc, S.J. Interactions of metabolism, inflammation, and reproductive tract health in the postpartum period in dairy cattle. Reprod. Domest. Anim. 2012, 47 (Suppl. S5), 18–30. [Google Scholar] [CrossRef] [PubMed]
  64. Moyes, K.M.; Drackley, J.K.; Morin, D.E.; Loor, J.J. Greater expression of TLR2, TLR4, and IL6 due to negative energy balance is associated with lower expression of HLA-DRA and HLA-A in bovine blood neutrophils after intramammary mastitis challenge with Streptococcus uberis. Funct. Integr. Genom. 2010, 10, 53–61. [Google Scholar] [CrossRef]
  65. Esposito, G.; Raffrenato, E.; Lukamba, S.D.; Adnane, M.; Irons, P.C.; Cormican, P.; Tasara, T.; Chapwanya, A. Characterization of metabolic and inflammatory profiles of transition dairy cows fed an energy-restricted diet. J. Anim. Sci. 2020, 98, skz391. [Google Scholar] [CrossRef] [PubMed]
  66. Bannerman, D.D.; Paape, M.J.; Hare, W.R.; Sohn, E.J. Increased levels of LPS-binding protein in bovine blood and milk following bacterial lipopolysaccharide challenge. J. Dairy Sci. 2003, 86, 3128–3137. [Google Scholar] [CrossRef] [PubMed]
  67. Rahman, M.M.; Lecchi, C.; Sauerwein, H.; Mielenz, M.; Haussler, S.; Restelli, L.; Giudice, C.; Ceciliani, F. Expression of alpha1-acid glycoprotein and lipopolysaccharide binding protein in visceral and subcutaneous adipose tissue of dairy cattle. Vet. J. 2015, 203, 223–227. [Google Scholar] [CrossRef]
  68. Townsend, M.; Singh, B. Pentraxin 3 expression in lungs and neutrophils of calves. Vet. Immunol. Immunopathol. 2021, 236, 110251. [Google Scholar] [CrossRef]
  69. Imamura, M.; Kawasaki, T.; Savchenko, A.S.; Ohashi, R.; Jiang, S.; Miyamoto, K.; Ito, Y.; Iwanari, H.; Sagara, M.; Tanaka, T.; et al. Lipopolysaccharide induced expression of pentraxin 3 in human neutrophils and monocyte-derived macrophages. Cell. Immunol. 2007, 248, 86–94. [Google Scholar] [CrossRef]
  70. Camozzi, M.; Rusnati, M.; Bugatti, A.; Bottazzi, B.; Mantovani, A.; Bastone, A.; Inforzato, A.; Vincenti, S.; Bracci, L.; Mastroianni, D.; et al. Identification of an antiangiogenic FGF2-binding site in the N terminus of the soluble pattern recognition receptor PTX3. J. Biol. Chem. 2006, 281, 22605–22613. [Google Scholar] [CrossRef]
  71. Genís, S.; Arís, A.; Kaur, M.; Cerri, R.L.A. Effect of metritis on endometrium tissue transcriptome during puerperium in Holstein lactating cows. Theriogenology 2018, 122, 116–123. [Google Scholar] [CrossRef] [Green Version]
  72. Cozzi, V.; Garlanda, C.; Nebuloni, M.; Maina, V.; Martinelli, A.; Calabrese, S.; Cetin, I. PTX3 as a potential endothelial dysfunction biomarker for severity of preeclampsia and IUGR. Placenta 2012, 33, 1039–1044. [Google Scholar] [CrossRef] [PubMed]
  73. Hatakeyama, T.; Okada, M.; Shimamoto, S.; Kubota, Y.; Kobayashi, R. Identification of intracellular target proteins of the calcium-signaling protein S100A12. Eur. J. Biochem. 2004, 271, 3765–3775. [Google Scholar] [CrossRef]
  74. Zhong, K.; Zhang, C.-Y.; Zha, G.-M.; Wang, X.-J.; Jiao, X.-Q.; Zhu, H.-S.; Wang, Y.-Y. S100 calcium-binding protein A12 as a diagnostic index for subclinical mastitis in cows. Reprod. Domest. Anim. 2018, 53, 1442–1447. [Google Scholar] [CrossRef] [PubMed]
  75. Guo, L.-Y.; Yang, F.; Peng, L.-J.; Li, Y.-B.; Wang, A.P. CXCL2, a new critical factor and therapeutic target for cardiovascular diseases. Clin. Exp. Hypertens. 2020, 42, 428–437. [Google Scholar] [CrossRef] [PubMed]
  76. Rouault, C.; Pellegrinelli, V.; Schilch, R.; Cotillard, A.; Poitou, C.; Tordjman, J.; Sell, H.; Clement, K.; Lacasa, D. Roles of chemokine ligand-2 (CXCL2) and neutrophils in influencing endothelial cell function and inflammation of human adipose tissue. Endocrinology 2013, 154, 1069–1079. [Google Scholar] [CrossRef] [PubMed]
  77. Burfeind, K.G.; Zhu, X.; Levasseur, P.R.; Michaelis, K.A.; Norgard, M.A.; Marks, D.L. TRIF is a key inflammatory mediator of acute sickness behavior and cancer cachexia. Brain Behav. Immun. 2018, 73, 64–374. [Google Scholar] [CrossRef] [PubMed]
  78. Mosialou, I.; Shikhel, S.; Luo, N.; Petropoulou, P.I.; Panitsas, K.; Bisikirska, B.; Rothman, N.J.; Tenta, R.; Cariou, B.; Wargny, M.; et al. Lipocalin-2 counteracts metabolic dysregulation in obesity and diabetes. J. Exp. Med. 2020, 217, e20191261. [Google Scholar] [CrossRef] [PubMed]
  79. Frances, L.; Tavernier, G.; Viguerie, N. Adipose-Derived Lipid-Binding Proteins: The Good, the Bad and the Metabolic Diseases. Int. J. Mol. Sci. 2021, 22, 10460. [Google Scholar] [CrossRef]
  80. Petropoulou, P.I.; Mosialou, I.; Shikhel, S.; Hao, L.; Panitsas, K.; Bisikirska, B.; Luo, N.; Bahna, F.; Kim, J.; Carberry, P.; et al. Lipocalin-2 is an anorexigenic signal in primates. eLife 2020, 9, e58949. [Google Scholar] [CrossRef]
  81. Contreras, G.A.; Strieder-Barboza, C.; De Koster, J. Modulating adipose tissue lipolysis and remodeling to improve immune function during the transition period and early lactation of dairy cows. J. Dairy Sci. 2018, 101, 2737–2752. [Google Scholar] [CrossRef] [Green Version]
  82. Taniguchi, T.; Ogasawara, K.; Takaoka, A.; Tanaka, N. IRF family of transcription factors as regulators of host defense. Annu. Rev. Immunol. 2001, 19, 623–655. [Google Scholar] [CrossRef] [PubMed]
  83. Kowalec, K.; Wright, G.E.B.; Drögemöller, B.I.; Aminkeng, F.; Bhavsar, A.P.; Kingwell, E.; Yoshida, E.M.; Traboulsee, A.; Marrie, R.A.; Kremenchutzky, M.; et al. Common variation near IRF6 is associated with IFN-β-induced liver injury in multiple sclerosis. Nat. Genet. 2018, 50, 1081–1085. [Google Scholar] [CrossRef] [PubMed]
  84. Chen, H.; Chu, H.; Jiang, Q.; Wang, C.; Tian, Y. Irf6 participates in sevoflurane-induced perioperative neurocognitive disorder via modulating M2, but not M1 polarization of microglia. Brain Res. Bull. 2021, 177, 1–11. [Google Scholar] [CrossRef] [PubMed]
  85. Li, C.; Ying, W.; Huang, Z.; Brehm, T.; Morin, A.; Vella, A.T.; Zhou, B. IRF6 Regulates Alternative Activation by Suppressing PPARgamma in Male Murine Macrophages. Endocrinology 2017, 158, 2837–2847. [Google Scholar] [CrossRef] [PubMed]
Figure 1. Transcriptional expression analysis of innate immune genes in different tissues. (A) PCA of 1232 bovine innate immune genes from different tissues. (B) Heatmap of the transcriptional expression of innate immune genes from different tissues, Kmer = 12, (C) DEGs (Log2FC > 1, p-value < 0.05) of innate immune genes from different tissues. (D) TOP 10 innate immune DEGs of different tissues.
Vetsci 10 00107 g001
Figure 2. GSEA of innate immune genes from different tissues. (A) Number of GO(BP) terms enriched by GSEA (p-value < 0.05); (B) upset plot of the GO(BP) terms enriched by GSEA (p-value < 0.05), both the x-axis and y-axis for the numbers of terms.
Vetsci 10 00107 g002
Figure 3. Cluster of the GO(BP) terms from every tissue. Red dots for up-regulated processes in NEB group and blue dots for down-regulated ones.
Vetsci 10 00107 g003
Figure 4. NEB altered the defense and inflammation-related processes and innate immune genes. (A) The cluster of the biological processes enriched from different tissues by GSEA as similarity, and different colors of pie plots means shared processes of multi-tissue. The processes in the circle are mainly related to defense and inflammation. (B) The network of shared hub processes related to defense and inflammation from multi-tissue. (C) The heatmap of NES value of the processes enriched from the five tissues. (D) The PPI network of the shared DEGs with great differences. The bar graph shows upregulation above the baseline and downregulation below. The y-axis shows Log2FC.
Vetsci 10 00107 g004
Table 1. Detailed information about the RNA-seq data.
Trait MaterialData GroupingSequencing PlatformData SourcesAccession
Numbers
AdiposeNormal (PreP), n = 12
NEB (PP1), n = 12
Illumina NextSeq 500 (Bos taurus)David Salcedo-Tacuma, 2020GSE159224
BloodNormal, n = 10
NEB, n = 13
Illumina HiSeq 2000 (Bos taurus)Ze Yan, 2020PRJNA605719
EndometriumNormal (MNEB), n = 15
NEB (SNEB), n = 9
Illumina HiSeq 4000 (Bos taurus)Wiruntita Chankeaw, 2021GSE169638
HypothalamusNormal (Restricted), n = 14
NEB (high level), n = 7
Illumina HiSeq 4000 (Bos taurus)Daragh Matthews, 2017GSE49540
LiverNormal (MNEB), n = 5
NEB (SNEB), n = 6
Illumina Genome Analyzer (Bos taurus)Matthew McCabe, 2012GSE37544
Table 2. The top 5 GO terms of up-regulated and down-regulated processes from every tissue.
GO TermNESTissueRegulated
Humoral Immune Response Mediated by Circulating Immunoglobulin1.8095AdiposeUp
Membrane Invagination1.8004AdiposeUp
Regulation of Humoral Immune Response1.7919AdiposeUp
Amyloid Beta Clearance1.7888AdiposeUp
Complement Activation1.7642AdiposeUp
Negative Regulation of Blood Vessel Diameter−1.6923AdiposeDown
Regulation of Steroid Biosynthetic Process−1.702AdiposeDown
Regulation of Steroid Metabolic Process−1.7112AdiposeDown
Fatty Acid Metabolic Process−1.9598AdiposeDown
Sterol Metabolic Process−2.1124AdiposeDown
Myeloid Leukocyte Mediated Immunity2.2295BloodUp
Exocytosis2.1093BloodUp
Myeloid Leukocyte Activation1.9157BloodUp
Defense Response to Gram-Positive Bacterium1.8822BloodUp
Cell Activation Involved in Immune Response1.8773BloodUp
B Cell Activation−1.9504BloodDown
Regulation of Fat Cell Differentiation−2.0154BloodDown
Regulation of Immunoglobulin Production−2.147BloodDown
B Cell Activation Involved in Immune Response−2.2318BloodDown
Immunoglobulin Production−2.2439BloodDown
Lymphocyte Chemotaxis1.9792EndometriumUp
Protein-DNA Complex Subunit Organization1.9613EndometriumUp
Organ Growth1.949EndometriumUp
Heart Growth1.8857EndometriumUp
Positive Regulation of Heart Growth1.8108EndometriumUp
Cellular Response to Virus−1.6434EndometriumDown
Positive Regulation of Response to Cytokine Stimulus−1.6448EndometriumDown
Sterol Metabolic Process−1.6475EndometriumDown
Regulation of Jun Kinase Activity−1.6754EndometriumDown
Positive Regulation of Jun Kinase Activity−1.7641EndometriumDown
Response to Retinoic Acid1.9746HypothalamusUp
Positive Regulation of CD4-Positive Alpha Beta T-Cell Differentiation1.8528HypothalamusUp
Regulation of CD4-Positive Alpha Beta T-Cell Differentiation1.7604HypothalamusUp
Leukocyte Homeostasis1.6864HypothalamusUp
Response to Chemokine1.6836HypothalamusUp
Non-canonical Wnt Signaling Pathway−1.6246HypothalamusDown
Calcium Ion Transmembrane Import into Cytosol−1.6279HypothalamusDown
Neuron Projection Organization−1.6319HypothalamusDown
Cellular Response to Ketone−1.6627HypothalamusDown
Regulation of Calcium Ion Transmembrane Transport−1.6661HypothalamusDown
Tissue Migration1.695LiverUp
Negative Regulation of Cell Adhesion1.6623LiverUp
Negative Regulation of Coagulation1.6527LiverUp
Odontogenesis1.65LiverUp
Positive Regulation of Cell Division1.6472LiverUp
Calcineurin-Mediated Signaling−1.656LiverDown
Positive Regulation of Lipid Kinase Activity−1.6596LiverDown
Glucose Metabolic Process−1.6671LiverDown
Establishment of Cell Polarity−1.7294LiverDown
Positive Regulation of Phospholipid Metabolic Process−1.7409LiverDown
Disclaimer/Publisher’s Note: The statements, opinions and data contained in all publications are solely those of the individual author(s) and contributor(s) and not of MDPI and/or the editor(s). MDPI and/or the editor(s) disclaim responsibility for any injury to people or property resulting from any ideas, methods, instructions or products referred to in the content.

