1. Introduction
Despite all the advances in the control of HIV-1 infection, the virus remains a major public health problem worldwide, with an estimated 1.3 million new infections each year [
1]. Because there is still no treatment available to eradicate the infection, the main control measure is antiretroviral therapy (ART), which promotes a reduction in viral load to undetectable levels, allowing the restoration of the individual’s immune response [
2,
3]. Unfortunately, ART may contribute to the development of metabolic changes and autoimmune reactions [
3,
4,
5,
6].
The development of autoimmune diseases is mainly attributed to genetic and environmental factors that are responsible for triggering the dysfunction of the immune response [
7]. Among the environmental factors, viruses are primarily responsible for triggering autoimmune events in genetically susceptible individuals. The mechanisms related to the breakdown of self-tolerance include molecular mimicry and the activation of a marked and nonspecific antiviral immune response, which can induce the formation of self-reactive B and T cells [
8]. In addition to the HIV-1 infection itself being able to induce a drop in self-tolerance, treatment with antiretrovirals (ARVs) has been associated with the development of autoimmune manifestations by promoting the reestablishment of an individual’s immunological competence [
9].
Some cytosolic sensors involved in innate immunity may act in the initial prevention of an autoimmune response [
10,
11]. In infections, the activity of these sensors may contribute to the restriction or permissiveness of retroviral infections [
12,
13,
14]. The three-prime repair exonuclease 1 (TREX1) protein is a sensor that promotes the degradation of DNA dispersed in the cytoplasm (ssDNA and dsDNA), both of endogenous and exogenous origin, contributing to the prevention of autoimmune diseases [
12]. TREX1 activity may favor the persistence of some viral infections and is considered a factor of retroviral permissiveness [
13,
15]. The TREX1 activity inhibits the recognition of viral DNA by the cyclic GMP-AMP synthase (cGAS) sensor and the activation of the cGAS-STING pathway, resulting in reduced expression of IFN-I, which is essential for the control of viral infections [
16,
17].
Genetic variations in different cytosolic sensors that may influence the course of autoimmune diseases and viral infections have been investigated [
18,
19]. Polymorphisms in the
TREX1 gene were associated with autoimmune manifestations, such as systemic lupus erythematosus and Sjögren’s syndrome [
20,
21], and with retrovirus infection [
6,
18,
22]. Among the various polymorphisms located in the
TREX1 gene, some stand out in HIV-1 infection; the
TREX1 rs3135941 (T/C) polymorphism was related to faster progression of the infection [
23], and the
TREX1 rs3135945 (G/A) polymorphism was associated with susceptibility to virus infection [
22]. The
TREX1 rs11797 (C/T) variation is associated with the maintenance of the immune status of individuals with HIV-1 [
6]. However, in human T-cell leukemia virus type 1 (HTLV-1) infection, the
TREX1 rs11797 (C/T) polymorphism was associated with a high proviral load [
18].
Although different TREX1 gene polymorphisms have been associated with retroviral infections, neither the relationship between TREX1 gene expression level and its polymorphisms nor the influence of TREX1 gene expression levels on the development of antinuclear antibodies (ANAs) in HIV-1 infection have been determined. This study investigated the association of variations in TREX1 gene expression levels with the TREX1 rs3135941 (T/C) and TREX1 rs3135945 (G/A) polymorphisms and the presence of ANA in ART-naïve individuals and after 1 year of treatment.
2. Materials and Methods
2.1. Type of Study, Population, and Sample Collection
In this longitudinal study, we evaluated a cohort of 119 ART-naïve people living with HIV-1 who were followed up and evaluated twice, namely before starting therapy and after 1 year of ART use. The individuals were from the outpatient clinic of the Casa Dia Testing and Counseling Center (CAT/SAE), located in the city of Belém, Pará, Brazil. The inclusion criteria for individuals in the cohort were age ≥ 18 years, being of either sex, and not having used antiretroviral drugs. The exclusion criteria were autoimmune disease, coinfection with hepatitis B virus, hepatitis C virus, hepatitis D virus or HTLV-1/2, use of corticosteroids, and clinical diagnosis of AIDS. Individuals who did not undergo treatment for 1 year of the study were also excluded.
To compare the genotypic and allelic frequencies of polymorphisms in the TREX1 gene, a group of 167 blood donors seronegative for HIV, HBV, HCV, HTLV, Chagas disease, and syphilis was used. This group was called the control group, and individuals were selected by matching for age and sex with the individuals in the HIV-1 group.
Blood samples were collected in two tubes (5 mL each) containing ethylenediaminetetraacetic acid (EDTA) as an anticoagulant. The samples were transported to the Laboratory of Virology of the Federal University of Pará, where they were subjected to aliquot separation of whole blood, leukocytes, and plasma. Whole blood samples were used for quantification of CD4+ and CD8+ T and genomic DNA extraction. Plasma samples were used to quantify the HIV-1 plasma viral load and IFN-α concentration. Leukocyte samples were subjected to RNA extraction.
2.2. Ethics Approval
The project was approved by the Ethics Committee of the Oncology Research Center of the Federal University of Pará (CAAE 66529116.4.0000.5634). All the subjects were informed about the project. All participants were adults, and those who agreed to participate had to sign an informed consent form.
2.3. DNA Extraction
Genomic DNA was extracted from peripheral blood leukocytes using the Puregene™ Kit (Gentra Systems, Minneapolis, MN, USA) following the steps of cell lysis, protein precipitation, DNA precipitation, and DNA hydration. All processing steps followed the manufacturer’s recommendations.
2.4. Genotyping of TREX1 rs3135941 (T/C) and TREX1 rs3135945 (G/A)
Genotyping was performed by real-time PCR using the StepOnePLUS™ Real-Time PCR System (Thermo Fisher, Carlsbad, CA, USA). The reaction was performed using the TaqMan™ TREX1 assay 3135941 (C__32390138_10) and rs3135945 (C__32390141_10), obtained commercially and containing specific primers and probes for amplification of the target sequence (Thermo Fisher, Carlsbad, CA, USA). The reaction consisted of 1× MasterMix, H2O, 20× assay, and 50 ng of DNA. The cycling program was 10 min at 95 °C, 40 cycles of 15 s at 95 °C, and 1 min at 60 °C.
2.5. RNA Extraction and Reverse Transcription
Total RNA was extracted from peripheral blood leukocytes using the total RNA extraction kit TRIzol™ Plus RNA Purification Kit (Thermo Fisher Scientific, Waltham, MA, USA). The concentration of the extracted RNA was determined using a BioDrop™ (Bio-Rad, Hercules, CA, USA) according to the manufacturer’s instructions. The concentrations of total RNA were set to 50 ng/µL for the synthesis of complementary DNA (cDNA).
The extracted RNA was converted into cDNA using the High-capacity cDNA Reverse Transcription® with RNase Inhibitor kit (Applied Biosystems, Foster City, CA, USA). For the cDNA reaction, a mixture with a final volume of 20 µL was prepared containing 2 µL of 10× RT Buffer, 0.8 µL of 25× dNTP Mix (100 nM), 2 µL of random primer, 1 µL of MultiScribeTM Reverse Transcriptase, 1 µL of RNase OnceTTM, 3.2 µL of ultrapure water supplied by the kit, and 10 µL of extracted RNA. The mixture was subjected to PCR in a Mastercycler Personal thermal cycler (Eppendorf, Hamburg, Germany) with cycles of 25 °C for 10 min, 37 °C for 120 min, and 85 °C for 5 min.
2.6. Quantification of Gene Expression
TREX1 gene expression was performed by quantifying the mRNA using the real-time PCR (qPCR) technique. Initially, the standardization of the qPCR with the cDNA and probes (endogenous and target genes) was performed to calculate the efficiency of the amplification reactions. In the standardization reactions, different concentrations of cDNA were tested (pure and in 4 dilutions of factor 2, 1:2, 1:4, 1:8, and 1:16). All the reactions were performed on plates and in triplicate, and the same cDNA (at different dilutions) was analyzed with the different probes to draw an efficiency curve to validate the 2-ΔΔCT analytical method (∆∆Ct = ∆Csample − ∆Ctreference). All tests showed the expected efficiency (100% ± 10) [
24].
The relative quantification of gene expression consisted of the amplification of the target gene with the endogenous gene (normalizer) using TaqMan™ assays (Applied Biosystems, Foster City, CA, USA) and the StepOnePLUS™ Real-Time PCR System (Thermo Fisher Scientific, Waltham, MA, USA). The reactions were performed in a single-plex format according to the manufacturer’s protocol. The test used for TREX1 expression was Hs03989617, and the glyceraldehyde-3-phosphate dehydrogenase (GAPDH) gene (Hs02786624_g1) was used as an endogenous control. All the products were obtained commercially (Thermo Fisher Scientific, Waltham, MA, USA). For the reaction, 15 µL of 2× TaqMan® Universal PCR Master Mix, 1.5 µL of 20× TaqMan Gene Expression Assays, 3 µL of cDNA and 10.5 µL of RNase-free water were used. The thermocycling program was 2 min at 50 °C, 10 min at 95 °C, and 1 min at 60 °C. The relative quantification (RQ) of the expression of target genes was determined using the comparative CT method (∆∆Ct), using the formula 2−ΔΔCT, where ∆∆Ct = ∆Ct sample − ∆Ct reference (Life Technologies, Carlsbad, CA, USA).
2.7. Quantification of CD4+ and CD8+ T Lymphocytes and the HIV-1 Plasma Viral Load
The CD4+ and CD8+ T lymphocyte counts were performed at the Virology Laboratory, as established by the National Network of CD4+/CD8+ T lymphocytes of the Ministry of Health. The flow cytometry methodology was used, which evaluated a whole blood sample with EDTA, using BD FACScount equipment and BD multi-test reagents (CD45, CD3, CD4, and CD8) (BD, Franklin Lakes, NJ, USA), following the protocol recommended by the manufacturer.
The plasma viral load was determined at the Virology Laboratory, following the standard methodology of the National Viral Load Network of the Ministry of Health, based on qPCR technology, using the Sample Purific CV HIV-1 Extraction Kit, the HIV-1 Viral Load Amplification, and the Abbott 2000mrt thermal cycler (ABBOTT, Chicago, IL, USA) and all steps were followed according to the manufacturer’s recommendations. Viral load measurements were used in log10.
2.8. Plasma Concentration of IFN-α
IFN-α levelswere quantified by enzyme-linked immunosorbent assay (ELISA) using the IFN alpha Human ELISA Kit (Thermo Fisher, Waltham, MA, USA), which uses specific monoclonal antibodies to detect cytokines. The test was performed according to the manufacturer’s recommendations.
2.9. ANA Research in HEp-2 Cells
The plasma samples were tested using the commercial VIRGO® ANA/HEp-2 IgG indirect fluorescent antibody (IFA) kit (Hemagen Diagnostics, Columbia, MD, USA) following the manufacturer’s specifications. The slides were read under an Eclipse E-200 immunofluorescence microscope (Nikon, Minato, Tokyo, Japan) using a 10× ocular lens and a 40× objective lens. To record and store the images obtained from the fluorescence standards, a ZOE Fluorescent Cell Imager was used (Bio-Rad, Hercules, CA, USA).
2.10. Statistical Analysis
The obtained information was entered into a database in the Microsoft Office Excelsoftware version 2019. The allelic and genotypic frequencies of the polymorphisms were determined by direct counting, and the differences between the HIV-positive and control groups were assessed using the chi-square test or G test. The Hardy–Weinberg equilibrium test was performed to assess the expected frequency of TREX1 rs3135941 (T/C) and TREX1 rs3135945 (G/A) genotypes in each group. The normality of quantitative data was assessed using the Shapiro–Wilk test. Continuous variables before and after 1 year of ART use were compared using the Wilcoxon test, and comparison among the genotypes for TREX1 rs3135941(C/T) was performed using the Kruskal–Wallis test. Viral load was compared using the chi-squared test or G test. All tests were performed in Biostat 5.3 software version 5.3 or GraphPad Prism 8.0. Statistical tests with p values < 0.05 were considered significant.
3. Results
The mean age of individuals with HIV-1 was 39.17 years and the majority were male (61.54%). A comparison of the genotypic and allelic frequencies of
TREX1 rs3135941 (T/C) and
TREX1 rs3135945 (G/A) between the HIV-1 and control groups showed that the HIV-1 group had a higher frequency of the polymorphic genotypes (CC and CT) for the
TREX1 rs3135941 (T/C) genetic variation, but these differences were not statistically significant. For
TREX1 rs3135945 (G/A), the genotype distribution was very similar between the two groups (
Table 1).
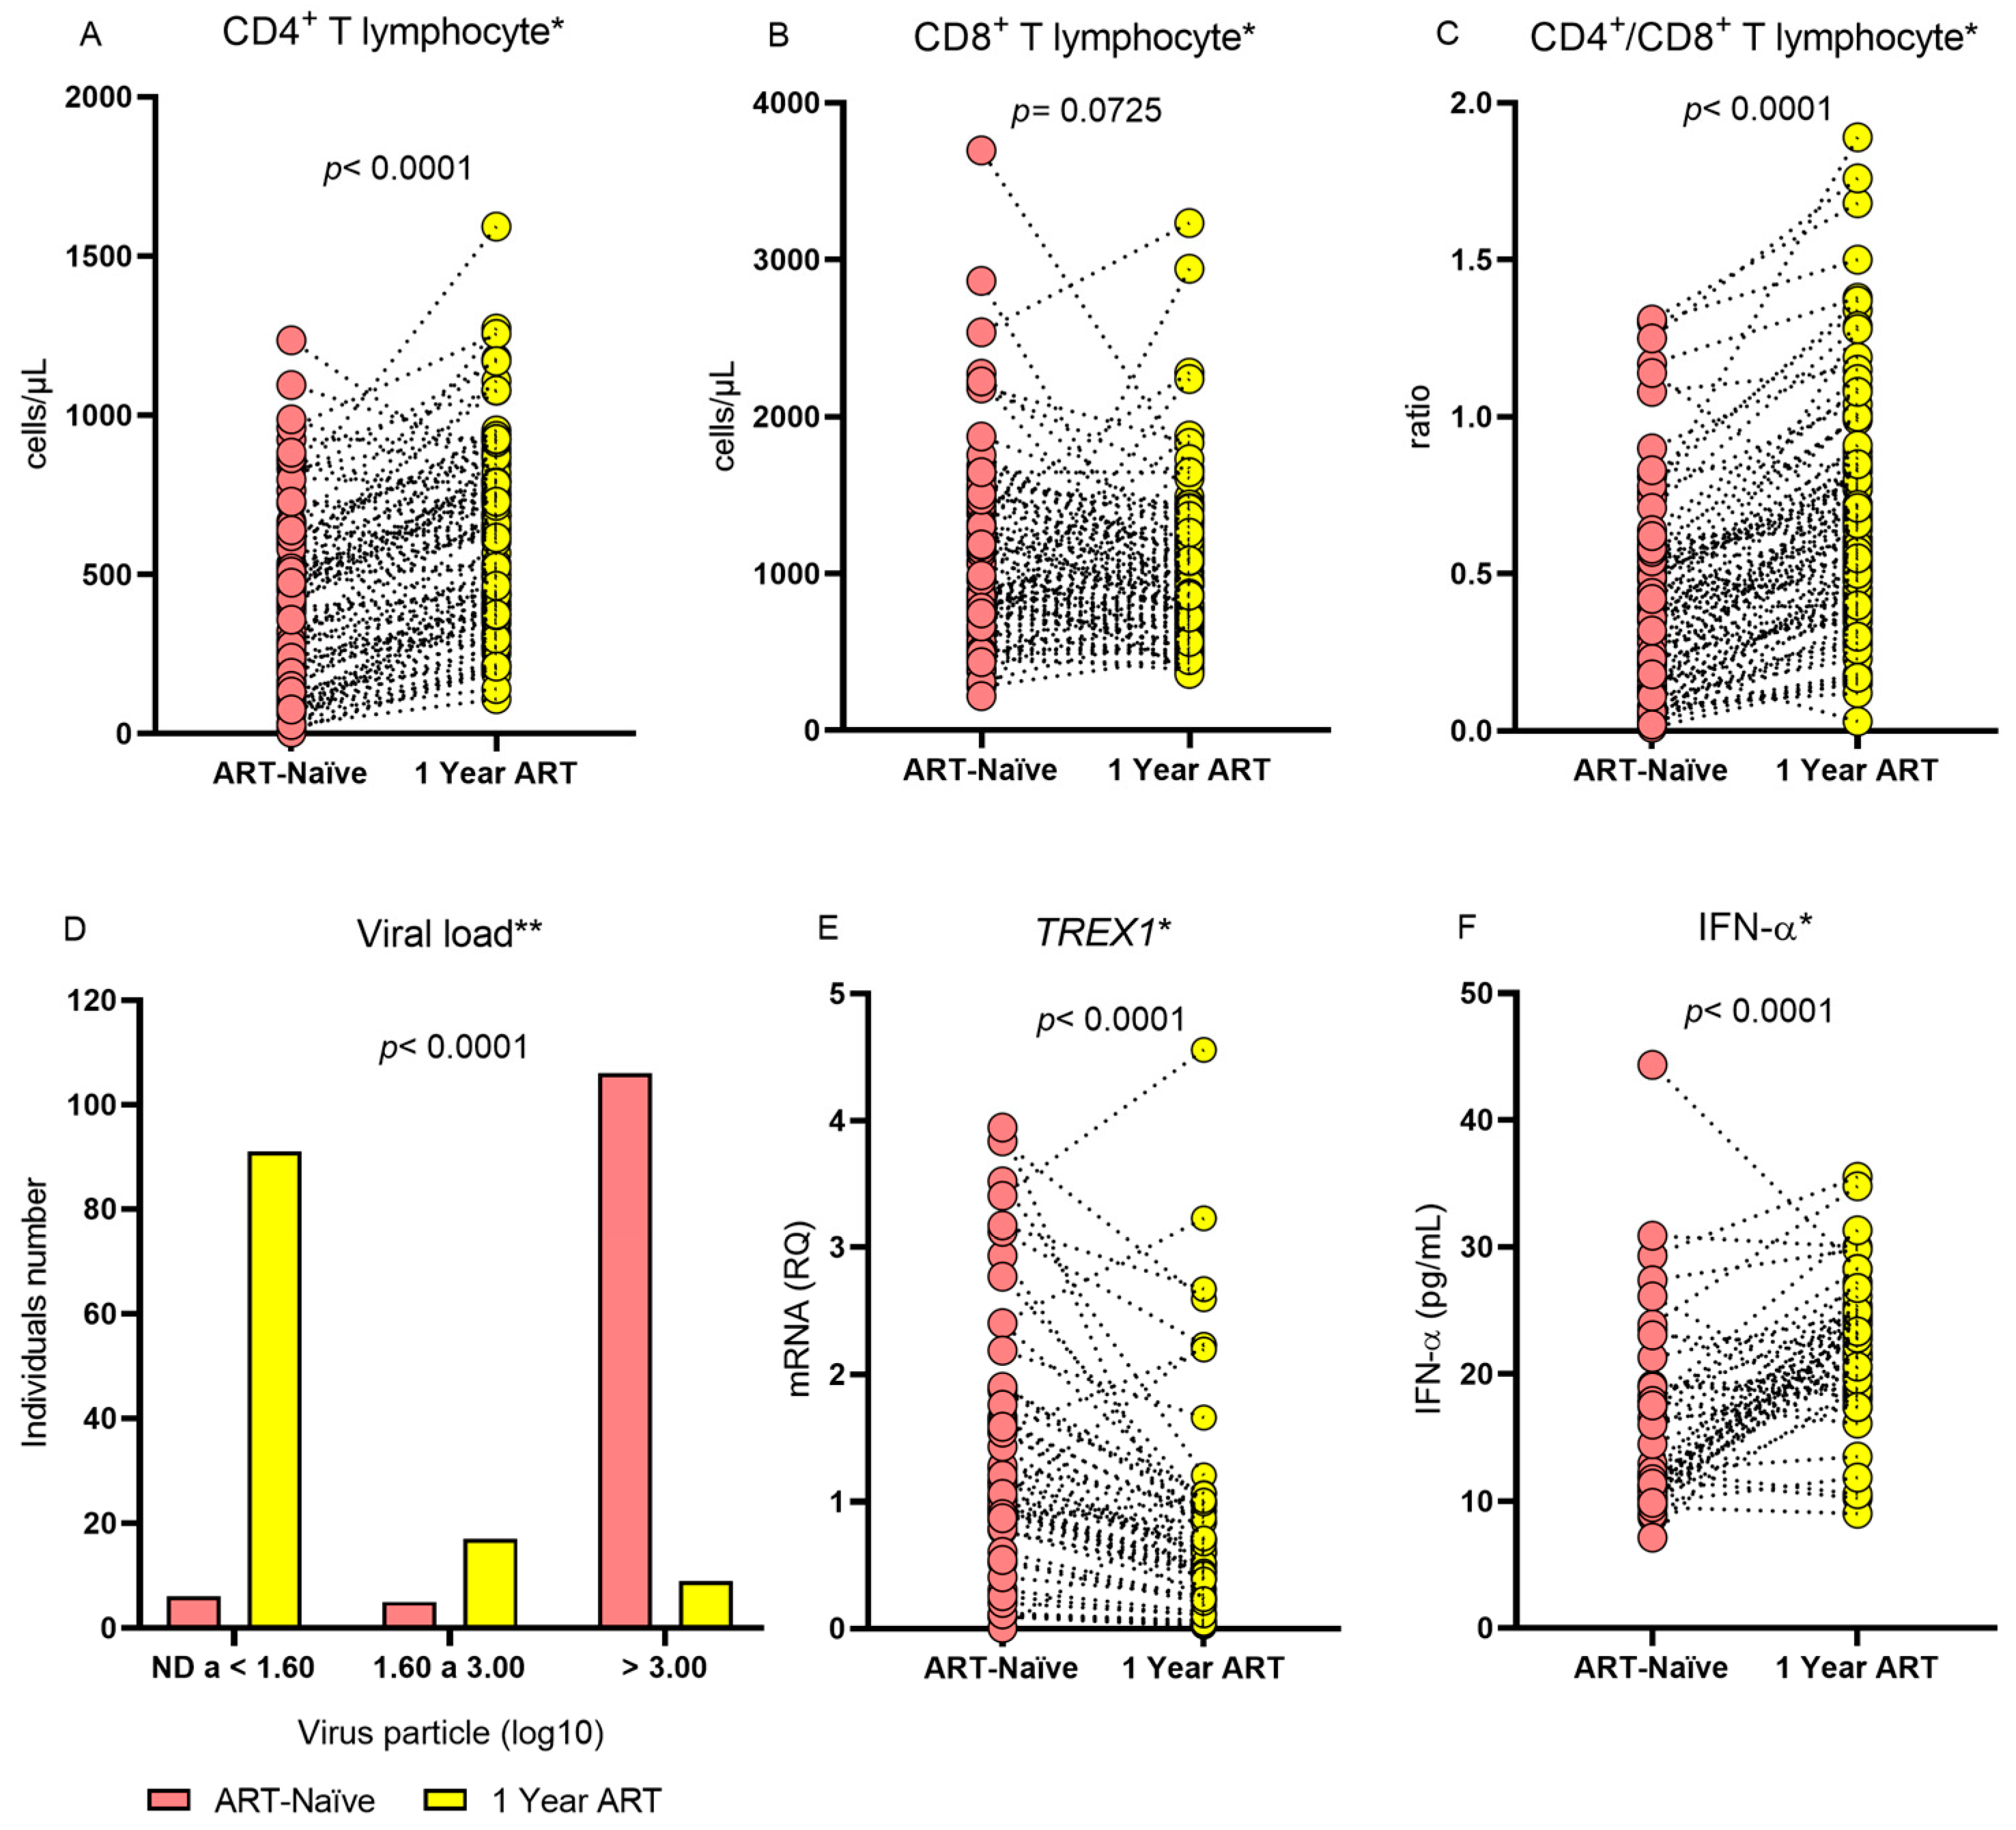
The evaluation of individuals with HIV-1 before and after 1 year of treatment showed that the median CD4
+ T lymphocyte count and the CD4
+/CD8
+ T lymphocyte ratio were higher during ART use and that individuals were more likely to have a lower viral load during the same period. After 1 year of therapy, the median
TREX1 gene expression was lower and the IFN-α level was higher (
Table 2 and
Figure 1). The therapeutic regimens applied to the patients were tenofovir/lamivudine/efavirenz (n = 117; 98.32%), atazanavir/tenofovir/lamivudine/ritonavir (n = 1; 0.84%), and tenofovir/lamivudine/dolutegravir (n = 1; 0.84%).
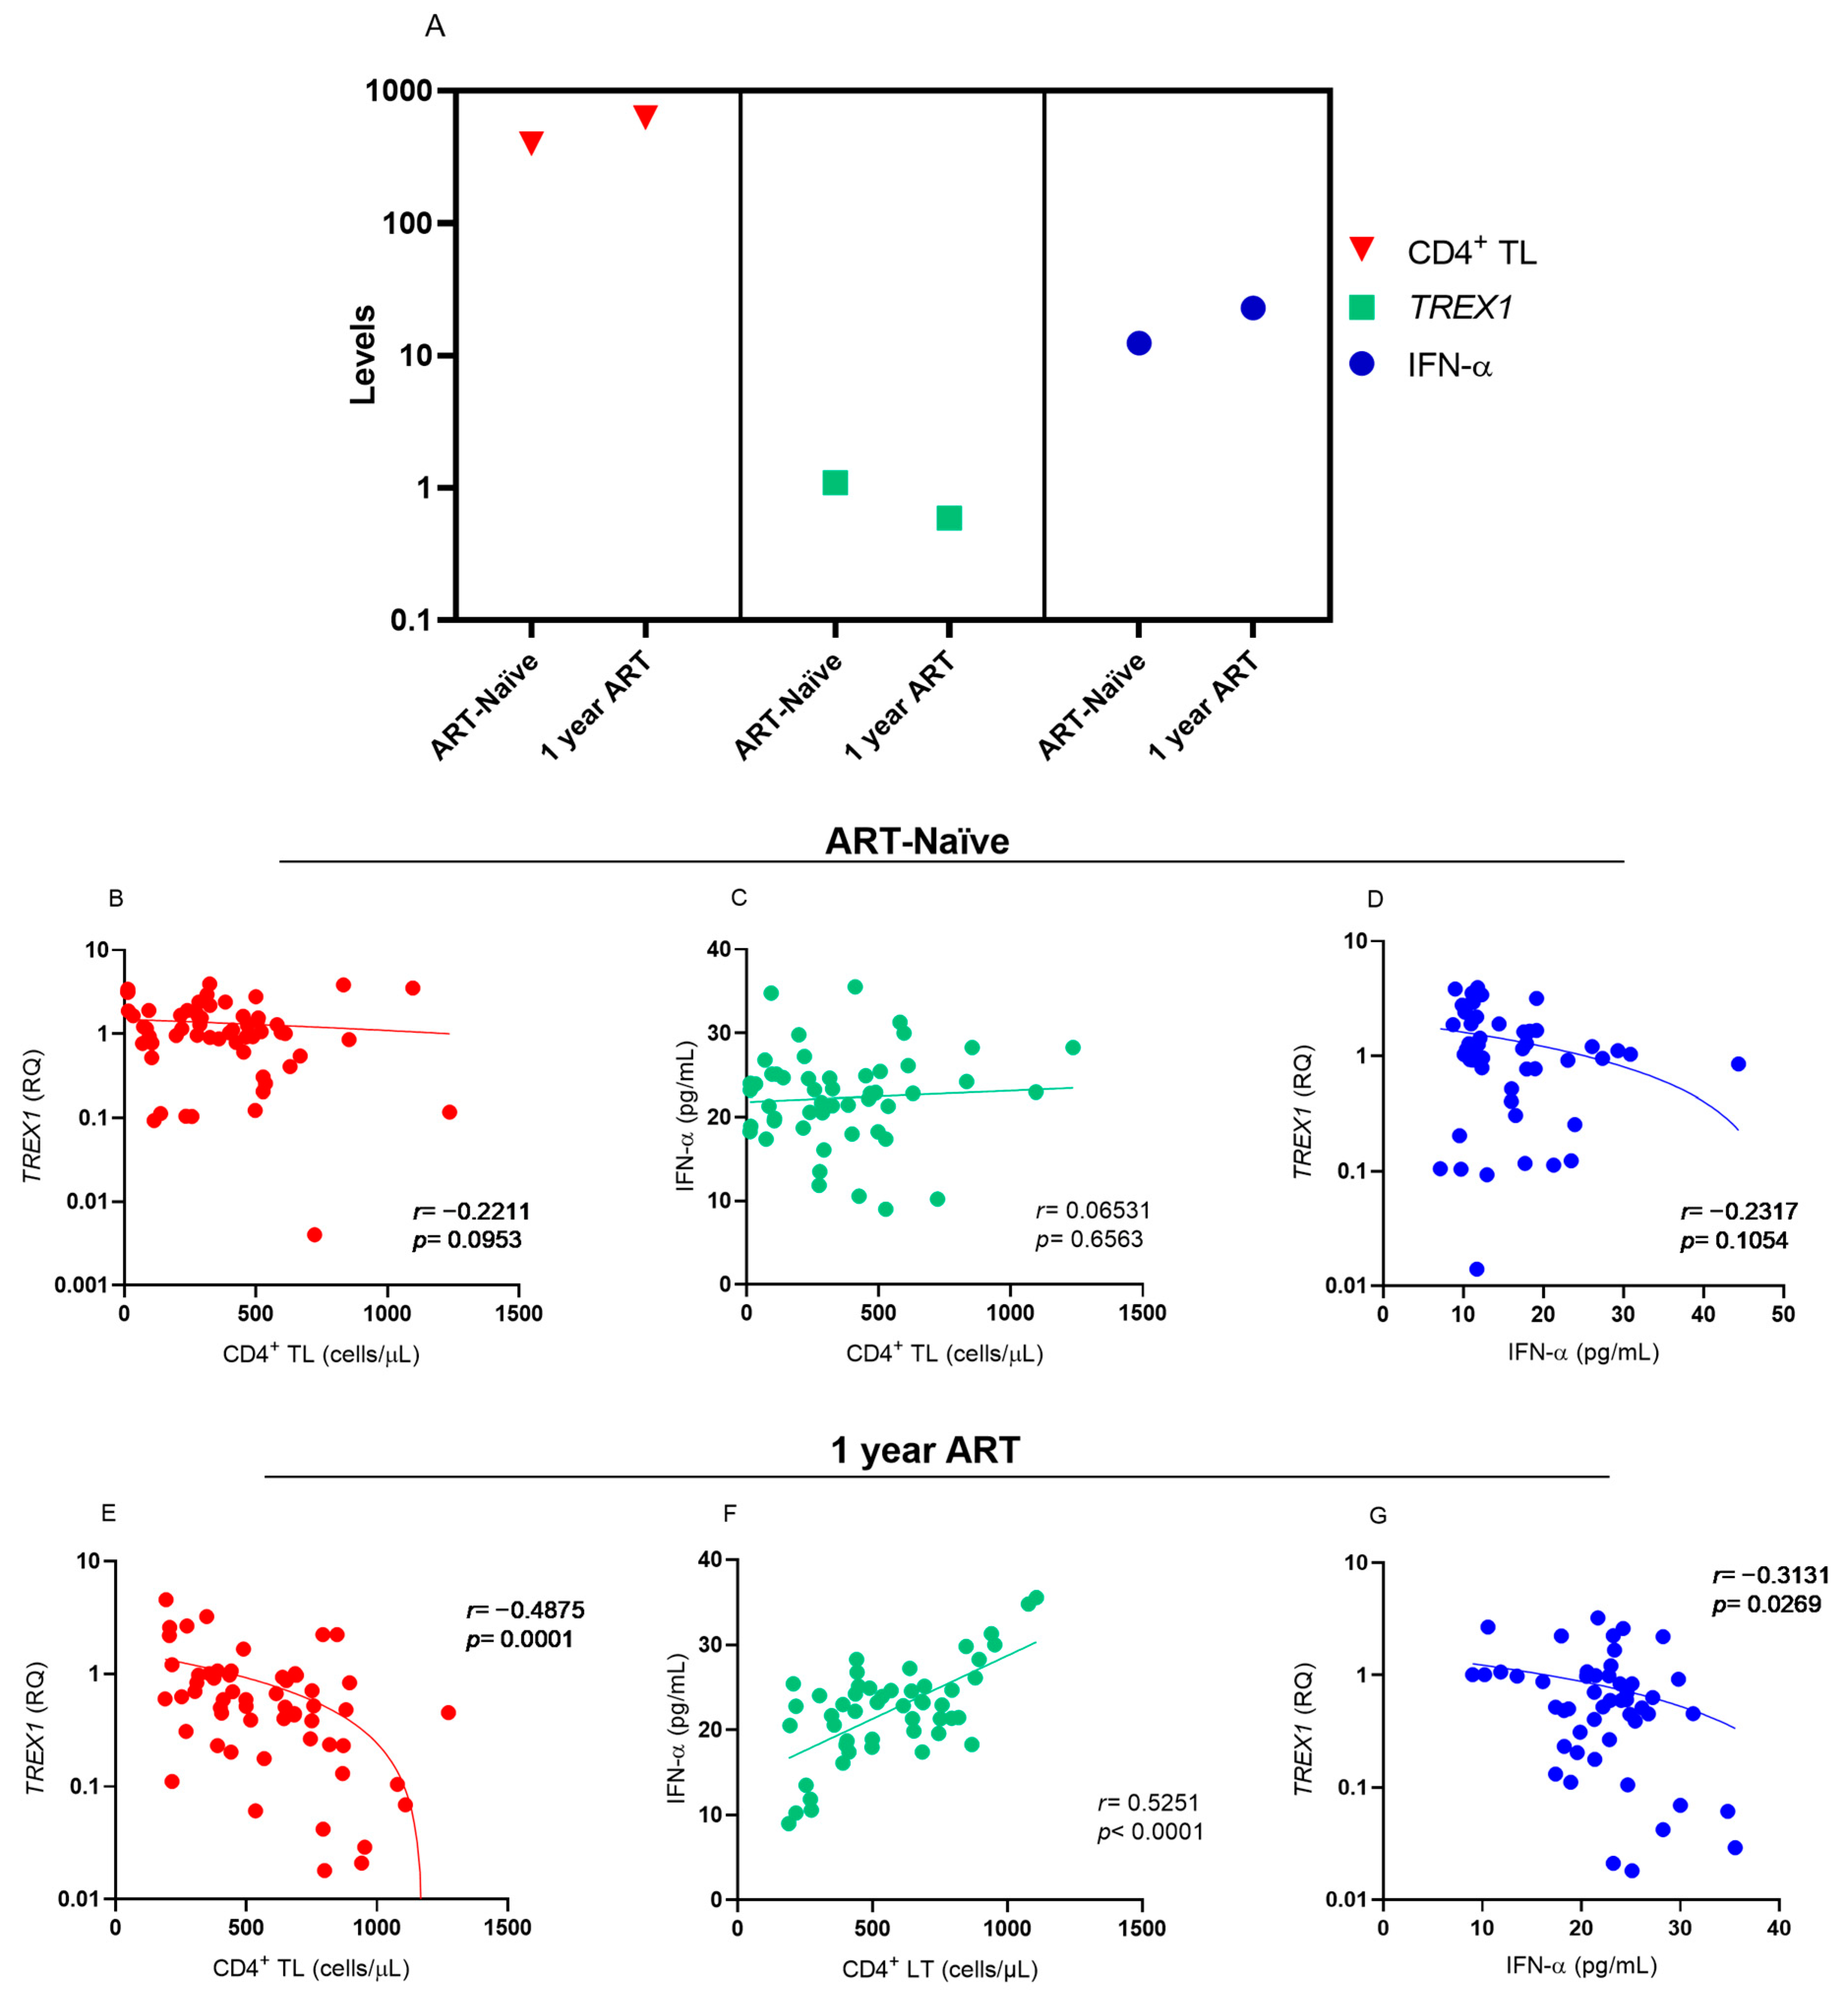
Analysis of the levels of CD4
+ T lymphocytes,
TREX1 and IFN-α showed that the increase in CD4
+ T lymphocyte levels was related to the reduction in
TREX1 levels and an increase in IFN-α levels after one year of ART use (
Figure 2A). Before starting ART, no correlation was observed between the markers evaluated (
Figure 2B–D). During the one-year period of ART, there was a negative correlation between the levels of CD4
+ T lymphocytes and
TREX1 expression (
Figure 2B), a positive correlation between the levels of CD4
+ T lymphocytes and IFN-α (
Figure 2C), and a low negative correlation between
TREX1 and IFN-α expression levels (
Figure 2D).
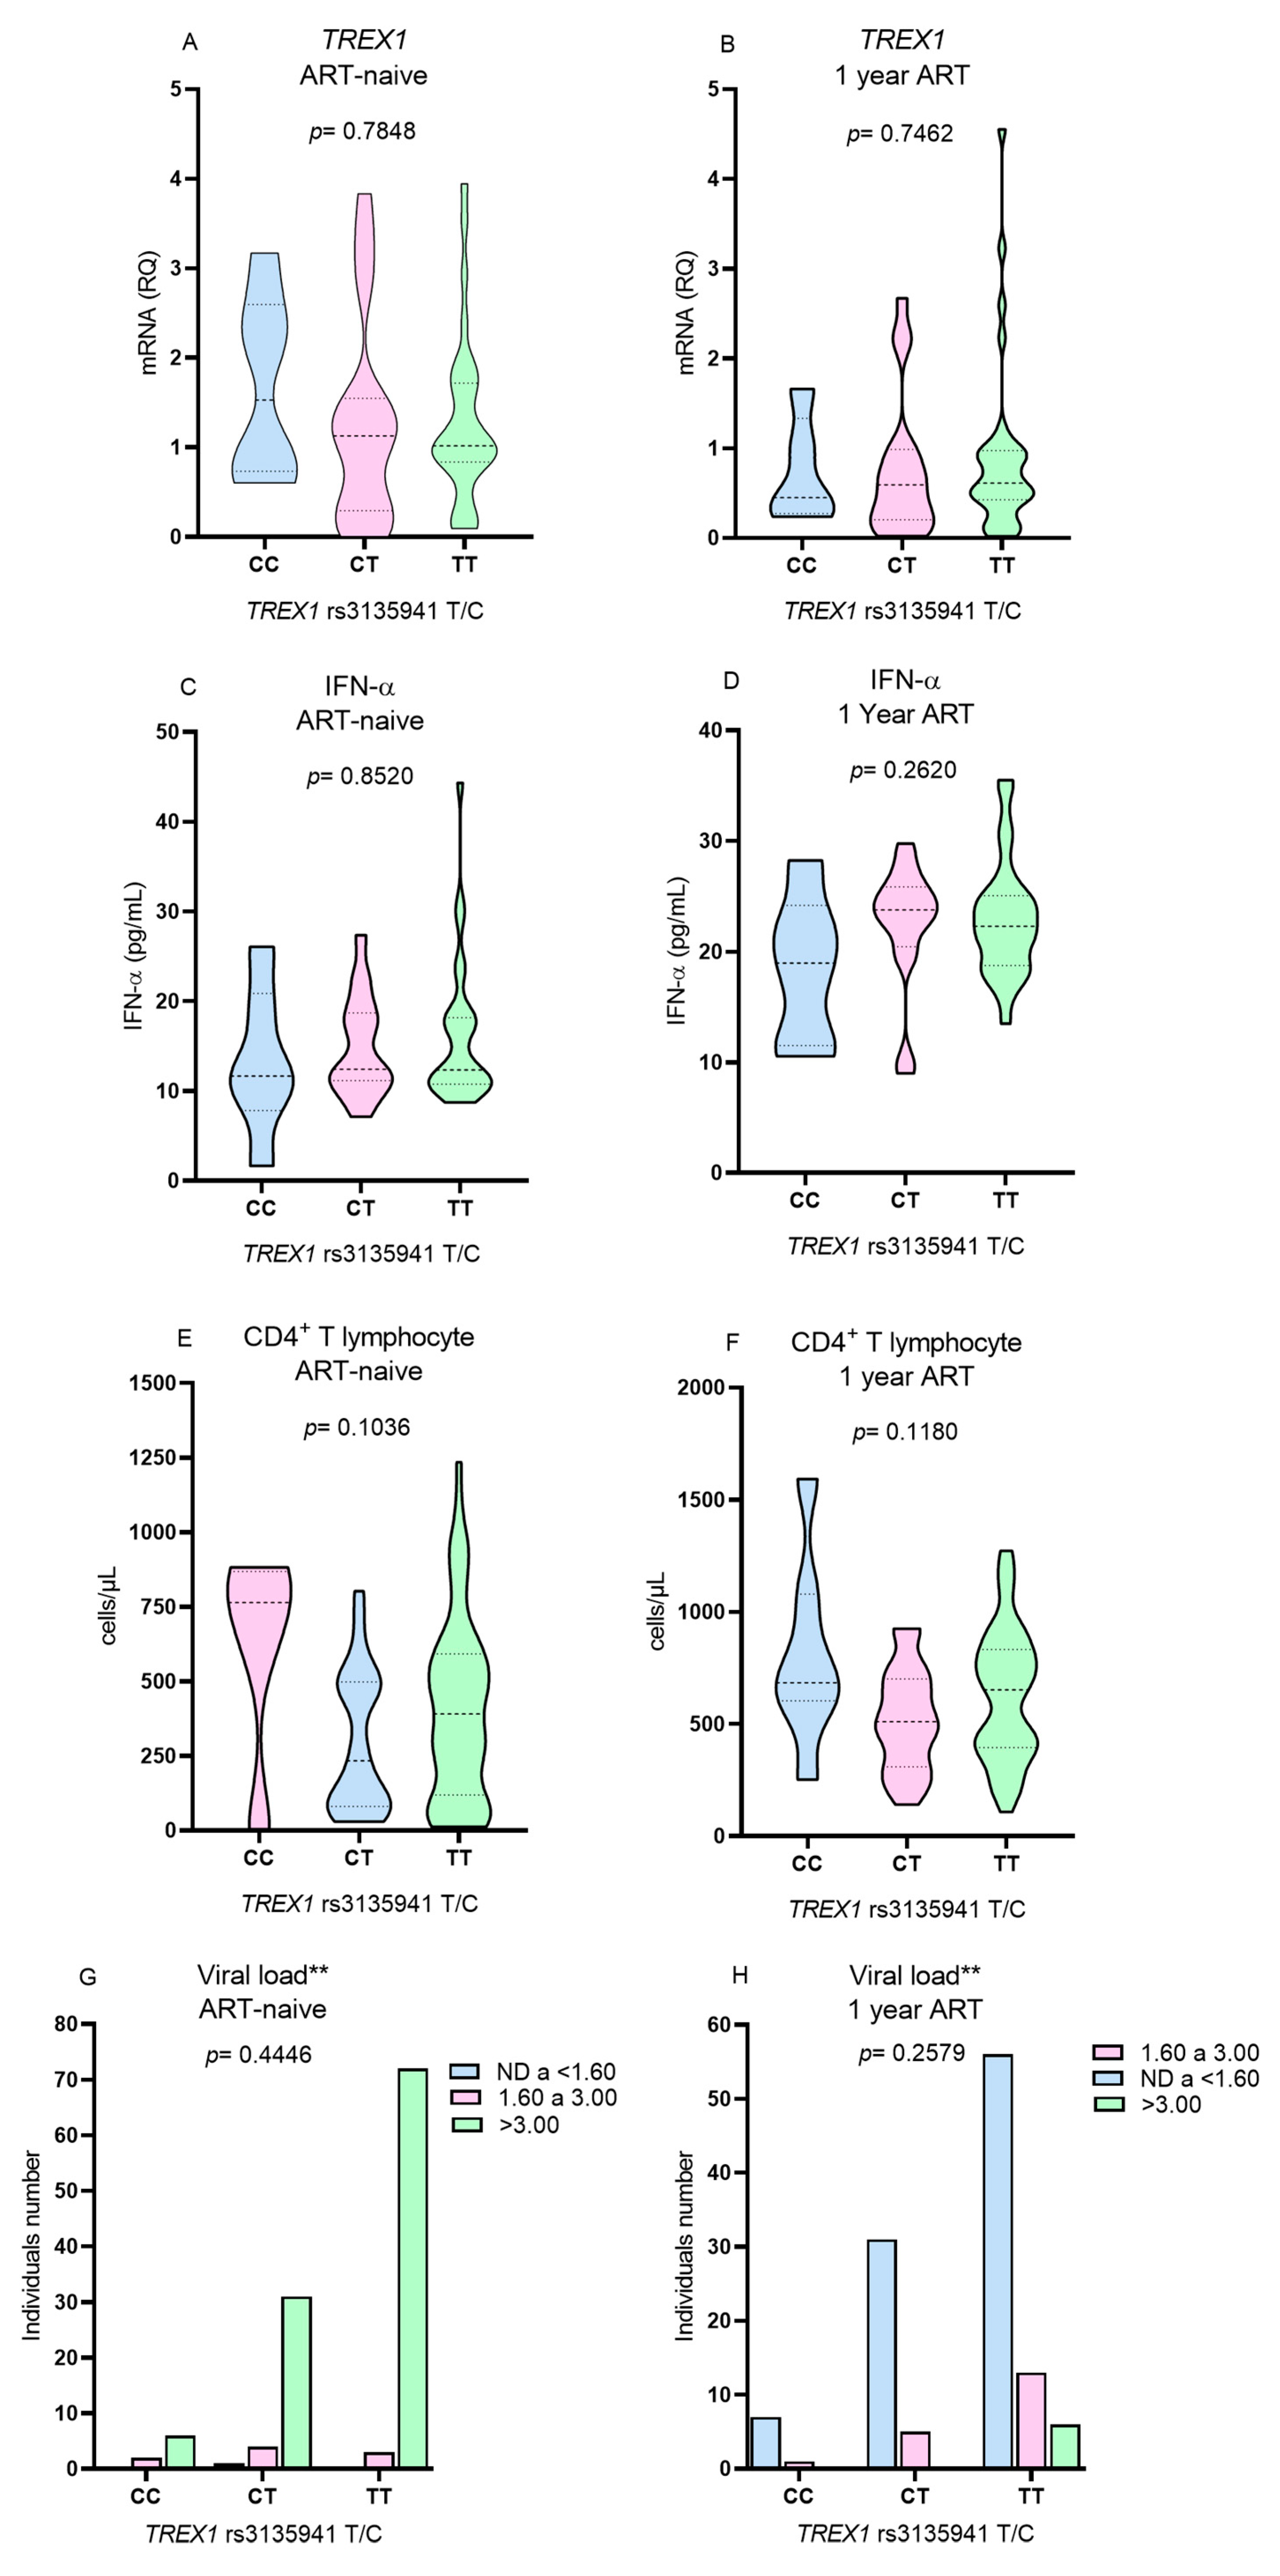
Due to the low frequency of the polymorphic genotype for the
TREX1 rs3135945 (G/A), the T lymphocyte count, viral load,
TREX1 expression and IFN-α levels were evaluated only in relation to the genotypes for the
TREX1 rs3135941 polymorphism (T/C). No differences were observed in the levels of the investigated variables among individuals with different genotypes of
TREX1 rs3135941 (T/C) before the initiation of ART (
Figure 3A,C,E,G) or after 1 year of therapy (
Figure 3B,D,F,H).
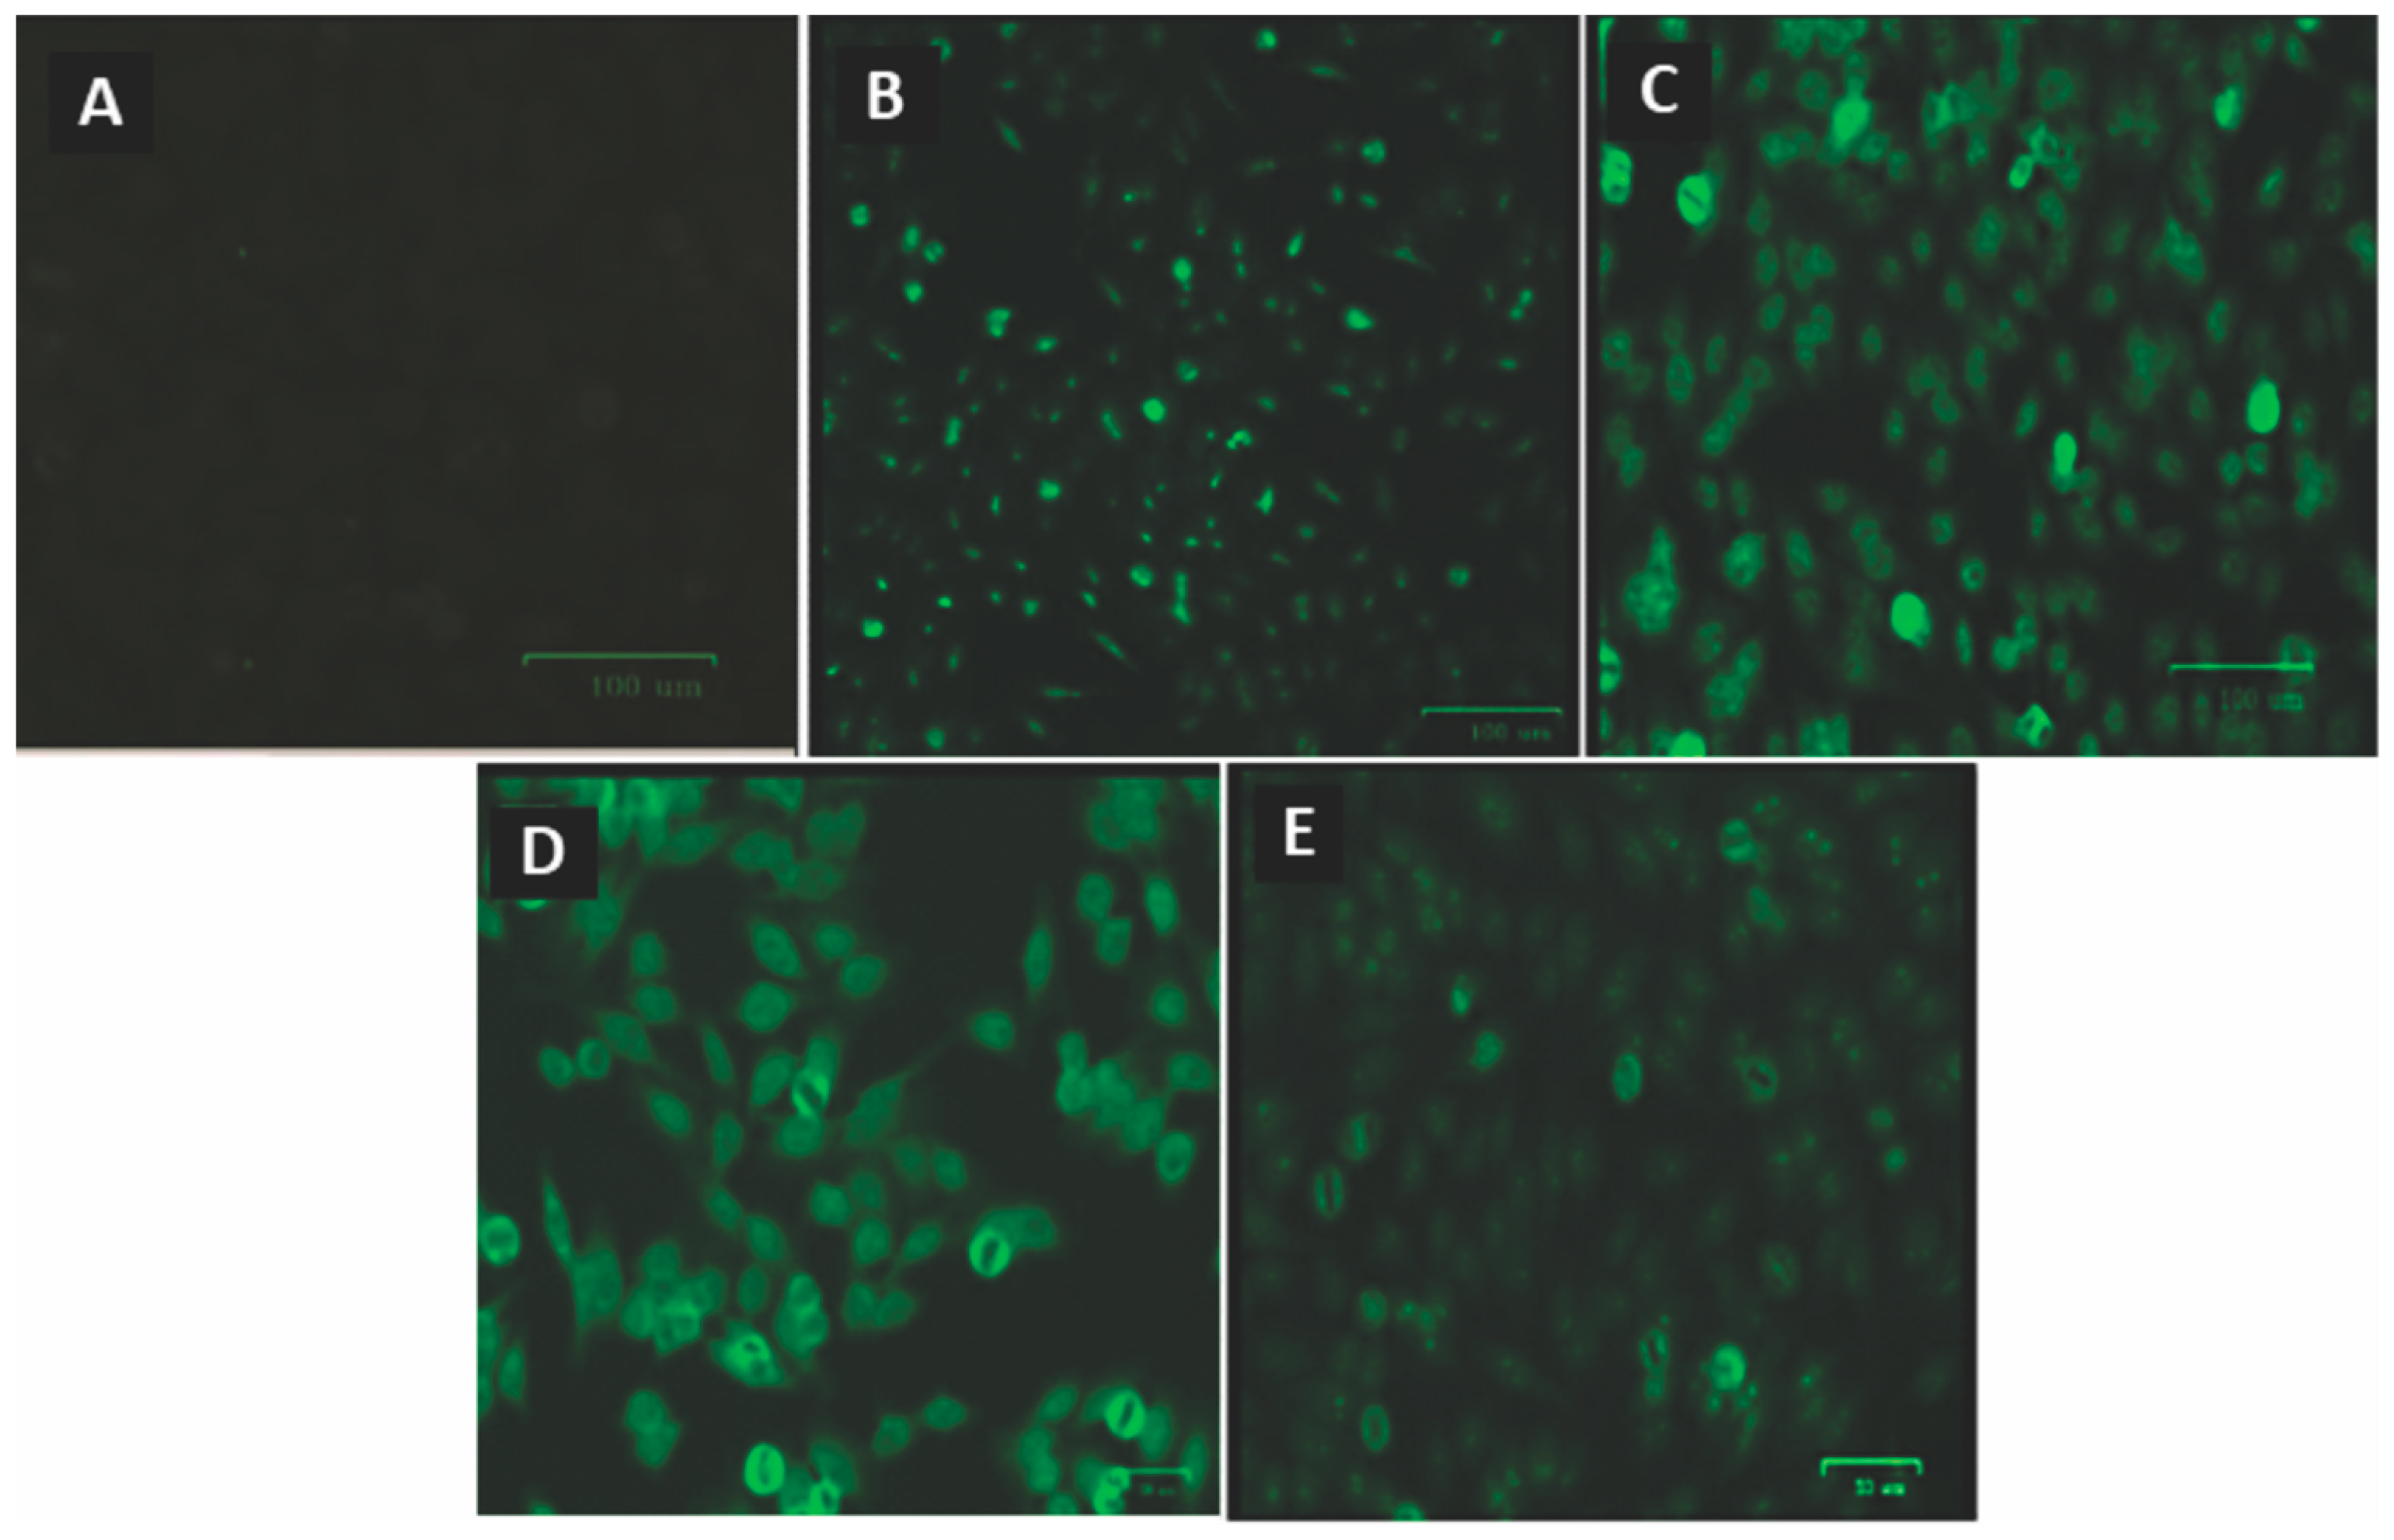
Of all the samples tested for ANA, none showed positive fluorescence before ART. After using ART, seven individuals exhibited different fluorescence patterns (
Figure 4).
Table 3 shows the ANA fluorescence pattern of each individual, the genotypes of the polymorphisms investigated, and the
TREX1 and IFN-α expression levels. Among the seven individuals with ANA, two had the TT genotype, two had the CC genotype, three had the CT genotype for the
TREX1 rs3135941 (T/C), and all were homozygous for the wild-type genotype (GG) for the
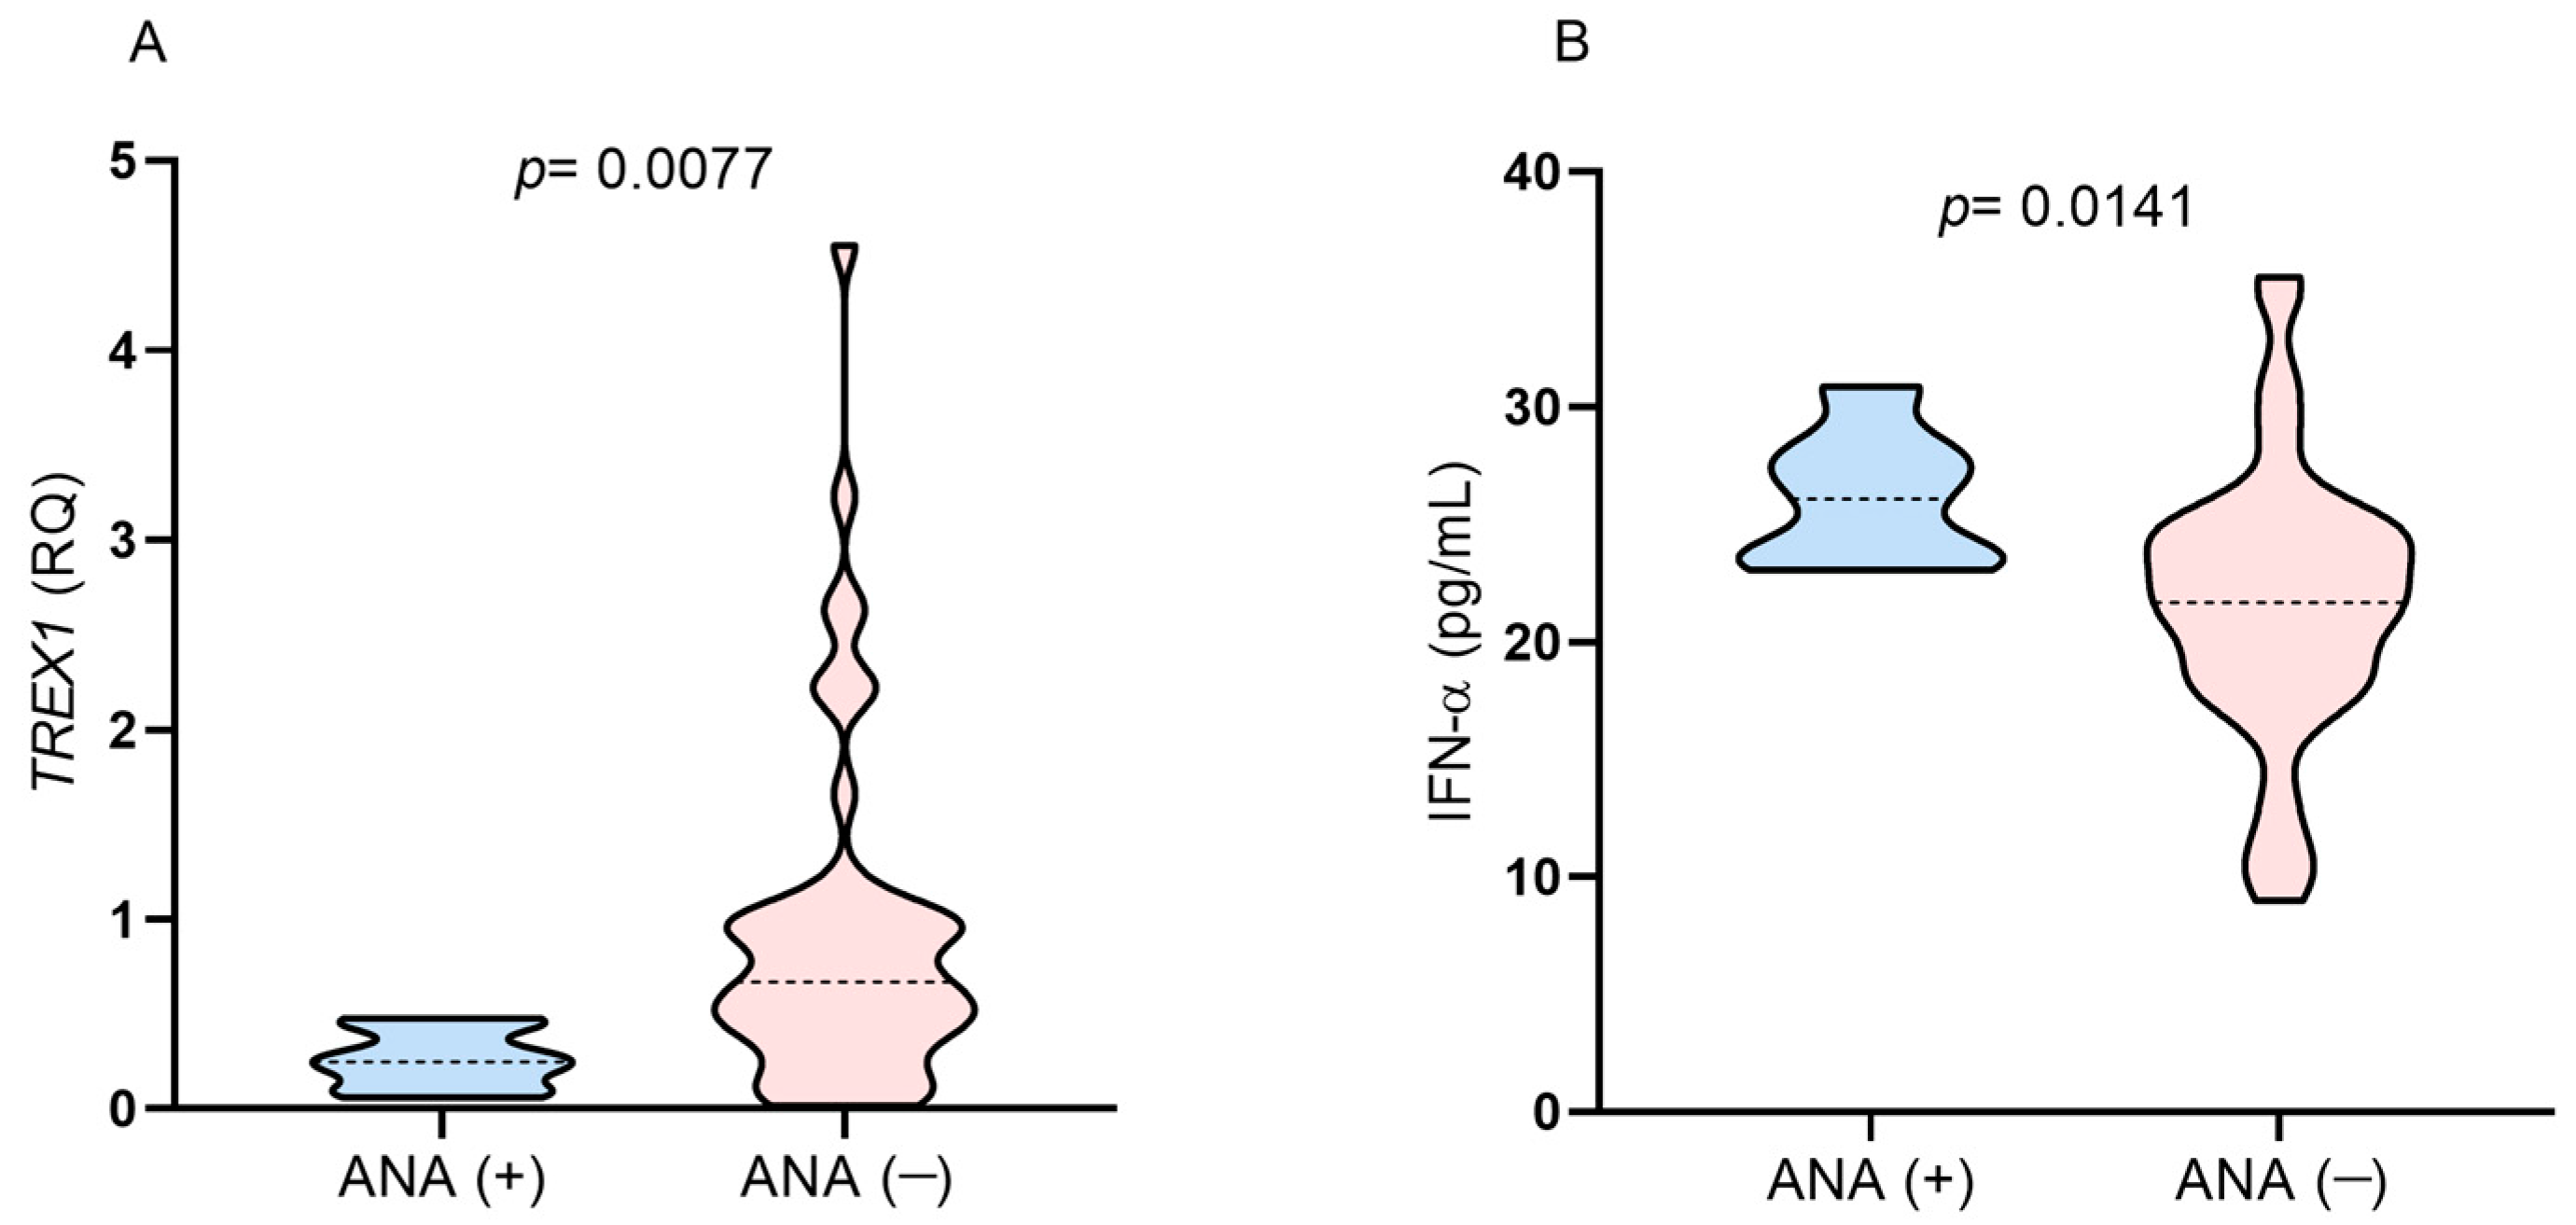
TREX1 rs3135945 (G/A). ANA-positive individuals had
TREX1 gene expression levels below the median in the studied group and higher plasma IFN-α levels (
Figure 5A,B). All the subjects were on a regimen containing tenofovir/lamivudine/efavirenz.
Table 3.
Characterization of patients with positive ANA according to the genotypes of the polymorphisms investigated and the levels of TREX1 and IFN-α.
Table 3.
Characterization of patients with positive ANA according to the genotypes of the polymorphisms investigated and the levels of TREX1 and IFN-α.
| Patient | Fluorescence Standards | TREX1 rs3135941/rs3135945 Genotypes | TREX1 Gene Expression (RQ) | IFN-α (pg/mL) |
|---|
| #1 | Fine dotted nuclear | TT/GG | 0.10 | 30.87 |
| #2 | Fine dotted nuclear | CC/GG | 0.30 | 27.38 |
| #3 | Nucleolar with isolated dots | CT/GG | 0.44 | 23.48 |
| #4 | Dotted nucleolar | TT/GG | 0.20 | 23.91 |
| #5 | Fine dotted nuclear | CT/GG | 0.25 | 23.04 |
| #6 | Dotted nucleolar | CC/GG | 0.06 | 26.09 |
| #7 | Cytoplasmic | CT/GG | 0.48 | 28.26 |
Figure 5.
Comparison of the levels of (A) TREX1 gene expression and (B) IFN-α between individuals with positive and negative results for ANA after 1 year of ART.
Figure 5.
Comparison of the levels of (A) TREX1 gene expression and (B) IFN-α between individuals with positive and negative results for ANA after 1 year of ART.
4. Discussion
Autoimmune manifestations may result from negative dysregulation of cytosolic sensors, such as in cGAS and STING, which leads to marked activation of IFN-I and NF-κB signaling. In this context, TREX1 acts by degrading cytosolic DNA, inhibiting the cGAS-STING pathway and preventing the development of an autoimmune response. On the other hand, in HIV infection, TREX1 activity promotes a decrease in viral DNA below the threshold of immune activation, inhibiting the adequate activation of cGAS-STING and the production of IFN-I, which are essential for the control of viral infections [
25].
Our study evaluated
TREX1 gene polymorphisms,
TREX1 gene expression, plasma IFN-α levels, and the presence of ANA in the context of HIV-1 infection and ART use. The genotype and allele distributions of the
TREX1 rs3135941 (T/C) and
TREX1 rs3135945 (G/A) polymorphisms were not associated with HIV-1 infection, and there was no association between the polymorphisms and the
TREX1 gene expression, IFN-α, and CD4
+ T lymphocytes levels. Thus, our results suggest that the polymorphisms do not influence the immune response to HIV infection in the investigated group. However, in contrast, previous studies showed an association between the
TREX1 rs3135941 polymorphism (T/C) and the speed of progression of HIV-1 infection as result of increased virus replication, indicating that the
TREX1 rs3135941 polymorphism (T/C) may promote higher exonuclease activity, which would result in reduced IFN-I production [
23,
26]. The
TREX1 rs3135945 polymorphism (G/A) has been associated with susceptibility to HIV-1 infection in individuals of Caucasian descent [
22].
The differences in the results between our study and other studies that did find an association between polymorphisms, and HIV-1 infection may be related to the ethnicity of the groups evaluated in each study. The
TREX1 rs3135941 (T/C) polymorphism was evaluated in individuals from Amsterdam and Iran [
23,
26], while the
TREX1 rs3135945 (G/A) polymorphism was evaluated in individuals from Italy [
22]. The group investigated in the present study originates from the city of Belém, which is part of the Brazilian Amazon. This is a mixed-race population with a genetic contribution from white Europeans, black Africans, and native indigenous peoples [
27]. Thus, it is possible that the frequencies of the investigated polymorphisms may be associated with HIV-1 infection only in certain ethnic groups. Another example is the
TREX1 polymorphism rs11797 (C/T), which was associated with HIV-1 infection in the same population as in the previous study [
6], but not in the study that evaluated the polymorphism in a population of different ethnicities [
22].
Differences in results among studies may also be related to the characterization of groups with HIV-1. We included individuals who used ART for 1 year; in the study by Booimam et al. (2014) and Tohidi et al. (2023), the majority of individuals were not using ART [
23,
26]. In this way, these two studies were able to evaluate the relationship of the
TREX1 rs3135941 (T/C) polymorphism with immunological and virological markers in natural HIV-1 infection over a period of time; our study evaluated the influence of polymorphisms in relation to markers by comparing periods of absence and presence of ART.
Due to the frequency of the polymorphic allele for TREX1 rs3135941 (T/C) being slightly higher in the group with HIV-1, with a p value close to the significance value of the test, it is possible that the lack of association of the TREX1 rs3135941 (T/C) polymorphism with HIV-1 infection may be related to our sample size. Furthermore, other factors may have contributed to determining the differences in results among the studies evaluated, such as gender, time of infection and, mainly, the use of ART.
In our study, no differences were observed in the levels of
TREX1 gene expression among individuals with different genotypes for the
TREX1 rs3135941 (T/C) polymorphism. Other authors evaluated the gene expression levels among genotypes for the
TREX1 rs3135941 (T/C) polymorphism in different conditions, including patients with Sjögren syndrome [
21], HIV-1 [
23], and healthy individuals [
28], but they also found no differences in
TREX1 expression levels between genotypes. The
TREX1 rs3135941 (T/C) polymorphism was also not associated with plasma IFN-α levels in our study or in autoimmune diseases [
21]. Taken together, these findings show that the
TREX1 rs3135941 (T/C) polymorphism located in the 5′ untranslated region (5′UTR) does not promote variations in
TREX1 expression levels, regardless of ethnic differences or the presence or absence of autoimmune or infectious diseases.
In contrast, the
TREX1 gene expression levels and plasma IFN-α concentrations of HIV-1 individuals who were ART-naïve were different from those after 1 year of therapy. In the period in which the individuals were ART-naïve, the expression of
TREX1 and the viral load were higher, while the number of CD4
+ T lymphocytes, the CD4
+/CD8
+ T lymphocyte ratio, and the plasma IFN-α concentration were lower than when ART was used. These results reflect the activity of TREX1 in retroviral infection because in the absence of ART, there is more viral DNA, which induces greater expression of exonucleases and a reduction in IFN-α. Although TREX1 can degrade the HIV-1 DNA reverse transcript before it can integrate into the host cell genome, this activity is not sufficient to eliminate the infection, since TREX1 contributes to maintaining DNA levels undetectable by cGAS and STING sensors, leading to a reduction in IFN-I synthesis [
12,
25]. On the other hand, after 1 year of treatment with ART, the viral load decreased, leading to a reduction in the expression of
TREX1. In this case, low levels of HIV-1 DNA appear to be enough to activate the cytosolic sensors responsible to produce IFN-I, including IFN-α. Furthermore, the increased levels of CD4
+ T lymphocytes (median above 500 cells/µL) observed after the use of ART was associated with reduced levels of
TREX1 and increased levels of IFN-α, showing that immune reconstitution of infected individuals induced variations in the levels of these two markers, since before the use of ART, when individuals had levels of CD4
+ T lymphocytes below 500 cells/µL,
TREX1 expression levels were higher and levels of IFN-α were lower. Thus, our findings contribute to a better understanding of the participation of TREX1 in natural HIV-1 infection and during ART intervention.
The presence of ANA was not related to the
TREX1 rs3135941 (T/C) or
TREX1 rs3135945 (G/A) polymorphisms since the individuals presented different genotypes for the
TREX1 rs3135941 (T/C) and only the wild-type genotype for
TREX1 rs3135945 (G/A). However, individuals with ANA had lower
TREX1 expression levels and higher IFN-α plasma levels than the median of the investigated group. Given that ANA were present in individuals after ART, who had higher IFN-α levels, these individuals may have experienced a more pronounced recovery of immune competence, which proves to be independent of the type of therapeutic regimen used. Other studies have described the association of ART use with the recovery of immune competence and the development of ANA [
3,
6]. Screening for ANA in individuals with HIV-1 infection who are receiving ART is important for identifying who could be at risk for developing possible autoimmune manifestations [
6].

 ,
, 


