
Trajectory of Gastrointestinal Symptoms in Previously Hospitalized COVID-19 Survivors: The Long COVID Experience Multicenter Study
 , , ,
, , ,  , and
, and
Abstract
:1. Introduction
2. Methods
2.1. Participants
2.2. Procedure
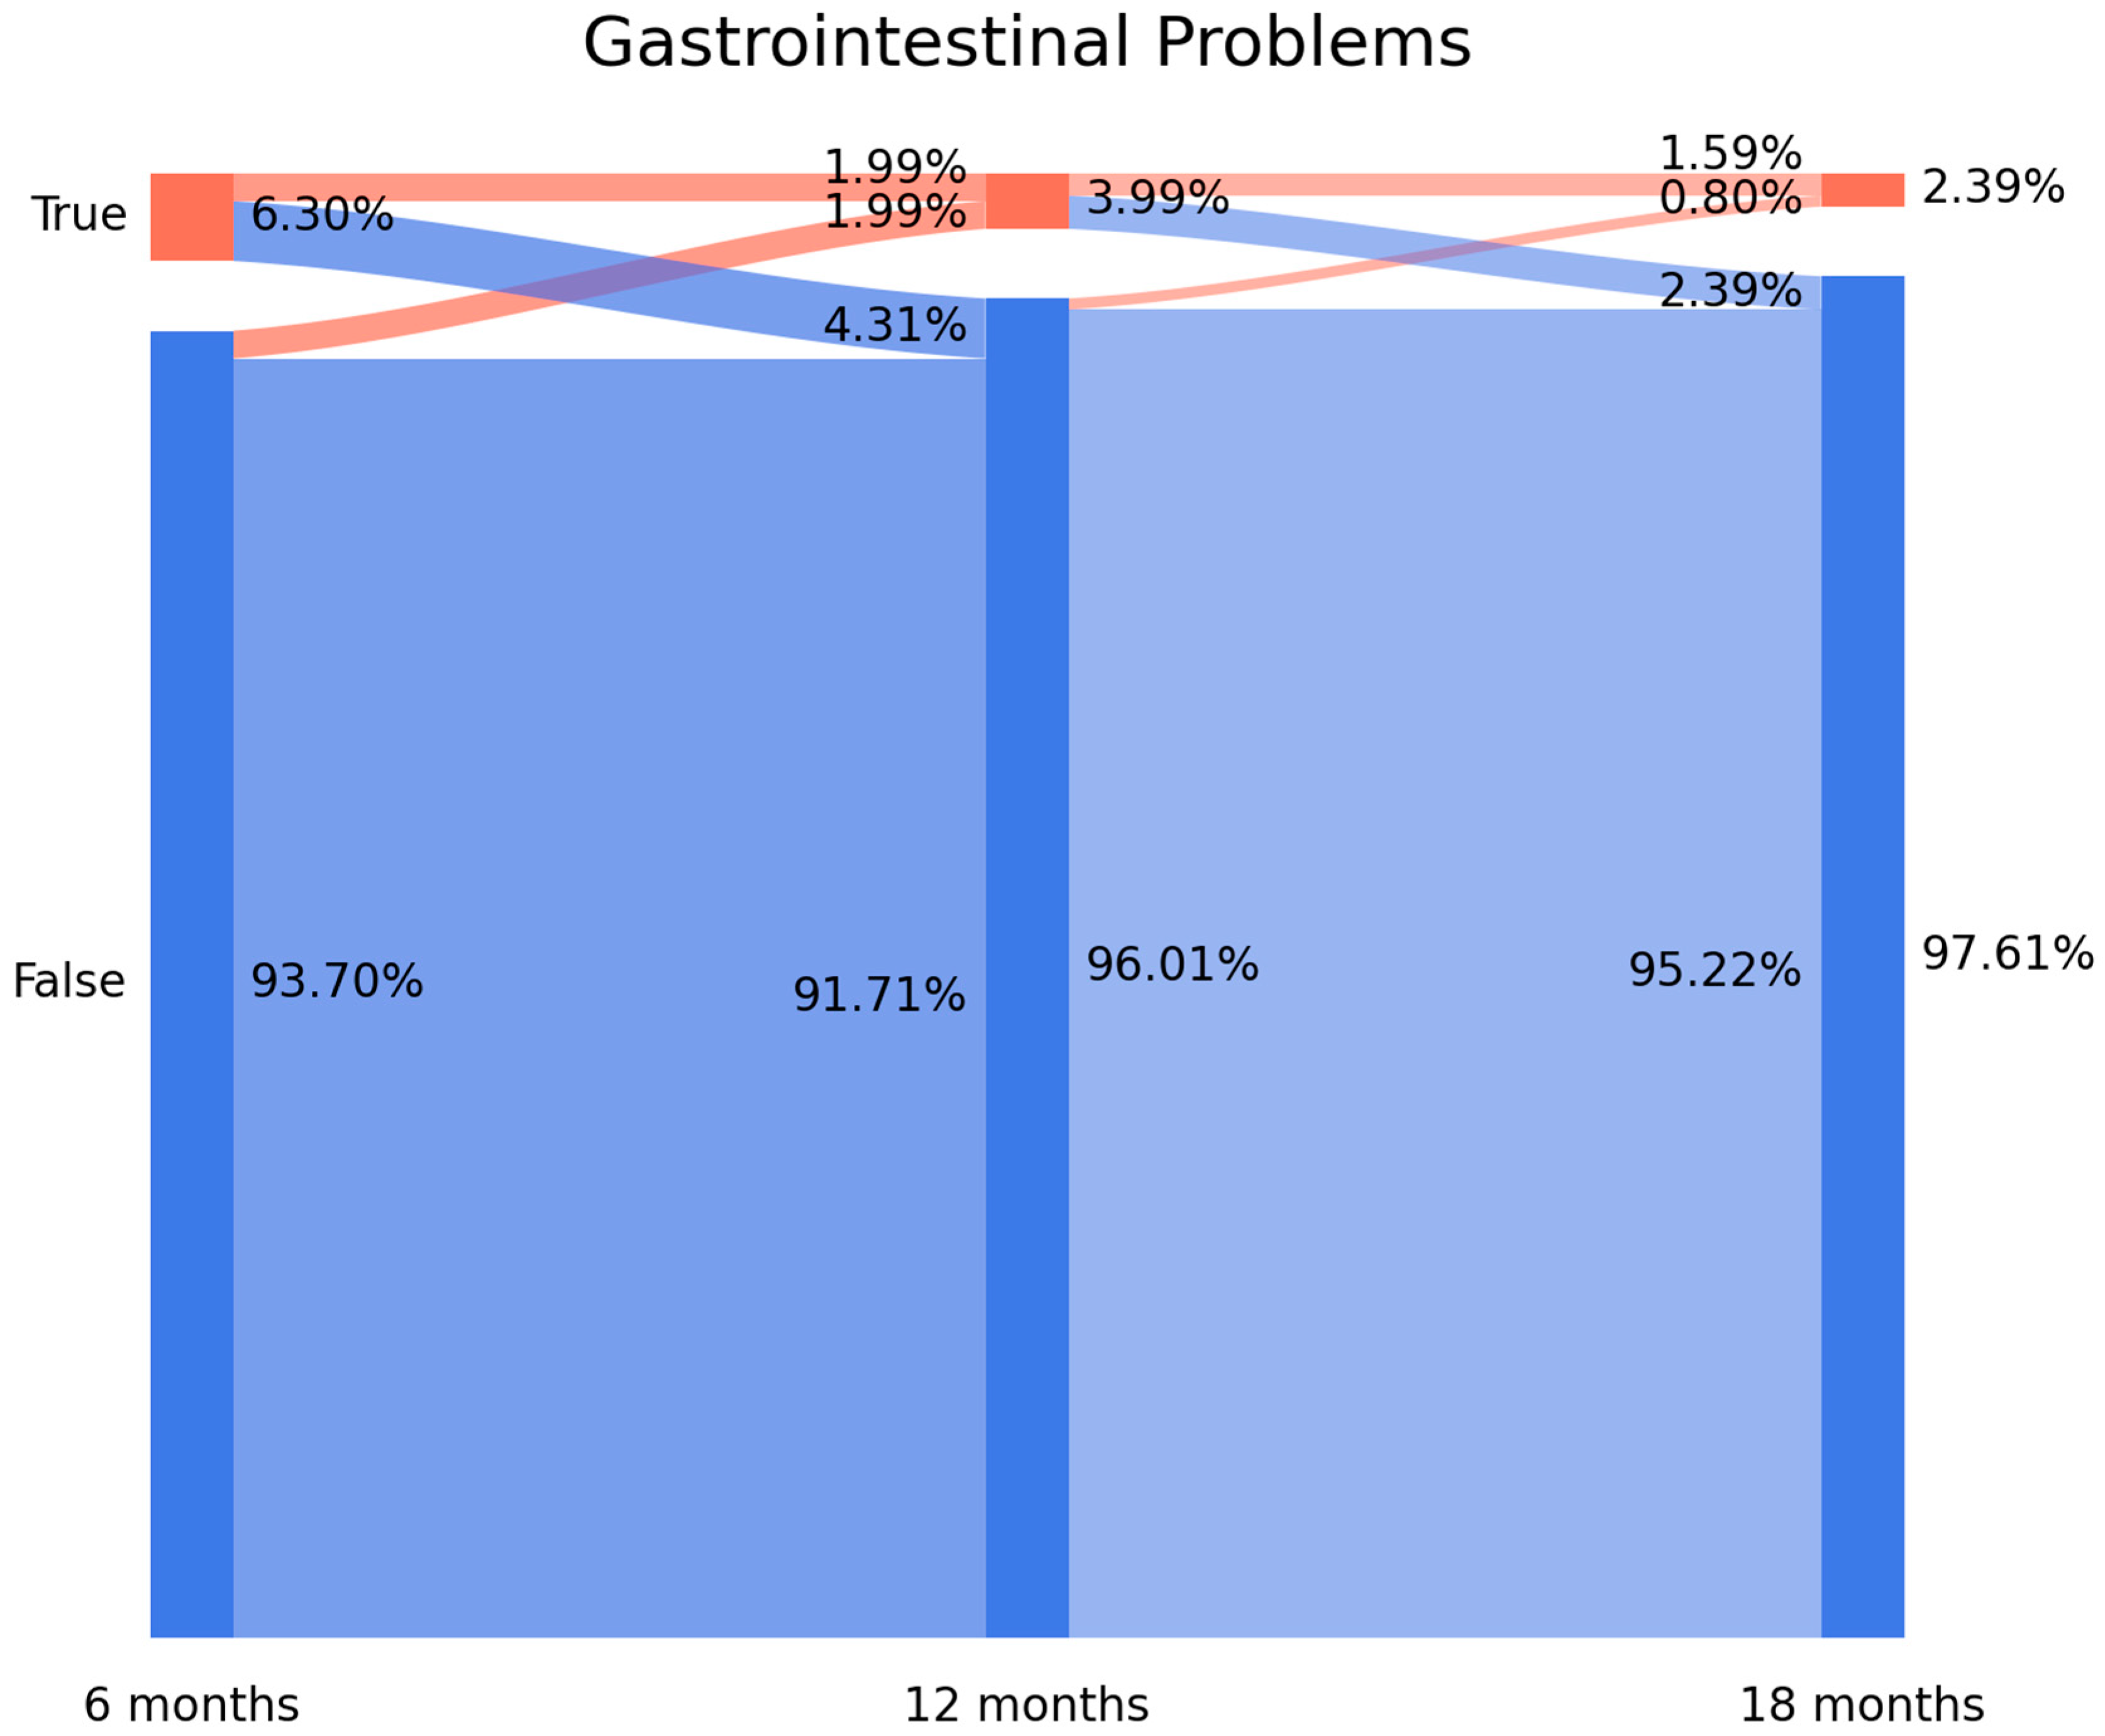
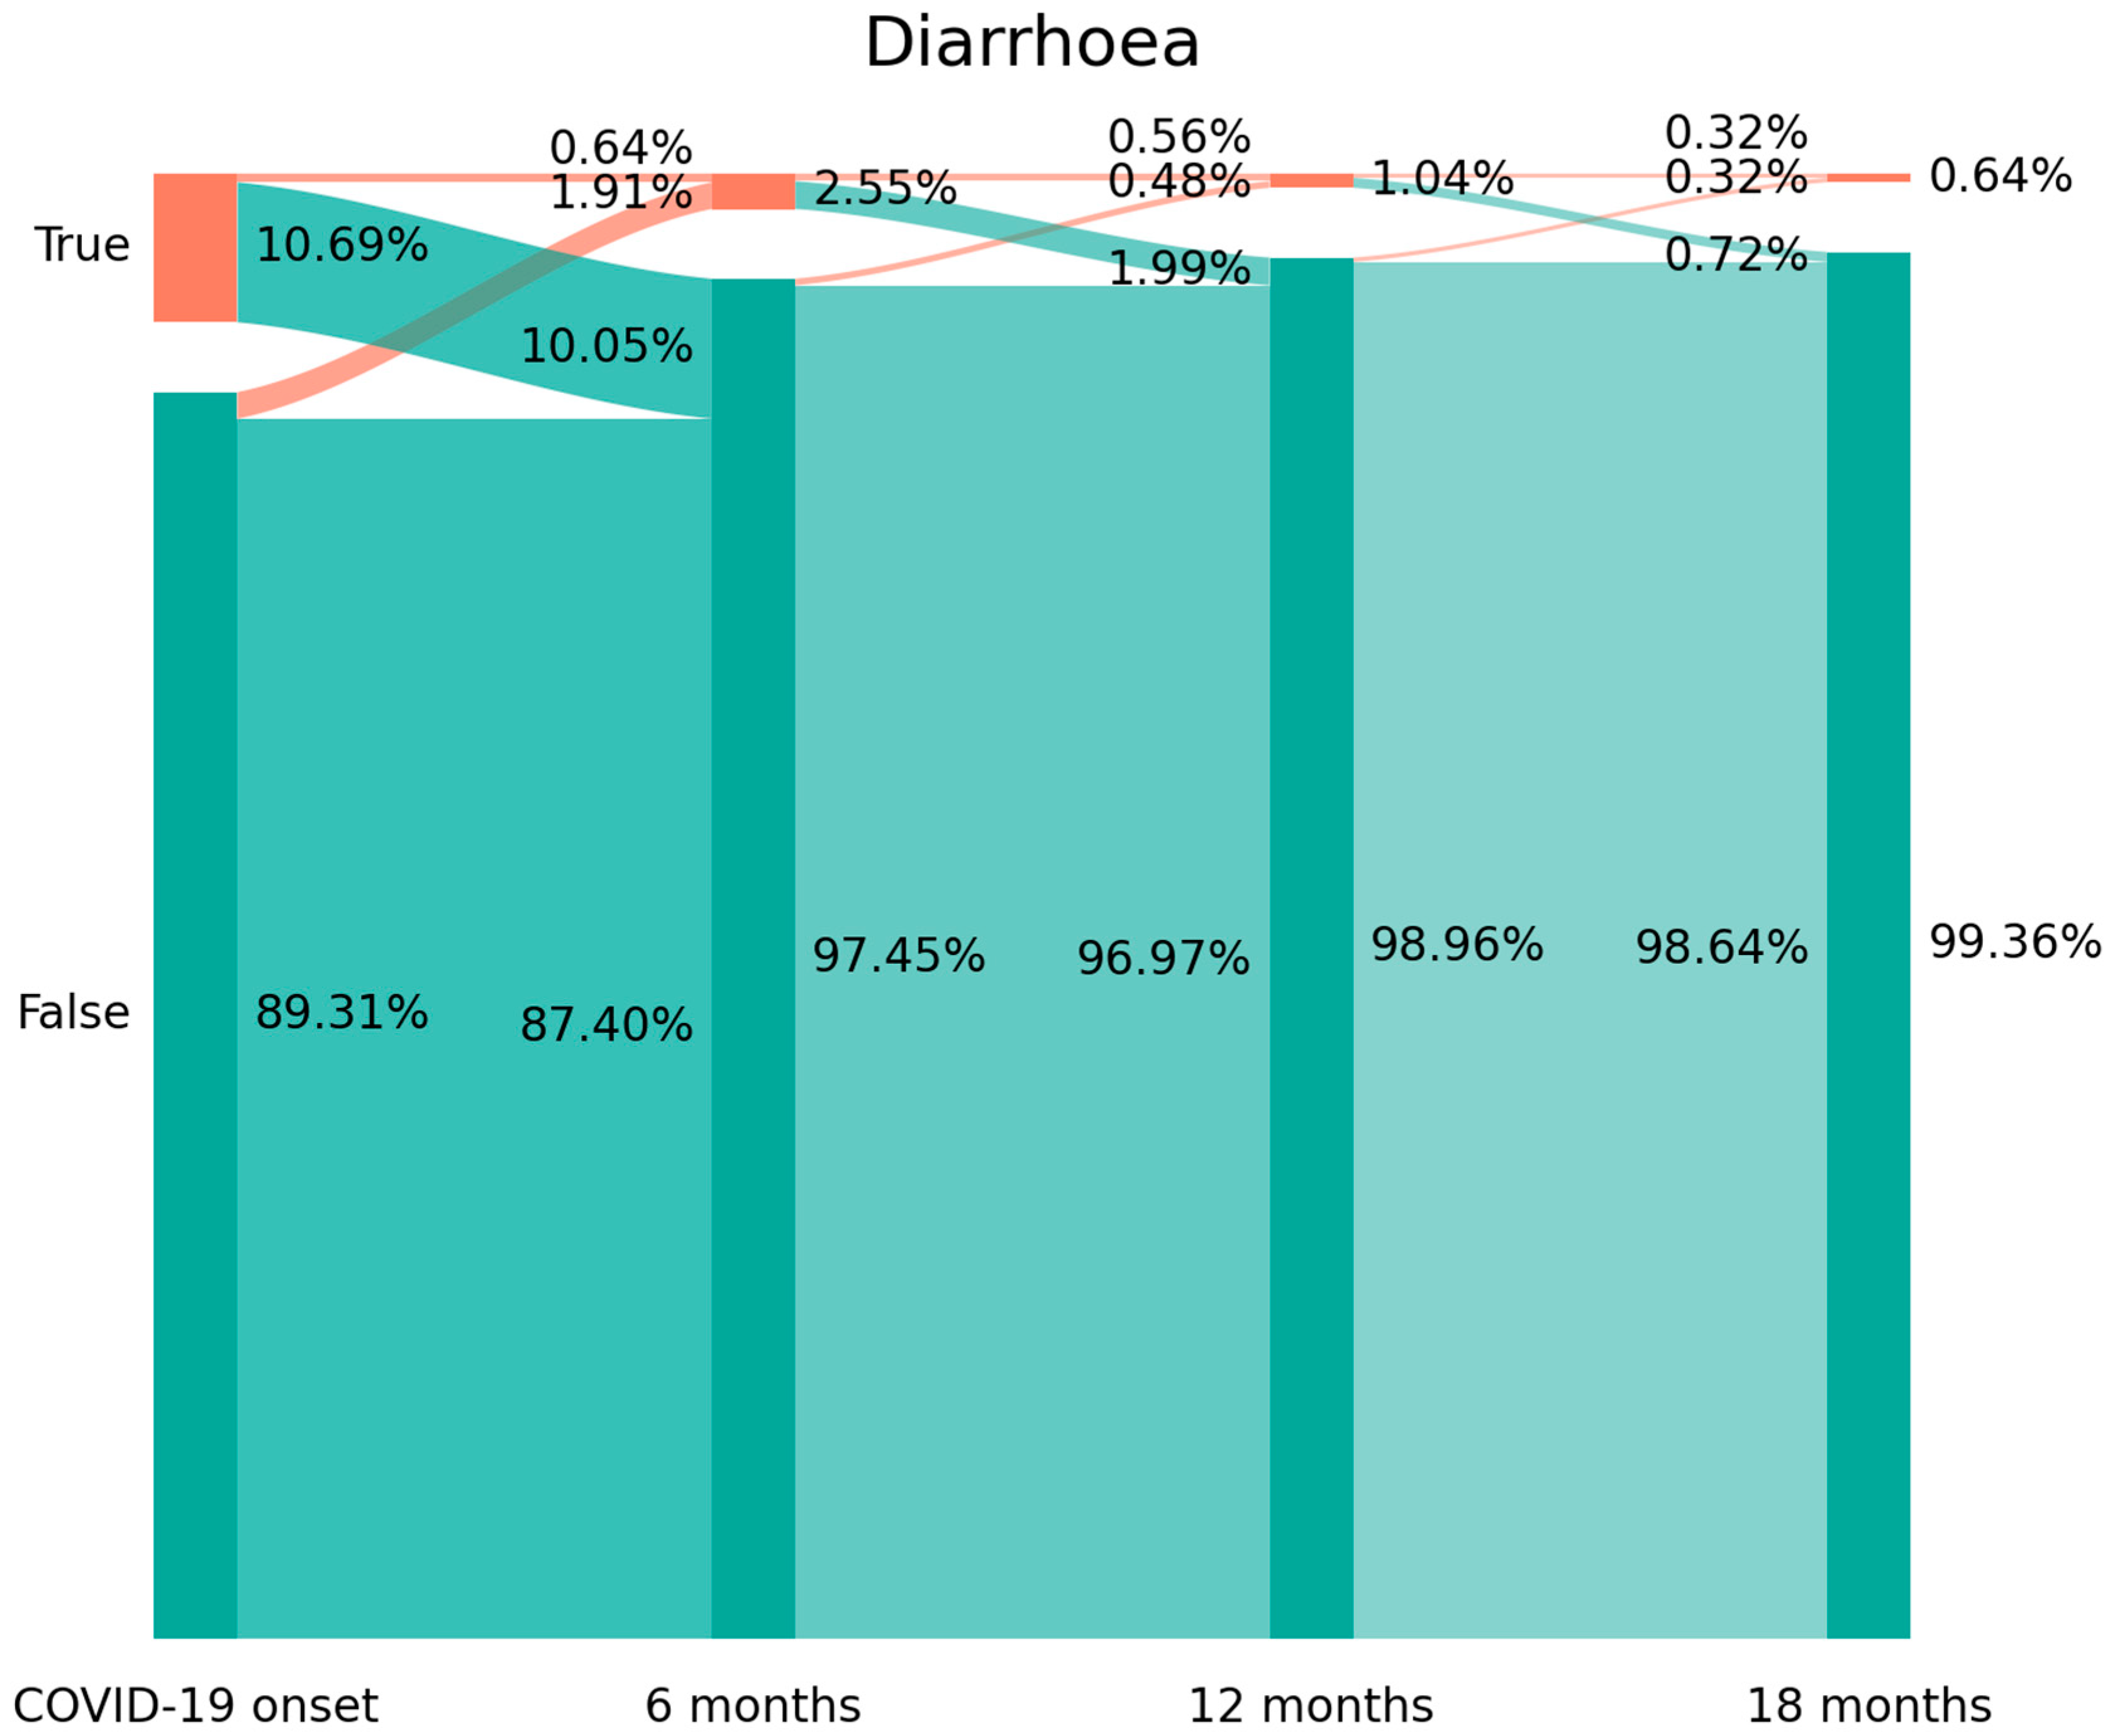
2.3. Sankey Plots
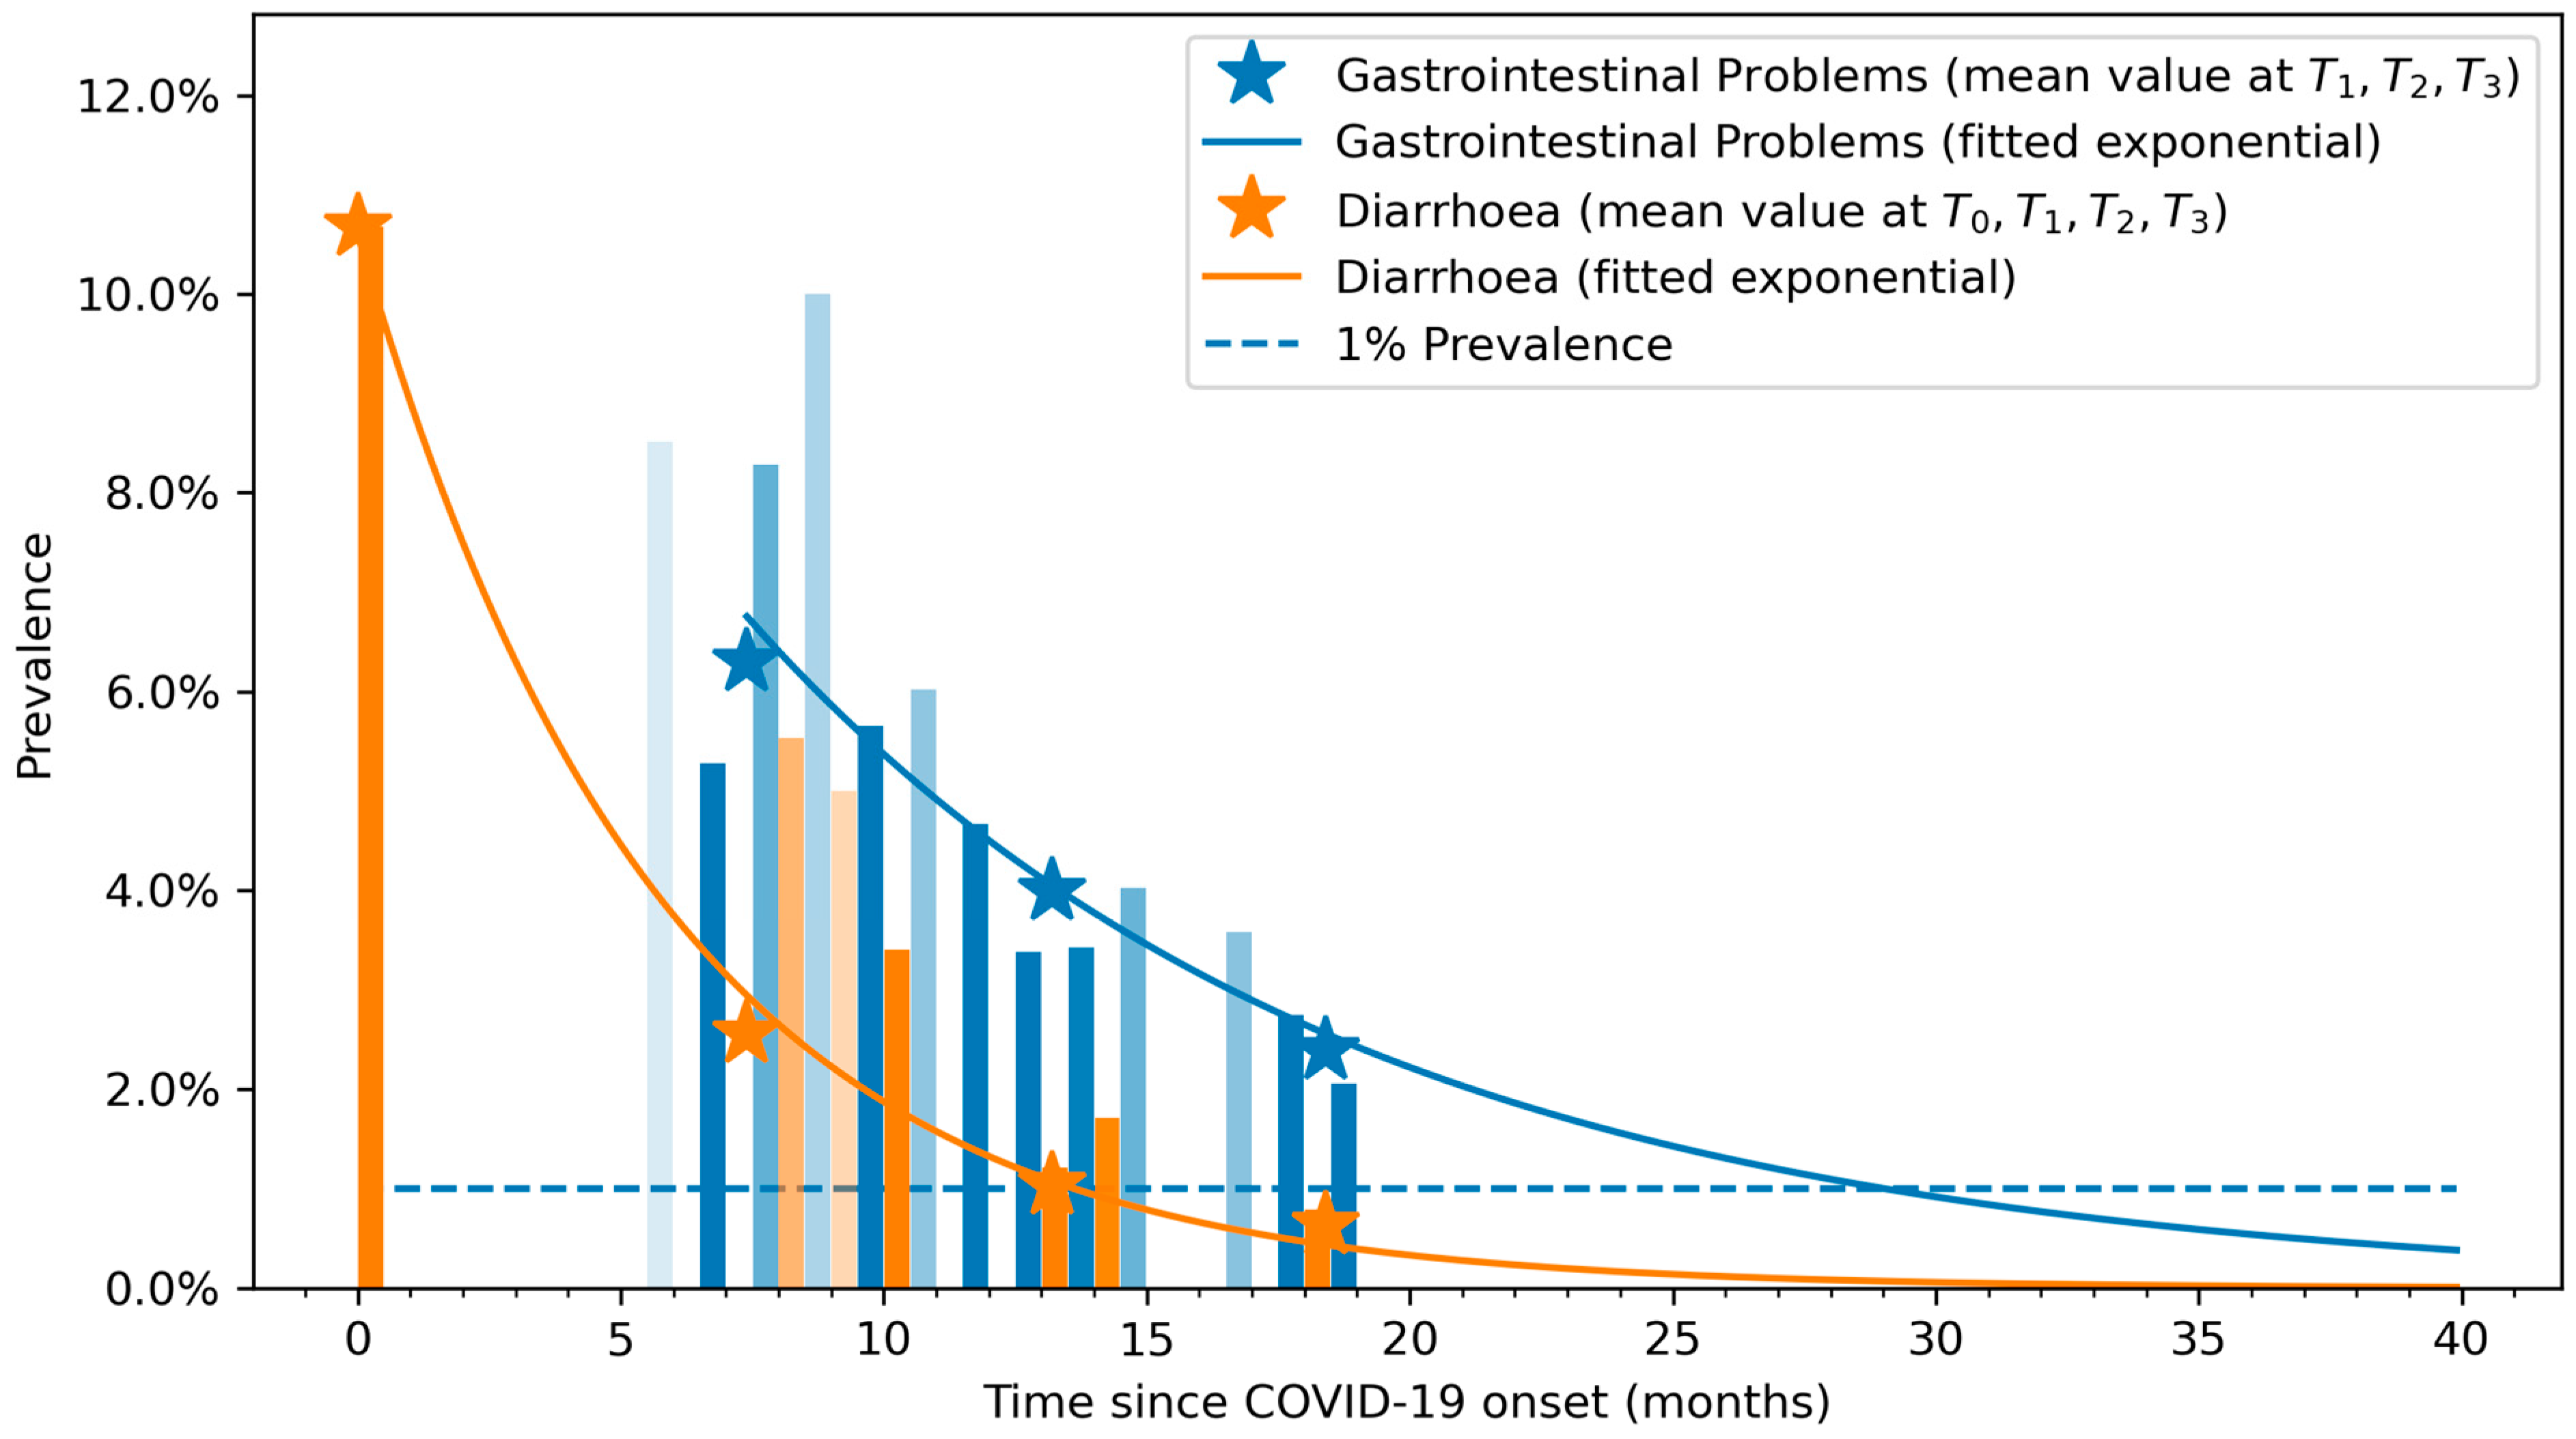
2.4. Exponential Bar Plots
2.5. Statistical Analysis
3. Results
4. Discussion
- New-onset symptoms: subjects experiencing a symptom, e.g., diarrhea, which they did not report during the acute phase of infection (1.91% arc from false at T0 to true at T1 on Figure 2).
5. Conclusions
Author Contributions
Funding
Institutional Review Board Statement
Informed Consent Statement
Data Availability Statement
Conflicts of Interest
References
- Rabaan, A.A.; Smajlović, S.; Tombuloglu, H.; Ćordić, S.; Hajdarević, A.; Kudić, N.; Al Mutai, A.; Turkistani, S.A.; Al-Ahmed, S.H.; Al-Zaki, N.A.; et al. SARS-CoV-2 infection and multi-organ system damage: A review. Biomol. Biomed. 2023, 23, 37–52. [Google Scholar] [CrossRef]
- Silva Andrade, B.; Siqueira, S.; de Assis Soares, W.R.; de Souza Rangel, F.; Santos, N.O.; Dos Santos Freitas, A.; da Ribeiro Silveira, P.; Tiwari, S.; Alzahrani, K.J.; Góes-Neto, A.; et al. Long-COVID and Post-COVID Health Complications: An up-to-date review on clinical conditions and their possible molecular mechanisms. Viruses 2021, 13, 700. [Google Scholar] [CrossRef] [PubMed]
- Słomka, A.; Kowalewski, M.; Żekanowska, E. Coronavirus Disease 2019 (COVID-19): A short review on hematological manifestations. Pathogens 2020, 9, 493. [Google Scholar] [CrossRef] [PubMed]
- Marasco, G.; Cremon, C.; Barbaro, M.R.; Salvi, D.; Cacciari, G.; Kagramanova, A.; Bordin, D.; Drug, V.; Miftode, E.; Fusaroli, P.; et al. Prevalence of gastrointestinal symptoms in Severe Acute Respiratory Syndrome Coronavirus 2 Infection: Results of the prospective controlled multinational GI-COVID-19 Study. Am. J. Gastroenterol. 2022, 117, 147–157. [Google Scholar] [CrossRef] [PubMed]
- Chen, T.H.; Hsu, M.T.; Lee, M.Y.; Chou, C.K. Gastrointestinal Involvement in SARS-CoV-2 Infection. Viruses 2022, 14, 1188. [Google Scholar] [CrossRef]
- Jiao, L.; Li, H.; Xu, J.; Yang, M.; Ma, C.; Li, J.; Zhao, S.; Wang, H.; Yang, Y.; Yu, W.; et al. The gastrointestinal tract is an alternative route for SARS-CoV-2 infection in a nonhuman primate model. Gastroenterology 2021, 160, 1467–1469. [Google Scholar] [CrossRef]
- Liu, S.; Zhao, Y.; Feng, X.; Xu, H. SARS-CoV-2 infection threatening intestinal health: A review of potential mechanisms and treatment strategies. Crit. Rev. Food Sci. Nutr. 2022, 1–19. [Google Scholar] [CrossRef]
- Ebrahim Nakhli, R.; Shanker, A.; Sarosiek, I.; Boschman, J.; Espino, K.; Sigaroodi, S.; Al Bayati, I.; Elhanafi, S.; Sadeghi, A.; Sarosiek, J.; et al. Gastrointestinal symptoms and the severity of COVID-19: Disorders of gut-brain interaction are an outcome. Neurogastroenterol. Motil. 2022, 34, e14368. [Google Scholar] [CrossRef]
- Zeng, W.; Qi, K.; Ye, M.; Zheng, L.; Liu, X.; Hu, S.; Zhang, W.; Tang, W.; Xu, J.; Yu, D.; et al. Gastrointestinal symptoms are associated with severity of coronavirus disease 2019: A systematic review and meta-analysis. Eur. J. Gastroenterol. Hepatol. 2022, 34, 168–176. [Google Scholar] [CrossRef]
- Kaliszewski, K.; Diakowska, D.; Nowak, Ł.; Tokarczyk, U.; Sroczyński, M.; Sępek, M.; Dudek, A.; Sutkowska-Stępień, K.; Kiliś-Pstrusińska, K.; Matera-Witkiewicz, A.; et al. Assessment of gastrointestinal symptoms and dyspnea in patients hospitalized due to COVID-19: Contribution to clinical course and mortality. J. Clin. Med. 2022, 11, 1821. [Google Scholar] [CrossRef]
- Nobel, Y.R.; Phipps, M.; Zucker, J.; Lebwohl, B.; Wang, T.C.; Sobieszczyk, M.E.; Freedberg, D.E. Gastrointestinal symptoms and Coronavirus Disease 2019: A case-control study from the United States. Gastroenterology 2020, 159, 373–375. [Google Scholar] [CrossRef]
- Fernández-de-las-Peñas, C. Long COVID: Current definition. Infection 2022, 50, 285–286. [Google Scholar] [CrossRef] [PubMed]
- Soriano, J.B.; Murthy, S.; Marshall, J.C.; Relan, P.; Diaz, J.V.; WHO Clinical Case Definition Working Group on Post-COVID-19 Condition. A clinical case definition of post-COVID-19 condition by a Delphi consensus. Lancet Infect. Dis. 2022, 22, e102–e107. [Google Scholar] [CrossRef] [PubMed]
- Hayes, L.D.; Ingram, J.; Sculthorpe, N.F. More than 100 persistent symptoms of SARS-CoV-2 (Long COVID): A scoping review. Front. Med. 2021, 8, 750378. [Google Scholar] [CrossRef] [PubMed]
- Liptak, P.; Duricek, M.; Rosolanka, R.; Ziacikova, I.; Kocan, I.; Uhrik, P.; Grendar, M.; Hrnciarova, M.; Bucova, P.; Galo, D.; et al. Gastrointestinal sequalae months after severe acute respiratory syndrome corona virus 2 infection: A prospective, observational study. Eur. J. Gastroenterol. Hepatol. 2022, 34, 925–932. [Google Scholar] [CrossRef] [PubMed]
- Blackett, J.W.; Wainberg, M.; Elkind, M.S.V.; Freedberg, D.E. Potential long COVID-19 gastrointestinal symptoms 6 months after coronavirus infection are associated with mental health symptoms. Gastroenterology 2022, 162, 648–650.e2. [Google Scholar] [CrossRef] [PubMed]
- Rizvi, A.; Patel, Z.; Liu, Y.; Satapathy, S.K.; Sultan, K.; Trindade, A.J.; Northwell Health COVID-19 Research Consortium. Gastrointestinal sequelae 3 and 6 months after hospitalization for Coronavirus Disease 2019. Clin. Gastroenterol. Hepatol 2021, 19, 2438–2440. [Google Scholar] [CrossRef] [PubMed]
- Choudhury, A.; Tariq, R.; Jena, A.; Vesely, E.K.; Singh, S.; Khanna, S.; Sharma, V. Gastrointestinal manifestations of long COVID: A systematic review and meta-analysis. Therap. Adv. Gastroenterol. 2022, 15, 17562848221118403. [Google Scholar] [CrossRef]
- Freedberg, D.E.; Chang, L. Gastrointestinal symptoms in COVID-19: The long and the short of it. Curr. Opin. Gastroenterol. 2022, 38, 555–561. [Google Scholar] [CrossRef]
- Norouzi Masir, M.; Shirvaliloo, M. Symptomatology and microbiology of the gastrointestinal tract in post-COVID conditions. JGH Open 2022, 6, 667–676. [Google Scholar] [CrossRef]
- Rocchi, G.; Giovanetti, M.; Benedetti, F.; Borsetti, A.; Ceccarelli, G.; Zella, D.; Altomare, A.; Ciccozzi, M.; Guarino, M.P.L. Gut Microbiota and COVID-19: Potential implications for disease severity. Pathogens 2022, 11, 1050. [Google Scholar] [CrossRef]
- Vojdani, A.; Vojdani, E.; Saidara, E.; Maes, M. Persistent SARS-CoV-2 Infection, EBV, HHV-6 and other factors may contribute to inflammation and autoimmunity in long COVID. Viruses 2023, 15, 400. [Google Scholar] [CrossRef] [PubMed]
- Pola, A.; Murthy, K.S.; Santhekadur, P.K. COVID-19 and gastrointestinal system: A brief review. Biomed. J. 2021, 44, 245–251. [Google Scholar] [CrossRef] [PubMed]
- Natarajan, A.; Zlitni, S.; Brooks, E.F.; Vance, S.E.; Dahlen, A.; Hedlin, H.; Park, R.M.; Han, A.; Schmidtke, D.T.; Verma, R.; et al. Gastrointestinal symptoms and fecal shedding of SARS-CoV-2 RNA suggest prolonged gastrointestinal infection. Med 2022, 3, 371–387. [Google Scholar] [CrossRef] [PubMed]
- Fernández-de-las-Peñas, C.; Martín-Guerrero, J.D.; Navarro-Pardo, E.; Torres-Macho, J.; Guijarro, C.; Pellicer-Valero, O.J. Exploring the recovery curve for gastrointestinal symptoms from the acute COVID-19 phase to long-term post-COVID: The LONG-COVID-EXP-CM Multicenter Study. J. Med. Virol. 2022, 94, 2925–2927. [Google Scholar] [CrossRef]
- Elshazli, R.M.; Kline, A.; Elgaml, A.; Aboutaleb, M.H.; Salim, M.M.; Omar, M.; Munshi, R.; Mankowski, N.; Hussein, M.H.; Attia, A.S.; et al. Gastroenterology manifestations and COVID-19 outcomes: A meta-analysis of 25,252 cohorts among the first and second waves. J. Med. Virol. 2021, 93, 2740–2768. [Google Scholar] [CrossRef]
- Adnan, D.; Deshmukh, A.; Khan, S.; Rempert, T.; Dhana, K.; Mahdavinia, M.; Bishehsari, F. Gastrointestinal symptoms predict the outcomes of COVID-19 Infection. Am. J. Gastroenterol. 2020, 115, S685–S686. [Google Scholar] [CrossRef]
- Otto, E.; Culakova, E.; Meng, S.; Zhang, Z.; Xu, H.; Mohile, S.; Flannery, M.A. Overview of Sankey flow diagrams: Focusing on symptom trajectories in older adults with advanced cancer. J. Geriatr. Oncol. 2022, 13, 742–746. [Google Scholar] [CrossRef]
- Friedel, D.M.; Cappell, M.S. Diarrhea and Coronavirus Disease 2019 Infection. Gastroenterol. Clin. N. Am. 2023, 52, 59–75. [Google Scholar] [CrossRef]
- Ghoshal, U.C.; Ghoshal, U.; Rahman, M.M.; Mathur, A.; Rai, S.; Akhter, M.; Mostafa, T.; Islam, M.S.; Haque, S.A.; Pandey, A.; et al. Post-infection functional gastrointestinal disorders following coronavirus disease-19: A case-control study. J. Gastroenterol. Hepatol. 2022, 37, 489–498. [Google Scholar] [CrossRef]
- Schmulson, M.; Ghoshal, U.C.; Barbara, G. Managing the inevitable surge of post-COVID-19functional gastrointestinal disorders. Am. J. Gastroenterol. 2021, 116, 4–7. [Google Scholar] [CrossRef]
- Fernández-de-las-Peñas, C. Are patients exhibiting post-Coronavirus Disease (COVID) symptoms at 12 months the same at 5 or 9 months? The fluctuating nature of Post-COVID. Clin. Infect. Dis. 2022, 75, e1208. [Google Scholar] [CrossRef] [PubMed]
- Burton, C.; Dawes, H.; Goodwill, S.; Thelwell, M.; Dalton, C. Within and between-day variation and associations of symptoms in long COVID: Intensive longitudinal study. PLoS ONE 2023, 18, e0280343. [Google Scholar] [CrossRef]
- Fernández-de-las-Peñas, C.; Florencio, L.L.; Gómez-Mayordomo, V.; Cuadrado, M.L.; Palacios-Ceña, D.; Raveendran, A.V. Proposed integrative model for post-COVID symptoms. Diabetes Metab. Syndr. 2021, 15, 102159. [Google Scholar] [CrossRef] [PubMed]
- Fernández-de-las-Peñas, C.; Martín-Guerrero, J.; Navarro-Pardo, E.; Torres-Macho, J.; Canto-Diez, M.G.; Pellicer-Valero, O. Gastrointestinal symptoms at the acute COVID-19 phase are risk factors for developing gastrointestinal post-COVID symptoms: A multicenter study. Intern. Emerg. Med. 2022, 17, 583–586. [Google Scholar] [CrossRef]
- Vélez, C.; Paz, M.; Silvernale, C.; Stratton, L.W.; Kuo, B.; Staller, K. Suffolk County COVID-19 Gastrointestinal Symptom Assessment Factors associated with chronic de novo post-Coronavirus Disease gastrointestinal disorders in a Metropolitan US County. Clin. Gastroenterol. Hepatol. 2022, 20, e1488–e1492. [Google Scholar] [CrossRef] [PubMed]
- Suárez-Fariñas, M.; Tokuyama, M.; Wei, G.; Huang, R.; Livanos, A.; Jha, D.; Levescot, A.; Irizar, H.; Kosoy, R.; Cording, S.; et al. Intestinal inflammation modulates the expression of ACE2 and TMPRSS2 and potentially overlaps with the pathogenesis of SARS-CoV-2–related disease. Gastroenterology 2021, 160, 287–301. [Google Scholar] [CrossRef]
- Sperber, A.D.; Bangdiwala, S.I.; Drossman, D.A.; Ghoshal, U.C.; Simren, M.; Tack, J.; Whitehead, W.E.; Dumitrascu, D.L.; Fang, X.; Fukudo, S.; et al. Worldwide prevalence and burden of functional gastrointestinal disorders, results of Rome foundation global study. Gastroenterology 2021, 160, 99–114. [Google Scholar] [CrossRef]
- Notarte, K.I.; Catahay, J.A.; Velasco, J.V.; Pastrana, A.; Ver, A.T.; Pangilinan, F.C.; Peligro, P.J.; Casimiro, M.; Guerrero, J.J.; Gellaco, M.M.L.; et al. Impact of COVID-19 vaccination on the risk of developing long-COVID and on existing long-COVID symptoms: A systematic review. EClinicalMedicine 2022, 53, 101624. [Google Scholar] [CrossRef]


| Age, mean (SD), years | 61 (16.5) |
| Female (%) | 578 (45.6%) |
| Weight, mean (SD), kg. | 74.5 (14.5) |
| Height, mean (SD), cm. | 165 (19.0) |
| Main symptoms at hospital admission, n (%)—T0 | |
| Fever | 948 (74.9%) |
| Dyspnoea | 361 (28.5%) |
| Myalgia | 374 (29.5%) |
| Cough | 360 (28.4%) |
| Headache | 135 (16.7%) |
| Diarrhea | 105 (8.3%) |
| Anosmia | 105 (8.3%) |
| Ageusia | 66 (7.0%) |
| Throat pain | 66 (5.2%) |
| Vomiting | 39 (3.0%) |
| Medical co-morbidities | |
| Hypertension | 336 (26.5%) |
| Diabetes | 158 (12.5%) |
| Cardiovascular disease | 141 (11.2%) |
| Asthma | 85 (6.7%) |
| Obesity | 57 (4.5%) |
| Chronic obstructive pulmonary disease | 47 (3.7%) |
| Rheumatological disease | 16 (1.3%) |
| Other (cancer, kidney disease) | 207 (16.3%) |
| Stay at the hospital, mean (SD), days | 10.5 (10.8) |
| Intensive care unit (ICU) admission | 78 (6.2%) |
| Gastrointestinal Symptoms | Diarrhea | |
|---|---|---|
| Age | 0.994 (0.964; 1.025) | 0.968 (0.921; 1.017) |
| Female sex | 0.441 (0.169; 1.147) | 1.239 (0.254; 6.050) |
| Weight | 0.976 (0.942; 1.011) | 0.982 (0.930; 1.037) |
| Height | 0.982 (0.243; 3.963) | 0.955 (0.943; 1.050) |
| Symptoms at hospital admission—T0 | ||
| Dyspnoea | 1.263 (0.519; 3.073) | 0.680 (0.128; 3.613) |
| Myalgia | 1.165 (0.508; 2.674) | 0.246 (0.033; 1.838) |
| Cough | 1.121 (0.464; 2.710) | 0.646 (0.122; 3.426) |
| Headache | 0.864 (0.315; 2.370) | 0.341 (0.038; 3.071) |
| Diarrhea | 1.462 (0.449; 4.760) | 0.689 (0.084; 5.626) |
| Anosmia | 0.414 (0.132; 1.293) | 1.617 (0.128; 20.382) |
| Ageusia | 0.356 (0.055; 2.290) | 0.620 (0.025; 15.142) |
| Throat pain | 1.938 (0.467; 8.033) | 1.799 (0.214; 15.130) |
| Vomiting | 0.396 (0.040; 3.957) | 0.929 (0.164; 5.246) |
| Medical co-morbidities | ||
| Hypertension | 1.194 (0.048; 2.920) | 1.864 (0.330; 10.538) |
| Diabetes | 0.400 (0.099; 1.620) | 0.993 (0.120; 8.218) |
| Cardiovascular disease | 0.991 (0.316; 3.112) | 1.023 (0.983; 1.065) |
| Asthma | 0.453 (0.083; 2.485) | 4.006 (0.466; 34.423) |
| Obesity | 0.855 (0.100; 7.293) | 0.671 (0.192; 2.340) |
| Chronic obstructive pulmonary disease | 0.561 (0.055; 5.677) | 0.868 (0.180; 4.194) |
| Rheumatological disease | 0.361 (0.015; 8.858) | 1.373 (0.717; 3.724) |
| Stay at the hospital | 1.002 (0.966; 1.041) | 0.971 (0.866; 1.088) |
| Gastrointestinal Symptoms | Diarrhea | |
|---|---|---|
| Age | 1.000 (0.962; 1.039) | 0.995 (0.959; 1.032) |
| Female sex | 0.817 (0.279; 2.392) | 2.495 (0.798; 7.803) |
| Weight | 0.981 (0.942; 1.022) | 1.004 (0.971; 1.038) |
| Height | 0.998 (0.985; 1.012) | 0.984 (0.967; 1.001) |
| Symptoms at hospital admission—T0 | ||
| Dyspnoea | 0.565 (0.173; 1.849) | 2.056 (0.784; 5.387) |
| Myalgia | 1.801 (0.663; 4.891) | 0.596 (0.207; 1.717) |
| Cough | 1.689 (0.621; 4.594) | 0.844 (0.286; 2.485) |
| Headache | 0.308 (0.066; 1.440) | 2.427 (0.807; 7.298) |
| Diarrhea | 0.942 (0.227; 3.916) | 1.498 (0.435; 5.154) |
| Anosmia | 0.307 (0.032; 2.958) | 0.878 (0.147; 5.230) |
| Ageusia | 0.660 (0.128; 3.417) | 1.062 (0.184; 6.134) |
| Throat pain | 0.943 (0.127; 6.980) | 0.376 (0.029; 4.965) |
| Vomiting | 0.492 (0.036; 6.802) | 4.198 (0.626; 28.150) |
| Medical co-morbidities | ||
| Hypertension | 1.735 (0.570; 5.281) | 1.305 (0.478; 3.562) |
| Diabetes | 0.614 (0.114; 3.302) | 1.619 (0.447; 5.868) |
| Cardiovascular disease | 1.145 (0.271; 4.842) | 2.973 (0.923; 9.579) |
| Asthma | 1.888 (0.434; 8.223) | 0.797 (0.165; 3.850) |
| Obesity | 1.055 (0.160; 6.962) | 2.091 (0.268; 16.294) |
| Chronic obstructive pulmonary disease | 3.070 (0.273; 34.578) | 2.300 (0.452; 11.708) |
| Rheumatological disease | 0.361 (0.015; 8.858) | 0.441 (0.041; 4.765) |
| Stay at the hospital | 0.965 (0.909; 1.025) | 0.983 (0.938; 1.030) |
Disclaimer/Publisher’s Note: The statements, opinions and data contained in all publications are solely those of the individual author(s) and contributor(s) and not of MDPI and/or the editor(s). MDPI and/or the editor(s) disclaim responsibility for any injury to people or property resulting from any ideas, methods, instructions or products referred to in the content. |
© 2023 by the authors. Licensee MDPI, Basel, Switzerland. This article is an open access article distributed under the terms and conditions of the Creative Commons Attribution (CC BY) license (https://creativecommons.org/licenses/by/4.0/).
Share and Cite
Fernández-de-las-Peñas, C.; Torres-Macho, J.; Guijarro, C.; Martín-Guerrero, J.D.; Pellicer-Valero, O.J.; Plaza-Manzano, G. Trajectory of Gastrointestinal Symptoms in Previously Hospitalized COVID-19 Survivors: The Long COVID Experience Multicenter Study. Viruses 2023, 15, 1134. https://doi.org/10.3390/v15051134
Fernández-de-las-Peñas C, Torres-Macho J, Guijarro C, Martín-Guerrero JD, Pellicer-Valero OJ, Plaza-Manzano G. Trajectory of Gastrointestinal Symptoms in Previously Hospitalized COVID-19 Survivors: The Long COVID Experience Multicenter Study. Viruses. 2023; 15(5):1134. https://doi.org/10.3390/v15051134
Chicago/Turabian StyleFernández-de-las-Peñas, César, Juan Torres-Macho, Carlos Guijarro, José D. Martín-Guerrero, Oscar J. Pellicer-Valero, and Gustavo Plaza-Manzano. 2023. "Trajectory of Gastrointestinal Symptoms in Previously Hospitalized COVID-19 Survivors: The Long COVID Experience Multicenter Study" Viruses 15, no. 5: 1134. https://doi.org/10.3390/v15051134