1. Introduction
Cities affect the health and well-being of urban dwellers in many ways. They exhibit elevated levels of environmental stressors such as air pollution, heat, and noise, which are known to have negative impacts on human health [
1,
2,
3]. Further, the agglomeration of humans has effects on the well-being of humans. To improve the health and well-being of the urban population and to assess human exposure to environmental change and multiple stressors in urban areas, knowledge about the processes within urban systems is necessary. Von Szombathely et al. [
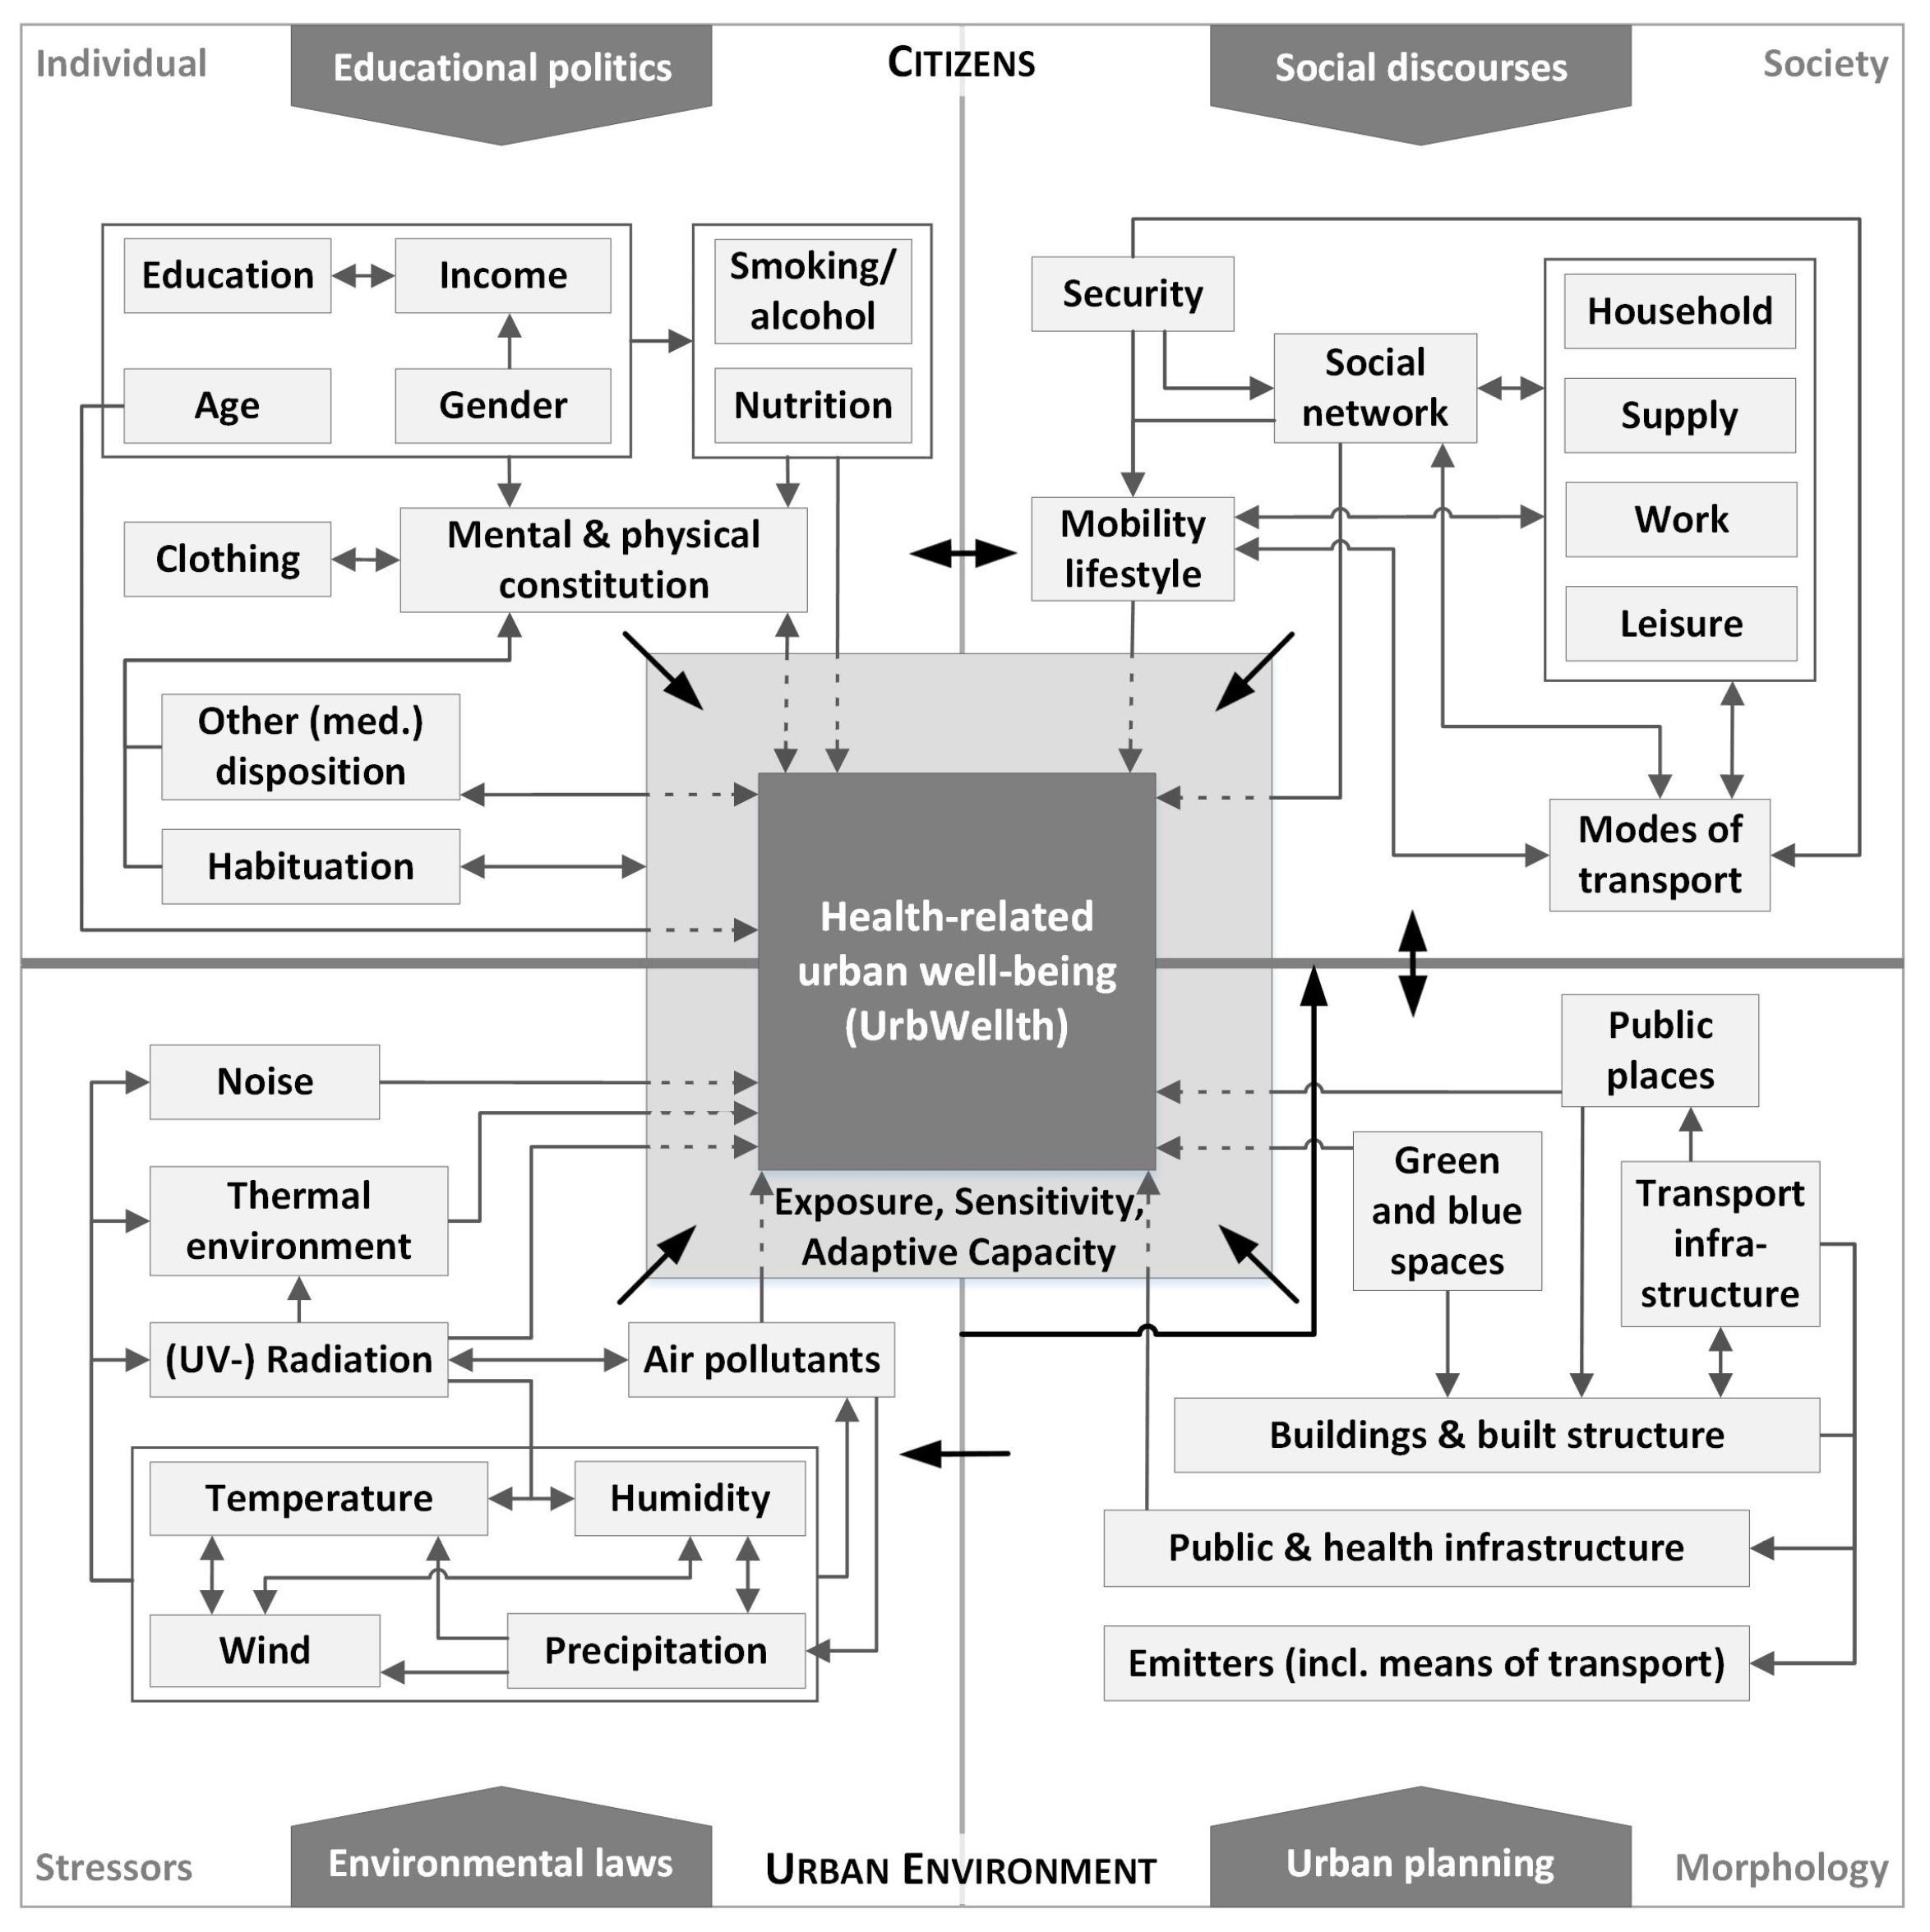
4] constructed a conceptual model for health-related urban well-being (UrbWellth) based on published knowledge and expert consultation. As displayed in
Figure 1, the model relates the different variables and processes in the urban system to the health-related well-being of urban dwellers in a systematic way deducted from concepts of environmental justice and vulnerability. Assessment of UrbWellth as a result of the different processes within the urban system will help city planners and decision-makers in finding the essential mechanisms and linkages to achieve a sustainable urban development that optimizes the well-being of urban dwellers. However, the interrelations between the parts of the conceptual model are complex.
For individual parts of the urban system, integrated mathematical models have been developed, e.g., for hydrological aspects [
5,
6,
7], environmental aspects [
8], as well as transport and land-use [
9]. Additionally, theories about the behavior of simple accumulated measures, e.g., total unemployment, total wages, or road surfaces, are available as a function of city size in the form of universal scaling laws [
10], although these scaling laws are debated in the scientific community [
11]. In the modeling of UrbWellth, more sophisticated indicators, and more than one part of the urban system, need to be introduced, and simple scaling laws cannot be expected due to the large number of non-linear interrelations between variables affecting UrbWellth.
In the interdisciplinary project “UrbMod—developing a multi-sector urban development impact model” sectoral know-how for modeling of different parts of the urban system exists. The modeling approaches range from numerical models that describe the urban climate, air quality, or traffic to statistical models that establish relationships between environmental variables and health or between a city’s morphology and the behavior of urban dwellers. Hence, apart from the complexity of urban processes, the integration of different modeling approaches is a challenging task itself. Different disciplinary backgrounds need to be accommodated and different models as well as software infrastructures (e.g., different programming languages and different data structures) need to be coupled. The first steps towards an integrated model have already been undertaken by coupling models with reduced complexity in an idealized city [
12] and by exploring the applicability of coupling agent-based models with models that simulate environmental conditions [
13]. However, we still face the issue of identifying and defining the connecting variables and processes, and thus the interfaces. Up to now, there have been no rational means to systematically define what variables and processes should work as interfaces among different models or software infrastructures.
To determine the interface variables and processes, the present study aims to explore the applicability of the Design Structure Matrix (DSM) and Multi-Domain Design Structure Matrix (MDDSM) concepts to the integrated modeling framework for UrbWellth. There are some alternative methods to model complicated systems graphically, such as System Dynamics [
14,
15] and SysML (System Modeling Language) [
16], and some alternative methods to analyze clusters of system elements mathematically, such as the hierarchical clustering method [
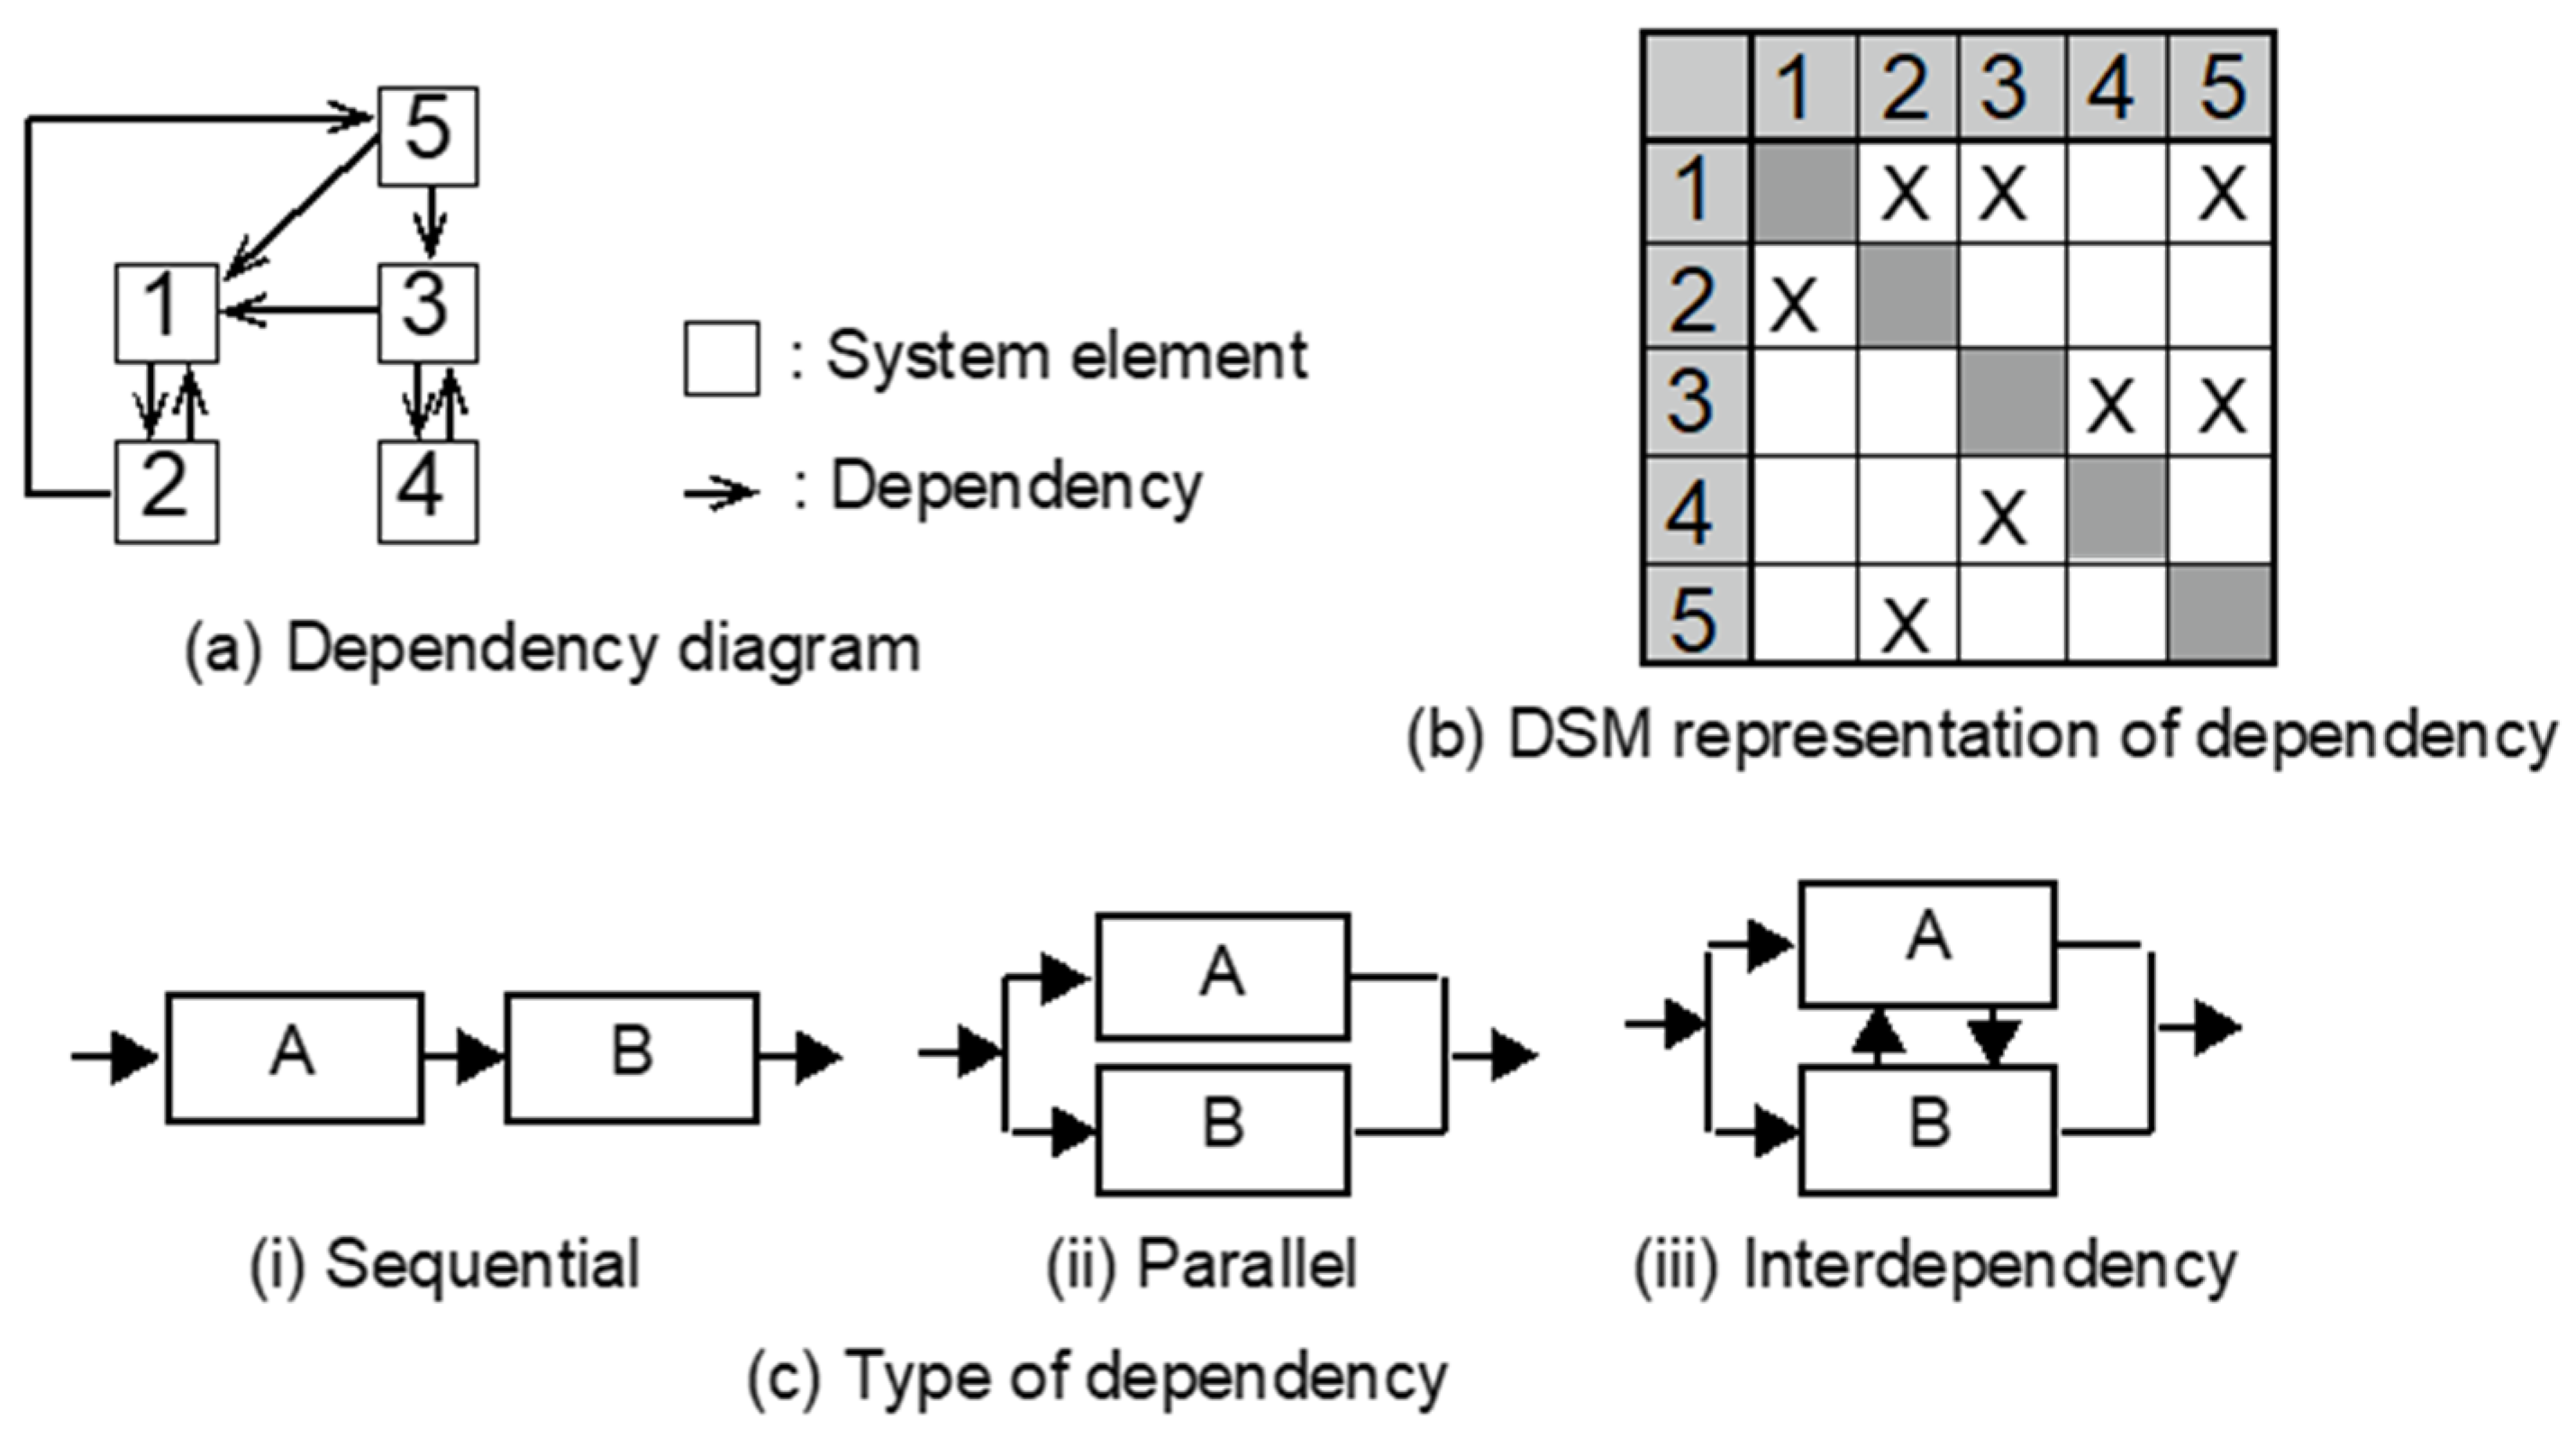
17]. The DSM concept offers the following advantages [
18]: (i) its matrix format gives a concise, visual, and intuitive representation of dependencies among system elements; (ii) the matrix-based nature of DSM opens the door to powerful analysis algorithms of clustering. Both advantages facilitate system modelers to understand the whole of the designed system and potential interfaces among subsystems [
18]. Thus, using DSM and MDDSM can help to identity relevant interfaces.
The concepts of DSM and MDDSM are introduced in
Section 2. The modeling approaches employed within the project UrbMod are described, and their relationship to the conceptual model of UrbWellth is discussed in
Section 3. In
Section 4, the DSM and MDDSM approaches are applied to the conceptual model, followed by a discussion of the results in
Section 5. Concluding remarks are put forward in
Section 6.
3. Urban System Modeling Approaches within UrbMod
The proposed MDDSM approach requires an allocation of interrelations within the DSM to specific modeling approaches. In the following, the modeling approaches that are applied in the consortium of the UrbMod project are briefly introduced, together with a localization of these approaches within the conceptual model (i.e., the sectors and variables presented in
Figure 1).
3.1. Atmospheric Models
Urban areas develop their own unique local climate, the so-called urban climate, which interacts with regional climate conditions. The most prominent urban climate phenomenon is the urban heat island (UHI), which refers to higher near-surface temperatures in urban areas compared to the surrounding rural areas [
27]. Furthermore, other meteorological variables are affected by urban areas, as presented in the conceptual model. Numerical atmospheric models are used to simulate the urban climate in high-resolution numerical atmospheric models (e.g., [
28]). They solve differential equations that cover the momentum, mass, and heat balance of the atmosphere. In addition, other relevant physical processes, such as radiation, cloud and rain microphysics, and turbulence are indirectly modeled using relevant parameterizations. The representation of urban areas in atmospheric models depends on the horizontal resolution of the model. Building-resolving models (horizontal resolutions of a few meters) can simulate meteorological conditions directly within the urban canopy layer (e.g., [
29,
30]), while models with horizontal resolutions in the order of 100 m to several kilometers use specific urban parameterizations (e.g., [
31]).
With respect to the conceptual model, atmospheric models simulate the meteorological variables (temperature, humidity, wind, precipitation, and (UV-)radiation) as a function of urban morphology (buildings and built structures, and green and blue spaces).
3.2. Atmospheric Chemistry Transport Models
The air quality in cities can often be classified as very poor compared to that in rural surroundings. Thus, it affects the health of the urban population and therefore UrbWellth. High concentrations of air pollutants are mainly due to intense emissions from traffic, energy production, and residential heating. A wide range of gaseous pollutants can be found in the urban atmosphere, such as nitrogen dioxide (NO2), carbon monoxide (CO), ozone (O3), and particulate matter (PM). The underlying relevant chemical transformations can only be described by a rather complex set of chemical reaction equations.
To assess the fate of emitted pollutants and concentrations of health affecting substances in a city, atmospheric chemistry transport models (CTMs) are employed. These numerical models compute the transport and transformation of a set of gases and particles (e.g., [
32]). The meteorological information needed by CTMs is typically provided by atmospheric models (
Section 3.1). At the urban scale, such chemistry transport models typically run with a horizontal grid resolution of 1 km down to 100 m. Models which provide pollutant concentrations on a building/street canyon resolving scale for larger parts of a city are rare or under development [
33]. Since the influence of substances advected from the region on pollutant concentrations in a city is not negligible, it is typically considered via boundary conditions from regional CTMs.
A crucial part of a chemistry-transport modeling system is the feed-in of emissions of the different substances [
34]. Since the emitters in urban areas are diverse and not equally distributed, it is critical to accurately determine the spatiality and temporality of emissions. Often, a separate emission model, sometimes with interactive meteorology, is employed to generate the necessary inventories (e.g., [
35]). For cities, quite detailed and highly resolved emissions data are necessary, and these often require a bottom-up approach, i.e., for traffic, industrial, and residential heating emissions utilizing geographical and census data. A special case is harbor cities, where ships emit exhaust fumes, which contribute substantively to NO
2 and PM concentrations and need to be determined (e.g., [
36]).
In summary, chemistry transport models simulate the concentrations of different pollutants at the pedestrian level as a function of meteorological variables (temperature, humidity, wind, precipitation, and (UV-)radiation) and emissions from different sources within urban areas and their surroundings (i.e., emitters (incl. means of transport)).
3.3. Exposure Models
The health of urban dwellers is only affected by stressors if urban dwellers are exposed to them. Hence, exposure is an important variable within the conceptual model of UrbWellth. Together with sensitivity and adaptive capacity, they form a so-called filter or modifying variable for the impact of the different stressors on UrbWellth. Modeling exposure is a complex task. It is necessary to know not only the stressors but also the locations and activities of the urban dwellers in sufficient detail. A simple way of accounting for exposure would be to use census data and combine them with maps of environmental stressors (e.g., [
37,
38]). However, for a comprehensive assessment of exposure, dynamic exposure models are currently developed. Here, two approaches are described, which differ in their complexity, numerical formulation, and intended application.
3.3.1. Agent-Based Models
Within the framework of agent-based modeling (ABM), the actions and interactions of autonomous agents (both individual and collective entities) are simulated, representing the behavior of heterogeneous subjects following decision rules to adapt action pathways to their values and vulnerabilities [
39]. ABM is appropriate to simulate human exposure to environmental stressors for different citizens in an urban environment and their responses. In particular, agents are configured to resemble types of urban dwellers that move within the urban environment, which consists of urban surfaces (e.g., transport network, buildings, and schools) and environmental conditions (e.g., urban climate and air pollution). Agents follow certain daily routines based on their attributes and adapt their means and pathways of transportation (such as car, bicycle, or public transport) as a function of location, time, and environmental conditions, which need to be defined before the simulations [
13].
Consequently, the ABM approach covers the processes related to mode of transport and mobility lifestyle with social (work, income) and environmental variables (e.g., precipitation, human thermal environment, air pollution).
3.3.2. Mathematical Models
Instead of simulating the movement of agents within the city, the mathematical modeling approach classifies urban dwellers into population groups. These groups can then be treated as partial densities. Using physical laws and results from experiments [
40], mathematical equations can be constructed for describing the movement of these groups. This construction has been carried out for idealized city configurations, where, among others, assumptions were made about the relationship between population distribution and the morphology of the city and about the distribution of workplaces [
12]. Within these idealized urban settings, stressors such as heat stress can be computed. As outcomes of such models, exposure for a group, for people living at a certain location, for car or bike users, and for the whole working population can be computed.
With respect to the conceptual model, the mathematical approach covers similar processes and variables to the ABM approach.
3.4. Travel Demand Models
Motorized road traffic is a major source of air pollutants and noise within cities. As measuring and monitoring these emissions throughout an entire traffic network is unrealistically resource-intensive, emission models are often used to quantify such environmental stressors. However, among other parameters, such models need information about road traffic patterns as their input. This includes vehicle types and numbers, as well as travel speeds at different times and along different parts of the network. Such inputs can be obtained from travel demand models (TDMs), which calculate the expressed mobility of both people and goods within a network. They can represent both present network scenarios (key statistics about which are also generally used to calibrate the models), as well as predict future travel demand under different conditions. Conventional four-step TDMs are based on traffic cells, which define trip origins and destinations. The trips generated within such cells are calculated based on cells’ functions (residential, employment, education, and so on) and household demographics (trip generation). They are then assigned to an origin/destination matrix (trip distribution) and different modes (mode choice). Finally, the trips are assigned to mode-specific networks to calculate network loads (route choice; [
41]). This operation can provide traffic-related parameters for the various network elements and relate to different parts of the day (such as a.m. or p.m. peak, or night-time).
Within the conceptual model, the TDM models cover the relationships between the variable modes of transport and the variables mobility lifestyle, transport infrastructure, and work.
3.5. Noise Models
In addition to air pollution, noise is also a threat to large sections of urban society. In Germany, 54% of the population feel disturbed or bothered by traffic noise [
42]. At the same time, noise has a major impact on health. According to the World Health Organization (WHO), due to traffic noise in Western Europe, at least one million healthy years of life are lost each year [
43]. The estimation of the actual burden of noise exposure requires sound propagation models.
Simple sound propagation models calculate the transmission of sound through the atmosphere and predict the sound at a location based on emissions [
44]. There are a variety of calculation methods and numerical models of sound propagation. They differ by the number of processes considered, their accuracy, and the computational effort involved [
45].
For instance, sound produced by road traffic depends, for example, on traffic density, traffic flow, the combination of tire and road properties, the noise emissions of vehicles (typology of vehicles), the behavior of drivers (especially concerning vehicle and engine speeds), speed limits, and the geometric conditions of the surroundings [
46,
47]. In addition, sound propagation is influenced by meteorological factors such as temperature gradients, humidity, and wind [
44,
48].
The most commonly used traffic noise model (TNM) in Europe originated in France, the “Nouvelle Methode de Prevision de Bruit” (NMPB). It takes into account traffic volume and vehicle type, meteorological conditions on a general level, and propagation conditions such as the ground effect and diffraction [
49,
50], and has been applied to generate noise maps [
51,
52].
The noise models cover the processes that deal with the dependency of noise on building and built structures, traffic variables (i.e., transport infrastructure and emitters (incl. means of transport)), and the meteorological variables (i.e., temperature, humidity, and wind).
3.6. Social Models
Social scientists have developed a large number of conceptional and theoretical approaches relevant to this domain. Therefore, a careful selection of a salient approach is necessary for research and modeling related to UrbWellth [
4]. One of the most influential models of social interactions was presented by Bourdieu [
53], who weaved the vertical stratification of urban society (described for example by classes after [
54]) with a variety of horizontal criteria of distinction. The thus shaped habitus and social structure [
55] influence the individual actions of the people in urban society. These dynamics are, in turn, closely linked to public health.
Therefore, it is crucial to account for social processes; for instance, social status is an important factor for many diseases, as well as the well-being of urban dwellers (e.g., [
56]). Statistical models are often based on the results of surveys [
57]. The results of the primary data collection undertaken within UrbMod show that Hamburg has an unequal distribution of environmental stressors [
58]: young people and dwellers with low wages are more affected by street noise [
57]. In addition, variables that have a significant impact on UrbWellth can be identified [
59].
On the other hand, for Gehl [
60], it is precisely the “life between houses” that defines urbanity. The possible social interactions and actions outweigh negative influences such as noise. The classical geographical model of the “basic functions of being” (living, working, recovering, and supplying) and Hägerstrand’s concept [
61] of “time geography” provide the spatial patterns from which the possibilities and limitations for decisions about activity derive.
In summary, social models cover most variables that are grouped into the society sector of the conceptual model and their relationships with the morphology sector and individual sector. In addition, there are also relationships with UrbWellth.
3.7. Health Models
The health of urban dwellers, an integral part of the target function of UrbWellth, depends on the different sectors of the urban system. The associations between different potential determinants (e.g., environmental stressors: noise, air pollution, and meteorological variables, which lead to heat stress) and health are usually simulated with statistical models (e.g., [
37,
38]), denoted here as health models. Regression models, in which one (univariate) or more (multivariate) independent variables are linked to a certain health outcome (i.e., dependent variable), are frequently used. The statistical associations are constructed using the results of epidemiological studies. Health models should also adjust for so-called confounders, which are determinants that correlate with both the dependent and independent variable(s). The conceptual model of UrbWellth controls for confounders that were found to correlate with many health outcomes in most epidemiological studies (age, gender, smoking, and most variables from the society sector).
3.8. Biometeorological Models
Biometeorological models are applied to characterize how meteorological variables affect human thermal comfort or thermal stress. Thermal stress can be highly dependent on urban morphology (e.g., [
62]) due to variable short- and long-wave radiation fluxes, wind speed, air temperature, and humidity in the city. In addition to these meteorological variables, biometeorological models also take human characteristics such as clothing and activity into account to calculate heat fluxes within the human body and to the environment [
63]. Depending on the number of nodes representing the body (one, two, multi-node, or multi-element models), heat fluxes are simulated with differential complexity in existing biometeorological models [
63]. Based on those fluxes and state variables such as skin and core temperature, thermal indices are derived that summarize the effect of the meteorological parameters on the human body into one quantity. In total, more than 165 thermal indices have been proposed [
64]. However, not all of them explicitly calculate heat fluxes and solve the energy balance of the human body.
Within the conceptual model, biometeorological models cover the processes between the meteorological variables (temperature, humidity, wind, and radiation), which are either provided by measurements or by atmospheric models, and UrbWellth.
4. Application of the MDDSM Approach to the Conceptual Model of UrbWellth
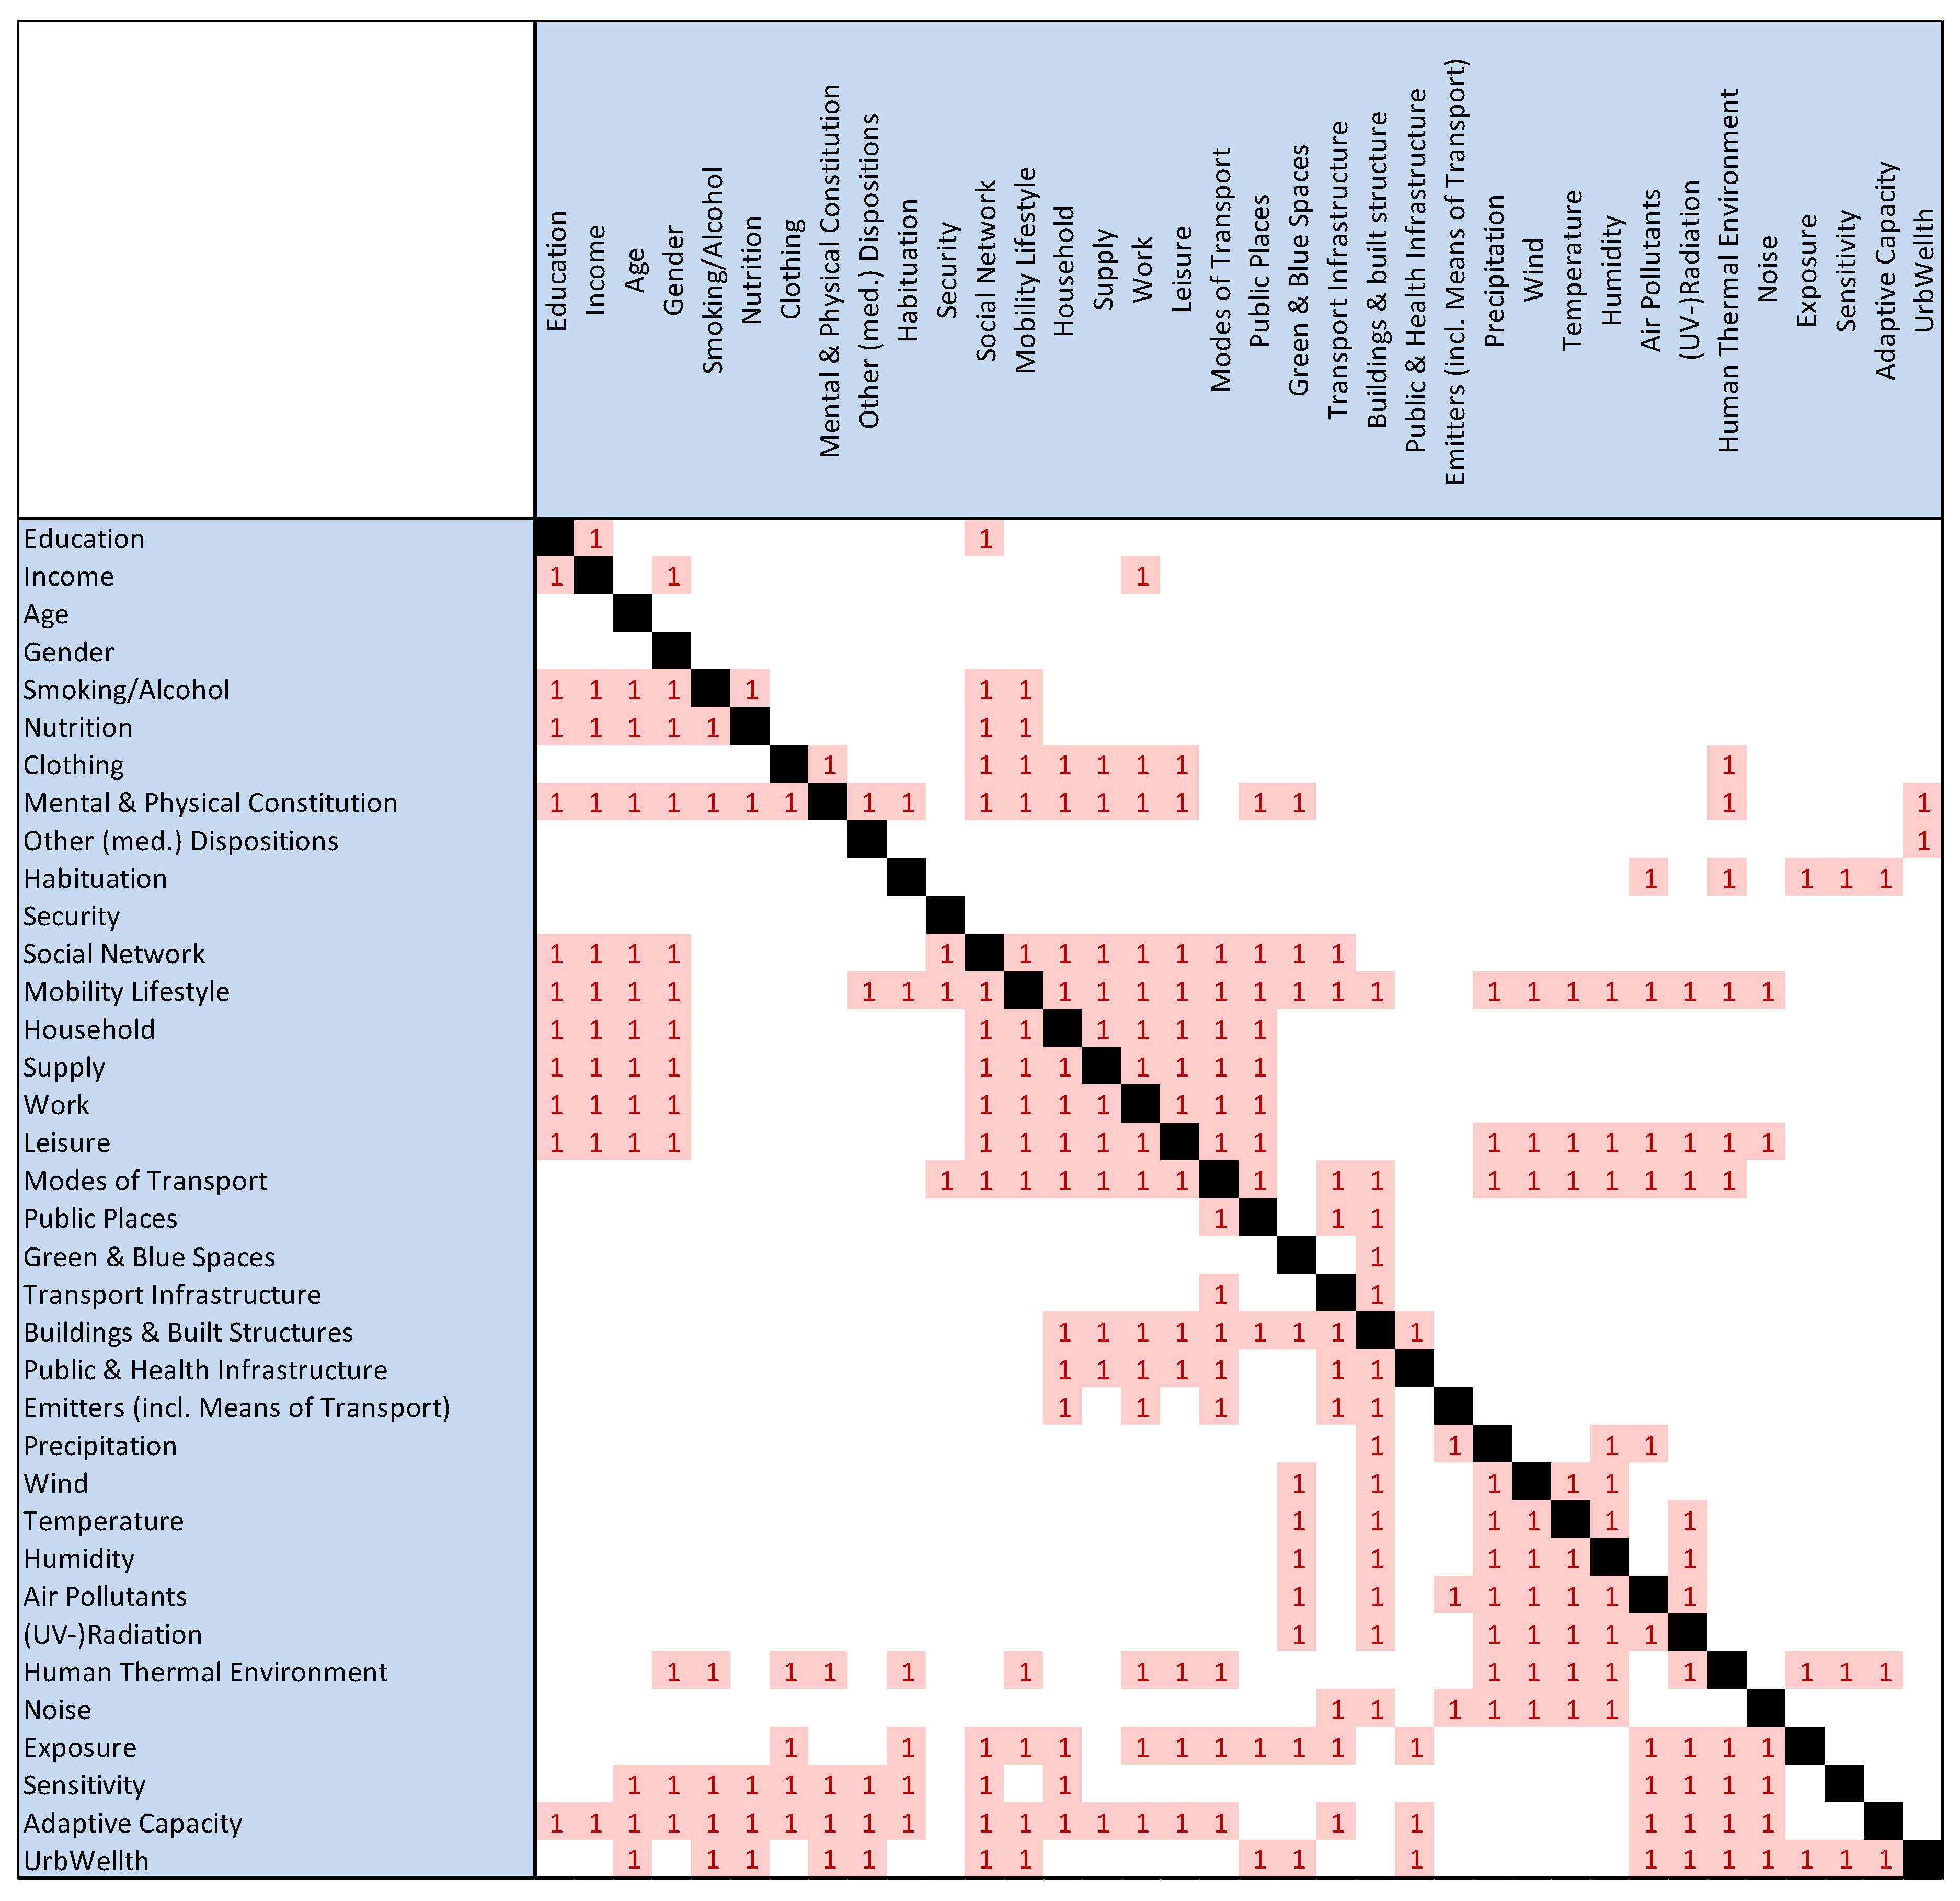
A DSM was constructed based on the conceptual model shown in
Figure 3. For expository purposes, in [
4], relationships between the variables in
Figure 1 were combined into bigger arrows (e.g., between the four sectors). Consequently, the DSM showed more entries than indicated by the arrows in
Figure 1. In total, there were 317 processes in the conceptual model. From the DSM, it is already visible that there are clusters of variables that are interrelated, which was already considered in the conceptual model by introducing boxes (e.g., the box including household, supply, work, and leisure). In addition, it can be seen that the variables exposure, sensitivity, adaptive capacity, and UrbWellth depend on most of the other variables.
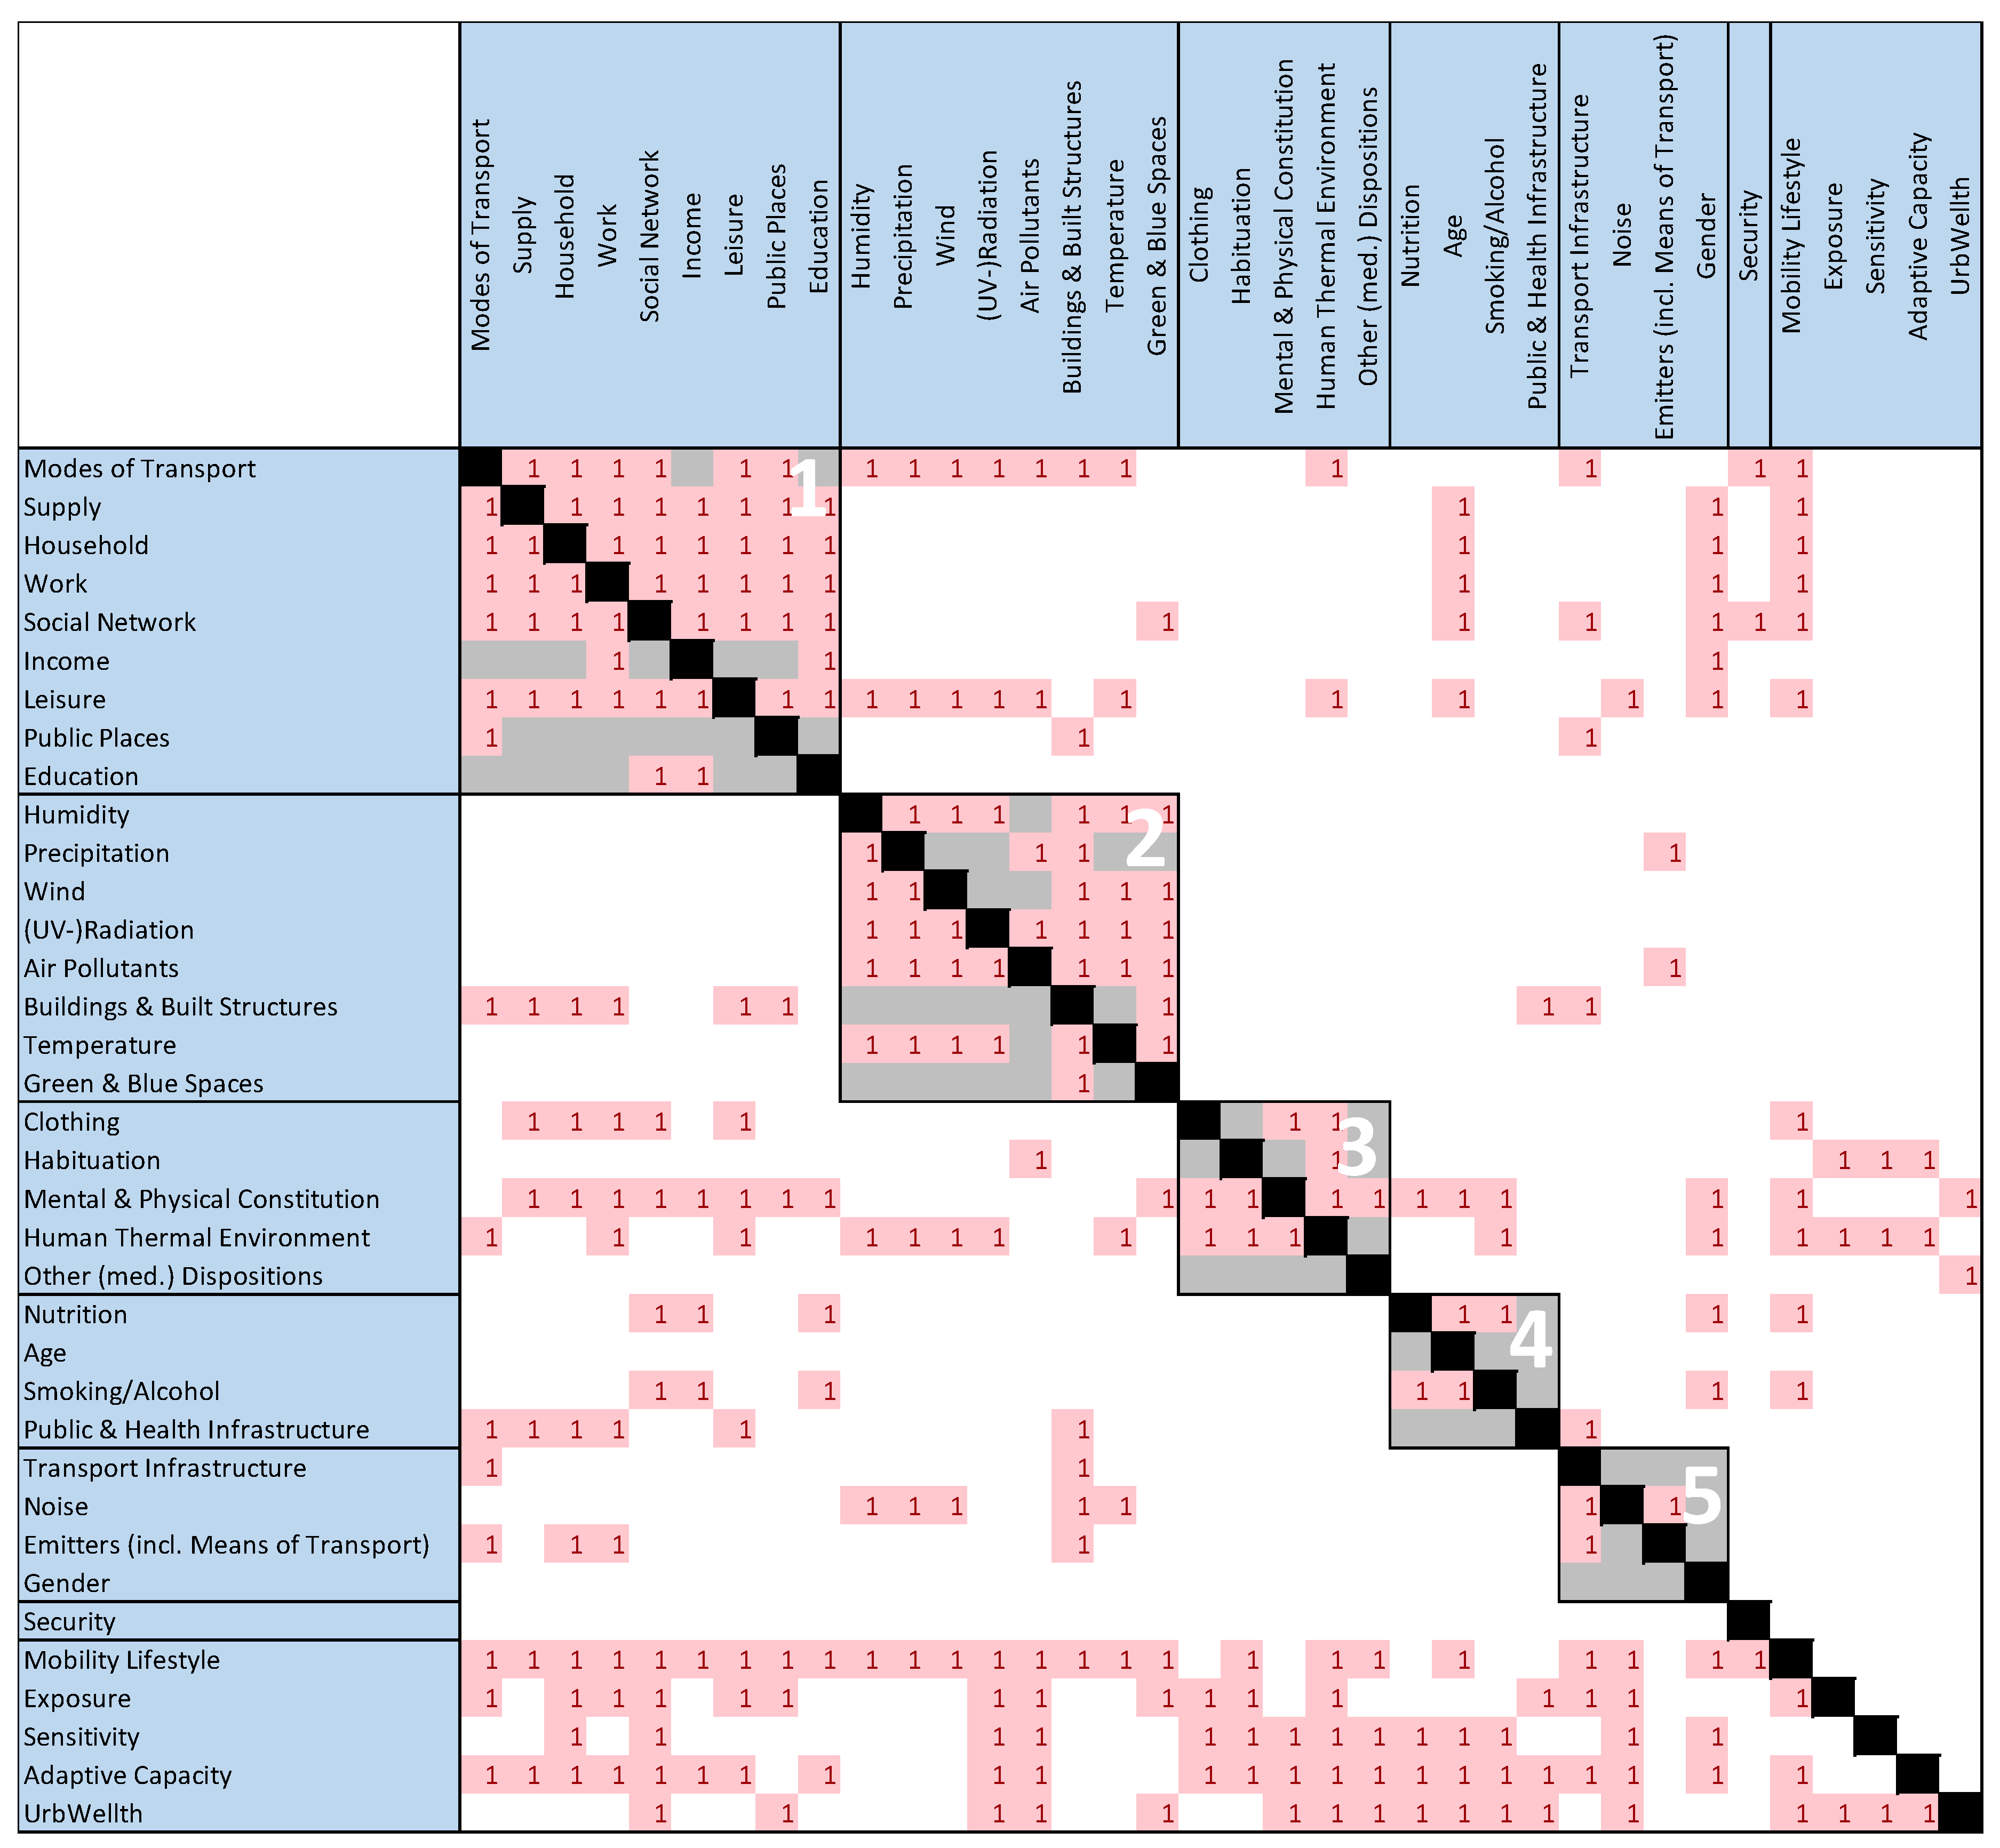
To structure the DSM, a clustering algorithm was applied (
Section 2.2). Five of the variables (mobility lifestyle, exposure, sensitivity, adaptive capacity, and UrbWellth) were excluded from the clustering operation because they are related to many other variables. System elements that have a great extent of dependencies with the rest of the elements are called bus elements in general [
24,
65]. Because bus elements work as system integrators, they were distinguished from clusters. Distributing these variables into specific clusters would be misleading because these variables need to be accounted for by most modelers.
Figure 4 shows the clustered DSM with α= 0.6. The α value was selected based on a comparison of clustering results with nine different α values from 0.1 to 0.9 at intervals of 0.1. The case of α = 0.5 obtained two large clusters, while the case of α = 0.7 obtained seven small clusters. The case of α = 0.6 was the most feasible compared to the original conceptual model of
Figure 1. In total, five clusters were formed. To quantitatively assess the similarity between the conceptual model of
Figure 1 and the DSM results in
Figure 4, the cluster matrix method [
65] was employed. In the cluster matrix, each cell shows whether or not two variables are in the same cluster. This study made two cluster matrices based on the conceptual model and the DSM results of 31 variables except for five bus elements. The comparison of them revealed that 77% of cells in the cluster matrix were matched. Therefore, the clustering confirmed that the separation in the conceptual model is, to some extent, reasonable. However, there are some differences between the separation in the conceptual model (
Figure 1) and the clusters in the DSM (
Figure 4). The variable security was not assigned to any cluster. In addition, gender and public and health services were not interrelated with variables within their clusters. Both variables could have been assigned to the first cluster. It seems that this would have increased the intra-cluster dependencies to a larger extent than it would have decreased the inter-cluster dependencies. The first and second clusters are similar to the society and stressor sector, respectively, of the conceptual model (
Figure 1). There are, however, exceptions. Noise is not located in cluster 2, but in cluster 5, human thermal environment is located in cluster 3, and buildings and built structures and green and blue spaces are variables from the morphology sector. The individual sector in
Figure 1 is resembled by cluster 3 and 4. Cluster 5 consists of two variables from the morphology sector (emitters and transport infrastructure) as well as noise and gender. The variables from the morphology sector of the conceptual model were not classified into one cluster but are located in clusters 1, 2, 4, and 5.
The interrelations between the clusters can be easily assessed in
Figure 4, too. Firstly, it is clear that cluster 3 only impacts cluster 1, while cluster 3 itself depends on all clusters. Clusters 3, 4, and 5 just depend sequentially. In addition, specific variables that link the different clusters can be identified. For instance, modes of transport and leisure are the main links to cluster 1 from cluster 2, and buildings and built structures link from cluster 1 to cluster 2.
To link the different modeling approaches to the conceptual model, the DSM was extended to an MDDSM. In the present study, the domains corresponded to the set of processes within the conceptual model that was simulated by the different modeling approaches, as discussed in
Section 3. This means that, for every process in the clustered DSM, the corresponding modeling approaches (
Section 3) were assigned by the modelers of the UrbMod project, resulting in eight different domains of the DSM. In the final step, they were combined to form the MDDSM, which is shown in
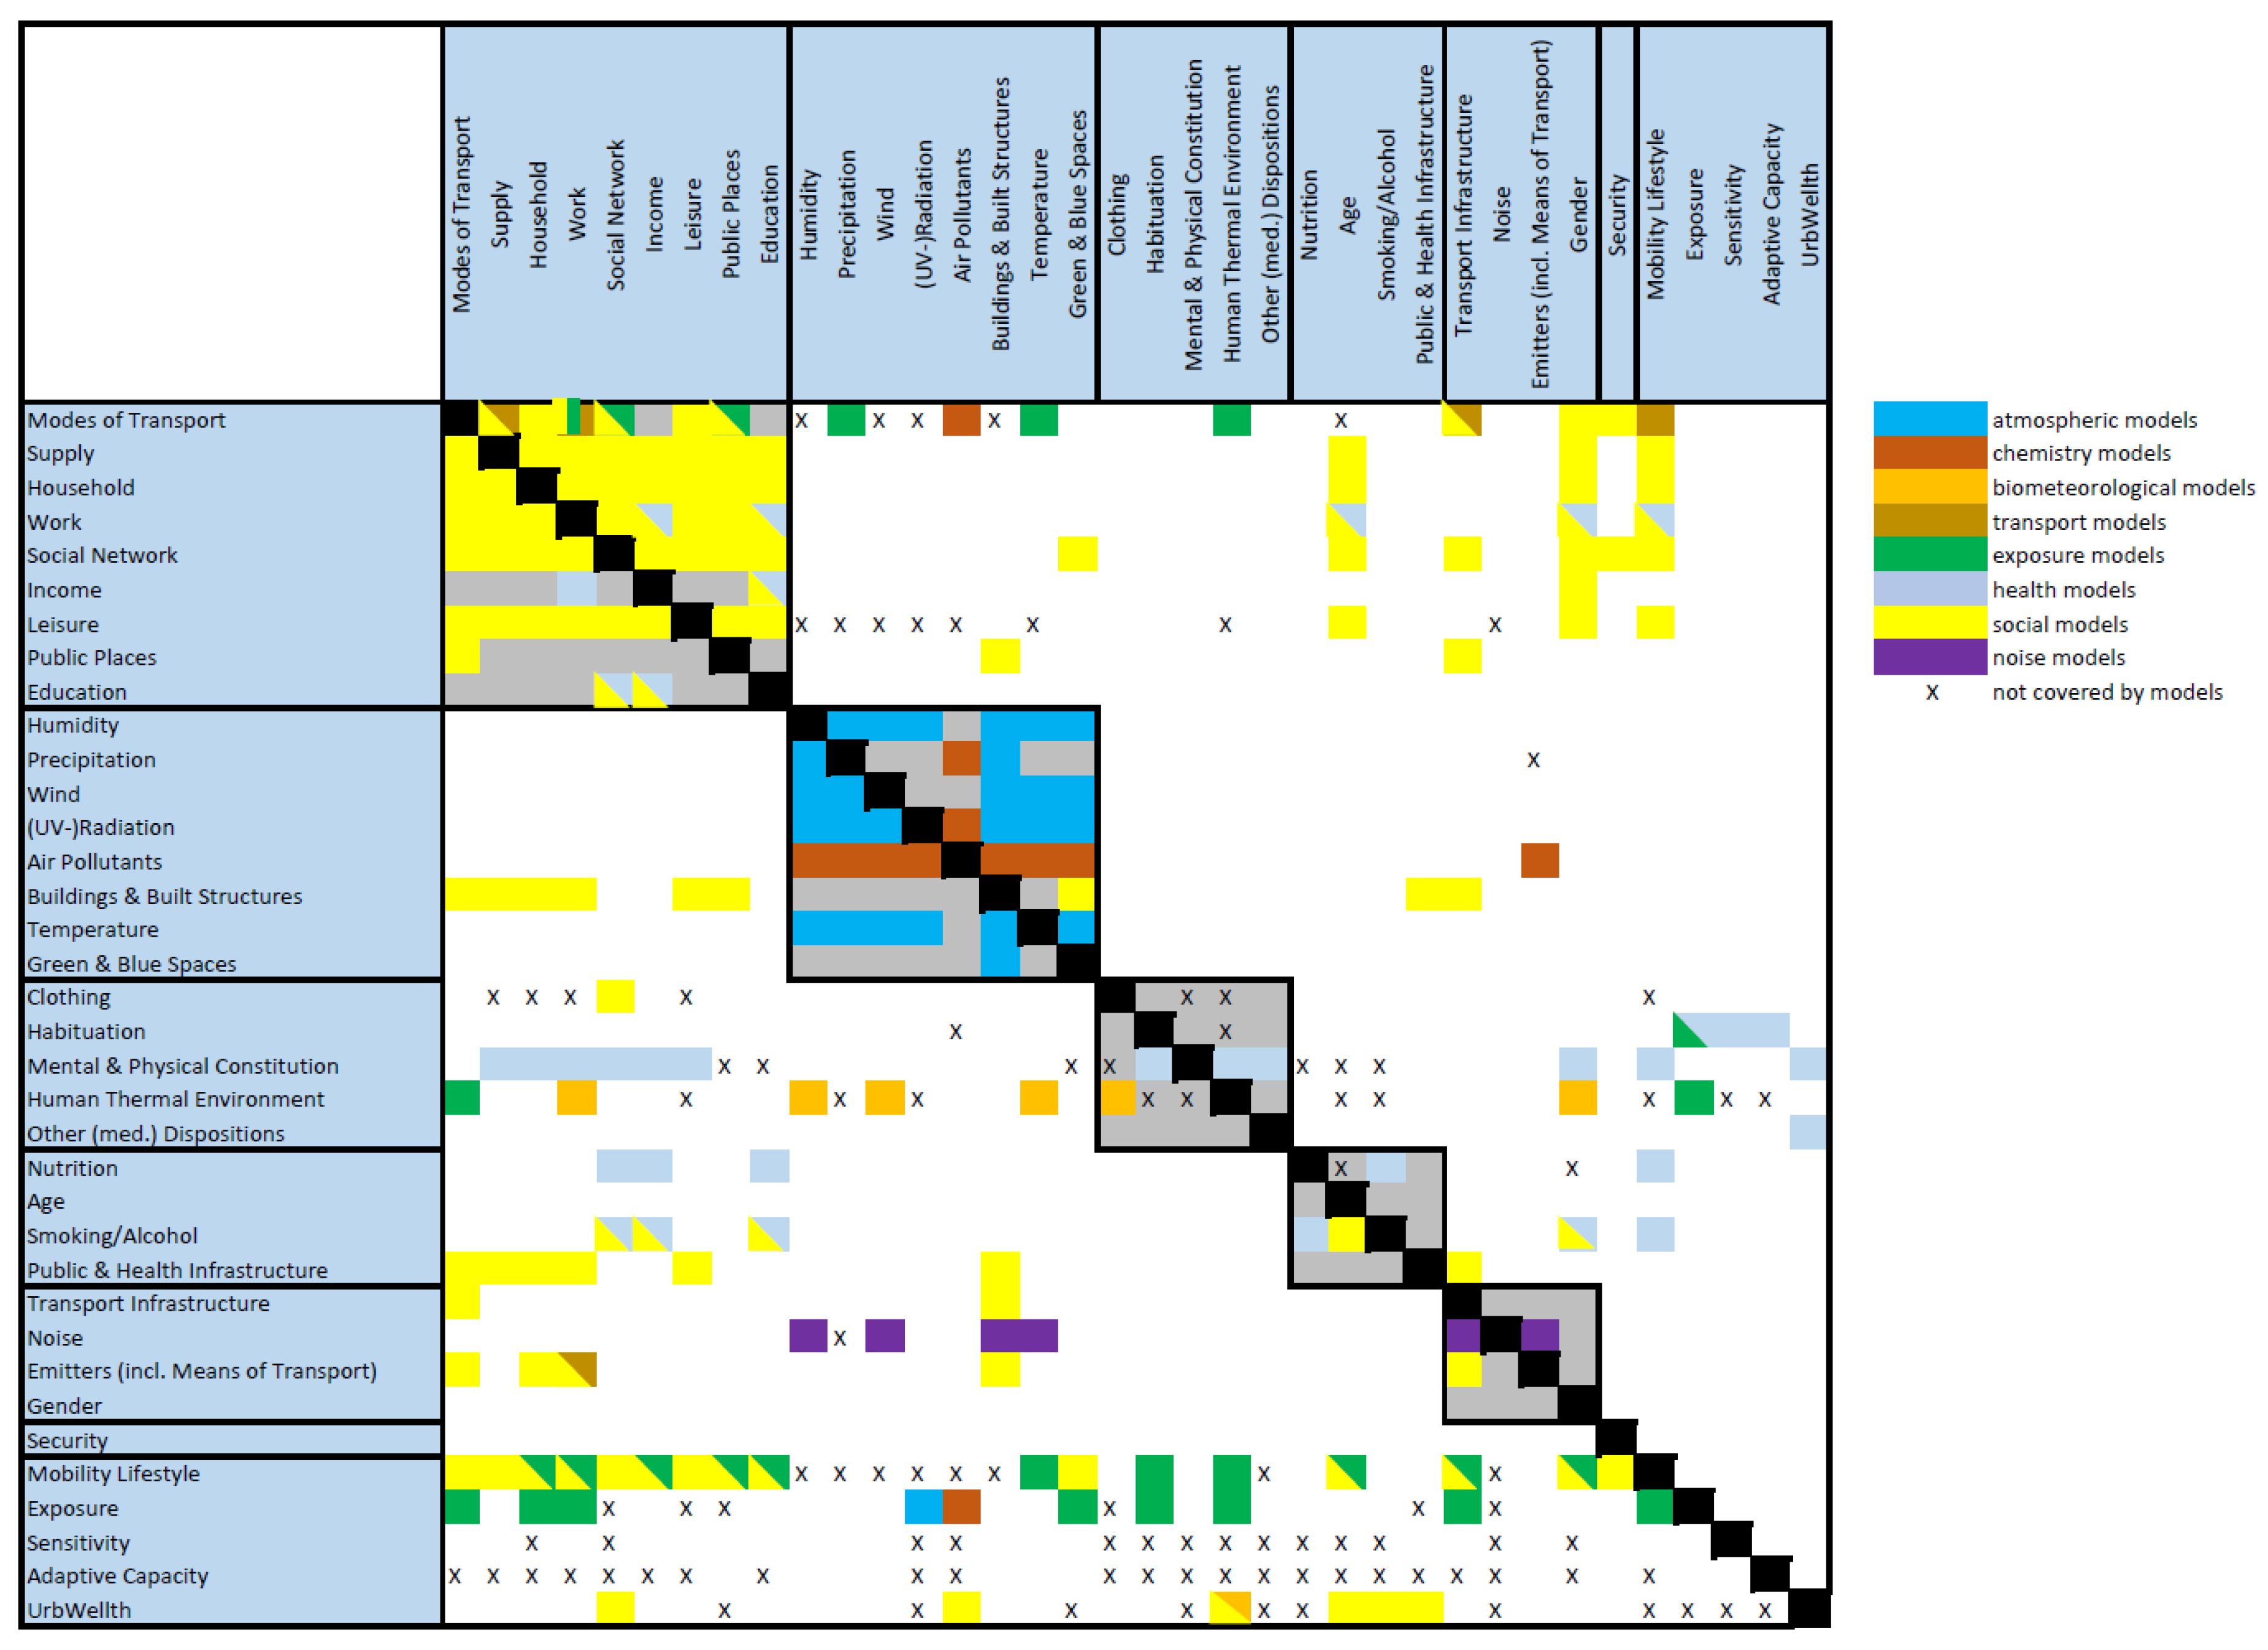
Figure 5. The majority of the processes were covered by the modeling approaches. In total,
n = 217 out of
n = 321 (about 2/3) processes were assigned to one or more models. It is also clear from the MDDSM that there are processes not covered by them, in particular, processes related to the so-called “filter” variables [
4] sensitivity and adaptive capacity, as well as UrbWellth itself. While the relationships in clusters 1 and 2 are all covered by the modeling approaches, that is not the case for cluster 3. Here, the relationships between the variables of the cluster tend not to be captured. Some important interfaces are not covered, such as leisure and its relationship with environmental variables (cluster 2) and clothing and its relationship with social variables (cluster 1). The latter variables are poorly captured by the models in general.
From the coloring in
Figure 5, it can be seen that, according to the expert assessment, the social models (yellow,
n = 121) and health models (light blue,
n = 36) cover the largest number of processes, followed by the exposure models (green,
n = 28) and the atmospheric models (blue,
n = 27). The lowest number of processes are biometeorological models (orange,
n = 7), noise models (violet,
n = 6), and transport models (brown,
n = 3). The largest cluster also has the most models (namely four: social, health, exposure, and transport). However, the social and health models tend to share the same processes. Cluster 2 includes the three modeling approaches: atmospheric, chemistry, and social models. Health and biometeorological models are covering processes in cluster 3, while processes in clusters 3 and 4 are covered by health and social models. Cluster 5 includes the processes from social and noise models. The unclustered processes (lower part of the matrix) are mainly covered by social and exposure models.
The interrelations between the clusters are also important for the integrated model, and this can be easily identified in the MDDSM. For instance, the interrelations between clusters 1 and 2 related to buildings and built structures are covered by social models (yellow), while the interrelations related to modes of transport (first row of the MDDSM) are covered by chemistry (dark brown) and exposure models (green). This suggests that these modeling groups also need to work closely together. However, many processes are not yet covered by the modeling approaches (e.g., related to leisure).
5. Discussion
Applying a clustering algorithm to the UrbWellth-based DSM showed that most variables that are closely related in the conceptual model are objectively grouped into the corresponding clusters (e.g., meteorological variables). However, expert judgement is still needed to make a final decision on the clusters. For instance, human thermal environment is not clustered into the same cluster as the other meteorological variables from the environment sector, but into a cluster with variables from the individual sector. Hence, this variable could have been moved into the cluster corresponding to the environment sector.
The analysis of the clustered DSM gives valuable findings for urban system modeling. The results show that the conceptual model is indeed structured in a logical way. They also show that the DSM approach can be helpful during the earlier stage of constructing the conceptual model. Sectors and variables that are closely related could be identified more efficiently based on the clustering of the DSM.
In addition, identifying variables that act as interfaces between the clusters is beneficial when constructing an integrated model, because these variables work as interfaces between the main model components, i.e., the clusters. This suggests that each model component should be designed in a way that interactions with the other components are realized by exchanging values of the interface variables. Since the goal of the present research effort was to integrate different existing models instead of building a new model from scratch, the clustered DSM does not yet give an answer to questions of interfaces between the different models; rather, it structures the model systematically. By extending the DSM towards an MDDSM, the interfaces become more evident.
The MDDSM was constructed based on the clustered DSM and expert knowledge about the processes covered by different modeling approaches. There are two major outcomes from the MDDSM. Firstly, it enables the identification of modeling groups that should work closely together because the processes tackled by their models are strongly interrelated. For example, environmental stressors (i.e., heat stress and air pollution) and atmospheric processes within urban areas are combined in cluster 2. The clustering suggests that it would be beneficial to create a component for the integrated model that includes atmospheric models, chemistry transport models, and, to some extent, social models. The first two models are commonly coupled with urban air quality modeling. Secondly, interfaces between the modeling approaches were identified using the MDDSM. The interface variables that were identified by clustering the DSM are relevant for components of the final integrated model. With the MDDSM, the interfaces between the modeling approaches can be identified: first, by identifying at the processes that are covered by two or more modeling approaches, indicated by multiple colored cells in the matrix; second, by listing the modeling approaches for every variable of the conceptual model. For example, buildings and built structures is a variable that acts as an important interface between cluster 1 (mostly social variables) and cluster 2 (mostly environmental variables). Processes that affect this variable are covered by social models, while it impacts the processes covered by atmospheric and chemistry models. Consequently, this variable would need to be defined as an interface (output of social models, input for atmospheric and chemistry models) between these three modeling approaches.
The DSM—as well as the MDDSM—approach does not account for the importance of a particular process for the entire integrated model. Consequently, the clustering does not account for the importance of the interrelations. For instance, the relationship between age and nutrition might be as important as the relationship between age and variables from cluster 1 (e.g., work and household), but age is not included in cluster 1. While this seems to be a minor problem in the present case because the clustering results are logical overall, there is still room for optimizing the clustering.
6. Conclusions
The present study applied the concept of the Design Structure Matrix (DSM) and Multi-Domain Structure Matrix (MDDSM) to a conceptual model of health-related urban well-being (UrbWellth), with the aim of determining interfaces via joint variables to support integrated modeling of UrbWellth. The study has shown that DSM as well as MDDSM are valuable approaches to be used in urban system modeling, where a wide range of disciplinary knowledge as well as sectoral models need to be integrated.
The DSM concept enables the application of objective classification algorithms to variables and processes within complex systems. The cluster algorithm employed in this study confirmed that the conceptual model of UrbWellth was already structured in a logical way. Hence, the conceptual model is an optimal starting point for the integrated modeling exercise. In addition, the clustered DSM could be a starting point for qualitative modeling (e.g., system dynamics modeling) and the syndrome approach [
66]. The clustering also revealed the interface variables between the proposed components of the integrated model (i.e., clusters).
The MDDSM approach, which is an extension of the DSM approach, using expert knowledge from modelers within the UrbMod project, yielded important findings for the development of an integrated model. Processes for which different modeling approaches need to be coordinated were identified. In addition, processes that are not covered by the available modeling approaches can also be easily identified. With respect to the conceptual model, processes related to important variables (e.g., UrbWellth, exposure, sensitivity, and vulnerability) as well as some processes related to interface variables are not yet covered. This suggests that either additional modeling approaches need to be added to the integrated model or that these processes need to be included in the existing modeling approaches.
Neither the DSM nor the MDDSM approach accounts for the relevance of the processes related to UrbWellth as well as for the integrated model. This information could be added in future studies by using a numeric DSM (i.e., applying different weights to the processes according to their importance). In doing so, the arrangement of the processes can be further optimized.

 ,
, 


