
Risk Stratification to Guide Prevention and Control Strategies for Arboviruses Transmitted by Aedes aegypti

 , , and
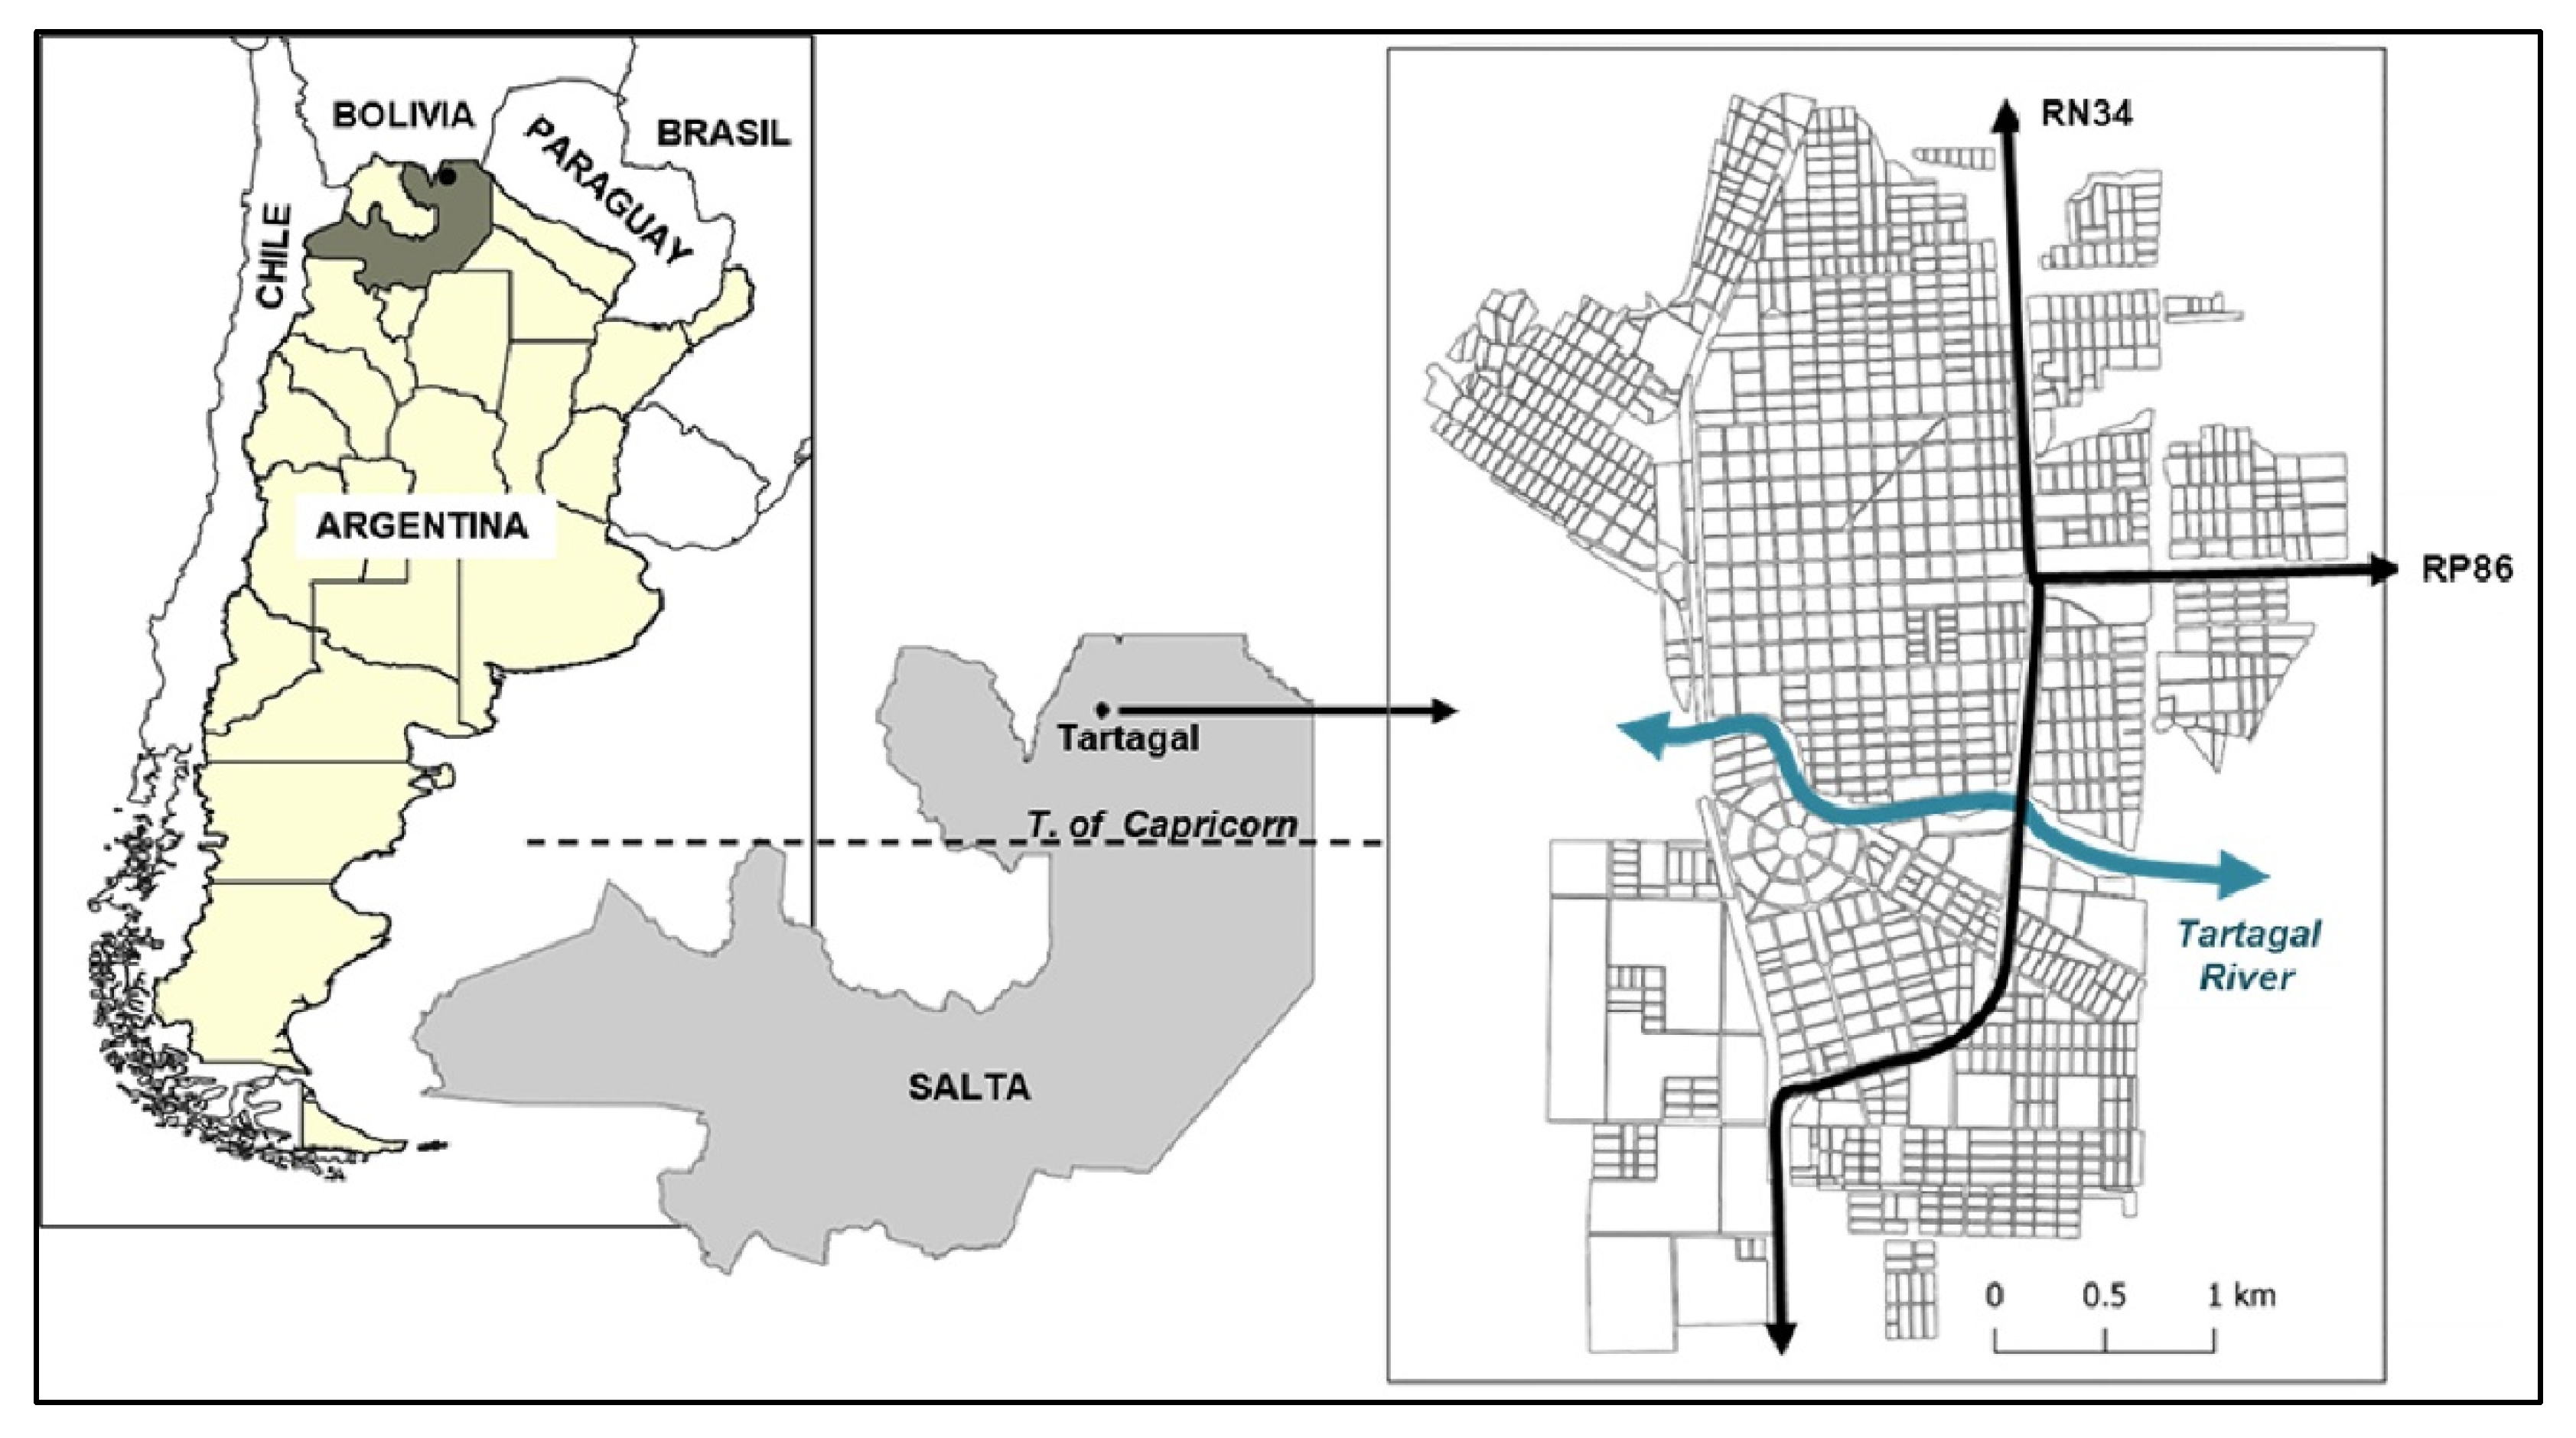
Abstract
:1. Introduction
2. Materials and Methods
2.1. Study Area
2.2. Dengue Cases
2.3. Data Analysis
3. Results
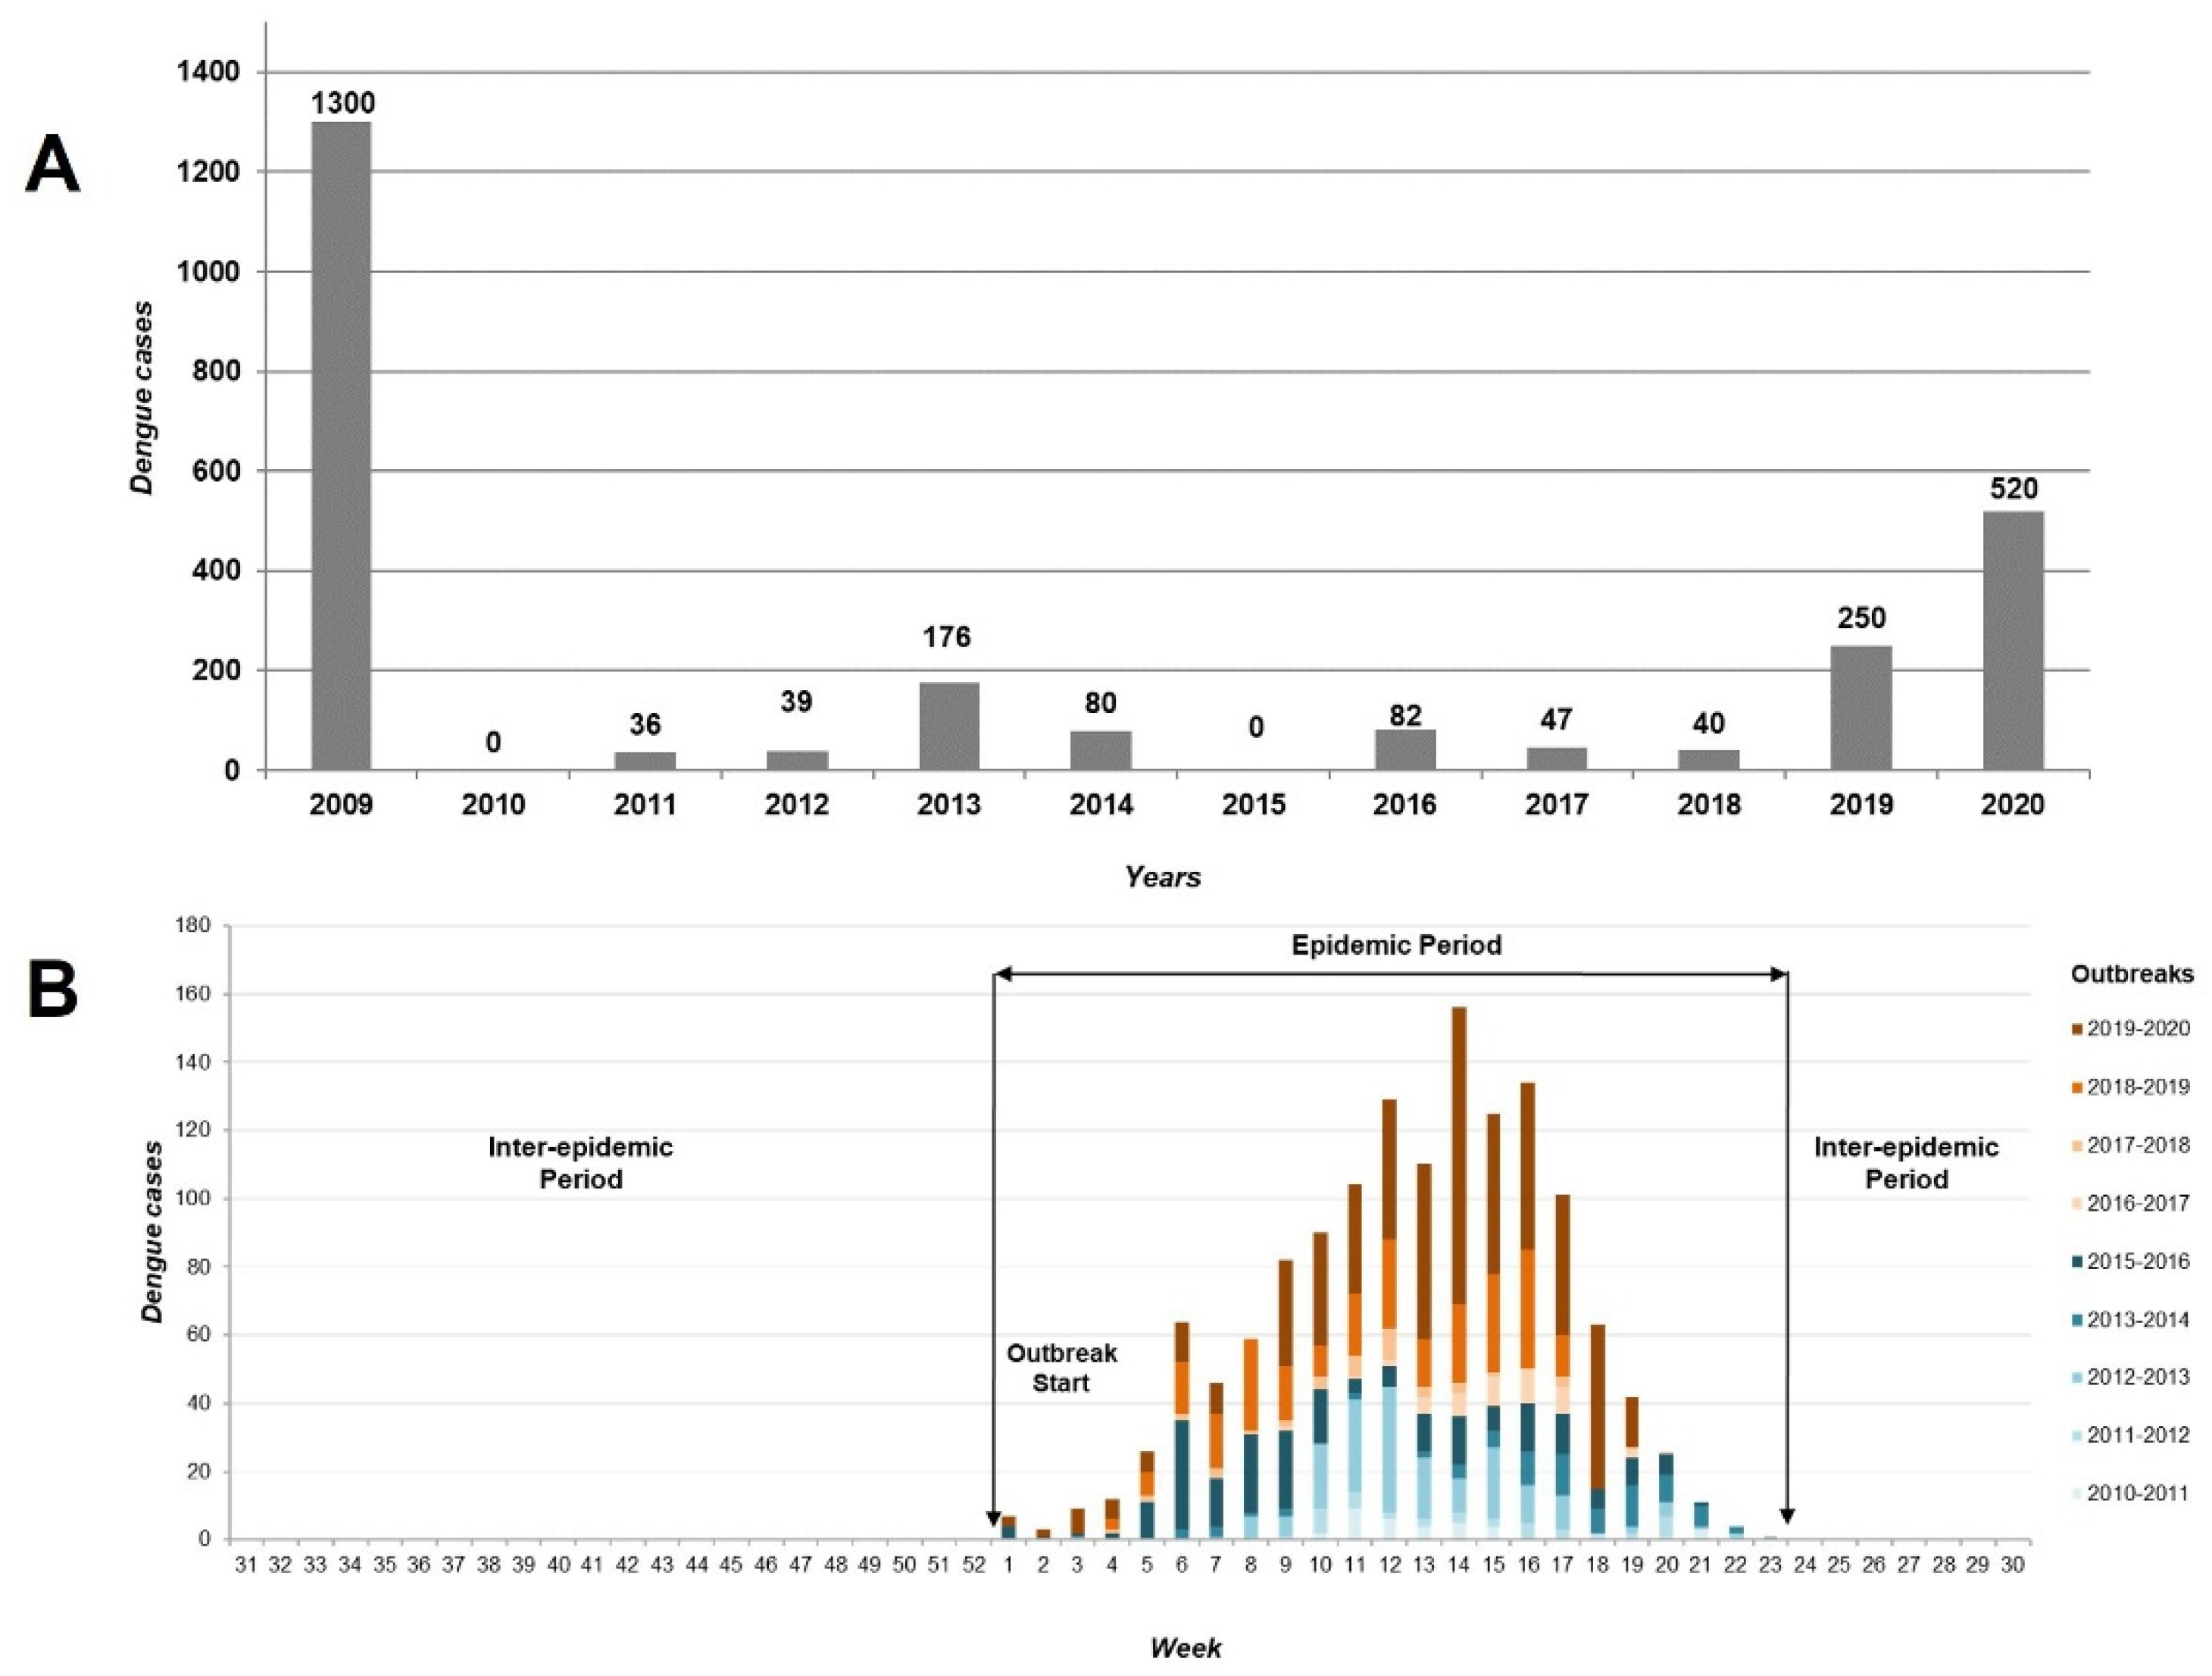
3.1. Temporal Patterns: Epidemic Period
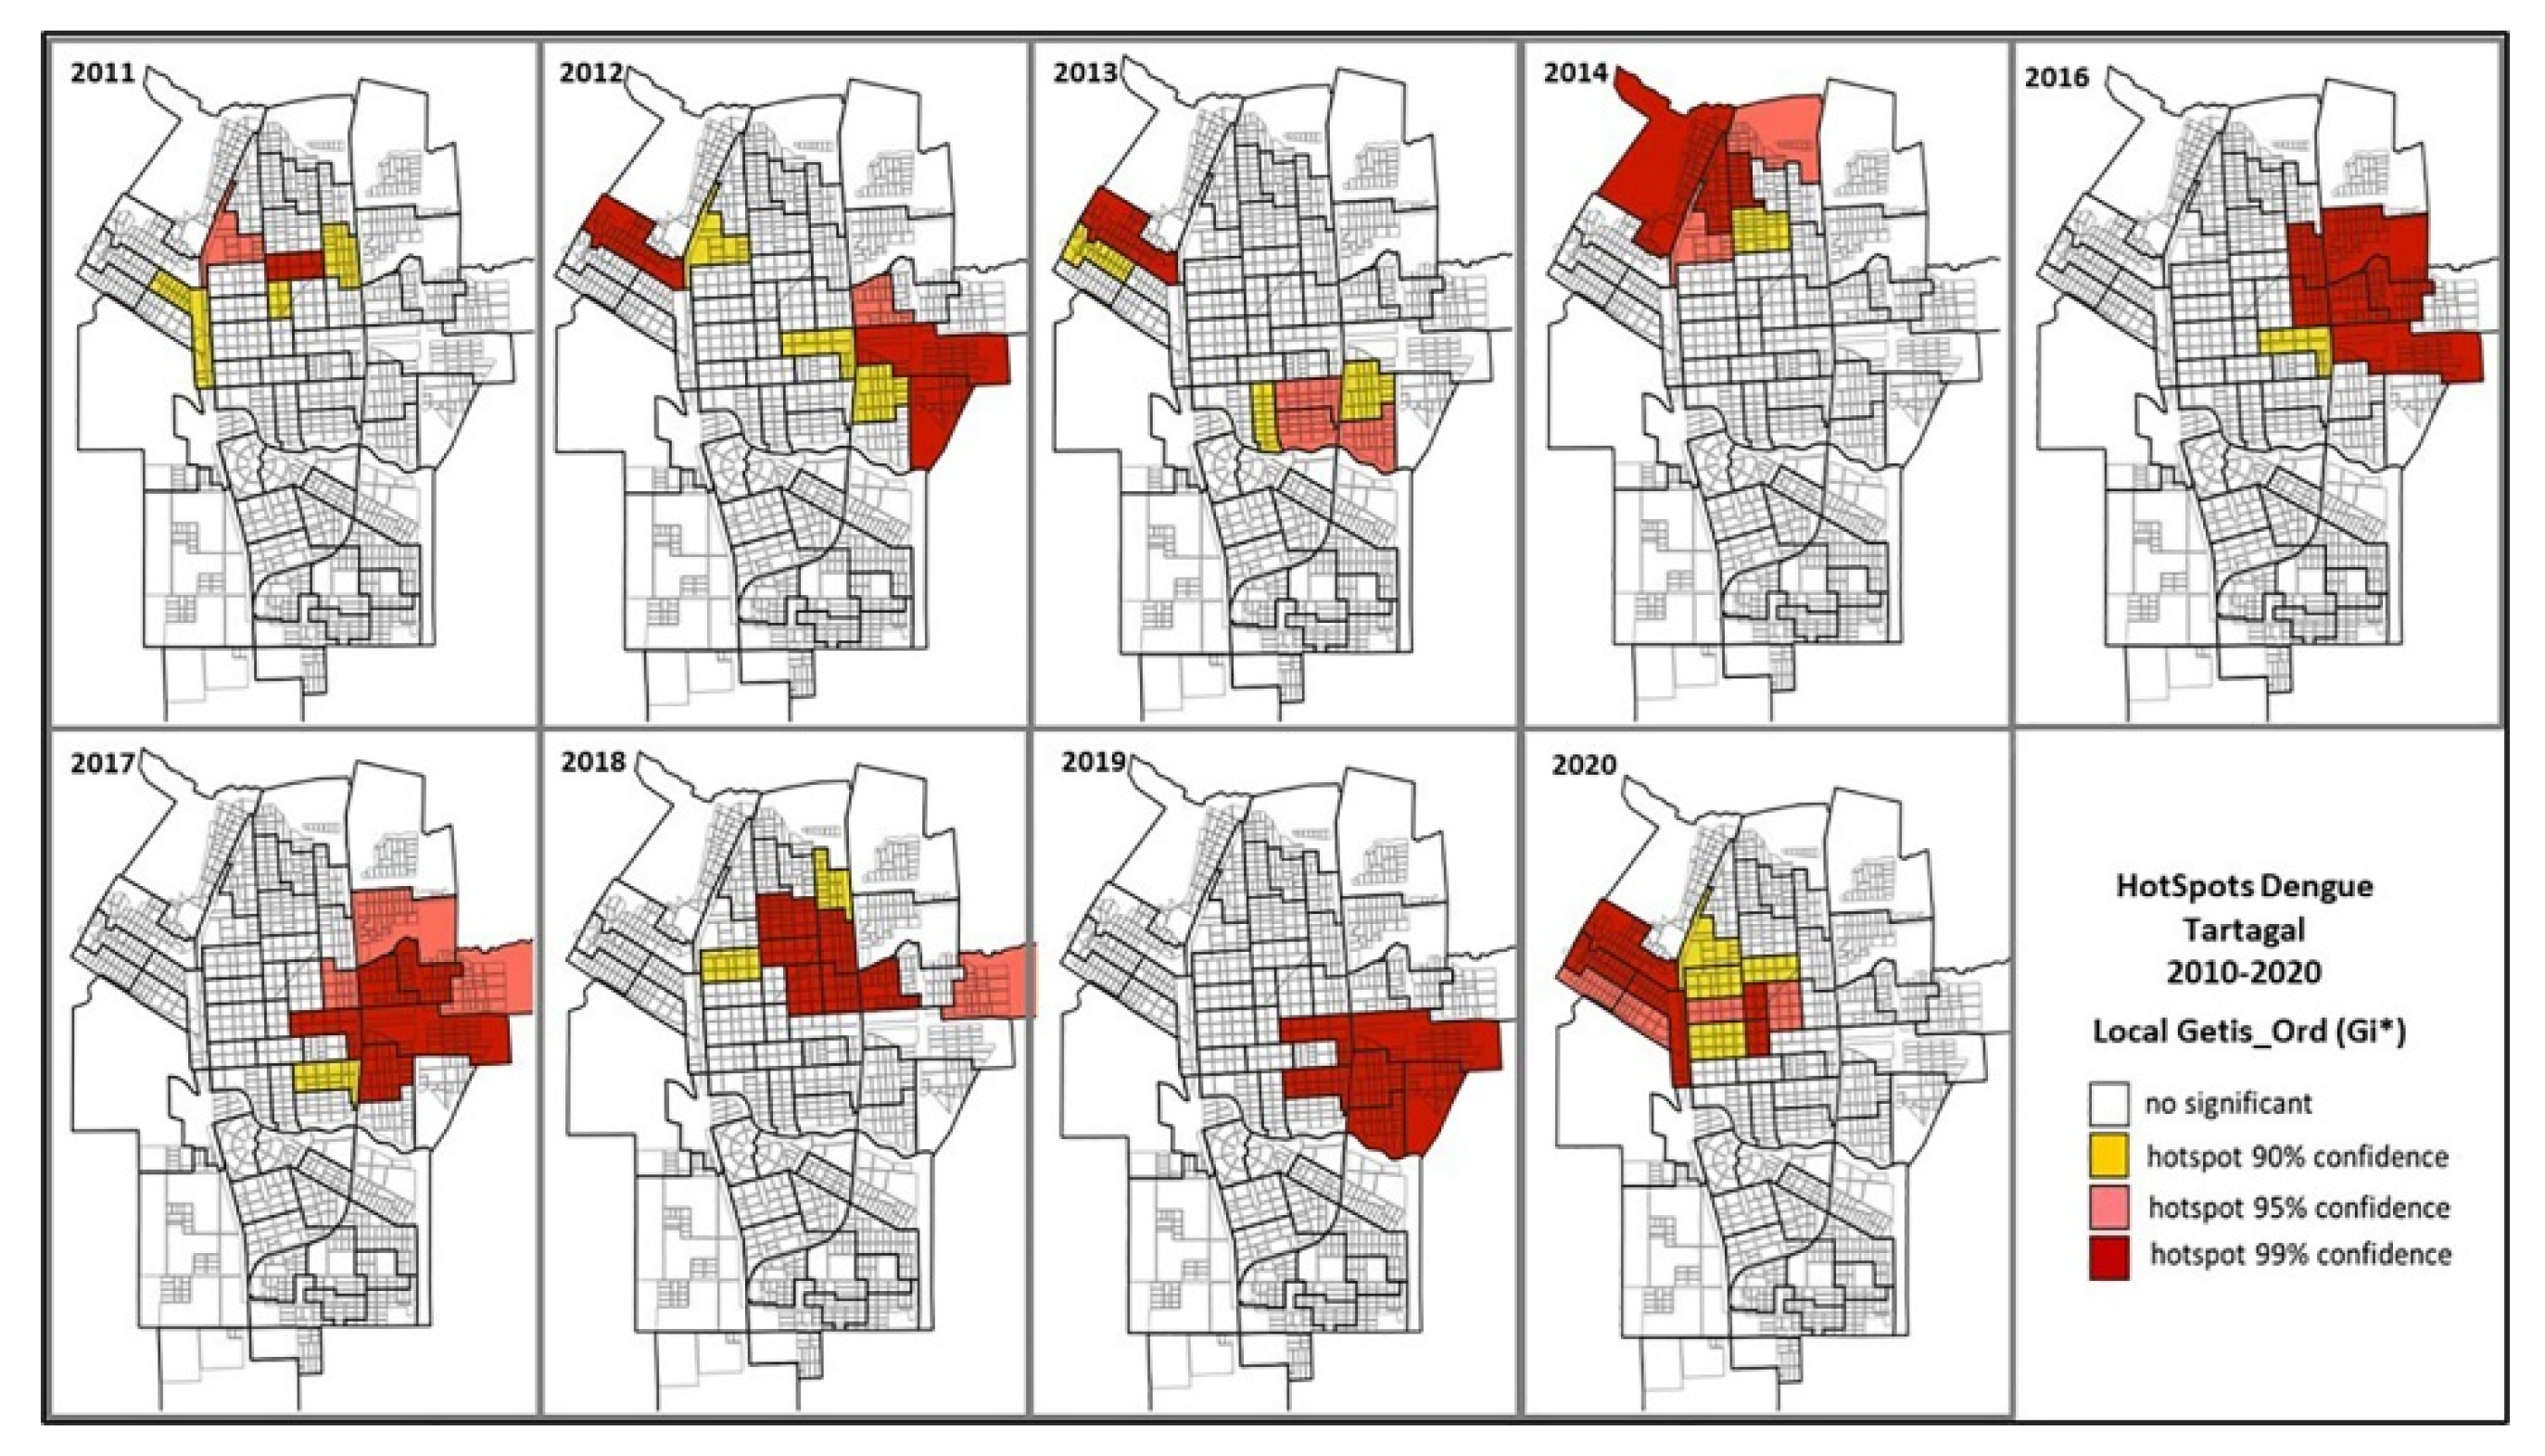
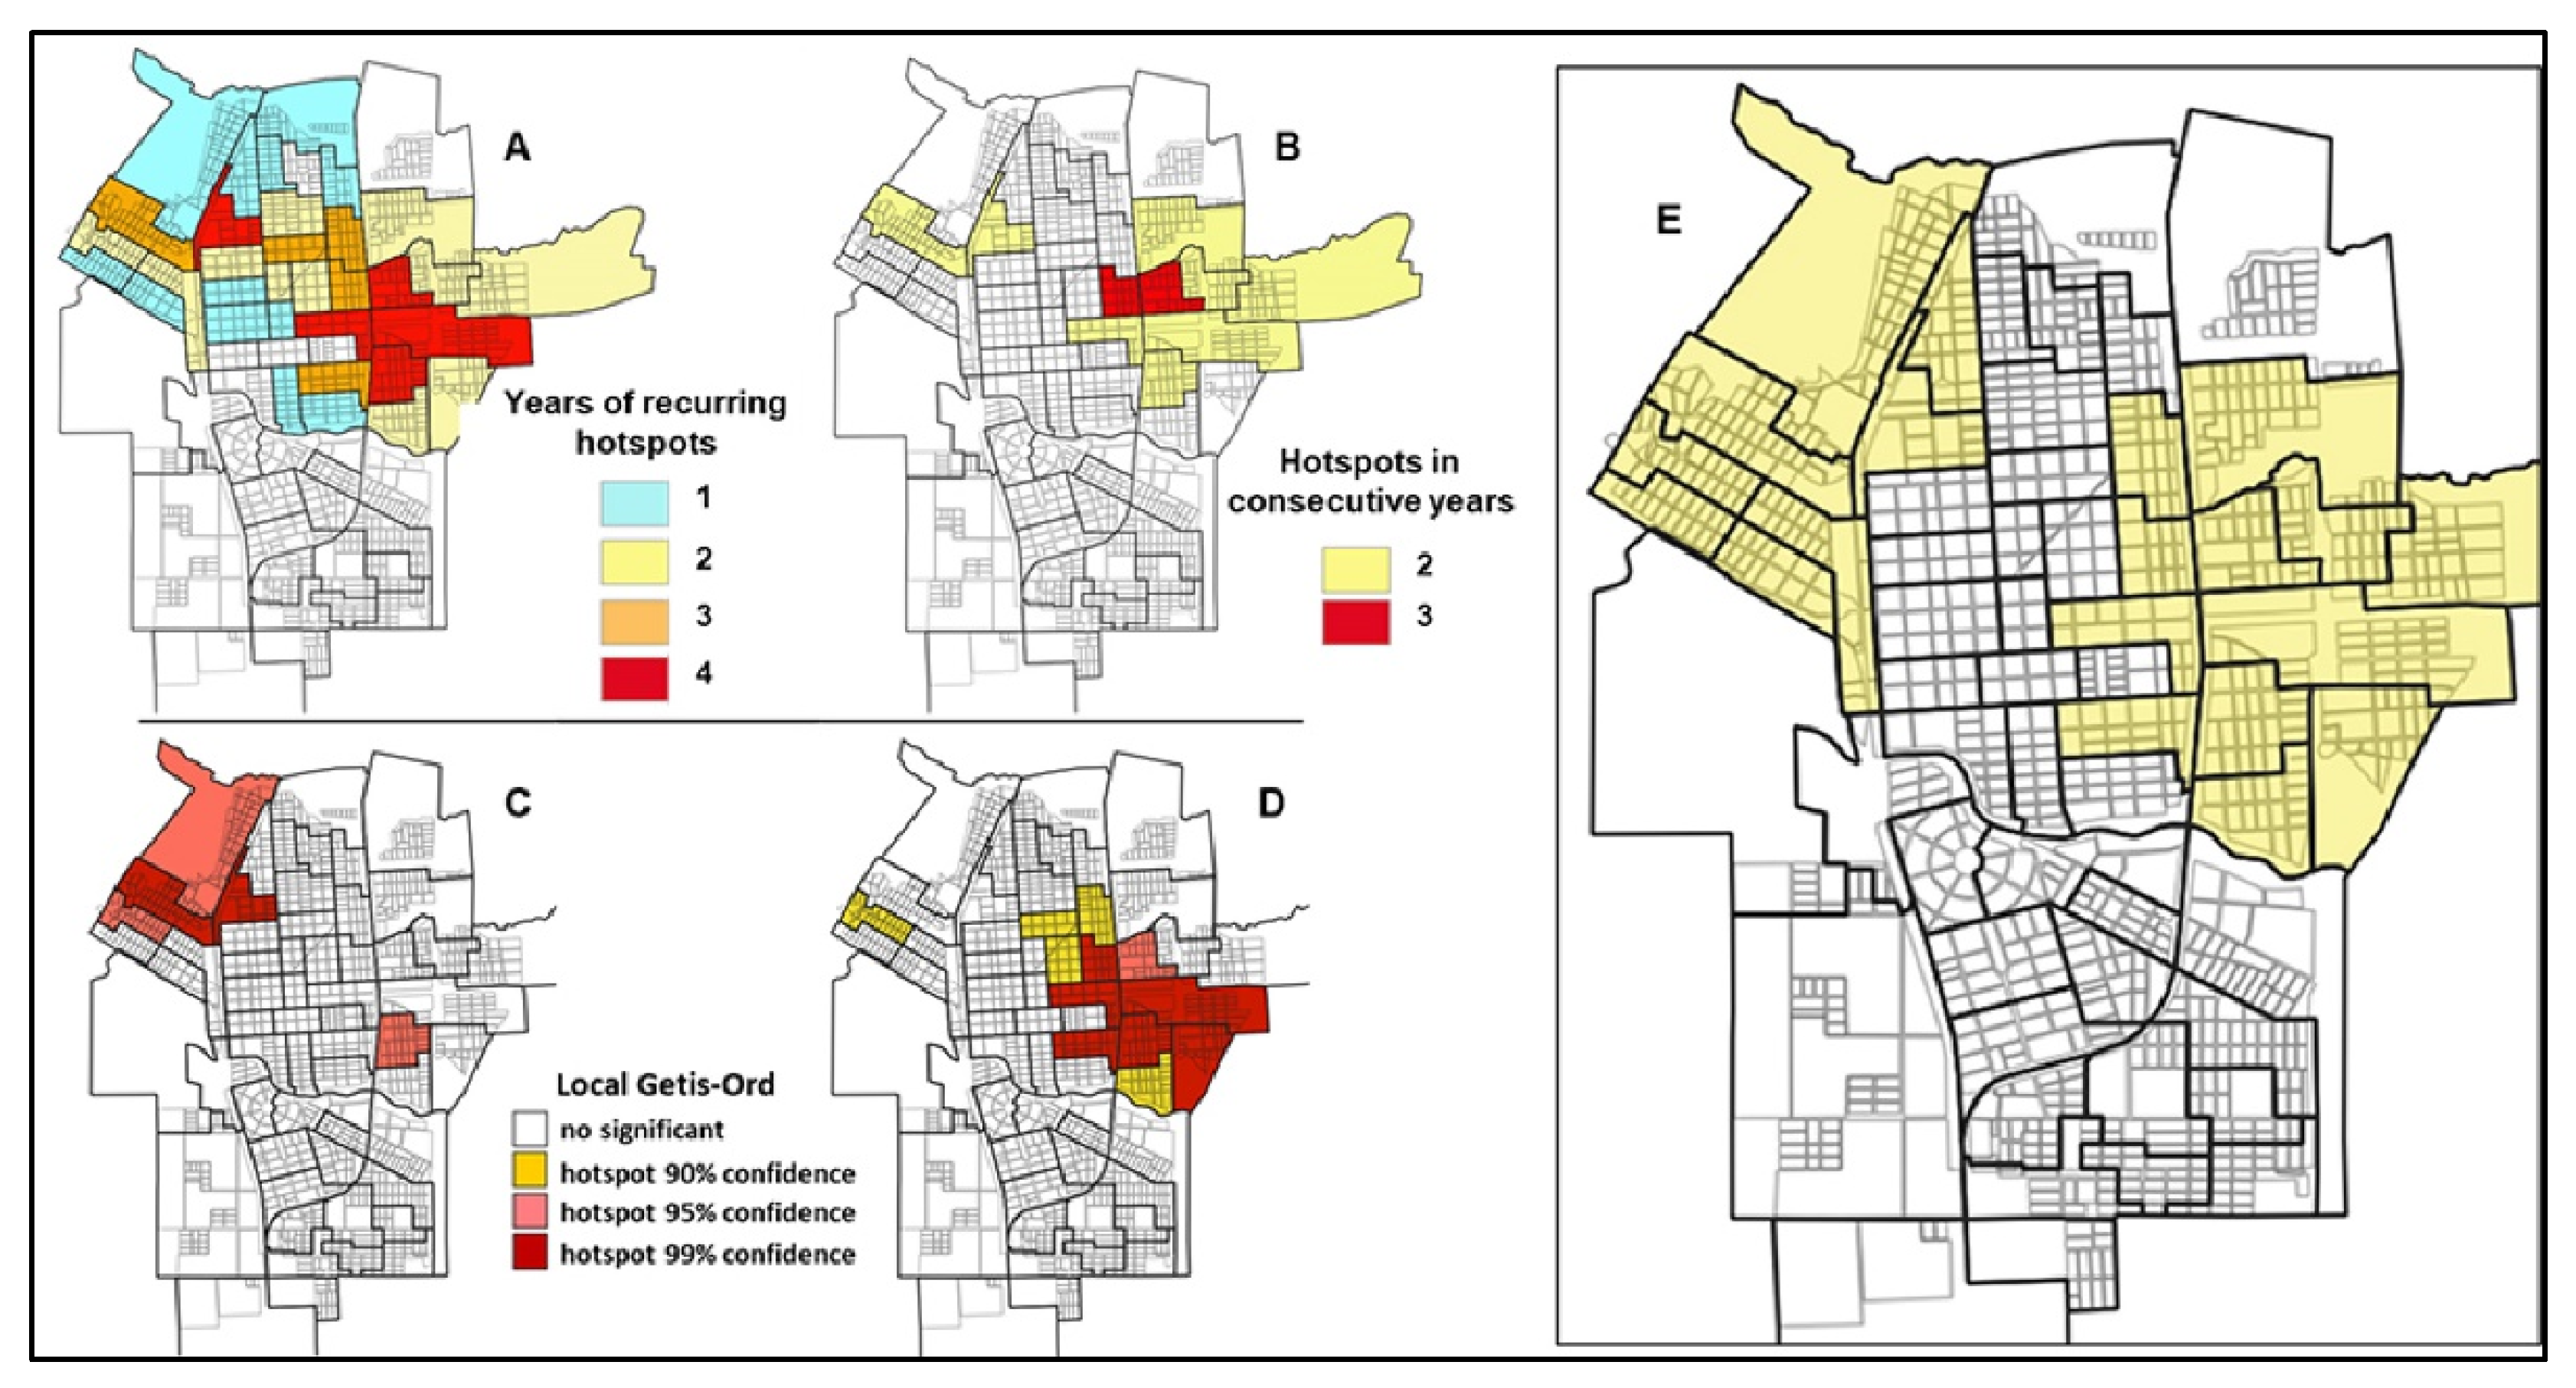
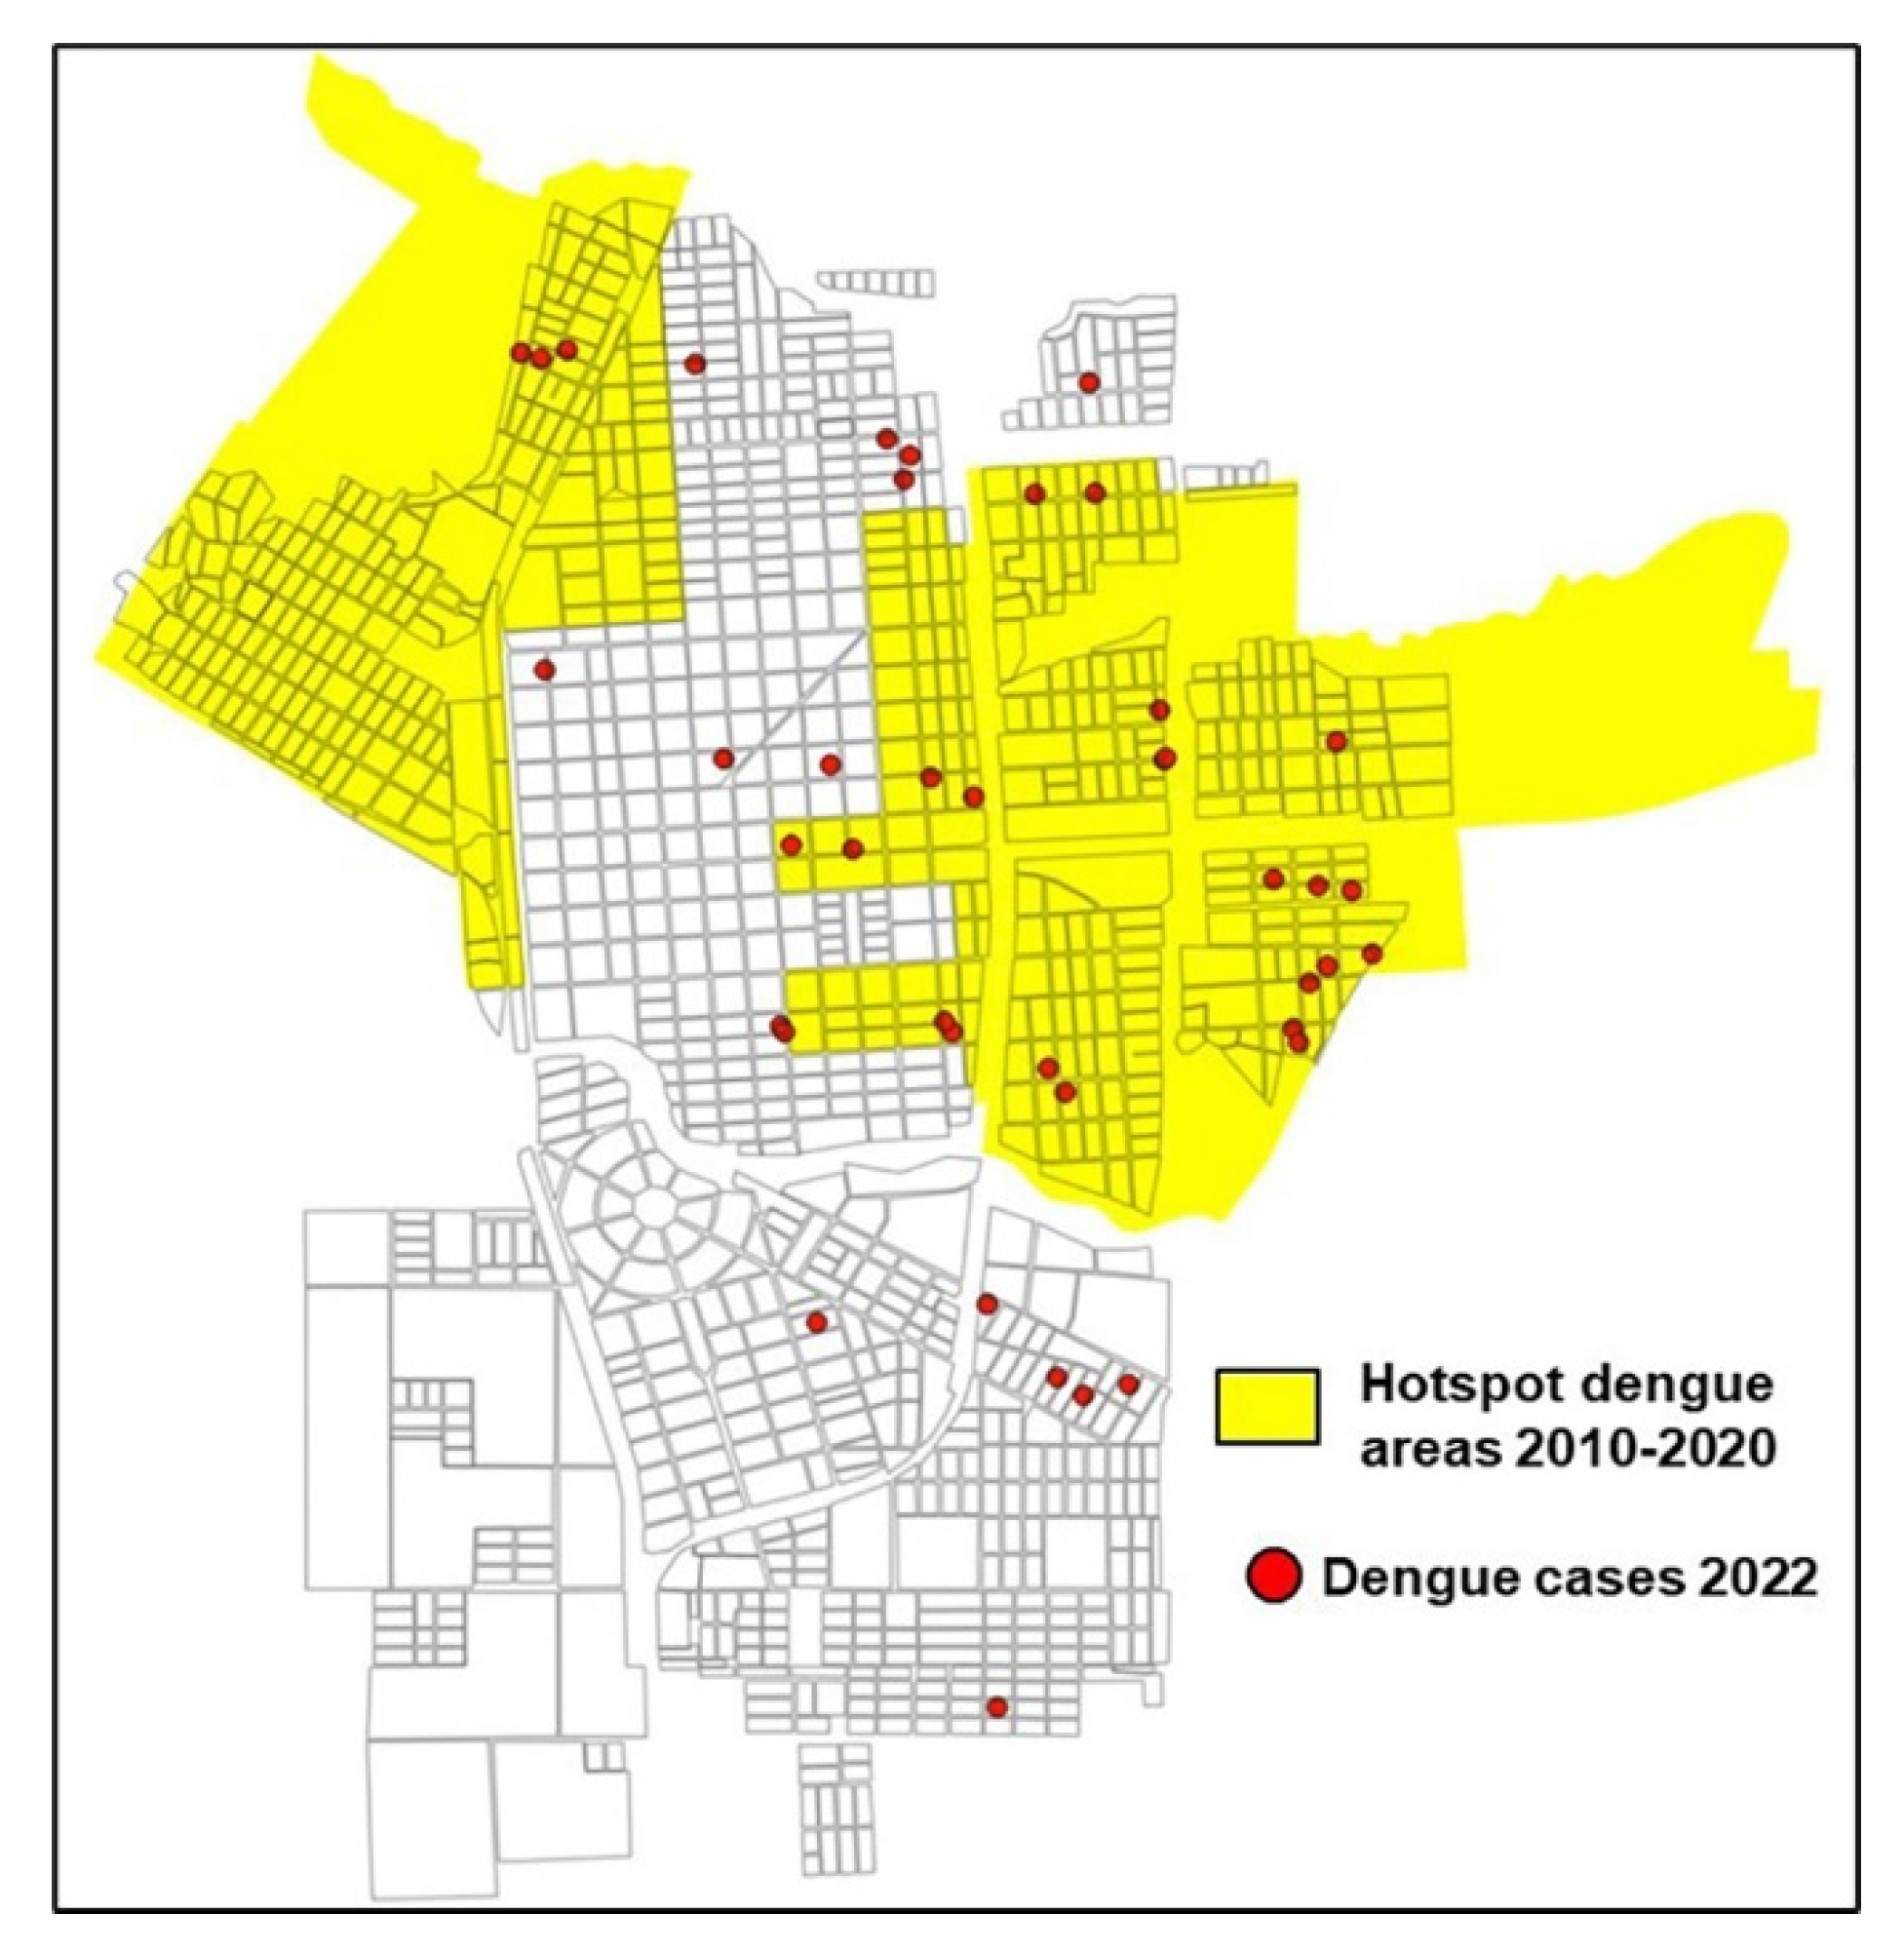
3.2. Spatial Patterns: Hotspot Areas
4. Discussion
5. Conclusions
Supplementary Materials
Author Contributions
Funding
Institutional Review Board Statement
Informed Consent Statement
Data Availability Statement
Acknowledgments
Conflicts of Interest
References
- Pan American Health Organization. Dengue. Available online: https://www.paho.org/es/temas/dengue (accessed on 17 May 2023).
- Pan American Health Organization. Métodos de Vigilancia Entomológica y Control de los Principales Vectores en las Américas; PAHO: Washington, DC, USA, 2021. [Google Scholar] [CrossRef]
- Pan American Health Organization. Technical Document for the Implementation of Interventions Based on Generic Operational Scenarios for Aedes Aegypti Control; PAHO: Washington, DC, USA, 2019; Available online: https://iris.paho.org/bitstream/handle/10665.2/51652/9789275121108_eng.pdf?sequence=5&isAllowed=y (accessed on 17 May 2023).
- Gómez-Dantés, H.; Martín, J.L.S.; Danis-Lozano, R.; Manrique-Saide, P. La estrategia para la prevención y el control integrado del dengue en Mesoamérica. Salud Pública Méx 2011, 53 (Suppl. S3), s349–s357. [Google Scholar] [PubMed]
- Bowman, L.R.; Donegan, S.; McCall, P.J. Is Dengue Vector Control Deficient in Effectiveness or Evidence?: Systematic Review and Meta-analysis. PLoS Negl. Trop. Dis. 2016, 10, e0004551. [Google Scholar] [CrossRef] [PubMed] [Green Version]
- Horstick, O.; Morrison, A.C. Dengue Disease Surveillance: Improving Data for Dengue Control. PLoS Negl. Trop. Dis. 2014, 8, e3311. [Google Scholar] [CrossRef] [PubMed] [Green Version]
- Kolimenakis, A.; Heinz, S.; Wilson, M.L.; Winkler, V.; Yakob, L.; Michaelakis, A.; Papachristos, D.; Richardson, C.; Horstick, O. The role of urbanisation in the spread of Aedes mosquitoes and the diseases they transmit—A systematic review. PLoS Negl. Trop. Dis. 2021, 15, e0009631. [Google Scholar] [CrossRef] [PubMed]
- Soto, S.M. Human migration and infectious diseases. Clin. Microbiol. Infect. 2009, 15, 26–28. [Google Scholar] [CrossRef] [PubMed] [Green Version]
- Espinosa, M.; Weinberg, D.; Rotela, C.H.; Polop, F.; Abril, M.; Scavuzzo, C.M. Temporal Dynamics and Spatial Patterns of Aedes aegypti Breeding Sites, in the Context of a Dengue Control Program in Tartagal (Salta Province, Argentina). PLoS Negl. Trop. Dis. 2016, 10, e0004621. [Google Scholar] [CrossRef] [PubMed] [Green Version]
- Bisanzio, D.; Dzul-Manzanilla, F.; Gomez-Dantes, H.; Pavia-Ruz, N.; Hladish, T.J.; Lenhart, A.; Palacio-Vargas, J.; Roldan, J.F.G.; Morales, F.C.; Sanchez-Tejeda, G.; et al. Spatio-temporal coherence of dengue, chikungunya and Zika outbreaks in Merida, Mexico. PLoS Negl. Trop. Dis. 2018, 12, e0006298. [Google Scholar] [CrossRef] [PubMed]
- Dzul-Manzanilla, F.; Correa-Morales, F.; Che-Mendoza, A.; Palacio-Vargas, J.; Sánchez-Tejeda, G.; González-Roldan, J.F.; López-Gatell, H.; Flores-Suárez, A.E.; Gómez-Dantes, H.; Coelho, G.E.; et al. Identifying urban hotspots of dengue, chikungunya, and Zika transmission in Mexico to support risk stratification efforts: A spatial analysis. Lancet Planet. Health 2021, 5, e277–e285. [Google Scholar] [CrossRef] [PubMed]
- Instituto Nacional de Estadística y Censos (INDEC). Resultados Correspondientes al Censo Nacional de Población, Hogares y Viviendas. 2010. Available online: https://www.indec.gob.ar/indec/web/Nivel4-Tema-2-41-135 (accessed on 19 May 2023).
- Instituto Nacional de Estadística y Censos. Unidades Geoestadísticas. Cartografía y Códigos Geográficos del Sistema Estadístico Nacional. Available online: https://www.indec.gob.ar/indec/web/Institucional-Indec-Codgeo (accessed on 19 May 2023).
- Servicio Meteorológico Nacional. Available online: https://www.smn.gob.ar/ (accessed on 20 May 2023).
- Ministerio de Salud de la Nación. Dengue, Algoritmo de Diagnóstico y Notificación. Available online: https://bancos.salud.gob.ar/recurso/dengue-algoritmo-de-diagnostico-y-notificacion (accessed on 23 May 2023).
- QGIS Development Team. QGIS GeographicInformation System; Open SourceGeospatialFoundation Project; Copyright (C) 1989, 1991 Free Software Foundation, Inc. 59 Temple Place—Suite 330, Boston, MA 02111-1307, USA. Available online: http://qgis.osgeo.org (accessed on 23 May 2023).
- Ord, J.K.; Getis, A. Local Spatial Autocorrelation Statistics: Distributional Issues and an Application. Geogr. Anal. 2010, 27, 286–306. [Google Scholar] [CrossRef]
- QGIS Python Plugins Repository. Hotspot Analysis. Available online: https://plugins.qgis.org/plugins/HotspotAnalysis/ (accessed on 23 May 2023).
- RStudio Team. RStudio: Integrated Development for R. RStudio; PBC: Boston, MA, USA, 2022; Available online: http://www.rstudio.com/ (accessed on 23 May 2023).
- Olliaro, P.; Fouque, F.; Kroeger, A.; Bowman, L.; Velayudhan, R.; Santelli, A.C.; Garcia, D.; Ramm, R.S.; Sulaiman, L.H.; Tejeda, G.S.; et al. Improved tools and strategies for the prevention and control of arboviral diseases: A research-to-policy forum. PLoS Negl. Trop. Dis. 2018, 12, e0005967. [Google Scholar] [CrossRef] [PubMed]
- Paiva Júnior, E.F.D.; Vaz, T.D.S.; Rosa, M.; Garcia, I.L.B.E. Estratificação automática de áreas prioritárias para controle da dengue utilizando o Model Builder do QGIS em uma análise multicritério. Epidemiol. Serviços Saúde 2020, 29, e2019028. [Google Scholar]
- Schaber, K.L.; Perkins, T.A.; Lloyd, A.L.; Waller, L.A.; Kitron, U.; Paz-Soldan, V.A.; Elder, J.P.; Rothman, A.L.; Civitello, D.J.; Elson, W.H.; et al. Disease-driven reduction in human mobility influences human-mosquito contacts and dengue transmission dynamics. PLoS Comput. Biol. 2021, 17, e1008627. [Google Scholar] [CrossRef] [PubMed]
- Instituto Nacional de Estadística y Censos (INDEC). Resultados Correspondientes al Pre-Censo Nacional de Viviendas. 2020. Available online: https://precensodeviviendas.indec.gob.ar/ (accessed on 19 May 2023).
- Opertti, E.R. Plan Estratégico de Desarrollo Local del Municipio de Tartagal; Gobierno de la Ciudad de Salta, Salta, Argentina, 2014. Available online: http://biblioteca.cfi.org.ar/documento/plan-estrategico-de-desarrollo-local-del-municipio-de-tartagal-provincia-de-salta-2/ (accessed on 23 May 2023).
- Bosch, Q.A.T.; Clapham, H.E.; Lambrechts, L.; Duong, V.; Buchy, P.; Althouse, B.M.; Lloyd, A.; Waller, L.A.; Morrison, A.C.; Kitron, U.; et al. Contributions from the silent majority dominate dengue virus transmission. PLoS Pathog. 2018, 14, e1006965. [Google Scholar] [CrossRef] [Green Version]
- Carbajo, A.E. Distribución Espacio-Temporal de Aedes Aegypti [Diptera: Culicidae]: Su Relación con el Ambiente Urbano y el Riesgo de Transmisión del Virus Dengue en la Ciudad de Buenos Aires; Facultad de Ciencias Exactas y Naturales, Universidad de Buenos Aires: Buenos Aires, Argentina, 2003; Available online: http://digital.bl.fcen.uba.ar/Download/Tesis/Tesis_3605_Carbajo.pdf (accessed on 23 May 2023).
- López, M.S.; Gómez, A.A.; Müller, G.V.; Walker, E.; Robert, M.A.; Estallo, E.L. Relationship between Climate Variables and Dengue Incidence in Argentina. Environ. Health Perspect. 2023, 131, 57008. [Google Scholar] [CrossRef] [PubMed]
- Paz-Soldan, V.A.; Reiner, R.C., Jr.; Morrison, A.C.; Stoddard, S.T.; Kitron, U.; Scott, T.W.; Elder, J.P.; Halsey, E.S.; Kochel, T.J.; Astete, H.; et al. Strengths and Weaknesses of Global Positioning System [GPS] Data-Loggers and Semi-structured Interviews for Capturing Fine-scale Human Mobility: Findings from Iquitos, Peru. PLoS Negl. Trop. Dis. 2014, 8, e2888. [Google Scholar] [CrossRef] [PubMed] [Green Version]
- Vazquez-Prokopec, G.M.; Montgomery, B.L.; Horne, P.; Clennon, J.A.; Ritchie, S.A. Combining contact tracing with targeted indoor residual spraying significantly reduces dengue transmission. Sci. Adv. 2017, 3, e1602024. [Google Scholar] [CrossRef] [PubMed] [Green Version]
- Chastel, C. Eventual Role of Asymptomatic Cases of Dengue for the Introduction and Spread of Dengue Viruses in Non-Endemic Regions. Front. Phys. 2012, 3, 70. [Google Scholar] [CrossRef] [PubMed] [Green Version]


Disclaimer/Publisher’s Note: The statements, opinions and data contained in all publications are solely those of the individual author(s) and contributor(s) and not of MDPI and/or the editor(s). MDPI and/or the editor(s) disclaim responsibility for any injury to people or property resulting from any ideas, methods, instructions or products referred to in the content. |
© 2023 by the authors. Licensee MDPI, Basel, Switzerland. This article is an open access article distributed under the terms and conditions of the Creative Commons Attribution (CC BY) license (https://creativecommons.org/licenses/by/4.0/).
Share and Cite
Espinosa, M.O.; Andreo, V.; Paredes, G.; Leaplaza, C.; Heredia, V.; Periago, M.V.; Abril, M. Risk Stratification to Guide Prevention and Control Strategies for Arboviruses Transmitted by Aedes aegypti. Trop. Med. Infect. Dis. 2023, 8, 362. https://doi.org/10.3390/tropicalmed8070362
Espinosa MO, Andreo V, Paredes G, Leaplaza C, Heredia V, Periago MV, Abril M. Risk Stratification to Guide Prevention and Control Strategies for Arboviruses Transmitted by Aedes aegypti. Tropical Medicine and Infectious Disease. 2023; 8(7):362. https://doi.org/10.3390/tropicalmed8070362
Chicago/Turabian StyleEspinosa, Manuel Osvaldo, Verónica Andreo, Gladys Paredes, Carlos Leaplaza, Viviana Heredia, María Victoria Periago, and Marcelo Abril. 2023. "Risk Stratification to Guide Prevention and Control Strategies for Arboviruses Transmitted by Aedes aegypti" Tropical Medicine and Infectious Disease 8, no. 7: 362. https://doi.org/10.3390/tropicalmed8070362