Citrinin Exposure in Germany: Urine Biomarker Analysis in Children and Adults

 ,
,  ,
,  , ,
, ,
Abstract
:1. Introduction
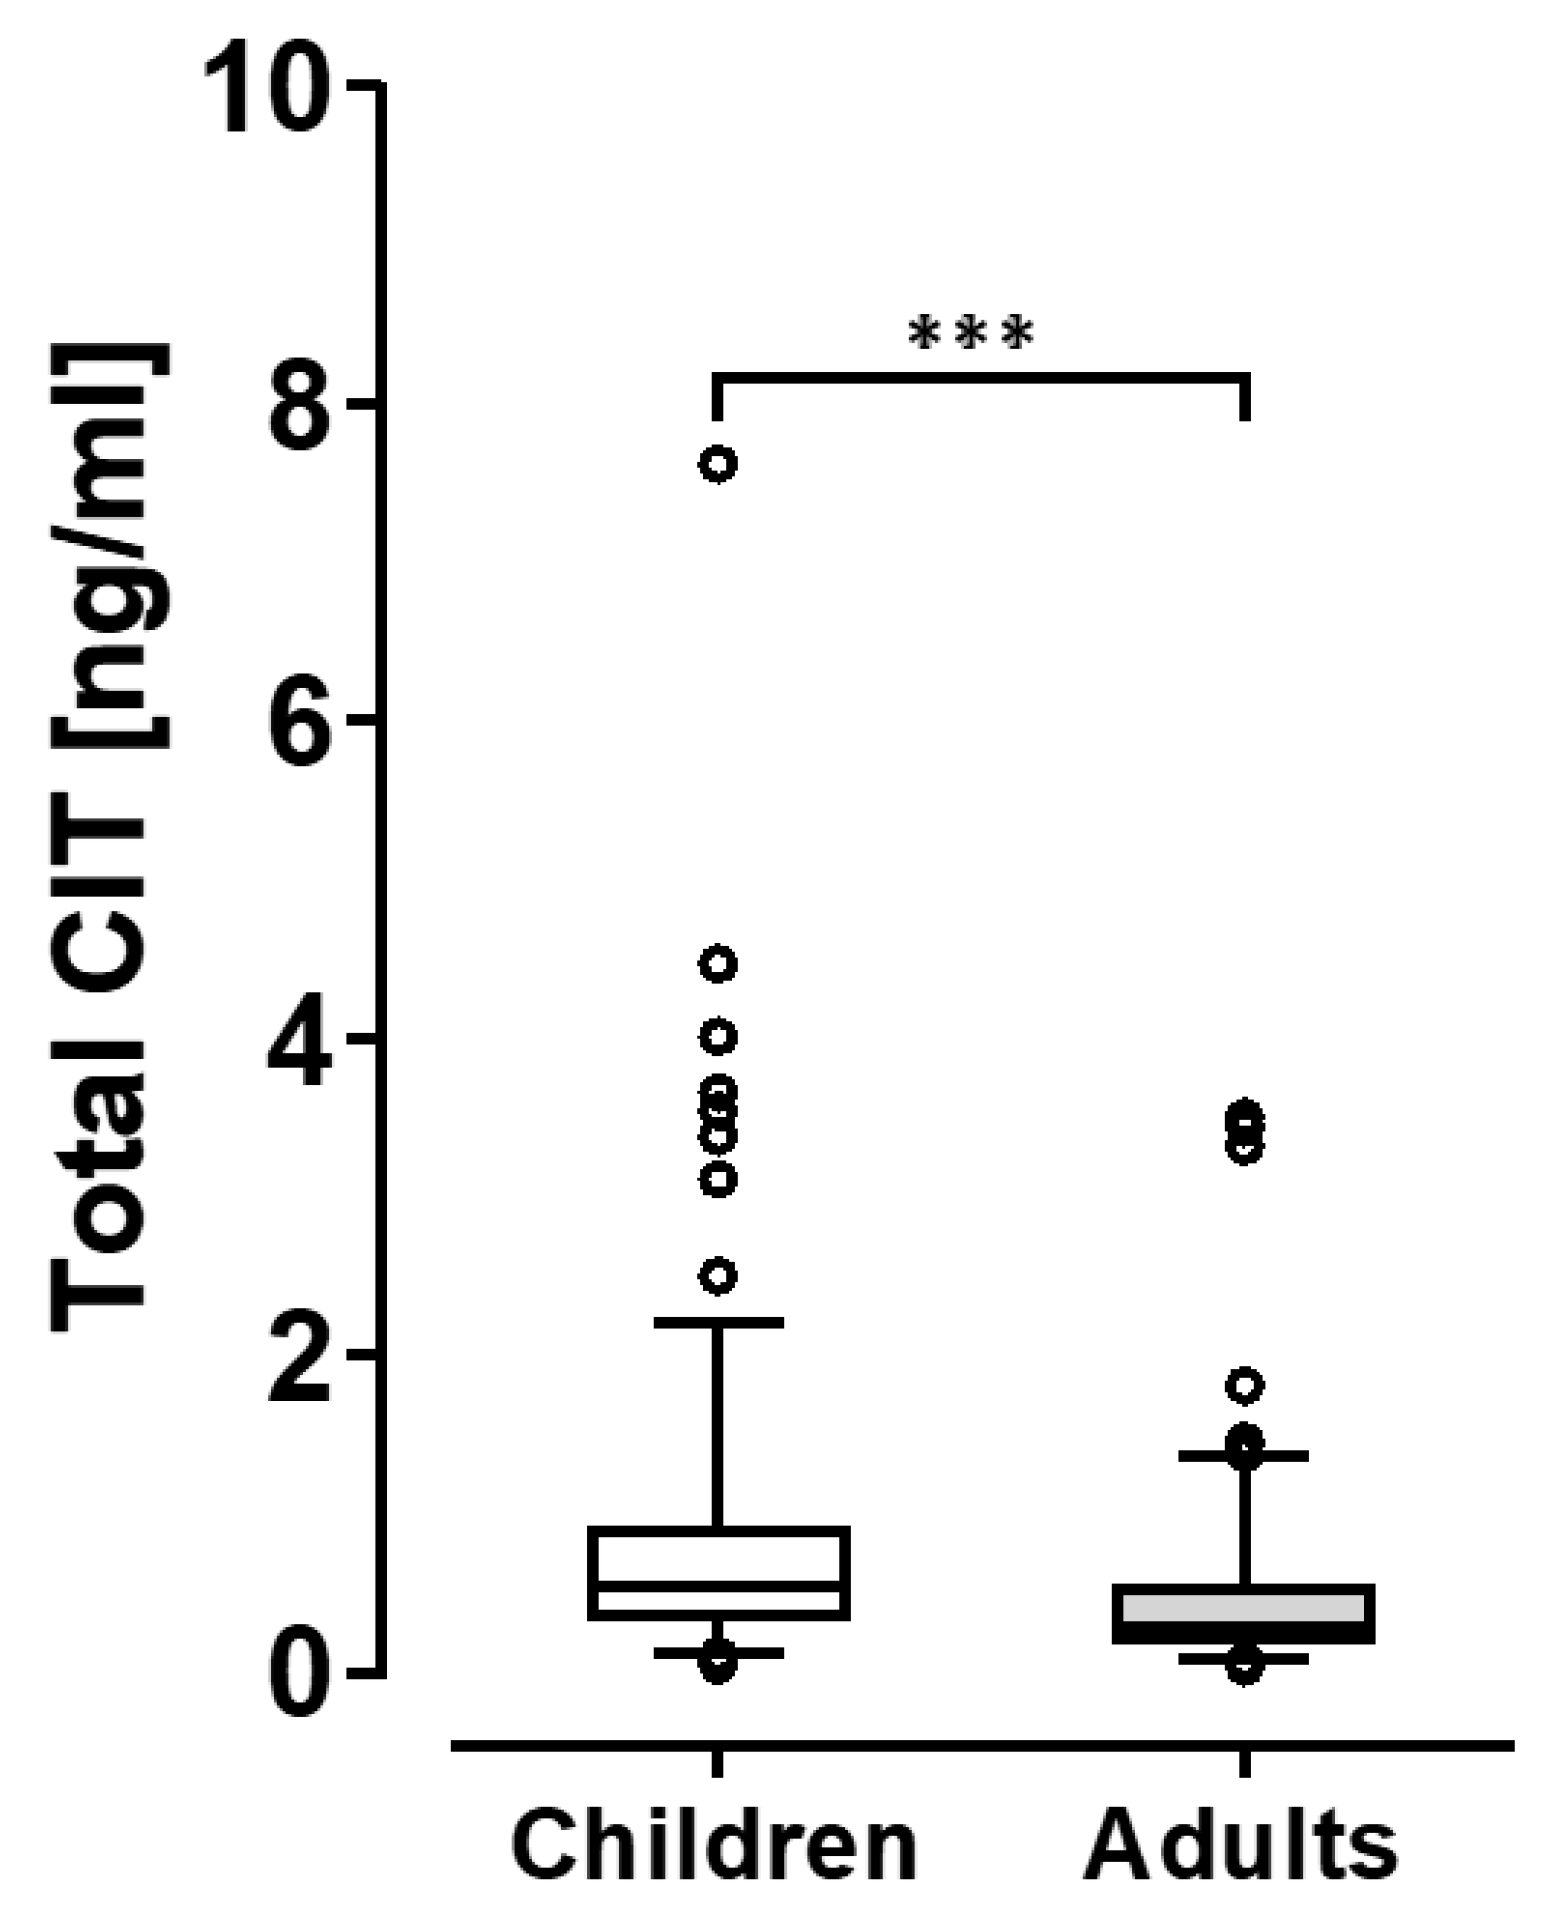
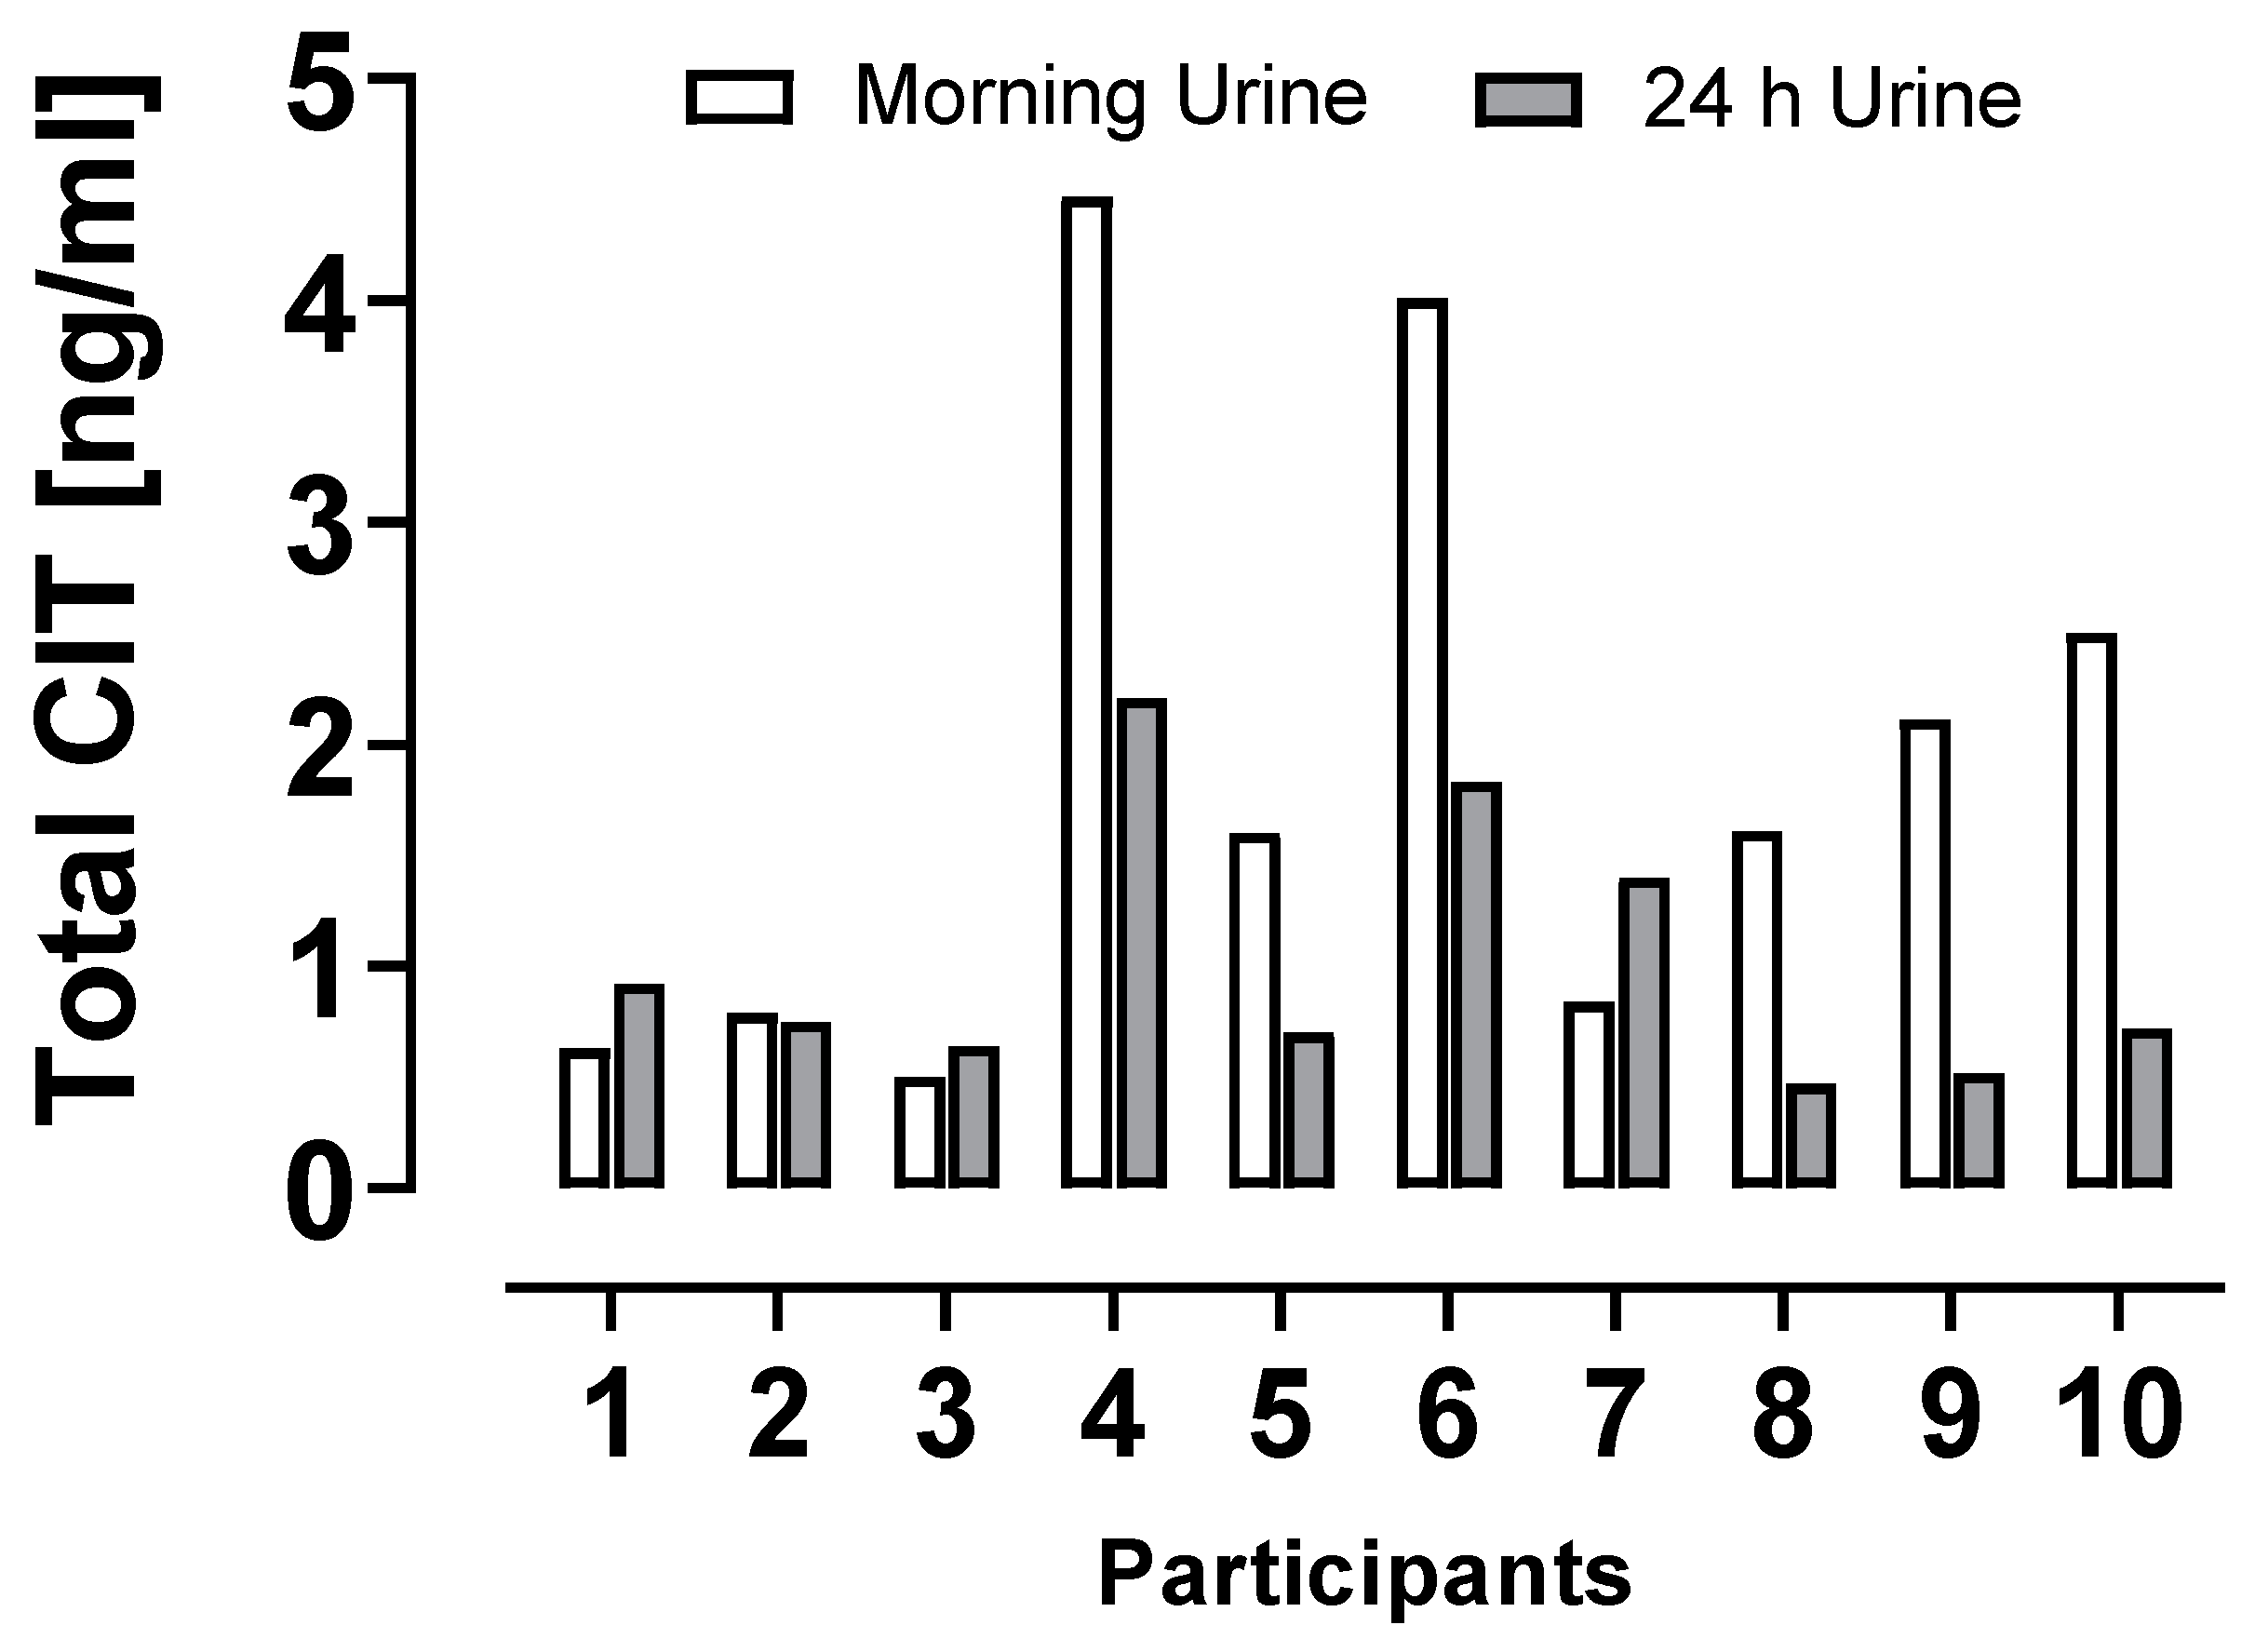
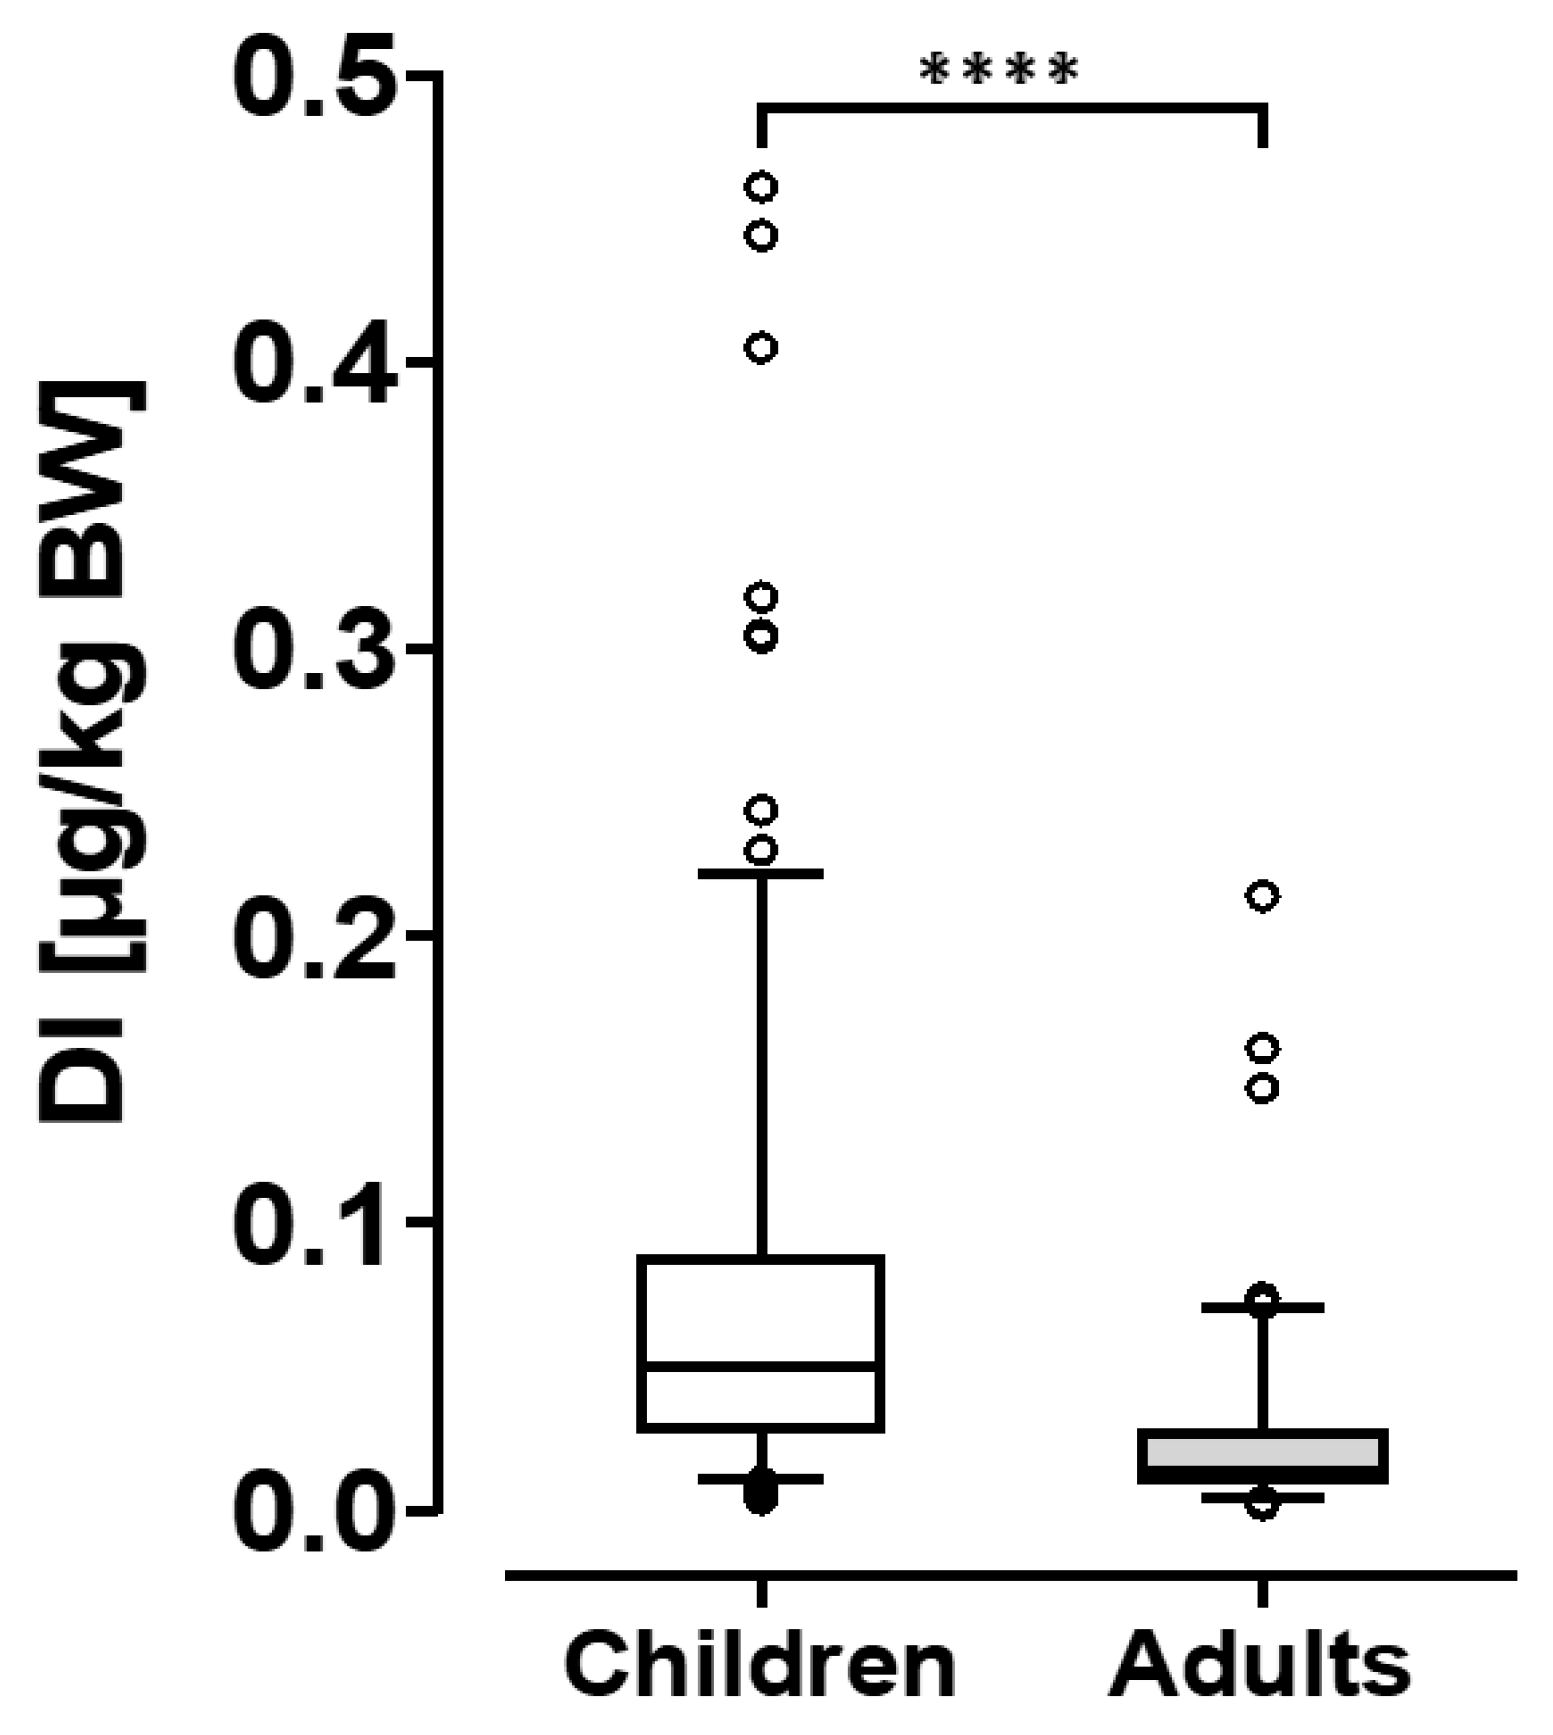
2. Results
3. Discussion
4. Conclusions
5. Materials and Methods
5.1. Chemicals and Reagents
5.2. Study Groups and Urines
5.3. Biomarker Analysis
5.4. Estimate of CIT Intake
5.5. Statistical Analysis
Author Contributions
Funding
Institutional Review Board Statement
Informed Consent Statement
Data Availability Statement
Acknowledgments
Conflicts of Interest
References
- Geisen, R.; Schmidt-Heydt, M.; Touhami, N.; Himmelsbach, A. New aspects of ochratoxin A and citrinin biosynthesis in Penicillium. Curr. Opin. Food. Sci. 2018, 23, 23–31. [Google Scholar] [CrossRef]
- Kamle, M.; Mahato, D.K.; Gupta, A.; Pandhi, S.; Sharma, N.; Sharma, B.; Mishra, S.; Arora, S.; Selvakumar, R.; Saurabh, V.; et al. Citrinin Mycotoxin Contamination in Food and Feed: Impact on Agriculture, Human Health, and Detection and Management Strategies. Toxins 2022, 14, 85. [Google Scholar] [CrossRef]
- Ali, N. Co-occurrence of citrinin and ochratoxin A in rice in Asia and its implications for human health. J. Sci. Food Agric. 2018, 98, 2055–2059. [Google Scholar] [CrossRef]
- European Food and Safety Authority. Scientific Opinion on the risks for public and animal health related to the presence of citrinin in food and feed. EFSA J. 2012, 10, 1–82. [Google Scholar] [CrossRef]
- Ostry, V.; Malir, F.; Ruprich, J. Producers and important dietary sources of ochratoxin A and citrinin. Toxins 2013, 5, 1574–1586. [Google Scholar] [CrossRef]
- Farawahida, A.H.; Palmer, J.; Flint, S. Monascus spp. and citrinin: Identification, selection of Monascus spp. isolates, occurrence, detection and reduction of citrinin during the fermentation of red fermented rice. Int. J. Food Microbiol. 2022, 379, 109829. [Google Scholar] [CrossRef]
- López Sánchez, P.; de Nijs, M.; Spanjer, M.; Pietri, A.; Bertuzzi, T.; Starski, A.; Postupolski, J.; Castellari, M.; Hortós, M. Generation of occurrence data on citrinin in food. EFSA Support Publ. 2017, 14, 1–47. [Google Scholar] [CrossRef]
- Silva, L.J.G.; Pereira, A.; Pena, A.; Lino, C.M. Citrinin in Foods and Supplements: A Review of Occurrence and Analytical Methodologies. Foods 2020, 10, 14. [Google Scholar] [CrossRef]
- Tangni, E.K.; Van Hove, F.; Huybrechts, B.; Masquelier, J.; Vandermeiren, K.; Van Hoeck, E. Citrinin Determination in Food and Food Supplements by LC-MS/MS: Development and Use of Reference Materials in an International Collaborative Study. Toxins 2021, 13, 245. [Google Scholar] [CrossRef]
- Commission of the European Union. Commission Regulation (EU) No 2019/1901 of 7 November 2019 amending Regulation (EC) No 1881/2006 as regards maximum levels of citrinin in food supplements based on rice fermented with red yeast Monascus purpureus. Off. J. EU 2019, 62, 2–4. [Google Scholar]
- Meerpoel, C.; Vidal, A.; Andjelkovic, M.; De Boevre, M.; Tangni, E.K.; Huybrechts, B.; Devreese, M.; Croubels, S.; De Saeger, S. Dietary exposure assessment and risk characterization of citrinin and ochratoxin A in Belgium. Food Chem. Toxicol. 2021, 147, 111914. [Google Scholar] [CrossRef] [PubMed]
- Mair, C.; Norris, M.; Donnelly, C.; Leeman, D.; Brown, P.; Marley, E.; Milligan, C.; Mackay, N. Assessment of Citrinin in Spices and Infant Cereals Using Immunoaffinity Column Clean-Up with HPLC-Fluorescence Detection. Toxins 2021, 13, 715. [Google Scholar] [CrossRef]
- Fromme, H.; Gareis, M.; Volkel, W.; Gottschalk, C. Overall internal exposure to mycotoxins and their occurrence in occupational and residential settings—An overview. Int. J. Hyg. Environ. Health 2016, 219, 143–165. [Google Scholar] [CrossRef]
- Vidal, A.; Mengelers, M.; Yang, S.; De Saeger, S.; De Boevre, M. Mycotoxin Biomarkers of Exposure: A Comprehensive Review. Compr. Rev. Food Sci. Food Saf. 2018, 17, 1127–1155. [Google Scholar] [CrossRef]
- Blaszkewicz, M.; Munoz, K.; Degen, G.H. Methods for analysis of citrinin in human blood and urine. Arch. Toxicol. 2013, 87, 1087–1094. [Google Scholar] [CrossRef]
- Ali, N.; Blaszkewicz, M.; Degen, G.H. Occurrence of the mycotoxin citrinin and its metabolite dihydrocitrinone in urines of German adults. Arch. Toxicol. 2015, 89, 573–578. [Google Scholar] [CrossRef]
- Gerding, J.; Ali, N.; Schwartzbord, J.; Cramer, B.; Brown, D.L.; Degen, G.H.; Humpf, H.U. A comparative study of the human urinary mycotoxin excretion patterns in Bangladesh, Germany, and Haiti using a rapid and sensitive LC-MS/MS approach. Mycotoxin Res. 2015, 31, 127–136. [Google Scholar] [CrossRef]
- Ali, N.; Degen, G.H. Citrinin biomarkers: A review of recent data and application to human exposure assessment. Arch. Toxicol. 2019, 93, 3057–3066. [Google Scholar] [CrossRef]
- Silva, L.; Pereira, A.; Duarte, S.; Pena, A.; Lino, C. Reviewing the Analytical Methodologies to Determine the Occurrence of Citrinin and its Major Metabolite, Dihydrocitrinone, in Human Biological Fluids. Molecules 2020, 25, 2906. [Google Scholar] [CrossRef]
- Narvaez, A.; Izzo, L.; Rodriguez-Carrasco, Y.; Ritieni, A. Citrinin Dietary Exposure Assessment Approach through Human Biomonitoring High-Resolution Mass Spectrometry-Based Data. J. Agric. Food Chem. 2021, 69, 6330–6338. [Google Scholar] [CrossRef]
- Degen, G.H.; Ali, N.; Gundert-Remy, U. Preliminary data on citrinin kinetics in humans and their use to estimate citrinin exposure based on biomarkers. Toxicol. Lett. 2018, 282, 43–48. [Google Scholar] [CrossRef]
- Kiebooms, J.A.L.; Huybrechts, B.; Thiry, C.; Tangni, E.K.; Callebaut, A. A quantitative UHPLC-MS/MS method for citrinin and ochratoxin A detection in food, feed and red yeast rice food supplements. World Mycotoxin J. 2016, 9, 343–352. [Google Scholar] [CrossRef]
- Ali, N.; Degen, G.H. Biological monitoring for ochratoxin A and citrinin and their metabolites in urine samples of infants and children in Bangladesh. Mycotoxin Res. 2020, 36, 409–417. [Google Scholar] [CrossRef]
- Kyei, N.N.A.; Cramer, B.; Humpf, H.U.; Degen, G.H.; Ali, N.; Gabrysch, S. Assessment of multiple mycotoxin exposure and its association with food consumption: A human biomonitoring study in a pregnant cohort in rural Bangladesh. Arch. Toxicol. 2022, 96, 2123–2138. [Google Scholar] [CrossRef]
- Heyndrickx, E.; Sioen, I.; Huybrechts, B.; Callebaut, A.; De Henauw, S.; De Saeger, S. Human biomonitoring of multiple mycotoxins in the Belgian population: Results of the BIOMYCO study. Environ. Int. 2015, 84, 82–89. [Google Scholar] [CrossRef]
- Janic Hajnal, E.; Kos, J.; Malachova, A.; Steiner, D.; Stranska, M.; Krska, R.; Sulyok, M. Mycotoxins in maize harvested in Serbia in the period 2012-2015. Part 2: Non-regulated mycotoxins and other fungal metabolites. Food Chem. 2020, 317, 126409. [Google Scholar] [CrossRef]
- Kos, J.; Janic Hajnal, E.; Malachova, A.; Steiner, D.; Stranska, M.; Krska, R.; Poschmaier, B.; Sulyok, M. Mycotoxins in maize harvested in Republic of Serbia in the period 2012-2015. Part 1: Regulated mycotoxins and its derivatives. Food Chem. 2020, 312, 126034. [Google Scholar] [CrossRef]
- Bundesministerium für Ernährung und Landwirtschaft. Besondere Ernte- und Qualitätsermittlung (BEE) 2021; Daten-Analysen; BMEL: Berlin, Germany, 2022. [Google Scholar]
- Sarkanj, B.; Ezekiel, C.N.; Turner, P.C.; Abia, W.A.; Rychlik, M.; Krska, R.; Sulyok, M.; Warth, B. Ultra-sensitive, stable isotope assisted quantification of multiple urinary mycotoxin exposure biomarkers. Anal. Chim. Acta 2018, 1019, 84–92. [Google Scholar] [CrossRef]
- Schmidt, J.; Cramer, B.; Turner, P.C.; Stoltzfus, R.J.; Humphrey, J.H.; Smith, L.E.; Humpf, H.U. Determination of Urinary Mycotoxin Biomarkers Using a Sensitive Online Solid Phase Extraction-UHPLC-MS/MS Method. Toxins 2021, 13, 418. [Google Scholar] [CrossRef] [PubMed]
- Ali, N.; Blaszkewicz, M.; Alim, A.; Hossain, K.; Degen, G.H. Urinary biomarkers of ochratoxin A and citrinin exposure in two Bangladeshi cohorts: Follow-up study on regional and seasonal influences. Arch. Toxicol. 2016, 90, 2683–2697. [Google Scholar] [CrossRef]
- Pustjens, A.M.; Castenmiller, J.J.M.; te Biesebeek, J.D.; de Rijk, T.C.; van Dam, R.C.J.; Boon, P.E. Dietary exposure to mycotoxins of 1-and 2-year-old children from a Dutch Total Diet Study. World Mycotoxin J. 2022, 15, 85–97. [Google Scholar] [CrossRef]
- Bergmann, D.; Hubner, F.; Wibbeling, B.; Daniliuc, C.; Cramer, B.; Humpf, H.U. Large-scale total synthesis of (13)C3-labeled citrinin and its metabolite dihydrocitrinone. Mycotoxin Res. 2018, 34, 141–150. [Google Scholar] [CrossRef]
- Manz, F.; Johner, S.A.; Wentz, A.; Boeing, H.; Remer, T. Water balance throughout the adult life span in a German population. Br. J. Nutr. 2012, 107, 1673–1681. [Google Scholar] [CrossRef]
- European Food and Safety Authority. Scientific Opinion on dietary reference values for iodine. EFSA J. 2014, 12, 3660. [Google Scholar] [CrossRef]


| Study Group (n = Urine Samples) | CITtotal Min–Max | Mean ± SD | Median | P95 |
|---|---|---|---|---|
| Entire study group | 0.04–7.62 | 0.68 ± 0.79 | 0.43 | 2.11 |
| Adults (n = 142) | 0.05–3.50 | 0.48 ± 0.56 | 0.30 | 1.28 |
| Children (n = 179) | 0.04–7.62 | 0.83 ± 0.91 | 0.54 | 2.20 |
| Bavaria all | 0.05–3.66 | 0.51 ± 0.52 | 0.35 | 1.46 |
| Adults (n = 76) | 0.05–1.81 | 0.42 ± 0.37 | 0.30 | 1.19 |
| Children (n = 93) | 0.05–3.66 | 0.60 ± 0.62 | 0.43 | 1.66 |
| Berlin all | 0.04–7.62 | 0.74 ± 1.03 | 0.41 | 2.54 |
| Adults (n = 66) | 0.04–3.50 | 0.55 ± 0.71 | 0.29 | 1.44 |
| Children (n = 27) | 0.13–7.62 | 1.19 ± 1.49 | 0.65 | 2.82 |
| North-Rhine Westphalia (All) | 0.23–4.47 | 1.04 ± 0.89 | 0.75 | 2.59 |
| Children (morning urines n = 50) | 0.23–4.47 | 1.05 ± 0.94 | 0.75 | 3.03 |
| Children (24 h urines n = 10) | 0.47–2.21 | 1.02 ± 0.60 | 0.74 | 2.04 |
| Study Group | Probable Daily Intakes (ng per kg Body Weight) | Percentage of the pTDI (i.e., 200 ng/kg bw *) | ||||
|---|---|---|---|---|---|---|
| PDImin | PDImedian | PDImax | pTDImin | pTDImedian | pTDImax | |
| Entire group | 2 | 30 | 461 | 1 | 15 | 231 |
| Adults (n = 138) | 2 | 13 | 214 | 1 | 6.5 | 107 |
| Children (n = 179) | 3 | 50 | 461 | 1.5 | 25 | 231 |
| Region Group | Age (Years) | Body Weight (kg) | Urine Donors N and (Gender) |
|---|---|---|---|
| Bavaria | |||
| Children | 2–14 (Mean 6) | 11–56 (Mean 20.2) | 93 (47 m, 46 f) |
| Adults | 26–61 (Mean 39) | 46–107 (Mean 75.1) | 76 (37 m, 39 f) |
| Berlin | |||
| Children | 2.0–12 (Mean 7.2) | 11–40 (Mean 25.7) | 27 (12 m, 15 f) |
| Adults | 24–52 (Mean 40.1) | 46–135 (Mean 70.2) | 66 (23 m, 43 f) |
| NRW | |||
| Children (Spot urine) | 2.4–6.5 (Mean 4.9) | 15–33 (Mean 19.2) | 50 (25 m, 25 f) |
| Children (24 h urine) | 4.0–6.5 (Mean 4.9) | 16–21 (Mean 18.7) | 10 (5 m, 5 f) |
Disclaimer/Publisher’s Note: The statements, opinions and data contained in all publications are solely those of the individual author(s) and contributor(s) and not of MDPI and/or the editor(s). MDPI and/or the editor(s) disclaim responsibility for any injury to people or property resulting from any ideas, methods, instructions or products referred to in the content. |
© 2022 by the authors. Licensee MDPI, Basel, Switzerland. This article is an open access article distributed under the terms and conditions of the Creative Commons Attribution (CC BY) license (https://creativecommons.org/licenses/by/4.0/).
Share and Cite
Degen, G.H.; Reinders, J.; Kraft, M.; Völkel, W.; Gerull, F.; Burghardt, R.; Sievering, S.; Engelmann, J.; Chovolou, Y.; Hengstler, J.G.; et al. Citrinin Exposure in Germany: Urine Biomarker Analysis in Children and Adults. Toxins 2023, 15, 26. https://doi.org/10.3390/toxins15010026
Degen GH, Reinders J, Kraft M, Völkel W, Gerull F, Burghardt R, Sievering S, Engelmann J, Chovolou Y, Hengstler JG, et al. Citrinin Exposure in Germany: Urine Biomarker Analysis in Children and Adults. Toxins. 2023; 15(1):26. https://doi.org/10.3390/toxins15010026
Chicago/Turabian StyleDegen, Gisela H., Jörg Reinders, Martin Kraft, Wolfgang Völkel, Felicia Gerull, Rafael Burghardt, Silvia Sievering, Jennifer Engelmann, Yvonni Chovolou, Jan G. Hengstler, and et al. 2023. "Citrinin Exposure in Germany: Urine Biomarker Analysis in Children and Adults" Toxins 15, no. 1: 26. https://doi.org/10.3390/toxins15010026