
Toxic Relationships: Prediction of TBT’s Affinity to the Ecdysteroid Receptor of Triops longicaudatus
 , and
, and
Abstract
:1. Introduction
2. Materials and Methods
2.1. Organism Culture
2.2. Species Sensitivity Distribution
2.3. Protein Sequence Selection and Phylogenetic Analysis
2.4. Protein Modeling and Protein–Ligand Docking
3. Results
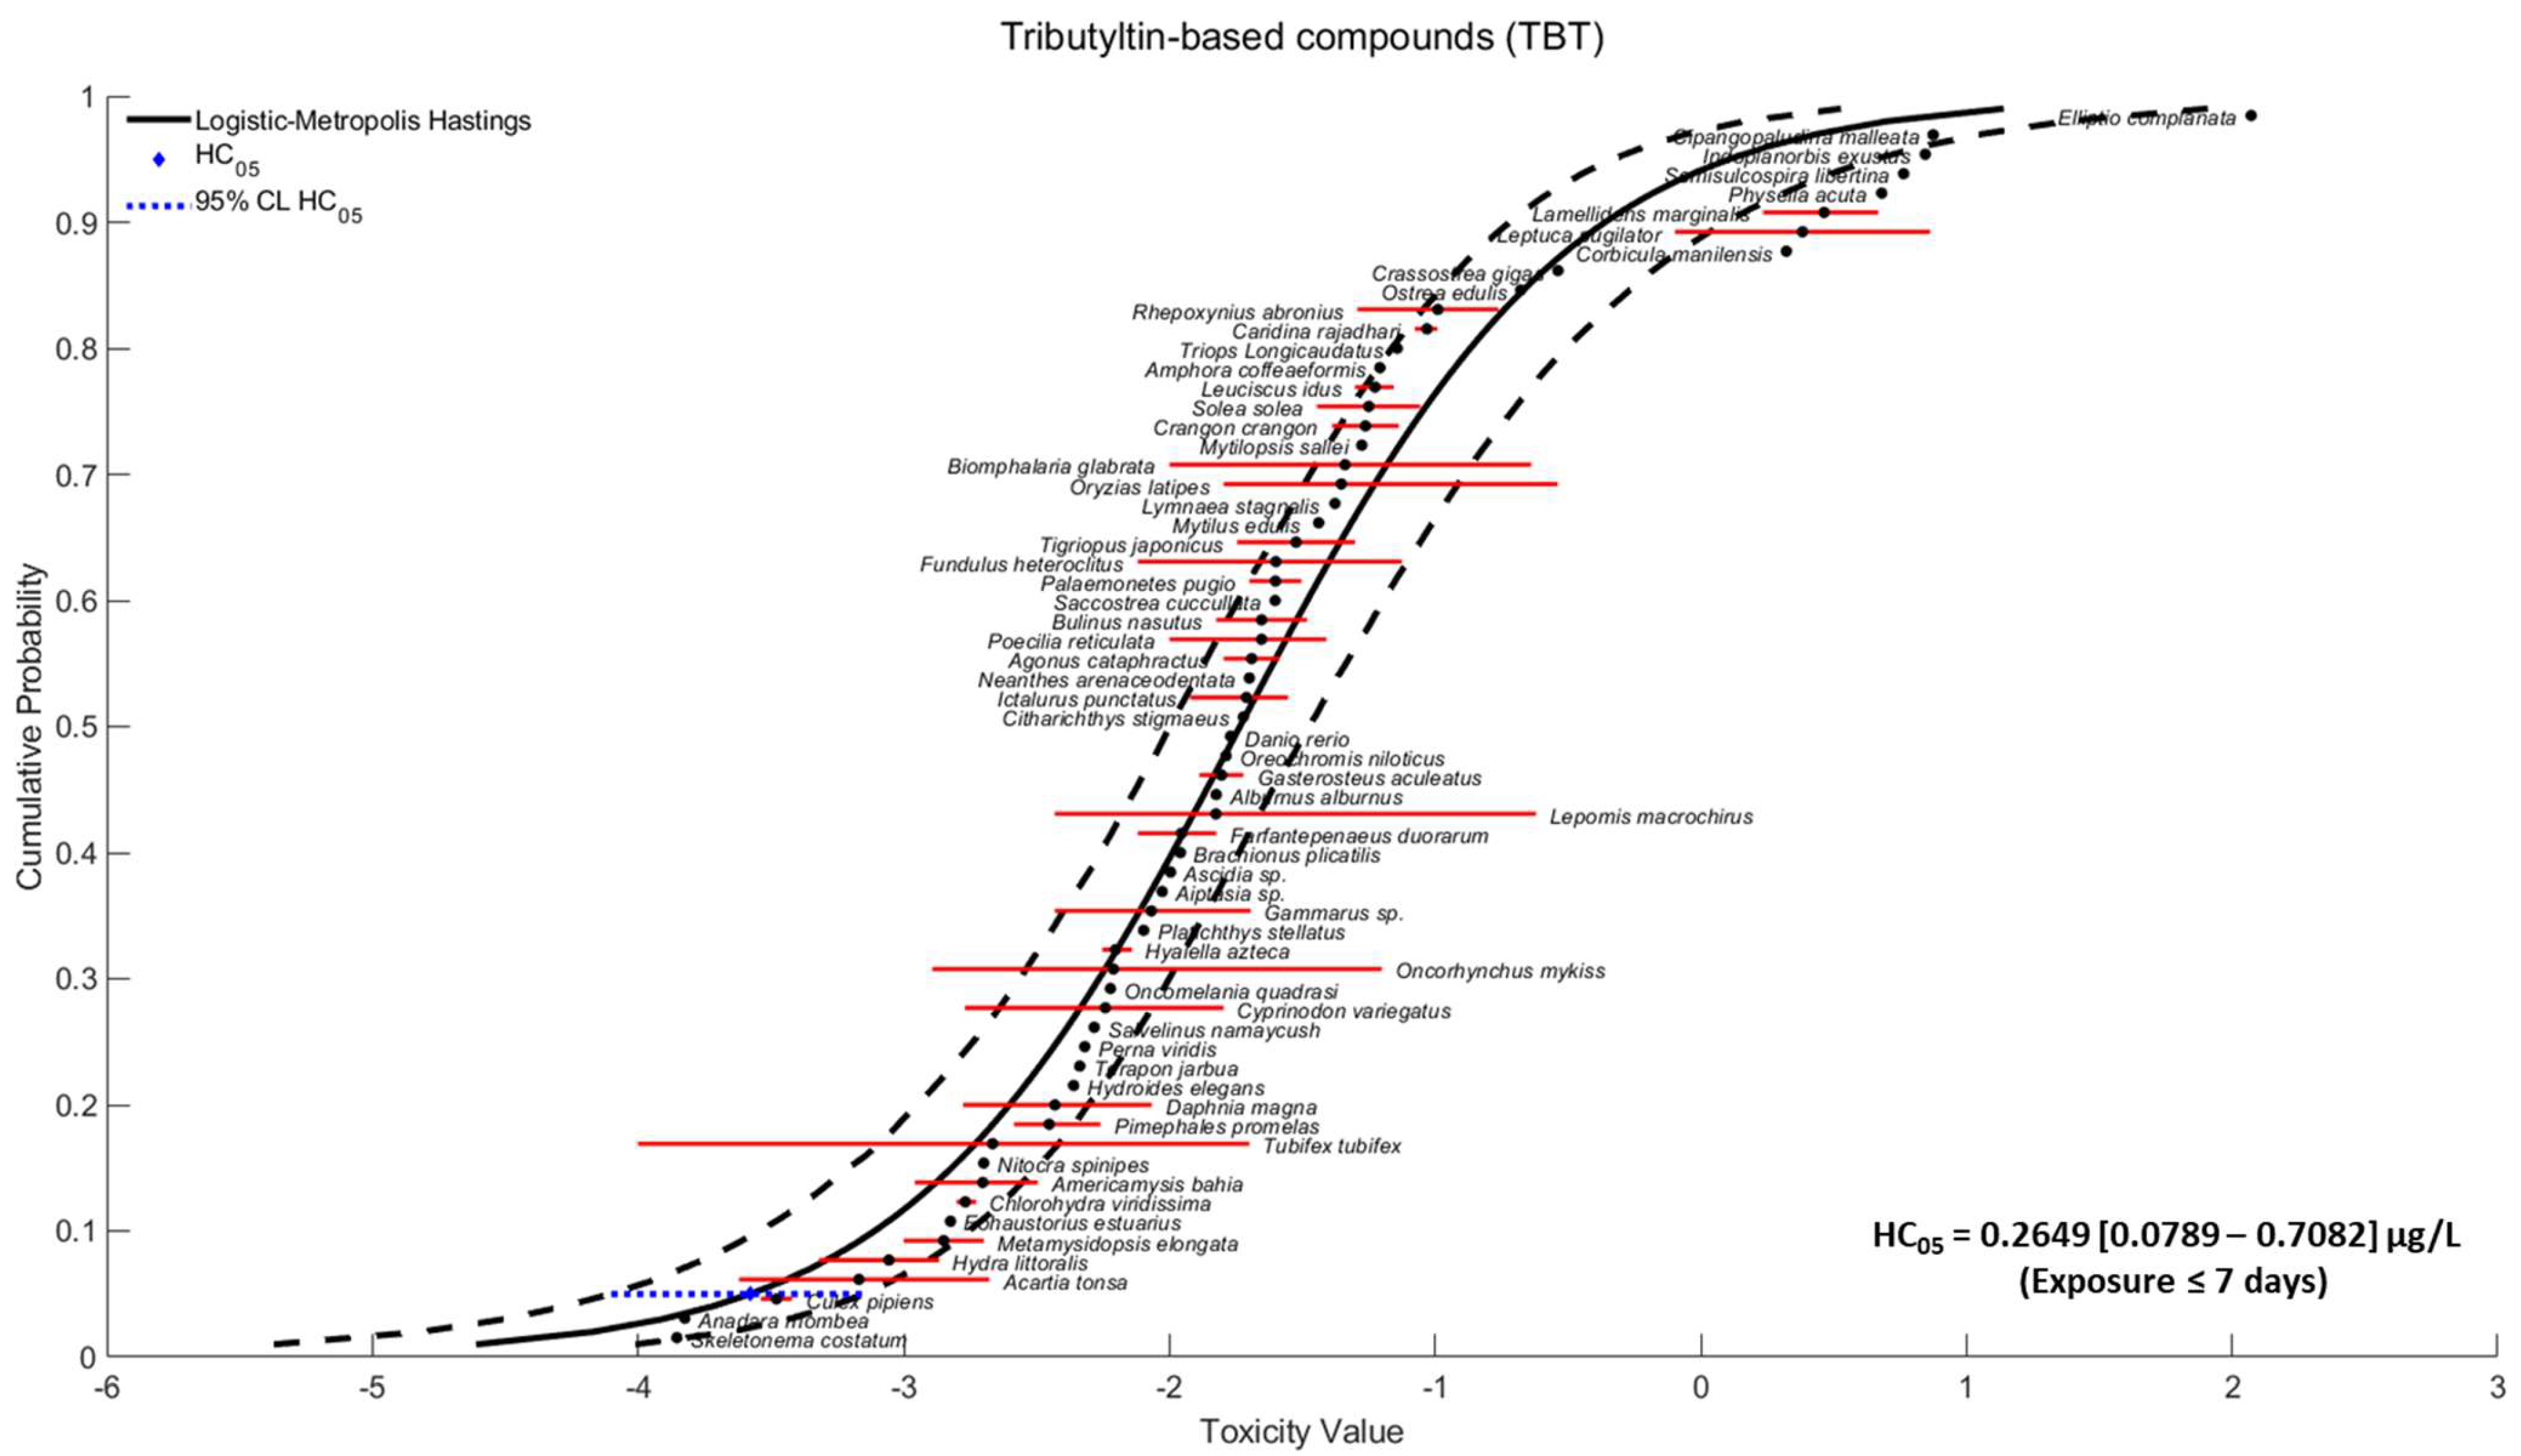
3.1. Species Sensitivity Distribution
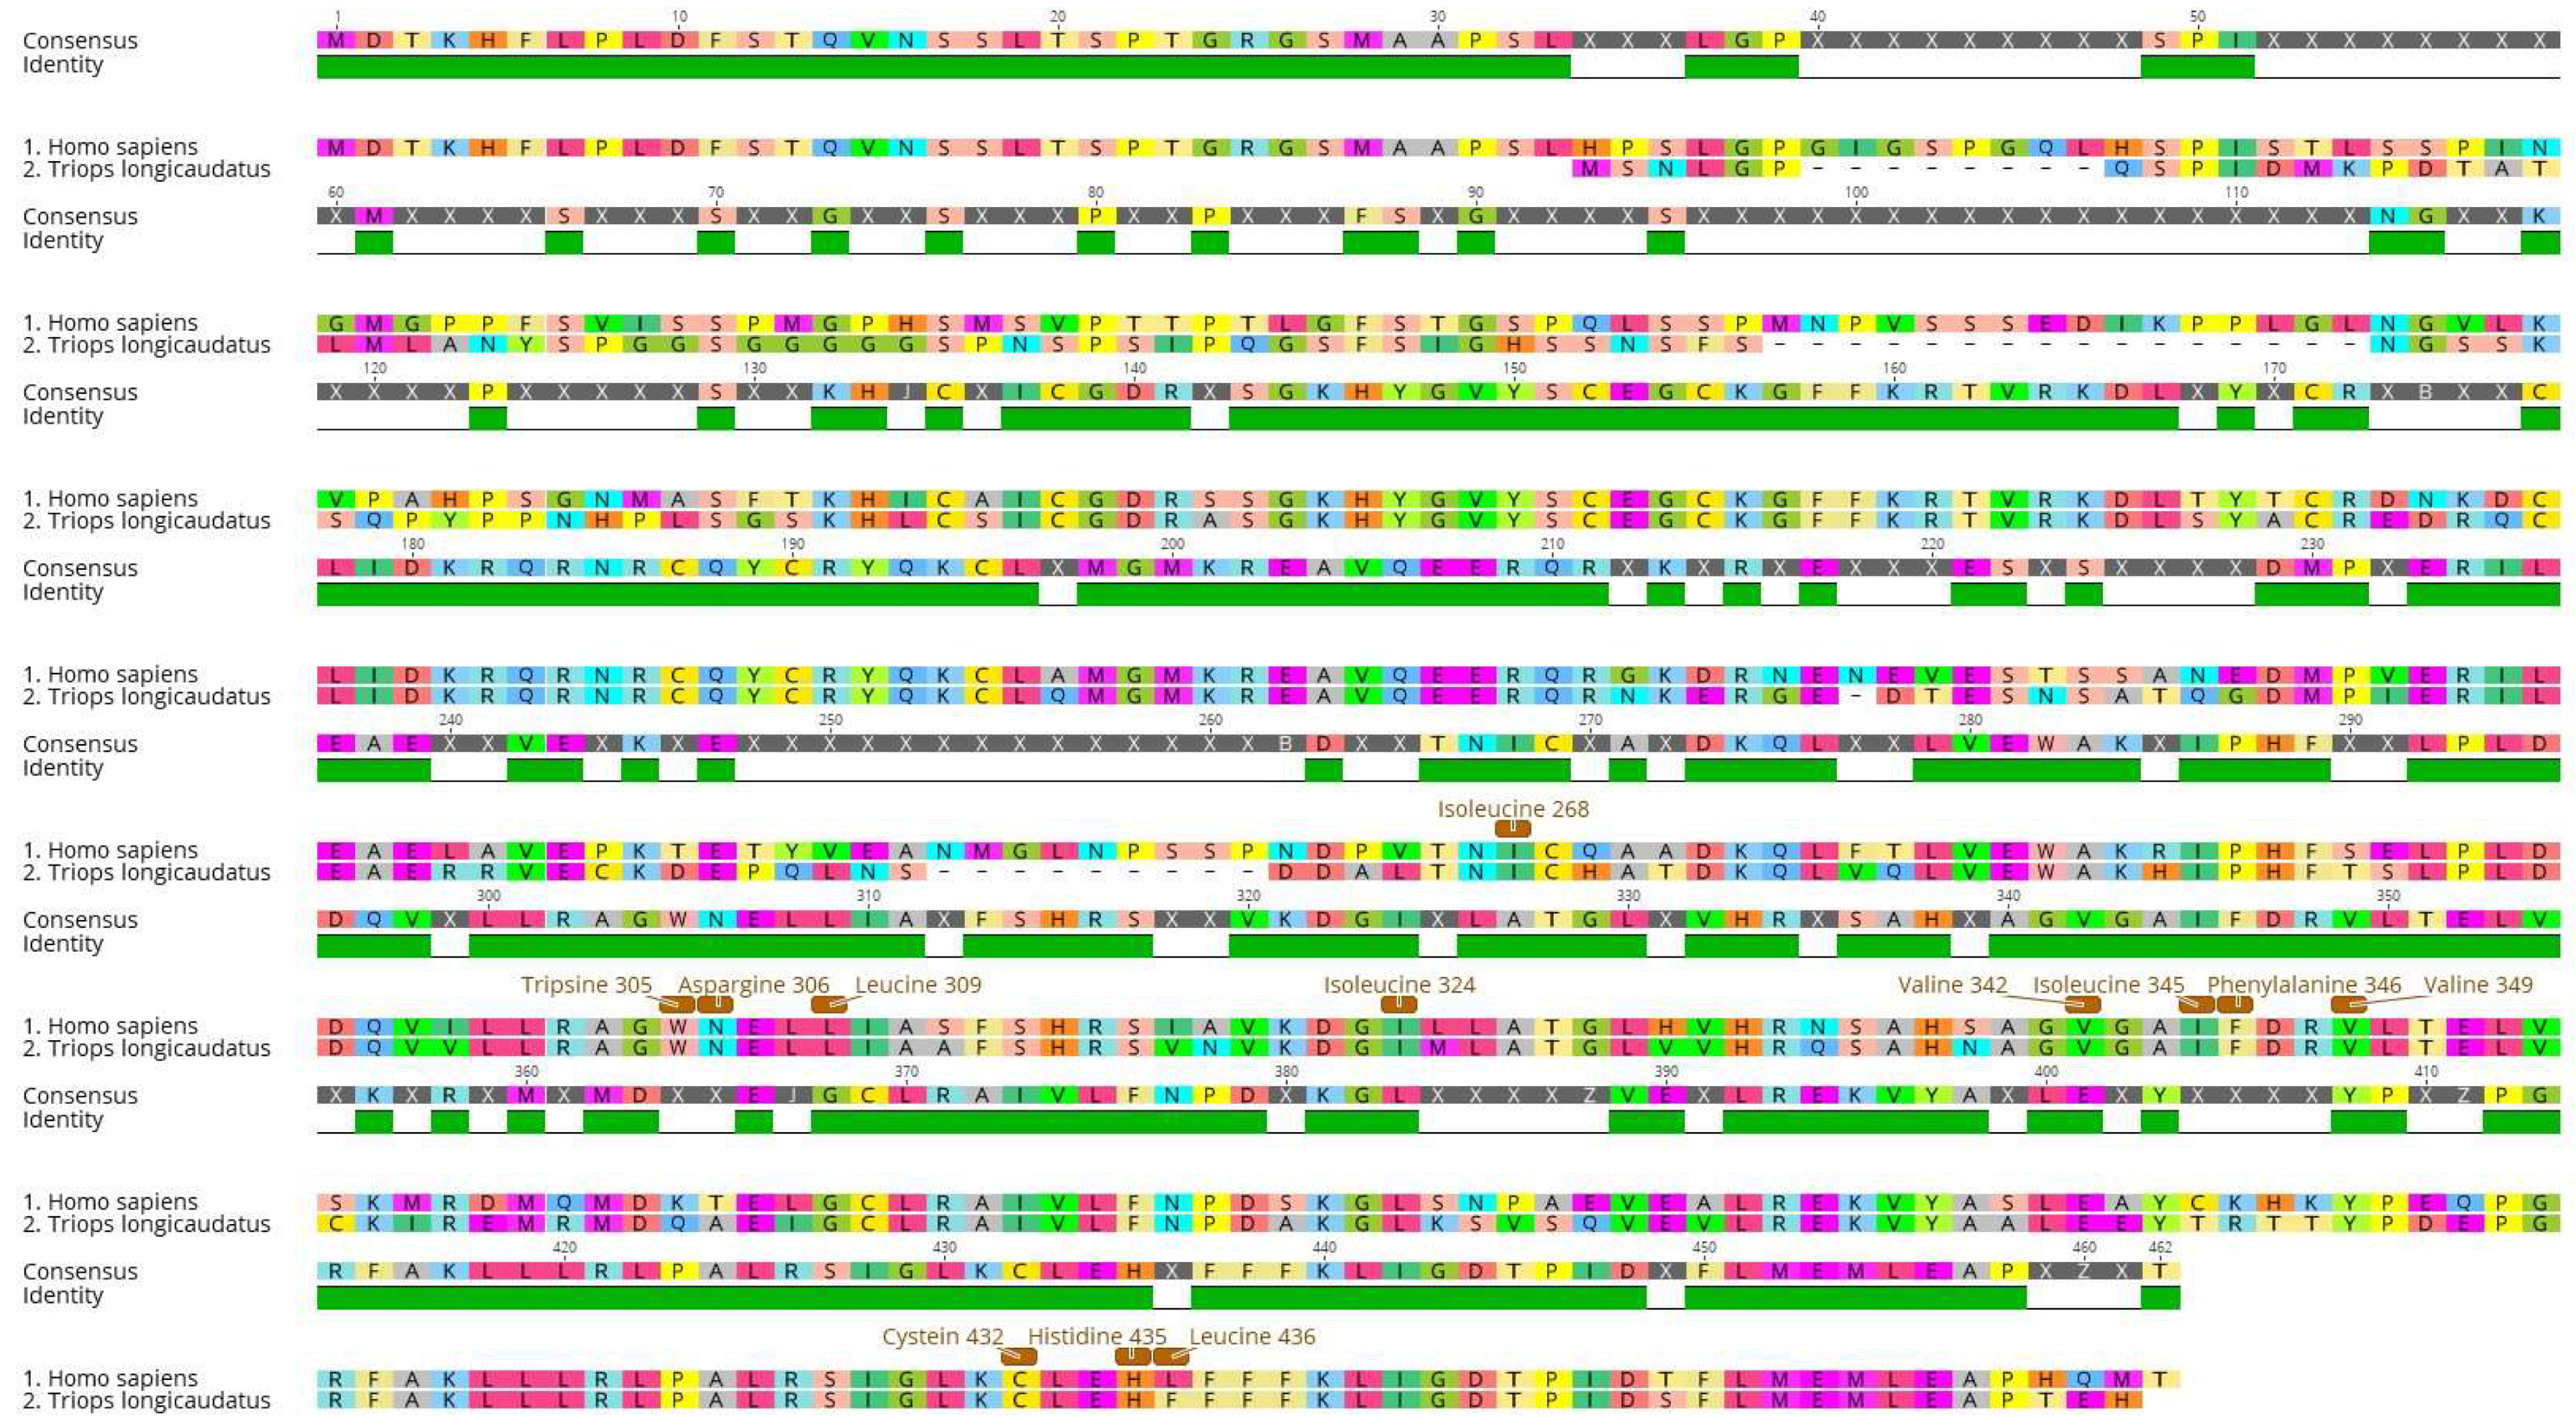
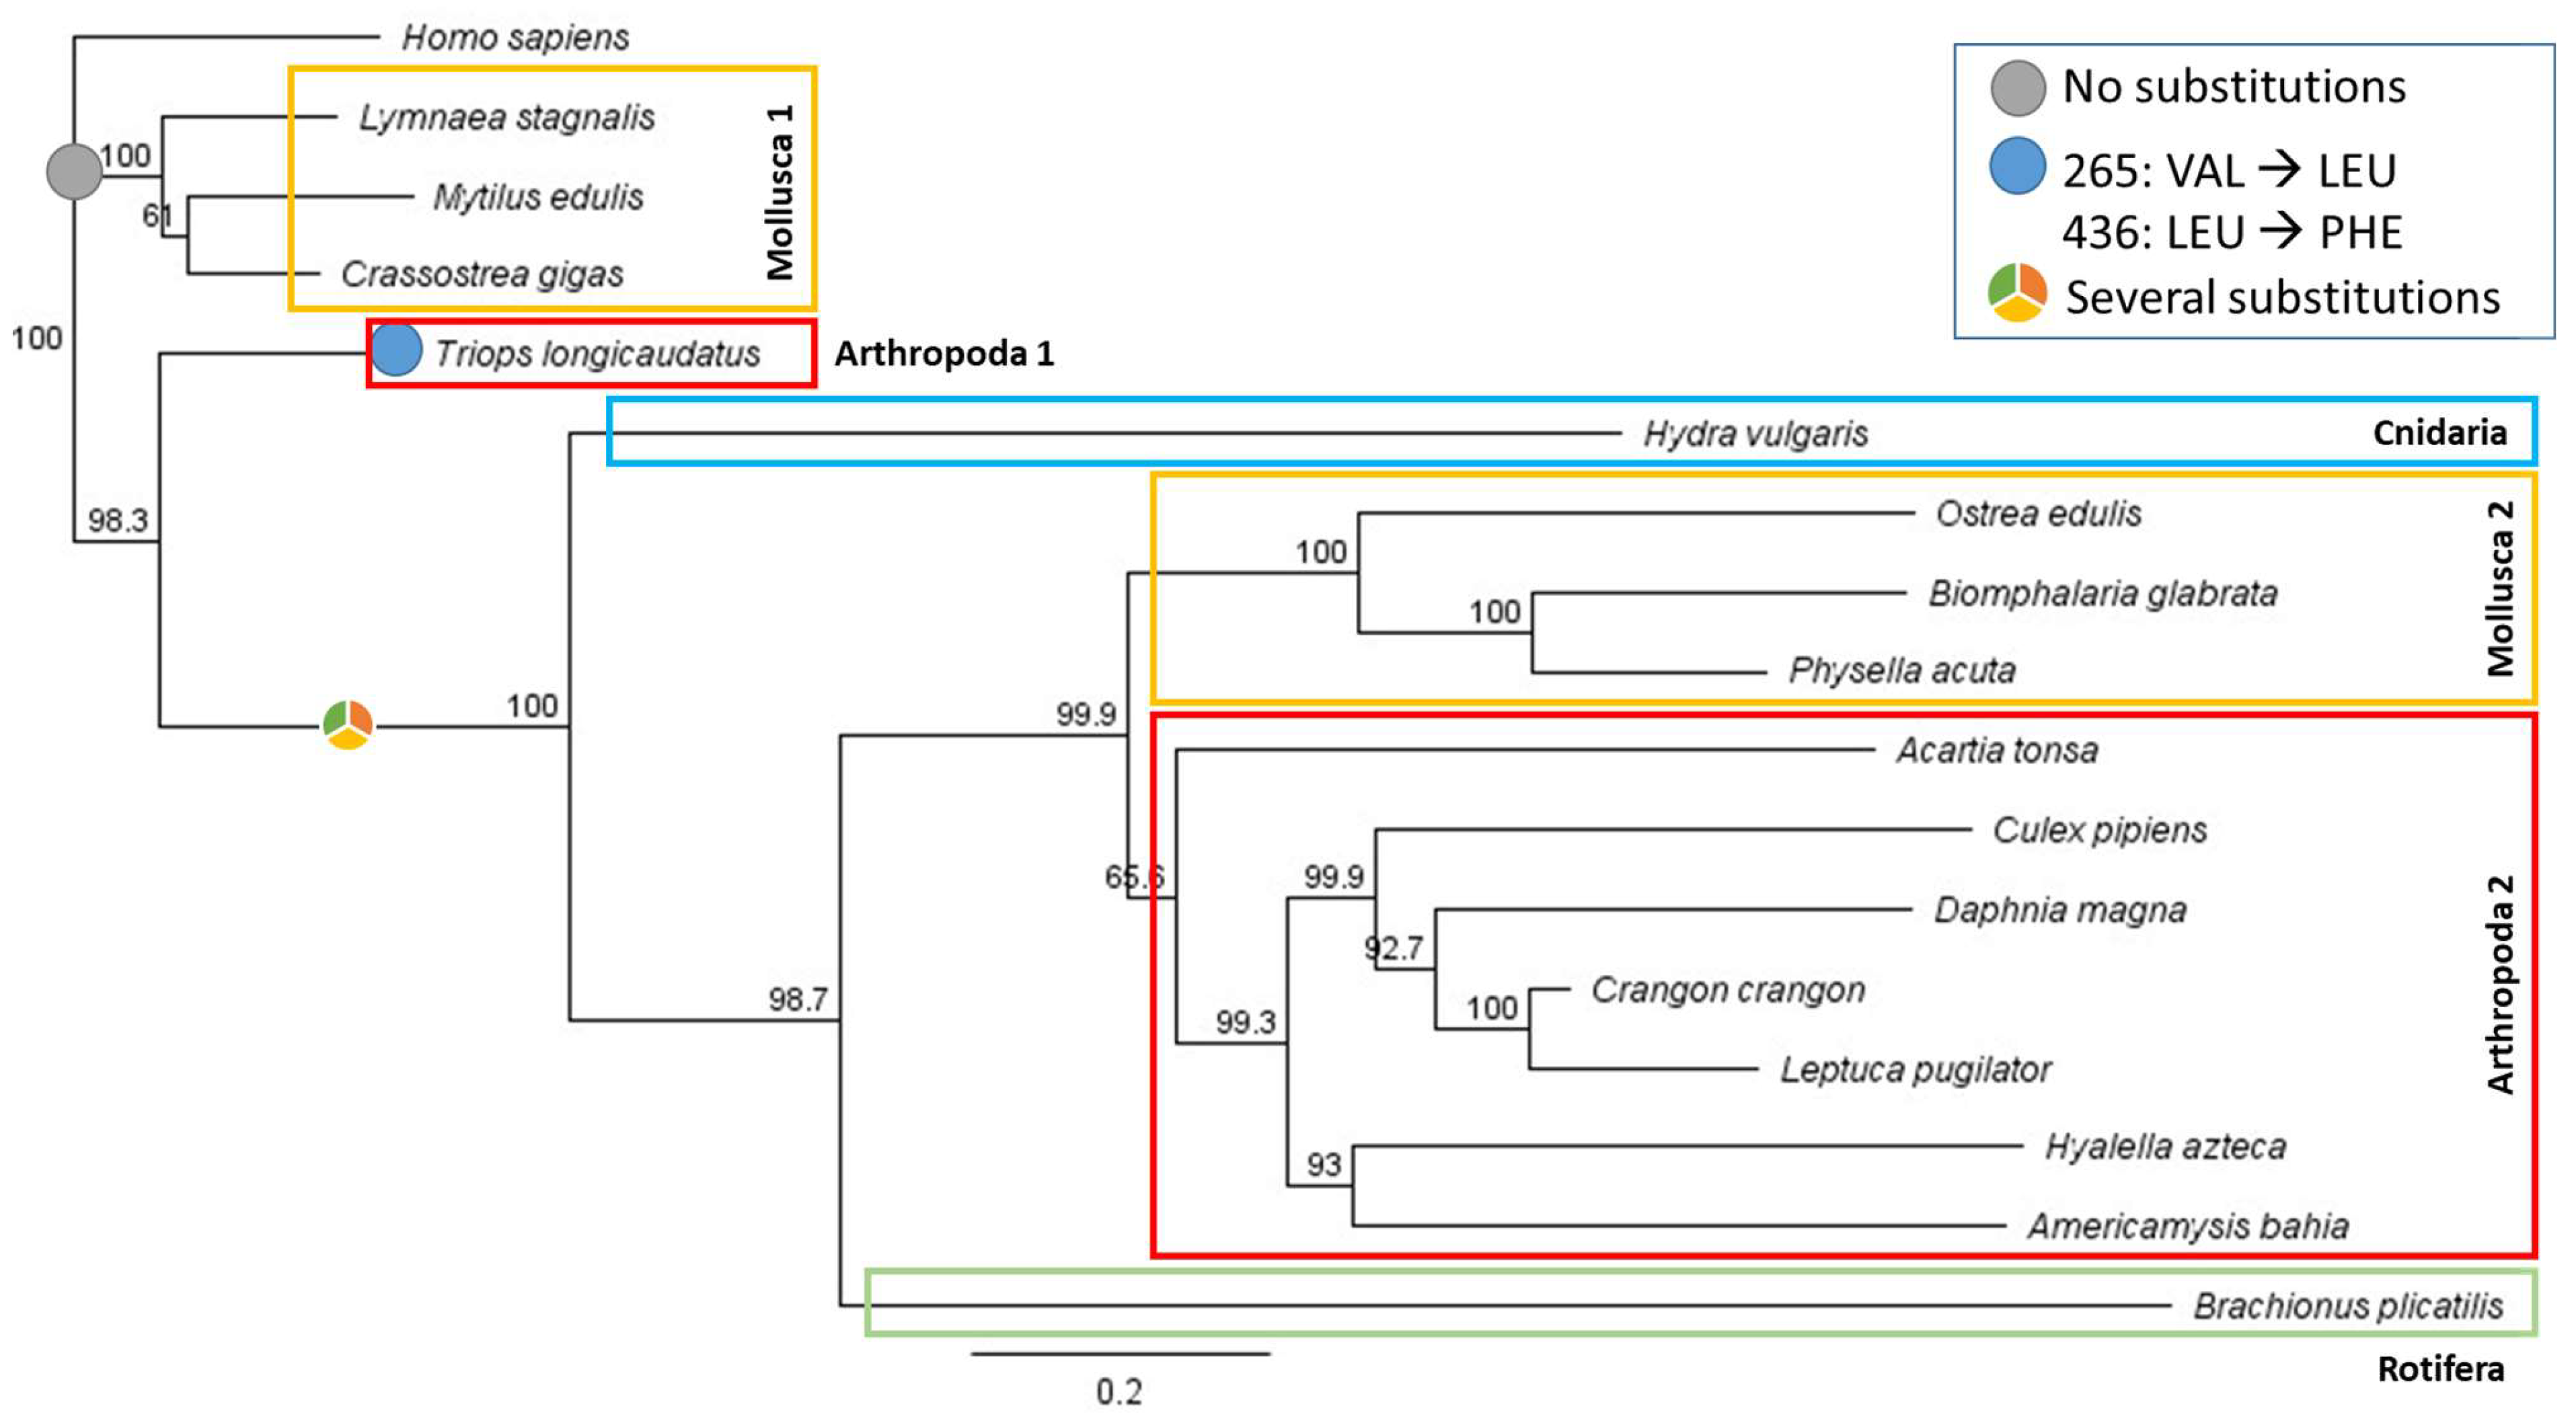
3.2. Sequence Alignments and Phylogenetic Analysis
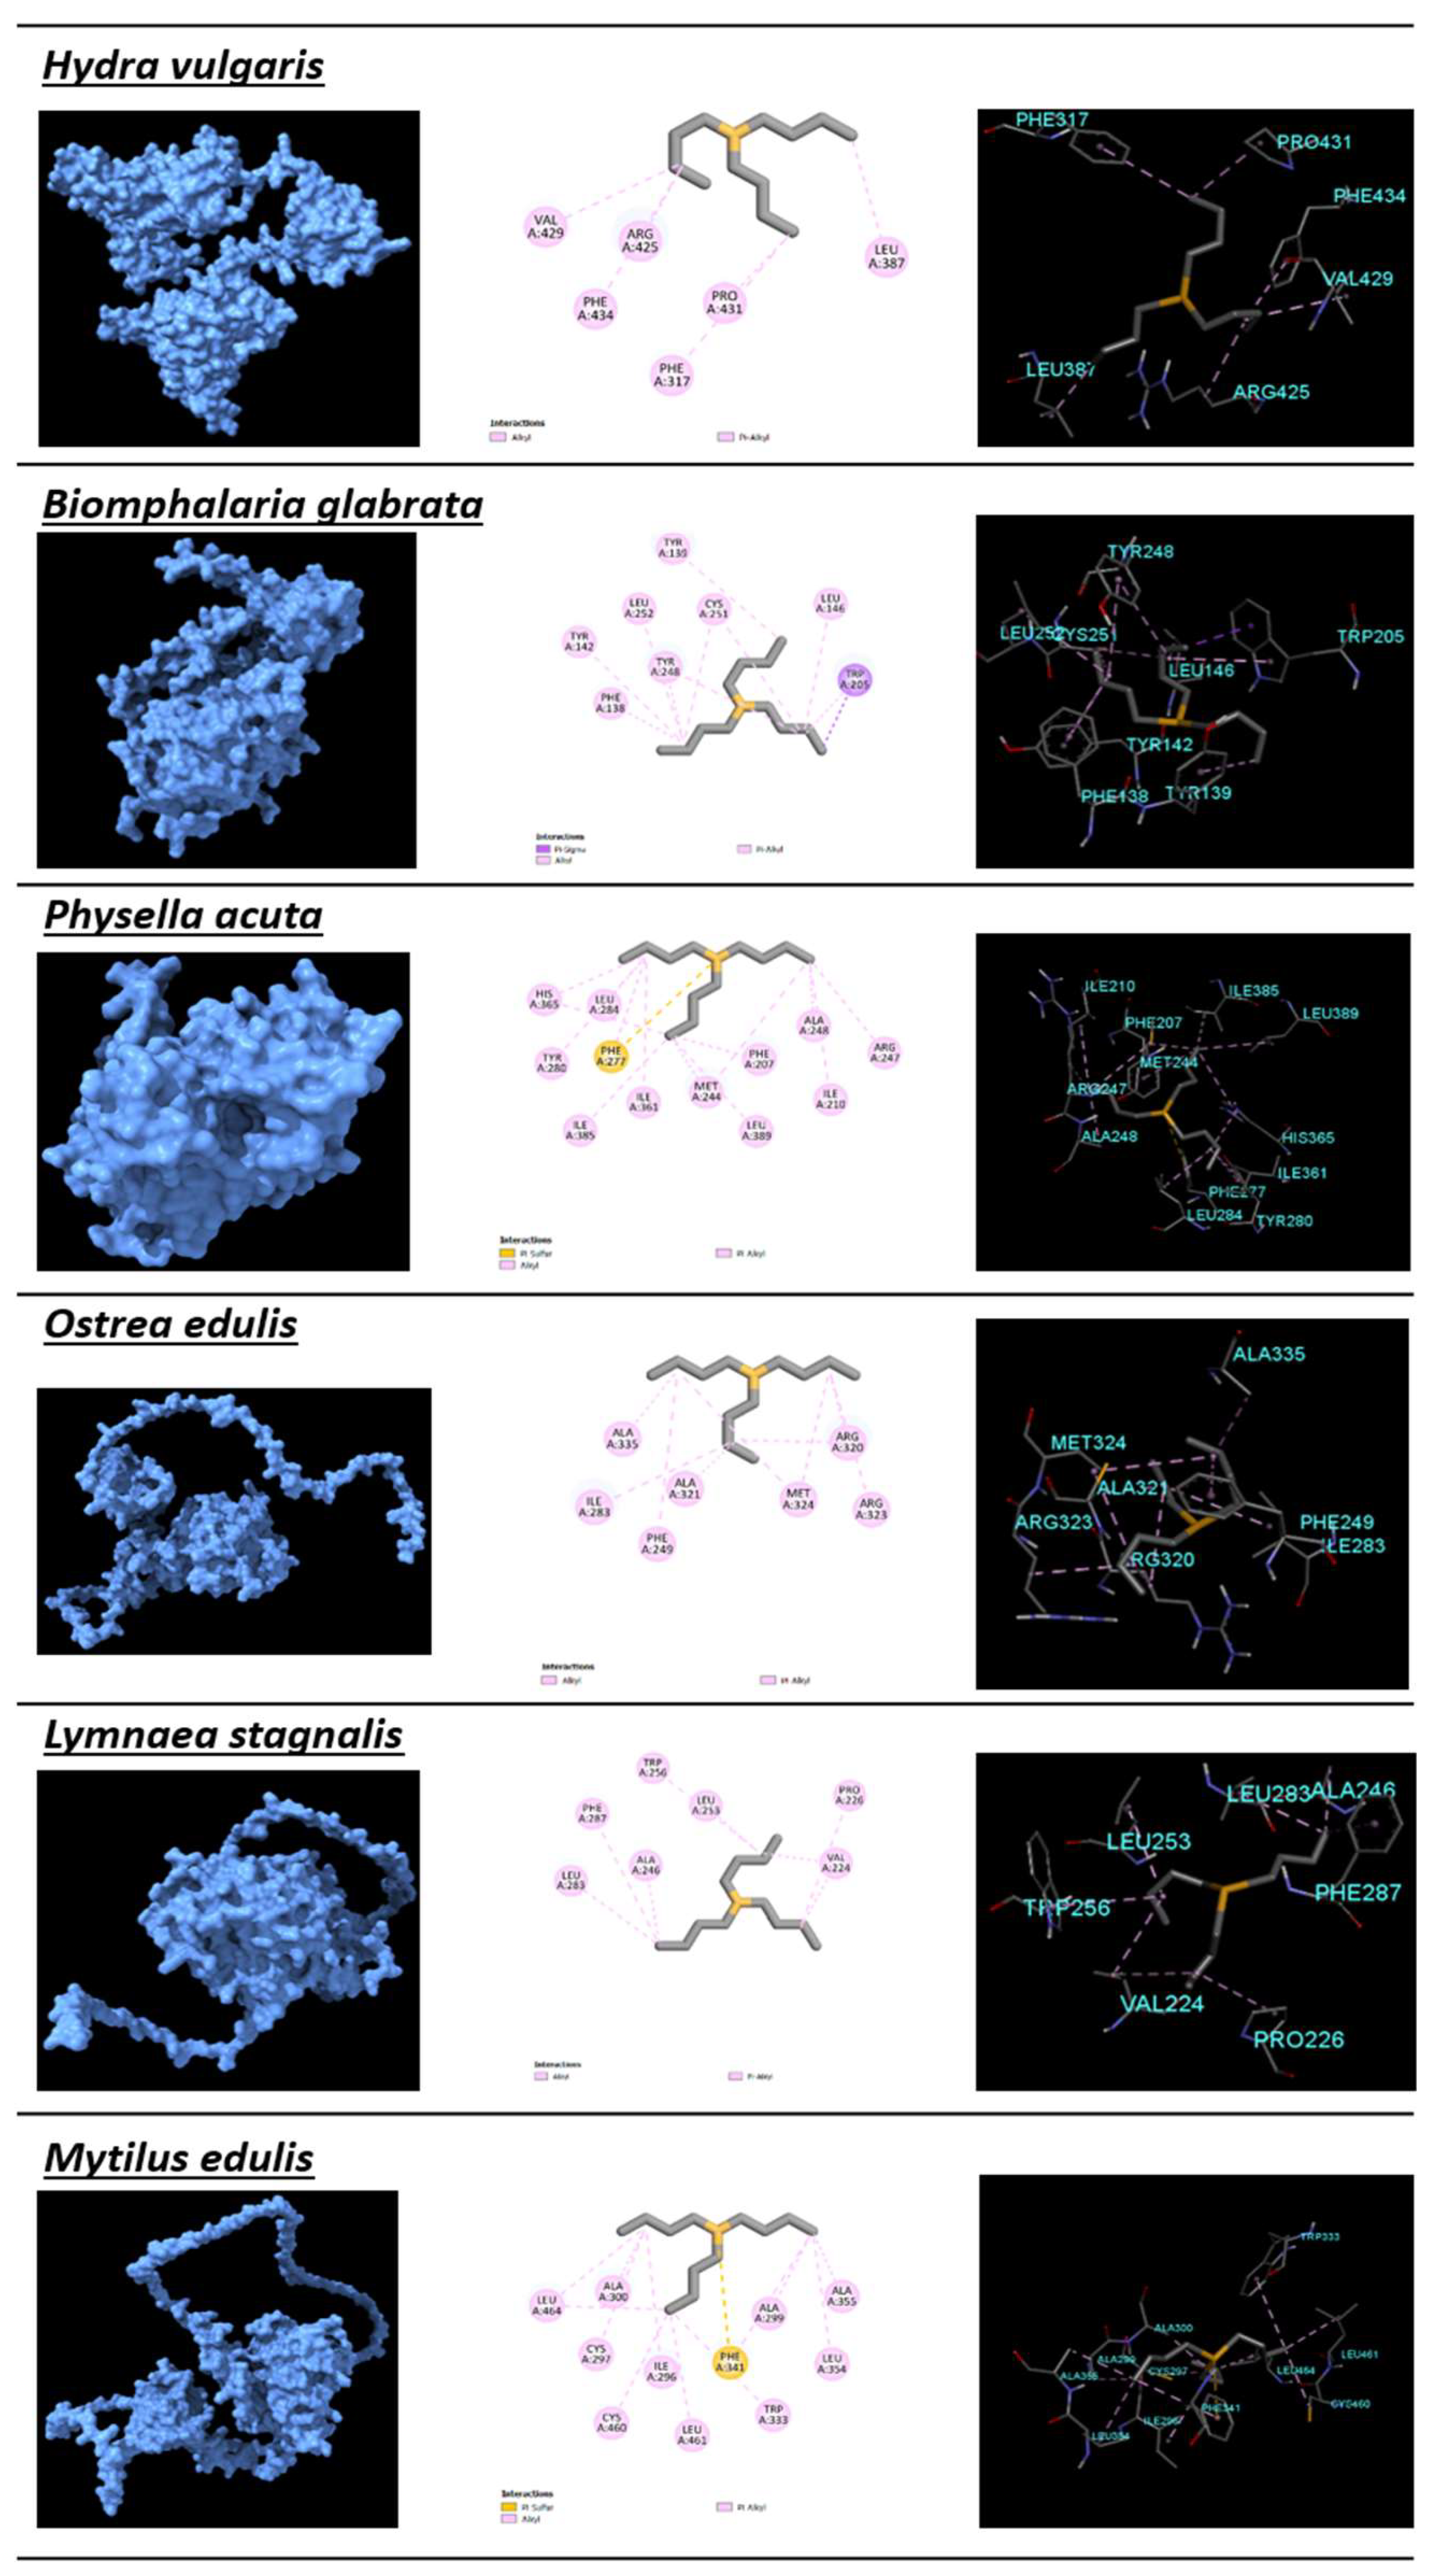
3.3. Protein Modeling
4. Discussion
5. Conclusions
Author Contributions
Funding
Institutional Review Board Statement
Informed Consent Statement
Data Availability Statement
Conflicts of Interest
References
- Byrnes, T.A.; Dunn, R.J.K. Boating- and Shipping-Related Environmental Impacts and Example Management Measures: A Review. J. Mar. Sci. Eng. 2020, 8, 908. [Google Scholar] [CrossRef]
- UNEP; FAO. Draft Decision Guidance Document for Tributyltin Compounds; UNEP: Nairobi, Kenya; FAO: Rome, Italy, 2015. [Google Scholar]
- Sousa, A.C.A.; Coelho, S.D.; Pastorinho, M.R.; Taborda-Barata, L.; Nogueira, A.J.A.; Isobe, T.; Kunisue, T.; Takahashi, S.; Tanabe, S. Levels of TBT and other selected organotin compounds in duplicate diet samples. Sci. Total Environ. 2017, 574, 19–23. [Google Scholar] [CrossRef] [PubMed]
- Lagadic, L.; Katsiadaki, I.; Biever, R.; Guiney, P.D.; Karouna-Renier, N.; Schwarz, T.; Meador, J.P. Tributyltin: Advancing the Science on Assessing Endocrine Disruption with an Unconventional Endocrine-Disrupting Compound. In Reviews of Environmental Contamination and Toxicology; de Voogt, P., Ed.; Springer International Publishing: Cham, Switzerland, 2018; Volume 245, pp. 65–127. [Google Scholar]
- Anastasiou, T.I.; Chatzinikolaou, E.; Mandalakis, M.; Arvanitidis, C. Imposex and organotin compounds in ports of the Mediterranean and the Atlantic: Is the story over? Sci. Total Environ. 2016, 569–570, 1315–1329. [Google Scholar] [CrossRef] [PubMed]
- Sayer, C.D.; Hoare, D.J.; Simpson, G.L.; Henderson, A.C.G.; Liptrot, E.R.; Jackson, M.J.; Appleby, P.G.; Boyle, J.F.; Jones, J.I.; Waldock, M.J. TBT Causes Regime Shift in Shallow Lakes. Environ. Sci. Technol. 2006, 40, 5269–5275. [Google Scholar] [CrossRef]
- Artifon, V.; Castro, Í.B.; Fillmann, G. Spatiotemporal appraisal of TBT contamination and imposex along a tropical bay (Todos os Santos Bay, Brazil). Environ. Sci. Pollut. Res. 2016, 23, 16047–16055. [Google Scholar] [CrossRef]
- Kim, N.S.; Shim, W.J.; Yim, U.H.; Hong, S.H.; Ha, S.Y.; Han, G.M.; Shin, K.-H. Assessment of TBT and organic booster biocide contamination in seawater from coastal areas of South Korea. Mar. Pollut. Bull. 2014, 78, 201–208. [Google Scholar] [CrossRef] [PubMed]
- Furdek, M.; Mikac, N.; Bueno, M.; Tessier, E.; Cavalheiro, J.; Monperrus, M. Organotin persistence in contaminated marine sediments and porewaters: In situ degradation study using species-specific stable isotopic tracers. J. Hazard. Mater. 2016, 307, 263–273. [Google Scholar] [CrossRef] [PubMed]
- Nesci, S.; Ventrella, V.; Trombetti, F.; Pirini, M.; Pagliarani, A. Tributyltin (TBT) and mitochondrial respiration in mussel digestive gland. Toxicol. In Vitro 2011, 25, 951–959. [Google Scholar] [CrossRef]
- Jacobson, T.; Sundelin, B.; Yang, G.; Ford, A.T. Low dose TBT exposure decreases amphipod immunocompetence and reproductive fitness. Aquat. Toxicol. 2011, 101, 72–77. [Google Scholar] [CrossRef]
- Krężel, W.; Rühl, R.; de Lera, A.R. Alternative retinoid X receptor (RXR) ligands. Mol. Cell. Endocrinol. 2019, 491, 110436. [Google Scholar] [CrossRef]
- Durica, D.S.; Wu, X.; Anilkumar, G.; Hopkins, P.M.; Chung, A.C.K. Characterization of crab EcR and RXR homologs and expression during limb regeneration and oocyte maturation. Mol. Cell. Endocrinol. 2002, 189, 59–76. [Google Scholar] [CrossRef]
- Morales, M.; Martínez-Paz, P.; Ozáez, I.; Martínez-Guitarte, J.L.; Morcillo, G. DNA damage and transcriptional changes induced by tributyltin (TBT) after short in vivo exposures of Chironomus riparius (Diptera) larvae. Comp. Biochem. Physiol. Part C Toxicol. Pharmacol. 2013, 158, 57–63. [Google Scholar] [CrossRef]
- Batista, R.M.; Castro, I.B.; Fillmann, G. Imposex and butyltin contamination still evident in Chile after TBT global ban. Sci. Total Environ. 2016, 566–567, 446–453. [Google Scholar] [CrossRef]
- Song, Y.; Villeneuve, D.L.; Toyota, K.; Iguchi, T.; Tollefsen, K.E. Ecdysone Receptor Agonism Leading to Lethal Molting Disruption in Arthropods: Review and Adverse Outcome Pathway Development. Environ. Sci. Technol. 2017, 51, 4142–4157. [Google Scholar] [CrossRef]
- Suno-Uchi, N.; Sasaki, F.; Chiba, S.; Kawata, M. Morphological stasis and phylogenetic relationships in Tadpole shrimps, Triops (Crustacea: Notostraca). Biol. J. Linn. Soc. 1997, 61, 439–457. [Google Scholar] [CrossRef]
- Scholnick, D.A. Sensitivity of Metabolic Rate, Growth, and Fecundity of Tadpole Shrimp Triops longicaudatus to Environmental Variation. Biol. Bull. 1995, 189, 22–28. [Google Scholar] [CrossRef] [PubMed]
- Herrero, J.; Muffato, M.; Beal, K.; Fitzgerald, S.; Gordon, L.; Pignatelli, M.; Vilella, A.J.; Searle, S.M.J.; Amode, R.; Brent, S.; et al. Ensembl comparative genomics resources. Database 2016, 2016, bav096. [Google Scholar] [CrossRef] [PubMed]
- Webb, B.; Sali, A. Comparative Protein Structure Modeling Using MODELLER. Curr. Protoc. Bioinform. 2016, 54, 5–6. [Google Scholar] [CrossRef] [PubMed]
- Öztürk, H.; Özgür, A.; Ozkirimli, E. DeepDTA: Deep drug–target binding affinity prediction. Bioinformatics 2018, 34, i821–i829. [Google Scholar] [CrossRef] [PubMed]
- Olker, J.H.; Elonen, C.M.; Pilli, A.; Anderson, A.; Kinziger, B.; Erickson, S.; Skopinski, M.; Pomplun, A.; LaLone, C.A.; Russom, C.L.; et al. The ECOTOXicology Knowledgebase: A Curated Database of Ecologically Relevant Toxicity Tests to Support Environmental Research and Risk Assessment. Environ. Toxicol. Chem. 2022, 41, 1520–1539. [Google Scholar] [CrossRef]
- Center for Computational Toxicology and Exposure. Species Sensitivity Distribution (SSD) Toolbox, Version v1.0; EPA: Washington, DC, USA, 2020.
- Fox, D.R.; van Dam, R.A.; Fisher, R.; Batley, G.E.; Tillmanns, A.R.; Thorley, J.; Schwarz, C.J.; Spry, D.J.; McTavish, K. Recent Developments in Species Sensitivity Distribution Modeling. Environ. Toxicol. Chem. 2021, 40, 293–308. [Google Scholar] [CrossRef] [PubMed]
- le Maire, A.; Grimaldi, M.; Roecklin, D.; Dagnino, S.; Vivat-Hannah, V.; Balaguer, P.; Bourguet, W. Activation of RXR–PPAR heterodimers by organotin environmental endocrine disruptors. EMBO Rep. 2009, 10, 367–373. [Google Scholar] [CrossRef]
- Morris, G.M.; Huey, R.; Lindstrom, W.; Sanner, M.F.; Belew, R.K.; Goodsell, D.S.; Olson, A.J. AutoDock4 and AutoDockTools4: Automated docking with selective receptor flexibility. J. Comput. Chem. 2009, 30, 2785–2791. [Google Scholar] [CrossRef] [PubMed]
- United States Environmental Protection Agency. Pesticide Ecotoxicity Database (Formerly: Environmental Effects Database (EEDB)), Environmental Fate and Effects Division; United States Environmental Protection Agency: Washington, DC, USA, 1992.
- Becker, E. Derivation of Quality Targets for the Protection of Surface Inland Waters for Organotin Compounds: Dibutyltin Compounds, Tetrabutyltin, Tributyltin Compounds, Triphenyltin Compounds; Draft for the BLAK QZ, Stand 1992, 26, cited in ECOTOX; Federal Environment Agency: Dessau-Roßlau, Germany, 1992. Available online: http://cfpub.epa.gov/ecotox/ (accessed on 22 May 2023).
- Meador, J. An Analysis of Photobehavior of Daphnia Magna Exposed to Tributyltin. In Proceedings of the OCEANS ‘86, Washington, DC, USA, 23–25 September 1986; pp. 1213–1218. [Google Scholar]
- Mackay, D.; McCarty, L.S.; Arnot, J.A. Relationships between exposure and dose in aquatic toxicity tests for organic chemicals. Environ. Toxicol. Chem. 2014, 33, 2038–2046. [Google Scholar] [CrossRef] [PubMed]
- Fargašová, A. Comparison of Tributyltin Compound Effects on the Alga Scenedesmus quadricauda and the Benthic Organisms Tubifex tubifex and Chironomus plumosus. Ecotoxicol. Environ. Saf. 1998, 41, 222–230. [Google Scholar] [CrossRef] [PubMed]
- Fargašová, A. Comparative Study of Ecotoxicological Effect of Triorganotin Compounds on Various Biological Subjects. Ecotoxicol. Environ. Saf. 1997, 36, 38–42. [Google Scholar] [CrossRef] [PubMed]
- Castro, L.F.C.; Lima, D.; Machado, A.; Melo, C.; Hiromori, Y.; Nishikawa, J.; Nakanishi, T.; Reis-Henriques, M.A.; Santos, M.M. Imposex induction is mediated through the Retinoid X Receptor signalling pathway in the neogastropod Nucella lapillus. Aquat. Toxicol. 2007, 85, 57–66. [Google Scholar] [CrossRef]
- Rato, M.; Gaspar, M.B.; Takahashi, S.; Yano, S.; Tanabe, S.; Barroso, C. Inshore/offshore gradients of imposex and organotin contamination in Nassarius reticulatus (L.) along the Portuguese coast. Mar. Pollut. Bull. 2008, 56, 1323–1331. [Google Scholar] [CrossRef]
- Oliveira, I.B.; Richardson, C.A.; Sousa, A.C.; Takahashi, S.; Tanabe, S.; Barroso, C.M. Spatial and temporal evolution of imposex in dogwhelk Nucella lapillus (L.) populations from North Wales, UK. J. Environ. Monit. 2009, 11, 1462–1468. [Google Scholar] [CrossRef]
- Abidli, S.; Santos, M.M.; Lahbib, Y.; Castro, L.F.C.; Reis-Henriques, M.A.; Trigui El Menif, N. Tributyltin (TBT) effects on Hexaplex trunculus and Bolinus brandaris (Gastropoda: Muricidae): Imposex induction and sex hormone levels insights. Ecol. Indic. 2012, 13, 13–21. [Google Scholar] [CrossRef]
- Grimaldi, M.; Boulahtouf, A.; Delfosse, V.; Thouennon, E.; Bourguet, W.; Balaguer, P. Reporter Cell Lines for the Characterization of the Interactions between Human Nuclear Receptors and Endocrine Disruptors. Front. Endocrinol. 2015, 6, 62. [Google Scholar] [CrossRef] [PubMed]
- Scott, A.P. Do mollusks use vertebrate sex steroids as reproductive hormones? II. Critical review of the evidence that steroids have biological effects. Steroids 2013, 78, 268–281. [Google Scholar] [CrossRef] [PubMed]
- Scott, A.P. Do mollusks use vertebrate sex steroids as reproductive hormones? Part I: Critical appraisal of the evidence for the presence, biosynthesis and uptake of steroids. Steroids 2012, 77, 1450–1468. [Google Scholar] [CrossRef] [PubMed]
- Oberdörster, E.; McClellan-Green, P. Mechanisms of imposex induction in the mud snail, Ilyanassa obsoleta: TBT as a neurotoxin and aromatase inhibitor. Mar. Environ. Res. 2002, 54, 715–718. [Google Scholar] [CrossRef]
- Jordão, R.; Casas, J.; Fabrias, G.; Campos, B.; Piña, B.; Lemos, M.F.L.; Soares, A.M.V.M.; Tauler, R.; Barata, C. Obesogens beyond Vertebrates: Lipid Perturbation by Tributyltin in the Crustacean Daphnia magna. Environ. Health Perspect. 2015, 123, 813–819. [Google Scholar] [CrossRef] [PubMed]
- Simões, L.A.R.; Vogt, É.L.; da Costa, C.S.; de Amaral, M.; Hoff, M.L.M.; Graceli, J.B.; Vinagre, A.S. Effects of tributyltin (TBT) on the intermediate metabolism of the crab Callinectes sapidus. Mar. Pollut. Bull. 2022, 182, 114004. [Google Scholar] [CrossRef] [PubMed]
- Cooke, G.M.; Forsyth, D.S.; Bondy, G.S.; Tachon, R.; Tague, B.; Coady, L. Organotin Speciation and Tissue Distribution in Rat Dams, Fetuses, and Neonates Following Oral Administration of Tributyltin Chloride. J. Toxicol. Environ. Health Part A 2008, 71, 384–395. [Google Scholar] [CrossRef] [PubMed]
- Parmentier, K.F.V.; Verhaegen, Y.; De Witte, B.P.; Hoffman, S.; Delbare, D.H.R.; Roose, P.M.; Hylland, K.D.E.; Burgeot, T.; Smagghe, G.J.; Cooreman, K. Tributyltin: A Bottom–Up Regulator of the Crangon crangon Population? Front. Mar. Sci. 2019, 6, 633. [Google Scholar] [CrossRef]
- Wolf, G. Is 9-Cis-Retinoic Acid the Endogenous Ligand for the Retinoic Acid-X Receptor? Nutr. Rev. 2006, 64, 532–538. [Google Scholar] [CrossRef]
- Wang, Y.H.; Kwon, G.; Li, H.; LeBlanc, G.A. Tributyltin Synergizes with 20-Hydroxyecdysone to Produce Endocrine Toxicity. Toxicol. Sci. 2011, 123, 71–79. [Google Scholar] [CrossRef]
- Neelima, H.; Srinivasa, R.B.; Ramachandra, R.P. Crustacean Molting: Regulation and Effects of Environmental Toxicants. J. Marine Sci. Res. Dev. 2017, 7, 236. [Google Scholar]
- Nagabhushanam, R.; Reddy, P.S.; Sarojini, R. Tributyltin oxide induced alterations in exuvial weight and calcium content of the prawn, Caridina rajadhari. Proc. Anim. Sci. 1990, 99, 397–400. [Google Scholar] [CrossRef]
- Mangelsdorf, D.J.; Borgmeyer, U.; Heyman, R.A.; Zhou, J.Y.; Ong, E.S.; Oro, A.E.; Kakizuka, A.; Evans, R.M. Characterization of three RXR genes that mediate the action of 9-cis retinoic acid. Genes Dev. 1992, 6, 329–344. [Google Scholar] [CrossRef]
- Caffrey, D.R.; Somaroo, S.; Hughes, J.D.; Mintseris, J.; Huang, E.S. Are protein–protein interfaces more conserved in sequence than the rest of the protein surface? Protein Sci. 2004, 13, 190–202. [Google Scholar] [CrossRef]
- Egea, P.F.; Mitschler, A.; Rochel, N.; Ruff, M.; Chambon, P.; Moras, D. Crystal structure of the human RXRα ligand-binding domain bound to its natural ligand: 9-cis retinoic acid. EMBO J. 2000, 19, 2592–2601. [Google Scholar] [CrossRef] [PubMed]


| Taxa | Species | Database | Accession Number | SWISS-MODEL |
|---|---|---|---|---|
| Chordata | Homo sapiens | UniProt | P19793 | Q05343.1.A |
| Arthropoda | Acartia tonsa | UniProt | A0A4Y5X195 | A0A4Y5X195.1.A |
| Americamysis bahia | NCBI | DD410574 | C3UZC9.1.A | |
| Crangon crangon | UniProt | C4N541 | A0A171LJQ0.1.A | |
| Culex pipiens | UniProt | A0A8D8KFP5 | A4F2F2.1.A | |
| Daphnia magna | UniProt | A4F2F2 | A4F2F2.1.A | |
| Hyalella azteca | UniProt | A0A979FUF3 | A0A6A0GRD0.1.A | |
| Leptuca pugilator | UniProt | O76246 | U6BGA5.1.A | |
| Triops longicaudatus | THIS STUDY | E9HV90.1.A | ||
| Cnidaria | Hydra vulgaris | UniProt | A0A8B7EC76 | T2MGI4.1.A |
| Mollusca | Biomphalaria glabrata | UniProt | A0A182ZWX8 | A0A182ZWX8.1.A |
| Crassostrea gigas | UniProt | K1PXX3 | K1PXX3.1.A | |
| Lymnaea stagnalis | UniProt | Q5I7G2 | Q8T5C6.1.A | |
| Mytilus edulis | UniProt | A0A8S3SHA1 | A0A6J8CUS3.1.A | |
| Ostrea edulis | NCBI | XM_048899976 | A0A6M2XXE3.1.A | |
| Physella acuta | NCBI | GHAL01006477 | A0A433TMS9.1.A | |
| Rotifera | Brachionus plicatilis | UniProt | A0A3M7RAV1 | A0A221CB62.1.A |
| Species | VAL | ILE | TRP | ASN | LEU | PHE | ILE | VAL | ILE | PHE | VAL | CYS | HIS | LEU | PHE | |
| 265 | 268 | 305 | 306 | 309 | 313 | 324 | 342 | 345 | 346 | 349 | 432 | 435 | 436 | 439 | ||
| Homo sapiens | Reference | V | I | W | N | L | F | I | V | I | F | V | C | H | L | F |
| Hydra vulgaris | Cnidaria | F | I | W | K | F | V | H | F | V | R | I | V | Q | L | V |
| Biomphalaria glabrata | Mollusca | I | M | T | T | M | A | I | L | Y | A | L | H | V | L | L |
| Physella acuta | Mollusca | V | M | S | T | M | A | I | F | Y | A | L | H | V | L | W |
| Ostrea edulis | Mollusca | L | L | S | S | M | A | I | Q | Y | T | L | H | M | L | L |
| Lymnaea stagnalis | Mollusca | V | I | W | N | L | F | I | V | I | F | V | C | H | L | F |
| Mytilus edulis | Mollusca | V | I | W | N | L | F | I | V | I | F | V | C | H | L | F |
| Crassostrea gigas | Mollusca | V | I | W | N | L | F | I | V | I | F | V | C | H | L | F |
| Triops longicaudatus | Arthropoda | L | I | W | N | L | F | I | V | I | F | V | C | H | F | F |
| Hyalella azteca | Arthropoda | F | I | T | Q | I | A | I | M | I | T | V | N | Q | C | V |
| Daphnia magna | Arthropoda | F | I | S | S | M | C | I | V | T | A | S | N | M | C | L |
| Americamysis bahia | Arthropoda | F | I | S | S | M | A | I | M | A | T | E | N | Q | C | I |
| Culex pipiens | Arthropoda | F | I | S | S | M | M | I | M | T | I | D | N | M | C | L |
| Crangon crangon | Arthropoda | F | I | S | S | M | A | I | L | S | A | A | N | M | C | L |
| Leptuca pugilator | Arthropoda | F | I | S | S | M | A | I | L | S | A | I | N | M | C | L |
| Acartia tonsa | Arthropoda | I | M | S | S | I | T | I | I | D | M | E | N | F | S | L |
| Brachionus plicatilis | Rotifera | W | F | I | F | Y | V | I | I | L | T | R | I | K | C | L |
| Species | RMSD | Inhibition Const.(µM) | Ligand Efficiency | Interaction Amino Acids | Pocket Amino Acids | SSD Rank | Docking Rank | |
|---|---|---|---|---|---|---|---|---|
| Hydra vulgaris | Cnidaria | −5.11 | 179.67 | 0.39 | PHE317, LEU387, ARG425, VAL429, PRO431, PHE434 | ALA382, GLN383, CYS384, PRO385, LEU424, HIS428 | 3 | 14 |
| Biomphalaria glabrata | Mollusca | −5.85 | 51.71 | 0.45 | PHE138, TYR139, TYR142, LEU146, TRP205, TYR248, CYS251, LEU252 | SER143, LEU202, GLU201 | 10 | 6 |
| Physella acuta | Mollusca | −6.07 | 35.53 | 0.47 | PHE207, ILE210, MET244, ARG247, ALA248, PHE277, TYR280, LEU284, ILE361, HIS365, ILE385, LEU389 | THR241, SER245, PHE261 | 16 | 4 |
| Ostrea edulis | Mollusca | −5.39 | 111.63 | 0.41 | PHE249, ILE283, ARG320, ALA321, ARG323, MET324, ALA335 | GLU248, PRO250, MET317, ILE332, LEU334, MET379 | 13 | 11 |
| Lymnaea stagnalis | Mollusca | −7.12 | 6.06 | 0.55 | VAL224, PRO226, ALA246, LEU253, TRP256, LEU283, PHE287 | GLU221,ASP225, ALA245, GLN249, THR252, GLY286, ARG290, ALA301, ARG345 | 9 | 1 |
| Mytilus edulis | Mollusca | −5.81 | 55.09 | 0.45 | ILE296, CYS297, ALA299, ALA300, TRP333, PHE341, LEU354, ALA355, CYS460, LEU461, LEU464 | GLN303, ASN334, LEU337, ILE338, ARG344, LEU479 | 8 | 8 |
| Crassostrea gigas | Mollusca | −6.77 | 10.91 | 0.52 | VAL233, PRO235, ALA255, LEU262, LEU292, PHE296 | GLU230, GLU234, ALA254, GLN258, THR261, TRP265, GLY295, ARG299, ARG354 | 14 | 2 |
| Triops longicaudatus | Arthropoda | −6.31 | 23.75 | 0.49 | ALA204, TRP238, LEU242, ILE243, PHE246, ALA260, VAL282, CYS365, PHE369 | ILE201, THR205, GLN208, ASN239, LEU259 | 12 | 3 |
| Hyalella azteca | Arthropoda | −584 | 52.7 | 0.45 | VAL455, PHE456, ILE529, ALA533, ARG536, ILE544, LEU570 | ILE488, MET491, THR492, GLU454, THR495, MET530, ARG532, SER547, TYR557 | 6 | 7 |
| Daphnia magna | Arthropoda | −5.07 | 191.61 | 0.39 | MET536, CYS578, PHE591, TYR602, Val 607, LEU614, MET698, LEU702, LEU709 | PHE530, ILE533,THR534, THR537, THR540, MET574, MET575, THR610, ASN695, CYS699, LEU713, TRP717 | 5 | 15 |
| Americamysis bahia | Arthropoda | −5.65 | 71.6 | 0.43 | LEU356, PRO357, ILE386, MET424, ALA428, ILE439, TYR441 | GLU355, ALA387, ALA390, LEU393, ARG427, ARG431, LEU440, PHE442, TYR452, LEU465 | 4 | 9 |
| Culex pipiens | Arthropoda | −5.59 | 79.39 | 0.43 | PRO315, PRO316, ALA319, LYS349, TRP352, TYR353 | CYS312, ASP313, PRO314, HIS317, ALA345, TYR348 | 1 | 10 |
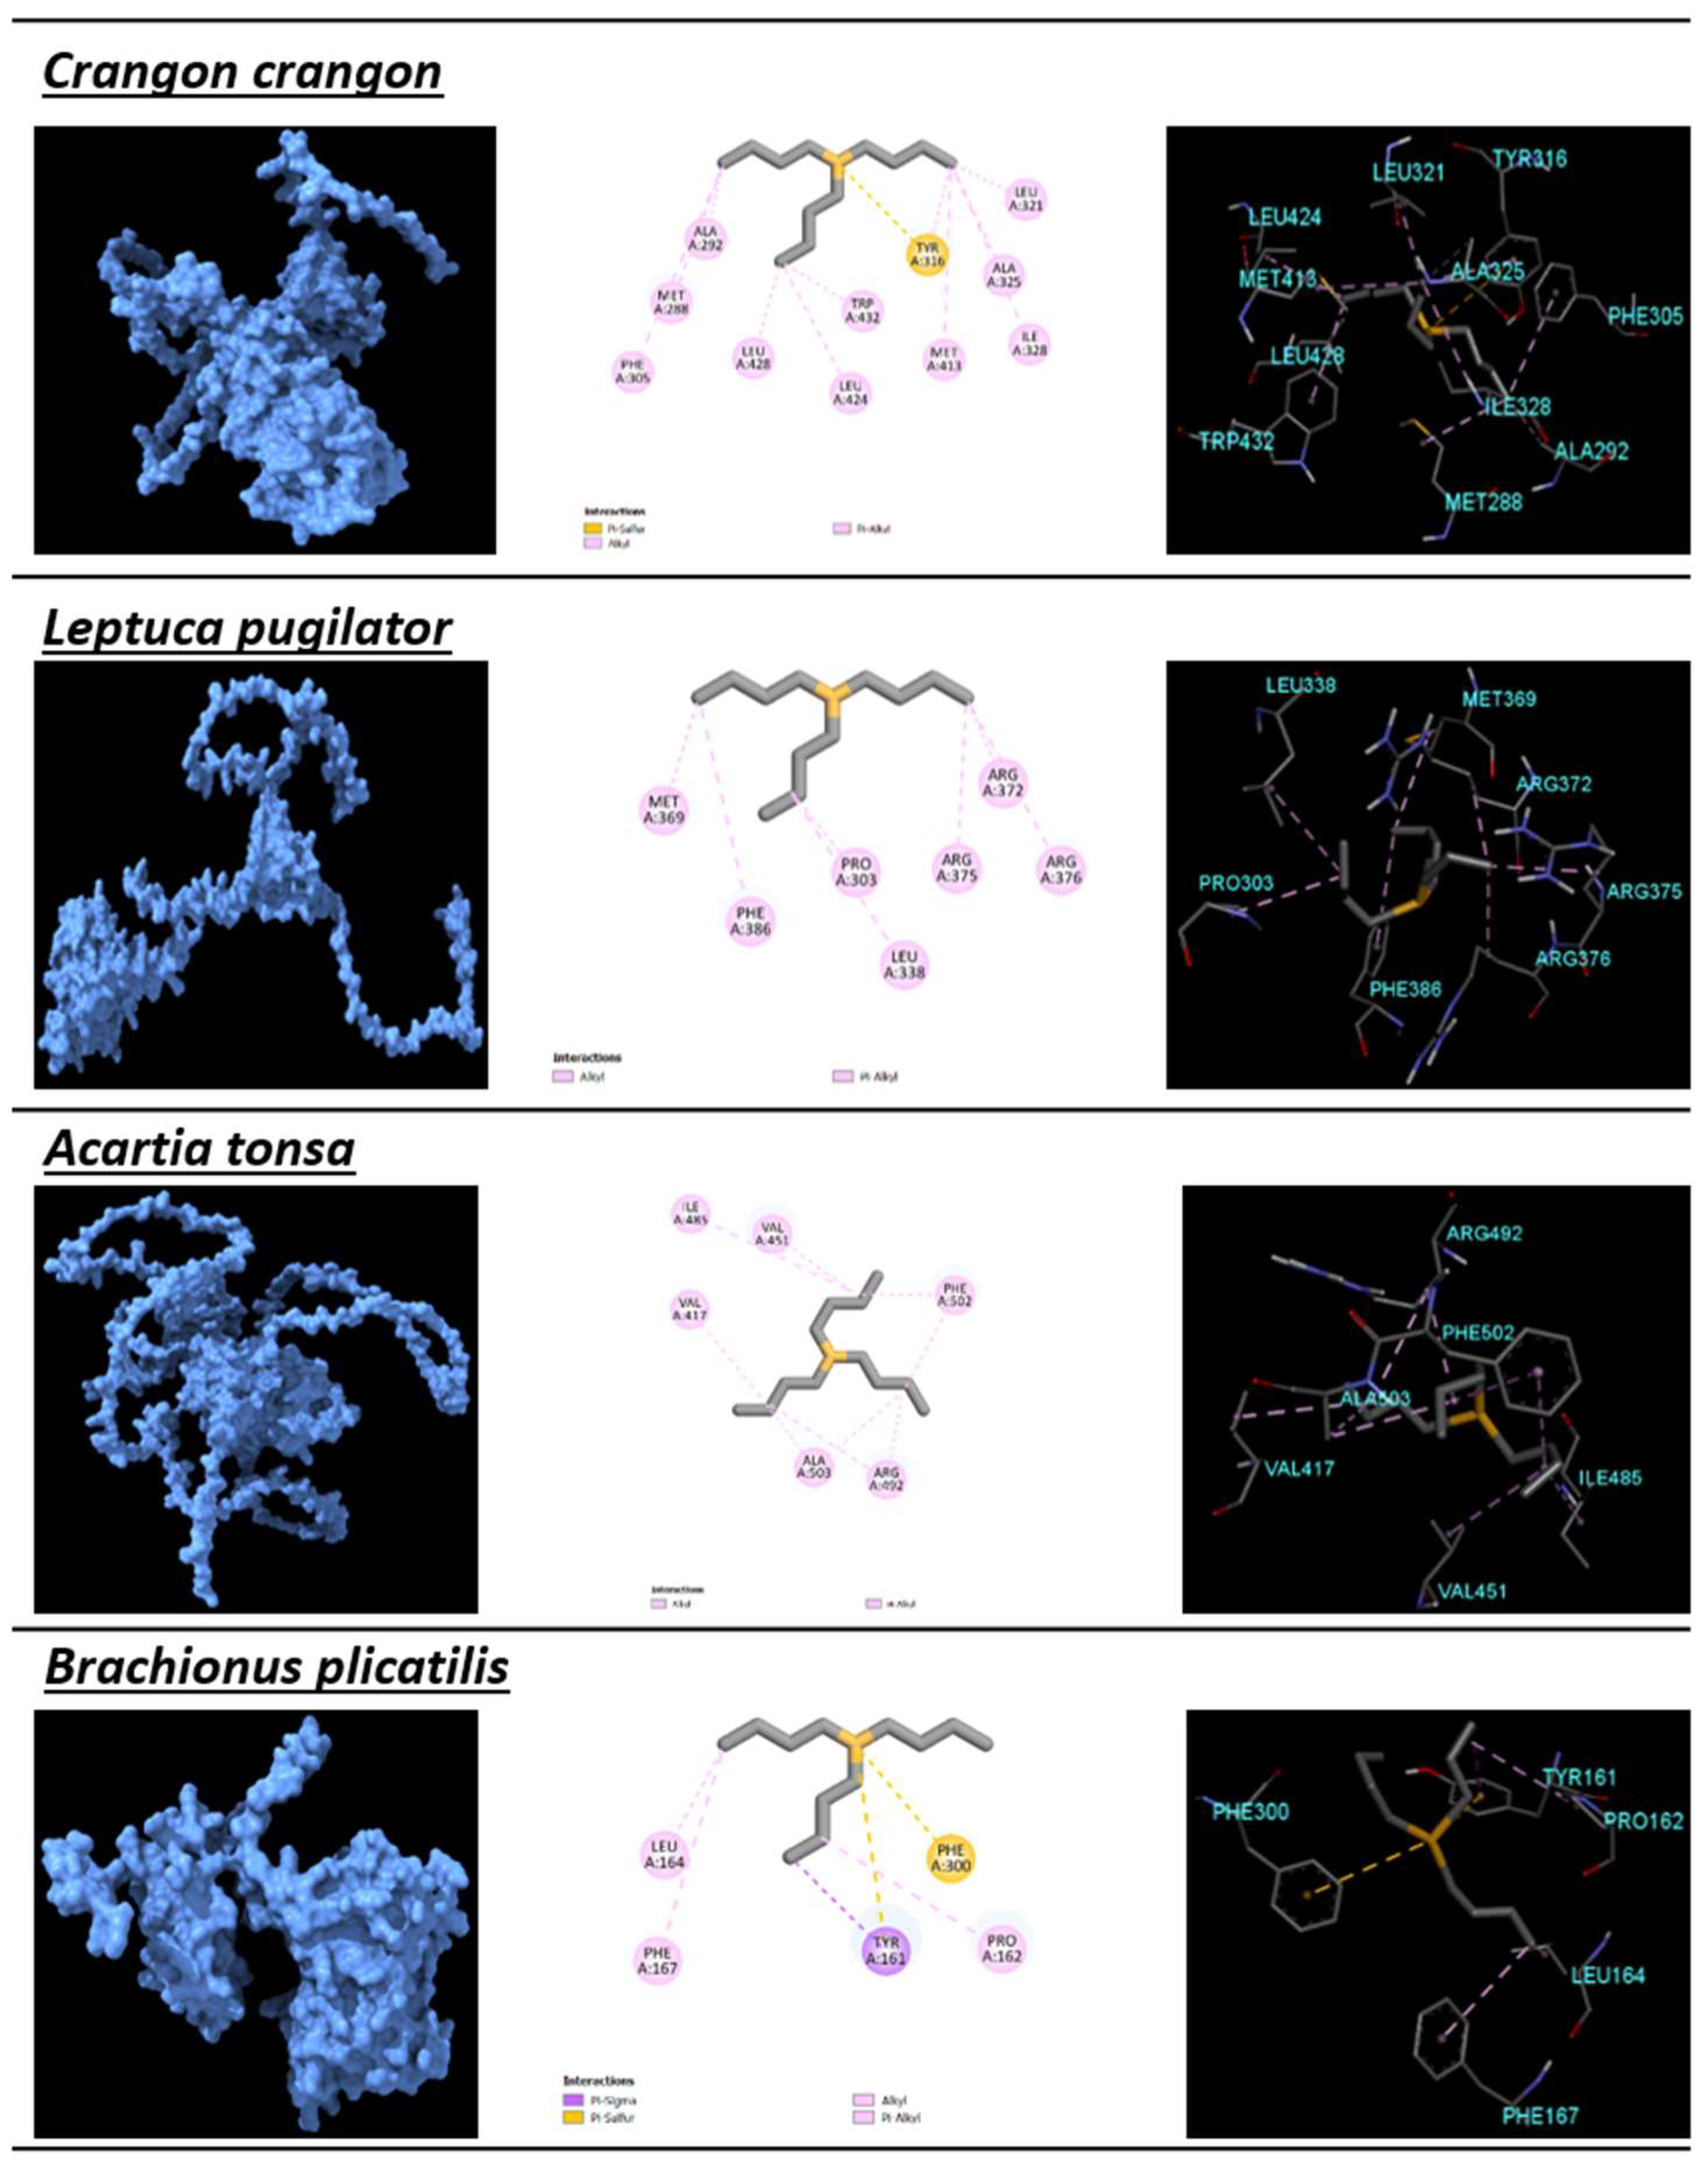
| Crangon crangon | Arthropoda | −5.12 | 176.12 | 0.39 | MET288, ALA292, PHE305, TYR316, LEU321, ALA325, ILE328, MET413, LEU424, LEU428, TRP432 | ILE247, TYR248, THR251, TYR254, MET289, SER324 | 11 | 13 |
| Leptuca pugilator | Arthropoda | −5.88 | 48.62 | 0.45 | MET369, MET370, ALA373, TYR397, LEU402, LEU409, MET494, TRP513 | ILE328, THR329, THR332, ILE384, PHE386, SER405, ALA406, CYS495, LEU498, LEU505, LEU509 | 15 | 5 |
| Acartia tonsa | Arthropoda | −5.26 | 140.33 | 0.4 | VAL417, VAL451, ILE485, ARG492, PHE502, ALA503 | GLU416, PRO418, MET444, SER447, THR448, ARG488, THR489, VAL501 | 2 | 12 |
| Brachionus plicatilis | Rotifera | −4.54 | 246.87 | 0.38 | TYR161, PRO162, LEU164, PHE167, PHE300 | LYS159, ASP163, TYR166, ILE301, ASN302, GLY303, ALA337, ASN340 | 7 | 16 |
Disclaimer/Publisher’s Note: The statements, opinions and data contained in all publications are solely those of the individual author(s) and contributor(s) and not of MDPI and/or the editor(s). MDPI and/or the editor(s) disclaim responsibility for any injury to people or property resulting from any ideas, methods, instructions or products referred to in the content. |
© 2023 by the authors. Licensee MDPI, Basel, Switzerland. This article is an open access article distributed under the terms and conditions of the Creative Commons Attribution (CC BY) license (https://creativecommons.org/licenses/by/4.0/).
Share and Cite
Ferreira, N.G.d.C.; Chessa, A.; Abreu, I.O.; Teles, L.O.; Kille, P.; Carvalho, A.P.; Guimarães, L. Toxic Relationships: Prediction of TBT’s Affinity to the Ecdysteroid Receptor of Triops longicaudatus. Toxics 2023, 11, 937. https://doi.org/10.3390/toxics11110937
Ferreira NGdC, Chessa A, Abreu IO, Teles LO, Kille P, Carvalho AP, Guimarães L. Toxic Relationships: Prediction of TBT’s Affinity to the Ecdysteroid Receptor of Triops longicaudatus. Toxics. 2023; 11(11):937. https://doi.org/10.3390/toxics11110937
Chicago/Turabian StyleFerreira, Nuno Gonçalo de Carvalho, Adriano Chessa, Isabel Oliveira Abreu, Luís Oliva Teles, Peter Kille, António Paulo Carvalho, and Laura Guimarães. 2023. "Toxic Relationships: Prediction of TBT’s Affinity to the Ecdysteroid Receptor of Triops longicaudatus" Toxics 11, no. 11: 937. https://doi.org/10.3390/toxics11110937