
Carbohydrate-Deficient Transferrin (CDT) as a Biomarker of Alcohol Abuse: A Retrospective Study of the Italian Drinking Trend among Drivers from 2016 to 2022
 , , , ,
Abstract
:1. Introduction
2. Materials and Methods
2.1. Subjects and Samples
2.2. HPLC Analysis
2.3. HPLC Methods
2.4. Data Analysis
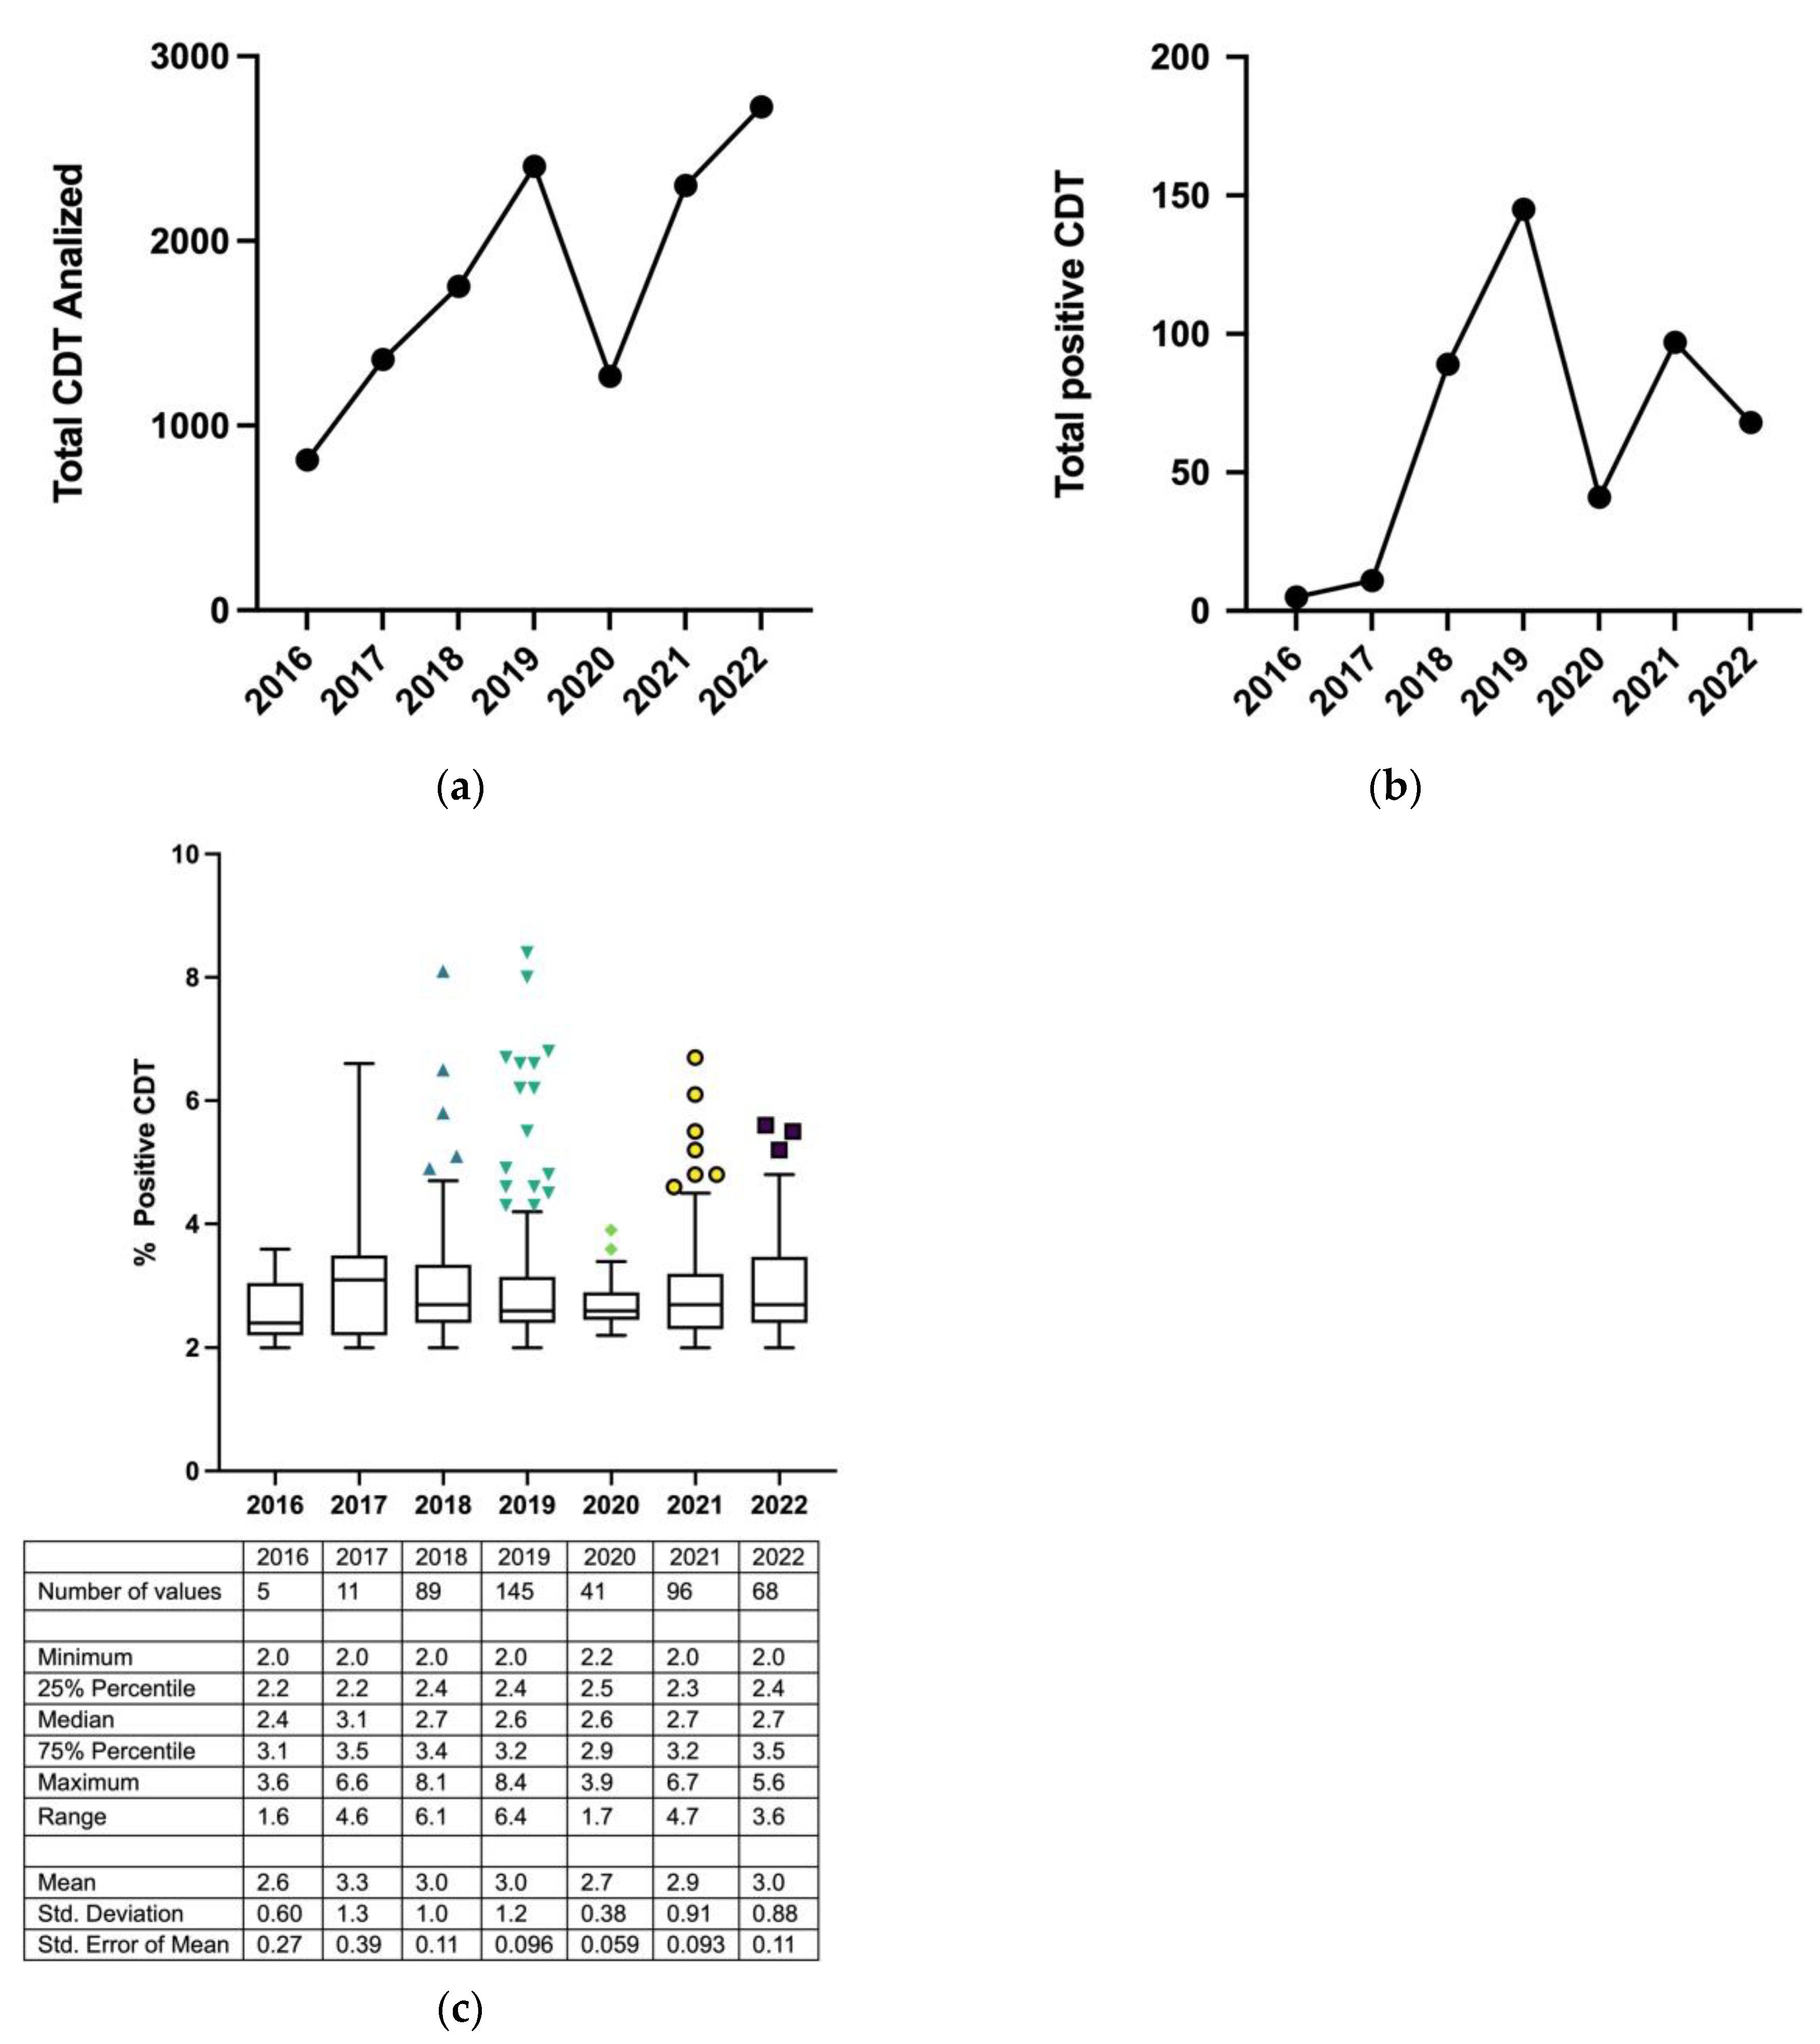
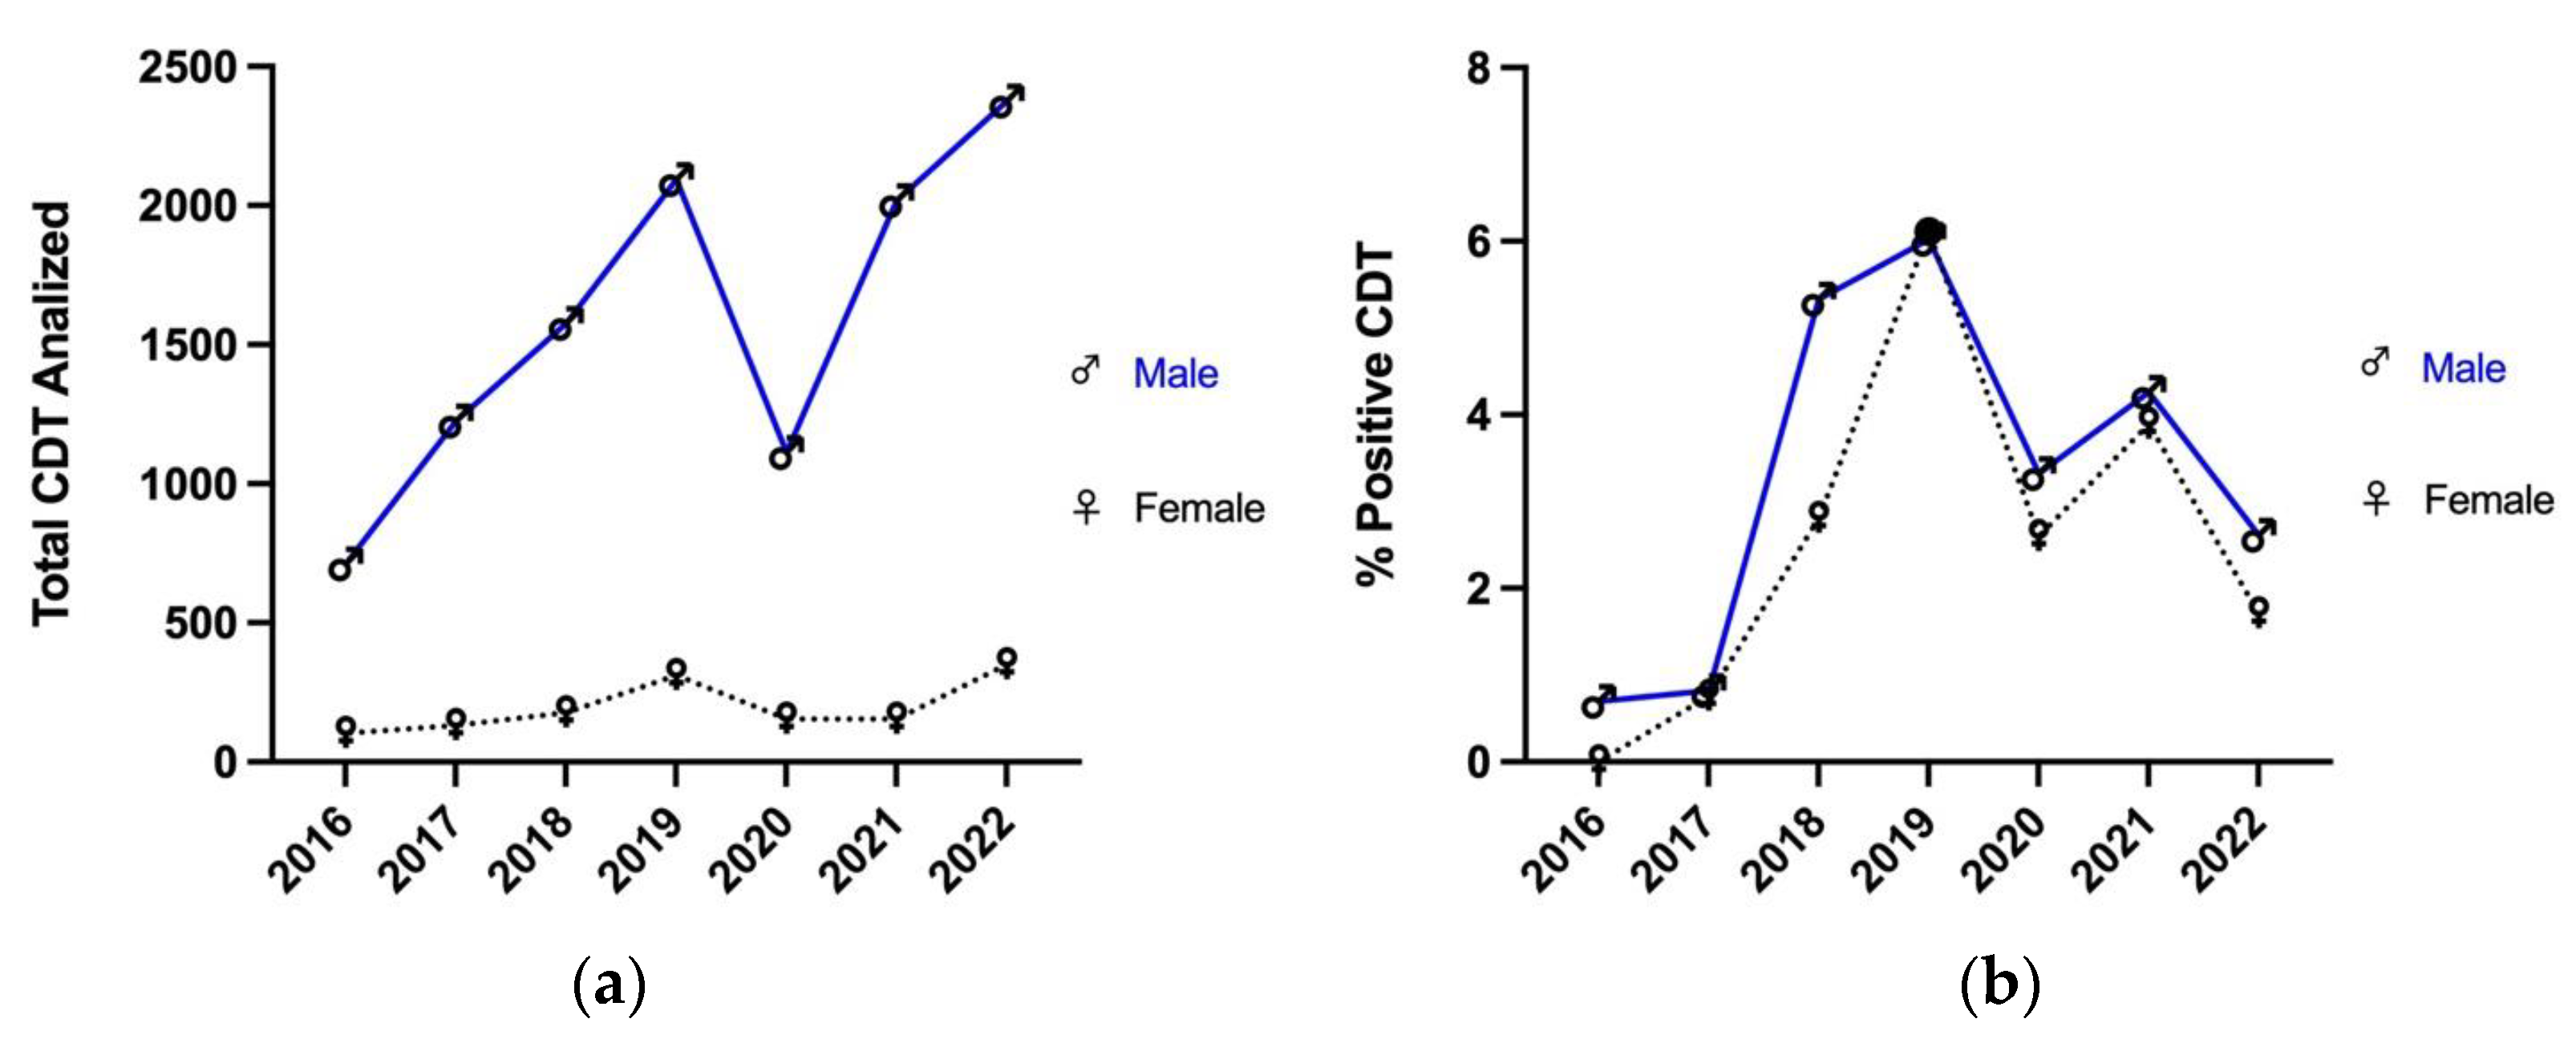
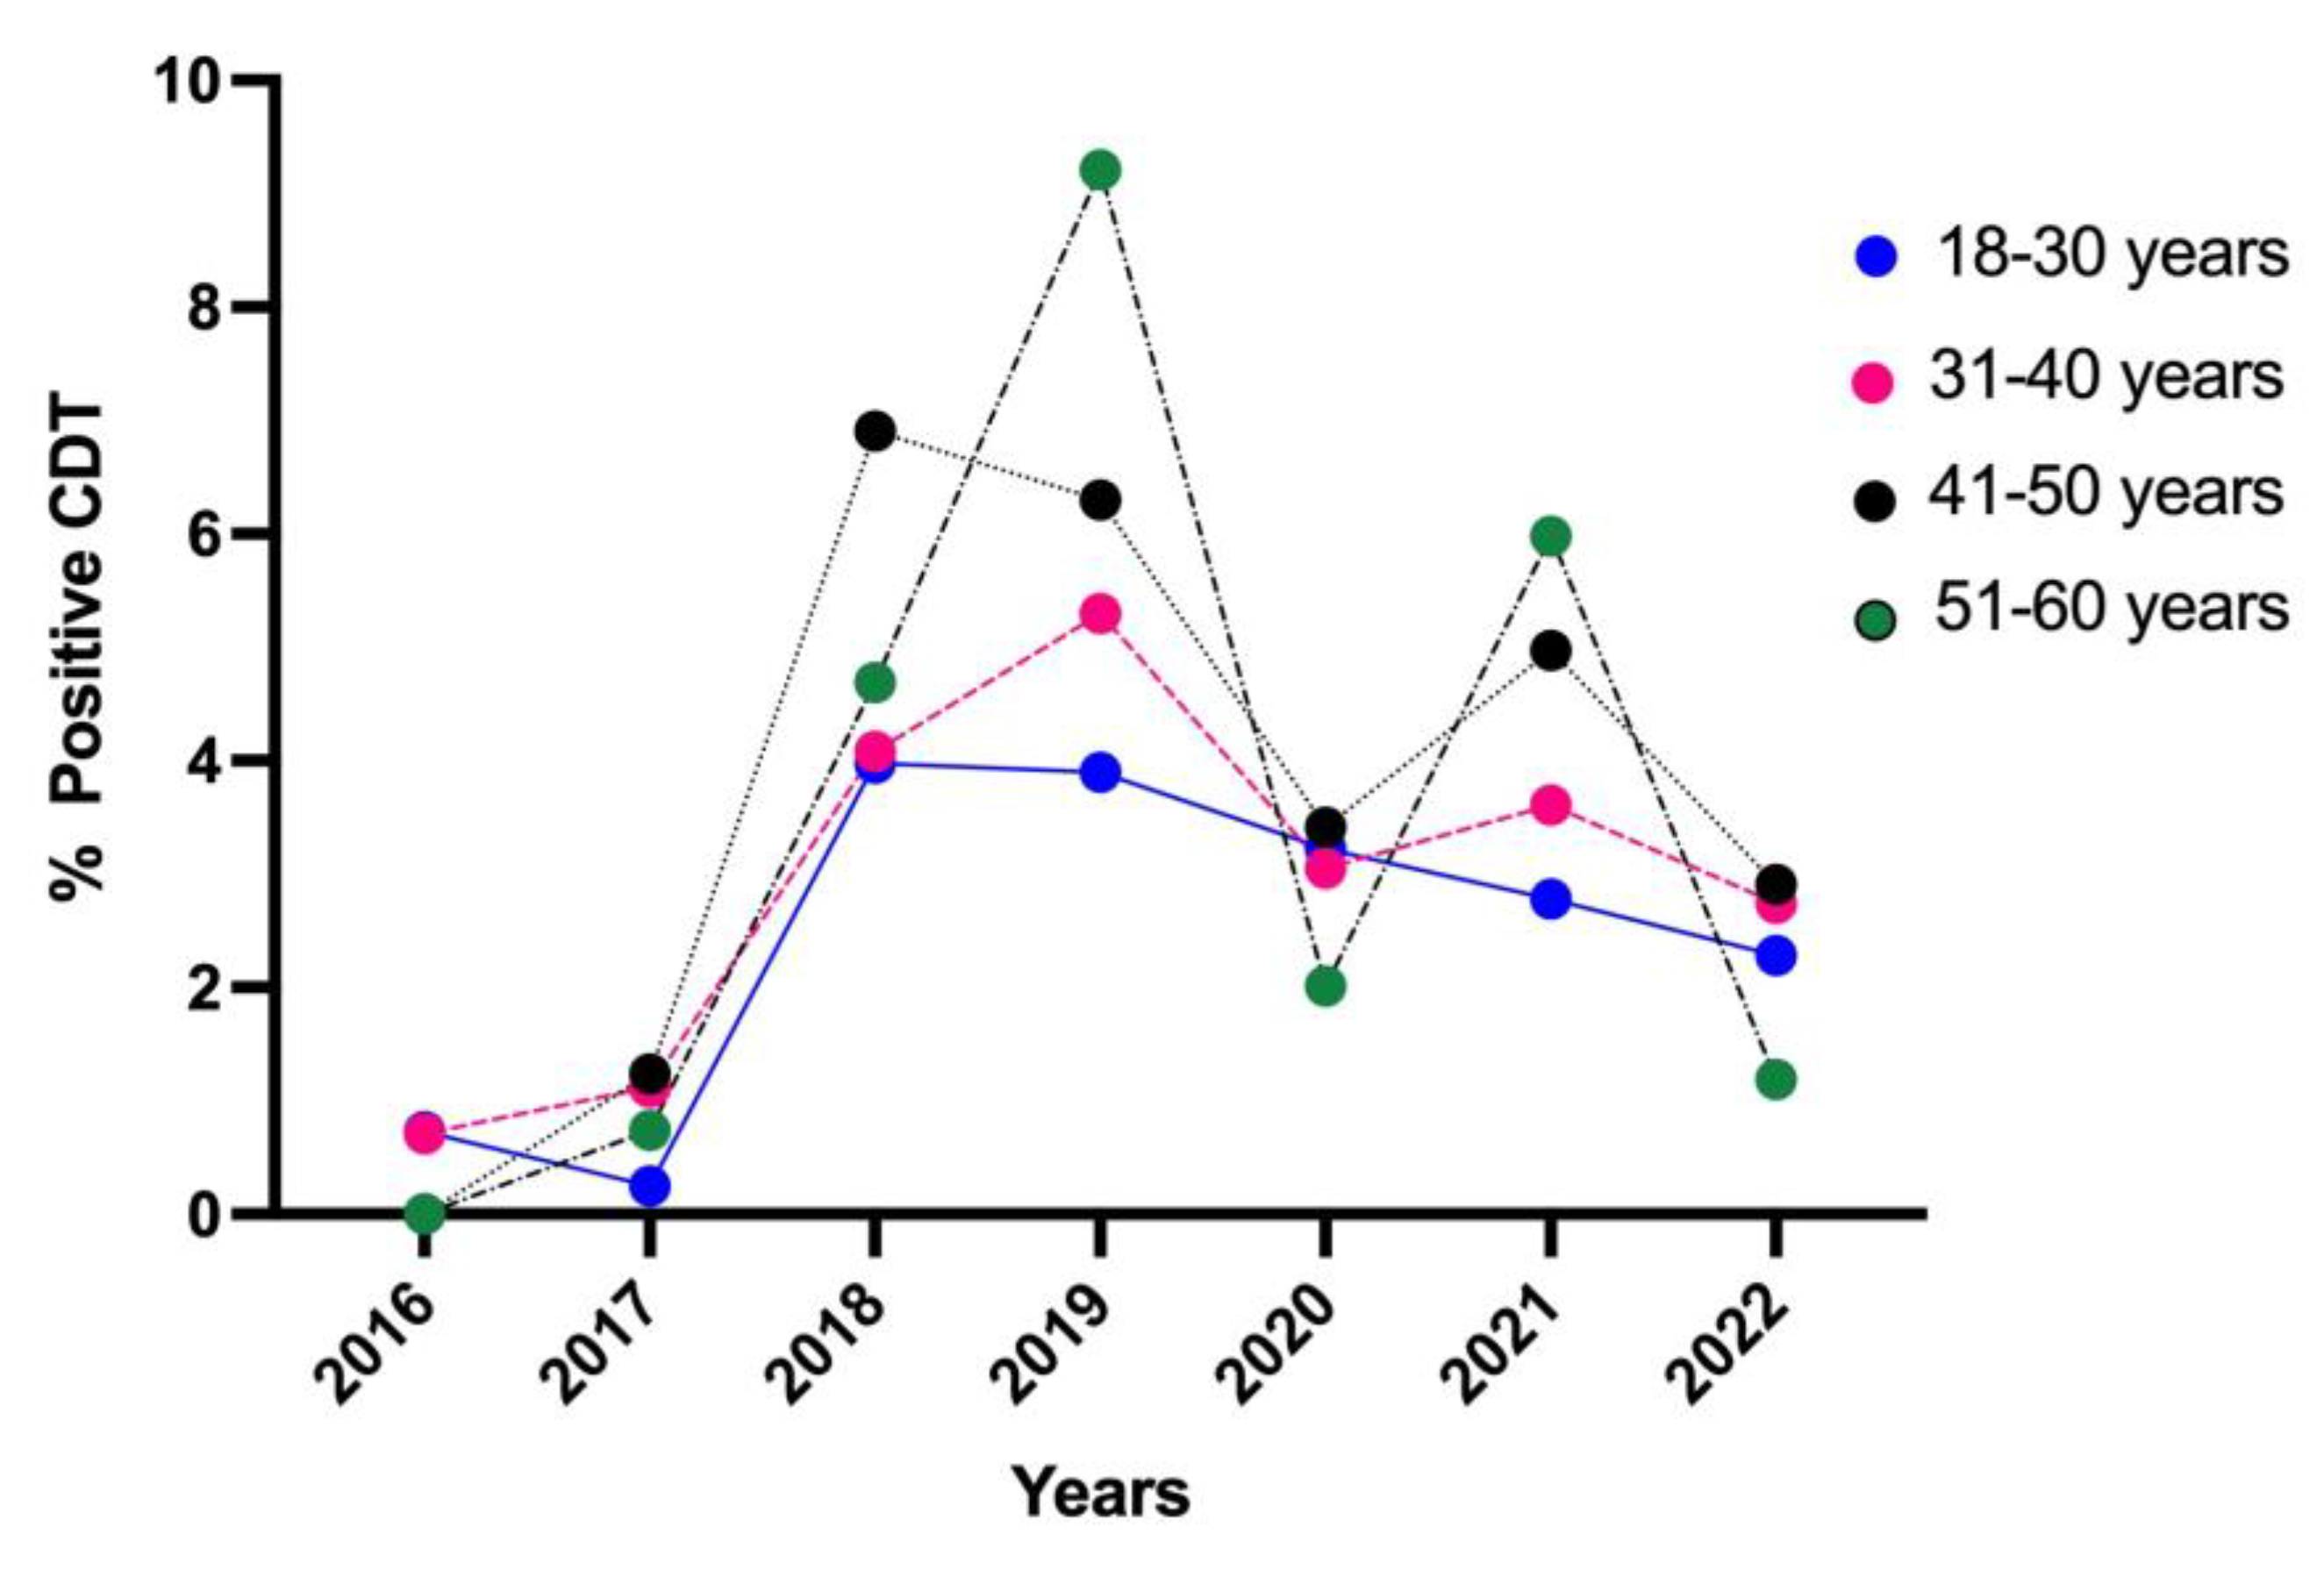
3. Results
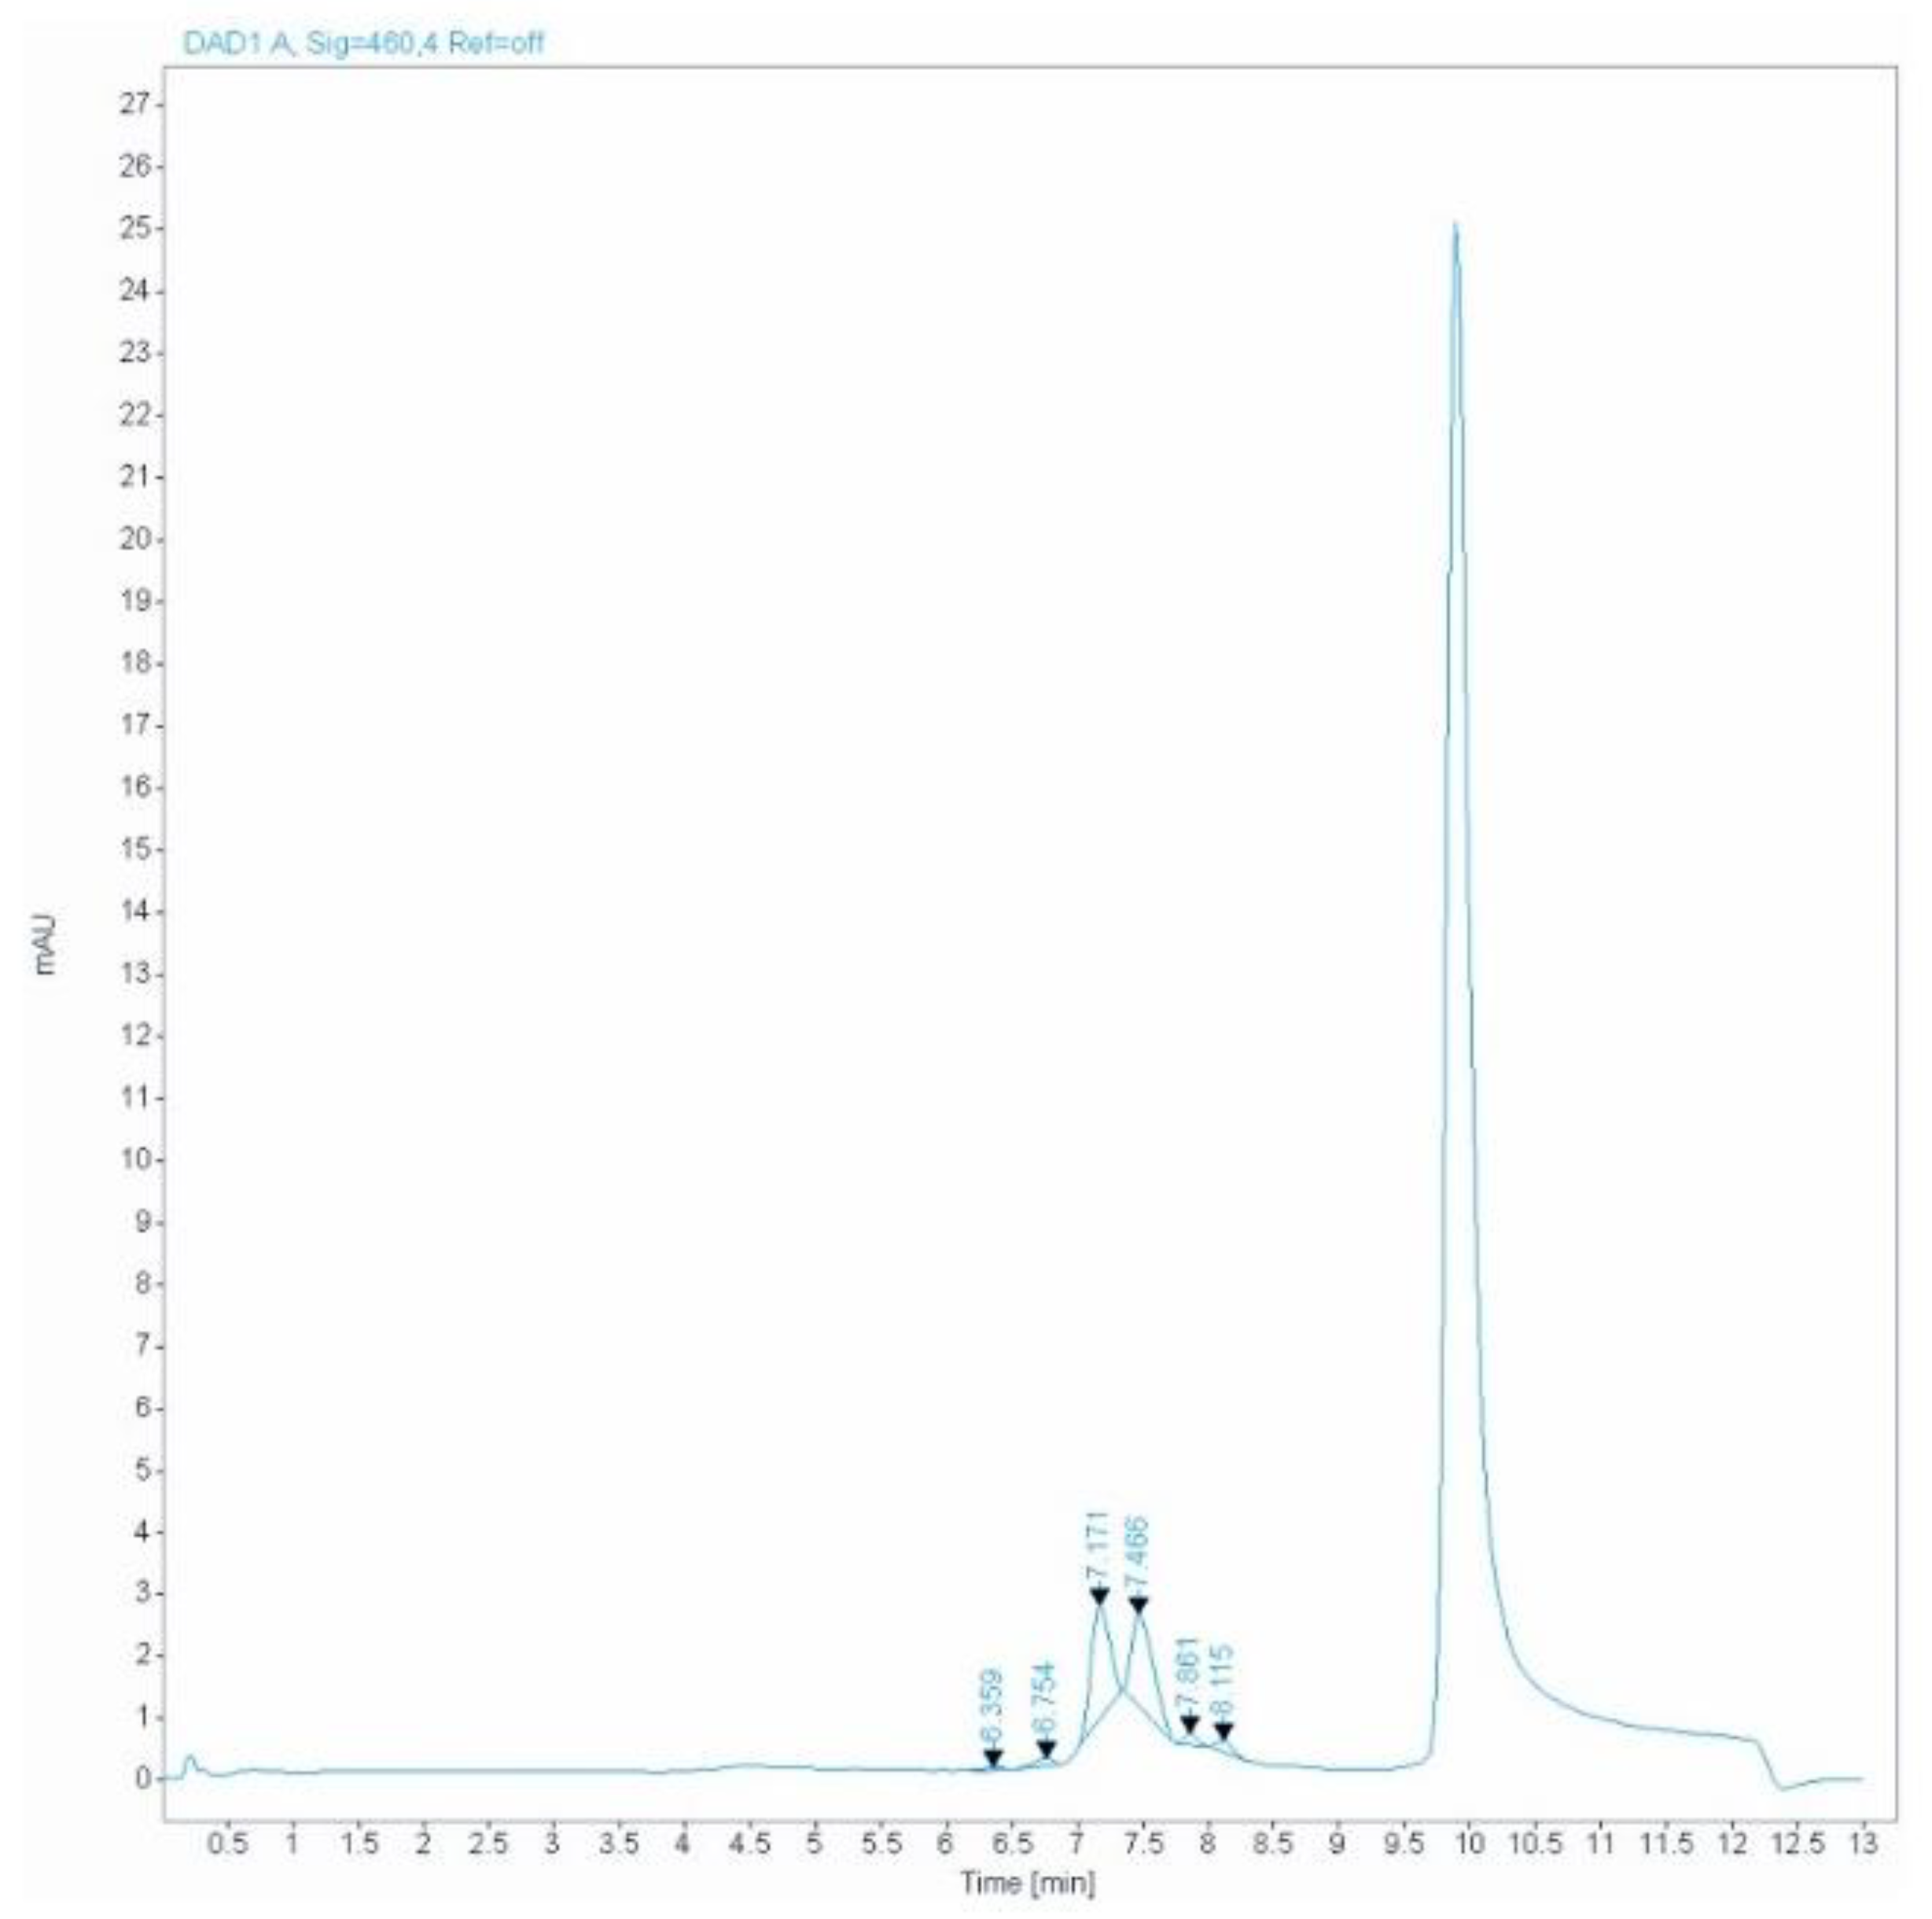
Genetic Tf Variants
4. Discussion
5. Conclusions
Author Contributions
Funding
Institutional Review Board Statement
Informed Consent Statement
Data Availability Statement
Conflicts of Interest
References
- World Health Organization (WHO). Accelerating Progress on Prevention and Control of NCDs Including Oral Health and Integrated Eye Care in the WHO South-East Asia Region. Published 2022. Available online: https://apps.who.int/iris/handle/10665/343753 (accessed on 1 September 2023).
- Treglia, M.; Pallocci, M.; Ricciardi-Tenore, G.; Baretti, F.; Bianco, G.; Castellani, P.; Pizzuti, F.; Ottaviano, V.; Passalacqua, P.; Leonardi, C.; et al. Policies and Toxicological Screenings for No Drug Addiction: An Example from the Civil Aviation Workforce. Int. J. Environ. Res. Public Health 2022, 19, 1501. [Google Scholar] [CrossRef]
- James Cave, O.B.E.F.R.C.G.P. Why measure carbohydrate deficient transferrin? Drug Ther. Bull. 2017, 55, 69–72. [Google Scholar] [CrossRef]
- Maurer, J.; Vergalito, E.; Prior, A.-F.; Donzé, N.; Thomas, A.; Augsburger, M. Suspicion of driving under the influence of alcohol or drugs: Cross sectional analysis of drug prevalence in the context of the Swiss legislation. Forensic. Sci. Int. 2021, 329, 111081. [Google Scholar] [CrossRef] [PubMed]
- Hannuksela, M.L.; Liisanantti, M.K.; Nissinen, A.E.T.; Savolainen, M.J. Biochemical markers of alcoholism. Clin. Chem. Lab. Med. 2007, 45, 953–961. [Google Scholar] [CrossRef] [PubMed]
- Helander, A.; Nordin, G. Insufficient Standardization of a Direct Carbohydrate-Deficient Transferrin Immunoassay. Clin. Chem. 2008, 54, 1090–1092. [Google Scholar] [CrossRef] [PubMed]
- Bortolotti, F.; Sorio, D.; Bertaso, A.; Tagliaro, F. Analytical and diagnostic aspects of carbohydrate deficient transferrin (CDT): A critical review over years 2007–2017. J. Pharm. Biomed. Anal. 2018, 147, 2–12. [Google Scholar] [CrossRef] [PubMed]
- Henriksen, J.H.; Grønbæk, M.; Møller, S.; Bendtsen, F.; Becker, U. Carbohydrate deficient transferrin (CDT) in alcoholic cirrhosis: A kinetic study. J. Hepatol. 1997, 26, 287–292. [Google Scholar] [CrossRef]
- Dasgupta, A. Mean Corpuscular Volume and Carbohydrate-Deficient Transferrin as Alcohol Biomarkers. In Alcohol and Its Biomarkers; Elsevier: Amsterdam, The Netherlands, 2015; pp. 139–162. [Google Scholar] [CrossRef]
- Gonzalo, P.; Radenne, S.; Gonzalo, S. Biomarkers of chronic alcohol misuse. Curr. Biomark. Find. 2014, 4, 9–22. [Google Scholar] [CrossRef]
- Fleming, M.F.; Anton, R.F.; Spies, C.D. A Review of Genetic, Biological, Pharmacological, and Clinical Factors That Affect Carbohydrate-Deficient Transferrin Levels. Alcohol. Clin. Exp. Res. 2004, 28, 1347–1355. [Google Scholar] [CrossRef]
- Liang, S.-S.; He, Y.; Huang, Z.-G.; Jia, C.-Y.; Gan, W. Evaluation of the diagnostic utility of carbohydrate-deficient transferrin in chronic alcoholism. Medicine 2021, 100, e24467. [Google Scholar] [CrossRef]
- Hahn, J.A.; Bwana, M.B.; Javors, M.A.; Martin, J.N.; Emenyonu, N.I.; Bangsberg, D.R. Biomarker Testing to Estimate Under-Reported Heavy Alcohol Consumption by Persons with HIV Initiating ART in Uganda. AIDS Behav. 2010, 14, 1265–1268. [Google Scholar] [CrossRef]
- Kim, S.M.; Kim, J.S.; Kim, K.M.; Pack, H.J.; Lee, D.H.; Kim, S.S.; Jung, J.G. Carbohydrate-deficient Transferrin as a Marker of Heavy Drinking in Korean Males. J. Korean Med. Sci. 2007, 22, 652. [Google Scholar] [CrossRef] [PubMed]
- McDonald, H.; Borinskya, S.; Kiryanov, N.; Gil, A.; Helander, A.; Leon, D.A. Comparative performance of biomarkers of alcohol consumption in a population sample of working-aged men in Russia: The Izhevsk Family Study. Addiction 2013, 108, 1579–1589. [Google Scholar] [CrossRef] [PubMed]
- Madhubala, V. Serum Carbohydrate Deficient Transferrin as A Sensitive Marker in Diagnosing Alcohol Abuse: A Case—Control Study. J. Clin. Diagn. Res. 2013, 7, 197–200. [Google Scholar] [CrossRef] [PubMed]
- De Sio, S.; Tittarelli, R.; Di Martino, G.; Buomprisco, G.; Perri, R.; Bruno, G.; Pantano, F.; Mannocchi, G.; Marinelli, E.; Cedrone, F. Alcohol consumption and employment: A cross-sectional study of office workers and unemployed people. PeerJ 2020, 8, e8774. [Google Scholar] [CrossRef] [PubMed]
- Sharma, P.; Arora, A. Clinical presentation of alcoholic liver disease and non-alcoholic fatty liver disease: Spectrum and diagnosis. Transl. Gastroenterol. Hepatol. 2020, 5, 19. [Google Scholar] [CrossRef] [PubMed]
- Morinaga, M.; Kon, K.; Uchiyama, A.; Fukada, H.; Fukuhara, K.; Yaginuma, R.; Nakadera, E.; Yamashina, S.; Ikejima, K. Carbohydrate-deficient transferrin is a sensitive marker of alcohol consumption in fatty liver disease. Hepatol. Int. 2022, 16, 348–358. [Google Scholar] [CrossRef]
- Sogawa, K.; Iida, F.; Kawshima, Y.; Yamada, M.; Satoh, M.; Sanda, A.; Takizawa, H.; Maruyama, K.; Wada, Y.; Nomura, F. Evaluation of serum carbohydrate-deficient transferrin by HPLC and MALDI-TOF MS. Clin. Chim. Acta 2015, 448, 8–12. [Google Scholar] [CrossRef]
- European Commission. Alcohol Interlocks. Available online: https://road-safety.transport.ec.europa.eu/statistics-and-analysis/statistics-and-analysis-archive/esafety/alcohol-interlocks_en (accessed on 7 September 2023).
- Kenan, N.; Husand, S.; Helander, A. Importance of HPLC confirmation of problematic carbohydrate-deficient transferrin (CDT) results from a multicapillary electrophoresis routine method. Clin. Chim. Acta 2010, 411, 1945–1950. [Google Scholar] [CrossRef]
- Arndt, T.; van der Meijden, B.B.; Wielders, J.P.M. Atypical serum transferrin isoform distribution in liver cirrhosis studied by HPLC, capillary electrophoresis and transferrin genotyping. Clin. Chim. Acta 2008, 394, 42–46. [Google Scholar] [CrossRef]
- Veronesi, A.; Cariani, E.; Trenti, T.; Rota, C. Carbohydrate-deficient transferrin: Utility of HPLC in handling atypical samples uninterpretable by capillary electrophoresis. Alcohol Alcohol. 2019, 54, 510–515. [Google Scholar] [CrossRef]
- Bianchi, V.; Ivaldi, A.; Raspagni, A.; Arfini, C.; Vidali, M. Pregnancy and Variations of Carbohydrate-Deficient Transferrin Levels Measured by the Candidate Reference HPLC Method. Alcohol Alcohol. 2011, 46, 123–127. [Google Scholar] [CrossRef] [PubMed]
- Perret, R.; Froehlich, F.; Lavanchy, D.; Henry, H.; Bachman, C.; Pécoud, A.; Bianchi, L.; Gonvers, J.J. Is carbohydrate-deficient transferrin a specific marker for alcohol abuse? A study in patients with chronic viral hepatitis. Alcohol. Clin. Exp. Res. 1997, 21, 1337–1342. [Google Scholar] [CrossRef] [PubMed]
- Stauber, R.E.; Vollmann, H.; Pesserl, I.; Jauk, B.; Lipp, R.; Halwachs, G.; Wilders-Truschnig, M. Carbohydrate-Deficient Transferrin in Healthy Women: Relation to Estrogens and Iron Status. Alcohol. Clin. Exp. Res. 1996, 20, 1114–1117. [Google Scholar] [CrossRef] [PubMed]
- Chrostek, L.; Cylwik, B.; Gruszewska, E.; Panasiuk, A.; Szmitkowski, M. N-Latex CDT Results in Liver Diseases. Alcohol Alcohol. 2012, 47, 428–432. [Google Scholar] [CrossRef] [PubMed]
- GTFI-SIMLA. TRANSFERRINA CARBOIDRATO CARENTE (CARBOHYDRATE-DEFICIENT TRANSFERRIN, CDT) Strategie Analitiche ed Interpretative. Available online: https://www.gtfi.it/wp-content/uploads/2022/06/LineeGuida-SIBioC-GTFI-SIMLA_CDT-rev01-2015.pdf (accessed on 4 September 2023).
- Appenzeller, B.M.R.; Schneider, S.; Yegles, M.; Maul, A.; Wennig, R. Drugs and chronic alcohol abuse in drivers. Forensic. Sci. Int. 2005, 155, 83–90. [Google Scholar] [CrossRef] [PubMed]
- Bortolotti, F.; Trettene, M.; Gottardo, R.; Bernini, M.; Ricossa, M.C.; Tagliaro, F. Carbohydrate-deficient transferrin (CDT): A reliable indicator of the risk of driving under the influence of alcohol when determined by capillary electrophoresis. Forensic. Sci. Int. 2007, 170, 175–178. [Google Scholar] [CrossRef] [PubMed]
- Law 23 March 2016, No. 41—The Crime of Vehicular Homicide and the Crime of Road Injuries. Published 2016. Available online: https://www.gazzettaufficiale.it/eli/id/2016/03/24/16G00048/sg (accessed on 4 September 2023).
- Legislative Decree 30 April 1992, No 285- Art. 186 Driving under the Influence of Alcohol. Published 1992. Available online: https://www.gazzettaufficiale.it/atto/serie_generale/caricaArticolo?art.progressivo=0&art.idArticolo=186&art.versione=14&art.codiceRedazionale=092G0306&art.dataPubblicazioneGazzetta=1992-05-18&art.idGruppo=11&art.idSottoArticolo1=10&art.idSottoArticolo=1& (accessed on 4 September 2023).
- Legislative Decree 30 April 1992, No 285—Art. 186-bis. Available online: https://www.gazzettaufficiale.it/atto/serie_generale/caricaArticolo?art.versione=6&art.idGruppo=11&art.flagTipoArticolo=0&art.codiceRedazionale=092G0306&art.idArticolo=186&art.idSottoArticolo=2&art.idSottoArticolo1=10&art.dataPubblicazioneGazzetta=1992-05 (accessed on 4 September 2023).
- Conigrave, K.M.; Davies, P.; Haber, P.; Whitfield, J.B. Traditional markers of excessive alcohol use. Addiction 2003, 98, 31–43. [Google Scholar] [CrossRef]
- Eureka. CDT Test in Serum by UV-Fast-Monoreagent. Published 2021. Available online: https://www.eurekakit.com/wp-content/uploads/2021/09/CDT_brochure_2021.pdf (accessed on 4 September 2023).
- Schellenberg, F.; Wielders, J.; Anton, R.; Bianchi, V.; Deenmamode, J.; Weykamp, C.; Whitfield, J.; Jeppsson, J.-O.; Helander, A. IFCC approved HPLC reference measurement procedure for the alcohol consumption biomarker carbohydrate-deficient transferrin (CDT): Its validation and use. Clin. Chim. Acta 2017, 465, 91–100. [Google Scholar] [CrossRef]
- Porpiglia, N.M.; Tagliaro, F.; Micciolo, R.; Canal, L.; Musile, G.; Bortolotti, F. New evidence of high association between carbohydrate deficient transferrin (CDT) and alcohol-related road traffic accidents. A retrospective study on 929 injured drivers. Forensic. Sci. Int. 2022, 340, 111438. [Google Scholar] [CrossRef]
- Chikritzhs, T.; Livingston, M. Alcohol and the Risk of Injury. Nutrients 2021, 13, 2777. [Google Scholar] [CrossRef]
- Pruckner, N.; Hinterbuchinger, B.; Fellinger, M.; König, D.; Waldhoer, T.; Lesch, O.M.; Gmeiner, A.; Vyssoki, S.; Vyssoki, B. Alcohol-Related Mortality in the WHO European Region: Sex-Specific Trends and Predictions. Alcohol Alcohol. 2019, 54, 593–598. [Google Scholar] [CrossRef]
- Bhala, N.B. Alcohol-related harms and the certainty of deaths and taxes. Lancet. Reg. Heal. Eur. 2022, 15, 100328. [Google Scholar] [CrossRef]
- ISTAT Health Risk Factors: Smoking, Obesity, Alcohol, and Sedentary Lifestyle—Year 2021. Published 2022. Available online: https://www.istat.it/it/archivio/270163 (accessed on 1 September 2023).
- Istituto Superiore di Sanità (ISS). Epidemiology and Alcohol-Related Monitoring in Italy and in the Regions. Evaluation of the National Observatory on Alcohol on the Impact of the Alcohol Consumption in Support for the Implementation of the Activities of the National Alcohol and Health Plan. ISTISAN. Published Online 2023. Available online: https://www.iss.it/en/-/rapporti_istisan_22_1 (accessed on 4 September 2023).
- ISTAT Road Accidents in Italy 2020. Published 2021. Available online: https://www.istat.it/it/files//2021/07/Incidenti-stradali_2020.pdf (accessed on 4 September 2023).
- Department of Anti-Drug Policies, Progetto “Strade Sicure 2020–2021”. Available online: https://www.politicheantidroga.gov.it/it/attivita/incidentalita-stradale/progetto-strade-sicure-2020-2021/ (accessed on 4 September 2023).


| Time (min) | %M1 (Pump A) | %M2 (Pump B) |
|---|---|---|
| 0 | 100 | 0 |
| 0.5 | 100 | 0 |
| 5 | 75 | 25 |
| 5.1 | 0 | 100 |
| 7.5 | 0 | 100 |
| 7.6 | 100 | 0 |
| %Positive CDT | |||||||
|---|---|---|---|---|---|---|---|
| Age Group | 2016 | 2017 | 2018 | 2019 | 2020 | 2021 | 2022 |
| <18 | 0 (0/0) | 0 (0/0) | 0 (0/3) | 50.0 (1/2) | 0 (0/0) | 0 (0/2) | 0 (0/1) |
| 18–30 | 0.73 (2/274) | 0.25 (1/405) | 3.98 (19/477) | 3.9 (23/589) | 3.22 (10/311) | 2.78 (13/467) | 2.28 (11/483) |
| 31–40 | 0.71 (2/283) | 1.12 (5/445) | 4.08 (22/539) | 5.32 (42/789) | 3.05 (12/394) | 3.61 (28/775) | 2.74 (25/911) |
| 41–50 | 0 (0/182) | 1.24 (4/322) | 6.91 (32/463) | 6.3 (39/619) | 3.41 (12/352) | 4.97 (30/604) | 2.91 (22/757) |
| 51–60 | 0 (0/59) | 0.74 (1/135) | 4.69 (10/213) | 9.21 (28/304) | 2.01 (3/149) | 5.98 (21/351) | 1.19 (5/421) |
| 61–70 | 7.14 (1/14) | 0 (0/43) | 9.8 (5/51) | 9.46 (7/74) | 6.82 (3/44) | 4.6 (4/87) | 3.03 (4/132) |
| >70 | 0 (0/3) | 0 (0/8) | 12.5 (1/8) | 18.52 (5/27) | 5.88 (1/17) | 6.67 (1/15) | 5 (1/20) |
| % of Genetic Variants Split by Gender | |||||||
|---|---|---|---|---|---|---|---|
| 2016 | 2017 | 2018 | 2019 | 2020 | 2021 | 2022 | |
| Males | 0.7% (5/712) | 0.4% (5/1226) | 1% (16/1576) | 1.2% (26/2093) | 0.9% (10/1113) | 1.3% (27/2018) | 1.4% (32/2375) |
| Females | 0% (0/103) | 0.8% (1/132) | 1.1% (2/178) | 0.6% (2/311) | 2.6% (4/154) | 0.4% (1/283) | 0.3% (1/350) |
Disclaimer/Publisher’s Note: The statements, opinions and data contained in all publications are solely those of the individual author(s) and contributor(s) and not of MDPI and/or the editor(s). MDPI and/or the editor(s) disclaim responsibility for any injury to people or property resulting from any ideas, methods, instructions or products referred to in the content. |
© 2023 by the authors. Licensee MDPI, Basel, Switzerland. This article is an open access article distributed under the terms and conditions of the Creative Commons Attribution (CC BY) license (https://creativecommons.org/licenses/by/4.0/).
Share and Cite
Fiorelli, D.; Romani, L.; Treglia, M.; Pallocci, M.; Passalacqua, P.; Coppeta, L.; Marsella, L.T.; Tittarelli, R. Carbohydrate-Deficient Transferrin (CDT) as a Biomarker of Alcohol Abuse: A Retrospective Study of the Italian Drinking Trend among Drivers from 2016 to 2022. Toxics 2023, 11, 914. https://doi.org/10.3390/toxics11110914
Fiorelli D, Romani L, Treglia M, Pallocci M, Passalacqua P, Coppeta L, Marsella LT, Tittarelli R. Carbohydrate-Deficient Transferrin (CDT) as a Biomarker of Alcohol Abuse: A Retrospective Study of the Italian Drinking Trend among Drivers from 2016 to 2022. Toxics. 2023; 11(11):914. https://doi.org/10.3390/toxics11110914
Chicago/Turabian StyleFiorelli, Denise, Leonardo Romani, Michele Treglia, Margherita Pallocci, Pierluigi Passalacqua, Luca Coppeta, Luigi Tonino Marsella, and Roberta Tittarelli. 2023. "Carbohydrate-Deficient Transferrin (CDT) as a Biomarker of Alcohol Abuse: A Retrospective Study of the Italian Drinking Trend among Drivers from 2016 to 2022" Toxics 11, no. 11: 914. https://doi.org/10.3390/toxics11110914