
Does High-Speed Railway Promote the Quality of Urbanization? From a Dynamic Network Perspective

School of Economics and Management, Beijing Jiaotong University, Beijing 100044, China
*
Author to whom correspondence should be addressed.
Systems 2023, 11(10), 523; https://doi.org/10.3390/systems11100523
Submission received: 15 September 2023
/
Revised: 15 October 2023
/
Accepted: 19 October 2023
/
Published: 20 October 2023
Abstract
:Applying the improved social-network analysis method and the idea of rolling-window regression, this paper explores the impact of an HSR network on the quality of urbanization and its dynamics. Based on a sample of 273 cities in China over the period 2009–2019, we find that the high-speed railway network has an increasingly positive effect on the quality of urbanization, which proves the existence of a network effect. The empirical results further show that this effect is closely related to the coverage rate of the high-speed rail network. In addition, heterogeneity analysis reveals that urban agglomeration cities are the main beneficiaries. Academically, our study provides a plausible explanation and evidence from network size differences for the two conflicting views of the HSR effect. Practically, we also propose some important policy implications for countries in different high-speed-rail-network construction stages.
1. Introduction
Transport infrastructure is inextricably linked to the evolution of urban systems [1]. The emergence of a new transport tool may radically change the size [2], structure [3] and status [4] of cities, thus profoundly affecting the evolution of the entire urban system. Since the 21st century, globally, high-speed railways (HSRs) have progressed and gradually become one of the most popular modes of transport. According to the latest statistics of the International Union of Railways (UIC), by the end of 2021, 20 countries around the world had opened high-speed railways, with an actual operating mileage of 58,839 km. Meanwhile, 22 other countries or regions are constructing or planning to construct high-speed railway, and the HSR mileage to be constructed (including the three parts of under construction, planning and long-term planning) exceeded 70,000 km. In 2023, the United States also joined the high-speed-rail-construction bandwagon. The role of high-speed rail in urban development is becoming more and more imperative. Many of these countries have already formed mature high-speed rail networks, such as China, Japan, South Korea, France and Spain [5,6]. As a result, the impact of HSR networks on urbanization has attracted extensive research interest.
It is not easy to clarify how an HSR network affects urbanization. There are two main challenges. Firstly, a city is a complex system, which is composed of the population, land, economy, environment, institutions and other elements [7]. Generally speaking, these elements reflect differently on the opening of HSR, which leads to uncertainty about the impact of the HSR on the overall quality of urban development. Secondly, with the prominent characteristics of an HSR network and the expansion of a network’s scale in some countries, new features or benefits (network externalities) obtained by a city’s network structure, such as a higher network status, will play a more important role in the urbanization process [8,9]. New dilemmas have been encountered in how to accurately measure these features and what new impacts they have caused.
Currently, scholars have conducted abundant research on the relationship between HSRs and urban development around different segments of the urban system. The urban population and urban economy have become the focus of attention. (1) The population aspect: Graham and Mole’s [10] research shows that due to the space–time compression effect of high-speed rail, travel time is significantly reduced and travel accessibility is dramatically improved, which makes inter-city-population mobility more fluid. Harman [11] investigated whether high-speed rail is becoming a new commuter tool of choice in the market for commuting within 1 h with great convenience. Wang et al. [12] constructed a DID model using 2005–2016 panel data of the Yangtze River Delta region of China, and found that the opening of HSR has a significantly positive effect on short-term population migration and the tertiary industry, but a negative impact on long-term population mobility and population urbanization. Kim et al. [13] assessed the impact of KTV sites in Korea and found that the node and location of each site had a positive effect on urbanization. However, an empirical study by Maparu and Mazumder [14] in India demonstrated that improved infrastructure conditions are not necessarily coupled with urbanization, apart from national highways and port facilities. (2) The economic aspect: Due to the effects of centrifugal and centripetal forces, the question of how HSR can urbanize the economy has not been defined. Taking Kent in the UK and the Yangtze River Delta (YRD) region in China as samples, Chen and Vickerman [15] suggested that HSRs have boosted economic growth in most HSR cities. In contrast, Gao et al. [16] found that the opening of high-speed rail suppressed nearly 10 per cent of the economic growth in the Yangtze River Delta region, owing to population loss and industry shifts in peripheral cities. (3) Other aspects: In addition, high-speed rail has also been proven to be an essential influence on land, environment, and inequity factors. Wang et al. [17] proposed that the opening of HSR played a positive role in the expansion of urban spaces and other built-up land, but accelerated the loss of agricultural land. A study by Jia et al. [18] pointed out that the increase in the intensity of HSR services promotes transport substitution, market integration, industrial upgrading and technological innovation, thus reducing urban CO2 emissions. Yu and Pan [19] argued that high-speed rail is also conducive to narrowing the urban–rural income gap, because of the more efficient mobility of high-skilled labor. All these studies have revealed the wide-ranging impacts of HSR construction and development on urban systems, but have failed to assess a comprehensive effect.
Further, as the network characteristics of HSRs come to the fore, more scholars have begun to introduce a network perspective to study HSRs and successively put forward a series of new indicators to describe the characteristics of the HSR network in a region. Overall, these indicators reflect three types of features: scale, benefit and structure, respectively. (1) HSR network scale. Some scholars have employed the quantification of HSR infrastructure to describe regional HSR development in the context of a network, such as high-speed-rail dummy variables [12,20,21], the amount of HSR stations [22], and the length of HSR lines [23]. These metrics focus on the nodes in the HSR network, ignoring node-to-node connections, and are not part of a true network analysis approach. (2) HSR-network benefit. In contrast, it may be more appropriate for some scholars to measure an HSR network indirectly through the benefits generated by the HSR network. This benefit is widely summarized as an improvement in accessibility, including the travel time [24], the economic potential [9], the number of passengers [25], the geographical distance [8] and other indicators [26]. These indices take full account of the connections between the HSR cities, but still do not reflect the unique structural characteristics of the network. (3) HSR-network structure. A few scholars have adopted a direct measurement from a network perspective. They have tried to introduce social-network analysis methods to portray the city’s HSR characteristics [9,27,28,29,30,31]. For example, Liu et al. [32] applied point degree and closeness centrality to the HSR infrastructure to measure the total accessibility and network structure. Taking into account the actual provision and use of HSR services, Liu et al. [33] also supplemented the travel time and daily frequency with the degree, betweenness and harmonic centrality indices by using China’s HSR timetable data, which reflect both the quantity and quality of connections. This is an important contribution to how to measure the characteristics of a HSR network, but related studies have neglected this new effect on urban development arising from the network characteristics, i.e., the network effect. In the study of networking, Metcalfe’s law shows that the network value will be proportional to the square of the number of nodes, which implies that the network effect is a kind of non-linear effect. Whether or not there is a network effect of a HSR network on urban development has not been confirmed so far.
In view of this, this paper firstly constructs a set of comprehensive index systems of urbanization quality to portray the comprehensive development level of an urban system. Secondly, by applying improved social-network methods, rolling-window regression and a spatial econometric model, we empirically examine the impact of a high-speed rail network on urbanization quality and its dynamic effects. Finally, as an extended study, we further explore the main beneficiary urban groups under the development trend of a high-speed railway network. China has a high coverage of HSR cities (nearly 70%), as well as a relatively complete HSR development cycle (major lines are basically completed), which makes the role of HSR in China’s urban development and its changes likely to be more easily observable. Therefore, we finally select Chinese cities as our sample. The biggest contribution of this paper is that it verifies the existence of the network effect of high-speed rail on urban development for the first time. Additionally, to achieve this, we propose a new combination of research methods, that is, combine the idea of rolling-window regression with spatial-measurement tools, which provides a feasible solution to mitigate the effects of spatial autocorrelation and temporal heterogeneity in regression tests. Nowadays, the construction of high-speed rail in the world is still in full swing. Our research will provide important policy implications for countries at different stages of high-speed-rail development and countries that are planning to build high-speed rail.
The subsequent structure of the article is arranged as follows. The second part is the theory basis and hypothesis. The third part is the research methodology, and sample and data collection. The fourth part is the empirical results. The fifth part is the conclusions and implications.
2. Theory Basis and Hypothesis
A city is a complex system. From an economic perspective, it can be viewed as a collection of production factors and relations. Therefore, the key to improving the quality of urbanization lies in achieving a more reasonable allocation of various factors. The mechanism of a high-speed rail network on the quality of urbanization can be revealed from the perspective of factor allocation.
According to the transaction cost theory [34], a reduction in transaction costs can increase the opportunity of negotiation and cooperation between parties, leading to a more reciprocal and effective contract (resource allocation decision). As an improved transportation mode, high-speed railway can reduce cross-regional transaction costs (mainly transportation or search costs), promote the formation of more transaction activities, and further improve the allocation efficiency of labor [35], land [32], capital [36], knowledge [37], and other factors. On the one hand, due to the weakening of space constraints, some new business will emerge and become popular, such as intercity commuting, job–housing separation and TOD projects, which will enable more idle or cheap resources to be used and appreciated. On the other hand, the frequency of some existing transactions will also increase as the loss of time value decreases, particularly activities that need to return in one day such as academic exchanges, business negotiations and short-distance travel, which enhances the mobility and utilization efficiency of factors. In addition, the increased accessibility of cities under networked conditions may lead to a more adequate exchange of factors. Based on this, we propose the following.
Hypothesis 1:
In a long run, a high-speed railway network can promote the quality of urbanization.
The emphasis of dynamic network analysis is to explore whether there is a nonlinear effect. According to the new economic geography theory [38], the short-term and long-term effects of HSR construction on peripheral areas are different. There is heterogeneity in the effects of transportation-cost changes on “center-periphery” areas at different stages. At the initial stage, an HSR, as a scarce transport infrastructure resource, can quickly create differences in transport costs between HSR (these are always core cities) and non-HSR cities [39]. Transport costs directly affect the enterprise location [40] and labor migration [35]. Driven by the profit-seeking nature of production factors, population, capital, technology and other factors will rapidly flow to HSR cities with lower transport costs, thus creating a short-term polarization effect [41]. More peripheral cities are caught up in factor loss and, thus, urban development is inhibited. But this will not last in the long run. As factors accumulate in central cities, there may be a tendency for their marginal output and marginal returns to decline. Moreover, as more cities are connected to the HSR network, the gap in transport costs between cities will gradually narrow. Both will inevitably reduce the incentives for factor mobility to central cities, but will facilitate factor exchange [12]. Benefiting from the proliferation of information, technology and advanced experience in the core cities, the quality of urbanization in all cities will be enhanced. Further, this enhancement will grow stronger. For each new HSR city, the number of travel routes will grow exponentially. This will continue to strengthen the flow of factors between cities, thus promoting the accelerated improvement in urbanization quality. In view of this, we propose Hypothesis 2.
Hypothesis 2:
As the size of the HSR network increases, the promotion effect of HSR on urbanization quality will become stronger.
In addition, the imbalance in China’s urban development is striking. The demand and utilization of the HSR infrastructure in different cities are not consistent, which may make the role of high-speed rail different. Chen and Haynes [42] and Adler et al. [43] find that high-speed railway is more competitive in the market on 500–800 km routes. This range coincides with the geographical scope of China’s urban agglomerations. According to China to Enhance Global Competitiveness in Transport, the maximum direct travelling time within an urban agglomeration in China should not exceed two hours. Taking the average high-speed rail running speed of 250–350 km/h as the standard [44], the spatial range of urban agglomerations with HSR is roughly between 500–700 km. Hence, HSR may be better suited for intercity travel within urban agglomerations. Otherwise, compared with non-urban agglomeration cities, urban agglomeration cities also have a highly unified policy regime and infrastructure [45], which makes the economic links closer and HSR role more obvious. Consequently, we formulated Hypothesis 3.
Hypothesis 3:
The HSR network will benefit urban agglomeration cities more than non-urban agglomeration cities.
3. Research Methodology, Sample, and Data
3.1. Sample and Data
The sample included 273 cities in China for the period 2009–2019, covering all prefecture-level cities and municipalities in mainland China, except Tibet and 12 cities with severe data deficiencies. A few missing-value data were processed using the exponential smoothing method or the mean value. In terms of sample interval selection, most scholars agree that 2008 was the first year of HSR opening in China, but we chose 2009 as the starting point for two reasons: first, as a major infrastructure construction, the effect of HSR often has a lag, so we treat all HSR opening years with a lag of half a year. Second, after that, only one HSR line (Nanjing to Hefei) opened in 2008, which cannot be regarded as a “network”. In addition, since China suffered from a “COVID-19” epidemic shock and strict mobility restrictions in 2020, which do not reflect the true benefits of high-speed railway, the data for that year were excluded. The HSR data are from the China Railway Yearbook from 2008 to 2019. Other data were collected from the China City Statistical Yearbook, the China Regional Economic Statistical Yearbook, and the China Urban and Rural Construction Statistical Yearbook and provincial yearbooks. Table 1 shows the descriptive statistics for all the variables.
3.2. Variable Measures
3.2.1. Measurement: Network Importance of HSR Cities
First, in terms of the network model setting, we employed the L-space model, that is, there were no multiple connections between the two nodes. Second, since some cities may have opened more than one HSR station, we defined an HSR city as a node in order to avoid double counting. Then, we used the improved degree and betweenness centrality formula [46] to measure the importance of cities in an HSR network. This formula is a standardized result and had two advantages for this study: (1) the influence of network size change is eliminated in variable selection, which reduces the endogeneity problem of dynamic analysis; (2) nodes are placed in a global network perspective, which highlights the interaction and comparative advantage between nodes. Specifically, degree centrality reflects the ability of direct link between a node itself and other adjacent nodes [33,47]. It can be defined as Equation (1):
where N refers to all cities with HSR that year, n = N − 1, represents the HSR connection between city j and city i. If i and j are directly connected through an HSR line, = 1; otherwise, = 0.
Betweenness centrality refers to the number of shortest paths passing through a node. It assesses the capacity of a node’s indirect control over other nodes and potentially the entire network, defined as Equation (2)
where represents the number of HSR connections through city i among all the shortest HSR connections from city o to city d, and represents all the shortest HSR connections from city o to city d.
3.2.2. Measurement: Quality of Urbanization
Drawing on the research of Wang et al. [48], the quality of urbanization was mainly divided into five aspects: population, economy, space, environment, and society. For population urbanization, the quality of urbanization not only seeks to improve the urbanization rate, but also takes into account the urban population density and the non-primary industrial population, which reflect the utilization efficiency of urban resources and the employment structure, respectively. In terms of economy, per capita GDP and the proportion of output value of secondary and tertiary industries are two common indicators to measure the quality of economic development, reflecting the individual contribution and structure composition of regional economic development, respectively. In addition, the GDP density of non-agricultural industries is supplemented to reflect the space utilization rate of economic growth. For the space, how to give full play to the value of land resources and improve land utilization is another key issue of urbanization quality. The capita road areas and capita living areas are two good indicators of urban congestion. The proportion of built-up area and per capita built-up area, respectively, reflect the construction scale and utilization efficiency of an urban space. Regarding the environment, sustainable development clearly emphasizes “ecological civilization” and seeks a “green and environmentally friendly” development mode. Therefore, the per capita green space area, green coverage rate of a built district, domestic garbage treatment rate, and wastewater treatment rate are included in the urbanization evaluation system to reflect the urban greening construction and waste treatment. In addition, the quality of urbanization has put forward higher requirements on education, medical care, culture, and resident income, so as to improve the level of social security and the quality of resident life. As a result, per capita education expenditure, the number of beds per 1000 people, and other indicators were included in the social aspects. Finally, considering the five aspects, we constructed the corresponding quality of the urbanization index system at the city level, which contained 18 indicators, as shown in Table 2.
Referring to the studies of Yu [49] and Zhang et al. [50], the quality of urbanization is measured using the panel entropy weight method (PEWM). PEWM can effectively extract the information, avoiding the randomness, presumption and other deviation problems caused by determining the weight due to subjective factors. By this method, the indicator weights were determined based on the full-period sample data rather than a single-period sample, which makes the data comparable in the time dimension. The specific calculation steps are as follows.
Standardization, as shown in Equations (3) and (4):
where t is the year, i is the city, j is the index, is the value after standardization, is the initial value, and and represent the maximum and minimum value of the index j in all of the years and the cities studied.
Calculation of the proportion of , as shown in Equation (5):
where m and n are total years and total cities, respectively, equal to 11 and 273 in this article.
Calculation of the entropy value and difference coefficient, as shown in Equations (6) and (7):
where denotes the entropy value of index j, and denotes the difference coefficient of index j.
Calculation of weight of each index and quality of urbanization, as shown in Equations (8) and (9):
where r is the total number of indexes, equal to 18 in this paper, denotes the weight of index j, and denotes the original value of the quality of urbanization. Since the value was too small, we enlarged it (multiplied it by 1000) and obtained the final quality of urbanization (QU).
3.3. Empirical Model Selection
The empirical estimation strategy to test our hypothesis was as follows. Firstly, considering the wide spatial correlation among cities from the perspective of a high-speed rail network, this paper selected the spatial econometric model to test all hypotheses. In testing Hypothesis 1, dummy variables and absolute centrality of the HSR were also introduced to compare the non-network perspective and the local perspective. Different control variables and spatial weight matrices were included to ensure the robustness of the empirical results. Secondly, the idea of rolling-window regression was used to test Hypothesis 2. Considering the length of sample data and the span of high-speed rail construction, we conducted stepwise regression with 3, 4 and 5 years as windows on the basis of the spatial econometric model. Thirdly, we screened urban agglomeration cities according to China’s 14th Five-Year Plan and performed sub-sample regression to further test whether the impact of high-speed rail networks on the quality of urbanization varies with urban agglomeration development policies (i.e., Hypothesis 3).
3.3.1. Spatial Econometric Model
The choice of the spatial econometric model in this paper was based on the following two considerations: First, since we describe the characteristics of the HSR network through the links established between cities through high-speed railway, it is highly likely that the HSR network will have a spatial correlation effect on the quality of urbanization. Second, the index of urbanization quality is a composite index that widely covers various aspects of urban development, which may have serious endogenous problems with other variables. The spatial econometric model generally uses maximum likelihood estimation (MLE) or generalized method of moments (GMM), which can help to overcome this problem. Its specific form is as follows:
where i, j, and t denote city i, city j, and year t, respectively; QU is the quality of urbanization; denotes a city’s high-speed rail characteristics, , , , and are four control variables; W is the n × n spatial weight matrix describing the spatial relation of cities, n is the number of cities; both and are spatial spillover coefficients to evaluate the impact of city j on city i, while only measures the impact within a city; and , and denote the individual effect, time effect and random error, respectively.
Regarding the setting of W, we adopted two matrices in accordance with spatial adjacency and geographic distance. For the adjacent-distance weight matrix , the spatial weight of two cities with an adjacent relation is set to 1, and vice versa to 0. Noticeably, a diagonal element is 0, too. For the geographic-distance weight matrix , the element is calculated as Equation (11):
where is the geographic distance between the city i and j. The value is calculated from city’s latitude and longitude data, which was obtained from the 1:4 million terrain database of the National Basic Geographic Information System. Since the weights in are relatively simple, we used for empirical analysis and for a robustness test.
3.3.2. Control Variables
The selection of control variables is based on the following aspects.
- (1)
- Technology support: The quality of urbanization pursues the transformation and development of intellectualization. In this process, new technology such as IT and DT can play a key role. These technological innovations are closely related to primary work and produce a systemic change, which can transform life and work within a city significantly and fundamentally [51]. Thus, corresponding technology support is an important factor of urbanization development. In this study, the proportion of science and technology expenditure is used to reflect the government’s support for science and technology innovation.
- (2)
- Financial development: A stable capital chain and sustainable financial services can promote the expansion of reproduction activities in small- and medium-sized enterprises by encouraging innovative activities, preventing monopoly and forming a good market competition environment [52]. In the past, due to the backward movement of China’s investment and financing systems, urbanization quality has long been hindered by a capital bottleneck [53]. Thus, the development of financial industry can help to realize the further improvement in urbanization. According to Han et al. [54], the level of financial development is measured by the total loan balance of all financial institutions divided by the gross regional product.
- (3)
- Marketization degree: The market is one of the most active parts of urbanization quality. The total retail consumption of the market divided by the gross regional product is a reflection of the marketization degree. The higher the consumption, the more active the market. An active market is conducive to improving transaction efficiency and promoting economic development [55].
- (4)
- Economic openness: Openness can help to introduce the foreign advanced technology, talents, and management experience, improving the quality of city development [56]. In addition, the frequent communication with the foreign can also improve the reputation of the city, which accelerates the process of urbanization and internationalization. In this study, FDI was measured by the total amount of foreign investment actually utilized divided by the gross regional product.
Considering the availability of variables, the specific calculation method of each variable is shown in Table 3.
4. Empirical Results
4.1. The Spatio-Temporal Evolution Characteristics of the HSR Network
Table 4 shows the development of the HSR network in the first 19 HSR cities in 2009 and 2019, including the number of HSR lines, relative degree and betweenness centrality. In terms of cities, China’s HSR network mainly originates from metropolises, including 2 municipalities (Beijing and Tianjin), and 7 provincial capital cities (Shijiazhuang, Wuhan, Jinan, etc.) and cities with strong economic strength such as Qingdao, Zibo, Weifang (the top 40 in GDP), while 7 medium and small cities (out of top 100 in GDP) are embedded in the HSR network. In terms of HSR lines, in addition to Yangquan, Jinzhou, Huludao, and Liu’an—four small cities—other cities have opened two or more high-speed rail lines. Hefei, Jinan and other metropolises have opened four high-speed rail lines, while Tianjing, Nanjing and Shenyang have even reached five. Just from the absolute number of HSR lines, the results clearly show that large cities gain the most from the HSR networking process. However, in the global-network perspective, the result shows a shocking reversal in pattern. In terms of the relative degree centrality, the absolute advantage of the lines does not translate into an absolute advantage of the network location. The relative degree centrality of all cities tends to decrease and eventually converge. This is not a local phenomenon, and the declines of the national average (from 8.77 to 1.11) and variance (from 3.85 to 0.51) also strongly support this result. According to Equation (1), the above can be properly explained by the speed and layout of China’s HSR construction. (1) China’s HSR network has expanded very rapidly, with an average of 20 cities opening high-speed rail each year, significantly increasing the base of HSR network nodes. (2) Most of China’s HSR lines are long-distance inter-provincial lines such as the Beijing–Shanghai line (through three municipalities and four provinces) and the Beijing–Kowloon line (through two municipalities and seven provinces), which have many stations but a single connection. (3) The specificities of a rail transit network determine the necessity of convergence, that is, the direct connections to railway stations are limited, which is the opposite of the air network. In terms of betweenness centrality, the law does not seem so obvious. Some cities have obvious line advantages (e.g., Hefei), but their degree centrality is much lower than that of single-line cities (e.g., Huludao). One possible explanation is that these cities have a critical geographical location or are located on mandatory routes. Both results show that the absolute amount of HSR infrastructure (such as HSR lines) is not a complete reflection of the importance of the city’s location, which supports our improved measurement.
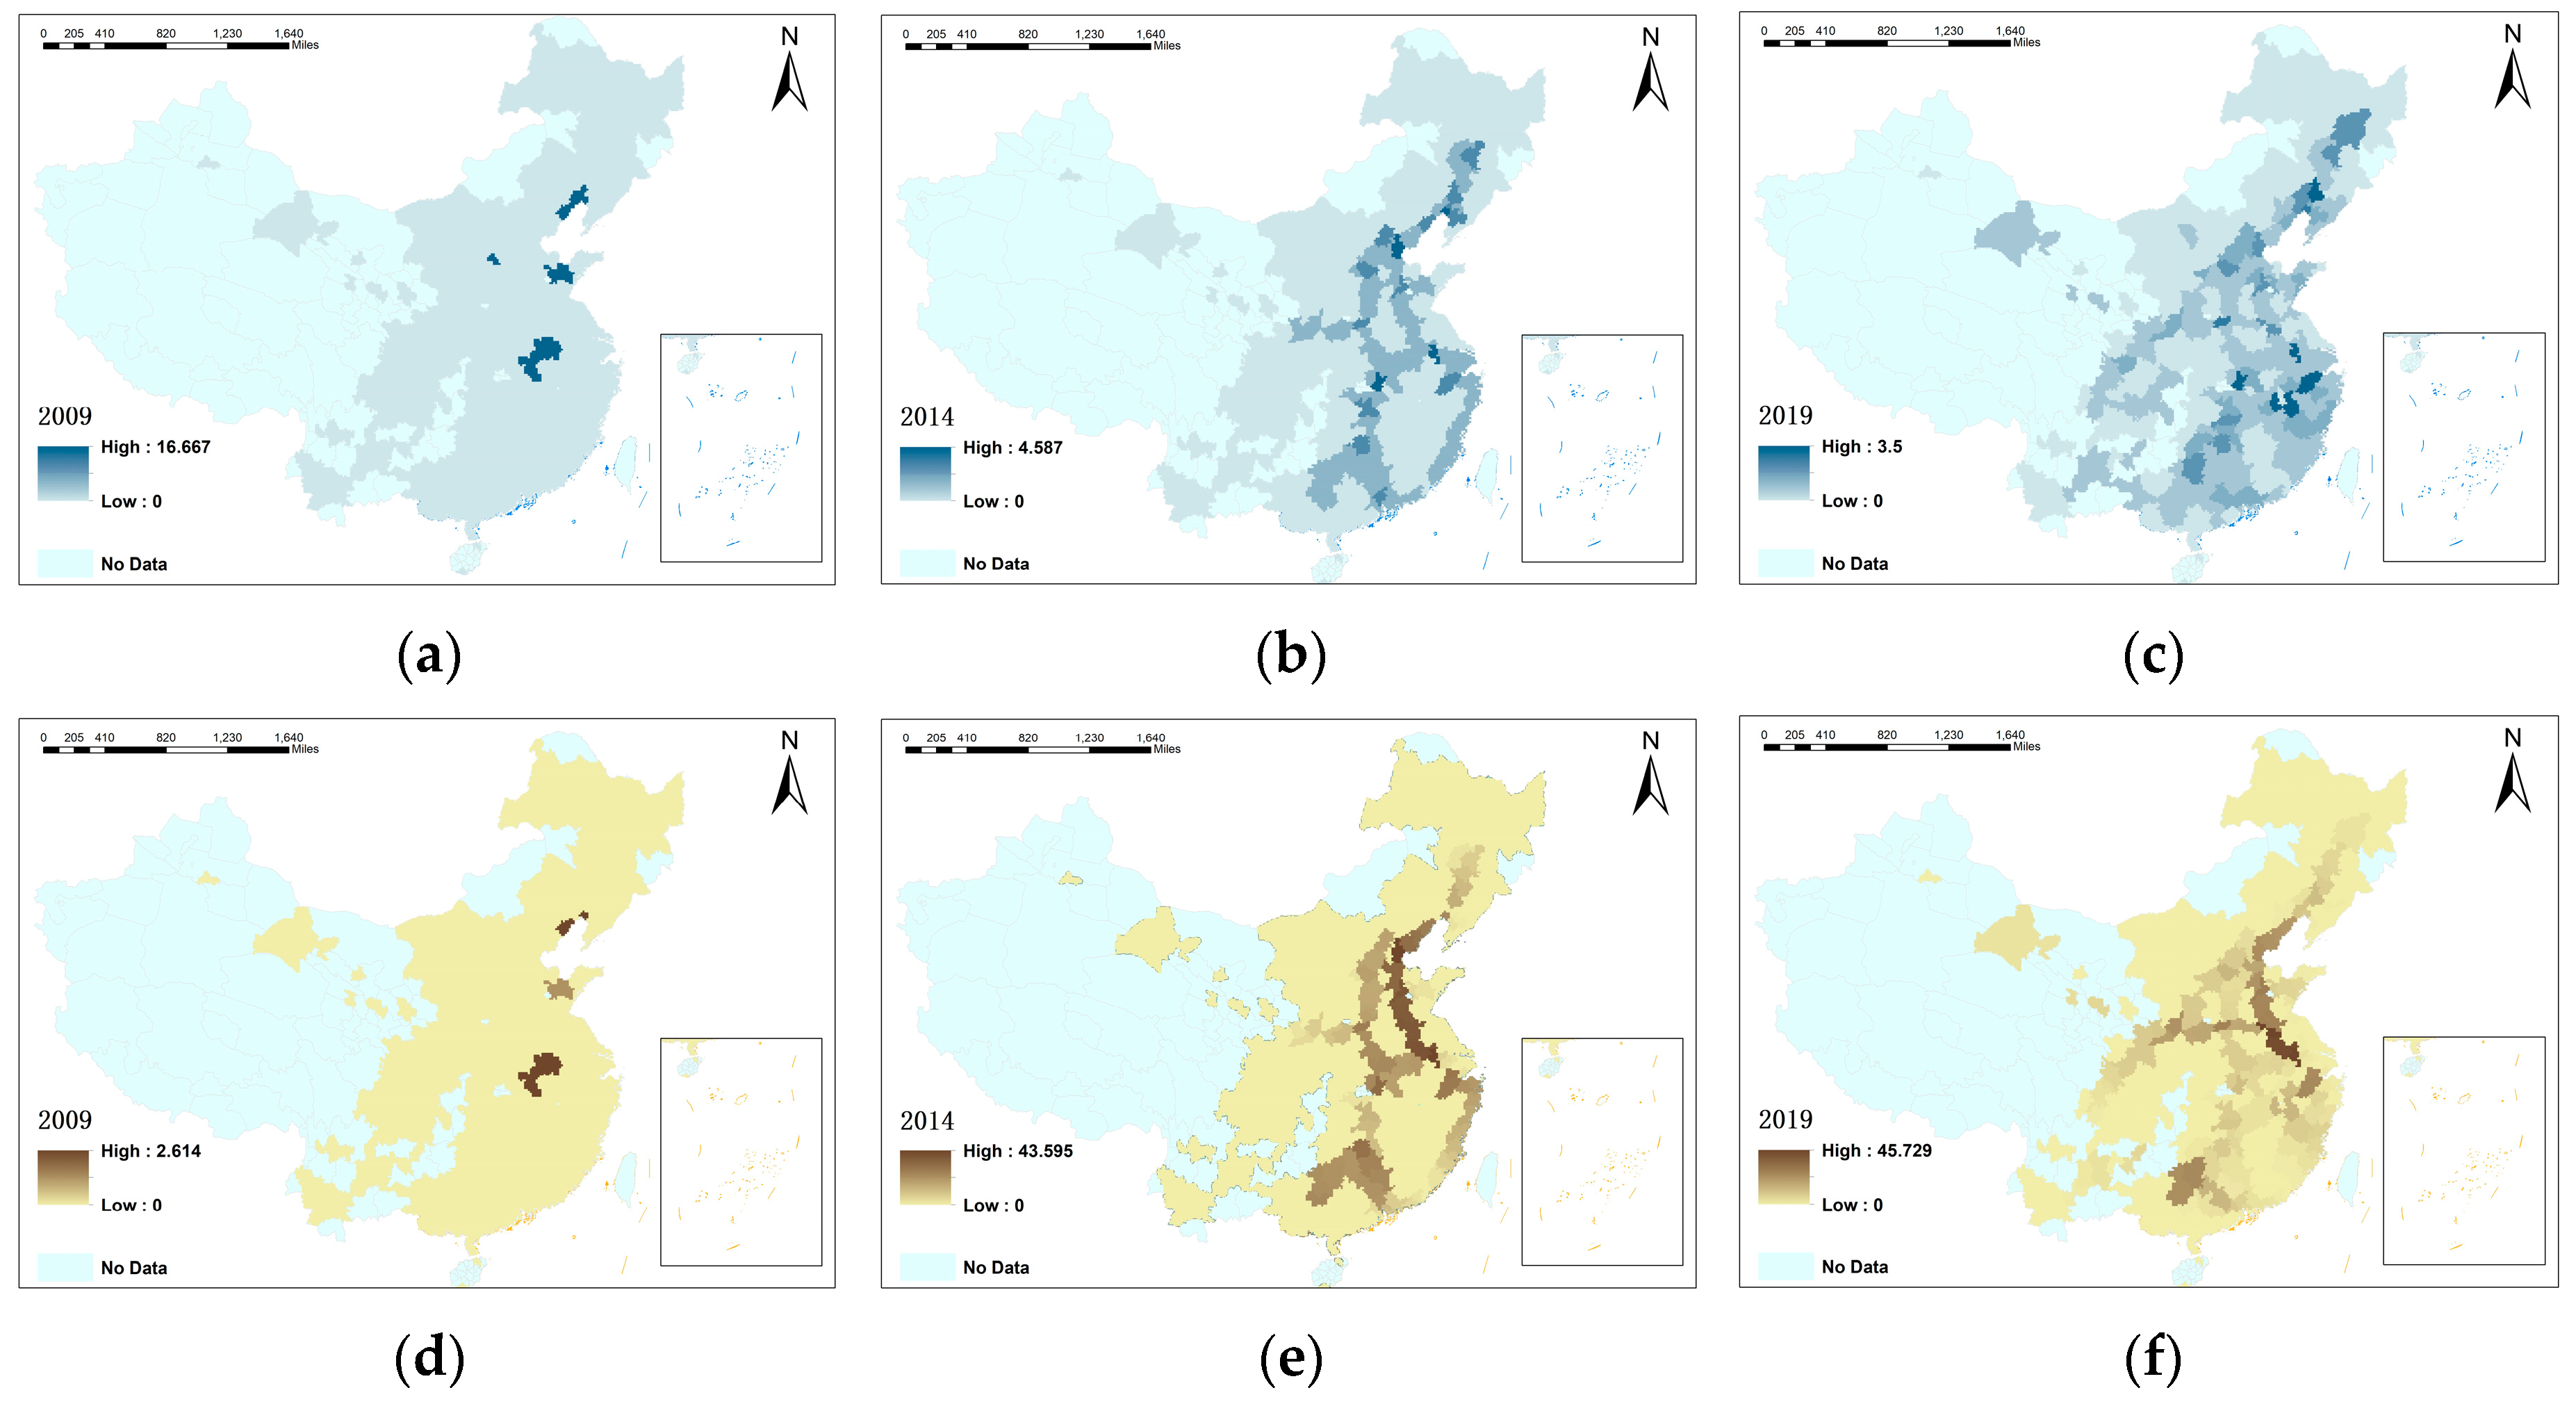
Figure 1 shows the spatial distribution of changes in location importance in relative degree and betweenness centrality from 2009 to 2019. In order to more clearly present the dynamic change process, we further equated this period into three time points, 2009, 2014, and 2019. The evolution of relative degree centrality is shown in Figure 1a–c, while Figure 1d–f demonstrate the evolution of relative betweenness centrality. From these maps, some conclusions can be drawn: (1) In terms of overall evolutionary trends, the development of China’s high-speed railway has gone through three major spatial evolution stages, namely “point distribution-corridor distribution-network distribution”. The locational position of HSR cities is becoming more and more balanced. We can see that in the period 2009–2014, most of the cities increased their locational importance (both degree centrality and betweenness centrality) due to the opening of high-speed railway. During this period, along the four horizontal and four vertical HSR trunk lines, a clear agglomeration of high-location cities was formed. However, with the further expansion of the HSR’s scale from 2014 to 2019, the locational advantages of these cities are rapidly fading. (2) From a regional perspective, both degree centrality and betweenness centrality are higher in cities in the Eastern and Central regions, indicating that the eastern and central regions are pivotal zones for the development of high-speed railway. (3) For changes in two types of centralities, relative degree centrality continues to decline, but relative intermediary centrality is rising. This means that more and more high-speed railway cities are playing the role of “interchange” rather than “destination”, and the role of each city in the high-speed railway network will become more and more prominent.
4.2. Spatial Autocorrelation Test and Model Determination
This paper examines the spatial agglomeration characteristics and evolution trend of urbanization. As shown in Table 5, Moran’s I values were all significantly positive at the 1% level, showing that China’s urbanization quality had significant positive autocorrelation during 2009–2019. From the development trend, we can also observe that the positive effect is gradually strengthened. This means that China’s overall development is more closely linked in space, and the cross-influence of urban development is stronger.
For the selection of the best models, at first, the Lagrange Multiplier (LM) and robust LM tests were adopted to examine whether SEM or SLM is more accurate [57]. Both models have been proved to be appropriate for the regression analysis. Then, we ran a further LR and Wald test and discovered that neither SEM nor SLM can nest in SDM. Therefore, SDM is more representative. Additionally, the p-value in the Hausman test was 0.0000, showing that the FE model was more appropriate in this case. In combination with the above test results, we constructed a spatial Durbin regression model with individual- and time-fixed effects for all our estimations in this paper.
4.3. The HSR Network and the Quality of Urbanization
We used five HSR proxy variables, including dummy variables, absolute- and relative- degree centrality, and absolute and relative betweenness centrality to test the impact of a high-speed railway on urbanization quality from the non-network, local network and overall network. Cities with a higher centrality hold higher importance in the HSR network. Following the studies of Wang et al. [12] and Liu et al. [33], we presented the estimation results without and with control variables, presented in the odd and even models, respectively. This was performed to rule out the problem of estimation bias caused by potential poor variable selection and variable omission, respectively.
Table 6 reports the estimation results of the whole sample with an MLE method. In models (3)–(6), the coefficients of hsr_rdc and hsr_adc were both negative, suggesting that increase in degree centrality is detrimental to improving the quality of urbanization. Among them, the coefficients of hsr_rdc passed the test of significance at the 1% level, while the coefficients of hsr_adc did not, further indicating that location changes in a global network have a more pronounced impact on the quality of urbanization than changes in the local network. In models (7)–(10), the coefficients of hsr_rbc and hsr_abc were both positive, showing that increasing betweenness centrality is conducive to promoting urbanization quality. Of these, only one of the four models, model (10), passed the significance test, and the estimated coefficient of hsr_abc was just 0.0001, demonstrating that the effect of the locational change arising from betweenness centrality on urbanization is limited. Since the HSR network actually reduces relative degree centrality and improves relative betweenness centrality, all of the above results show that the HSR network can indeed enhance the quality of urbanization. This well verifies Hypothesis 1. Meanwhile, by comparing the regression results of models (5) and (8), we can also see that the direct connectivity effect of the HSR network would be more pronounced than the intermediary effect. However, it is worth wondering why a decline in the importance of a city drives urbanization instead. It can be explained as follows: The declining status of HSR cities means that the attractiveness of HSR cities is dropping. When the location advantage of an HSR city is no longer prominent, both the location or investment of local enterprises and the migration of the local population will become “unprofitable”. Therefore, the willingness of production factors to gather in core cities will be inhibited. In other words, the factors are still flowing, but not lost, which is strongly supported by the study of Wang [12]. This has effectively avoided the plight of economic stagnation in the majority of small- and medium-sized cities due to the siphon effect, and has created good development opportunities for them, thus promoting the improvement in urbanization quality [58]. As one of the regions with the highest density of the HSR network in China, the empirical analysis of the YRD city agglomeration should be representative. According to the data from China‘s seventh census in 2020, since the opening of the Beijing–Shanghai line, the urbanization rates of Shanghai, Nanjing, Hangzhou and Suzhou have not increased much, all of which are less than 10 percentage points. In contrast, Tongling and Chuzhou, which belong to the same urban agglomeration, have achieved more than 20% urbanization-rate growth, far exceeding the core cities. More importantly, due to ignoring this dilution effect, the positive effect of high-speed rail has not been effectively reflected in the perspective of the non-network and local network. The coefficients of hsr_dum in model (1) and (2) even reached a completely opposite conclusion. Thus, all the evidence demonstrates the necessity of the relative index measurement again, which provides a richer perspective and conclusion for the study of the relationship between high-speed rail and urban development.
Regarding the impact of control variables, estimation results show that only the coefficient of rtec is significantly positive across all models. This means that technical support has a relatively stable role in promoting the quality of urbanization, whether based on the network perspective or non-network perspective. Technological innovation often relies on breakthroughs in basic scientific research, so it can result in a systemic rather than a unilateral change [51]. Therefore, for an urban system, the improvement in its technological level can promote its overall development from multiple aspects.
4.4. HSR Network and the Quality of Urbanization: Dynamic Analysis
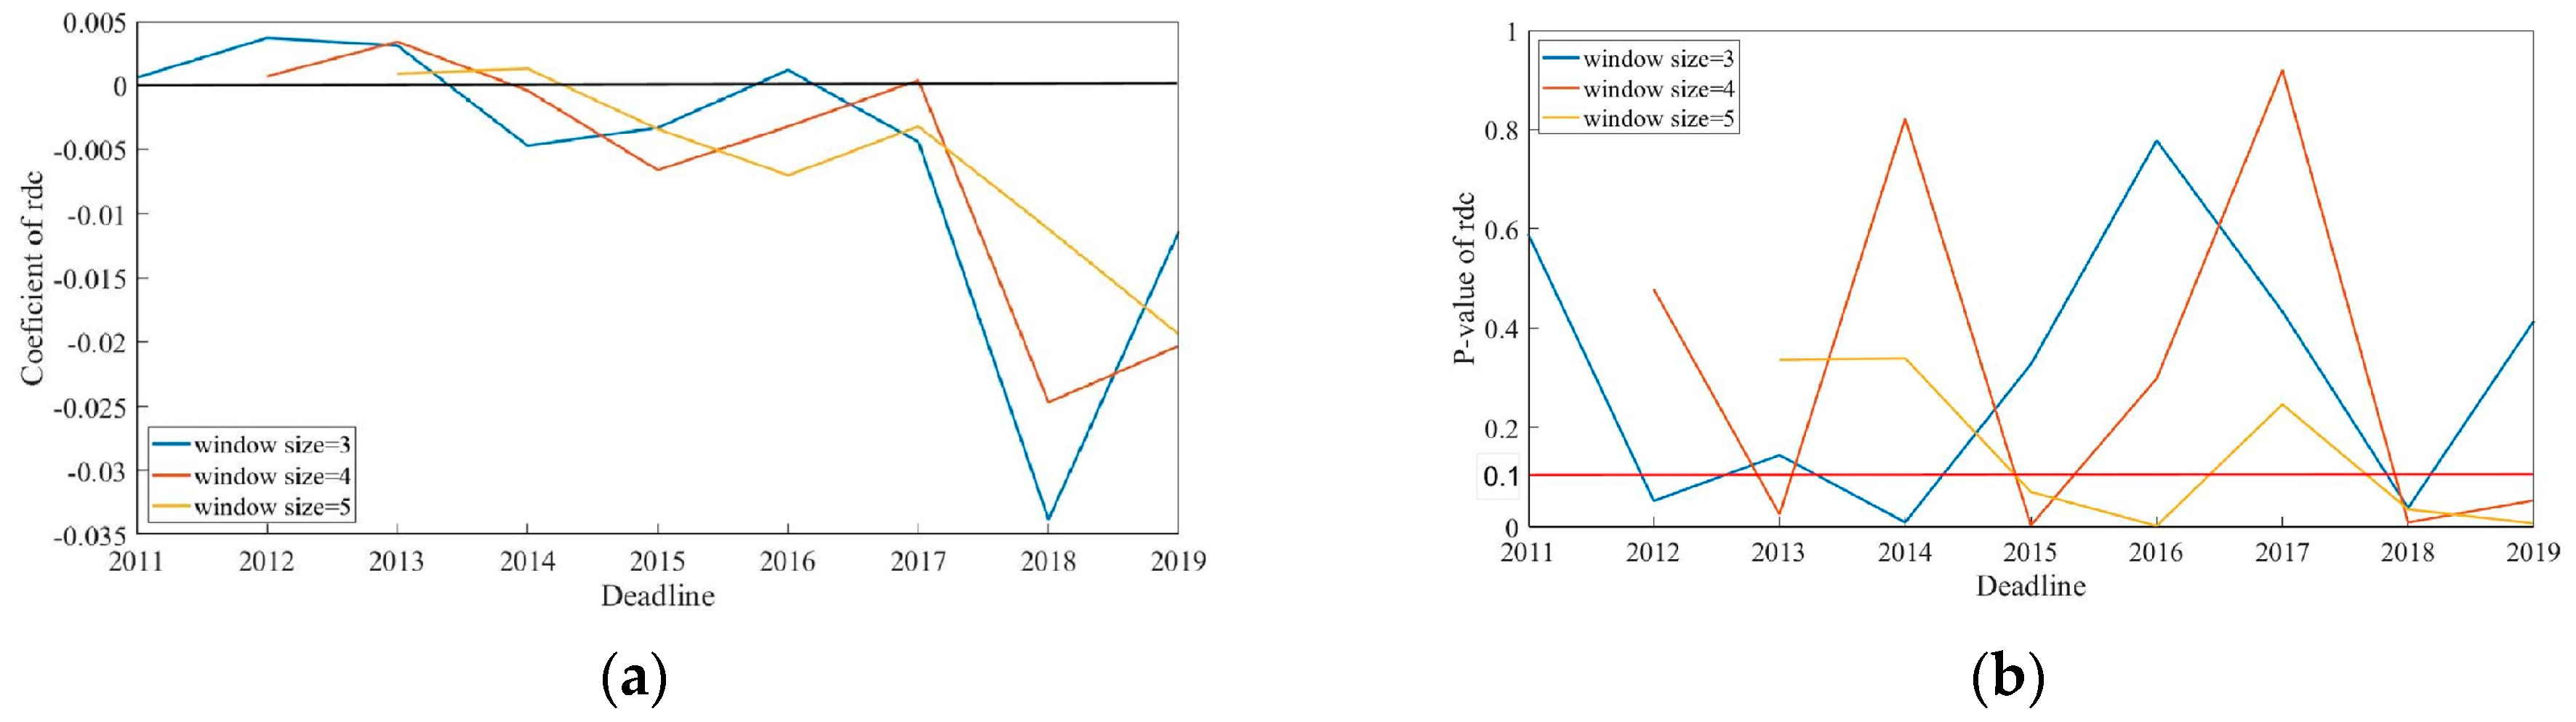
Rolling-window regression is applicable when the correlation between variables is time-varying. This method divides the whole sample into several sub-samples by setting a fixed rolling window (time span T), and then examines the impact of each period separately. Drawing on this idea and combining it with the spatial econometric model, this paper tests the dynamic impact of the HSR network on the quality of urbanization in one-year steps. Since Table 6 shows that the mediating effect of the HSR network is not significant, this section only explores the direct effect (i.e., relative degree centrality). To visually verify the presence of a nonlinear characteristic, we present the estimation results, including coefficients and significance, for all HSR variables in the form of line graphs.
Figure 2 reports the rolling regression results of the impact of the HSR network on urbanization at different window size settings. As shown in Figure 2a, the estimated coefficients under all windows showed a clear downward trend (from positive to negative to smaller negative values). Since the actual HSR degree centrality is continuously decreasing, this result suggests that the HSR network has an incremental positive effect on the quality of urbanization. This finding supports Hypothesis 2. Specifically, at the beginning of the construction of the HSR network, the increased importance of cities in the HSR network is conducive to promoting urban development. When the HSR network reaches a certain scale, there is little gain in the improvement in the city’s location, and it even starts to inhibit its high-quality development. As the scale of the HSR network expands further, it will become profitable to reduce urban locations, and its contribution to the quality of urbanization will become strengthened. Based on the above estimation results, we can roughly divide the process of China’s HSR network into three periods. From the results of Figure 2b, these three periods can be further identified as 2010–2012, 2013–2015, and 2016–2019, with estimated coefficients of +0.0037, −0.0066, and −0.0203, respectively. The corresponding HSR coverage ranges are 0–25.27%, 33.33–53.48%, and over 61.17%, respectively, showing a strong “stage characteristic” of HSR-network development.
Why did it present such a result? We can give some explanations from the characteristics of the HSR cities at each phase and China’s HSR development plan. According to our survey, before 2012, a total of 69 cities in China had opened high-speed railways, of which 64 were large cities (except for Hengyang, Huanggang, Cangzhou, Lu’an and Suzhou), accounting for more than 90%. During this period, large cities monopolized almost all the HSR resources. These cities hold obvious location advantages in the HSR network, forming a strong “siphon effect”, which is not conducive to the improvement in the urbanization quality in all cities. From 2013 to 2015, China started to enter the “fast track” of high-speed railway construction, aiming to build a “four vertical and four horizontal” HSR network system. Among the 77 new HSR cities, we found that 60 of them belong to small- and medium-sized cities. This breaks the monopoly of large cities over HSR resources and raises their position in the HSR network, thus enhancing the “centrifugal force effect”. In 2016, the Chinese government proposed the “eight vertical and eight horizontal” high-speed-railway network plan. Since then, almost all the new HSR cities have been small- and medium-sized cities, and the distribution of HSR resources has gradually become more balanced. Correspondingly, the centrifugal-force effect has been further expanded, and the positive effect of high-speed rail on urban development has shown an incremental trend. These changes in impacts have not been tested in previous studies. All these findings provide strong empirical evidence for the “core-periphery” theory of the new economic geography [38], as well as for the existence of the HSR network’s effects.
However, it is worth noting that when data in 2019 are added to the sub-sample interval, the estimated coefficient rebounds significantly, indicating that the centrifugal-force effect is also weakening to some extent. As shown in Table 7, there were only 11 new HSR cities in 2019, the second-lowest of all years. This means that the size of China’s HSR network (number of nodes) has gradually stabilized and its scale effect is diminishing. How to maintain the positive effects of the HSR network will be a challenge for the next phase of HSR planning in China. More efficient network connection (HSR routes) may be the focus of attention rather than the number of nodes (HSR scale).
4.5. HSR Network and the Quality of Urbanization: Main Beneficiaries
The improvement in transportation conditions has strengthened the cross-regional links as China’s urbanization progresses. To boost urbanization quality and regional core competitiveness, China has proposed the Urban Agglomeration Development Strategy. This strategy emphasizes coordination between neighboring cities in the vicinity, which fits well within the comfort zone of high-speed rail travel. Thus, in order to verify its policy effect, this paper divided 273 cities into 208 urban agglomeration cities and 65 non-urban agglomeration cities according to the 14th Five-Year Plan. The estimated results are shown in Table 8 below.
From the results, urban agglomeration development strategy has proved useful. Firstly, the estimated coefficients of hsr_rdc in Model (1) and Model (2) were statistically negative, whereas the estimated coefficients of hsr_rdc in Model (5) and Model (6) were not significant. This shows that the decline of HSR relative degree centrality has a negligible impact on the growth of urbanization quality in non-urban agglomeration cities, but a considerable benefit for urban agglomeration cities. As a result, the development of HSR network will be more conducive to urban agglomeration cities, rather than non-urban agglomeration cities. Furthermore, the estimation coefficients of hsr_rbc in Model (4) and Model (8) were significantly positive and negative, respectively. This means that the HSR mediating effect can promote the development of urban agglomeration cities but inhibit the development of non-urban agglomeration cities. So, by comparing the regression results of two HSR network variables, we can see that both degree centrality and betweenness centrality have proved that urban agglomeration cities may benefit more from the HSR network, which is consistent with the conclusions of Yin et al. [59]. This heterogeneity can be explained by two aspects. First, urban agglomeration cities often have a higher economic level and larger population size (e.g., Yangtze River Delta city agglomeration, Pearl River Delta city agglomeration and Beijing–Tianjin–Hebei city agglomeration). In these areas, more travelers are able to afford the expensive HSR price, and the frequency of HSR service is also relatively high, thus making the role of high-speed rail more obvious. Taking the Beijing–Tianjin Intercity as an example, its shortest departure interval has been shortened to 3 min, and its daily capacity exceeds 70,000 trips3, which undoubtedly gives a great impetus to the development of the economy of the Beijing–Tianjin–Hebei urban agglomeration. Secondly, the role of HSR often requires regional policies to work with it, and governments can effectively avoid becoming peripheral cities by adjusting and restructuring local endowments [60]. The development of urban agglomerations is characterized by a high degree of uniformity, especially in policy formulation. This means that the resource integration and restructuring of urban agglomeration cities will face less resistance, which is more conducive to the positive effects of HSR. All evidence supports Hypothesis 3.
4.6. HSR Network and the Quality of Urbanization: Robustness Test
Regarding the robustness test, scholars often choose lagged variables and proxy variables to replace the original variables, or change the time length of the sample. However, these methods are not applicable in this paper for two reasons. (1) Centrality is a proprietary measure of node importance in network analysis and is difficult to substitute. (2) Our study emphasizes the heterogeneity of the temporal dimension. Therefore, we still draw on the approach commonly used in spatial econometric analysis, which is to replace the spatial weight matrix, to perform robustness tests. In this paper, another spatial weight matrix is the adjacency matrix. The results of all sample and sub-urban agglomerations based on adjacent distance weight matrix are shown in Table 9. From the result, we can see that almost all the coefficients do not change in sign. As a result, the empirical findings can be considered reliable.
5. Discussions and Conclusions
In this paper, we applied the improved social-network analysis method and the panel entropy weight method to measure the importance of cities in the HSR network and their urbanization quality, respectively. After that, using spatial econometric model and rolling-window regression idea, we empirically tested the impact of the HSR network on the quality of urbanization and its dynamics over the period 2009–2019. On this basis, we further explored who the main beneficiaries of HSR networking were in terms of city cluster classification. The following conclusions were drawn. (1) The HSR network can significantly contribute to the improvement in urbanization quality, and the direct effect of the network is stronger than the intermediary effect. The positive effect is due to the dilution effect of the increased network size, which promotes the equality of cities in the HSR network. (2) The impact of HSR network on urbanization quality shows a marginal increasing trend and obvious periodic characteristics over time. Depending on the coverage of HSR cities, the impact can be roughly divided into three stages: inhibition (0–30%), relatively weak promotion (30–60%) and relatively strong promotion (more than 60%). (3) The impact of an HSR network on urbanization quality is urban and heterogeneous. Urban agglomeration cities will benefit more from the HSR network, while non-urban agglomeration cities will be at a relative disadvantage.
With the rapid development of high-speed rail networks, a growing number of studies have begun to focus on the issue of high-speed rail and urban development. Regarding how HSR affects urban development, two types of conclusions are presented separately: the promotion effect and inhibition effect. Both views are supported by substantial research [15,16,39,61,62], which has led to a sharp research controversy. As distinguished from these studies, we derived both conclusions based on the perspective of changes in the network size, which provides a plausible explanation for the controversy. In their studies, some were due to ignoring the network externalities of the HSR, while others were limited by sample selection, which resulted in unobserved network effects. For example, the Chinese HSR data used by Chen and Vickerman [15] and Li et al. [61] were all dated before 2016, when the network effects of Chinese HSR were not apparent. It is worth mentioning that using the rolling-window causality test, Liu and Su [63] also verified two effects of transport infrastructure on urbanization, but failed to consider the network characteristics of the infrastructure. Moreover, due to the difference in sample selection (1949–2014), the specific relationship is not consistent. In addition to its academic value, this study has important policy implications for future HSR layout and the improvement in urbanization quality in China and other countries.
First, China should expedite the transition of its development power and drive urban growth using technological innovation. In the current stage, the demographic dividend of Chinese economic development is fading as fertility declines and the population ages [64]. If the Chinese government wishes to achieve high-quality urbanization while maintaining rapid economic growth, the improvement in the individual labor conversion rate and the participation of other factors will be necessary. Our empirical results show that technical support is the most stable positive factor contributing to the quality improvement in urbanization, so it is still very necessary for the government to continue to increase the investment funding for research and technology.
Second, the government should formulate and adjust its policies according to the different stages of HSR network construction. For example, in the early stages, large cities will have a very significant siphoning effect on the surrounding small- and medium-sized cities. At this point, policies such as strict population mobility and household registration restrictions are very necessary. But when the coverage reaches a high level, these policies should be adjusted in time to ensure the healthy development of large cities due to the gradual increase in the centrifugal force effect. Specially for China, the network-scale effect is beginning to show its weakness. With the completion of the “eight vertical and eight horizontal” high-speed railway plan, the scale of the HSR network (the number of nodes) has basically stabilized, but the number of connections still has a huge upside. As a consequence, the key to future HSR layout and city competition lies in how to effectively connect HSR cities to each other. Our research shows that HSR has both positive and negative effects. Therefore, cities should reasonably plan the high-speed rail network according to local endowment conditions to give full play to the positive side of the high-speed rail effect.
Third, urban agglomeration growth paradigms should be appreciated and broadly popularized. In the urban agglomeration development model, the advantages of the HSR network can be further reflected and better utilized. Governments at all levels need to formulate a unified and complementary development plan based on the factor endowment and the technological level. Satellite cities and other surrounding cities should provide corresponding support for the development of core cities and help to enhance the competitiveness of core cities, including the integration of regional transportation, larger market foundation and financial support. In return, the core city should actively promote the characteristic industry growth of neighboring cities and build a comparative advantage. All urban agglomeration cities eventually are mutually beneficial and form a virtuous loop.
However, there are still some limitations in this study. First, due to data constraints, we did not use a complete rolling-window regression method, but only drew on the idea. In the empirical process of our dynamic impact, we lacked the coefficient stability test (such as Sub-F, Mean-F and Exp-F test), and the window setting value was far less than the minimum value of 20. Second, although we adopted the maximum likelihood estimation and fixed-effect model to alleviate endogeneity, it is still difficult to completely eradicate. This is because the urbanization quality index covers all aspects of social and economic development, and has a general two-way causal relationship with independent variables. Third, this paper did not explore the causal relationship between the HSR network and urbanization quality, but only considered the correlation relationship, which may reduce the credibility of the explanation. These issues require the further refinement of empirical tools and more in-depth research.
Author Contributions
J.C.: conceptualization, investigation, methodology, writing—original draft, writing—review and editing. W.L.: conceptualization, methodology, project administration, funding acquisition, writing—review and editing. B.W.: conceptualization, methodology, writing—review and editing, data curation, formal analysis. Z.Y.: conceptualization, writing—review and editing, data curation, formal analysis. All authors have read and agreed to the published version of the manuscript.
Funding
This research was funded by Humanities and Social Sciences Planning Project [2023JBW8006], National Key Research and Development Program for Advanced Rail Transit of China [2018YFB201401], Major Project of National Social Science Foundation of China [17ZDA084]. And The APC was funded by Humanities and Social Sciences Planning Project [2023JBW8006].
Data Availability Statement
The data presented in this study are available on request from the corresponding author.
Acknowledgments
The author would like to thank the anonymous reviews for their helpful comments, which helped to improve both the technical quality and exposition of this paper substantially.
Conflicts of Interest
The authors declare no conflict of interest.
| 1 | In this table, hsr_dum, hsr_rdc, hsr_adc, hsr_rbc, hsr_abc denote the estimation results when the core explanatory variables (HSR) are the HSR dummy variable, the HSR relative centrality, the HSR absolute centrality, the HSR relative betweenness centrality and the HSR absolute betweenness centrality, respectively. W × hsr denotes the impact of the local HSR network on the quality of urbanization in other cities. Rtec, rfin, rmar, and rfdi are a series of control variables. pho is the spatial spillover coefficient. sigma2 is the individual variance. city FE and year FE denote individual-fixed terms and time-fixed terms, respectively. N is the total number of observations. logL is the maximum likelihood estimate. Vif is the variance inflation factor. LM-sar and LM-sem denote the Lagrange multiplier test results for the SAR and SEM models, respectively. |
| 2 | In this table, W × hsr denotes the impact of the local HSR network on the quality of urbanization in other cities. LR_hsr indicates the longer-term impact of the HSR network on urbanization. Con-var is a series of control variables. N is the total number of observations. logL is the maximum likelihood estimate. Vif is the variance inflation factor. LM-sar and LM-sem denote the Lagrange multiplier test results for the SAR and SEM models, respectively. |
| 3 | Data from China High-Speed Rail Timetable. |
| 4 | In this table, W × hsr denotes the impact of the local HSR network on the quality of urbanization in other cities. Con-var is a series of control variables. city FE and year FE denote individual-fixed terms and time-fixed terms, respectively. N is the total number of observations. |
References
- Colliar, P.; Venables, A.J. Urban Infrastructure for Development. Oxf. Rev. Econ. Pol. 2016, 3, 391–409. [Google Scholar] [CrossRef]
- Wu, R.; Li, Y.C.; Wang, S.J. Will the Construction of High-speed Rail Accelerate Urban Land Expansion? Evidences from Chinese Cities. Land Use Pol. 2021, 114, 105920. [Google Scholar] [CrossRef]
- Zhang, P.F.; Zhao, Y.Y.; Zhu, X.Y.; Cai, Z.W.; Xu, J.X.; Shi, S. Spatial Structure of Urban Agglomeration under the Impact of High-speed Railway Construction: Based on the Social Network Analysis. Sustain. Cities Soc. 2020, 62, 102404. [Google Scholar] [CrossRef]
- Meng, X.Y.; Lin, S.L.; Ren, G. The Effect of HSR Connection on Urban Cluster Centrality: Evidence from China. Appl. Econ. 2022, 54, 3088–3102. [Google Scholar] [CrossRef]
- Givoni, M. Development and Impact of the Modern High-speed Train: A Review. Transp. Rev. 2006, 26, 593–611. [Google Scholar] [CrossRef]
- Guo, Y.; Cao, L.Y.; Song, Y.; Wang, Y.; Li, Y.K. Understanding the Formation of City-HSR Network: A Case Study of Yangtze River Delta, China. Transp. Pol. 2022, 116, 315–326. [Google Scholar] [CrossRef]
- Mortberg, U.; Haas, J.; Zetterberg, A.; Franklin, J.P.; Jonsson, D.; Deal, B. Urban Ecosystems and Sustainable Urban Development-analysing and Assessing Interacting Systems in the Stockholm Region. Urban Ecosyst. 2022, 16, 763–782. [Google Scholar] [CrossRef]
- Shaw, S.L.; Fang, Z.X.; Lu, S.W.; Tao, R. Impacts of High Speed Rail on Railroad Network Accessibility in China. J. Transp. Geogr. 2014, 40, 112–122. [Google Scholar] [CrossRef]
- Jiao, J.J.; Wang, J.O.; Jin, F.J. Impacts of High-speed Rail Lines on the City Network in China. J. Transp. Geogr. 2017, 60, 257–266. [Google Scholar] [CrossRef]
- Graham, D.; Melo, P. Assessment of Wider Economic Impacts of High-Speed Rail for Great Britain. Transport. Res. Rec. 2011, 2261, 15–24. [Google Scholar] [CrossRef]
- Harman, R. High Speed Trains and the Development and Regeneration of Cities. Greengauge 2006, 21, 1–21. Available online: http://refhub.elsevier.com/S0965-8564(18)31064-4h0075 (accessed on 21 June 2006).
- Wang, F.; Wei, X.; Liu, J.; He, L.; Gao, M. Impact of High-speed Rail on Population Mobility and Urbanisation: A Case Study on Yangtze River Delta Urban Agglomeration, China. Transp. Res. Part A Pol. Pract. 2019, 127, 99–114. [Google Scholar] [CrossRef]
- Kim, H.; Sultana, S. The Impacts of High-speed Rail Extensions on Accessibility and Spatial Equity Changes in South Korea from 2004 to 2018. J. Transp. Geogr. 2015, 45, 48–61. [Google Scholar] [CrossRef]
- Maparu, T.S.; Mazumder, T.N. Transport Infrastructure, Economic Development and Urbanization in India (1990-2011): Is There Any Causal Relationship? Transp. Res. Part A Pol. Pract. 2017, 100, 319–336. [Google Scholar] [CrossRef]
- Chen, C.L.; Vickerman, R. Can Transport Infrastructure Change Regions’ Economic Fortunes? Some Evidence from Europe and China. Reg. Stud. 2017, 51, 144–160. [Google Scholar] [CrossRef]
- Gao, Y.; Song, S.; Sun, J.; Zang, L. Does High-speed Rail Connection Really Promote Local Economic? Evidence from China’s Yangtze River Delta Region. Rev Dev Econ. 2020, 24, 316–338. [Google Scholar] [CrossRef]
- Wang, D.; Wei, D.Y.; Deng, T. Transportation Development, Spatiotemporal Convergence, and Urban Land Use: Study of the Opening of High-Speed Rails in the Yangtze River Delta, China. J. Urban Plan. Dev. 2021, 147, 5021023. [Google Scholar] [CrossRef]
- Jia, R.; Shao, S.; Yang, L. High-speed Rail and CO2 Emissions in Urban China: A Spatial Difference-in-differences Approach. Energ. Econ. 2021, 99, 105271. [Google Scholar] [CrossRef]
- Yu, Y.; Pan, Y. Does High-speed Rail Reduce the Rural-urban Income Disparity? An Interpretation Based on the Perspective of Heterogeneous Labor Mobility. Chin. Rural Econ. 2019, 1, 79–95. (In Chinese) [Google Scholar]
- Zhong, C.; Cai, H.; Shi, Q. Will High-speed Rail Bring Cleaning to the Cities? Evidence from China. Appl. Econ. Lett. 2021, 30, 259–263. [Google Scholar] [CrossRef]
- Yang, X.; Lin, S.; Li, Y.; He, M. Can High-speed Rail Reduce Environmental Pollution? Evidence from China. J. Clean. Prod. 2019, 239. [Google Scholar] [CrossRef]
- Zhang, A.L.; Pan, M.M.; Liu, B.; Cao, X.B. Do High-speed Rail (HSR) Station and Airport Affect Local Government Debt Risk? Evidence from China. Transp. Pol. 2023, 134, 41–51. [Google Scholar] [CrossRef]
- Compa, J.L.; Arce, R.; López-Lambas, M.E.; Guirao, B. Can HSR Improve the Mobility of International Tourists Visiting Spain? Territorial Evidence Derived from the Spanish Experience. J. Transp. Geogr. 2018, 73, 94–107. [Google Scholar] [CrossRef]
- Martínez Sánchez-Mateos, H.S.; Givoni, M. The Accessibility Impact of a New High-Speed Rail Line in the UK—A Preliminary Analysis of Winners and Losers. J. Transp. Geogr. 2012, 25, 105–114. [Google Scholar] [CrossRef]
- Cascetta, E.; Carteni, A.; Henke, I.; Pagliara, F. Economic Growth, Transport Accessibility and Regional Equity Impacts of High-speed Railways in Italy: Ten Years Expost Evaluation and Future Perspectives. Transp. Res. Part A Pol. Pract. 2020, 139, 412–428. [Google Scholar] [CrossRef]
- Chen, C.; Hall, P. The Wider Spatial-economic Impacts of High-speed Trains: A Comparative Case Study of Manchester and Lille Sub-regions. J. Transp. Geogr. 2012, 24, 89–110. [Google Scholar] [CrossRef]
- Li, T.; Rong, L.; Yan, K. Vulnerability Analysis and Critical Area Identification of Public Transport System: A Case of High-speed Rail and Air Transport Coupling System in China. Transp. Res. Part A Pol. Pract. 2019, 127, 55–70. [Google Scholar] [CrossRef]
- Yang, H.; Dobruszkes, F.; Wang, J.; Dijst, M.; Witte, P. Comparing China’s Urban Systems in High-speed Railway and Airline Networks. J. Transp. Geogr. 2018, 68, 233–244. [Google Scholar] [CrossRef]
- Chen, C.; D’Alfonso, T.; Guo, H.; Jiang, C. Graph Theoretical Analysis of the Chinese High-speed Rail Network Over Time. Res. Transp. Econ. 2018, 72, 3–14. [Google Scholar] [CrossRef]
- Xu, W.; Zhou, J.; Qiu, G. China’s High-speed Rail Network Construction and Planning over Time: A Network Analysis. J. Transp. Geogr. 2018, 70, 40–54. [Google Scholar] [CrossRef]
- Xu, W.; Zhou, J.; Yang, L. The Implications of High-speed Rail for Chinese Cities: Connectivity and Accessibility. Transp. Res. Part A Pol. Pract. 2018, 116, 308–326. [Google Scholar] [CrossRef]
- Liu, X.; Jiang, C.; Wang, F.; Yao, S. The Impact of High-speed Railway on Urban Housing Prices in China: A Network Accessibility Perspective. Transp. Res. Part A Pol. Pract. 2021, 152, 84–99. [Google Scholar] [CrossRef]
- Liu, S.; Wan, Y.; Zhang, A. Does China’s High-speed Rail Development Lead to Regional Disparities? A Network Perspective. Transp. Res. Part A Pol. Pract. 2020, 138, 299–321. [Google Scholar] [CrossRef]
- Coase, R.H. The Problem of Social Cost. J. Law Econ. 1960, 3, 1–44. Available online: http://www.jstor.org/stable/724810 (accessed on 1 October 2023). [CrossRef]
- Guirao, B.; Campa, J.L.; Casado-Sanz, N. Labour Mobility Between Cities and Metropolitan Integration: The Role of High-speed Rail Commuting in Spain. Cities 2018, 78, 140–154. [Google Scholar] [CrossRef]
- Duan, L.; Niu, D.; Sun, W.; Zheng, S. Transportation Infrastructure and Capital Mobility: Evidence from China’s High-speed Railways. Ann. Regional Sci. 2021, 67, 617–648. [Google Scholar] [CrossRef]
- Komikado, H.; Morikawa, S.; Bhatt, A.; Kato, H. High-speed Rail, Inter-regional Accessibility, and Regional Innovation: Evidence from Japan. Technol. Forecast. Soc. 2021, 167, 120697. [Google Scholar] [CrossRef]
- Combes, P.P.; Mayer, T.; Thisse, J.F. Economic Geography: The Integration of Regions and Nations; Princeton University Press: Princeton, NJ, USA, 2008. [Google Scholar]
- Chen, Z.H.; Xue, J.B.; Rose, A.Z.; Haynes, K.E. The Impact of High-speed Rail Investment on Economic and Environmental Change in China: A Dynamic CGE Analysis. Transp. Res. Part A Pol. Pract. 2016, 92, 232–245. [Google Scholar] [CrossRef]
- Fujita, M.; Mori, T. Transport Development and the Evolution of Economic Geography. Port. Econ. J. 2005, 4, 129–156. [Google Scholar] [CrossRef]
- Bian, Y.C.; Wu, L.H.; Bai, J.H. High-speed Rail, Factor Flow and Regional Economic Disparities. Financ. Trade Econ. 2018, 39, 147–161. (In Chinese) [Google Scholar] [CrossRef]
- Chen, Z.H.; Haynes, K.Z. Impact of High-speed Rail on Regional Economic Disparity in China. J. Transp. Geogr. 2017, 65, 81–90. [Google Scholar] [CrossRef]
- Adler, N.; Pels, E.; Nash, C. High-speed Rail and Air Transport Competition: Game Engineering as Tool for Cost-benefit Analysis. Transport. Res. B-Meth. 2010, 44, 812–833. [Google Scholar] [CrossRef]
- UIC (International Union of Railways), n.d. General Definitions of High Speed. Available online: https://uic.org/highspeed (accessed on 12 October 2019).
- Fang, C.L.; Yu, D.L. Urban Agglomeration: An Evolving Concept of An Emerging Phenomenon. Landsc. Urban Plan. 2017, 162, 126–136. [Google Scholar] [CrossRef]
- Wasserman, S.; Faust, K. Social Network Analysis: Methods and Applications; Structural Analysis in the Social Sciences; Cambridge University Press: Cambridge, UK, 1994. [Google Scholar] [CrossRef]
- Opsahl, T.; Agneessens, F.; Skvoretz, J. Node Centrality in Weighted Networks: Generalizing Degree and Shortest Paths. Soc. Netw. 2010, 32, 245–251. [Google Scholar] [CrossRef]
- Wang, Z.; Sun, Y.; Wang, B. How Does the New-type Urbanisation Affect CO2 Emissions in China? An Empirical Analysis from the Perspective of Technological Progress. Energ. Econ. 2019, 80, 917–927. [Google Scholar] [CrossRef]
- Yu, B.B. Ecological effects of new-type urbanization in China. Renew. Sust. Energ. Rev. 2020, 135, 110239. [Google Scholar] [CrossRef]
- Zhang, X.; Wei, F.L.; Yuan, X.M. Evaluation and Evolution of Provincial High-Quality Green Development in China. Econ. Geogr. 2010, 40, 108–116. (In Chinese) [Google Scholar] [CrossRef]
- Damanpour, F.; Walker, R.M.; Avellaneda, C.N. Combinative Effects of Innovation Types and Organizational Performance: A Longitudinal Study of Service Organizations. J. Manag. Stud. 2009, 46, 650–675. [Google Scholar] [CrossRef]
- Berger, A.N.; Udell, G.F. A More Complete Conceptual Framework for SME Finance. J. Bank. Financ. 2006, 30, 2945–2966. [Google Scholar] [CrossRef]
- Guan, X.; Wei, H.; Lu, S.; Dai, Q.; Su, H. Assessment on the Urbanization Strategy in China: Achievements, Challenges and Reflections. Habitat Int. 2018, 71, 97–109. [Google Scholar] [CrossRef]
- Han, X.; Xia, X.; Zhao, M.; Xu, K.; Li, X. Synergistic Effects between Financial Development and Improvements in New-type Urbanization: Evidence from China. Emerg. Mark. Financ. Trade 2020, 56, 2055–2072. [Google Scholar] [CrossRef]
- Chen, T.; Lu, H.; Chen, R.; Wu, L. The Impact of Marketization on Sustainable Economic Growth—Evidence from West China. Sustainability 2021, 13, 3745. [Google Scholar] [CrossRef]
- Kim, S. Influence of FDI on the Regional Economic Growth of Shaanxi Province in China. J. Sinol. China Stud. 2014, 62, 141–157. [Google Scholar]
- Liu, Y.; Xiao, H.; Lv, Y.; Zhang, N. The Effect of New-type Urbanization on Energy Consumption in China: A Spatial Econometric Analysis. J. Clean. Prod. 2017, 163, S299–S305. [Google Scholar] [CrossRef]
- Ren, X.; Wang, Y.; Dan, T. Influences of Opening High-speed Rail on the Economic Growth of Small and Mediun-sized Cities. Urban Probl. 2020, 91–97. (In Chinese) [Google Scholar] [CrossRef]
- Yin, M.; Bertolini, L.; Duan, J. The Effects of the High-speed Railway on Urban Development: International Experience and Potential Implications for China. Prog. Plann. 2015, 98, 1–52. [Google Scholar] [CrossRef]
- Jia, S.; Zhou, C.; Qin, C. No Difference in Effect of High-speed Rail on Regional Economic Growth Based on Match Effect Perspective? Transp. Res. Part A Pol. Pract. 2017, 106, 144–157. [Google Scholar] [CrossRef]
- Li, H.; Strauss, J.; Hu, S.; Lui, L. Do High-speed Railways Lead to Urban Economic Growth in China? A Panel Data Study of China’s Cities. Q. Rev. Econ. Financ. 2018, 69, 70–89. [Google Scholar] [CrossRef]
- Qin, Y. ‘No County Left Behind?’ The Distributional Impact of High-speed Rail Upgrades in China. J. Econ. Geogr. 2017, 17, 489–520. [Google Scholar] [CrossRef]
- Liu, T.; Su, C. Is Transportation Improving Urbanization in China? Socio-Econ. Plan. Sci. 2021, 77, 101034. [Google Scholar] [CrossRef]
- Wu, P.; Wu, C.; Wu, Y. Reforming Path of China’s Fertility Policy in Stabilizing Demographic Dividends Perspective. Soc. Indic. Res. 2018, 137, 1225–1243. [Google Scholar] [CrossRef]
Figure 1.
Spatial distribution of centrality changes from 2009–2019. (a) Relative degree centrality in 2009 (b) Relative degree centrality in 2014 (c) Relative degree centrality in 2019 (d) Relative betweenness centrality in 2009 (e) Relative betweenness centrality in 2014 (f) Relative betweenness centrality in 2019.

Figure 2.
Estimated coefficients and significance under different rolling windows. Note: The horizontal axis time indicates the year ending at that window size.
Figure 2.
Estimated coefficients and significance under different rolling windows. Note: The horizontal axis time indicates the year ending at that window size.


Table 1.
Descriptive statistics of various variables.
| Variable | Units | Mean | Std. Dev. | Min | Max |
|---|---|---|---|---|---|
| qu | - | 0.181 | 0.187 | 0.018 | 2.734 |
| hsr dum | - | 0.418 | 0.493 | 0 | 1 |
| hsr rdc | % | 0.727 | 1.249 | 0 | 16.667 |
| hsr adc | % | 0.858 | 1.154 | 0 | 6.919 |
| hsr rbc | % | 2.289 | 5.374 | 0 | 45.729 |
| hsr abc | % | 269.475 | 724.542 | 0 | 8738.812 |
| rtech | % | 0.003 | 0.002 | 0 | 0.041 |
| rmar | % | 0.381 | 0.108 | 0.026 | 1.013 |
| rfin | % | 2.373 | 6.423 | 0.004 | 128.569 |
| rfdi | % | 0.018 | 0.020 | 0 | 0.460 |
Table 2.
Evaluation system of urbanization quality.
| Index I | Index II | Weight (%) | Unit |
|---|---|---|---|
| Population urbanization | : Urban population density | 35.44 | Person/square kilometer |
| : Proportion of urban district population | 35.40 | % | |
| : Proportion of employees in secondary and tertiary industries | 0.40 | % | |
| Economy urbanization | : Per capita GRP | 1.81 | Yuan |
| : Proportion of GRP of secondary and tertiary industries | 1.18 | % | |
| : GDP density of secondary and tertiary industries | 7.66 | 10 thousand yuan/km2 | |
| Space urbanization | : Proportion of built-up area | 7.00 | % |
| : Per capita built-up area | 0.78 | Square meter | |
| : Per capita living area in urban | 0.54 | Square meter | |
| : Per capita road area in urban | 0.79 | Square meter | |
| Environment urbanization | : Per capita green area | 0.48 | Square meter |
| : Green coverage rate of built-up district | 0.09 | % | |
| : Domestic garbage treatment rate | 0.06 | % | |
| : Wastewater treatment rate | 0.14 | % | |
| Society urbanization | : Per capita education expenditure | 2.13 | Yuan |
| : Medical facility beds per 1000 people | 0.98 | Set | |
| : Books in public libraries per 100 people | 4.51 | Piece | |
| : Average salary of urban employees | 0.95 | Yuan/Person |
Table 3.
Definitions of variables.
| Variables | Definition and Calculation Methods |
|---|---|
| hsr_dum | Dummy variable, whether a city has an HSR station (Yes = 1 and No = 0) |
| hsr_rdc | HSR relative degree centrality, a city’s ability to connect directly in the global HSR network, calculated via Equation (1) (%) |
| hsr_adc | HSR absolute degree centrality, a city’s ability to connect directly in the local HSR network, calculated via Equation (1) × (N − 1) (%) |
| hsr_rbc | HSR relative betweenness centrality, a city’s ability to connect indirectly in the global HSR network, calculated via Equation (2) (%) |
| hsr_abc | HSR absolute betweenness centrality, a city’s ability to connect indirectly in the local HSR network, calculated via Equation (2) × (N2 − 3N + 2) (%) |
| rtec | Technology support, the proportion of science and technology expenditure (%) |
| rfin | Financial development, the total loan balance of all financial institutions divided by gross regional product (%) |
| rmar | Marketization degree, the total retail consumption of the market divided by the gross regional product (%) |
| rfdi | Economic openness, the total amount of foreign investment actually utilized (FDI) divided by the gross regional product (%) |
Table 4.
HSR development in the initial HSR cities.
| City | HSR Lines | HSR Relative Degree Centrality | HSR Relative Betweenness Centrality | |||
|---|---|---|---|---|---|---|
| 2009 | 2019 | 2009 | 2019 | 2009 | 2019 | |
| Beijing | 1.0000 | 3.0000 | 5.5560 | 1.5000 | 0.0000 | 3.1010 |
| Tianjing | 1.0000 | 5.0000 | 5.5560 | 2.0000 | 0.0000 | 20.1610 |
| Shijiazhuang | 1.0000 | 3.0000 | 5.5560 | 2.0000 | 0.0000 | 10.9280 |
| Qinhuangdao | 1.0000 | 2.0000 | 5.5560 | 1.0000 | 0.0000 | 17.7990 |
| Nanjing | 1.0000 | 5.0000 | 5.5560 | 3.5000 | 0.0000 | 45.7290 |
| Hefei | 2.0000 | 4.0000 | 11.1110 | 1.0000 | 1.9610 | 5.0090 |
| Wuhan | 1.0000 | 2.0000 | 5.5560 | 3.0000 | 0.0000 | 9.7540 |
| Huanggang | 1.0000 | 2.0000 | 11.1110 | 1.5000 | 1.9610 | 4.0860 |
| Ji’nan | 1.0000 | 4.0000 | 5.5560 | 2.0000 | 0.0000 | 23.8520 |
| Qingdao | 1.0000 | 4.0000 | 5.5560 | 1.5000 | 0.0000 | 4.5030 |
| Zibo | 1.0000 | 2.0000 | 11.1110 | 1.5000 | 1.3070 | 6.1910 |
| Weifang | 1.0000 | 2.0000 | 11.1110 | 1.0000 | 1.3070 | 5.3370 |
| Taiyuan | 1.0000 | 3.0000 | 5.5560 | 1.5000 | 0.0000 | 6.5380 |
| Shenyang | 1.0000 | 5.0000 | 5.5560 | 3.0000 | 0.0000 | 9.0960 |
| Panjin | 1.0000 | 2.0000 | 16.6670 | 2.5000 | 1.9610 | 7.8020 |
| Yangquan | 1.0000 | 1.0000 | 11.1110 | 1.0000 | 0.6540 | 6.3740 |
| Jinzhou | 1.0000 | 1.0000 | 11.1110 | 2.0000 | 0.0000 | 7.9510 |
| Huludao | 1.0000 | 1.0000 | 16.6670 | 1.5000 | 1.9610 | 17.0950 |
| Liu’an | 1.0000 | 1.0000 | 11.1110 | 1.0000 | 2.6140 | 4.4090 |
| national mean | 1.0526 | 1.6244 | 8.7722 | 1.1117 | 0.7224 | 5.2822 |
| national sd | 0.2294 | 1.0107 | 3.8470 | 0.5128 | 0.9470 | 7.6108 |
Notes: HSR relative degree centrality measures a city’s ability to connect directly in the global HSR network; HSR relative betweenness centrality measures a city’s ability to connect indirectly to the global HSR network.
Table 5.
Moran’s I of the quality of urbanization in China.
| Year | 2009 | 2010 | 2011 | 2012 | 2013 | 2014 | 2015 | 2016 | 2017 | 2018 | 2019 |
|---|---|---|---|---|---|---|---|---|---|---|---|
| Moran’s I | 0.055 | 0.052 | 0.058 | 0.054 | 0.055 | 0.055 | 0.062 | 0.061 | 0.065 | 0.047 | 0.063 |
| p-value | 0.000 | 0.000 | 0.000 | 0.000 | 0.000 | 0.000 | 0.000 | 0.000 | 0.000 | 0.000 | 0.000 |
Note: the global autocorrelation test results are based on the geographical distance weight matrix.
Table 6.
The result of overall regression1.
Table 6.
The result of overall regression1.
| Variables | Dependent Variable: Quality of Urbanization | |||||||||
|---|---|---|---|---|---|---|---|---|---|---|
| hsr_dum | hsr_rdc | hsr_adc | hsr_rbc | hsr_abc | ||||||
| (1) | (2) | (3) | (4) | (5) | (6) | (7) | (8) | (9) | (10) | |
| hsr | −0.0087 ** | −0.0097 *** | −0.0052 *** | −0.0047 *** | −0.0001 | −0.0010 | 0.0002 | 0.0004 | 0.0001 | 0.0001 ** |
| W × hsr | 0.0326 *** | 0.0067 | 0.0384 *** | 0.0198 * | 0.0100 *** | −0.0055 | 0.0014 * | −0.0007 | 0.0001 | −0.0001 ** |
| rtec | 4.1260 *** | 4.1080 *** | 4.1606 *** | 4.1530 *** | 4.0645 *** | |||||
| rfin | 0.0000 | 0.0000 | 0.0000 | 0.0000 | 0.0000 | |||||
| rmar | −0.0788 *** | −0.0806 *** | −0.0807 *** | −0.0808 *** | −0.0841 *** | |||||
| rfdi | −0.2950 *** | −0.2940 *** | −0.2903 *** | −0.2910 *** | −0.2821 *** | |||||
| rho | 0.6600 *** | 0.2800 ** | 0.7770 *** | 0.2810 ** | 0.6686 *** | 0.2858 ** | 0.7640 *** | 0.2880 ** | 0.7471 *** | 0.2939 ** |
| sigma2 | 0.0031 *** | 0.0030 *** | 0.0031 *** | 0.0030 *** | 0.0031 *** | 0.0030 *** | 0.0031 *** | 0.0030 *** | 0.0031 *** | 0.0030 *** |
| city FE | YES | YES | YES | YES | YES | YES | YES | YES | YES | YES |
| year FE | YES | YES | YES | YES | YES | YES | YES | YES | YES | YES |
| N | 2730 | 2730 | 2730 | 2730 | 2730 | 2730 | 2730 | 2730 | 2730 | 2730 |
| logL | 4008.9755 | 4059.2649 | 4011.5885 | 4062.8970 | 4005.8872 | 4056.2412 | 4002.2400 | 4056.5197 | 4003.6787 | 4059.3856 |
| Vif | 1.0000 | 1.1100 | 1.0000 | 1.0700 | 1.0000 | 1.1100 | 1.0000 | 1.0700 | 1.0000 | 1.0700 |
| LM-sar | 226.672 *** | 89.904 *** | 679.041 *** | 176.317 *** | 222.179 *** | 86.823 *** | 616.320 *** | 165.752 *** | 604.148 *** | 170.270 *** |
| (Robust) | 0.475 | 7.478 *** | 54.134 *** | 3.527 *** | 1.536 | 10.985 *** | 10.747 *** | 0.543 | 44.508 *** | 0.768 |
| LM-sem | 484.604 *** | 357.409 *** | 627.286 *** | 277.912 *** | 523.487 *** | 393.390 *** | 636.837 *** | 311.785 *** | 641.398 *** | 309.710 *** |
| (robust) | 258.407 *** | 274.983 *** | 2.378 | 105.122 *** | 302.844 *** | 317.553 *** | 31.264 *** | 146.576 *** | 44.508 *** | 140.208 *** |
Notes: * p < 0.1. ** p < 0.05. *** p < 0.01.
Table 7.
The HSR cities and coverage from 2009 to 2019.
| YEAR | 2009 | 2010 | 2011 | 2012 | 2013 | 2014 | 2015 | 2016 | 2017 | 2018 | 2019 |
|---|---|---|---|---|---|---|---|---|---|---|---|
| HSR cities | 19 | 41 | 57 | 69 | 91 | 110 | 146 | 167 | 172 | 186 | 197 |
| New HSR cities | 19 | 22 | 16 | 12 | 22 | 19 | 36 | 21 | 5 | 14 | 11 |
| HSR coverage | 0.07 | 0.15 | 0.21 | 0.25 | 0.33 | 0.40 | 0.53 | 0.61 | 0.63 | 0.68 | 0.72 |
Notes: The total number of cities is equal to 273.
Table 8.
The result of urban agglomerations and non-urban agglomerations2.
Table 8.
The result of urban agglomerations and non-urban agglomerations2.
| Variables | Dependent Variable: Quality of Urbanization | |||||||
|---|---|---|---|---|---|---|---|---|
| Urban Agglomerations | Non-Urban Agglomerations | |||||||
| (1) | (2) | (3) | (4) | (5) | (6) | (7) | (8) | |
| hsr_rdc | −0.0064 *** | −0.0058 *** | −0.0001 | 0.00001 | ||||
| hsr_rbc | 0.0005 | 0.0007 * | −0.0013 *** | −0.0012 *** | ||||
| W × hsr | 0.0350 *** | 0.0228 * | 0.0012 | −0.0001 | −0.0007 | −0.0030 | 0.0046 *** | 0.0020 ** |
| LR_hsr | 0.1080 *** | 0.0231 | 0.0063 * | 0.0008 | −0.0037 | −0.0037 | 0.0075 *** | 0.0010 |
| Con-var | No | Yes | No | Yes | No | Yes | No | Yes |
| N | 2080 | 2080 | 2080 | 2080 | 650 | 650 | 650 | 650 |
| LogL | 2792.262 | 2835.499 | 2784.876 | 2830.721 | 1819.698 | 1855.436 | 1850.296 | 1873.345 |
| Vif | 1.00 | 1.06 | 1.00 | 1.07 | 1.00 | 1.06 | 1.00 | 1.06 |
| LM-sar | 264.184 *** | 96.496 *** | 331.252 *** | 94.750 *** | 90.643 *** | 41.965 *** | 76.983 *** | 35.990 *** |
| (Robust) | 42.021 *** | 0.000 | 2.567 | 0.217 | 17.562 *** | 46.500 *** | 40.031 *** | 41.224 *** |
| LM-sem | 356.750 *** | 168.177 *** | 338.356 *** | 176.333 *** | 84.544 *** | 18.803 *** | 63.791 *** | 14.836 *** |
| (Robust) | 137.587 *** | 71.681 *** | 9.671 *** | 81.8000 *** | 11.463 *** | 23.337 *** | 26.839 *** | 20.070 *** |
Notes: * p < 0.1. ** p < 0.05. *** p < 0.01.
Table 9.
The regression result based on adjacent distance matrix4.
Table 9.
The regression result based on adjacent distance matrix4.
| Variables | Dependent Variable: Quality of Urbanization | ||||||||
|---|---|---|---|---|---|---|---|---|---|
| Overall Regression | Urban Agglomerations | Non-Urban Agglomerations | |||||||
| (1) | (2) | (3) | (4) | (5) | (6) | (7) | (8) | (9) | |
| hsr_dum | −0.0068 * | ||||||||
| hsr_rdc | −0.0061 *** | −0.0061 *** | −0.0009 | ||||||
| hsr_adc | −0.0008 | ||||||||
| hsr_rbc | 0.0007 ** | 0.0011 ** | −0.0009 *** | ||||||
| hsr_abc | 0.0001 *** | ||||||||
| W×hsr | 0.0294 *** | 0.0095 *** | 0.0118 *** | 0.0002 | 0.0001 | 0.0088 *** | 0.0002 | 0.0032 *** | 0.0012 *** |
| Control | YES | YES | YES | YES | YES | YES | YES | YES | YES |
| city FE | YES | YES | YES | YES | YES | YES | YES | YES | YES |
| year FE | YES | YES | YES | YES | YES | YES | YES | YES | YES |
| N | 2730 | 2730 | 2730 | 2730 | 2730 | 2080 | 2080 | 650 | 650 |
Notes: * p < 0.1. ** p < 0.05. *** p < 0.01.
Disclaimer/Publisher’s Note: The statements, opinions and data contained in all publications are solely those of the individual author(s) and contributor(s) and not of MDPI and/or the editor(s). MDPI and/or the editor(s) disclaim responsibility for any injury to people or property resulting from any ideas, methods, instructions or products referred to in the content. |
© 2023 by the authors. Licensee MDPI, Basel, Switzerland. This article is an open access article distributed under the terms and conditions of the Creative Commons Attribution (CC BY) license (https://creativecommons.org/licenses/by/4.0/).
Share and Cite
MDPI and ACS Style
Chen, J.; Li, W.; Wu, B.; Yu, Z. Does High-Speed Railway Promote the Quality of Urbanization? From a Dynamic Network Perspective. Systems 2023, 11, 523. https://doi.org/10.3390/systems11100523
AMA Style
Chen J, Li W, Wu B, Yu Z. Does High-Speed Railway Promote the Quality of Urbanization? From a Dynamic Network Perspective. Systems. 2023; 11(10):523. https://doi.org/10.3390/systems11100523
Chicago/Turabian StyleChen, Jingyu, Weidong Li, Bingyu Wu, and Zhen Yu. 2023. "Does High-Speed Railway Promote the Quality of Urbanization? From a Dynamic Network Perspective" Systems 11, no. 10: 523. https://doi.org/10.3390/systems11100523
Note that from the first issue of 2016, this journal uses article numbers instead of page numbers. See further details here.