
Efficacy of an Adaptive Learning System on Course Scores

Teaching & Learning Centre, Singapore University of Social Sciences, Singapore 599494, Singapore
*
Author to whom correspondence should be addressed.
Systems 2023, 11(1), 31; https://doi.org/10.3390/systems11010031
Submission received: 14 December 2022
/
Revised: 3 January 2023
/
Accepted: 4 January 2023
/
Published: 5 January 2023
(This article belongs to the Special Issue Innovations in Educational Systems and Digital Transformations in Education)
Abstract
:Adaptive learning systems have gained popularity within higher education, given the affordances that claim to enhance student learning outcomes by providing personalised learning trajectories that allow students to interact with course content at their own pace. Nonetheless, studies investigating the impact of such systems on learning outcomes such as course scores have been mixed, in part due to the research approaches applied, as found by the review undertaken in this study. Yet, for purposes of accountability, it remains critical to investigate the efficacy of adaptive learning systems, at least for its relation to course scores when assessment stakes are involved. This study reports the efficacy of an in-house adaptive learning system used within an institution in terms of its impact on course scores, based upon propensity score analysis, a quasi-experimental approach considered as a feasible alternative to randomised controlled trials. Results of this study reported a difference in course scores, suggesting merit in using the in-house adaptive learning system, though the difference did not present statistically significant differences at the 95% confidence level. Directions for future research are also discussed.
1. Introduction
One of the primary objectives of general and higher education is to create an effective and efficient learning environment for students. However, the classic learning context revolves around an environment in which a learner is provided with the same information, structure, and interface [1]. Yet, to improve diverse students’ learning, educational researchers point out that students learn more effectively when instructional materials are individualised to meet their needs [2]. This is particularly important for students who have been working for some years prior to pursuing academic studies due to job and family responsibilities, and may have limited time to complete academic work related to their coursework [3]. Further, students with diverse levels of knowledge and skills could pose more challenges for faculty members to teach or integrate fundamental concepts into the curriculum.
To enhance students’ competencies and success in multiple programs, alternative teaching and learning approaches are crucial, including the use of technology in instruction that had been emphasised during the recent COVID-19 pandemic [4]. As an example, given the complexity of mathematics [5], sufficient prior knowledge and personalised supports for individual students are important to the enhancement of students’ mathematics learning outcomes [6]. To foster learners’ problem-solving competence, researchers have developed various learning strategies and technological tools to enhance students’ learning outcomes [7]. In particular, adaptive learning platforms have been gaining popularity in higher education settings. A study by [8] suggested that the core elements of adaptiveness contribute to incremental learning, regular assessment, and the availability of many paths to a final destination. In this regard, adaptive learning transforms the learning environment from a fixed to flexible setting.
In addition to making a difference to teaching and learning processes, the adaptive learning approach changes another high priority factor—time. As mentioned, students in the workforce (e.g., part-time students) have limited time due to multiple responsibilities. Yet, for mastery to occur during learning, some students need more time than others. Incidentally, adaptive learning platforms provide a solution to this, by providing students an opportunity to navigate their learning trajectories at a self-determined pace when completing course content within the scheduled deadline [9]. For these reasons, adaptive learning platforms provide flexible context, content, and an opportunity for students in the workforce to complete required pre-requisite assignments at their own pace.
While adaptive learning systems provide some affordances to enhance learning and teaching, efficacy studies of such systems have yielded inconclusive findings, some due to less robust research approaches (e.g., studies without control groups), as identified by the literature review undertaken in this study. Some have reported learning gains in terms of course scores, while others reported otherwise. Nonetheless, it remains critical to establish whether an adaptive learning system impacts learning outcomes, at least in terms of course scores particularly where stakes are higher; in the least desirable situation, an adaptive learning system should not be detrimental to student course scores as they engage with it. To this end, this study seeks to contribute to scholarship by reporting the efficacy of an in-house adaptive learning system used within an institution (i.e., AdLeS) in terms of its impact on course scores, based upon a quasi-experimental approach considered as a feasible alternative to randomised controlled trials.
2. The Potential of Adaptive Learning: Improving Educational Performance
In part to scaffold students’ current levels of understanding and identify knowledge gaps, research studies have also indicated that adaptive learning systems have the potential to improve learners’ performance [10]. However, due to the evolving states of adaptive learning within higher education, research findings on adaptive learning systems have been mixed [11]. In particular, the review undertaken here of some studies published since 2015 found some that showed no statistically significant difference on student learning outcomes and others that demonstrated significant learning outcomes (see Table 1). As an example, to investigate the efficacy of adaptive systems, ref. [1] examined the use of two instructional methods to compare students’ scores and completion rates. The first method employed an adaptive learning approach in which instruction and tasks were adapted in real time. The second method engaged a more traditional approach using a set of quizzes supplied by the textbook publisher. Finding that neither the first nor the second method provided a learning advantage to students’ learning, ref. [1] concluded that both instructional delivery approaches did not vary significantly during the course of learning.
In the same vein, having implemented an adaptive learning system with the aim to examine performance differences between the pre-test and post-test of students who completed the adaptive learning versus those who did not participate, ref. [2] found that the adaptive learning intervention significantly increased students’ knowledge of chemistry content but not for other subjects. It is noteworthy, however, that [2] explained that the differences between pre- and post-test scores in biology, mathematics, and information literacy were greater for students who completed the adaptive system compared to those who did not, though the difference in scores were not statistically significant following the intervention.
Further, to examine the efficacy of an adaptive platform, ref. [12] compared college students who adopted an adaptive learning system (i.e., ALEKS) with those who chose not to use it. They collected data from four courses including pre-algebra, elementary algebra, intermediate algebra, and college mathematics. The comparisons showed that students using ALEKS had significantly higher pass rates than non-users. Mojard and colleagues pointed out that all comparisons were statistically significantly in support of the adaptive learning system, which enhanced pass rates by 6 to 19 points between users and non-users. Subsequently, ref. [13] conducted a follow-up study to investigate: (1) if usage of the adaptive platform had increased and, (2) whether users had the same improvements in terms of learning outcomes as demonstrated in the previous study. Similarly, this follow-up study compared students using ALEKS with non-users by adding a new analysis approach that was not applied in the original research. The results showed that all comparisons between users and non-users were again statistically significant in support of the adaptive learning system. The pass rates for the original research achieved a boost of 6 to 19 points between users and non-users. In comparison, the pass rates for the follow-up study achieved a boost of 13 to 20 points. With these, ref. [13] concluded that ALEKS was likely to be beneficial for learners within the same educational context.
The findings of the research studies discussed are consistent with those of [11], indicating that the efficacy of adaptive learning systems within higher education yielded mixed results. Although adaptive learning has been adopted across different higher education contexts and various disciplines to influence student performance, it remains unclear how it could be efficacious. Given these inconclusive results, the efficacies of different adaptive learning approaches and their learning outcomes need to be further investigated in various educational settings. Specifically, the continued investigation of the efficacy of adaptive learning systems remains critical as it would provide information useful for instructors and institutions to decide whether to implement adaptive learning and if yes, what would work better for their students.
Adaptive Learning in the Institution in This Study
The institution in this study comprises mainly adult learners with diverse academic and demographic backgrounds along with varied work experiences. About 80% of enrolled undergraduate learners read their studies while working. To ensure all learners are given the best possible opportunity to achieve their optimal performance, learning and teaching instruction cannot be one-size-fits all, but one that is personalised to the level of individual prior knowledge and learning behaviour. To this end, adopting personalised learning as part of innovating for diverse learners is a key instructional strategy adopted by the institution in this study.
One form of personalised learning is via technology-enabled adaptive systems where the digital platform adapts both components of content and assessment based on individual learners’ prior knowledge. The adaptive learning system used in this study (i.e., AdLeS) also caters to personalised learning behaviours as it intends for learners to have flexibility when they learn online within a stipulated period, depending on the progress they make in the learning process. Based on these characteristics, AdLeS aims to enable learners to level up their prior knowledge, which is varied and uneven, such that they are able to engage with the tertiary level content more meaningfully. Further, the outputs from AdLeS would reflect analytics of learners’ learning gains and gaps, thereby enabling instructors to perform more targeted instruction to address these gains, and in particular, the learning gaps.
3. Methodology
Based on the gaps of the efficacy studies identified in Table 1, it was determined that propensity score analysis [20], the Student’s t-test [21], and Cohen’s d [22] would be appropriate for this study. Data between July 2020 and January 2022 was first curated from two main sources (i.e., student demographics from the data information office, and student course examination results from the school) as AdLeS was piloted only from July 2021. Subsequently, the data was processed such that students with missing covariates (e.g., General Certificate of Education Ordinary [GCEO] Level English or Mathematics grades) were deleted before data from both sources were merged, for the purpose of computing propensity scores. In order to minimise unaccounted hidden bias [23,24], all available and relevant covariates were considered with the exception of the concomitant variable (i.e., end-of-course examination score [TOA]). These included the: (1) student unique identifier (2) course code (i.e., course A7 or course B8; both are level one Calculus courses in the tertiary institution) (3) academic semester that the student read and completed the course (4) age when student read and completed the course (age) (5) gender (6) post-secondary institution that the student was from prior to matriculating with the current tertiary institution (7) GCEO Level English grade (ELGRnum) (8) GCEO Level Mathematics grade (MAGRnum) (9) course computer-marked assignment score (CMA), and (10) mid-of-course tutor-marked assignment score (TMA).
Propensity Score Analysis
While randomised controlled trials are considered the gold standard for efficacy research studies of educational programmes or interventions, practical issues remain. For example, artificially establishing control and treated groups within the same semester of study may disadvantage either, particularly if the stakes are high, and calls into question the issue of research ethics [25]. In this regard, quasi-experimental methods could be used and one such approach is propensity score analysis [26]. Propensity score analysis via SAS (9.4) was used in this study as it was not possible to randomise both control (students who did not interact with AdLeS across the July 2020 and January 2021 semesters; N = 162 for course A7 and N = 76 for course B8) and treated (students who interacted with AdLeS across the July 2021 and January 2022 semesters; N = 98 for course A7 and N = 56 for course B8) groups, on the basis of research ethics and that AdLeS was introduced only in the July 2021 semester.
Of the three common methods within propensity score analysis (i.e., weighting, stratification and matching), matching (i.e., propensity score matching [PSM]) was used in this study as the aim was to establish whether the treated group benefited from their interaction with AdLeS in terms of their TOA). PSM matches each individual in the treated group with one in the control group who is similar on one of more covariates, based upon the definition of a propensity score, that is, the conditional probability estimates of a subject receiving treatment given observed covariates [20] (see Equation (1)).
where is the propensity score, is a scalar summary of a vector of the covariates, is the probability of treatment (i.e., 0 means non-treatment and 1 means treatment) given a vector of the covariates .
Matching this way allows a between-groups comparison thereby providing an estimate of the effect of a treatment on a non-randomised control group. For this study, propensity scores for each subject in both the control and treatment groups were first estimated by fitting a binary logistic regression model [20] before matching subjects based on this score [27]. In fitting the regression model, all covariates, other than the concomitant variable that may be impacted by the treatment [28], were included to minimise the occurrence of unaccounted hidden bias, as opposed to selecting covariates to maximise the predictive power of the logistic regression, which is not the focus in propensity score analyses [23,24].
To achieve optimal matching with the highest number of matches, three matching methods (i.e., greedy nearest neighbour matching, optimal matching, and matching with replacement) were considered. In addition, the caliper value (i.e., the upper limit of the difference in propensity score between each pair of matched subjects) and different regions of support were applied and iteratively adjusted [29]. Three approaches were then used for balance assessment: (1) standardised mean difference of covariates (2) treated-to-control variance ratio of propensity scores between both treatment and control groups, and (3) percent bias reduction of propensity scores. Following the balance assessment, Student’s t-test was applied along with the computation of Cohen’s d to determine if TOA scores were influenced by students’ interaction with AdLeS.
4. Results
Of the three types of matching, greedy nearest neighbour matching was found to be optimal based on the iterative matching procedure discussed. Greedy matching was also deemed more appropriate for this study as the number of students who interacted with AdLeS for both courses was smaller than those who did not interact with AdLeS; [30] specified that greedy matching works well in such instances. Despite the importance of a caliper specification to improve matching quality and enforce a common support region [30], this specification had to be lifted for optimal matching in this study to run successfully, contrary to caliper width recommendations by [31,32] (i.e., 0.20 to 0.25). Similarly, matching with replacement was deemed as less ideal as individuals in the control group (i.e., students who did not interact with AdLeS) would have to be re-used; this would decrease precision owing to increased reliance on just a few individuals, and may impact effect sizes [33].
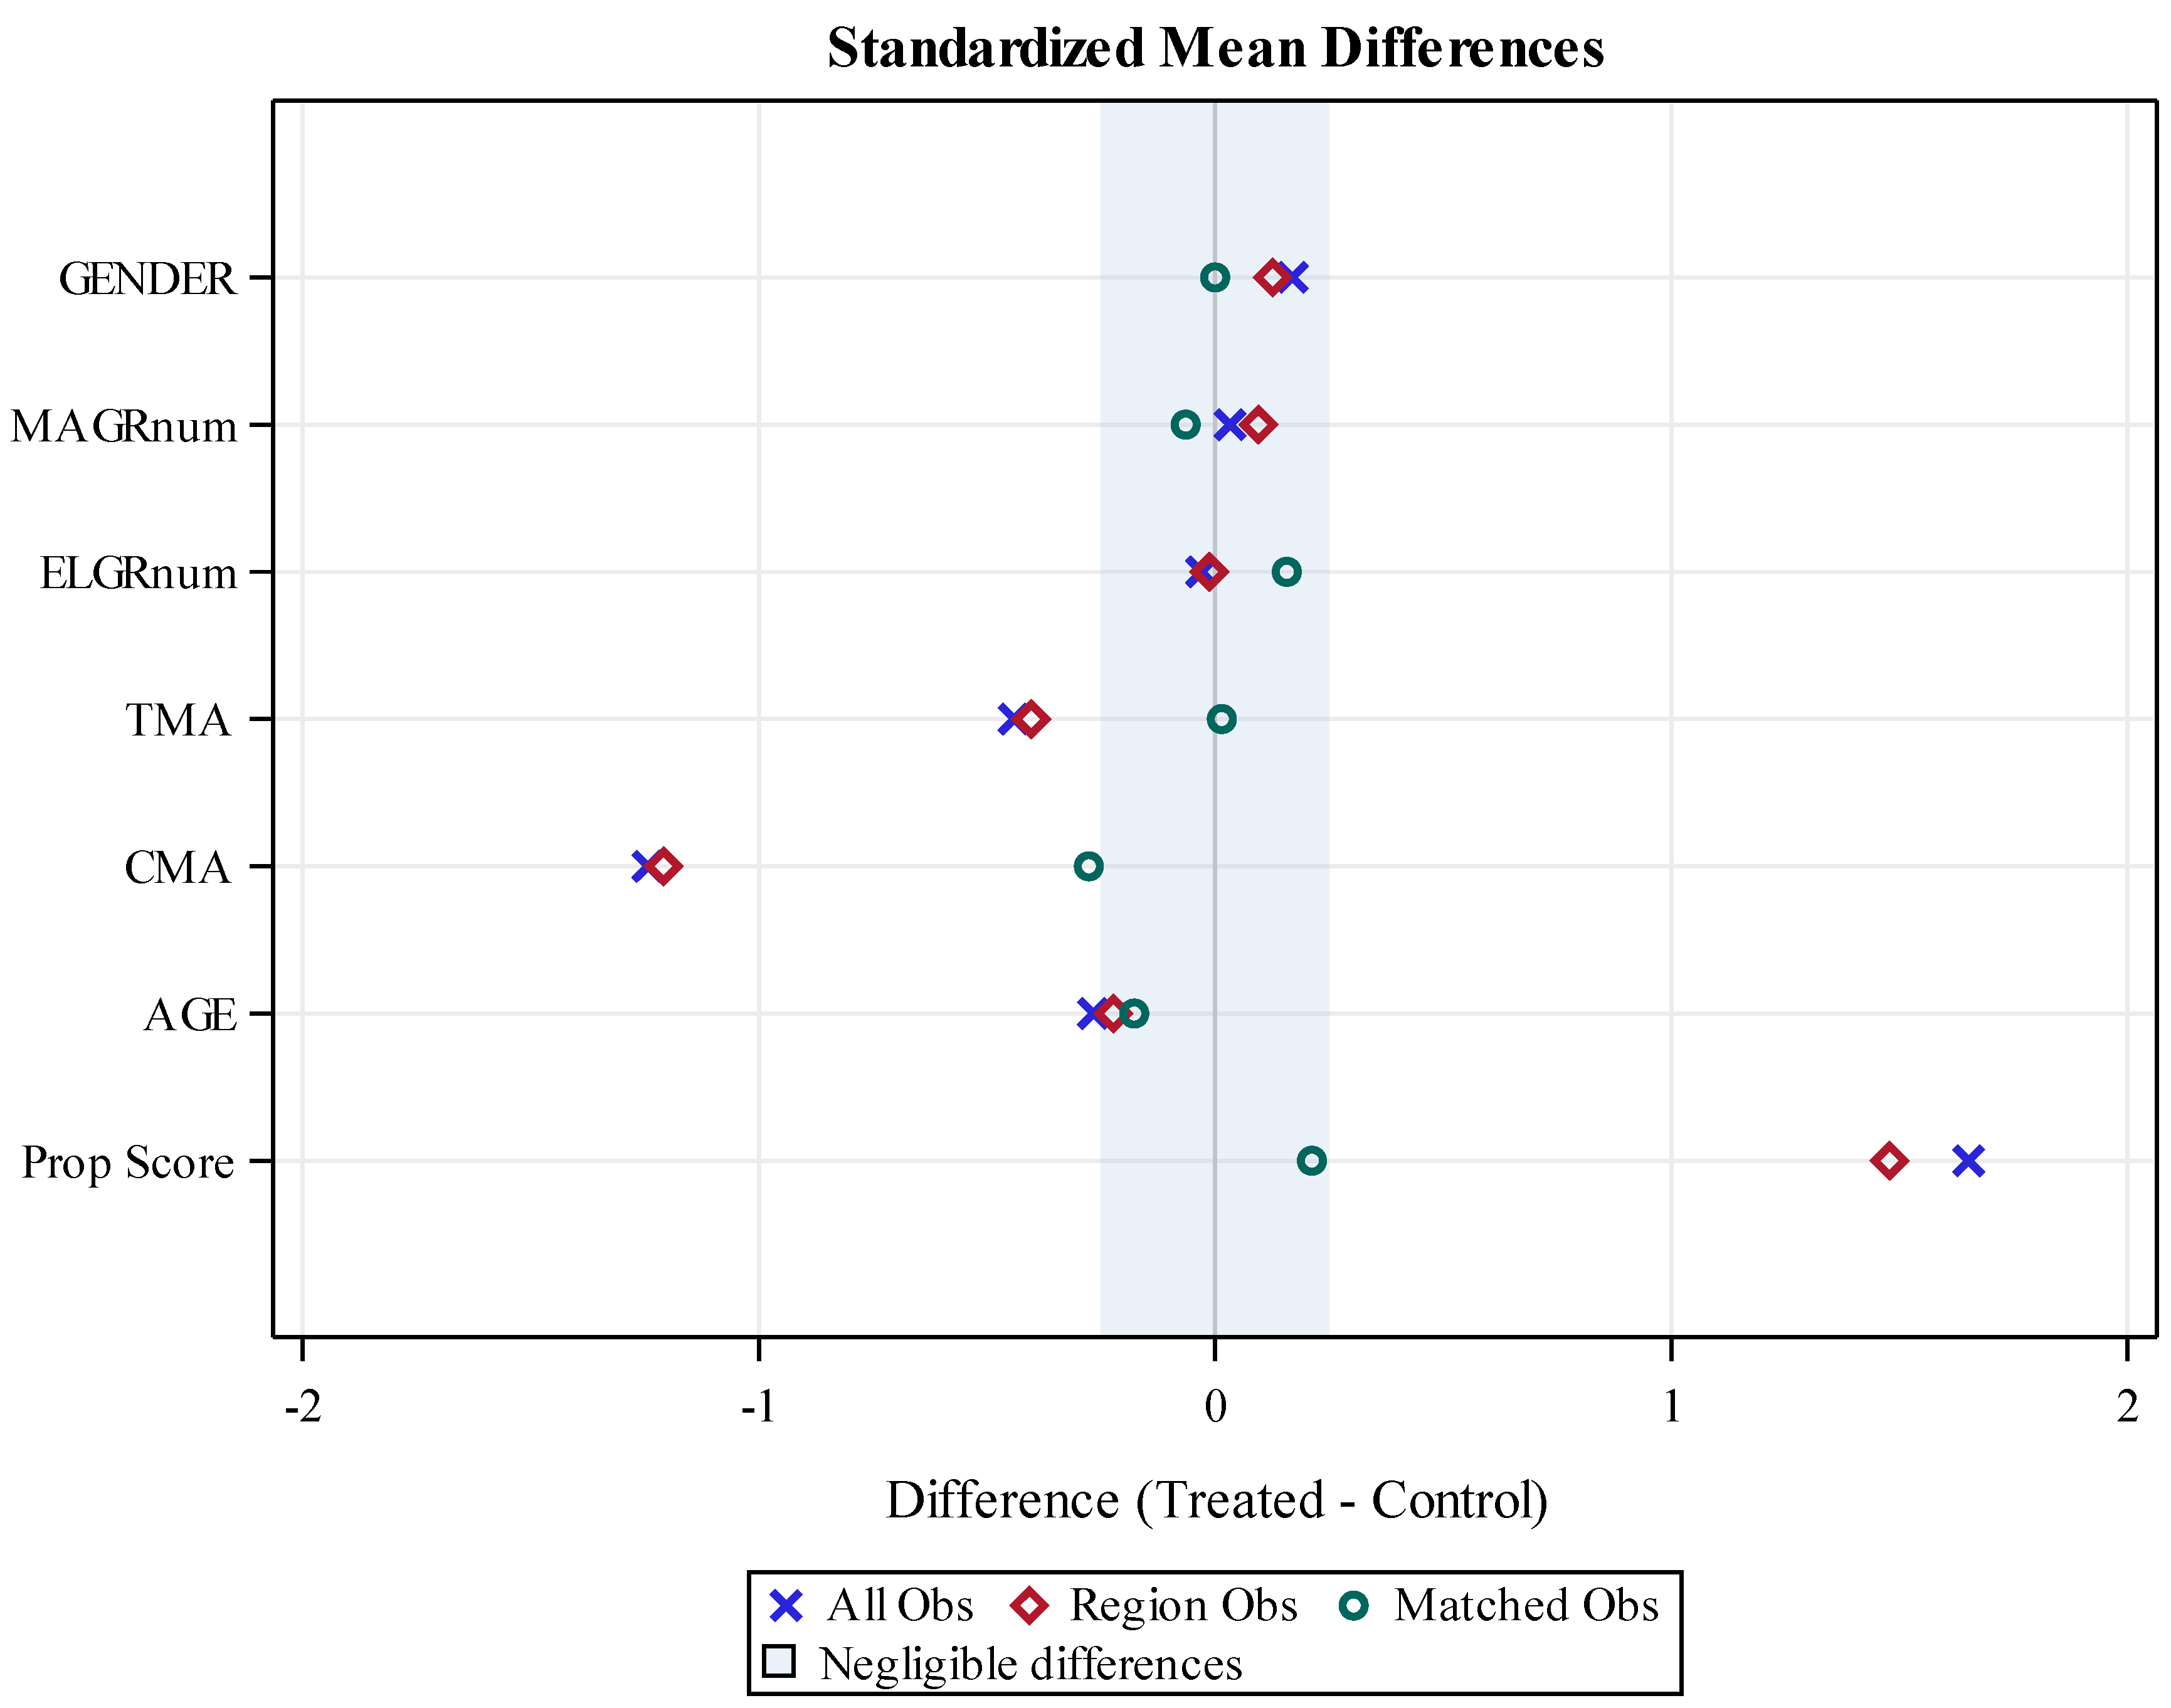
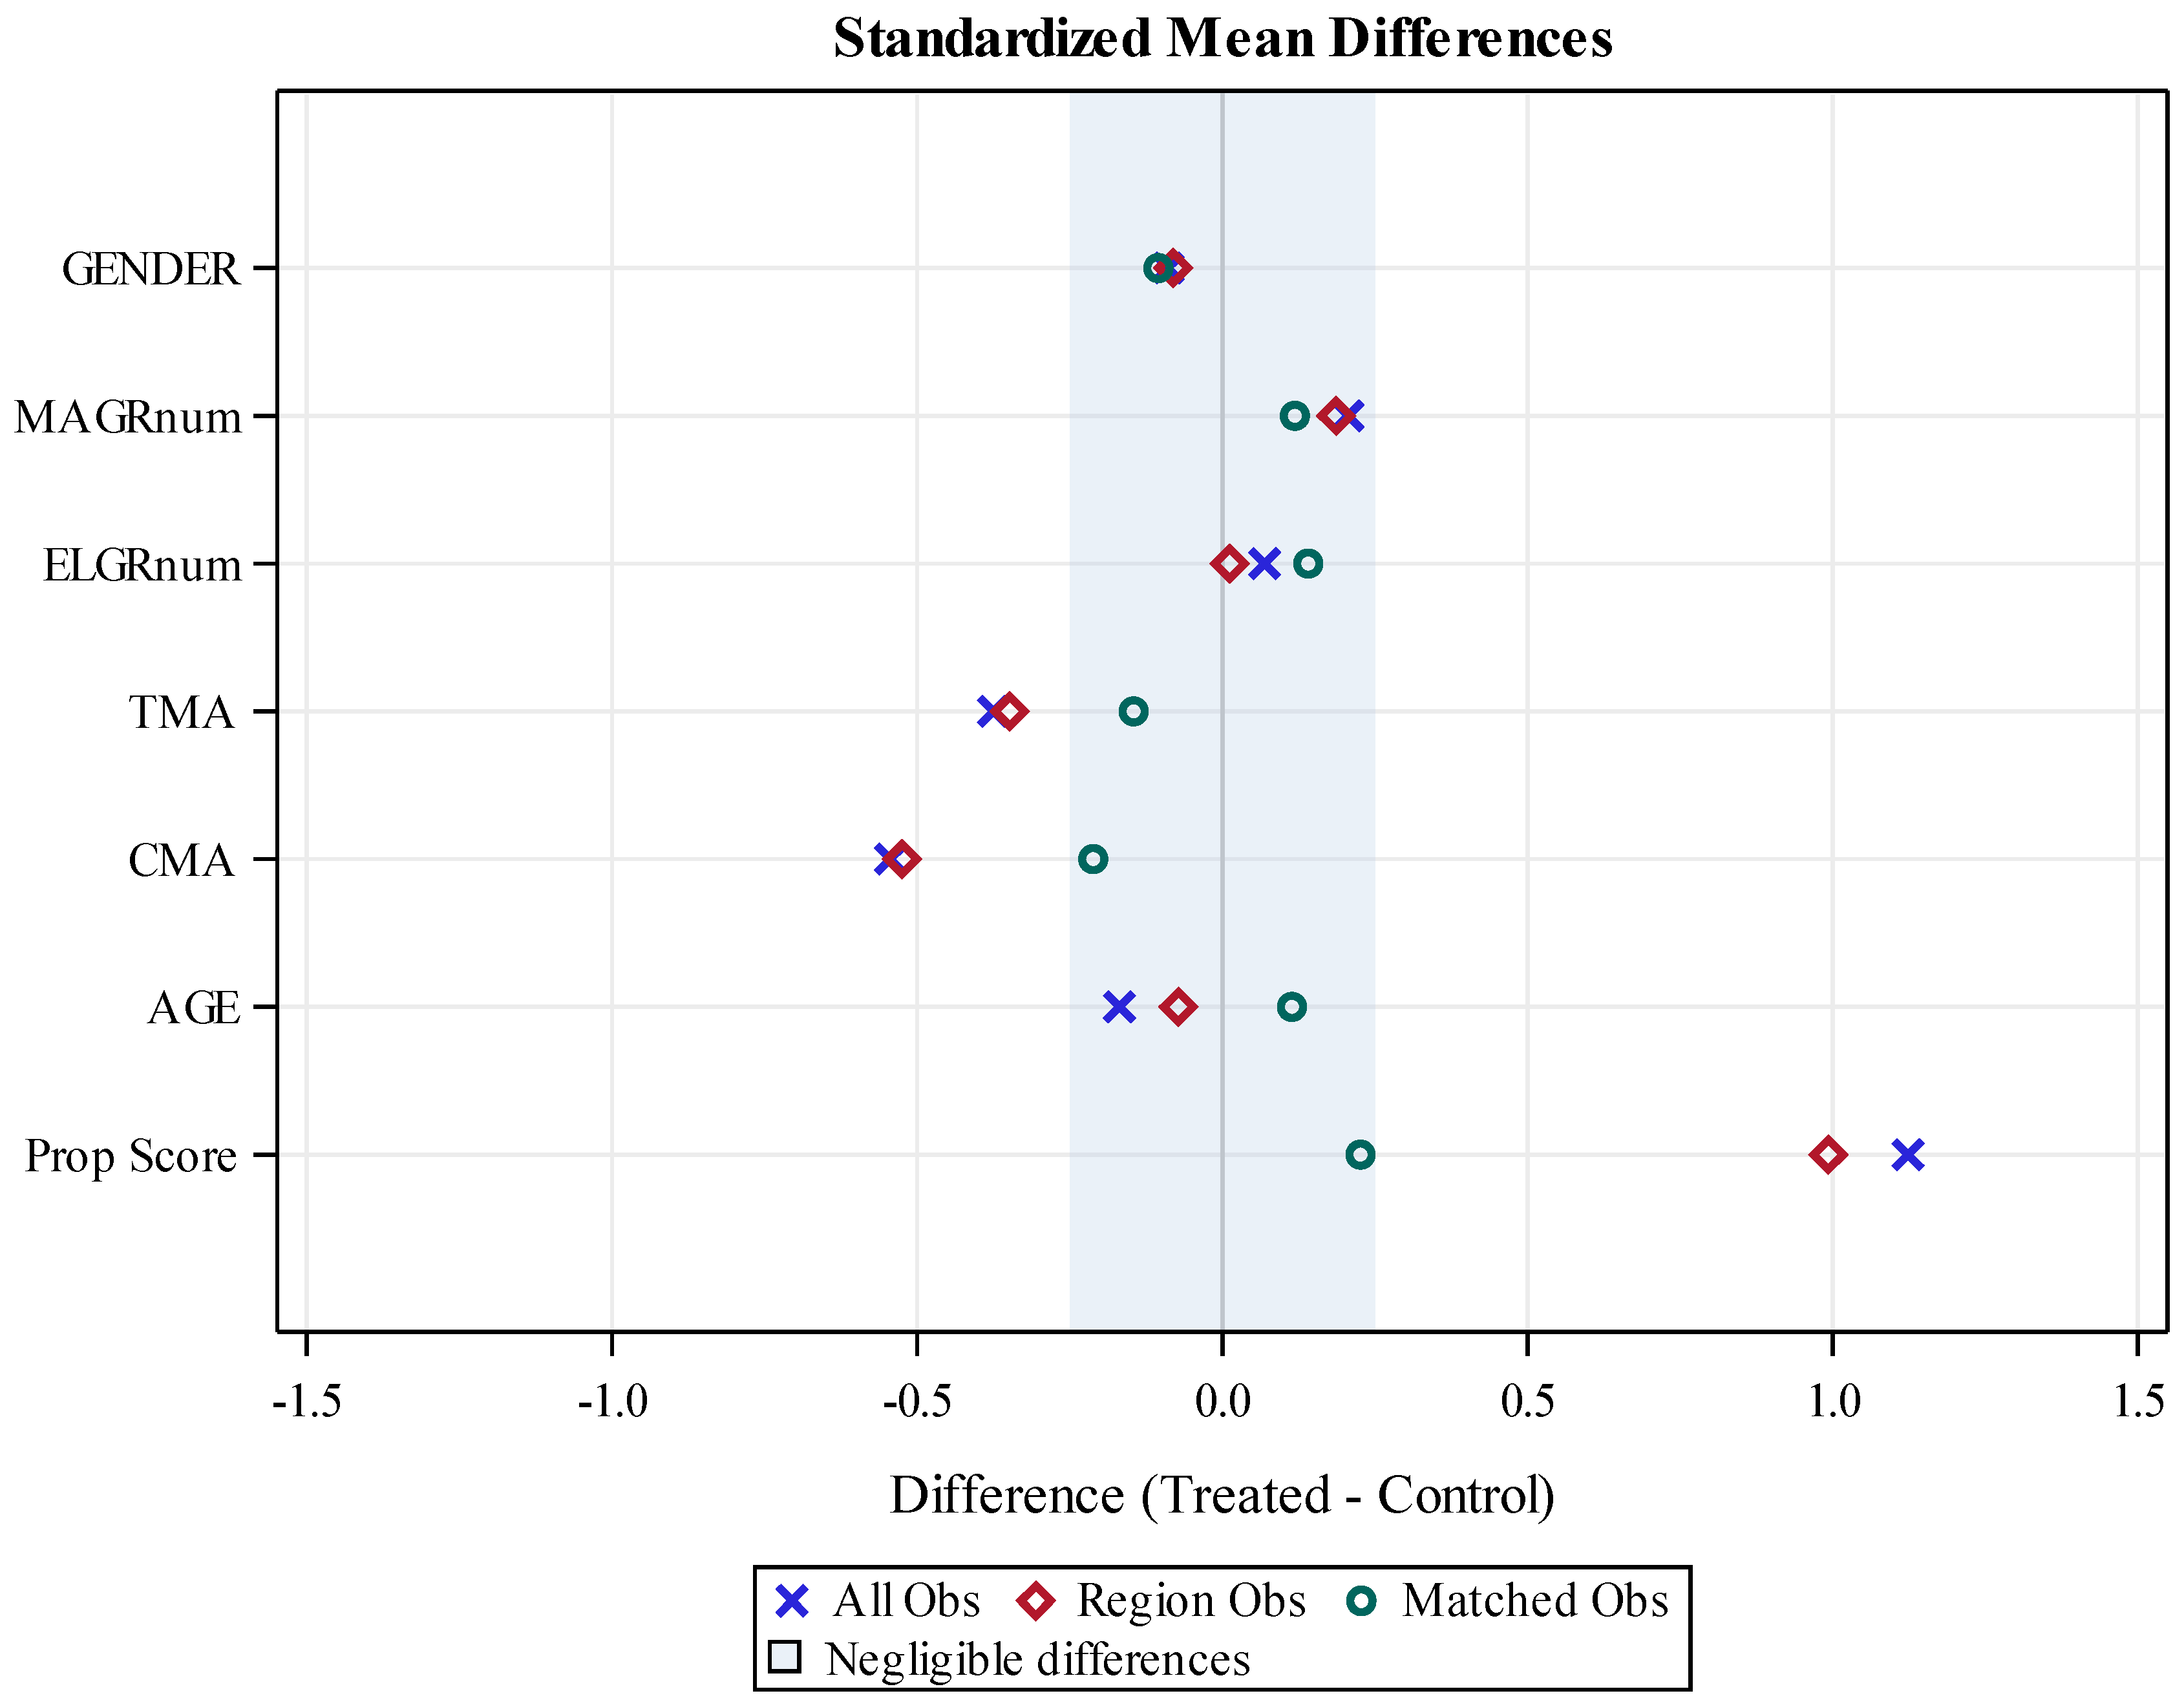
With greedy nearest neighbour matching, 55 and 43 matched pairs were found for course A7 and course B8, respectively. Figure 1 and Figure 2 illustrate that the standardised mean differences for the matched pairs of course A7 and course B8 were acceptable based on the 0.25 threshold for covariate balance recommended by [34]. Further, Table 2 shows that the treated-to-control variance ratios of propensity scores between both treatment and control groups for both course A7 and course B8 were 0.99 and 1.21, respectively, well within the thresholds for optimal balance by [34] (i.e., between 0.5 and 2). The percent bias reduction of propensity scores for both course A7 and course B8 were also considered adequate given their values of 87.16% and 79.86%, respectively [35].
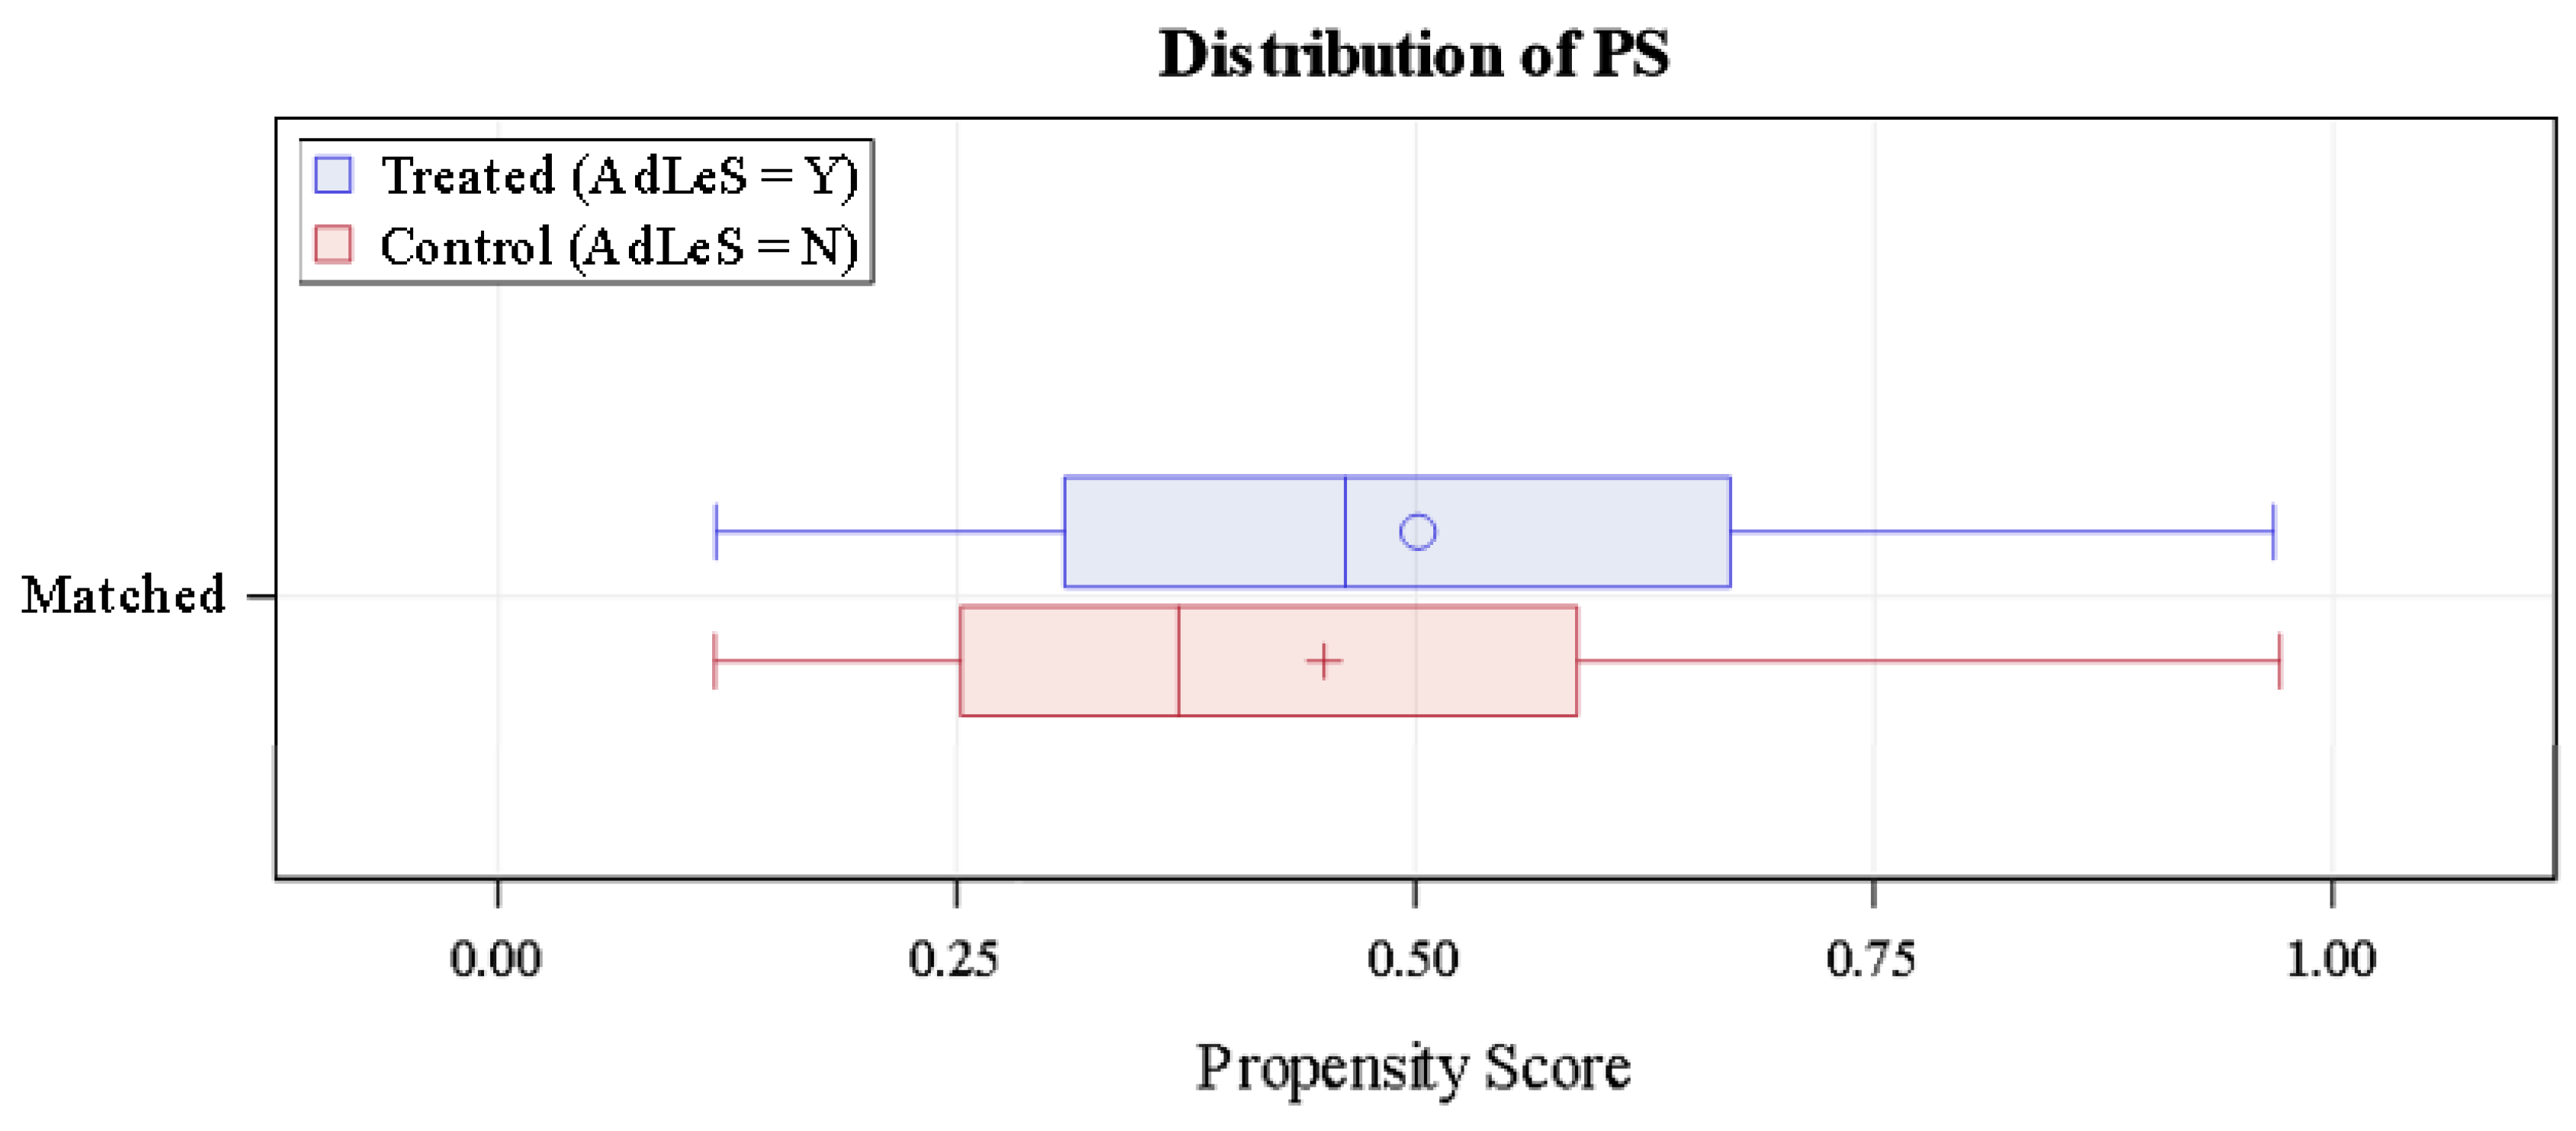
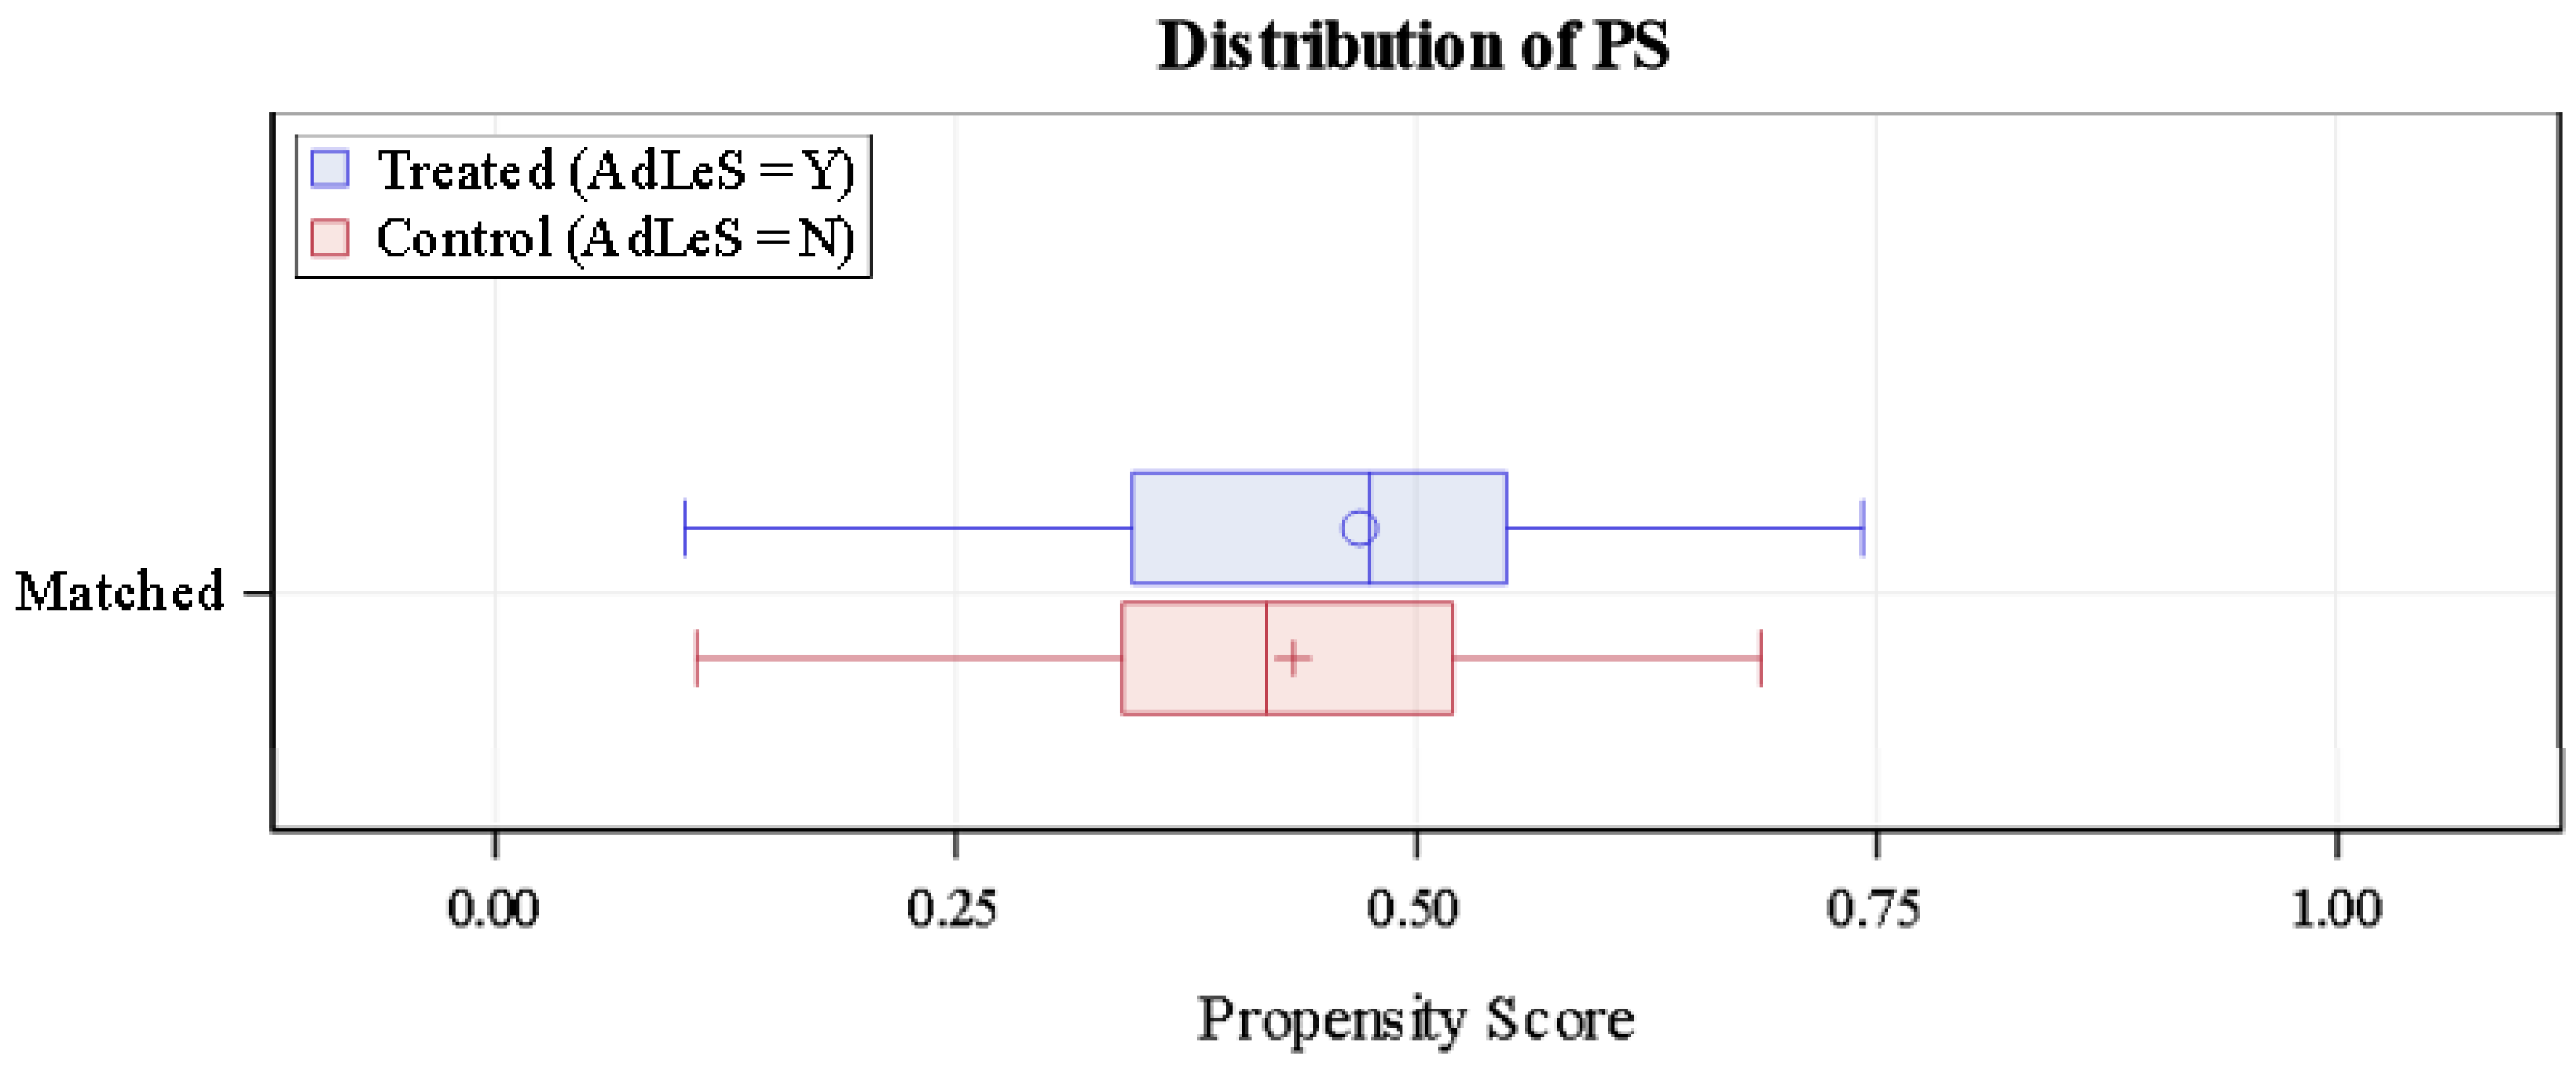
Figure 3 and Figure 4, which illustrate the propensity score distributions for individuals in the treated and control groups, further indicate that the distributions are well-balanced for the matched observations.
Given the acceptable findings upon the balance assessment, Student’s t-tests were conducted on the matched pairs, as well as prior to the matching to establish the worth of PSM in this study. Table 3 presents the t-test results.
5. Discussion
Results in Table 3 demonstrate that the TOA scores did not present statistically significant differences at the 95% confidence level between students who interacted with AdLeS and those who did not, regardless of whether PSM was applied. However, relying solely on statistical significance is inadequate as it only suggests whether the findings are likely to be due to chance; whether interacting with AdLeS impacts TOA scores, and to what extent, remains unknown. In this regard, it is worthwhile considering effect size as it quantifies the magnitude of differences found [36]. For this study, the effect size would indicate whether AdLeS impacted the TOA scores and to what extent.
Without PSM, based on recommendations by [37], the effect size of AdLeS on course A7 and course B8 would be considered negligible and small, respectively. Nonetheless, it is noteworthy that [31] effect size benchmarks (i.e., 0.2 suggests a small effect, 0.5 suggests a medium effect, and 0.8 suggests a large effect) should not be interpreted strictly [38]. On the contrary, applying the recommendations of [39] for effect sizes of educational interventions (i.e., less than 0.05 indicates a small effect, 0.05 to less than 0.20 indicates a medium effect, and 0.20 or greater indicates a large effect) would render the effect size of AdLeS on course A7 and course B8 as small and large, respectively. With PSM and based on the recommendations from [39], however, the effect sizes for both course A7 and course B8 would be considered large and, hence, more consistent. Particularly for course A7, the effect size suggests practical significance [40,41] in that students who interacted with AdLeS yielded higher TOA scores than those who did not.
While PSM overcomes issues such as research ethics and presented AdLeS as having a large effect size on both courses in this study, there are limitations to this approach. The identification and availability of relevant covariates are dependent on the data information office, and pertinent covariates could have been omitted resulting in propensity score estimation bias. It is undeniable that the computation of propensity scores is limited by observable variables afforded by access granted for this study, and does not account for hidden bias due to other unknown variables. It is also noteworthy that propensity score analyses works best when sample sizes are large, and those within this study might not be considered as such.
6. Conclusions and Practical Implications
This study sought to determine whether students’ TOA scores would be impacted if they interacted with AdLeS. While the results indicate non-statistical significance at the 95% confidence level, the effect sizes suggest that there is merit in having students use AdLeS within a course. This finding, consistent with what was gleaned the literature, indicated that while there is some merit to using an adaptive learning system, more work is needed to thoroughly unpack specific learning benefits. In particular, we envisage how instructors act on the analytics produced by the adaptive learning system and what specific teaching strategies they adopt will influence the eventual performance in the TOA scores. These conditions constitute an indication of the direction of future research on using adaptive learning systems for personalised learning.
Author Contributions
Conceptualization, L.L. and W.Y.R.L.; methodology, L.L.; validation, L.L.; formal analysis, L.L.; investigation, L.L.; data curation, S.H.L. and L.L.; writing—original draft preparation, L.L., W.Y.R.L. and S.H.L.; writing—review and editing, L.L., W.Y.R.L. and S.H.L.; project administration, L.L. and S.H.L.; funding acquisition, L.L. and W.Y.R.L. All authors have read and agreed to the published version of the manuscript.
Funding
This research was supported by the Ministry of Education, Singapore, under its Tertiary Education Research Fund (MOE2020-TRF-012). Any opinions, findings and conclusions or recommendations expressed in this material are those of the authors and do not reflect the views of the Ministry of Education, Singapore.
Data Availability Statement
Data available on request due to privacy and ethical restrictions.
Conflicts of Interest
The authors declare no conflict of interest.
References
- Murray, M.C.; Pérez, J. Informing and Performing: A Study Comparing Adaptive Learning to Traditional Learning. Inf. Sci. Int. J. Emerg. Transdiscipl. 2015, 18, 111–125. Available online: http://www.inform.nu/Articles/Vol18/ISJv18p111-125Murray1572.pdf (accessed on 5 June 2022).
- Liu, M.; McKelroy, E.; Corliss, S.B.; Carrigan, J. Investigating the effect of an adaptive learning intervention on students’ learning. Educ. Tech. Res. Dev. 2017, 65, 1605–1625. [Google Scholar] [CrossRef]
- Ho, Y.Y.; Lim, L. Targeting student learning needs: The development and preliminary validation of the Learning Needs Questionnaire for a diverse university student population. High. Educ. Res. Dev. 2021, 40, 1452–1465. [Google Scholar] [CrossRef]
- Lim, L.; Ho, Y.Y. Supporting student learning needs in tertiary education: Institutional support structures based on the Institutional Support Questionnaire. Behav. Sci. 2022, 12, 277. [Google Scholar] [CrossRef]
- Hwang, G.J.; Tu, Y.F. Roles and research trends of artificial intelligence in mathematics education: A bibliometric mapping analysis and systematic review. Mathematics 2021, 9, 584. [Google Scholar] [CrossRef]
- Davadas, S.D.; Lay, Y.F. Factors affecting students’ attitude toward mathematics: A structural equation modeling approach. Eurasia J. Math. Sci. Technol. Educ. 2017, 14, 517–529. [Google Scholar] [CrossRef]
- Bray, A.; Tangney, B. Technology usage in mathematics education research—A systematic review of recent trends. Comput. Educ. 2017, 114, 255–273. [Google Scholar] [CrossRef]
- Dziuban, C.D.; Moskal, P.D.; Cassisi, J.; Fawcett, A. Adaptive learning in Psychology: Wayfinding in the digital age. Online Learn. 2016, 20, 74–96. [Google Scholar] [CrossRef] [Green Version]
- Lim, L.; Lim, S.H.; Lim, R.W.Y. Measuring Learner Satisfaction of an Adaptive Learning System. Behav. Sci. 2022, 12, 264. [Google Scholar] [CrossRef]
- Lin, C.C.; Guot, K.H.; Lin, Y.C. A simple and effective remedial learning system with a fuzzy expert system. J. Comput. Assist. Learn. 2016, 32, 647–662. [Google Scholar] [CrossRef]
- Booth, C.; Cheluvappa, R.; Bellinson, Z.; Maguire, D.; Zimitat, C.; Abraham, J.; Eri, R. Empirical evaluation of a virtual laboratory approach to teach lactate dehydrogenase enzyme kinetics. Ann. Med. Surg. 2016, 8, 6–13. [Google Scholar] [CrossRef] [PubMed]
- Arsovic, B.; Stefanovic, N. E-learning based on the adaptive learning model: Case study in Serbia. Indian Acad. Sci. 2020, 45, 266. [Google Scholar] [CrossRef]
- Daines, J.B.; Troka, T.T.; Santiago, J.M. Improving performance in trigonometry and pre-calculus by incorporating adaptive learning technology into blended models on campus. In Proceedings of the ASEE’s 123rd Annual Conference & Exposition, New Orleans, LA, USA, 29 June 2016. [Google Scholar]
- Foshee, C.M.; Elliott, S.N.; Atkinson, R.K. Technology-enhanced learning in college mathematics remediation. Br. J. Educ. Technol. 2016, 47, 893–905. [Google Scholar] [CrossRef]
- Mojarad, S.; Essa, A.; Mojarad, S.; Baker, R. Studying Adaptive Learning Efficacy Using Propensity Score Matching. In Proceedings of the 8th International Conference on Learning Analytics and Knowledge, New York, NY, USA, 7–9 March 2018; Available online: https://www.researchgate.net/publication/323358166 (accessed on 5 June 2022).
- Mojarad, S.; Baker, R.; Essa, A.; Stalzer, S. Replicating Studying Adaptive Learning Efficacy Using Propensity Score Matching and Inverse Probability of Treatment Weighting. J. Interact. Learn. Res. 2021, 32, 169–203. Available online: https://www.researchgate.net/publication/354956401 (accessed on 1 June 2022).
- Mou, C.; Tian, Y.; Zhang, F.; Zhu, C. Current situation and strategy formulation of college sports psychology teaching following adaptive learning and deep learning under information education. Front. Psychol. 2022, 12, 766621. [Google Scholar] [CrossRef]
- Ruan, S.; Jiang, L.W.; Xu, J.; Tham, B.J.K.; Qiu, Z.N.; Zhu, Y.S.; Murnane, E.L.; Brunskill, E.; Landay, J.A. QuizBot: A dialogue-based adaptive learning system for factual knowledge. In Proceedings of the CHI Conference on Human Factors in Computing Systems Proceedings, Glasgow, Scotland, 4–9 May 2019. [Google Scholar] [CrossRef] [Green Version]
- Shelle, G.; Earnesty, D.; Pilkenton, A.; Powell, E. Adaptive Learning: An Innovative Method for Online Teaching and Learning. J. Ext. 2018, 56, 17. Available online: https://tigerprints.clemson.edu/joe/vol56/iss5/17 (accessed on 1 June 2022).
- Guo, S.; Fraser, M.W. Propensity Score Analysis, 2nd ed.; SAGE Publishing: New York, NY, USA, 2015. [Google Scholar]
- Korosteleva, O.; Song, B. T tests. In The SAGE Encyclopedia of Educational Research, Measurement, and Evaluation; Frey, B., Ed.; SAGE Publications, Inc.: New York, NY, USA, 2018; pp. 1652–1654. [Google Scholar] [CrossRef]
- Kadel, R.; Kip, K. A SAS Macro to Compute Effect Size (Cohen’s) and Its Confidence Interval from Raw Survey Data. In Proceedings of the Annual Southeastern SAS Users Group 2012 Conference, Durham, NC, USA, 14–16 October 2012; Paper SD-06. Available online: https://analytics.ncsu.edu/sesug/2012/SD-06.pdf (accessed on 23 July 2022).
- Gant, T.; Crowland, K. A Practical Guide to Getting Started with Propensity Scores. In Proceedings of the SAS® Global Forum 2017 Conference, Lake Buena Vista, FL, USA, 2–5 April 2017; Paper SAS0689-2017. Available online: https://support.sas.com/resources/papers/proceedings17/0689-2017.pdf (accessed on 23 July 2022).
- Stuart, E.A. Matching methods for causal inference: A review and a look forward. Stat. Sci. 2010, 25, 1–21. [Google Scholar] [CrossRef] [Green Version]
- Lim, L.; Bo, W.V. Evaluating the efficacy of English proficiency on initial semestral results for higher education L1 English speakers in a multilingual context. High. Educ. Eval. Dev. 2021, 15, 82–97. [Google Scholar] [CrossRef]
- U.S. Department of Education. What Works Clearinghouse™; version 4.0; Standards Handbook: San Francisco, CA, USA, 2018; p. 130. Available online: https://ies.ed.gov/ncee/wwc/Docs/referenceresources/wwc_standards_handbook_v4.pdf (accessed on 20 July 2022).
- Rosenbaum, P.R.; Rubin, D.B. The central role of the propensity score in observational studies for causal effects. Biometrika 1983, 70, 41–55. [Google Scholar] [CrossRef]
- Rosenbaum, P.R. The consequences of adjustment for a concomitant variable that has been affected by the treatment. J. R. Stat. Soc. Ser. A 1984, 147, 656–666. [Google Scholar] [CrossRef]
- Yuan, Y.; Yung, Y.F.; Stokes, M. Propensity Score Methods for Causal Inference with the PSMATCH Procedure. In Proceedings of the SAS® Global Forum 2017 Conference, Lake Buena Vista, FL, USA, 2–5 April 2017; Paper SAS332-2017. Available online: https://support.sas.com/resources/papers/proceedings17/SAS0332-2017.pdf (accessed on 23 July 2022).
- Leite, W. Practical Propensity Score Methods Using R; SAGE Publishing: Thousand Oaks, CA, USA, 2017. [Google Scholar]
- Rosenbaum, P.R.; Rubin, D.B. Constructing a Control Group Using Multivariate Matched Sampling Methods that Incorporate the Propensity Score. Am. Stat. 1985, 39, 33–38. Available online: https://www.jstor.org/stable/2683903 (accessed on 23 July 2022).
- Austin, P.C. An introduction to propensity score methods for reducing the effects of confounding in observational studies. Multivar. Behav. Res. 2011, 46, 399–424. [Google Scholar] [CrossRef]
- Greifer, N.; Stuart, E.A. Matching methods for confounder adjustment: An addition to the epidemiologist’s toolbox. Epidemiol. Rev. 2022, 43, 118–129. [Google Scholar] [CrossRef] [PubMed]
- Rubin, D.B. Using propensity scores to help design observational studies: Application to the tobacco litigation. Health Serv. Outcomes Res. Methodol. 2001, 2, 169–188. [Google Scholar] [CrossRef]
- Bai, H. A bootstrap procedure of propensity score estimation. J. Exp. Educ. 2013, 81, 157–177. [Google Scholar] [CrossRef]
- Bakker, A.; Cai, J.; English, L.; Kaiser, G.; Mesa, V.; Van Dooren, W. Beyond small, medium, or large: Points of consideration when interpreting effect sizes. Educ. Stud. Math. 2019, 102, 1–8. [Google Scholar] [CrossRef] [Green Version]
- Cohen, J. Statistical Power Analysis for the Behavioral Sciences, 2nd ed.; Routledge: Oxfordshire, UK, 1988. [Google Scholar] [CrossRef]
- Thompson, B. Effect sizes, confidence intervals, and confidence intervals for effect sizes. Psychol. Sch. 2007, 44, 423–432. [Google Scholar] [CrossRef]
- Kraft, M.A. Interpreting effect sizes of education interventions. Educ. Res. 2020, 49, 241–253. [Google Scholar] [CrossRef]
- Kirk, R.E. Practical significance: A concept whose time has come. Educ. Psychol. Meas. 1996, 56, 746–759. [Google Scholar] [CrossRef]
- Spurlock, D. Defining practical significance is hard, but we should do it anyway. J. Nurs. Educ. 2019, 58, 623–626. [Google Scholar] [CrossRef]
Figure 1.
Standardised Mean Differences of Matched Pairs for Course A7.

Figure 2.
Standardised Mean Differences of Matched Pairs for Course B8.

Figure 3.
Propensity Score Distributions for Course A7.

Figure 4.
Propensity Score Distributions for Course B8.


Table 1.
Efficacy studies of adaptive learning systems.
| Author(s) | Participants | Methods | Findings | Remarks |
|---|---|---|---|---|
| [12] Arsovic, B., & Stefanovic, N. (2020) | Total number of first and second years of undergraduate students; number was not indicated | t-test, ANOVA, & multivariate linear regression | Students who attended the adaptive course obtained higher marks, and the pass rate was higher. | Comparability of students who attended the traditional or adaptive course was not observed. This could suggest that the finding (of students who attended the adaptive course attained higher scores) could be influenced by confounding variables. |
| [13] Daines, J.B., Troka, T., & Santiago, JM. (2016) | 27 students from Calculus I course, 19 from Trigonometry and Pre-calculus prerequisite courses | Descriptive statistics | Results show that average pass rates in Trigonometry, Pre-calculus and Calculus I increased from 76% to 94%, 66% to 94%, and 69% to 86%, respectively. | As no control group was observed, the findings could possibly be confounded by single-group threats (e.g., maturation). |
| [14] Foshee, C.M., Elliott, S.N., & Atkinson, R.K. (2016) | 2880 college students | Pre-test and post-test, paired sample t-test, two-way ANOVA | Results show statistically significant improvements in students’ learning and math efficacy suggesting that the adaptive system led to successful remediation. | The authors indicated that it was deemed unethical to use a control group for first-year students. However, without a control group, the outcome could have been influenced by other confounding variables. |
| [2] Liu, M., McKelroy, E., Corliss, S.B., & Carrigan, J. (2017) | 128 first year undergraduate students (74 participated in Biology module; 52 in Chemistry; 62 in Math; 50 in Information Literacy) | ANCOVA, t-test, Pearson correlation, linear regression | The adaptive learning intervention significantly increased students’ knowledge of Chemistry but not other subjects. | No control group was observed. The effects of the adaptive system could have been influenced by other confounding variables. |
| [15] Mojarad, S., Essa, A., Mojarad, S., & Baker, R. (2018) | 3422 college students. Non-ALEKS-section consisted of 706 students; ALEKS-section consisted of 417 students who participated | Logistic regression to calculate propensity score matching | Five comparisons were statistically significant in favour of ALEKS, with a boost of 6 to 19 points in pass rates. | The study had a large sample size and applied propensity score analyses that supported the findings. |
| [16] Mojarad, S., Baker, R.S., Essa, A., & Stalzer, S. (2021) | 2072 community college students | Matched comparisons using the inverse proportion of treatment weights and chi square | This replication study obtained an effect size of 0.36, which was higher than that of a similar previous study which was 0.22. | The study was observed to have a large sample size and comparable control groups to validate findings of the prior research. |
| [17] Mou, C., Tian, Y., Zhang, F., & Zhu, C. (2022) | 3426 college students | Deep neural networks | Results indicated that adaptive and deep learning were more targeted at students’ learning in areas of difficulty and accuracy than traditional teaching modes. | The study recommended that future research should account for students’ characteristics (e.g., matching students from each of the modes of teaching). |
| [1] Murray, M.C., & Pérez, J. (2015) | 218 university students | Correlation, and t-test | Results indicated that neither the adaptive learning nor the traditional approaches provided a definitive learning advantage | The researchers concluded that more similar research studies are needed. Further, evidence related to the comparability of the control group was not observed. |
| [18] Ruan, S., Jiang, L., Xu, J., Tham, B.J.K., Qiu, Z.N., Zhu, Y., Murnane, E.L., Brunskill, E., Landay, J.A. (2019) | 76 students from 12 different universities over 20 majors including Mathematics, Computer Science, Biology, History, Communication, Psychology, and others | Descriptive statistics, pre- and post-test, two sample t-test | The algorithm sequencing system helped learners recognise 21.4% more (and recall 21% more) questions than a traditional flashcard learning tool. | Academic performance in terms of quiz scores were not studied. However, the researchers suggested that further studies are necessary to understand long-term usage behaviours and attitudes. |
| [19] Shelle, G., Earnesty, D., Pilkenton, A, Powell, E. (2018) | 85 undergraduate students competed the pre-test and 50 attempted post-test, 75 completed the questionnaire | Descriptive statistics, pre- and post-test, t-test; qualitative approach with open, axial, and selective data analysis | There was a significant difference between the pre- and post-test average scores suggesting the effectiveness of the tool | No control group was observed. The effects of the adaptive system could have been influenced by other confounding variables. |
Table 2.
Treated-to-control Variance Ratio and Percent Bias Reduction for Course A7 and Course B8 Propensity Scores.
Table 2.
Treated-to-control Variance Ratio and Percent Bias Reduction for Course A7 and Course B8 Propensity Scores.
| Propensity Score | Course A7 | Course B8 |
|---|---|---|
| Treated-to-control variance ratio | 0.99 | 1.21 |
| Percent bias reduction (%) | 87.16 | 79.86 |
Table 3.
Comparison of TOA Scores.
| Course | Comparison of TOA Scores | N | Equality of Variances p Values | t Value | p Value | 95% CI | Cohen’s d |
|---|---|---|---|---|---|---|---|
| A7 | Students who interacted AdLeS with students who did not interact with AdLeS, without PSM | 162 (without AdLeS); 98 (with AdLeS) | 0.47 | −0.25 | 0.80 | [−0.21, 0.28] | 0.03 |
| A7 | Students who interacted AdLeS with students who did not interact with AdLeS, with PSM | 55 | 0.48 | −1.75 | 0.08 | [−0.05, 0.71] | 0.33 |
| B8 | Students who interacted AdLeS with students who did not interact with AdLeS, without PSM | 76(without AdLeS); 56 (with AdLeS) | 0.79 | −1.48 | 0.14 | [−0.08, 0.61] | 0.26 |
| B8 | Students who interacted AdLeS with students who did not interact with AdLeS, with PSM | 43 | 0.39 | −1.73 | 0.09 | [−0.06, 0.80] | 0.37 |
Disclaimer/Publisher’s Note: The statements, opinions and data contained in all publications are solely those of the individual author(s) and contributor(s) and not of MDPI and/or the editor(s). MDPI and/or the editor(s) disclaim responsibility for any injury to people or property resulting from any ideas, methods, instructions or products referred to in the content. |
© 2023 by the authors. Licensee MDPI, Basel, Switzerland. This article is an open access article distributed under the terms and conditions of the Creative Commons Attribution (CC BY) license (https://creativecommons.org/licenses/by/4.0/).
Share and Cite
MDPI and ACS Style
Lim, L.; Lim, S.H.; Lim, W.Y.R. Efficacy of an Adaptive Learning System on Course Scores. Systems 2023, 11, 31. https://doi.org/10.3390/systems11010031
AMA Style
Lim L, Lim SH, Lim WYR. Efficacy of an Adaptive Learning System on Course Scores. Systems. 2023; 11(1):31. https://doi.org/10.3390/systems11010031
Chicago/Turabian StyleLim, Lyndon, Seo Hong Lim, and Wei Ying Rebekah Lim. 2023. "Efficacy of an Adaptive Learning System on Course Scores" Systems 11, no. 1: 31. https://doi.org/10.3390/systems11010031
Note that from the first issue of 2016, this journal uses article numbers instead of page numbers. See further details here.