
Research on Mechanical Properties of Rock Mass with Tiny Cracks under FTCs Conditions

1
Shandong Key Laboratory of Civil Engineering Disaster Prevention and Mitigation, Shandong University of Science and Technology, Qingdao 266590, China
2
School of Civil Engineering, Ludong University, Yantai 264025, China
*
Author to whom correspondence should be addressed.
Symmetry 2024, 16(2), 234; https://doi.org/10.3390/sym16020234
Submission received: 30 December 2023
/
Revised: 9 February 2024
/
Accepted: 12 February 2024
/
Published: 14 February 2024
Abstract
:After the repeated freezing and dissolution of fractured rock masses in cold regions, the liquid present in the pores undergoes a water–ice phase transition, resulting in frost heave forces and damage to the internal structure of the rock mass. This causes the rock masses to continuously develop new cracks, which further expand and connect, leading to rock mass failure and ultimately reducing the overall stability of the rock mass in engineering projects. In this study, uniaxial compression tests, direct shear tests, and Brazilian splitting tests were conducted on rock after freeze–thaw cycles (FTCs), and the changes in the physical and mechanical properties of the rock under freeze–thaw conditions were obtained (this study used raw rock from an engineering project and processed it into symmetrical jointed rock samples). The roughness of the shear fracture surfaces was analyzed through 3D cross-sectional scanning experiments. Using statistical damage theory, the mechanism of freeze–thaw damage was analyzed, and a constitutive model for freeze–thaw rock damage was established. The research results can provide a theoretical basis and support for engineering safety and stability in cold regions.
1. Introduction
In low-temperature environments, the freeze–thaw cycle of a rock mass can exacerbate the damage, deterioration, and fracture process of the rock mass, further affecting stability and engineering safety [1,2]. Therefore, for research and application in related fields, it is necessary to study the freeze–thaw cycle damage [3], deterioration, and fracture process of joints and rock masses. This can accurately reflect the process of rock mass failure in engineering, providing strong support for engineering construction [4,5].
Many scholars have researched intermittently jointed rock masses.
For instance, Gehle and Kutter [6] studied the failure and shear behavior of intermittent rock joints in a series of direct shear tests using a self-designed new shear device. A prefabricated joint composed of many short cracks arranged en echelon along the central shear axis was constructed, and the shearing process consisted of three stages. Furthermore, Jafari et al. [7] studied the variation in the shear strength of jointed rocks under cyclic loading and proposed a relationship between the shear strength and the shear velocity, number of loading cycles, and stress amplitude. Direct shear tests were conducted within the shear velocity range of 0.3 to 30 mm/min, and it was found that shear parameters such as the joint shear strength, shear stiffness, and friction angle were related to the shear velocity [8]. Bahaaddini [9] researched the influence of boundary conditions on the results of direct shear tests through PFC2D numerical simulation. These research results are highly important for improving rock mass engineering design and the stability evaluation of rock surrounding tunnels.
The above studies focused mainly on shear tests of discontinuously jointed rock masses and lacked research on rock mass failure under freeze–thaw conditions. In recent years, scholars have conducted relevant freeze–thaw tests to study rock mass failure.
A summary of the freeze–thaw test research is provided below:
The freeze–thaw damage and failure of rock masses are influenced by various factors, and previous studies have considered various factors from various perspectives. Momeni et al. [10] selected three different types of granite bodies for research. It was concluded that as the number of FTCs increases, the water absorption and porosity of the rock increases, while the other physical and mechanical properties decrease. Yavuz [11] measured the physical and mechanical properties of andesite samples after a total of 50 FTCs to study the degradation of andesite. During the experiment, the porosity and water absorption continued to increase with the progression of FTCs, while the longitudinal wave velocity, hardness, and compressive strength decreased to varying degrees with the progression of FTCs.
In addition, many scholars have utilized advanced equipment to study the microstructure of rock masses under freeze–thaw cycling. For instance, Yang et al. [12] used computed tomography (CT) scanning experiments to study the changes in rock masses after FTC and studied the effect of FTC on crack propagation in rock masses. Mu et al. [13] studied the damage and deterioration mechanisms of three different rock masses under freeze–thaw cycling using scanning electron microscopy and summarized two cracking modes, namely, crack propagation and particle precipitation.
In previous studies, scholars have analyzed the effects of temperature and pore water/ice pressure on frost heave strain, mechanical properties, and other aspects of rock mass freeze–thaw cycling tests from a theoretical perspective by establishing mathematical models. Through different experiments and testing methods, the impact of FTCs on the performance and structure of rock masses was explored.
However, to date, there has been a considerable lack of research on the shear characteristics and damage models of rock masses under freeze–thaw conditions.
In response to the above shortcomings, in this study, the shear failure mechanism of intermittently jointed rock masses under freeze–thaw cycling conditions was investigated freeze–thaw tests were conducted on the rock specimens, and the failure modes, mechanical parameter changes, and other factors were analyzed (this study used raw rock processed into symmetrical jointed rock samples). The roughness of the shear fracture surfaces was also discussed. The impact mechanism of rock freeze–thaw cycle damage degradation was examined, and a damage constitutive equation for rock masses was proposed based on the coupling of joint surface characteristics, freeze–thaw cycling, and loading. The influence of FTC on the shear mechanical properties of jointed rock masses was systematically researched, and the crack propagation of intermittently jointed rock masses after different numbers of FTCs was analyzed in depth.
2. Materials and Methods
2.1. Materials
According to the “Code for Rock Testing in Hydraulic and Hydroelectric Engineering” [14], standard cylindrical specimens were used for compressive strength testing (Φ fifty × 100 mm), and the original rock was drilled, cut, and polished to ensure an error within 2 mm. The side surface of the specimen was smooth, with a vertical inclination error less than 0.25° and a surface unevenness less than 0.02 mm. For the Brazilian splitting tensile strength testing, a disc with a diameter of 50 mm and a height of 30 mm was used, and the sample processing accuracy was consistent with the sample processing standard of the compressive strength test. For the direct shear testing, a natural rock mass was cut, polished, and processed to a 100 mm × 100 mm × 100 mm cube test block, as shown in Figure 1. This size was selected to meet the test requirements. Cracks were added to the rock samples before testing to simulate the mechanical properties of rock masses containing cracks.
2.2. Methods
2.2.1. A Freeze–Thaw Cycle Experimental Plan
At present, there is no unified worldwide standard for freeze–thaw cycle test conditions, and there is no clear experimental basis for selecting rock masses. After summarizing the freeze–thaw temperature, time, and lithology of rock freeze–thaw cycle tests performed by domestic and foreign scholars, as well as summarizing various test procedures and rock freeze–thaw cycle test plans in recent years, the test plan for this experiment was determined, as summarized in Table 1.
In this article, the influence of FTCs on the shear mechanical properties of rock masses is examined. Based on previous research and in accordance with the “Standard for Engineering Rock Mass Testing Methods” GB/T50266-2013 [30], experimental conditions such as the number of FTCs and the freeze–thaw temperature range were set in the experiment. In terms of mechanical tests, uniaxial compression tests were conducted on rock specimens after FTC to study the changes in strength parameters such as the uniaxial compressive strength and elastic modulus of rocks under freeze–thaw cycling. Moreover, direct shear tests were carried out on jointed rocks after different numbers of FTCs to study the changes in the shear mechanical properties of the rocks after different numbers of FTCs. The specific experimental plan is shown in Table 2.
2.2.2. Shear Experiment Scheme
The definition of joint persistence (JP) is used to describe the proportion of joint length in the specimen, as shown in Table 3. A total of 5 sets of experiments were set up to study the shear mechanical properties of intermittently jointed rock masses using joint connectivity, FTCs, and normal stress as variables.
2.2.3. Experimental Instruments and Procedures
The testing equipment used in the freeze–thaw cycle, uniaxial compression, and direct shear tests in these experiments mainly included the following:
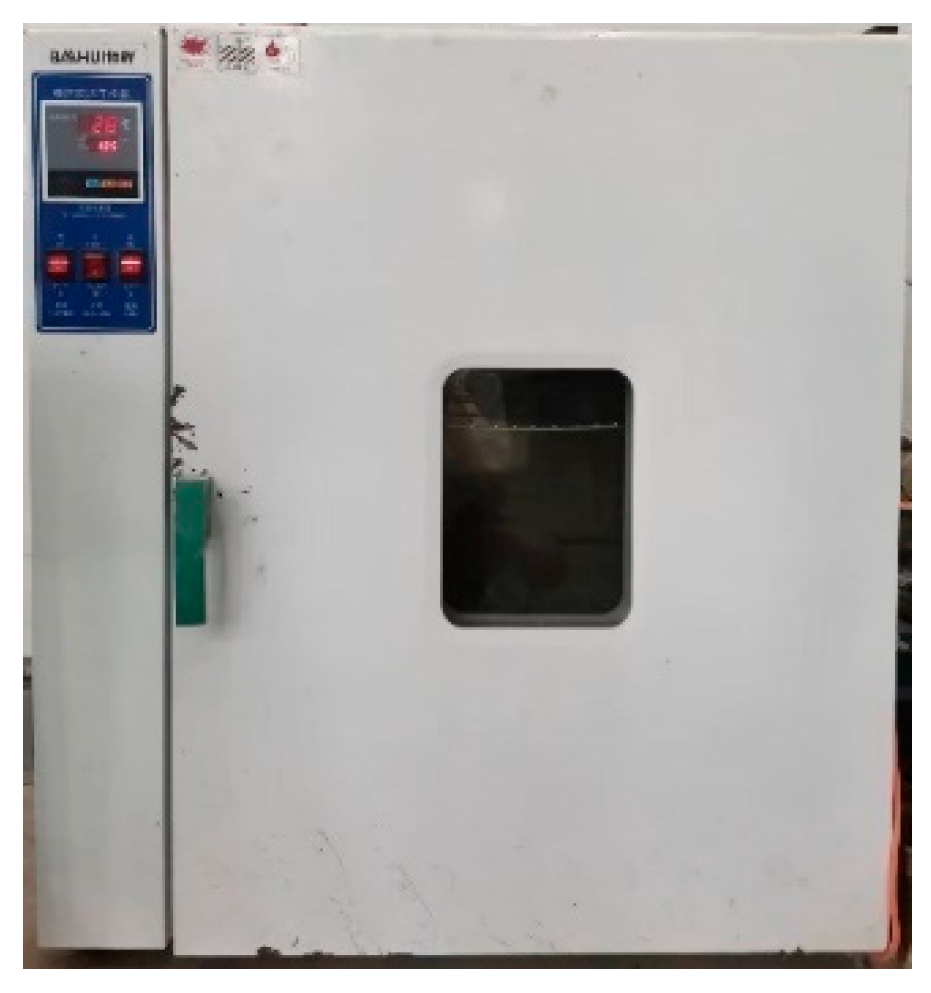
- Electric blast drying oven.
The temperature control range of the drying oven (Figure 2) used in this research was 10–250 °C, with a resolution of 0.1 °C. This temperature-control device, equipped with an automatic wind speed adjustment device, is reliable, stable and easy to operate.
- 2.
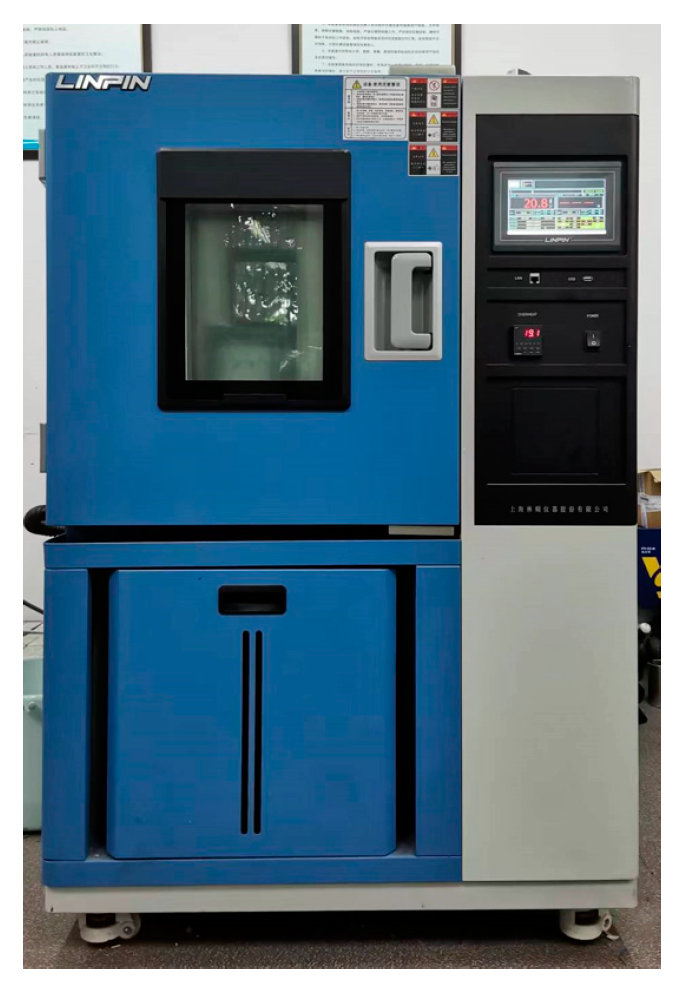
- The Freeze–thaw testing machine
In this study, a high- and low-temperature alternating humidity and heat circulation box (Figure 3) was used as the freeze–thaw test instrument. The main technical parameters of this instrument are a temperature range of −40~150 °C and a humidity range of 20~98%. The heating and cooling rates ranged from 1~3 °C/min.
- 3.
- The Triaxial testing machine
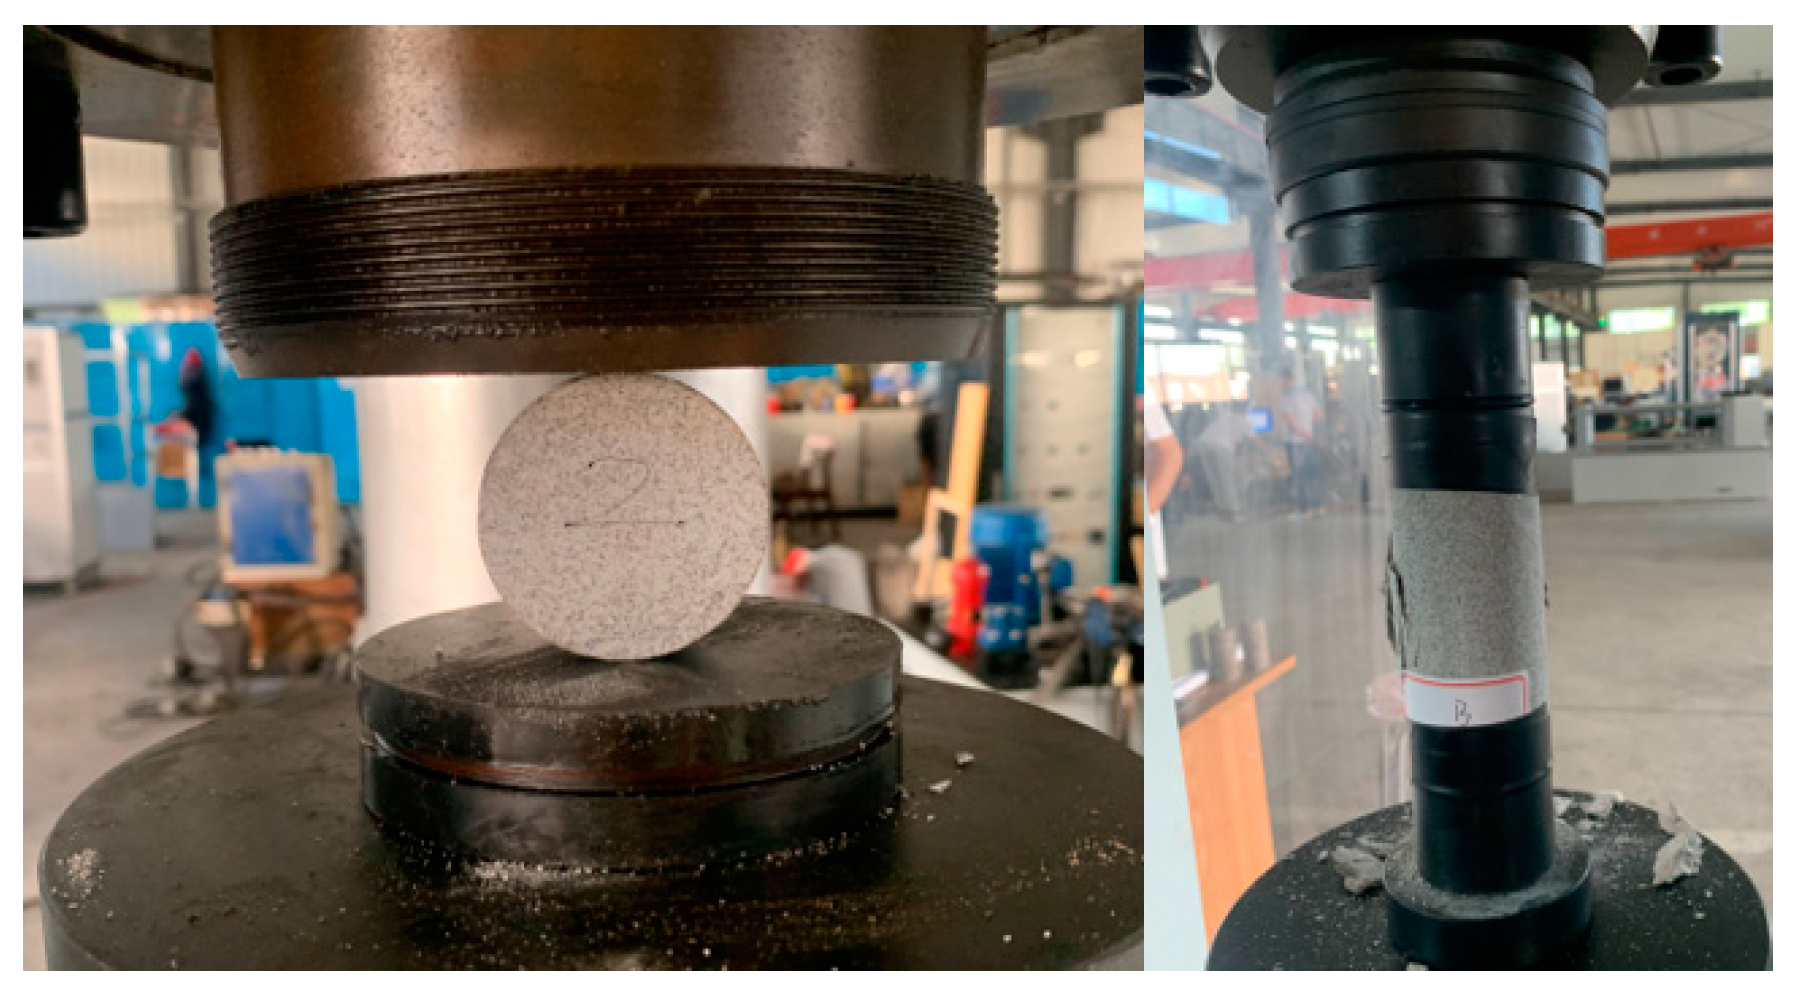
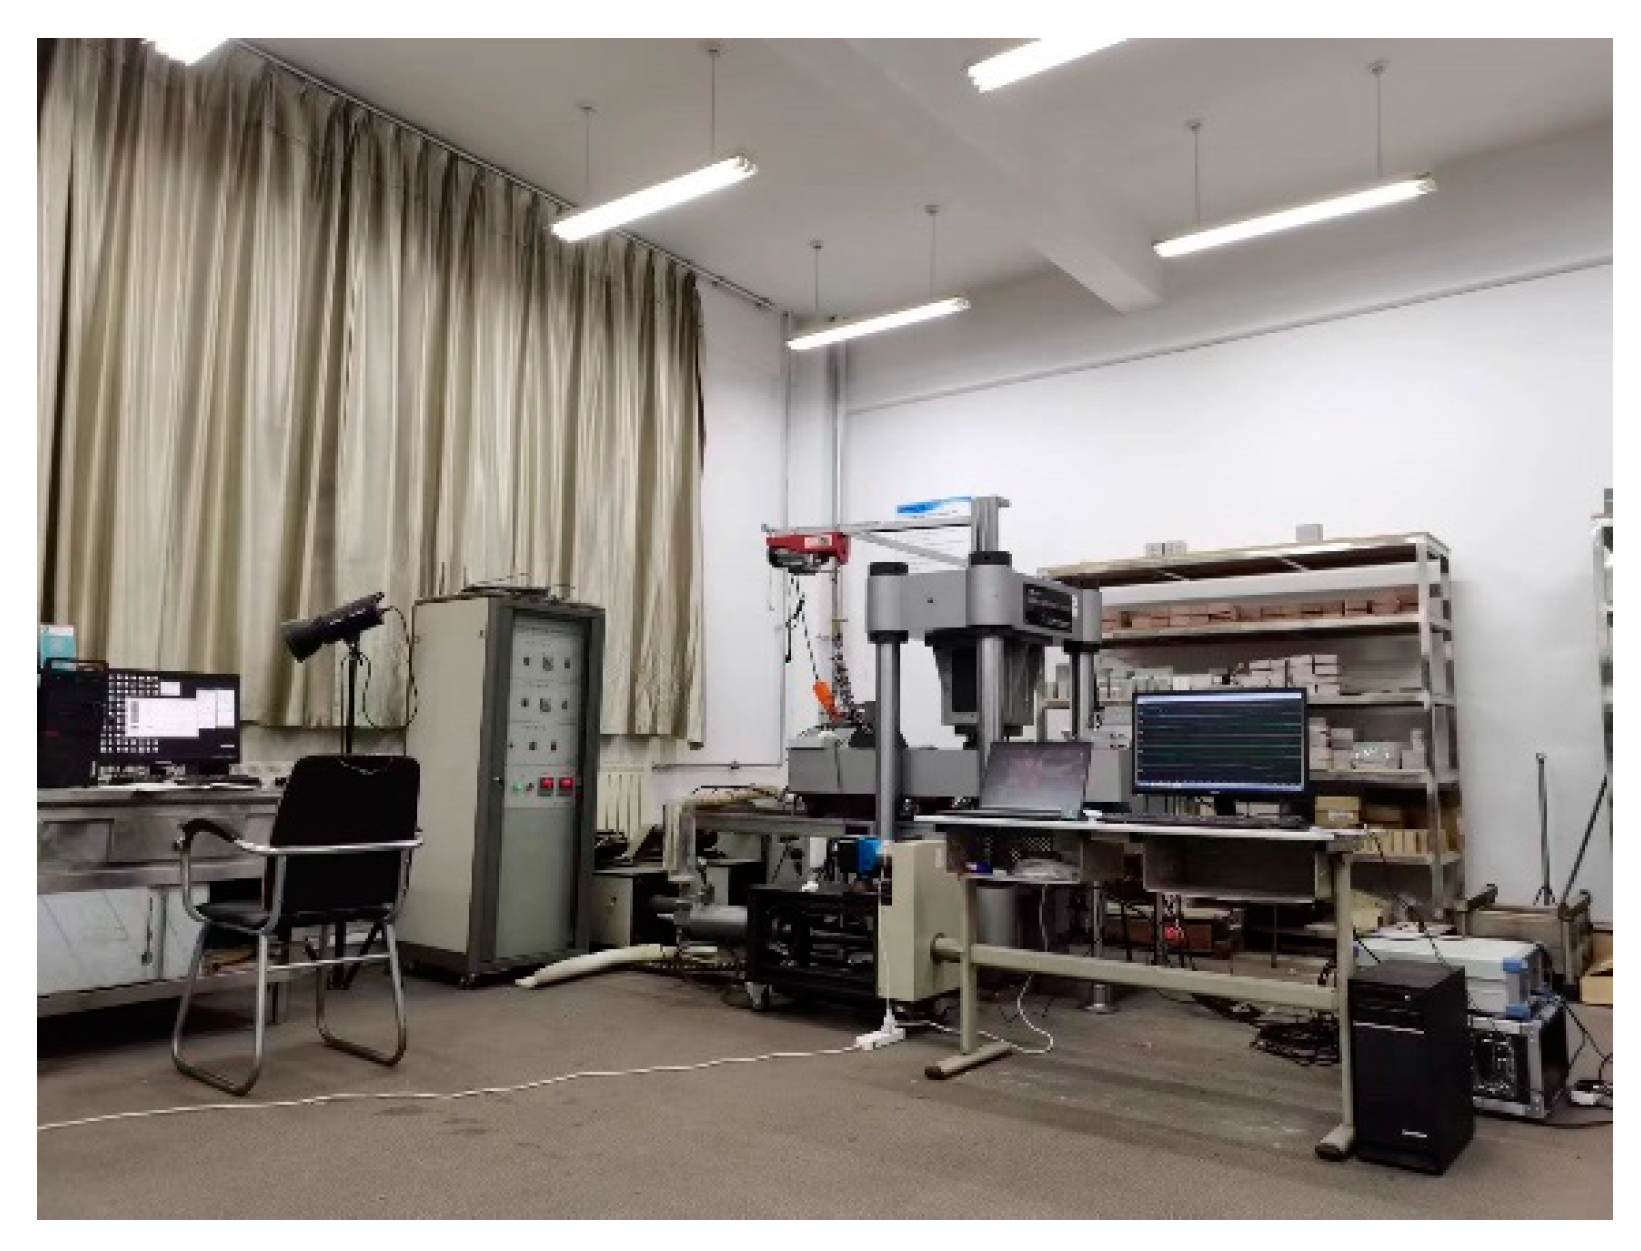
Uniaxial compression tests were conducted on a TAW-2000 microcomputer-controlled electrohydraulic servo rock triaxial testing machine (Figure 4) developed by Changchun Chaoyang Testing Instrument Co., Ltd. (Changchun, China). The Brazilian splitting experiments were also conducted using this equipment. Figure 5 shows the Brazilian splitting and uniaxial compression experimental setups.
- 4.
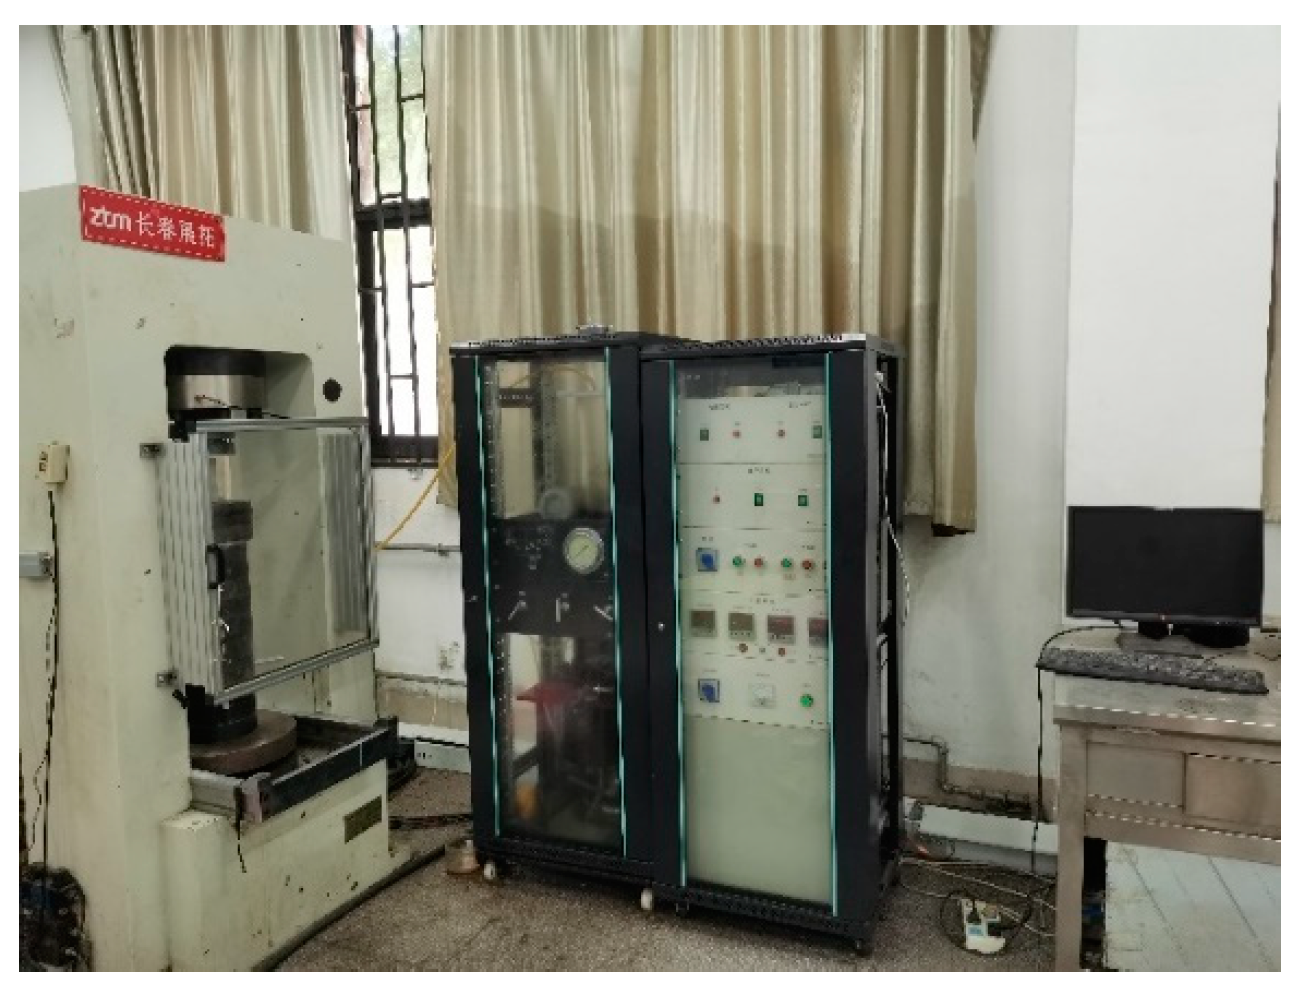
- Rock shear seepage meter
All the shear tests involved in this study were conducted on a JAW-600 rock shear seepage coupling test system (Figure 6).
The experimental process is summarized as follows:
- The processed rock samples are screened and grouped for labeling. Then, all the rock samples are placed in a drying oven, the temperature is set to 105 °C, and the samples are dried for 48 h until the samples no longer changed. Subsequently, the dry density of the rock mass test block can be calculated;
- The natural immersion method is used to saturate the rock sample and measure the mass, geometric size, and other parameters in the saturated state;
- The sample is placed in a high- and low-temperature alternating humidity and heat circulation box for freeze–thaw cycling experiments. The minimum temperature is set to −20 °C to allow the rock specimen to freeze, with a cooling time of 30 min. The low-temperature freezing time is four hours, and the maximum temperature of the test chamber is set to 20 °C. Three identical samples are tested for each experimental condition to avoid accidental errors;
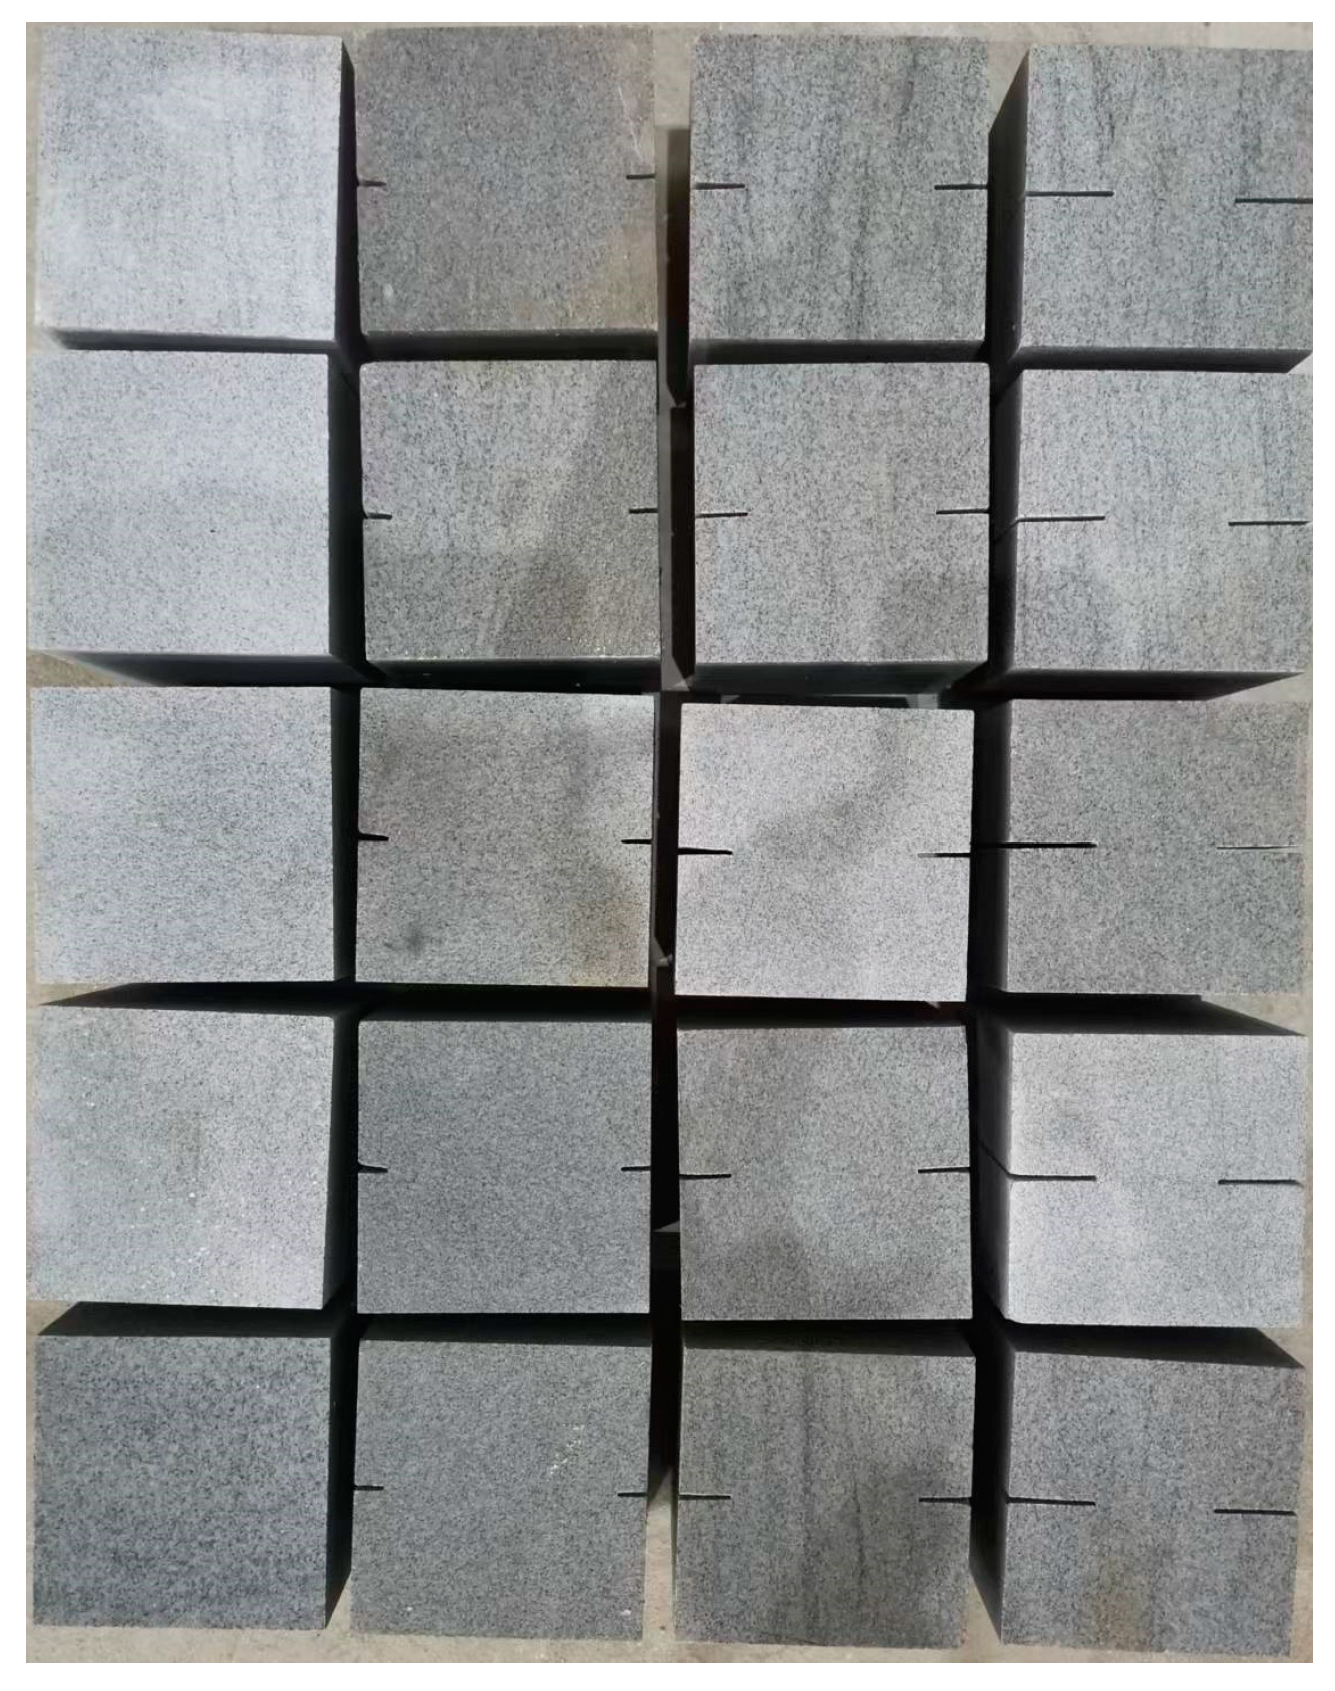
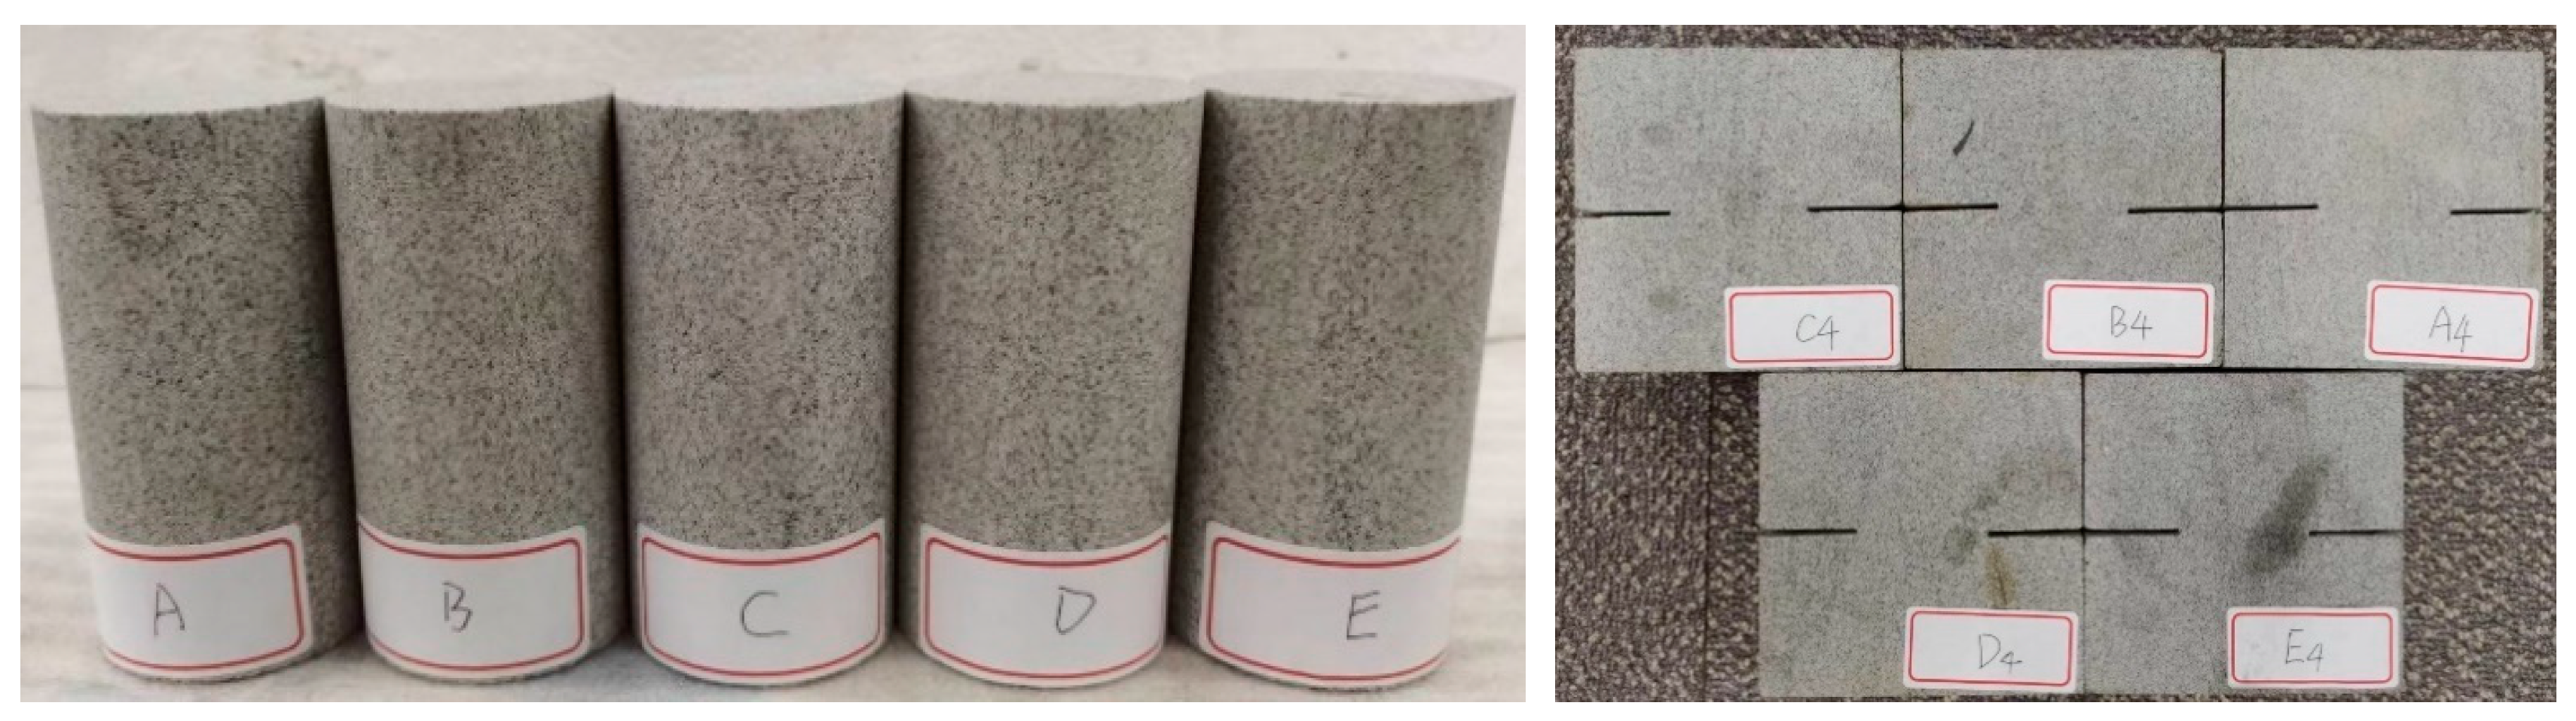
- The numbers of FTCs for the four groups of saturated freeze–thaw rock masses are set to 0, 10, 20, 30, and 40. Each group consists of 3 experimental samples. The numbering sequence is A1, A2, A3, A4, up to E1, E2, E3, and E4, as shown in Figure 7.
- 5.
- The completed physical test sample is placed into a drying oven at a temperature of 105 °C. The sample is dried again for 24 h, after which the mass of the completely dried rock is measured. Then, uniaxial compression, Brazilian splitting, and direct shear tests are conducted, and the test data are recorded and saved;
- 6.
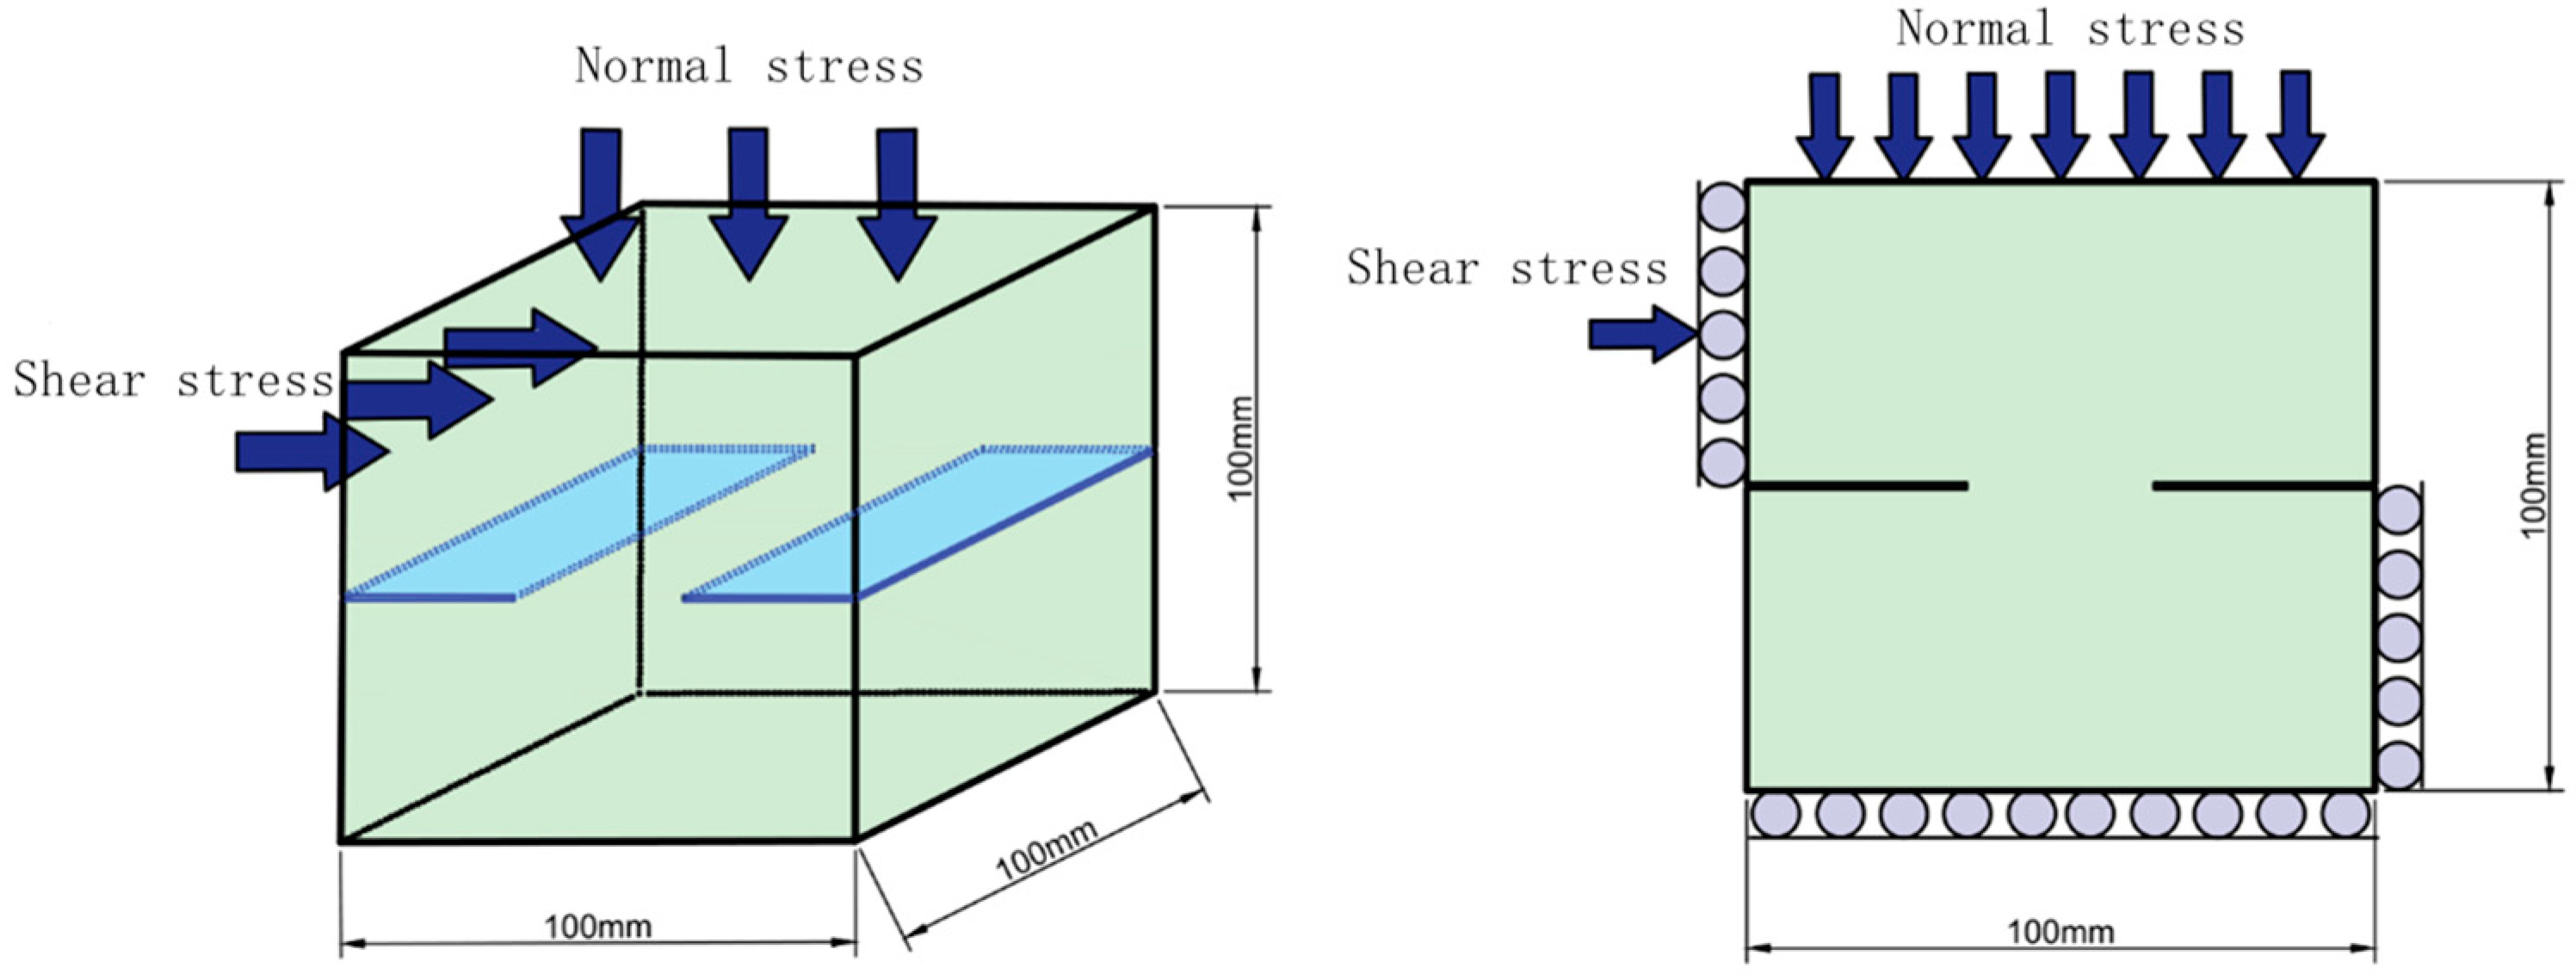
- Direct shear tests are conducted on the rock specimens after freeze–thaw cycling. The test conditions for Groups A, B, C, D, and E are as follows. The different rock bridge dimensions of the rock specimens in Groups A, B, C, and D are 100 mm × 100 mm, 100 mm × 80 mm, 100 mm × 60 mm, and 100 mm × 40 mm, respectively. Therefore, area A of the rock bridge is varied. Therefore, to maintain a constant normal stress on different jointed rock samples, normal stresses of 20 kN, 16 kN, 12 kN, and 8 kN are applied, increasing from 0 kN at a constant rate of 0.5 kN/s until shear failure. Figure 8 shows a schematic diagram of the shear loading force.
3. Results
3.1. The Mechanical Properties of the Rock Mass
To verify the impact of FTCs on various properties of rock masses, uniaxial compression tests were conducted on cylindrical specimens after FTCs. The influence of FTCs on the compressive strength and the variation in the freeze–thaw coefficient of the rock specimens were obtained. By weighing the cubic specimens after freeze–thaw cycling, the changes in the saturated mass and dry mass of the rock mass were obtained. This provides experimental data for the damage evolution theory of rock masses as follows:
- 1.
- Uniaxial compressive strength.
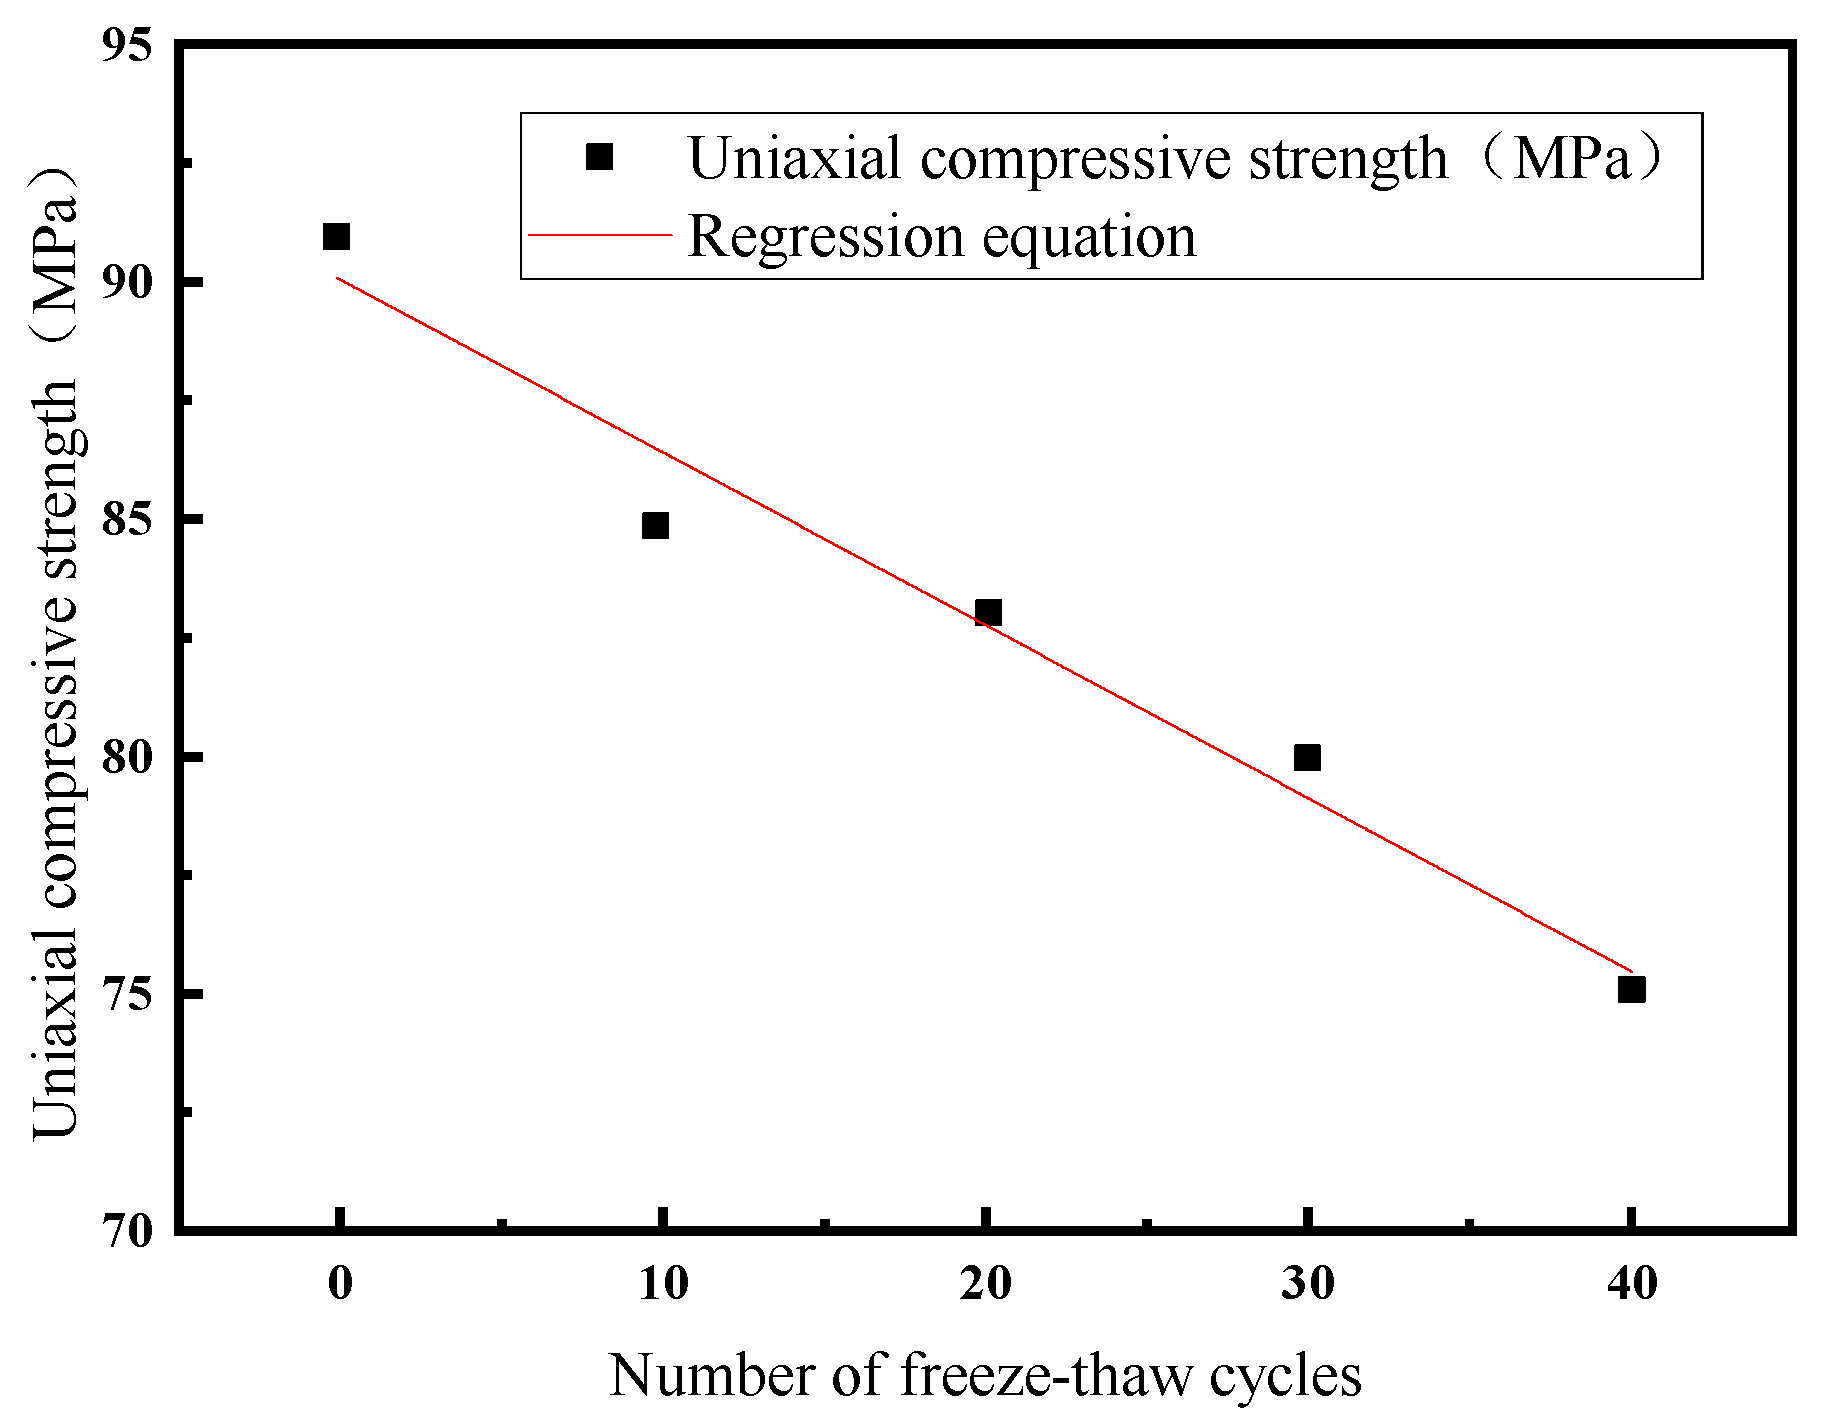
First, freeze–thaw cycle tests were performed on cylindrical specimens, and then uniaxial compression tests were conducted to determine the changes in the uniaxial compressive strength of the rock with an increasing number of FTCs. The curve is shown in Figure 9, and the results indicate that as the number of FTCs increases, the uniaxial compressive strength of a specimen gradually decreases. After 10 FTCs, the strength of the rock mass decreases by 6.32%. After 40 cycles, the average uniaxial compressive strength decreases from 91.06 MPa to 75.43 MPa, with a strength loss rate of approximately 17.12%. In the early stage of freeze–thaw cycling, the internal damage of the rock sample is obvious, leading to a more significant decrease in strength.
The regression equation for the uniaxial compressive strength of the rock mass derived from FTCs is (Equation (1)):
—the uniaxial compressive strength of the rock mass after n freeze–thaw cycles.
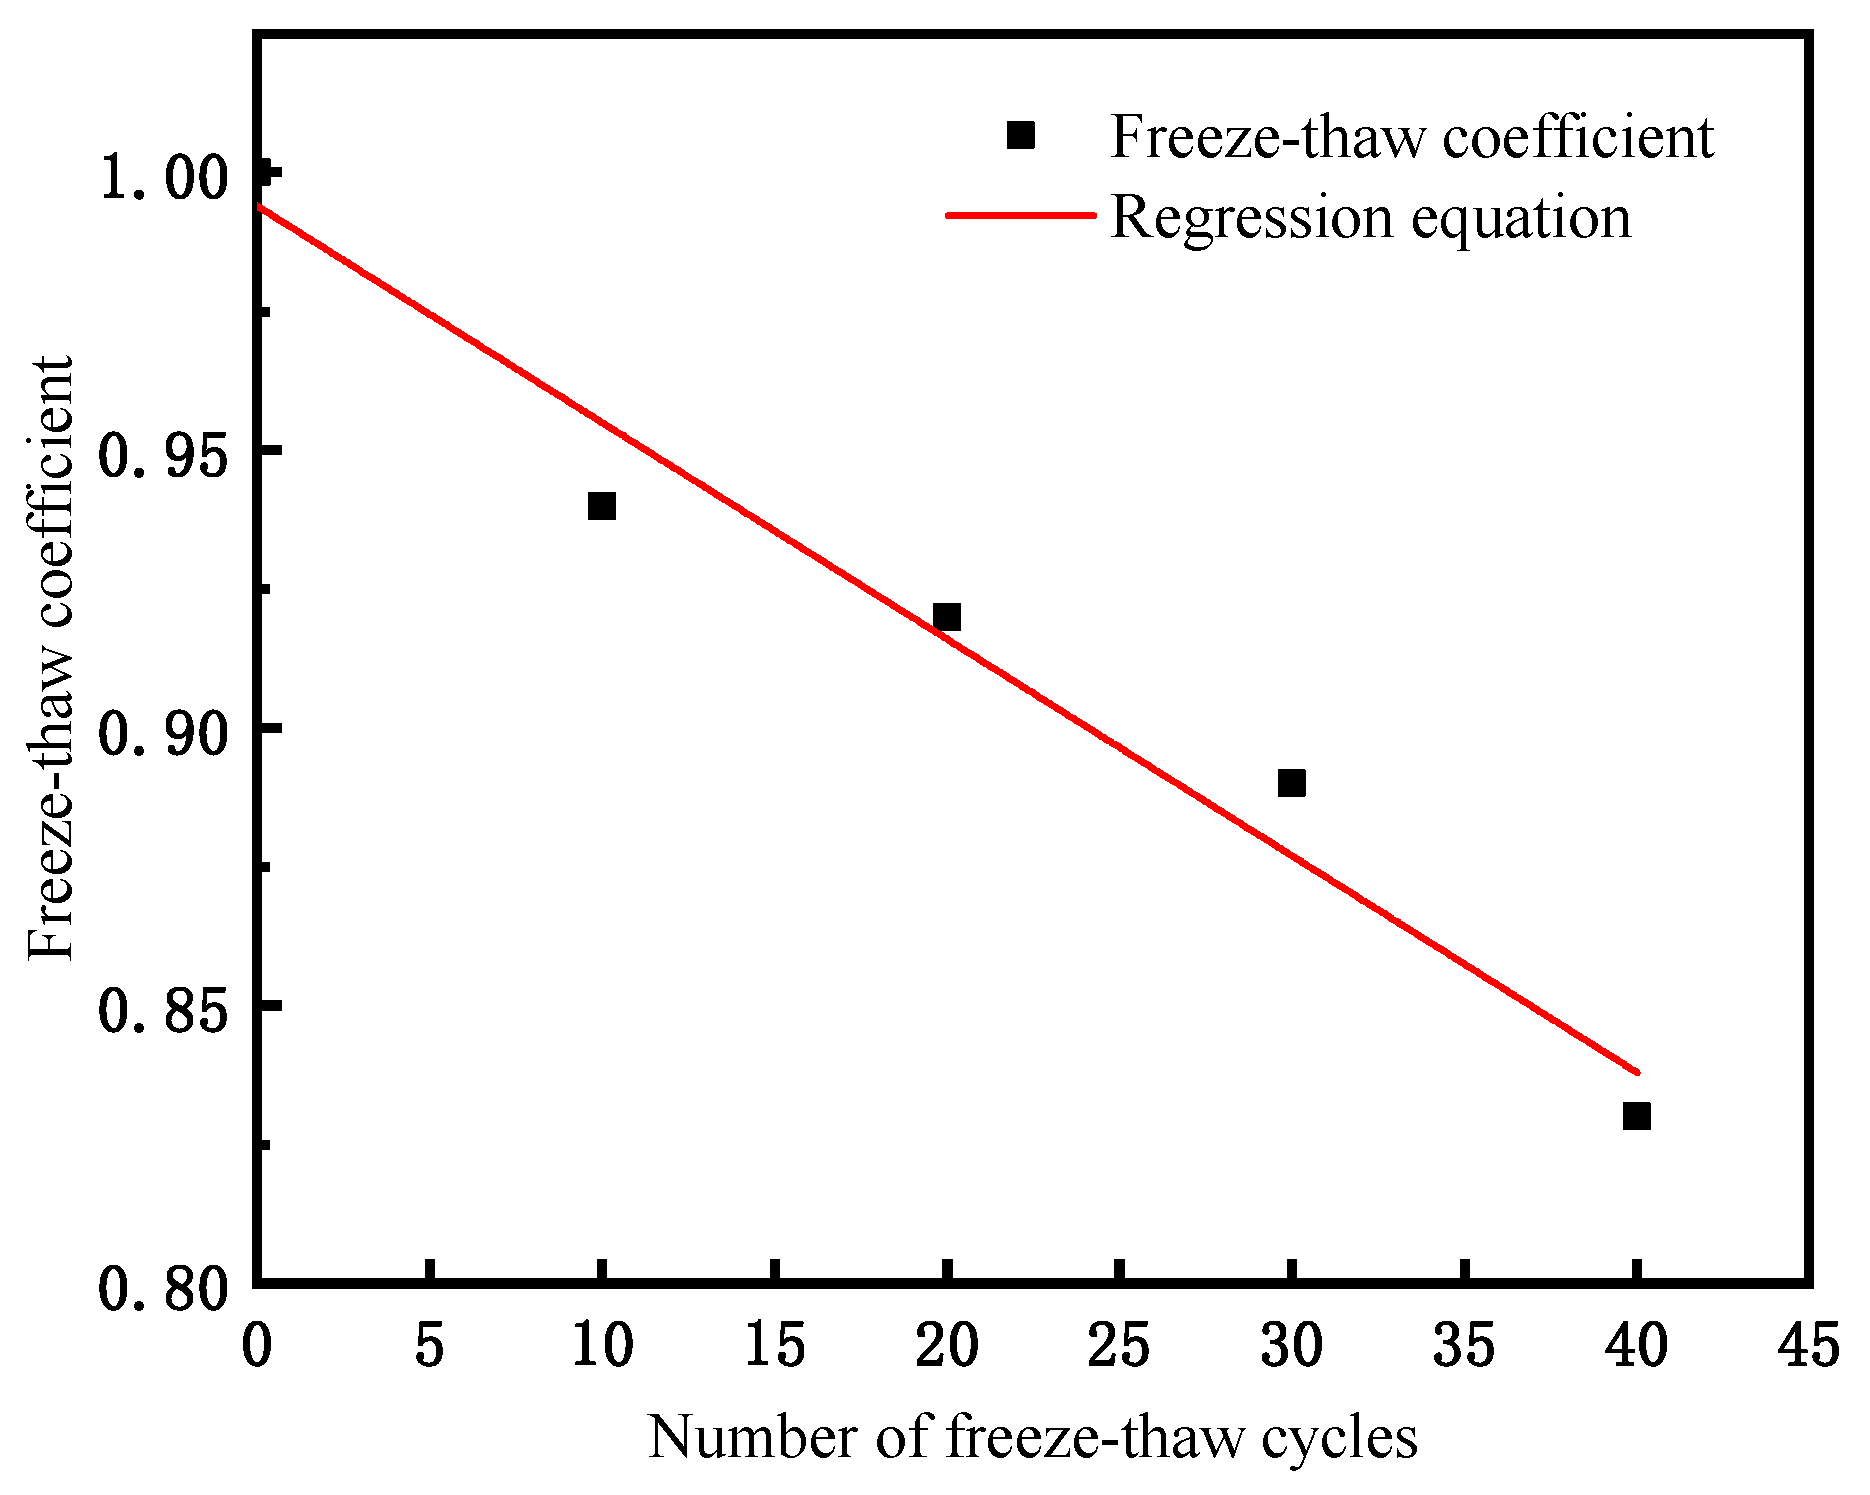
The freeze–thaw coefficient of rocks represents the ability of rocks to withstand freeze–thaw failure, with values ranging from zero to one. When other conditions remain unchanged, the larger the value of is, the smaller the degree of damage caused by freeze–thaw action on the rock, and the better the frost resistance of the rock [31]. The calculation formula for the freeze–thaw coefficient is Equation (2):
—the uniaxial compressive strength of rocks after freeze–thaw cycling.
—the uniaxial compressive strength of rocks before freeze–thaw cycling.
To obtain the freeze–thaw coefficient of a rock sample, the measured compressive strength data of the rock were inserted into Equation (2). The variation in the freeze–thaw coefficient with an increasing number of FTCs is shown in Figure 10. The regression equation for is described by Equation (3):
—the freeze–thaw coefficient after n freeze–thaw cycles.
As shown in Figure 10, as the number of FTCs increases, the frost resistance of the rock mass gradually decreases. Notably, after 30 FTCs, the freeze–thaw coefficient of the rock significantly decreases due to a significant decrease in rock strength. The change in the freeze–thaw coefficient is the same as the change in the uniaxial compressive strength. A rock mass with a freeze–thaw coefficient greater than 75% is considered to have good frost resistance. From the figure, after 40 FTCs, the freeze–thaw coefficient of the tested rock is 83%. The initiation of new cracks and the propagation of initial cracks cannot be observed on the rock sample surface. Based on the rock mass loss rate data, it can be concluded that the rock sample still exhibited good frost resistance after 40 FTCs.
- 2.
- Elastic modulus
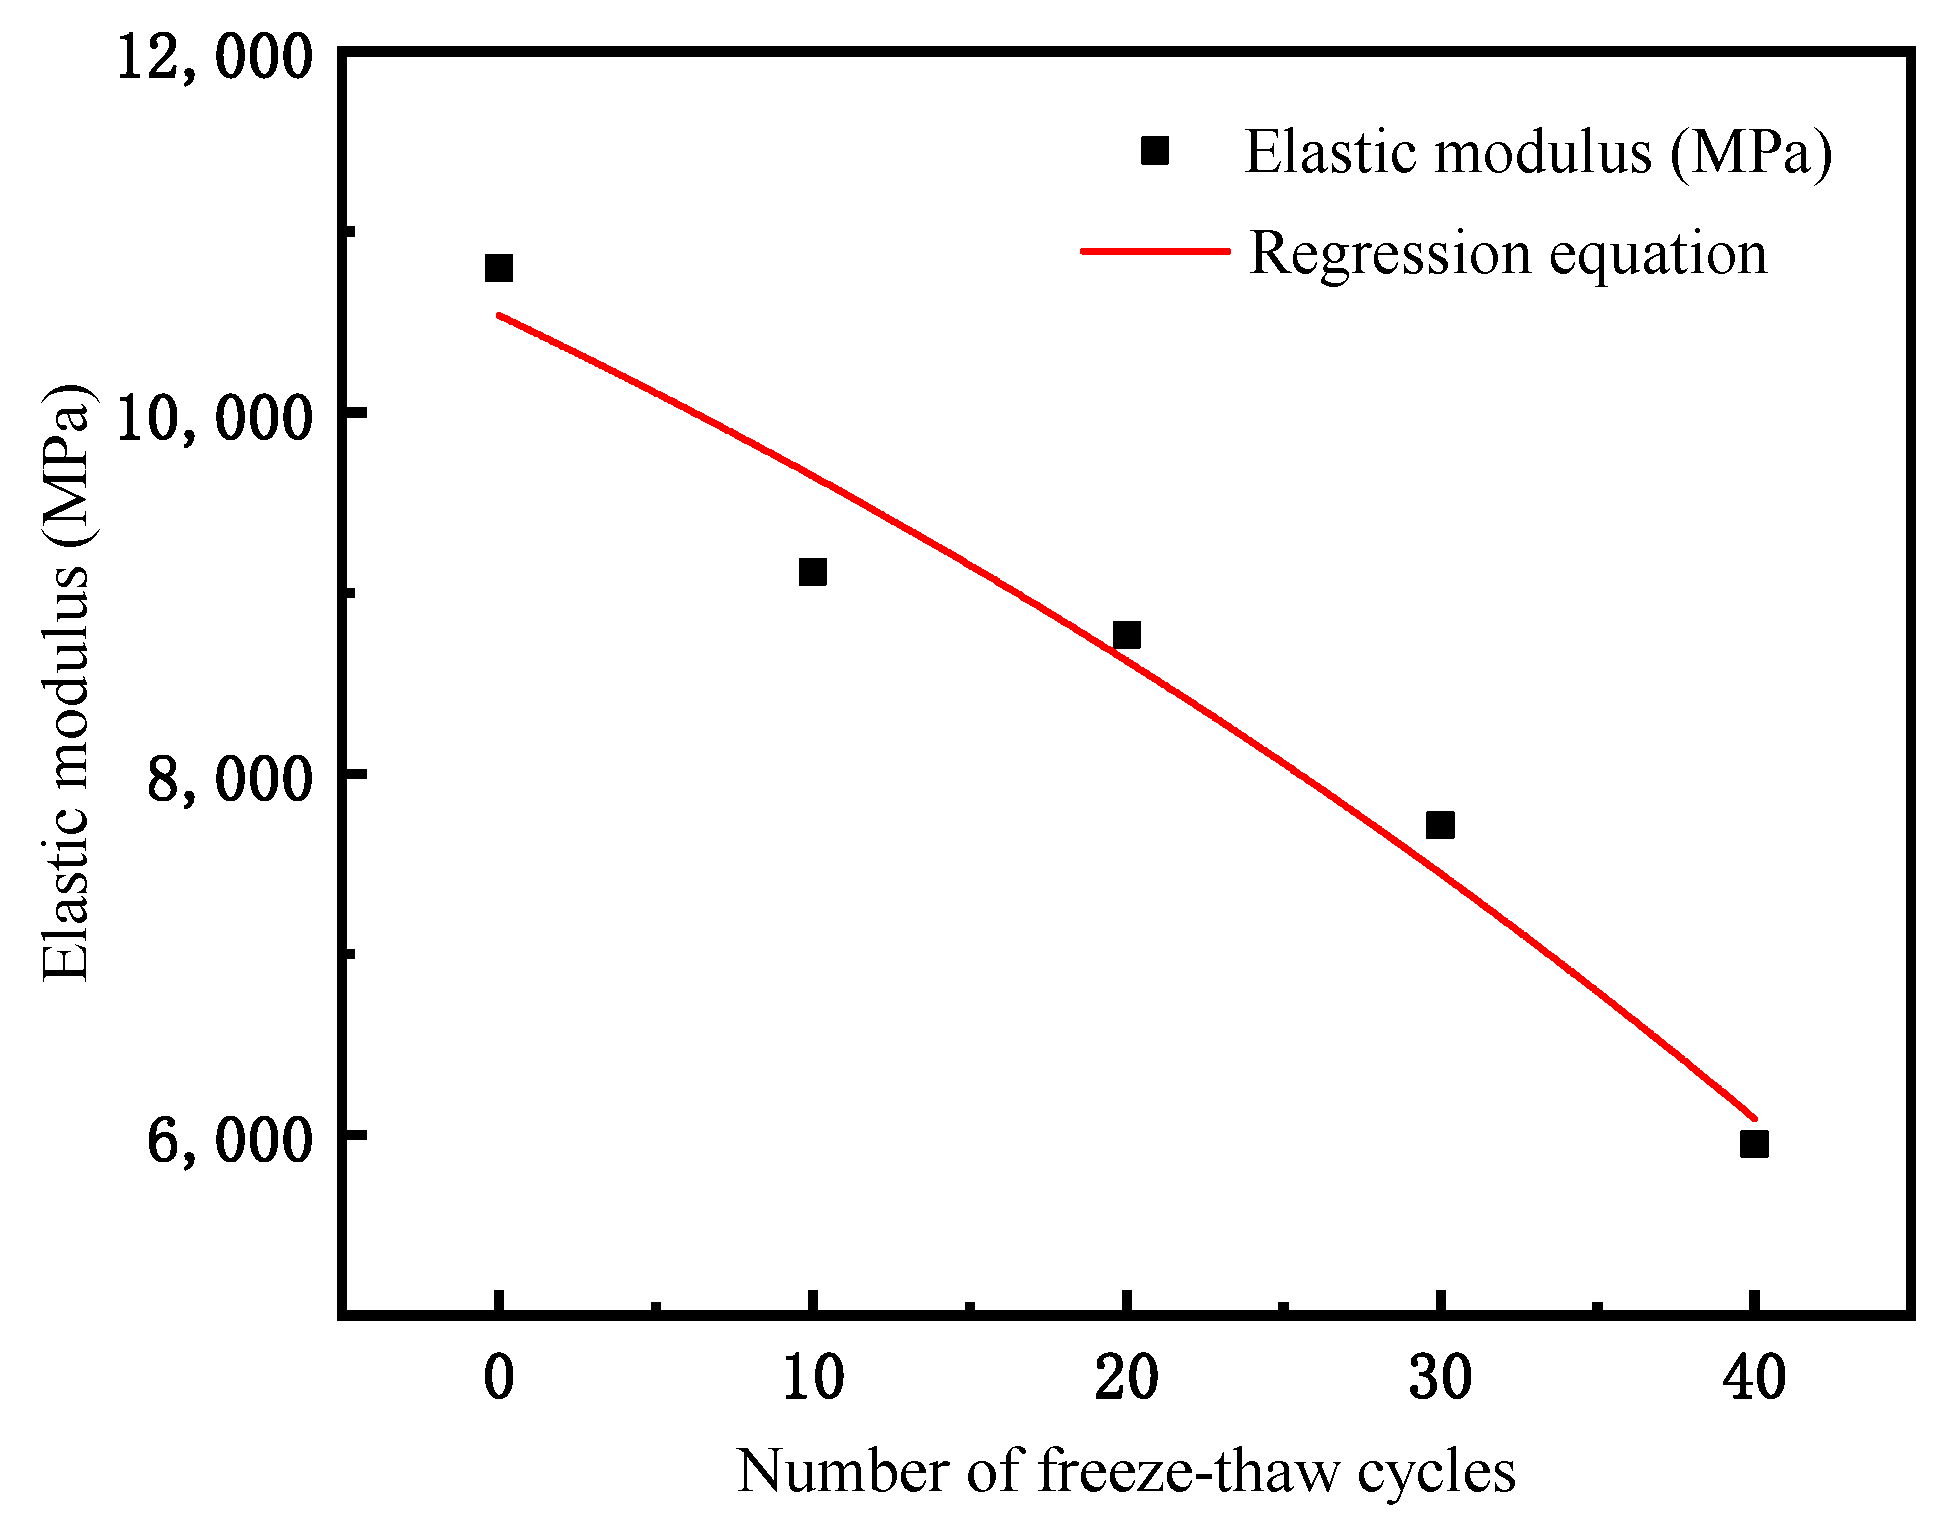
An analysis of Figure 11 indicates that the elastic modulus of the rock mass decreases continuously with an increasing number of FTCs. In the first 10 FTCs, the elastic modulus decreases significantly by approximately 1.66 GPa. After 40 FTCs, the elastic modulus decreased by approximately 45%. The regression equation effectively reflects the relationship between the elastic modulus and the number of FTCs.
As shown in Figure 11, the regression equation of the elastic modulus with the number of FTCs is described by Equation (4):
—the elastic modulus after n freeze–thaw cycles.
- 3.
- Changes in freeze–thaw rock mass
The rock specimens were weighed after freeze–thaw cycling. The dry and saturated masses of the rock sample after 10 FTCs were measured and recorded, and the mass loss rate was calculated as follows (Equations (5) and (6)):
—the saturated mass loss rate;
—the dry mass loss rate;
—the saturated mass of the unfrozen thawed specimen, in grams;
—the saturated mass of the unfrozen thawed specimen, in grams;
—the saturated mass of the specimen after n freeze–thaw cycles, in grams;
—the saturated mass of the specimen after n freeze–thaw cycles, in grams.
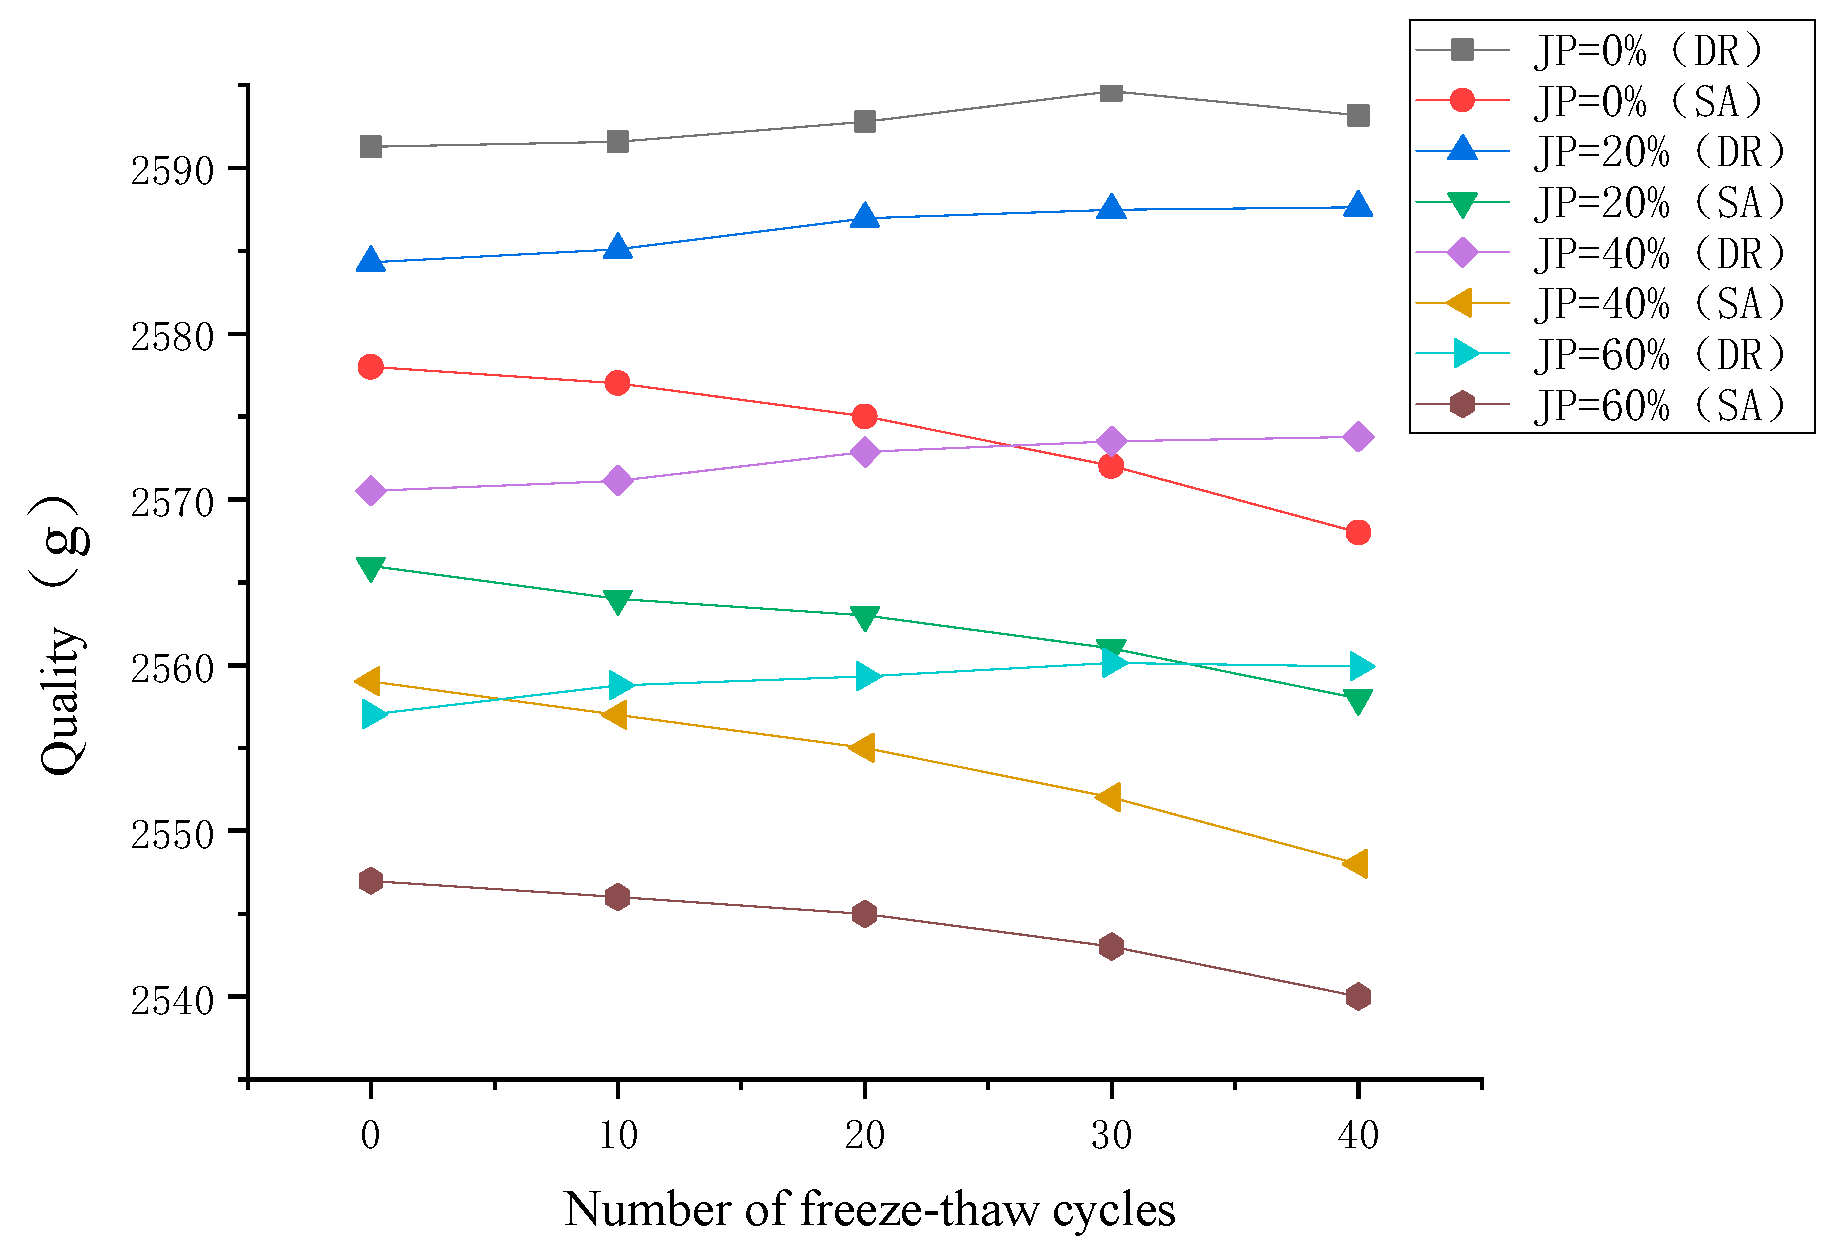
Table 4 shows the changes in the dried and saturated masses of the sandstone specimens after 0, 10, 20, 30, and 40 FTCs.
Figure 12 shows the mass change curve of the rock samples during the freeze–thaw process. An analysis of Figure 12 indicates that as the number of FTCs increases, the dry mass shows a continuous decreasing trend. The saturated mass first increases and then decreases, and there is a slight decrease after 30 FTCs. This is because as the number of FTCs increases, microcracks and pores in the rock continue to develop and connect, and the volume of cracks gradually increases, leading to an increase in the water absorption rate of the rock. In the initial stage, the water absorption mass of the rock mass is greater than the mass loss caused by the detachment of the rock surface; therefore, the saturated water absorption of the rock shows an increasing trend, and the saturated mass loss rate decreases. However, as the experiment continues, the damage to the rock becomes increasingly severe, and the mass loss due to surface peeling gradually becomes greater than the mass gained via water absorption. Therefore, the saturated mass loss rate gradually increases. The frost heave effect causes damage to and peeling of the rock mass surface, resulting in the movement and loss of solid particles inside, thereby exacerbating the mass change.
3.2. Shear Experimental Results for the Rock Mass
3.2.1. The Influence of the Normal Stress on the Shear Stress–Shear Displacement Relationship
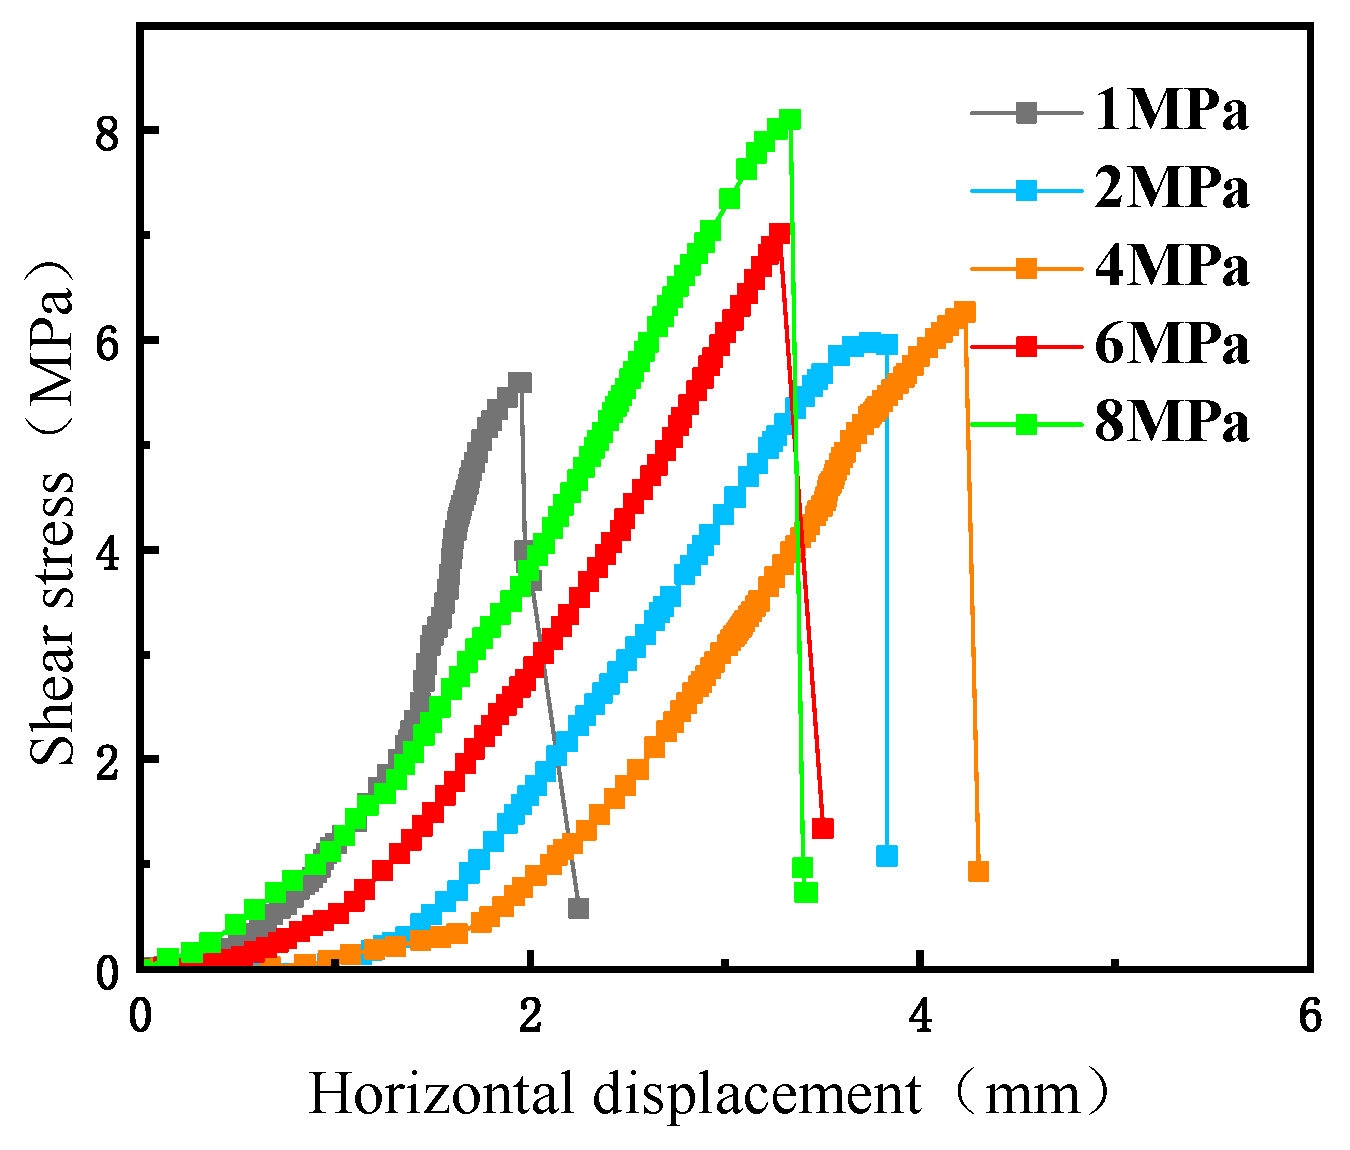
Figure 13 shows the shear stress–horizontal displacement curve of the rock mass under different normal stresses. The variation pattern of the shear stress in the rock specimen in the figure with increasing shear displacement can be summarized into three stages. The first stage is the initial compaction stage, characterized by an increase in shear stress. At this stage, as the shear displacement increases, the shear stress on the shear plane of each specimen slightly increases. Subsequently, the second stage occurs, which is the linear elastic deformation stage. The slope of the curve begins to increase, and the shear stress increases at a faster rate to the peak shear strength. When the shear displacement is small, the joint shear resistance does not fully exert its effect, and the curve rises slowly. As the shear displacement increases, the shear stress begins to steadily increase until reaching the peak strength. The third stage is the yield deformation stage and the shear stress reduction stage. When the shear strength reaches its peak, the specimen undergoes shear failure, and the shear strength of the joint rapidly decreases, leading to a decrease in stress on the curve. As the shear displacement continues to increase, the specimen is completely sheared. Compared with those in the first two stages, the deformation segment in the third stage is smaller, and there is no post-peak residual curve in terms of shear strength. When the yield deformation reaches its limit, shear failure occurs.
As shown in Figure 13, as the normal stress gradually increases, the shear strength shows an increasing trend. When the normal stress increases from 1 MPa to 8 MPa, the shear strength increases from 5.59 MPa to 8.13 MPa.
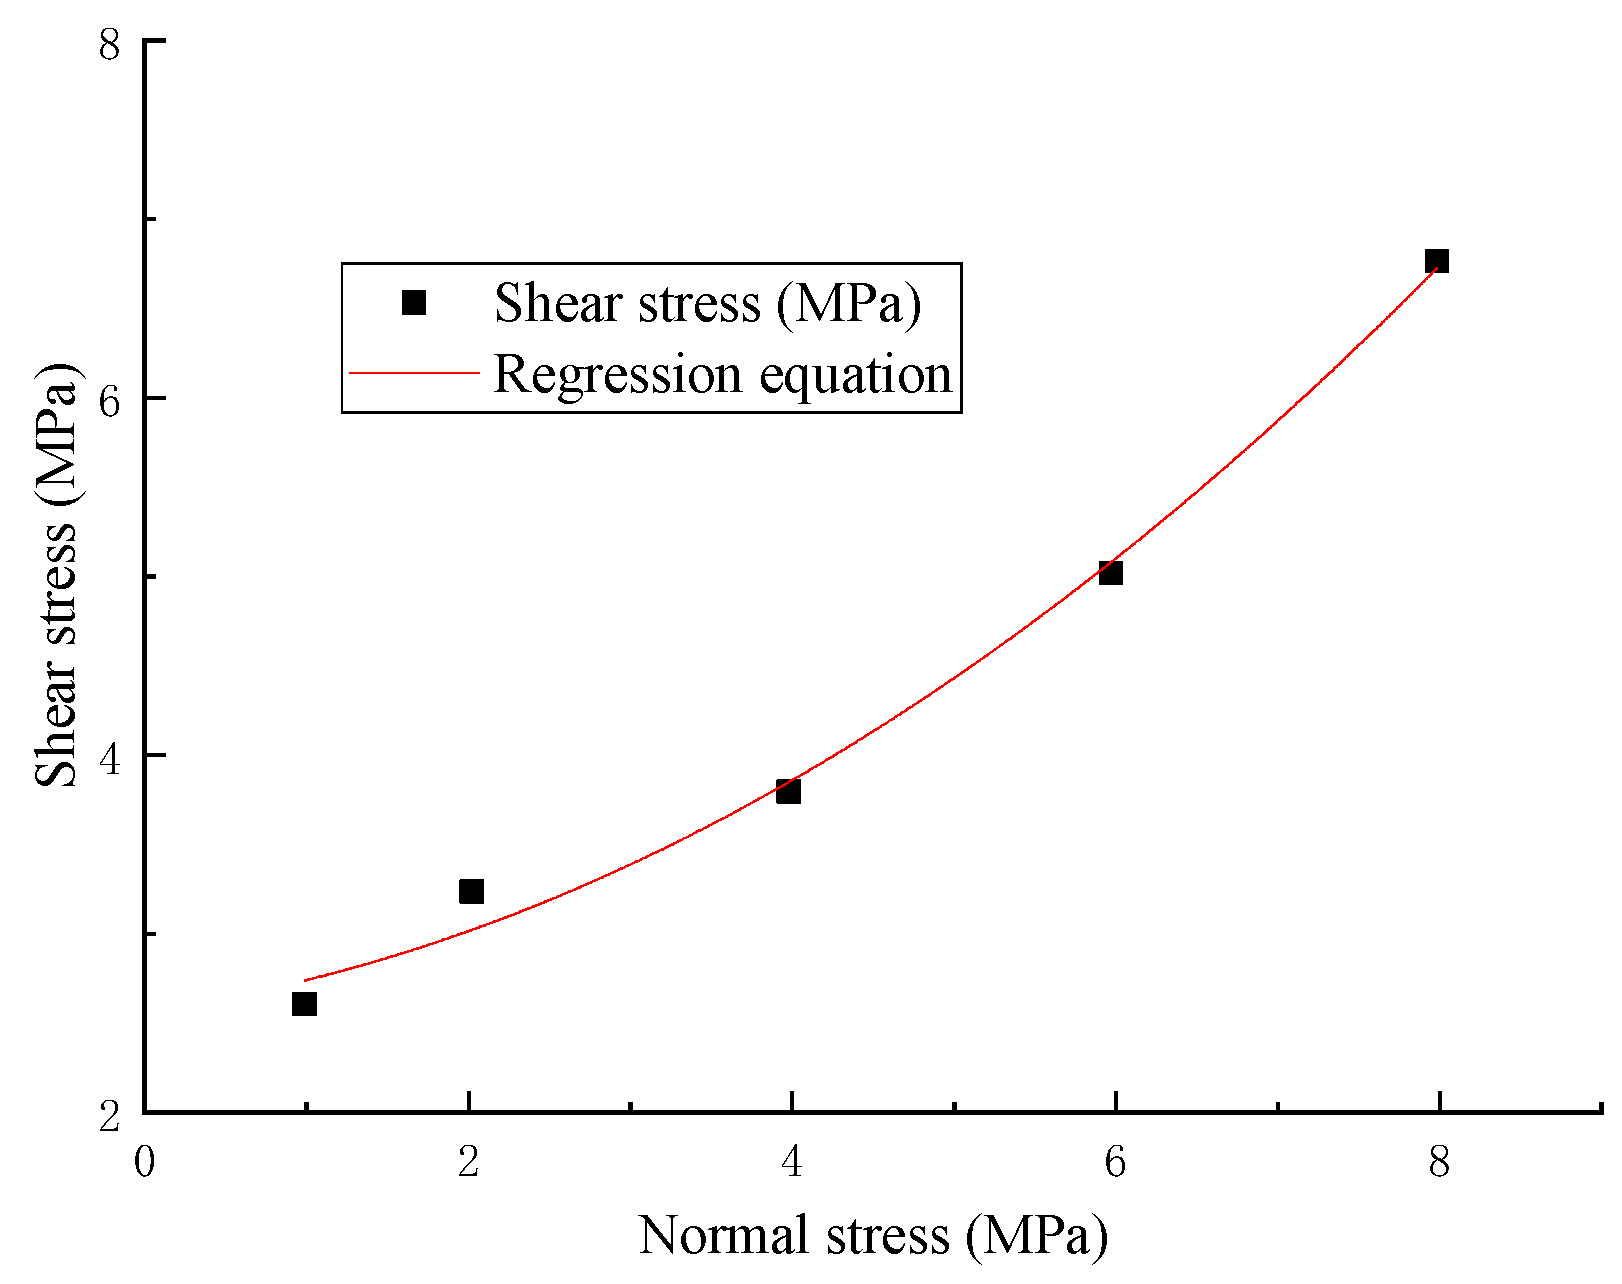
Figure 14 shows the fitting curve between the shear strength and normal stress of the rock mass test block. Figure 14 shows that the fitting relationship between the shear strength and normal stress is good, and the correlation coefficient is relatively large, reaching 0.99. The shear strength also increases with increasing normal stress, and the regression equation is shown in Equation (7):
3.2.2. The Influence of the Joint Connectivity on the Shear Stress–Shear Displacement Relationship
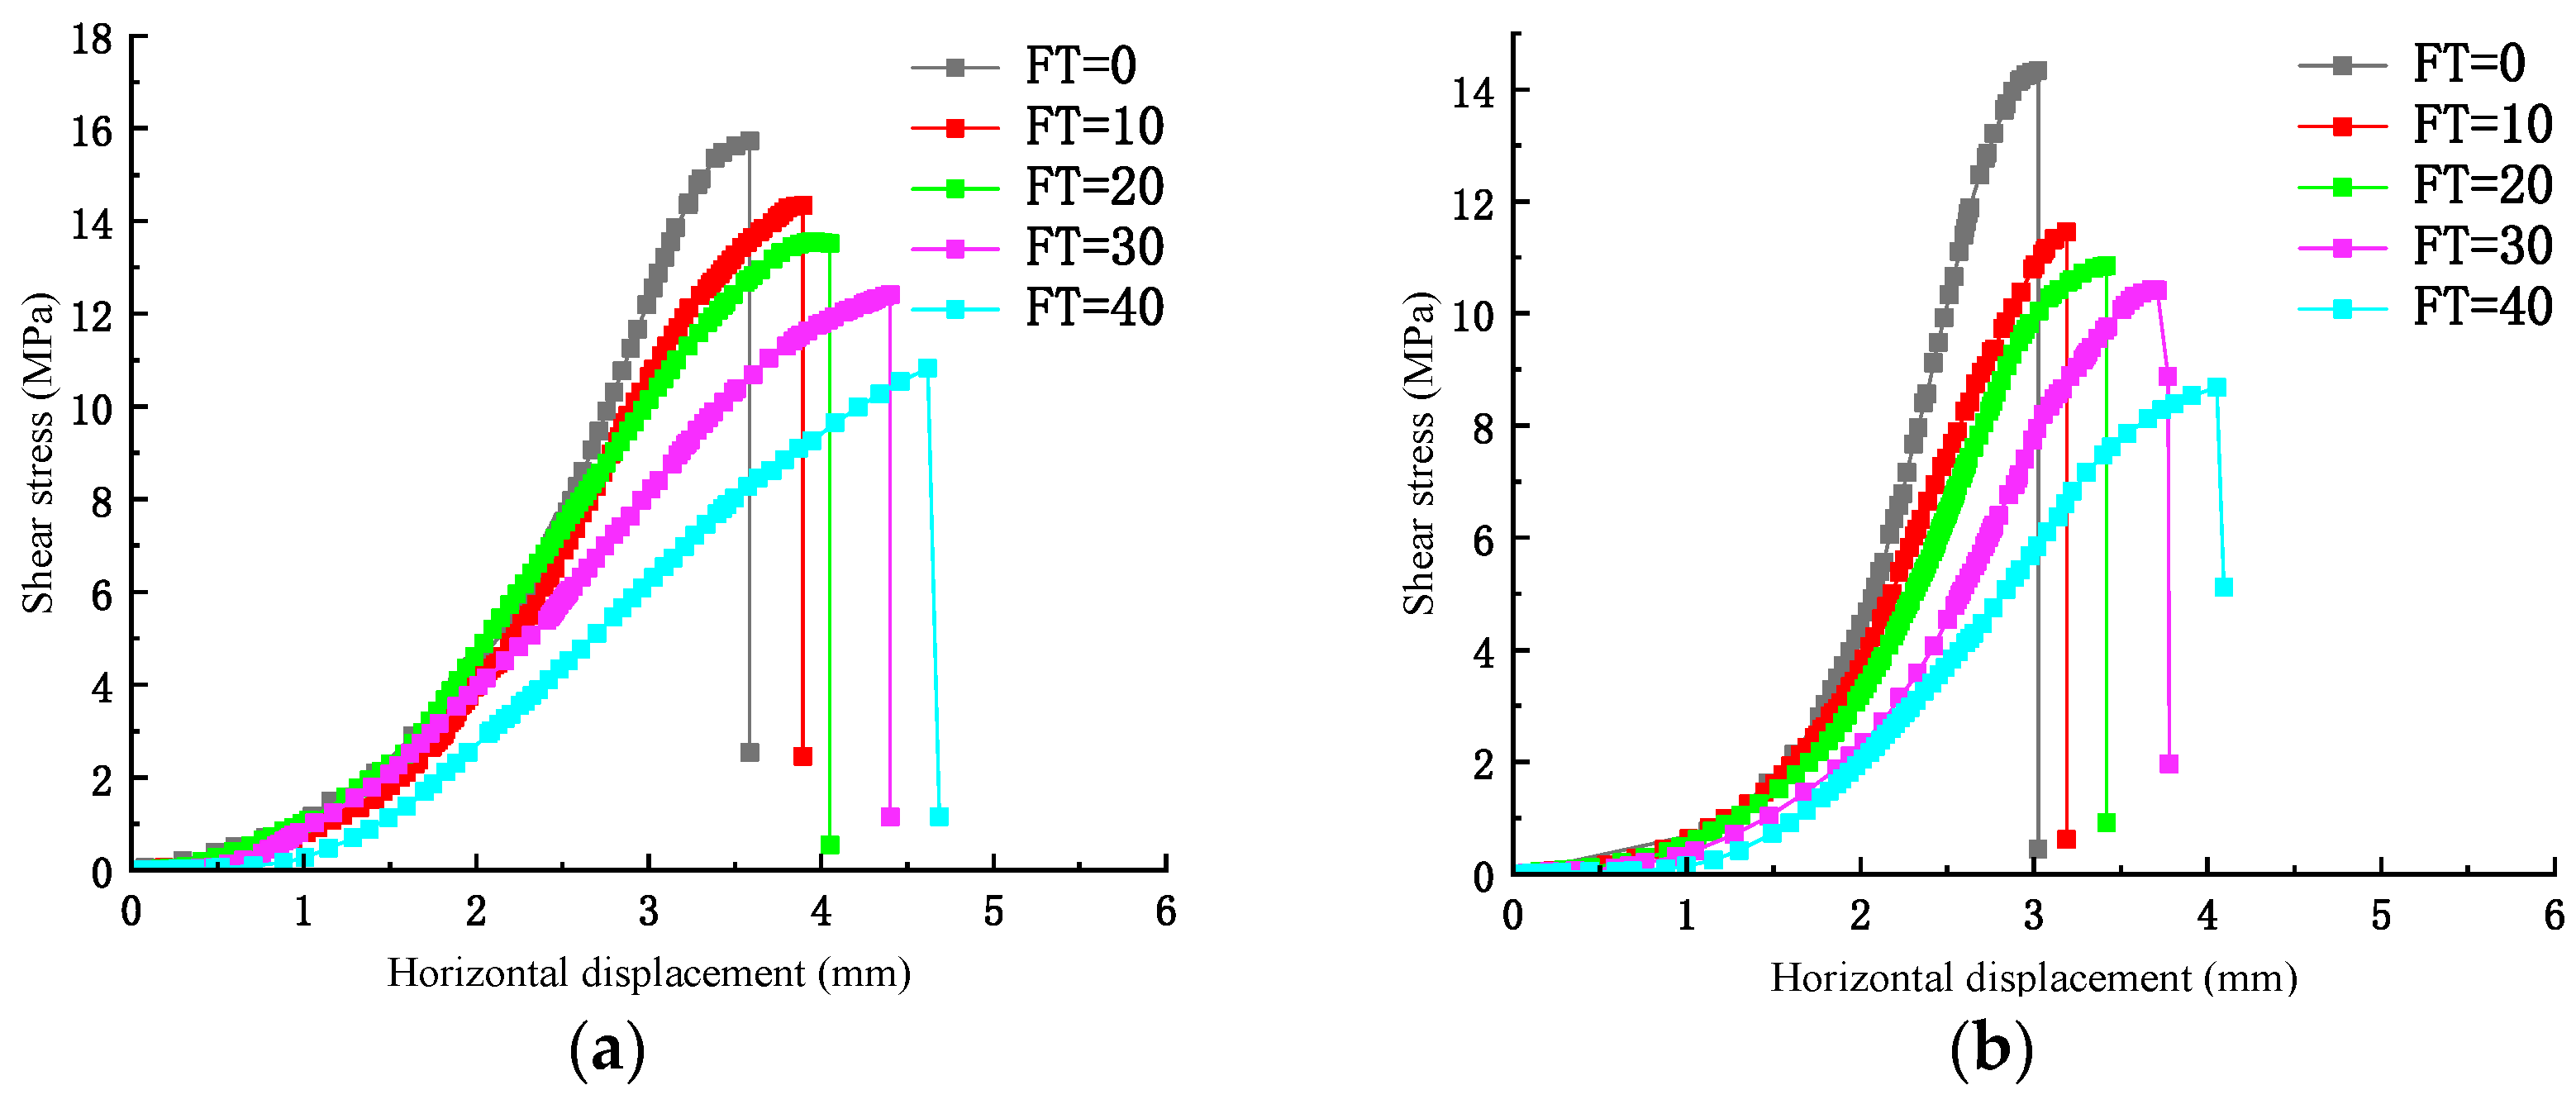
Taking a 2.0 MPa normal stress as an example, in this study, the effect of joints with different JP values on the shear mechanical properties of rock specimens after freeze–thaw cycling was investigated. An analysis of Figure 15 indicates that the shear strength decreases with increasing joint connectivity and that the freeze–thaw cycle causes damage to the rock specimen. This directly leads to a decrease in shear resistance under compressive and shear loads. Rock bridges impose a certain constraint on shear displacement, and in the natural state, the shear strength of intact rock specimens is similar to that of jointed specimens. Moreover, the shear strength of intact rock specimens after freeze–thaw cycling is significantly greater than that of jointed specimens. In the initial loading stage, the shear displacement is small, and the corresponding linear segment of the curve is obvious. Subsequently, the joint surface begins to slide when the yield stage is reached.
The peak shear displacement of the tested rock after freeze–thaw cycling is smaller than the peak shear displacement before freeze–thaw cycling. As the number of FTCs increases, the peak shear displacement shows a decreasing trend, and the difference in peak displacement before and after FTCs increases with increasing joint connectivity. Thus, it can be concluded that as the number of FTCs increases, the shear displacement corresponding to the peak shear strength of the jointed specimen decreases.
3.2.3. The Effect of FTCs on the Shear Stress–Strain Curve
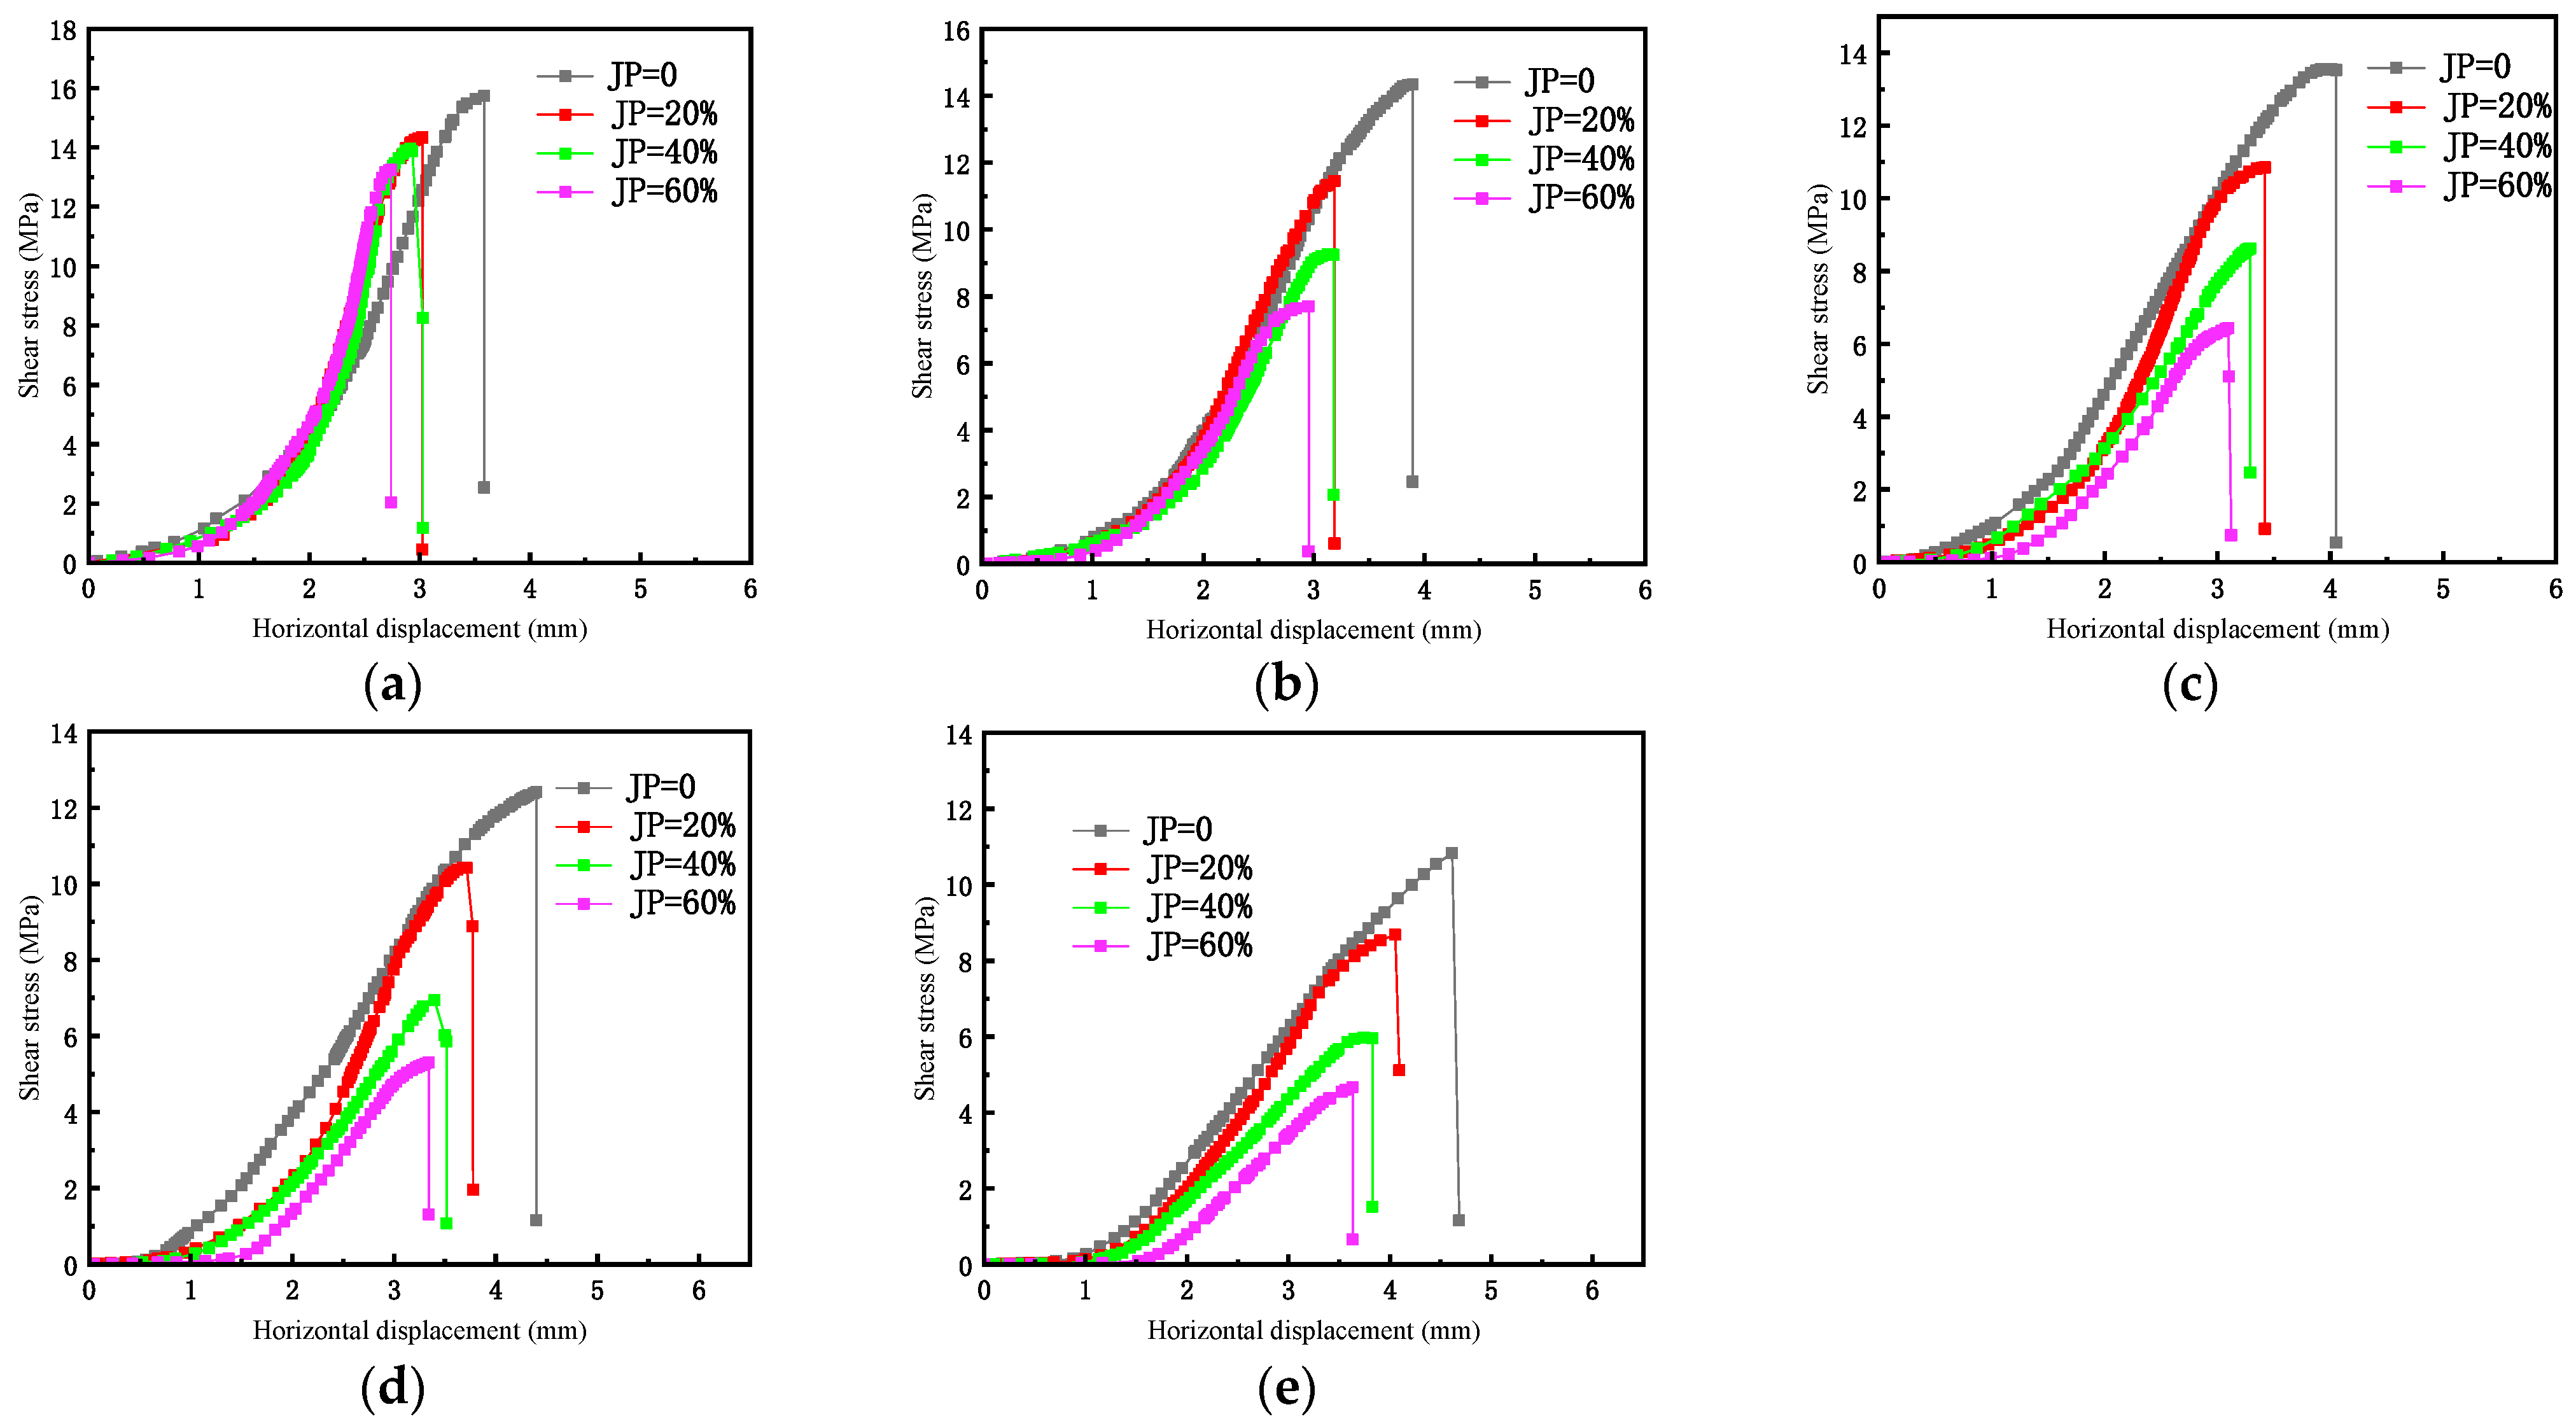
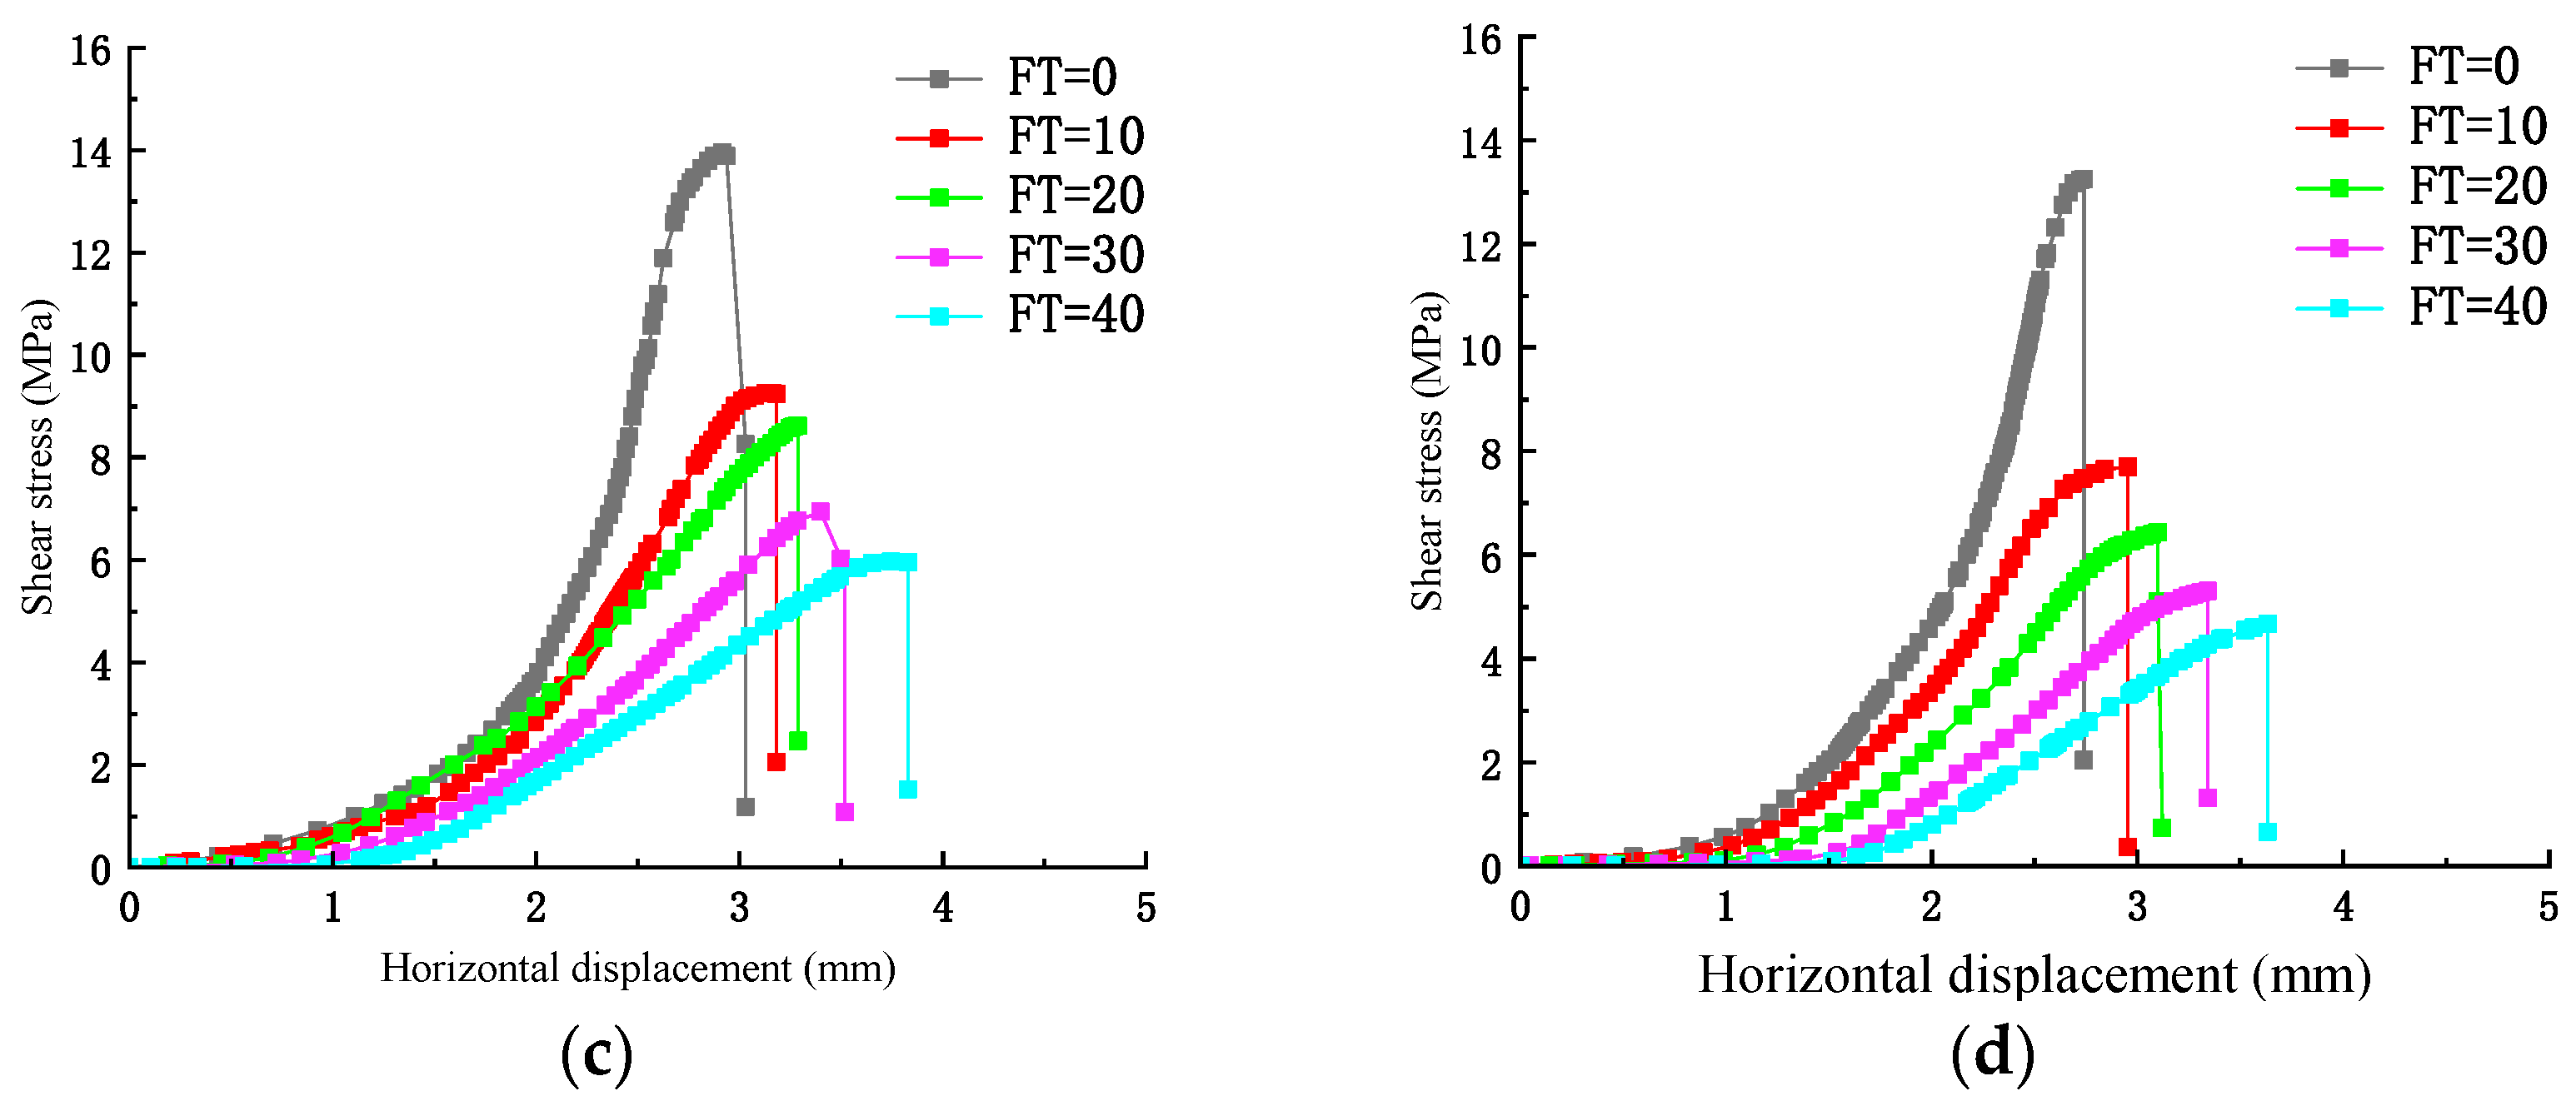
For a normal stress of 2.0 MPa, and the effect of FTCs on the shear mechanical properties of jointed rock with different JP values was studied. Figure 16 shows the corresponding shear stress–displacement curves. The shear stress–horizontal displacement curves in the figure exhibit a high similarity, presenting four stages: the compaction stage, elastic deformation stage, plastic deformation stage, and failure and instability stage.
As the number of FTCs increases, the decrease in shear strength of the rock gradually decreases. When the JP of the joints increases from 20% to 30% and then to 40%, the shear strength of the joints sharply decreases with increasing number of FTCs. This indicates that the number of FTCs has a small impact on the shear strength of jointed rock masses with lower connectivity, but for jointed rock specimens with higher connectivity, the effect of FTCs is significant.
During the initial loading period, as the shear displacement increases, the shear stress on the shear plane of each specimen slightly increases. This is because under the influence of the load, the cracks, pores, etc., in the rock mass gradually close, and the curve shows an upward concave shape. Subsequently, the slope of the curve begins to increase approximately linearly, with shear stress increasing at a faster rate and shear strain energy continuously accumulating. The slope of the curve gradually decreases afterward, reflecting a plastic stage where macroscopic cracks of varying degrees appear on the surface of the rock mass until the shear stress reaches its peak and the rock mass begins to fail. Finally, the stage of rock mass failure and instability occurs. As the loading progresses and reaches the peak shear stress, the macro- and microcracks in the rock mass continue to expand and may eventually coalesce, gradually developing into the main crack. At this stage, the shear strain energy is fully released, and the rock mass undergoes a shear slip along the main crack, resulting in ultimate instability and failure.
As the number of FTCs increases, the overall upward concave trend of the curve gradually becomes less obvious and gradually transitions to an upward convex trend. In the linear elastic stage, the slope of the curve decreases significantly with an increasing number of FTCs, the peak shear strength gradually decreases, and the shear displacement shows a significant increasing trend. Under freeze–thaw cycling, the water in the pores and fractures inside the sandstone undergoes a water–ice phase transition. Water freezes into ice, increasing its volume and generating an expansion force, leading to crack expansion. As the ice melts, free water enters new cracks. This cyclic process leads to the cracking and coalescence of sandstone at different scales at the microlevel, resulting in an increase in the number of fractures. Therefore, when the rock is under pressure, the time needed for the internal pores and cracks to close increases. In the shear stress–strain curve, the more FTCs there are, the longer the compaction stage. Simultaneously, the number and volume of microcracks in the rock mass continue to increase, the rock mass lithology decreases, the elastic section of the curve shortens, the shear modulus decreases, and the plastic stage gradually lengthens.
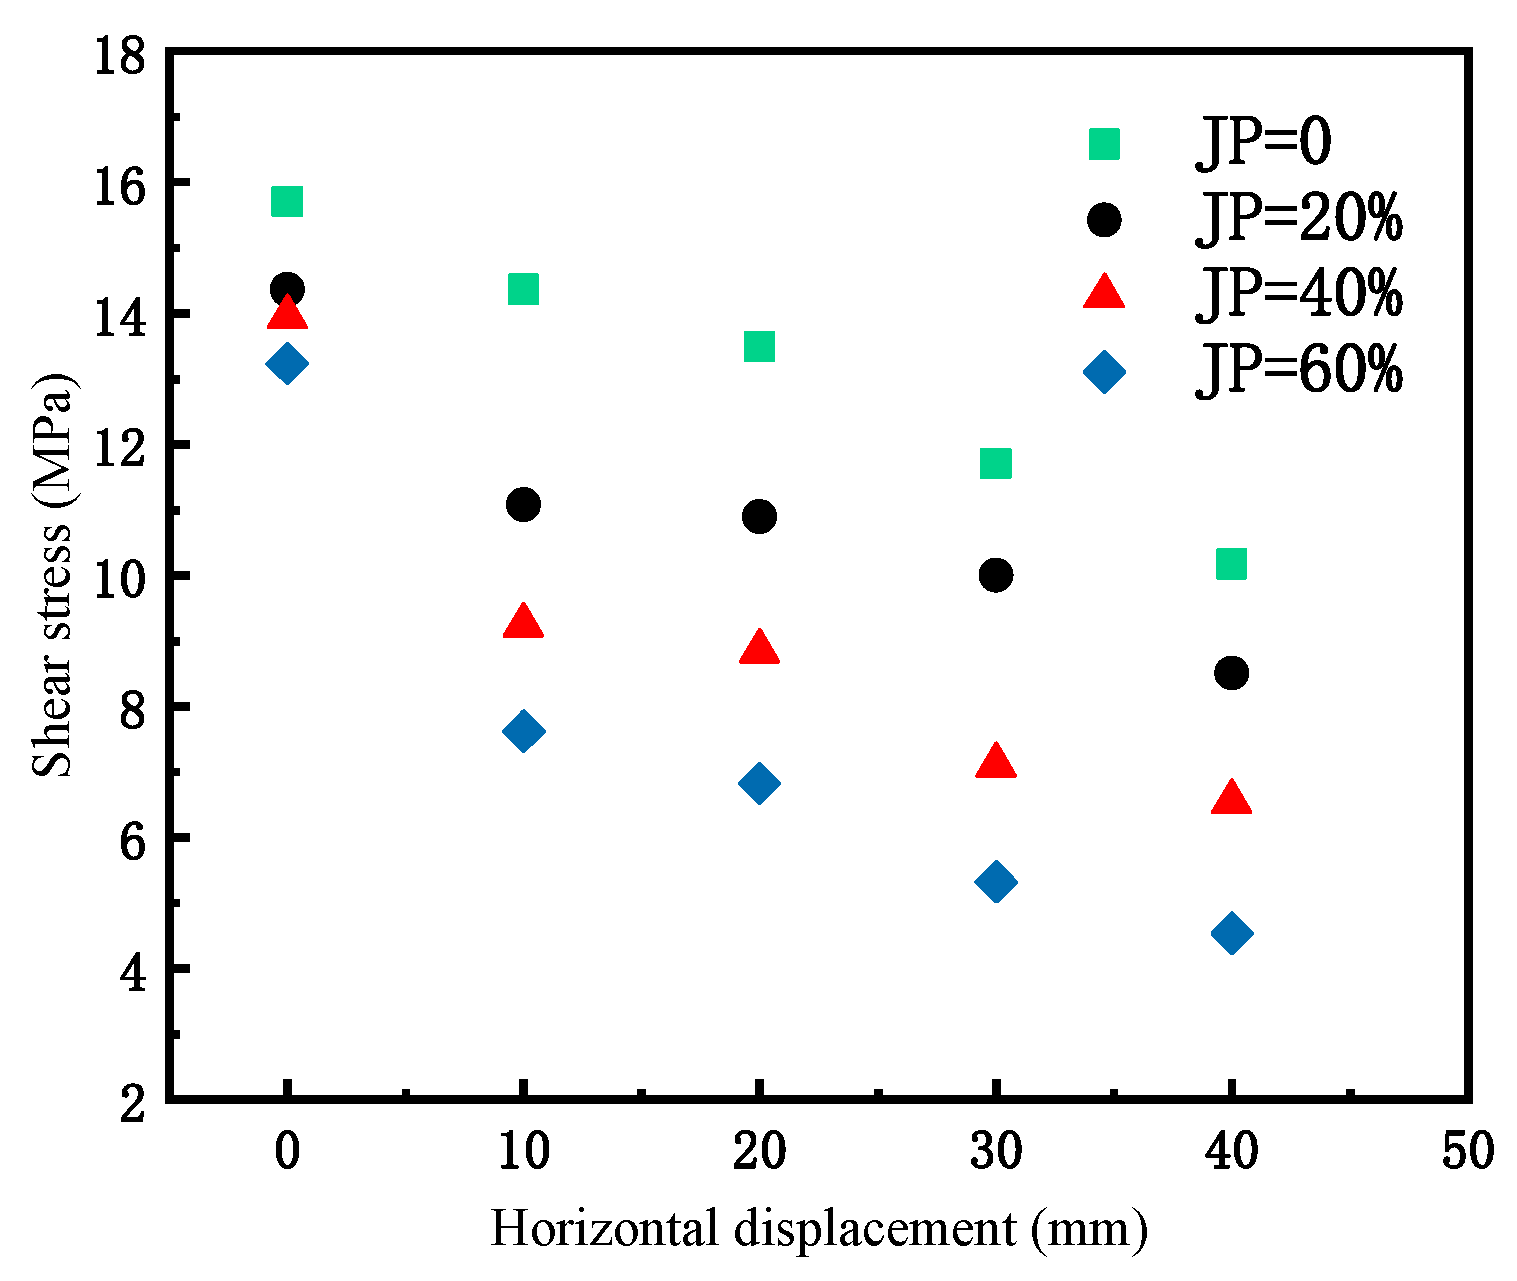
The jointed rock masses with different JP values exhibit a decreasing trend in shear strength with an increasing number of FTCs. The shear strength of the intact rock specimens ranges from 13 MPa to 16 MPa. The shear strength with a JP of 20% ranges from 8 MPa to 15 MPa. The shear strength of the rock specimens with a JP of 40% ranges from 6 MPa to 14 MPa. The shear strength of the rock specimens with a JP of 60% ranges from 5 MPa to 14 MPa. Figure 17 shows a scatter plot of the change in shear strength with the number of FTCs. Figure 17 reflects the weakening of the shear strength freeze–thaw damage with increasing number of FTCs. An analysis of Figure 17 indicates that as the number of FTCs increases, the shear strength shows an exponentially decreasing trend. As the number of FTCs increases, the decrease in shear strength slows.
3.3. An Analysis of Internal Extension through Failure in Direct Shear Experiments
The uniaxial compressive strength of the sandstone used in this experiment is approximately 90 MPa, and the Brazilian splitting strength is approximately 10 MPa.
3.3.1. An Analysis of the External Surface Expansion and Penetration Failure of Intermittently Jointed Rocks under Different Connectivity Conditions
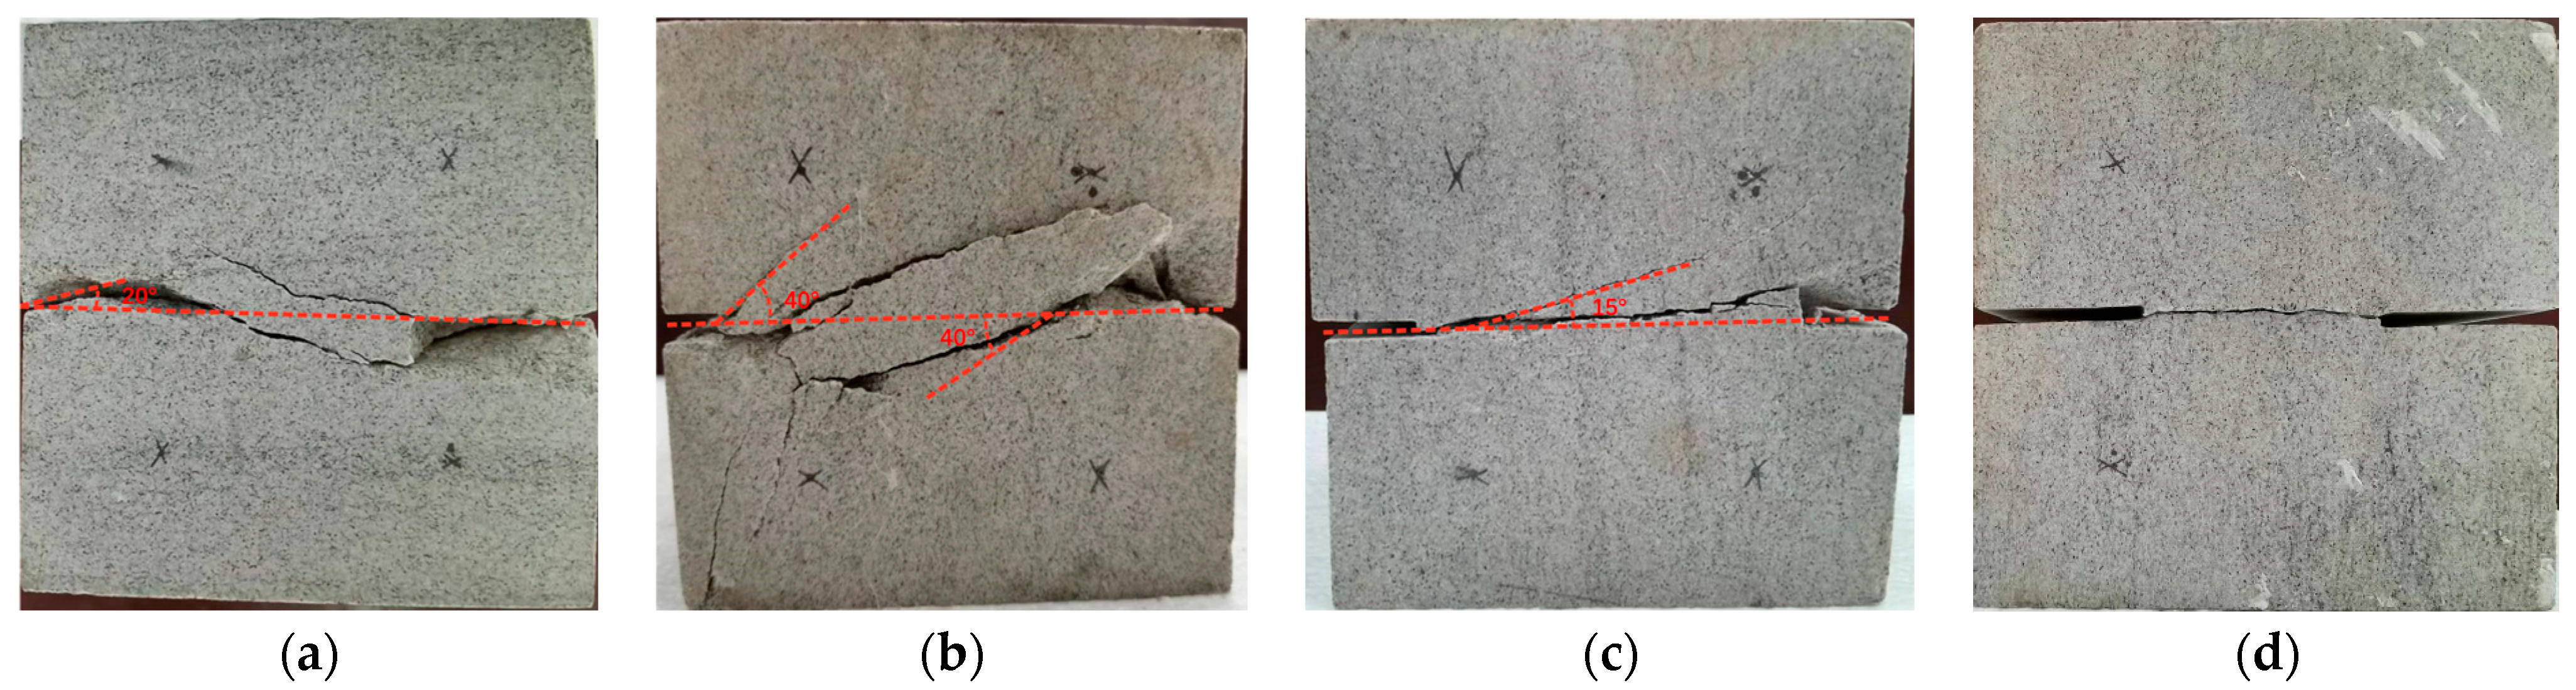
When the normal stress and the number of FTCs remain the same, taking a normal load of 2 MPa and the number of FTCs of 20 as examples, the influence of JP values of 0, 20%, 40%, and 60% on the discontinuously jointed rock in the shear failure test is shown in Figure 18.
According to Figure 18a, tensile cracks appeared in the intact rock mass during the shearing process of the specimen. This indicates that the rock underwent tensile failure under shear force, while shear failure occurred along the joint surface. The tensile cracks along the failure surface were large, resulting in substantial debris and a large damaged area in the specimen. Observation of the specimen showed that a tension crack formed at an angle of approximately 20° with respect to the shear plane, further confirming that the rock was subjected mainly to tension failure.
According to Figure 18b, the discontinuously jointed rock mass with a JP of 20% experienced shear failure between the joint planes during the shearing process. Moreover, tensile cracks formed at an angle of approximately 40° between the tensile cracks and the shear surface, and the tensile cracks along the failure surface were obvious. Considerable debris was generated due to damage, resulting in extensive damage to the specimen. However, tensile failure is not the main form of failure, and rock specimens eventually undergo shear failure along the joint plane.
As shown in Figure 18c, the discontinuously jointed rock mass with a JP of 40% underwent shear failure along the joint surface during the shearing process. Tension cracks appeared at an angle of approximately 20° between the tension cracks and the shear surface. During the direct shear test, the tensile cracks along the failure surface were relatively small, and a small amount of debris was generated due to failure. The damaged area of the specimen was relatively small.
Figure 18d shows that no new tensile cracks formed during the direct shear process of the discontinuously jointed rock mass with a JP of 60%, but shear failure occurred. The failure surface was flush with the two joint surfaces, with minimal debris present, and the specimen exhibited the smallest damage area. This indicated that the joints of the rock mass had a certain degree of connectivity and strength but were damaged during the freeze–thaw cycle.
Overall, the connectivity of discontinuously jointed rock masses has a significant impact on the shear failure of the rock mass. When the JP is low, the rock mass is prone to tensile failure, with a larger failure area. When the connectivity is high, the tensile cracks in the rock mass are relatively small, and the impact of tensile failure is relatively small, with only shear failure occurring. The larger the area of the rock bridge, the more likely the failure mode is to cause shear failure of the complete specimen, the more obvious the brittle failure characteristics are, and the rougher the failure surface of the rock bridge is.
3.3.2. An Analysis of Intermittently Jointed Rock External Surface Expansion and Penetration Failure after Different Numbers of Freeze–Thaw Cycles
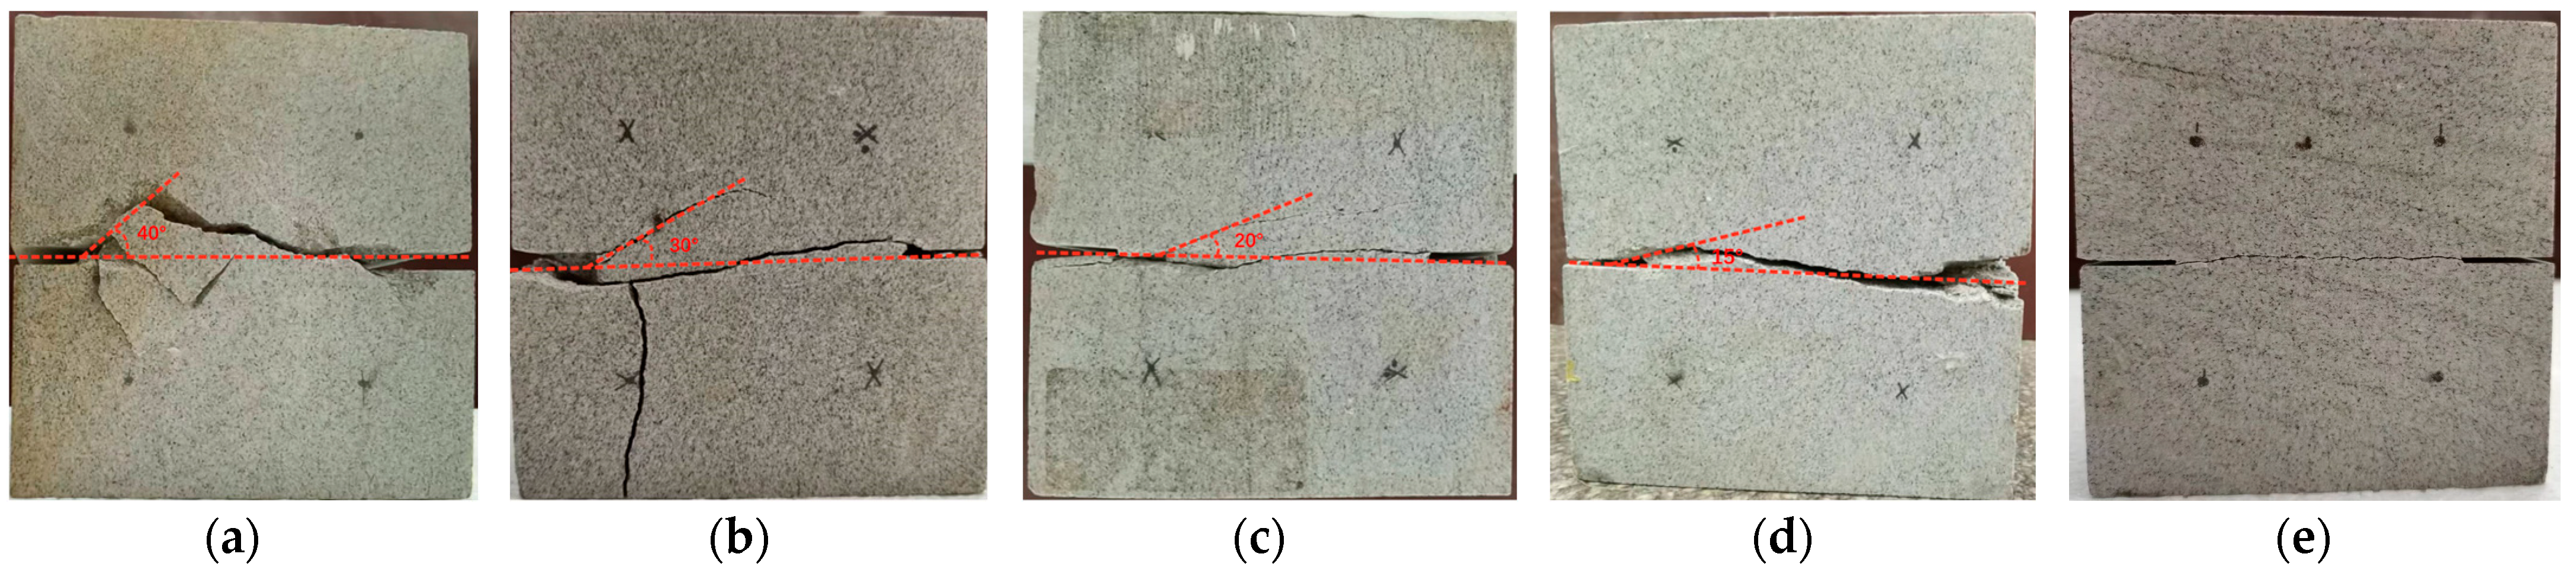
Figure 19 shows the macroscopic crack propagation angle during the shear test of rock masses with a joint JP of 40% after different numbers of FTCs. Figure 19 shows that during the direct shear process, new tensile cracks first appeared at the end of the initial joint, leading to shear failure of the rock bridge. Under the same normal stress conditions, for the sample that underwent zero FTCs, the crack initiation angle was approximately 40° (Figure 19a). For the sample with 10 FTCs, the crack initiation angle was approximately 30° (Figure 19b). After 20 FTCs, the crack initiation angle was approximately 20° (Figure 19c). After 30 cycles, the crack initiation angle was approximately 15° (Figure 19d). After 40 cycles, the crack initiation angle approached 0° (Figure 19e).
As the number of FTCs increases, the angle of rock mass initiation and propagation gradually decreases, indicating that freeze–thaw cycling can change the angle of rock mass initiation and propagation. This is because under the action of FTCs, the frost heave force generated by the internal water–ice phase transformation in the rock mass damages the organizational structure, and the internal cohesion and internal friction angle continuously decrease, resulting in a gradual increase in the plasticity of the rock mass. As the number of FTCs increases, the damage and failure of the rock mass structure intensify, and the propagation direction of macroscopic cracks tends to approach the horizontal shear direction, resulting in an increasingly smaller angle of macroscopic crack initiation.
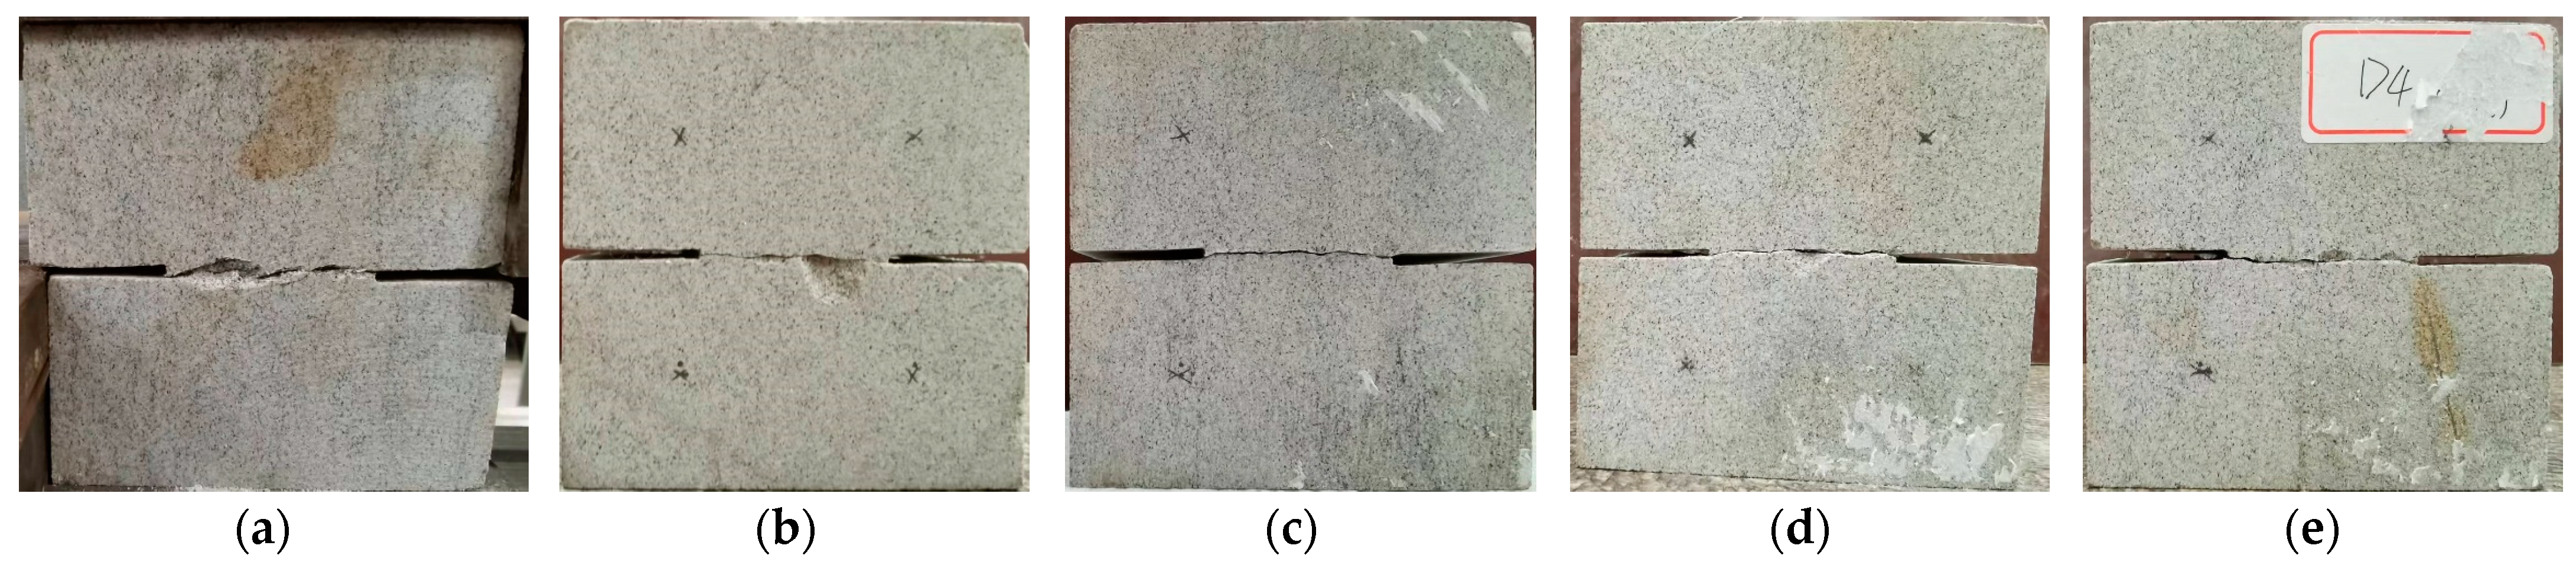
Figure 20 shows the shear fracture failure diagram of a rock mass with a JP of 60% after different numbers of FTCs. The rock bridges in the rock mass test blocks all formed planar shear cracks, and there were no wing-shaped cracks. As the number of FTCs increased, the surface of the rock specimen underwent significant changes, and the failure surface became rough. The main reason for this phenomenon is particle separation and precipitation caused by water–ice phase changes during freeze–thaw cycling. The more FTCs there were, the more significant the changes in the specimen. When the number of FTCs reached 30, blocky shedding occurred at the edges and corners of the specimen, as shown in Figure 20d. When the number of FTCs reached 40, macroscopic cracks could even appear, as shown in Figure 20e.
3.3.3. An Analysis of Intermittently Jointed Rock External Surface Expansion and Penetration Failure under Different Normal Stresses
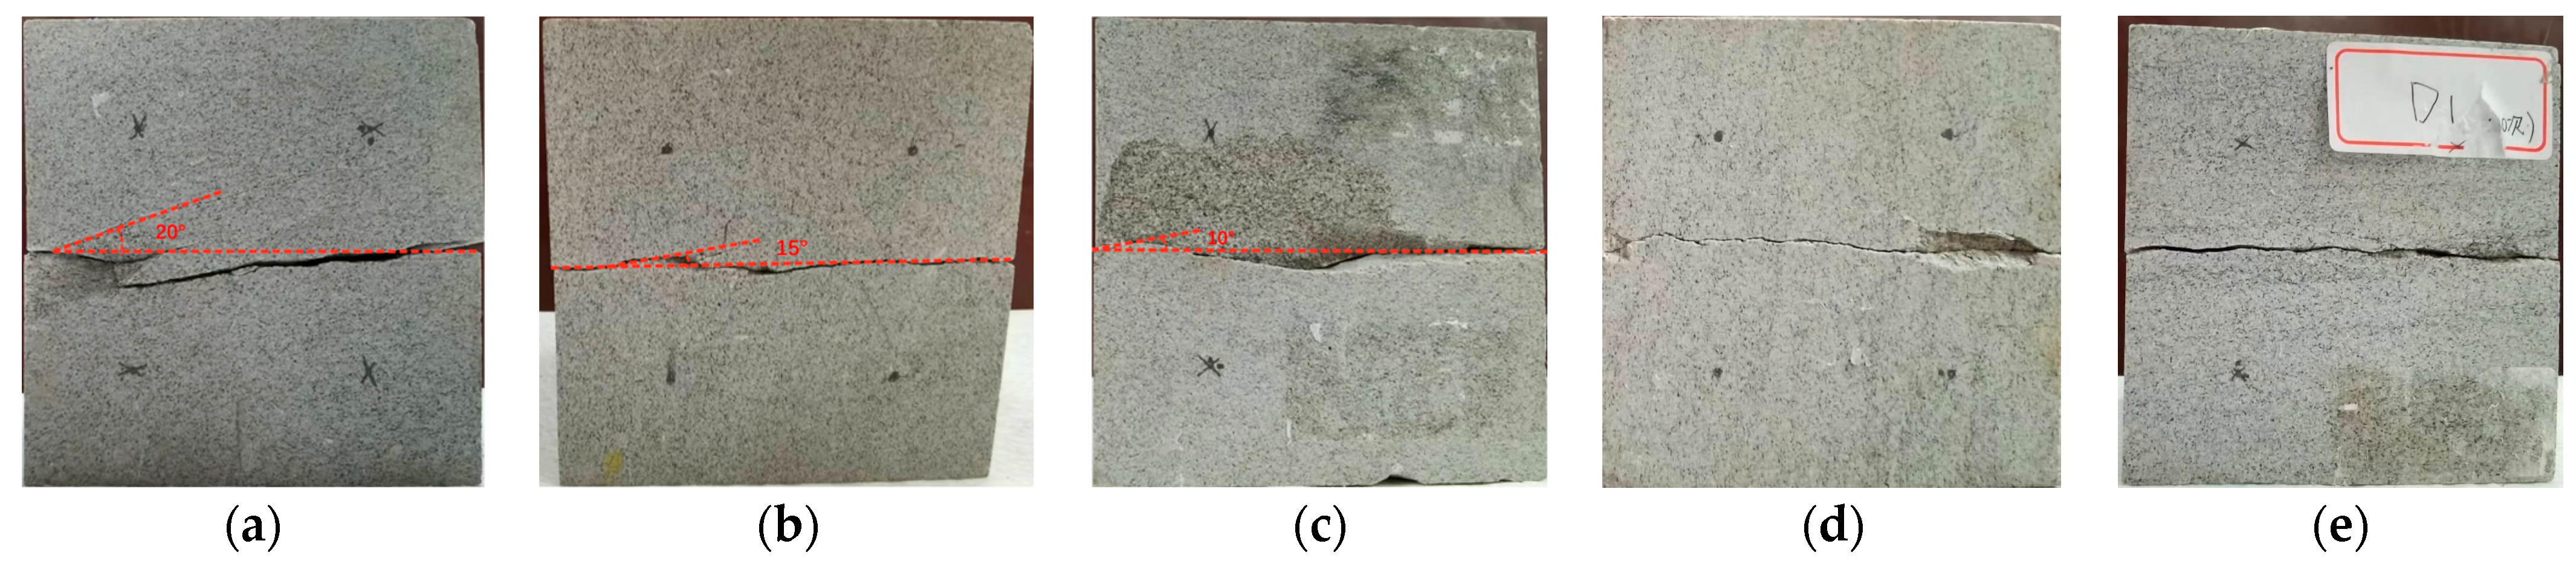
When the joint connectivity and FTCs of the rock mass are constant, taking a joint connectivity of 40% (FTC=20) as examples, the influence of normal stresses of 1 MPa, 2 MPa, 4 MPa, 6 MPa, and 8 MPa on the failure of the rock mass was studied, as shown in Figure 21.
Figure 21 shows that the rock underwent shear failure during the direct shear process, but tensile cracks also occurred. Under a normal stress of 1.0 MPa, new tensile cracks initiated, forming an angle of approximately 20° with respect to the original joint (Figure 21a). Under a normal stress of 2.0 MPa, new tensile cracks initiated, forming an angle of approximately 15° with respect to the original joint (Figure 21b). Under a normal stress of 4.0 MPa, new tensile cracks initiated, forming an angle of approximately 10° with respect to the original joint (Figure 21c). Under a normal stress of 6.0 MPa, the rock specimen underwent direct shear failure without the generation of new tensile cracks (Figure 21d). Under a normal stress of 8.0 MPa, the rock specimen experienced shear failure only, without the generation of new tensile cracks, and the failure surface was relatively flat (Figure 21e).
3.4. A Roughness Analysis of the Shear Fracture Surfaces
To further investigate the characteristics of the shear failure surfaces, 3D laser scanning was performed on the fracture surfaces of the specimens after shearing. In this study, an HSCAN300 handheld 3D laser scanner (Figure 22) with a resolution of 0.1 mm, an accuracy of 0.5 mm, and a depth of field of 300 mm was used. The position of measurement points was determined through visual markers, and the operation process was flexible and convenient.
There are many joints or fractures in rock in cold regions, and the fracture characteristics of fractured rock masses are highly important for engineering stability [32,33,34]. However, there is little research on the degradation of rock fracture toughness and changes in fracture morphology, especially the characteristics of planar shear fractures, after freeze–thaw cycling treatment. The impact of FTCs on the degradation of rock fracture toughness and shear characteristics is not fully understood. Fracture toughness is an important indicator of the resistance of rocks to cracking and plays an important role in various rock engineering applications. The stress and vertical displacement of each specimen were recorded under compression and shear loads until complete failure. The boundary stress characteristics of jointed rock specimens during compression shear loading are shown in Figure 23.
The experimental results indicate that as the freeze–thaw cycling progressed, the shear section of the specimens exhibited varying degrees of wear. With more FTCs, the wear situation became more obvious, and the fracture cross-section became rougher. The freeze–thaw cycling led to changes in the structure of the rock mass and degradation of fracture toughness. During the loading process, a crack initiated along the tip of the prefabricated crack gradually expanded and ultimately formed a throughgoing fracture zone. Changes in the microstructure of the sample rock bridge inevitably affect the propagation path of cracks, and there should be certain differences in the morphology of the final fracture surfaces of the samples after failure. To study the changes in the fracture morphology of the samples after freeze–thaw cycling, a 3D laser scanner was used to scan and reconstruct the shear failure section.
First, a handheld 3D laser scanner was used to scan the 3D morphology of the fracture surfaces of each specimen. The scanning accuracy was controlled at a sampling interval of 0.5 mm, and the 3D cross-section was reconstructed. The coordinates (x, y, z) of the fracture surface were extracted and projected onto the xoy plane. The projection plane can be divided into a series of squares with a side length of . The four vertices corresponding to any square on the xoy plane and four points on the crack plane can be obtained, and the height between the four points can be directly calculated through the Z coordinate: , , , and . Finally, cubes with a side length of can be used to enclose the fracture surface [35] (Equation (8)).
where is an integral function, and the number of cubes needed to cover the fracture surface can be expressed as Equation (9):
The different scales of correspond to different values of , and the relationship between and the side length can be expressed as Equation (10):
is the fractal dimension of the fracture surface in this study. After logarithmic transformation, the linear relationship between and was obtained. The formula for calculating the surface fractal dimension in the box number method is shown in Equation (11):
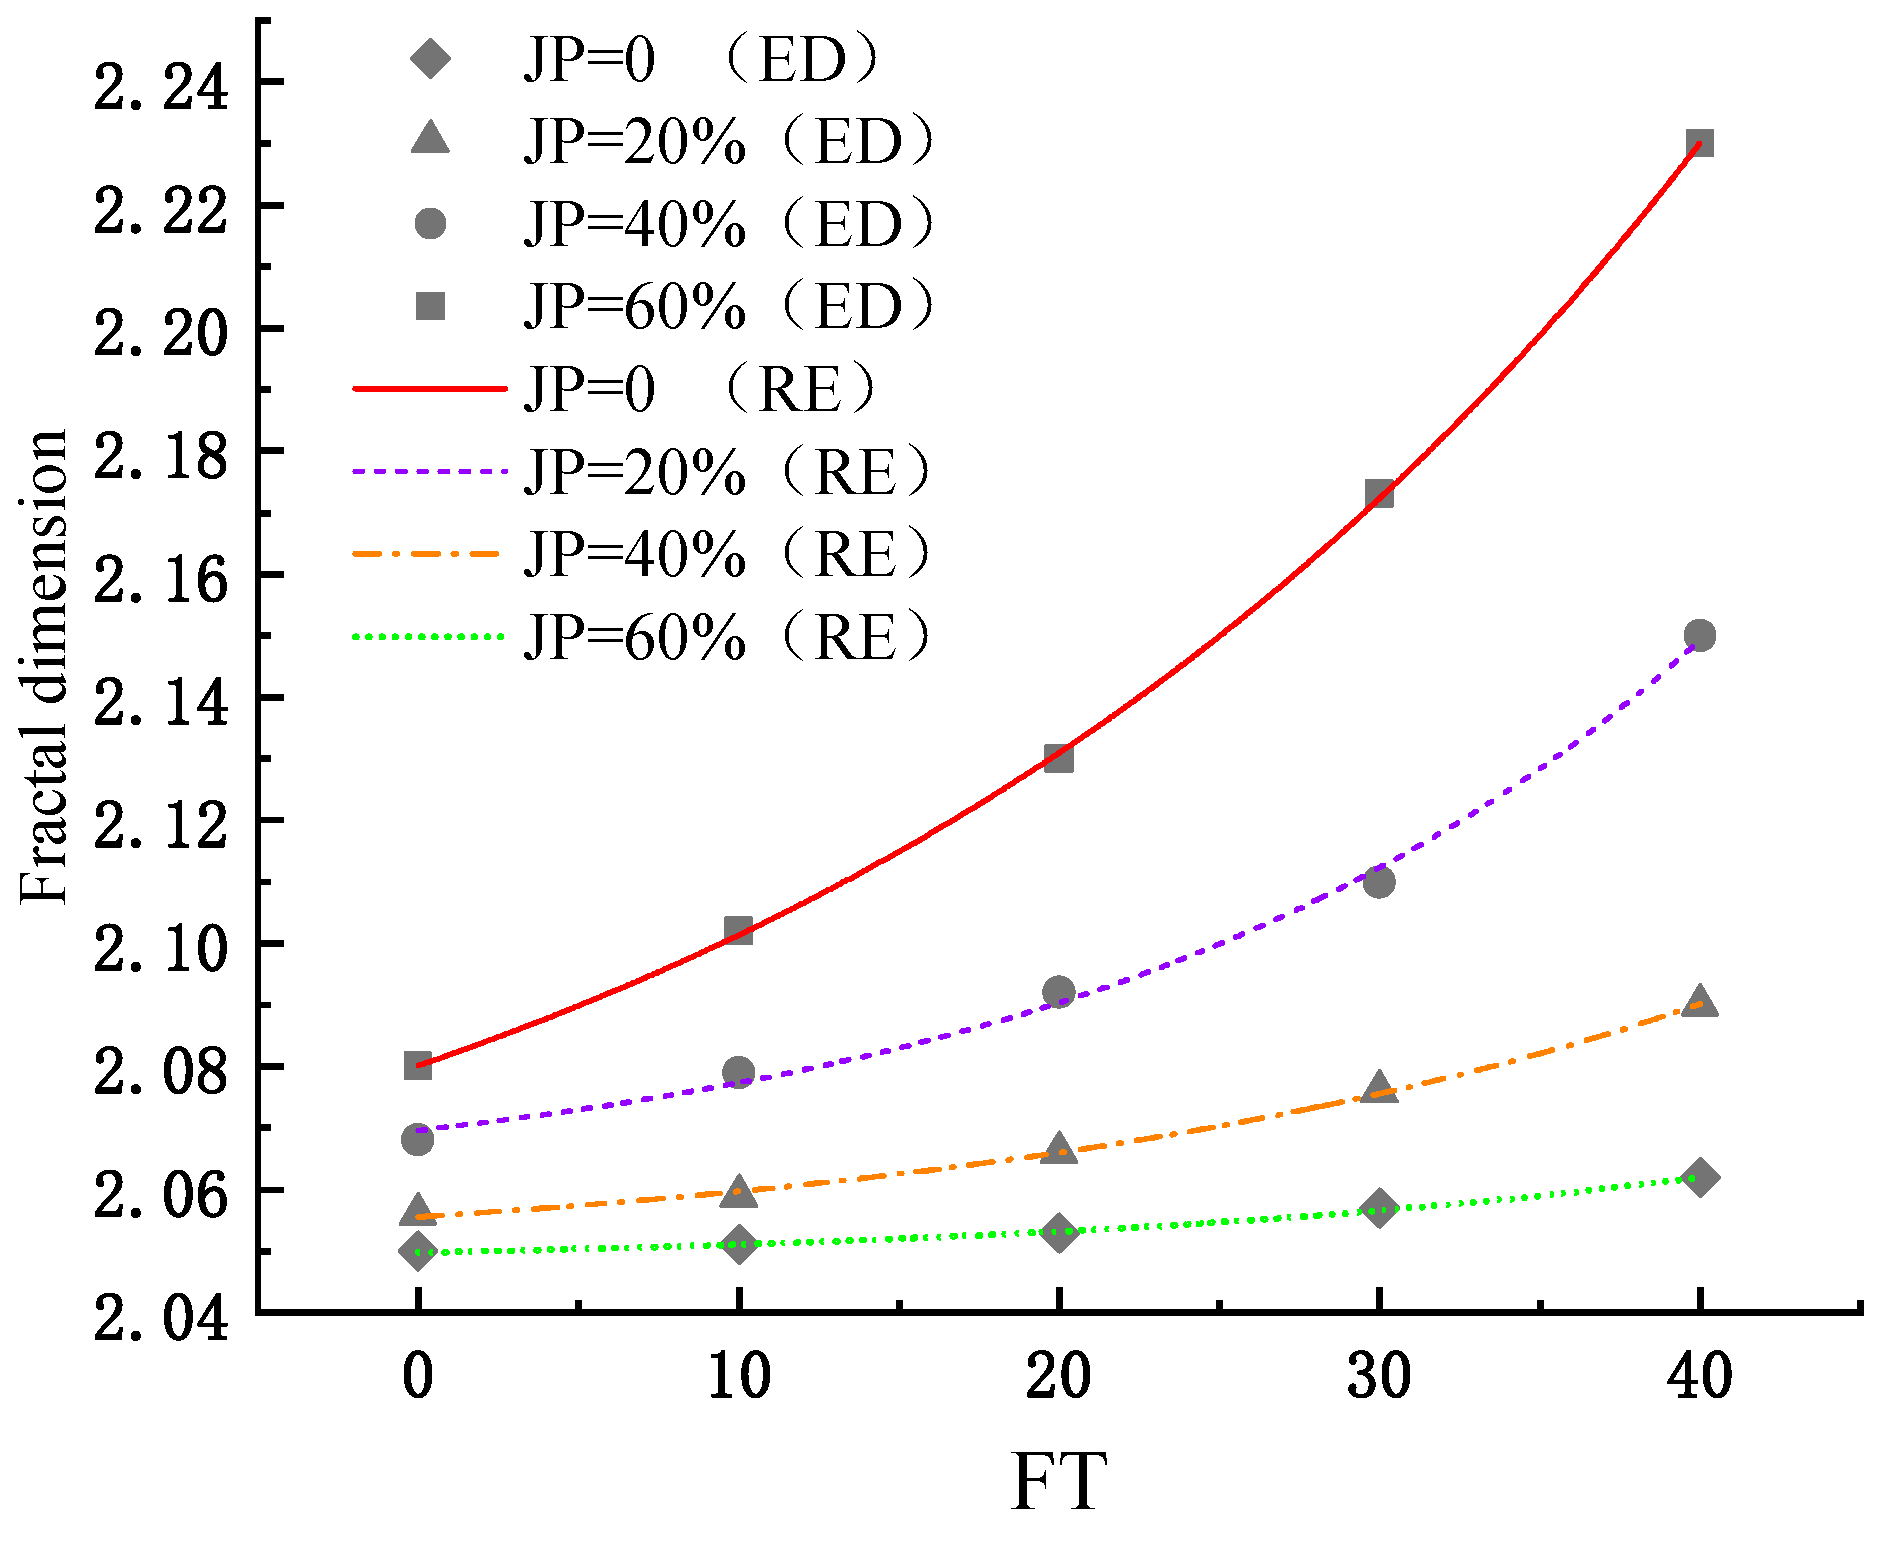
The fractal dimension values of the specimen fractures after different numbers of FTCs are shown in Figure 24. As the number of cycles increases, the fractal dimension of the fracture surface shows a significantly increasing trend. The experimental results indicate that the more FTCs there are, the rougher the fracture surface is, which is consistent with existing research results [36]. As mentioned earlier, the microstructure of the rock bridge affects the crack propagation path and the final fracture morphology of the specimen. This is because during more FTCs, some mineral particles separate from the main structure of the rock, resulting in a rougher crack surface.
In Figure 24, ED represents the experimental data, and RE represents the regression equation.
4. Discussion
The mechanism of freeze–thaw damage is highly important in freeze–thaw research [37]. In this study, a constitutive model for rock damage under freeze–thaw cycling and loading was derived and studied.
The intact rock elastic modulus is used as a benchmark to describe the freeze–thaw damage of rocks as follows:
According to Lemaitre’s strain equivalence assumption [38,39], the most primitive damage state of the rock mass was also used as the benchmark. Rock masses that have undergone long-term FTCs and are subjected to loads are considered to correspond to the first damage state, while those that have undergone FTCs are considered to correspond to the second damage state. Using the generalized strain equivalence principle, the following can be obtained:
—the initial effective stress;
—the initial effective bearing area;
—the effective stress after freeze–thaw cycles;
—the effective bearing area after freeze–thaw cycling.
Combining Equations (14) and (15) yields:
The principle of strain equivalence is described as follows:
The relationship between the elastic moduli in the two states is described as follows:
By combining Equations (16) and (17), the constitutive relationships of the two damage states can be obtained as follows:
The principle of strain equivalence was once again applied to specimens that have undergone FTCs (the first damage state) and those that have been subjected to loads after FTCs (the second damage state). Therefore, the constitutive relationship between these two damage states can be expressed as follows:
From Equations (18) and (20), it can be inferred that the stress–strain relationship of the loaded rock mass after multiple FTCs is
—the total damage variable after freeze–thaw/load coupling.
Equation (22) indicates that under the conditions of both freeze–thaw cycling and loading, the rock damage further intensifies, exhibiting nonlinearity. The damage caused by the two conditions is coupled, and the coupling term is represented by . The coupling effect weakens the total damage and ultimately changes the mechanical properties of the rock.
The total damage variable of rocks under freeze–thaw cycling and loading can be obtained from Equations (12), (13) and (22):
Equation (16) can be substituted into Equation (21) to derive the damage constitutive relationship of loaded rocks under a freeze–thaw environment:
5. Conclusions
In this study, intact sandstone and prefabricated jointed sandstone specimens were taken as the research objects, and indoor freeze–thaw tests, uniaxial compression tests, direct shear tests, and Brazilian splitting tests were conducted. The shear strength changes and surface crack propagation characteristics of the rock were obtained after freeze–thaw cycle treatments. Based on the indoor test results, a damage constitutive model was used for the analysis of rock mass damage weakening. The research results can provide a theoretical basis and support for the safety and stability of engineering in cold regions. The work carried out in this research and the main conclusions obtained are summarized as follows:
- As the number of FTCs increases, the dry mass of the rock specimens shows a continuous decreasing trend. The saturated mass first increases and then decreases, and there is a slight decrease after 30 FTCs. The shear stress–horizontal displacement curve shows a three-stage deformation process: the initial compaction deformation stage, the midterm linear elastic deformation stage, and the final yield deformation stage;
- The number of FTCs has a smaller impact on the shear strength of jointed specimens with lower connectivity, but it has a greater impact on jointed specimens with higher connectivity. The results of 3D laser scanning inspection indicate that the more FTCs there are, the greater the fractal dimension, and the rougher the fracture surface;
- Based on the statistical damage theory and the nonuniformity within natural rock masses, the damage evolution of rock masses was studied, and a damage evolution constitutive equation was established to characterize the damage weakening mechanism of jointed rock masses under shear loading and freeze–thaw cycling. These research results can provide reliable references for projects with similar geological conditions. In the next step of our research, the results of this study will be compared to practice. In addition, further analysis will be conducted on the mechanical characteristics of rock masses under other conditions.
Author Contributions
Y.-G.Z.: Conceptualization, Supervision, Writing—review and editing, Writing—original draft. Y.W.: Supervision, Software, Writing—review and editing, Validation. A.-Q.L.: Writing—review and editing, Validation, Data curation. S.Z.: Investigation, Writing—review and editing, Software. All authors have read and agreed to the published version of the manuscript.
Funding
This study was financially supported by the National Natural Science Foundation of China (Grant No. 51774192) and the Natural Science Foundation of Shandong Province (Grant No. ZR2022QE134).
Data Availability Statement
All the data, models, and code generated or used during the study appear in the submitted article.
Acknowledgments
The authors are thankful for the support of the Shandong Provincial Key Laboratory of Disaster Prevention and Mitigation.
Conflicts of Interest
The authors declare no conflicts of interest.
References
- Duda, R. Methods of determining rock mass freezing depth for shaft sinking in difficult hydrogeological and geotechnical conditions. Arch. Min. Sci. 2014, 59, 517–528. [Google Scholar] [CrossRef]
- Longinos, S.; Hazlett, R. Cryogenic fracturing using liquid nitrogen on granite at elevated temperatures: A case study for enhanced geothermal systems in Kazakhstan. Int. J. Sci. Rep. 2024, 14, 160. [Google Scholar] [CrossRef] [PubMed]
- Hess, T.; Mullis, J.; Franz, L. The first petrographic characterisation of a prehistoric rock crystal mine in the Swiss Alps. Sci. Rep. 2023, 13, 23107. [Google Scholar] [CrossRef] [PubMed]
- Sanfirov, I.; Yaroslavtsev, A.; Chugaev, A.; Babkin, A.; Baibakova, T. Frozen Wall Construction Control in Mine Shafts Using Land and Borehole Seismology Techniques. J. Min. Sci. 2020, 56, 359–369. [Google Scholar] [CrossRef]
- Park, K.; Kim, K.; Lee, K.; Kim, D. Analysis of Effects of Rock Physical Properties Changes from Freeze-Thaw Weathering in Ny-Ålesund Region: Part 1-Experimental Study. Appl. Sci. 2020, 10, 1707. [Google Scholar] [CrossRef]
- Gehle, C.; Kutter, H.K. Breakage and shear behaviour of intermittent rock joints. Int. J. Rock Mech. Min. Sci. 2003, 40, 687–700. [Google Scholar] [CrossRef]
- Jafari, M.K.; Hosseini, K.A.; Pellet, F.; Boulon, M.; Buzzi, O. Evaluation of shear strength of rock joints subjected to cyclic loading. Soil Dyn. Earthq. Eng. 2003, 23, 619–630. [Google Scholar] [CrossRef]
- Atapour, H.; Moosavi, M. The influence of shearing velocity on shear behavior of artificial joints. Rock Mech. Rock Eng. 2014, 47, 1745–1761. [Google Scholar] [CrossRef]
- Bahaaddini, M. Effect of boundary condition on the shear behaviour of rock joints in the direct shear test. Rock Mech. Rock Eng. 2017, 50, 1141–1155. [Google Scholar] [CrossRef]
- Momeni, A.; Abdilor, Y.; Khanlari, G.R.; Heidari, M.; Sepahi, A.A. The effect of freeze–thaw cycles on physical and mechanical properties of granitoid hard rocks. Bull. Eng. Geol. Environ. 2016, 75, 1649–1656. [Google Scholar] [CrossRef]
- Yavuz, H. Effect of freeze–thaw and thermal shock weathering on the physical and mechanical properties of an andesite stone. Bull. Eng. Geol. Environ. 2011, 70, 187–192. [Google Scholar] [CrossRef]
- Yang, G.; Pu, Y. Preliminary study on rock damage propagation under freeze-thaw cycles. J. Coal Sci. 2002, 4, 357–360. [Google Scholar]
- Mu, J.; Pei, X.; Huang, Y.; Min, W. Experimental study on mechanical properties of freeze-thaw rock mass. J. Eng. Geol. 2013, 21, 103–108. [Google Scholar]
- Zhu, J. The revised “Code for Rock Testing of Hydraulic and Hydroelectric Engineering” (SL/T 264-2020) presided over by the Yangtze River Academy of Sciences has been promulgated and implemented. J. Yangtze River Acad. Sci. 2020, 37, 2. [Google Scholar]
- Liu, H.; Niu, F.; Xu, Z.; Lin, Z.; Xu, J. Experimental study on the physical and mechanical properties of andesite and granite under cyclic freeze-thaw conditions. Glacier Permafr. 2011, 33, 557–563. [Google Scholar]
- Zhou, K.; Xu, Y.; Li, J.; Zhang, Y. Experimental study on the influence of freeze-thaw cycles on the physical properties of weathered granite. J. Coal Sci. 2012, 37 (Suppl. S1), 70–74. [Google Scholar] [CrossRef]
- Zhang, H.; Yang, G. The influence of moisture and freeze-thaw cycles on the physical and mechanical properties of red sandstone. Exp. Mech. 2013, 28, 635–641. [Google Scholar]
- Zhang, H.; Yang, G. Experimental study on the influence of moisture and freeze-thaw effects on the mechanical properties of shale. J. Wuhan Univ. Technol. 2014, 36, 95–99. [Google Scholar]
- Lu, Y.; Li, X.; Xiao, J. Experimental analysis of freeze-thaw mechanical properties of single fractured rock mass. J. Undergr. Space Eng. 2014, 10, 593–598+649. [Google Scholar]
- Liu, H.; Liu, Y.; Xing, C.; Zhang, L.; Ma, M. Experimental study on damage and failure of jointed rock masses under cyclic freeze-thaw conditions. Geotech. Mech. 2014, 35, 1547–1554. [Google Scholar] [CrossRef]
- Wen, L.; Li, X.; Yin, Y.; Gao, L. Comparative analysis and application research on the physical and mechanical properties of granite porphyry and limestone under freeze-thaw cycles. Glacier Permafr. 2014, 36, 632–639. [Google Scholar]
- Fang, Y.; Qiao, L.; Chen, X.; Yan, S.; Zhai, G.; Liang, Y. Research on cyclic freeze-thaw tests of sandstone in Yungang Grottoes. Geotech. Mech. 2014, 35, 2433–2442. [Google Scholar] [CrossRef]
- Chen, Y.; Wang, P.; Zhang, X.; Du, X. Experimental study on the mechanical properties of granite after chemical dissolution and freeze-thaw cycles. J. Geotech. Eng. 2014, 36, 2226–2235. [Google Scholar]
- Anderson, R. Assessment of Timbercrete for Freeze/Thaw Durability by Testing to ASTM C1262-05a. Timbercrete Rotorua Ltd.: Rotorua, New Zealand, 2006. [Google Scholar]
- ASTM D 5312-04; 2004 Standard Test Method for Evaluation of Durability of Rock for Erosion Control under Freezing and Thawing Conditions. ASTM Standards: West Conshohocken, PA, USA, 2004.
- Park, J.; Hyun, C.U.; Park, H.D. Changes in microstructure and physical properties of rocks caused by artificial freeze–thaw action. Bull. Eng. Geol. Environ. 2015, 74, 555–565. [Google Scholar] [CrossRef]
- Bayram, F. Predicting mechanical strength loss of natural stones after freeze–thaw in cold regions. Cold Reg. Sci. Technol. 2012, 83–84, 98–102. [Google Scholar] [CrossRef]
- Ghobadi, M.H.; Babazadeh, R. Experimental studies on the effects of cyclic freezing–thawing, salt crystallization, and thermal shock on the physical and mechanical characteristics of selected sandstones. Rock Mech. Rock Eng. 2015, 48, 1001–1016. [Google Scholar] [CrossRef]
- Freire-Lista, D.M.; Fort, R.; Varas-Muriel, M.J. Freeze–thaw fracturing in building granites. Cold Reg. Sci. Technol. 2015, 113, 40–51. [Google Scholar] [CrossRef]
- Ministry of Housing and Urban Rural Development of the People’s Republic of China. GB/T50266-2013Engineering Rock Mass Test Method Standard; China Planning Press, Institute of Standards and Quotas of the Ministry of Housing and Urban Rural Development of the People’s Republic of China: Beijing, China, 2013.
- Li, J. Research on the Instability Mechanism and Protective Measures of Dolomite Slopes under Freeze-Thaw Cycles. Master’s Thesis, Shijiazhuang Railway University, Shijiazhuang, China, 2020. [Google Scholar]
- Lin, H.; Yang, H.; Wang, Y.; Zhao, Y.; Cao, R. Determination of the stress field and crack initiation angle of an open flaw tip under uniaxial compression. Theor. Appl. Fract. Mech. 2019, 104, 102358. [Google Scholar] [CrossRef]
- Liu, Y.; Dai, F.; Feng, P.; Xu, N.W. Mechanical behavior of intermittent jointed rocks under random cyclic compression with different loading parameters. Soil Dyn. Earthq. Eng. 2018, 113, 12–24. [Google Scholar] [CrossRef]
- Cao, R.H.; Cao, P.; Lin, H.; Pu, C.Z.; Ou, K. Mechanical behavior of brittle rock-like specimens with pre-existing fissures under uniaxial loading: Experimental studies and particle mechanics approach. Rock Mech. Rock Eng. 2016, 49, 763–783. [Google Scholar] [CrossRef]
- Cao, R.H.; Wang, C.; Hu, T.; Yao, R.; Li, T.; Lin, Q. Experimental investigation of plane shear fracture characteristics of sandstone after cyclic freeze–thaw treatments. Theor. Appl. Fract. Mech. 2022, 118, 103214. [Google Scholar] [CrossRef]
- Xu, X.; Zhang, Y.; Fu, Y.; Lei, D.; Zou, X. Shear failure characteristics of jointed rock specimens under freeze-thaw cycles. J. Jilin Univ. (Earth Sci. Ed.) 2021, 51, 483–494. [Google Scholar] [CrossRef]
- Bozonnet, C.; Saudreau, M.; Badel, E.; Améglio, T.; Charrier, G. Freeze dehydration vs. supercooling in tree stems: Physical and physiological modelling. Tree Physiol. 2023, 44, tpad117. [Google Scholar] [CrossRef] [PubMed]
- Li, X.; Lu, Y.; Wang, Y. Research on damage model of single fractured rock mass under freeze-thaw load coupling effect. J. Rock Mech. Eng. 2013, 32, 2307–2315. [Google Scholar]
- Zhang, H.; Lei, L.; Yang, G. Rock damage model under temperature and load effects. J. Rock Mech. Eng. 2014, 33 (Suppl. S2), 3391–3396. [Google Scholar] [CrossRef]
Figure 1.
Rock specimens.

Figure 2.
Electric blast drying oven.

Figure 3.
Freeze–thaw tester.

Figure 4.
Triaxial testing machine.

Figure 5.
Brazilian splitting and uniaxial compression experimental setups.

Figure 6.
Rock shear seepage meter.

Figure 7.
Rock mass specimens after different numbers of freeze–thaw cycles.

Figure 8.
Shear loading.

Figure 9.
Uniaxial compressive strength.

Figure 10.
Freeze–thaw coefficient.

Figure 11.
Elastic modulus.

Figure 12.
Study with different numbers of FTCs (DR represents dry mass, and SA represents saturated mass).
Figure 12.
Study with different numbers of FTCs (DR represents dry mass, and SA represents saturated mass).

Figure 13.
Diagram of the influence of normal stress on shear strength.

Figure 14.
Shear strength regression equation curve.

Figure 15.
Shear stress–displacement curves of freeze–thaw samples with different joint connectivities. (a) Freeze–thaw cycles = 0; (b) freeze–thaw cycles = 10; (c) freeze–thaw cycles = 20; (d) freeze–thaw cycles = 30; (e) freeze–thaw cycles = 40.
Figure 15.
Shear stress–displacement curves of freeze–thaw samples with different joint connectivities. (a) Freeze–thaw cycles = 0; (b) freeze–thaw cycles = 10; (c) freeze–thaw cycles = 20; (d) freeze–thaw cycles = 30; (e) freeze–thaw cycles = 40.

Figure 16.
Shear stress–horizontal displacement curves of jointed rock masses after different numbers of FTCs. (a) JP = 0%; (b) JP = 20%; (c) JP = 40%; and (d) JP = 60%.
Figure 16.
Shear stress–horizontal displacement curves of jointed rock masses after different numbers of FTCs. (a) JP = 0%; (b) JP = 20%; (c) JP = 40%; and (d) JP = 60%.


Figure 17.
Shear strength and horizontal displacement diagram.

Figure 18.
Shear effect of freeze–thaw rock masses with different connectivity conditions. (a) JP = 0; (b) JP = 20%; (c) JP = 40%; and (d) JP = 60%.
Figure 18.
Shear effect of freeze–thaw rock masses with different connectivity conditions. (a) JP = 0; (b) JP = 20%; (c) JP = 40%; and (d) JP = 60%.

Figure 19.
Shear effects of the jointed rock masses with a JP of 40% after different numbers of FTCs. (a) FTC = 0; (b) FTC = 10; (c) FTC = 20; (d) FTC = 30; and (e) FTC = 40.
Figure 19.
Shear effects of the jointed rock masses with a JP of 40% after different numbers of FTCs. (a) FTC = 0; (b) FTC = 10; (c) FTC = 20; (d) FTC = 30; and (e) FTC = 40.

Figure 20.
Shear effects of the jointed rock masses with a JP of 60% after different numbers of FTCs. (a) FTC = 0; (b) FTC = 10; (c) FTC = 20; (d) FTC = 30; and (e) FTC = 40.
Figure 20.
Shear effects of the jointed rock masses with a JP of 60% after different numbers of FTCs. (a) FTC = 0; (b) FTC = 10; (c) FTC = 20; (d) FTC = 30; and (e) FTC = 40.

Figure 21.
Shear effects of the rock masses under different normal stress conditions. (a) Normal stress= 1 MPa; (b) normal stress = 2 MPa; (c) normal stress = 4 MPa; (d) normal stress = 6 MPa; and (e) normal stress = 8 MPa.
Figure 21.
Shear effects of the rock masses under different normal stress conditions. (a) Normal stress= 1 MPa; (b) normal stress = 2 MPa; (c) normal stress = 4 MPa; (d) normal stress = 6 MPa; and (e) normal stress = 8 MPa.

Figure 22.
Handheld 3D laser scanner.

Figure 23.
Shear effect of the rock mass after FTCs. (a) FTCs = 0; (b) FTCs = 10; (c) FTCs = 20; (d) FTCs = 30; and (e) FTCs = 40.
Figure 23.
Shear effect of the rock mass after FTCs. (a) FTCs = 0; (b) FTCs = 10; (c) FTCs = 20; (d) FTCs = 30; and (e) FTCs = 40.

Figure 24.
Changes in the fractal dimension of the shear failure surface of specimens with different JP values with increasing number of FTCs.
Figure 24.
Changes in the fractal dimension of the shear failure surface of specimens with different JP values with increasing number of FTCs.


Table 1.
Summary of rock freeze–thaw cycle experimental schemes by domestic and foreign scholars.
| Researcher(s) | Freezing Temperature/℃ | Freezing Time/h | Melting Temperature/℃ | Melting Time/h | Number of Cycles/Time | Rock Used |
|---|---|---|---|---|---|---|
| Yang [12] | −20 | 12 | 20 | 12 | 20 | Sandstone, shale, coal |
| Liu [15] | −20 | 14 | 20 | 10 | 30 | Granite, andesite |
| Zhou [16] | −40 | 4 | 20 | 4 | 30 | Granite |
| Mu [13] | −30 | 4 | Ordinary temperature | 4 | 50 | Granite, sandstone, phyllite |
| Zhang [17,18] | −20 | 6 | 20 | 6 | 60/100 | Red sandstone, shale |
| Lu [19] | −40 | 6 | 40 | 6 | 60 | Rock-like material |
| Liu [20] | −20 | 12 | 20 | 12 | 100 | Rock-like material |
| Wen [21] | −20 | 12 | 20 | 12 | 30 | Granite, limestone |
| Fang [22] | −30 | 12 | Ordinary temperature | 12 | 35 | Sandstone |
| Chen [23] | −15 | 4 | 20 | 4 | 100 | Granite |
| Anderson [24,25] | −18 | 1.5 | 24 | 1.5 | 25 | Rock-like material |
| Park et al. [26] | −20 | 4 | 10 | 4 | 50 | Diorite, basalt, tuff |
| Bayram [27] | −20 | 2 | 20 | 2 | 25 | Marble |
| Khanlari [8] | −20 | 15 | 20 | 9 | 30 | Sandstone |
| Ghobadi and Babazadeh [28] | −20 | 12 | 20 | 6 | 60 | Sandstone |
| Freire-Lista et al. [29] | −12 | 6 | 20 | 6 | 280 | Granite |
Table 2.
Freeze–thaw experimental scheme design.
| Maximum FTC/Time | Minimum Temperature/°C | Freeze Duration/h | Minimum Temperature/°C | Melting Duration/h |
|---|---|---|---|---|
| 40 | −20 | 4 | 20 | 4 |
Table 3.
Shear experimental design scheme.
| Experimental Category | Sample Number | Rock Bridge Size/mm | Normal Load/kN | Normal Stress/MPa | Number of FTC/Time |
|---|---|---|---|---|---|
 | A1 | 100 × 100 | 20 | 2 | 0 |
| B1 | 100 × 100 | 20 | 2 | 10 | |
| C1 | 100 × 100 | 20 | 2 | 20 | |
| D1 | 100 × 100 | 20 | 2 | 30 | |
| E1 | 100 × 100 | 20 | 2 | 40 | |
 | A2 | 100 × 80 | 16 | 2 | 0 |
| B2 | 100 × 80 | 16 | 2 | 10 | |
| C2 | 100 × 80 | 16 | 2 | 20 | |
| D2 | 100 × 80 | 16 | 2 | 30 | |
| E2 | 100 × 80 | 16 | 2 | 40 | |
 | A3 | 100 × 60 | 12 | 2 | 0 |
| B3 | 100 × 60 | 12 | 2 | 10 | |
| C3 | 100 × 60 | 12 | 2 | 20 | |
| D3 | 100 × 60 | 12 | 2 | 30 | |
| E3 | 100 × 60 | 12 | 2 | 40 | |
 | A4 | 100 × 40 | 8 | 2 | 0 |
| B4 | 100 × 40 | 8 | 2 | 10 | |
| C4 | 100 × 40 | 8 | 2 | 20 | |
| D4 | 10 × 40 | 8 | 2 | 30 | |
| E4 | 10 × 40 | 8 | 2 | 40 | |
 | F1 | 100 × 60 | 6 | 1 | 40 |
| F2 | 100 × 60 | 12 | 2 | 40 | |
| F3 | 100 × 60 | 24 | 4 | 40 | |
| F4 | 100 × 60 | 36 | 6 | 40 | |
| F5 | 100 × 60 | 48 | 8 | 40 |
Table 4.
Changes in rock mass after freeze–thaw cycling.
| FTCs | JP = 0 | JP = 20% | JP = 40% | JP = 60% | ||||
|---|---|---|---|---|---|---|---|---|
| Dry Mass (g) | Saturated Mass (g) | Dry Mass (g) | Saturated Mass (g) | Dry Mass (g) | Saturated Mass (g) | Dry Mass (g) | Saturated Mass (g) | |
| 0 | 2578.35 | 2591.27 | 2566.41 | 2584.31 | 2559.12 | 2570.53 | 2547.38 | 2557.03 |
| 10 | 2577.33 | 2591.58 | 2564.59 | 2585.09 | 2557.07 | 2571.14 | 2546.71 | 2558.78 |
| 20 | 2575.11 | 2592.79 | 2563.63 | 2586.94 | 2555.21 | 2572.87 | 2545.62 | 2559.32 |
| 30 | 2572.24 | 2594.63 | 2561.24 | 2587.45 | 2552.52 | 2573.49 | 2543.44 | 2560.12 |
| 40 | 2568.35 | 2593.17 | 2558.33 | 2587.62 | 2548.47 | 2573.77 | 2540.23 | 2559.93 |
Disclaimer/Publisher’s Note: The statements, opinions and data contained in all publications are solely those of the individual author(s) and contributor(s) and not of MDPI and/or the editor(s). MDPI and/or the editor(s) disclaim responsibility for any injury to people or property resulting from any ideas, methods, instructions or products referred to in the content. |
© 2024 by the authors. Licensee MDPI, Basel, Switzerland. This article is an open access article distributed under the terms and conditions of the Creative Commons Attribution (CC BY) license (https://creativecommons.org/licenses/by/4.0/).
Share and Cite
MDPI and ACS Style
Zhu, Y.-G.; Wu, Y.; Li, A.-Q.; Zhang, S. Research on Mechanical Properties of Rock Mass with Tiny Cracks under FTCs Conditions. Symmetry 2024, 16, 234. https://doi.org/10.3390/sym16020234
AMA Style
Zhu Y-G, Wu Y, Li A-Q, Zhang S. Research on Mechanical Properties of Rock Mass with Tiny Cracks under FTCs Conditions. Symmetry. 2024; 16(2):234. https://doi.org/10.3390/sym16020234
Chicago/Turabian StyleZhu, Yin-Ge, Yue Wu, An-Qi Li, and Shuai Zhang. 2024. "Research on Mechanical Properties of Rock Mass with Tiny Cracks under FTCs Conditions" Symmetry 16, no. 2: 234. https://doi.org/10.3390/sym16020234
Note that from the first issue of 2016, this journal uses article numbers instead of page numbers. See further details here.