

A Symmetrical Approach to Brain Tumor Segmentation in MRI Using Deep Learning and Threefold Attention Mechanism

School of Computer, Huanggang Normal University, Huanggang 438000, China
*
Author to whom correspondence should be addressed.
Symmetry 2023, 15(10), 1912; https://doi.org/10.3390/sym15101912
Submission received: 14 September 2023
/
Revised: 2 October 2023
/
Accepted: 9 October 2023
/
Published: 12 October 2023
(This article belongs to the Special Issue Image Processing and Symmetry: Topics and Applications)
Abstract
:The symmetrical segmentation of brain tumor images is crucial for both clinical diagnosis and computer-aided prognosis. Traditional manual methods are not only asymmetrical in terms of efficiency but also prone to errors and lengthy processing. A significant barrier to the process is the complex interplay between the deep learning network for MRI brain tumor imaging and the harmonious compound of both local and global feature information, which can throw off the balance in segmentation accuracy. Addressing this asymmetry becomes essential for precise diagnosis. In answer to this challenge, we introduce a balanced, end-to-end solution for brain tumor segmentation, incorporating modifications that mirror the U-Net architecture, ensuring a harmonious flow of information. Beginning with symmetric enhancement of the visual quality of MRI brain images, we then apply a symmetrical residual structure. By replacing the convolutional modules in both the encoder and decoder sections with deep residual modules, we establish a balance that counters the vanishing gradient problem commonly faced when the network depth increases. Following this, a symmetrical threefold attention block is integrated. This addition ensures a balanced fusion of local and global image features, fine-tuning the network to symmetrically discern and learn essential image characteristics. This harmonious integration remarkably amplifies the network’s precision in segmenting MRI brain tumors. We further validate the equilibrium achieved by our proposed model using three brain tumor segmentation datasets and four metrics and by juxtaposing our model against 21 traditional and learning-based counterparts. The results confirm that our balanced approach significantly elevates performance in the segmentation of MRI brain tumor images without an asymmetrical increase in computational time.
1. Introduction
Biomedical imaging has firmly established itself as an integral component of both disease diagnosis and subsequent treatment strategies, with its role continuously expanding [1]. One of the most pressing scientific challenges in the domain of medical imaging is harnessing the potential of artificial intelligence (AI) and deep learning methodologies. The ambition is to adeptly analyze the vast repositories of medical imaging data, ensuring that these technologies not only keep pace with the data influx but also bring transformative advancements to the field. However, while there is an abundance of research on MRI segmentation methods, there remains a noticeable gap in leveraging advanced neural network architectures for efficient and accurate brain tumor segmentation from MR images. Our work addresses this very gap by proposing an innovative method that combines the strengths of multiple existing models. The overarching goal is to arm clinicians with sophisticated tools and methods, facilitating more effective screening, diagnosis, therapeutic planning, image-guided interventions, evaluation of treatment outcomes, and patient monitoring across a myriad of significant medical conditions [2]. Zooming into the specific context of brain tumors, these are characterized by the aberrant proliferation of cells within the cerebral environment [3]. The onset and progression of such tumors can be subtle yet profoundly harmful, significantly affecting a patient’s well-being and overall quality of life. Recognizing these challenges, the medical community has continuously sought better methods for diagnosis and intervention. As a result, as medical advancements progress, technologies like medical imaging, tumor monitoring, and the ability to predict patient outcomes have taken center stage [4]. Yet, there exists a tangible need for automated methods that not only detect these tumors but also predict their progression with higher accuracy. Our research aims to provide a comprehensive solution that bridges this gap, ensuring that individuals receive the most comprehensive and effective treatments available. These advancements are not just about detecting tumors but providing a holistic approach to patient care, ensuring that individuals receive the most comprehensive and effective treatments available [5]. The integration of these technologies underscores their importance in the contemporary treatment of brain tumors [6]. One standout technique in this realm is Magnetic Resonance Imaging (MRI). MRI is a non-invasive imaging method that uses radiofrequency signals to produce internal images by exciting target tissues under a powerful magnetic field. Some of its unique advantages include excellent soft tissue contrast, no radiation exposure, and the capability to offer multi-modal and multi-parameter imaging by varying the contrast agents. This makes MRI particularly suited for detecting brain abnormalities. For brain MRI, there are four commonly used imaging modes (referenced in Figure 1): (a) FLAIR (fluid-attenuated inversion recovery) prominently showcases the edema, or swelling, surrounding brain tumors. (b) T1-weighted images provide clarity in discerning tumor core contours, consisting of enhanced and non-enhanced tumor regions, as well as areas of necrosis. (c) T1C images (T1-weighted contrast-enhanced images) emphasize the area of enhancing tumors. (d) T2-weighted images offer a clear demarcation between the whole tumor region, which includes the tumor core and the surrounding edema, and the healthy tissue areas. The differences between tumor tissue and adjacent normal brain tissue are significant, but they share a high degree of grayscale similarity. Even though there has been substantial progress in brain tumor research, automatically identifying tumor contours and their detailed segmentation within multi-modal MRI remains a challenging task.
For physicians to formulate effective treatment plans, acquiring precise details regarding the size, morphology, and location of brain tumors is of paramount importance. Traditionally, segmenting brain tumors from MR images is a manual process, demanding considerable time and expertise on the part of medical practitioners. The intricate nature of brain tumor presentations exacerbates the challenge, rendering the process prone to errors. This has led to a growing interest in the automatic segmentation of brain tumors in MR images, as it promises to enhance diagnostic efficiency. Nonetheless, this endeavor is not without its challenges. The inherent variability in the presentation of brain tumors—manifested in disparities in size, shape, and location across different patients—compounds the difficulty of the task. Additionally, delineating the boundaries between normal soft tissues and pathological tissues in MR images can be nebulous, as highlighted by Ren Lu et al. [7]. Hence, while automated techniques hold promise, ensuring their accuracy remains an intricate academic and clinical pursuit.
Extending the discussion, Convolutional Neural Networks (CNNs) have made significant strides in the domain of image segmentation [8]. One notable contribution was in 2015, when Long et al. [9] introduced a Fully Convolutional Network (FCN) that is based on CNNs for semantic segmentation. This model was innovative in its approach; it replaces the fully connected layer typically found at the end of CNNs with convolutional layers. This change allows for outputs matching the size of the input image, yielding accurate segmentation results. Basically, the brain tumor image segmentation network based on the FCN is an end-to-end semantic segmentation network. However, the FCN disconnects the association between pixels, resulting in less accurate image segmentation outcomes. While CNNs have dramatically advanced the field of image segmentation, the pressing need to continually refine these models stems from the inherent complexities in medical images. Ghiasi et al. [10] improved the segmentation precision of images by incorporating pyramid convolution to extract global information from the image. Ronneberger et al. [11] proposed a symmetrical FCN called U-Net. Using skip connections, U-Net integrates both shallow and deep image feature information, enhancing the performance in medical image segmentation tasks. In order to further improve image segmentation performance, many studies have embedded attention mechanisms (AMs) into deep neural networks. For example, Hu et al. [12] introduced a channel-based Squeeze-and-Excitation attention network, and Xiao et al. [13] devised the Weighted Res-UNet architecture. This design embeds both the AM and residual connections, as elucidated by He et al. [14], specifically for retinal image segmentation. Within this framework, residual connections are systematically incorporated across all components of U-Net, leading to an optimized feature extraction process. Utilizing the AM concept, CBAM [15] implements a model that connects two AM modules in a cascading manner and embeds them into the network. Meanwhile, DANet [16] parallels the spatial attention module with the channel attention module, which captures feature dependencies in both spatial and channel dimensions. Delving deeper into the mentioned studies, it becomes evident that the field has shifted from purely architecture-based innovations to integrating AMs and other heuristics that capture contextual information more effectively. A significant problem with current brain tumor MRI image segmentation networks is their excessive number of layers and the inadequate integration of local and global feature information. This results in decreased image segmentation accuracy. Furthermore, Ibtehaz et al. [17] presented an innovative method with their introduction of MultiResUNet for skin cancer segmentation. Their method expanded multi-resolution blocks and improved upon the residual skip connections inherent to the U-Net model. However, a closer look at U-Net reveals a limitation: only features of the same scale are amalgamated during skip connections. This overlooks the potential of amalgamating multi-scale features from the encoder, each with its distinct receptive field. Furthermore, Nodirov et al. [18] presented attention U-Net, which incorporates an additive AM to accentuate crucial feature information in the skip connection features. Highlighting other advancements, Colman et al. [19] developed the DR-Unet104 network specifically for brain tumor segmentation tasks. They made changes to the traditional U-Net by substituting its convolutional blocks in the encoder with stacked bottleneck residual blocks. Impressively, their model achieved insightful segmentation results. Considering these benefits, it is unsurprising that the prevailing paradigm in medical image segmentation prominently features CNNs employing an encoder–decoder approach.
Without a doubt, methods based on deep neural network models have achieved good results in brain tumor segmentation tasks. However, there is still significant room for performance improvement. The utilization of features in brain tumor images is not exhaustive. Often, the intrinsic complexities, such as variations in tumor size, shape, location, and patient-specific characteristics, present unique challenges that have not been completely addressed by current models. These challenges highlight the nuances of the problem and the need to capture a broader and more intricate feature spectrum for accurate segmentation. Moreover, while there are numerous models available, not all are tailored to the specific requirements of brain tumor segmentation. Moreover, designing a brand new and efficient deep neural network model is a costly endeavor. It demands substantial computational resources, time, and expertise. Furthermore, given the critical nature of medical diagnostics, any new model must undergo rigorous testing and validation processes to ensure it is reliable and accurate. This adds to the complexity, cost, and time of bringing novel deep neural networks into clinical practice. Therefore, the research community should consider both refining existing models and developing optimized strategies to harness the full potential of neural networks for this pivotal task. In this paper, we introduce a new approach uniquely tailored for MRI brain tumor image segmentation. We enhance the clarity of MRI images using a specific pre-processing technique, allowing for the extraction of hidden features through CNNs. We replace the convolutional units in the conventional segmentation network with deep residual modules, tackling the vanishing gradient issue commonly found in deeper networks. By incorporating a threefold attention block (TAB), the network effectively combines local and global image features, greatly improving precision in MRI brain tumor segmentation. Our primary goal is to substantially improve segmentation accuracy, providing invaluable support for clinical diagnosis.
The main contributions of this research can be summarized in three aspects:
- An end-to-end brain tumor MRI image segmentation network is proposed. It not only extracts more comprehensive contextual image features but also significantly improves the accuracy of brain tumor image segmentation.
- A TAB and a residual module are introduced within the Fully Convolutional Network. This effectively connects deep and shallow image information, emphasizing important feature information. On one hand, the residual module enhances the feature information’s expressive capacity, aiding in the extraction of image features during encoding. On the other hand, the TAB pays more attention to the detail of the brain tumor image during decoding, enhancing the accuracy of segmentation details.
- The TAB underwent extensive evaluations on BraTS2018, BraTS2019, and other brain tumor segmentation benchmarks. Experimental results indicate that the segmentation network with the TAB outperforms prior brain tumor image segmentation networks.
2. Related Work
In this section, we provide a comprehensive overview of existing methods and their limitations. Further details are provided in the subsequent sections.
2.1. Brain Tumor Image Segmentation
Segmentation techniques utilizing CNNs have shown remarkable success in the domain of medical imaging. Among them, the U-Net-based segmentation network stands out. In a notable study, Abdullah et al. [20] put forward the concept of a light-weighted rapid semantic segmentation network, known as LBTS-Net. Their approach involved simplifying the U-Net network by trimming down the feature channels and incorporating depth-separable convolutions. As a result, they were able to streamline the number of parameters, thus boosting the overall computational efficiency. In a separate development, Awasthi et al. [21] rolled out multi-threshold attention U-Net. This innovation relies on attention U-Net and uses multi-path segmentation to create separate models for different brain tumor sub-regions. Going a step further, Xu et al. [22] introduced deeply supervised U-Attention Net. This design integrates both an AM and deep supervision into U-Net, which facilitates both high- and low-resolution representation of features, a boon especially for smaller tumor areas. Meanwhile, Shelatkar et al. [23] unveiled a cross-stage local network structure. This structure is geared towards better feature extraction in U-Net. Additionally, they refined the loss function to counter the effects of class imbalances in training samples, leading to enhanced brain tumor segmentation precision.
2.2. U-Net and Its Advancements
U-Net is widely recognized as the primary network for medical image segmentation. Both its original and improved versions play a crucial role in many medical imaging applications. Evidence of its effectiveness came when Ronneberger et al. [11] used U-Net to win the 2015 International Symposium on Biomedical Imaging Cell Tracking Challenge. On a different note, Çiçek et al. [24] put forth the idea of replacing all 2D convolution operations in U-Net with 3D convolutions. The resulting 3D U-Net turned out to be better suited for medical image voxel processing. However, 3D convolution operations come with their own set of challenges, mainly because of their complex parameters and rigorous training requirements. Taking inspiration from residual connections, as mentioned by Deng et al. [25], Ibtehaz et al. [17] incorporated multi-resolution blocks and residual skip connections into U-Net. This integration resulted in MultiResUNet, which has been pivotal in skin cancer image segmentation. In another intriguing approach, Zhou et al. [26] combined the principles of dense connections, as presented by Liu et al. [27], with U-Net to craft UNet++. Their approach utilizes nested and densely connected skip paths to bridge the semantic differences between encoder and decoder features during skip connections.
2.3. Multi-Scale Feature Segmentation Network
Recently, segmentation techniques have increasingly utilized multi-scale features to enhance the network’s segmentation capabilities. The pyramid parsing network serves as a prime example. In this network, Zhao et al. [28] demonstrated the effectiveness of multi-scale feature-pooling modules. These modules gather features from various receptive fields of a single feature, enhancing the interplay between the local and global aspects of the feature. In a parallel stride, Wang et al. [29] harnessed information from different layers of CNNs to design a cutting-edge deep neural network. This network, equipped with a deep attention feature module, demonstrated superior performance in prostate segmentation within transrectal ultrasounds. Sinha et al. [30] introduced the concept of multi-scale features during fusion and aimed to integrate a guided self-attention mechanism. Their model served as a link between fused and local features, effectively capturing subtle contextual relationships. Furthermore, Jiali et al. [31] concentrated on the intricacies of segmenting small targets in the hippocampus and introduced multi-resolution images into their network. Using dense connections, they utilized encoder and decoder multi-resolution features to enhance feature propagation, promoting better communication between encoder and decoder.
2.4. Attention Mechanism
AMs have emerged as a transformative force in image processing, notably in the domains of object detection, classification, and segmentation. Jetley et al. [32] and Wang et al. [33] introduced the groundbreaking self-attention mechanism, crafted to eliminate the dependency on external data sources. Zhou et al. [34] advanced the field by devising a CNN that utilizes a sophisticated channel attention mechanism, expertly capturing the complex interplay among feature channels. Additionally, their model enables an adaptive adjustment of the prominence of each channel within the feature set. Moreover, Mazumdar et al. [35] proposed the use of spatial attention based on the channel AM to model the dependencies among different positions on the feature map, resulting in a correlation coefficient matrix of these positions. With the emergence of transformers underpinned by self-attention mechanisms, as elucidated by Valanarasu et al. [36] and Jiang et al. [37], there has been a marked advancement in discerning extensive interdependencies among features. Furthermore, seminal research on sentence translation by Bahdanau et al. [38] and Shen et al. [39] introduced the initial versions of additive AMs. Recently, these mechanisms have gained traction in the domain of image processing. In essence, an additive AM merges two input features using post-linear transformation; they then undergo subsequent activation and linear transformations. Upon transformation, a sigmoid function is employed to elucidate the interrelation of similarity between the two features. Taking this to the realm of U-Net, Cai et al. [40] innovatively integrated a gated attention mechanism between encoder and decoder features, accentuating pivotal feature data in skip connections. Through the integration of attention mechanisms, neural networks have been fortified to focus selectively on distinct data points, significantly augmenting model proficiency in tasks necessitating precise localization.
It is evident that brain tumor segmentation is majorly impacted by CNNs, with U-Net standing out as a main contributor. Recent innovations, like the more streamlined LBTS-Net, highlight attempts to boost efficiency in computing. At the same time, tools like multi-threshold attention U-Net and deeply supervised U-Attention Net demonstrate the industry’s drive to improve feature accuracy, especially when it comes to identifying smaller tumor areas. The shift towards 3D convolution in U-Net indicates a deeper exploration, and the addition of multi-resolution blocks and residual skip connections in MultiResUNet represents a mix of detailed and broader views in segmentation. Additionally, methods focusing on multi-scale features are becoming more common, aiming to combine specific details with a broader view. This makes networks like the pyramid parsing network and other techniques using multi-scale features increasingly important today. The AM has brought about major changes, with self-attention strategies and channel attention designs leading to major progress. These strategies highlight the importance of focusing on certain areas to increase segmentation accuracy.
With these developments in mind, our new method incorporates the principle of residual structures, tackling the often-seen issue of vanishing gradients in more complex networks. Through the addition of a three-part attention feature, we have managed to merge both specific and broad image features. This not only fits with modern developments but also greatly improves the accuracy of segmenting brain tumors in MRI scans, presenting a fresh and enhanced approach to the subject.
3. Proposed Methodology
In this section, we introduce our innovative approach, distinguishing it from existing methods previously discussed. Here, we delve into the specifics of our technique, outlining its design and key components. We present a sophisticated technique for detecting brain tumors using MRI scans. Initially, we improve the clarity of MRI brain images through a pre-processing step. We then adopt a residual-based approach, replacing conventional convolutional segments in both the encoder and decoder phases of a standard image segmentation network with advanced residual units. This method adeptly tackles the vanishing gradient dilemma often encountered in deeper networks. Following this, we incorporate a threefold AM within the network. This design allows for a seamless combination of local and extensive image attributes, bolstering the network’s ability to effectively identify and comprehend crucial image characteristics. In Figure 2, we delineate the architecture of the proposed model. Subsequent subsections provide an exhaustive analysis of each constituent step.
3.1. Data Pre-Processing
Given the complexity inherent in the structure of brain tumor images and the influence of noise, data pre-processing becomes imperative for enhanced performance. The first step of our proposed model is enhancing the contents in MRI images. In this study, brain tumor MRI images are subjected to a two-step pre-processing procedure. Initially, each 3D MRI image possesses dimensions of pixels. These 3D brain tumor images are sliced along the axial direction, resulting in a series of 2D brain tumor slice images. Subsequently, slices of size are derived from each 2D slice image. To process the images according to the first step, we consider the following mathematical equations and notations:
- Initial dimensions: The dimensions of each 3D MRI image can be represented as , where each coordinate represents the size of the image along the x-, y-, and z-axes, respectively.
- Axial direction slicing: Upon slicing in the axial direction, a series of 2D slices is obtained. Let N denote the number of 2D slices. In this case, , with each slice having dimensions .
- Sub-slices of size : From each 2D slice, sub-slices of dimensions are derived. Let m and n represent the number of sub-slices along the x- and y-axes, respectively. In this particular instance, the extraction method for the slices must be specified. However, for the sake of this discussion, we assume that these sub-slices are non-overlapping and align perfectly within the dimensions.This gives us sub-slice per 2D slice.
- Total number of sub-slices: The total number of slices, , is
Thus, from each initial 3D MRI image with dimensions of , we derive a total of 155 sub-slices, each of size . To further extract hidden features, the visual quality of the obtained MRI images that are processed in the first step is refined using a low-complexity algorithm. The enhancement procedure commences by manipulating the initial MRI images using a logarithmic transformation method to enhance pixels with medium and low brightness levels. Subsequently, the images undergo treatment utilizing a straightforward exponential equation to adjust local contrast while reducing the impact of bright pixels. Following this, an advanced version of the logarithmic-based image processing model is employed to combine the two altered images for the purpose of optimizing visual traits and efficiency. Additionally, a revised version of the cumulative distribution function based on hyperbolic secant distribution is applied to elevate the overall luminance of the images. In the final step, pixel values in the images are adjusted to a standard scope using a linear scaling method, guided by a normalization equation. The formula that outlines this enhancement is articulated as follows:
where signifies the initial MRI image, represents the MRI image that is processed using the logarithmic transformation, is the image adjusted using the straightforward exponential equation, is the combined image subsequent to the application of the advanced logarithmic-based image processing model, is the image after being refined using the updated cumulative distribution function based on hyperbolic secant distribution, and is the image subsequent to adjustment using the linear scaling technique. To provide a visual representation, Figure 3 showcases original and enhanced MRI brain tumor images. Within this image, distinct colors demarcate different tumor types: red signifies necrotic and non-enhancing tumor regions; green highlights peritumoral edema regions; and yellow delineates enhancing tumor regions. This color-coded approach aids in intuitive understanding and analysis.
3.2. Deep Residual Module
Understanding the architecture of neural networks is paramount for obtaining the desired results. One of the critical areas that has received significant attention in the realm of image segmentation is the CNN structure. The configuration of a CNN plays a pivotal role in determining the quality of segmentation outcomes. Let denote the transformation applied by a traditional CNN to an input x. However, deepening this structure has often led to a pervasive challenge: the vanishing gradient issue. Mathematically, during the backpropagation phase, gradients can approach zero, where is the loss function and w are the network weights:
To mitigate this concern, our research turned to the principles underlying the residual network [41]. A residual network is comprised of numerous interconnected residual modules. A representative structure of a single residual unit is depicted in Figure 4.
3.2.1. The Residual Unit
Suppose that the input to the neural network is x and the expected output is . An identity mapping layer is added to the shallow network. Input x is directly transmitted to the subsequent network layers, and the output results are accumulated. At this point, what needs to be learned is not an entire output but the difference between function value and x. Now, the output () of the residual unit can be represented as
where is the residual that the network needs to learn. This effectively changes the objective from approximating to learning residual .
3.2.2. Incorporation into Image Segmentation Networks
In traditional CNNs, multiple convolution operations are used to extract image features, as depicted in Figure 5a. The output from such a traditional network can be formulated as
where ∘ represents the composition of functions, represents the transformation performed by the i-th convolutional layer, and n is the total number of layers. Our study replaces these original convolution modules in both the encoder and the decoder of the segmentation network with deep residual modules, as demonstrated in Figure 5b. In this residual architecture, output can be formulated as
where is the transformation by individual deep residual modules and n is the number of such modules. This equation essentially represents the addition of residuals to identity mapping x. Moreover, the deep residual module refines the vanishing gradient problem during network training. Typically, during backpropagation, the gradient of the loss () with respect to the weights (w) is calculated as follows:
In traditional deep networks, the term may become vanishingly small, leading to the vanishing gradient problem. However, in deep residual networks, the presence of the identity mapping ensures that contains terms that are not prone to vanish. Thus, gradient is less likely to diminish significantly during backpropagation:
By encouraging these gradients to propagate without significant diminishment, the deep residual module effectively alleviates the vanishing gradient issue. This architecture thus enhances the extraction of feature information, addressing the problem of incomplete feature extraction in image segmentation networks.
3.3. Segmentation Network
The brain tumor image segmentation network based on the TAB uses deep residual modules to replace the encoder and decoder layers in the original image segmentation network structure. This can solve problems such as vanishing gradient while deepening network training. By introducing a TAB into the segmentation network, the network can better learn important feature information, suppress redundant feature information, and enhance brain tumor segmentation performance in MRI images. The structure of the TAB network in this study is shown in Figure 2; it consists of encoding path, decoding path, bridging path, and skip connections, where the inputs are the four modalities of MRI brain tumor images. The encoding layer is composed of convolutional layers, deep residual modules, and max pooling layers. Mathematically, it can be expressed as
These components encompass convolution operations, ReLU activation functions, and batch normalization (BN) regularization. Within the deep residual modules, residual connections bridge both the shallow and deep semantic features of the feature map. As the feature map undergoes downsampling, its size diminishes. Concurrently, the number of channels in the feature map escalates as its size contracts. Similar to the encoding layer, the decoding layer is composed of deep residual modules and incorporates upsampling processes, i.e., with , we have
Feature maps from the encoding layer undergo upsampling, allowing the resultant feature map to match the size of the original image. The bridging path, , serves as an intermediary layer connecting the encoding and decoding layers. By leveraging skip connections, the encoding layer’s shallow features find their counterparts in the deep features of the decoding layer, ensuring harmonious integration of the feature map. It is worth noting, however, that the primary feature data sourced from the encoding layer are not always pristine. Often, they are interspersed with noise and superfluous details. Such imperfections, if not addressed, have the potential to undermine the accuracy of brain tumor image segmentation, emphasizing the need for meticulous processing and refinement. In this study, we introduce a TAB prior to merging the features from the encoding layer with their corresponding features in the decoding layer. This strategic placement of the TAB serves multiple purposes: it amplifies the essential feature information, diminishes the response from non-pertinent areas, and curtails the influence of extraneous information. By doing so, we created a more streamlined and focused feature set. As a result of these refinements, the accuracy of brain tumor image segmentation is significantly enhanced, paving the way for more reliable and precise diagnostic tools. Building upon the foundation of the established AM, as referenced in sources [42], we introduce the TAB. This innovative approach deftly creates a symbiotic interdependence among all pixel channels, a relationship vividly depicted in Figure 6. It is noteworthy that the TAB is not a monolithic structure; instead, it is a composite configuration consisting of three coexisting modules. This threefold design emphasizes its capacity for versatility and adaptability in addressing intricate imaging endeavors. The tensors generated by the three parallel attention modules are aggregated together by taking the average. Given an input tensor , the tensor undergoes a series of transformations across three parallel attention modules. In the first module, the interaction between the H and C dimensions is established. Initially, the H- and C-axes of x are interchanged. Subsequently, the tensor’s C dimension is condensed to two dimensions using maxpooling and meanpooling. This step ensures the retention of a rich representation of the inherent feature information while simultaneously reducing the network’s depth, thereby minimizing computational demands. A convolution is then applied, followed by normalization. The resulting tensor is processed with a sigmoid activation function, yielding interaction attention weights. To maintain consistency with the input, the output’s H- and C-axes are reverted to their original configuration. The second attention module operates analogously, focusing on the interaction between the W and C dimensions. The WW- and C-axes of x are initially swapped, followed by the aforementioned maxpooling and meanpooling operations to reduce the C dimension. A subsequent convolution and normalization lead to the generation of interaction attention weights with a sigmoid activation function. Again, to ensure consistency, the output’s W- and C-axes are reverted. The third attention module establishes an interaction between W and H. Here, x is directly subjected to maxpooling and meanpooling operations, reducing the C dimension. A convolution and normalization yield interaction attention weights post-sigmoid activation. Therefore, for a given input tensor , each TAB module performs attention-based transformations:
where is the permutation of dimensions H, C, and W, depending on module i. The final output of the TAB network is the average of the outputs from all three modules:
Conclusively, the tensors produced by these three distinct attention modules are integrated to achieve the target result. This aggregation is achieved by computing their average, ensuring a comprehensive representation that encapsulates the interactions across all dimensions.
4. Experimental Results
4.1. Datasets
In our study, we employed the BraTS2018 [43] and BraTS2019 [44] datasets to evaluate brain tumor image segmentation performance. Both datasets originate from the esteemed MICCAI Brain Tumor Segmentation Challenge, a recognized platform in the domain of medical imaging. The BraTS2018 dataset encompasses 285 patient cases. Of these, 210 samples are derived from high-grade glioma patients, while the remaining 75 are from those with low-grade gliomas. On the other hand, the BraTS2019 dataset builds upon its 2018 counterpart. In addition to the original BraTS2018 training dataset, it incorporates 49 high-grade glioma patients and a single low-grade glioma patient, thereby expanding its breadth.
Each patient’s dataset is characterized by four distinct MRI modalities. Additionally, the actual segmentation image, often referred to as the ground truth, is provided. The segmentation task for brain tumors necessitates a tripartite division: the whole tumor (WT), the enhanced tumor (ET), and the tumor core (TC). The labeling scheme is systematic, with four categories in place: healthy regions bear the label 0; necrotic and non-enhancing tumor regions are designated as 1; peritumoral edema regions are labeled as 2; lastly, enhancing tumor regions are marked as 4.
4.2. Loss Function
This study introduces a hybrid loss function that combines cross-entropy loss with Dice similarity coefficient loss. The mathematical expression for the cross-entropy loss is given by
where N represents the set of pixels within the segmentation map, while L designates the set of pixels that are labeled with the segmentation marker. Moving on, signifies the actual classification of the pixel in the segmentation map in conjunction with the pixel in the labeled segmentation. On the other hand, indicates the forecasted value for the pixel in the segmentation map and its counterpart, the pixel, in the annotated segmentation label. As we delve into the network training phase, it is worth noting that the cross-entropy loss function plays a pivotal role in optimization. This optimization is crucial, because it addresses and rectifies the vanishing gradient issue, ensuring that the network operates with stability. Nevertheless, when dealing with images that exhibit class imbalance issues, there is a notable challenge. Specifically, the loss function tends to lean favorably towards samples that encompass a larger number of categories. Such a bias can redirect the network’s optimization trajectory, potentially compromising its efficacy. To address such scenarios, another metric can be utilized. Here, the Dice similarity coefficient loss function, which is defined as follows, comes into play:
Firstly, we must determine N, which is the set of pixels within the segmentation map, and L, the set of pixels associated with the segmentation label. It is important to note the presence of a smoothing factor, , in the equation. This factor ensures that the denominator in the loss function never reaches zero. For the purpose of our experiment, we assign a negligible value. With the incorporation of the Dice similarity loss function, there is a strategic advantage: it steers the network parameters’ learning process, allowing prediction outcomes to more closely mirror actual values. Building on this, we then arrive at the culmination, which is the formulation of the hybrid loss function, described as follows:
4.3. Parameter Setting and Training
For our experiment, we utilized a specific hardware and software configuration to ensure optimal performance and accuracy. In terms of hardware, our setup comprised an Gold 6128 CPU operating at 2.30 GHz, complemented by a memory capacity of 256 GB. Additionally, we used the NVIDIA 1080Ti GPU. On the front end, our environment was anchored on the Windows Server 2012 R2 operating system. We executed our scripts using Python 3.8 and PyTorch, which facilitated our neural network operations.
During the training phase, the dataset predominantly consisted of pre-processed images of brain tumors, accompanied by their authentic segmentation labels. To ensure a robust validation mechanism, 25% of this dataset was reserved as a validation set, leaving the remaining 75% for continuous model training. As we proceeded the training, certain hyperparameters were carefully chosen to optimize the model’s learning. Specifically, the initial learning rate was set to 0.003, combined with a momentum of 0.9. Furthermore, each iteration processed a batch size of 18 images, aiming to complete 10,000 iterations in total. To further enhance the optimization process, the Adam optimizer was employed, characterized by a decay coefficient of 0.0001. Recognizing the importance of not overfitting the model, the Early Stopping methodology was integrated. This serves as a mechanism to halt training once the model ceases to show significant improvement, thereby determining the optimal iteration count. For a visual representation of the model’s performance, Figure 7 provides a graphical depiction of the loss function, number of epochs, and batch size trend for both the training and validation sets. From this, a noteworthy observation emerges: as the iteration count increases, there is a discernible decline in the network’s loss value. This trend highlights the model’s learning efficacy. Remarkably, by the time we approach the 340th iteration, the loss begins to showcase signs of stabilization, indicating a point of convergence. This convergence is pivotal, suggesting that the model has sufficiently learned from the dataset and is less likely to benefit from further iterations.
4.4. Performance Evaluation Metrics
In real-world clinical settings, the tumor structure is typically segmented into three distinct regions for performance evaluation in image segmentation. These regions comprise whole tumor (WT), enhanced tumor (ET), and tumor core (TC).
For a comprehensive assessment of the proposed image segmentation network, we employed several performance metrics. These included Dice similarity coefficient, Precision, Recall, and Hausdorff distance (HD). The corresponding formulas for these metrics are delineated below:
In the above formulas, TP is the number of samples correctly detected as positive samples; FP is the number of negative samples incorrectly detected as positive samples; and FN is the number of positive samples incorrectly detected as negative samples. The Dice coefficient is used to measure the similarity between the predicted segmentation results and the actual segmentation results. Precision is the proportion of the total number of pixels correctly predicted as brain tumor segmentation to the total number of pixels predicted as brain tumor. Recall is the proportion of the total number of pixels correctly predicted as brain tumor to the total number of pixels that are actually brain tumor.
Furthermore, HD is used to represent the maximum mismatch degree between two sample sets. A smaller HD value indicates better segmentation results. Hausdorff 95 (HD95) represents the calculated HD value multiplied by 95%, aiming to eliminate the impact of outliers on the calculation results.
where S and L represent the actual segmentation prediction results and the real segmentation labels, respectively.
4.5. Quantitative Analysis
To validate the enhanced performance and effectiveness of our model, we conducted a series of quantitative experiments. Table 1 shows the brain tumor image segmentation experimental results of the four networks and the network proposed in this study in terms of the Dice and Hausdorff coefficients. It can be seen that in terms of both coefficients, the segmentation network of this study is superior to the experimental results of the other three networks in the WT, TC, and ET areas. The experimental results show that in the WT, TC, and ET areas, the Dice values reached 88.25%, 90.66%, and 85.89%, respectively. Likewise, a closer examination of the quantitative analysis in Table 1 revealed that our segmentation network achieved HD coefficient values of 2.121, 1.369, and 2.301 for the WT, TC, and ET regions, respectively. While our model’s segmentation outcomes for the overall tumor, necrotic tumor, and enhanced tumor regions outperform those of the SwinBTS [37] and DR-Unet104 [19] networks, it is imperative to highlight that the performance in the enhanced tumor region remains consistent and does not show marked improvement when juxtaposed with the metrics from UNet3D [45] and DANet [16].
Furthermore, Table 2 provides a comprehensive evaluation of various learning-based approaches for segmentation, focusing on the BRATS2019 and BRATS2020 datasets. In total, 14 different learning-based models are considered. The table utilizes two performance metrics, i.e., Dice and HD, to quantify segmentation accuracy. It is noteworthy that the proposed model achieved higher scores in Dice and lower scores in HD across both datasets. Specifically, the proposed model reached Dice scores of 84.23, 92.30, and 88.45 for the ET, WT, and TC compartments, respectively, on the BRATS2019 dataset. When compared with BRATS2020, the Dice scores are 80.38, 93.78, and 89.01. These results indicate an improvement in segmentation accuracy over other methods listed, especially in the WT and TC compartments, which often present challenges due to their complex structure. Among the existing models, 3D-AR [46] and Edge U-Net [47] are the closest competitors. For instance, in the BRATS2019 dataset, 3D-AR [46] achieved Dice scores of 81.73, 90.68, and 86.02 for the ET, WT, and TC compartments, respectively. Likewise, Edge U-Net [47] scored 81.70, 89.84, and 86.40 in the same categories. While these models performed admirably, they still lagged behind the proposed model in terms of both Dice and HD metrics. Interestingly, some models, like HDC-Net [48] and DMF-Net [49], showed comparable performance in certain compartments but exhibited inconsistencies across different metrics and datasets. For example, HDC-Net achieved a Dice score of 80.90 in the ET compartment on BRATS2019 but fell behind in the TC compartment, with a score of 84.70. This variability suggests that while these models have their strengths, they might not be as robust across different testing conditions as the proposed model. In terms of HD, the proposed model also led the pack, with scores of 2.35, 4.22, and 4.51 on BRATS2019 and 2.33, 4.20, and 5.37 on BRATS2020. Lower HD scores indicate that the proposed model’s segmentation output more closely resembles the ground truth, especially when compared with other models, like MSMA-Net [50], which recorded higher Hausdorff distance values, namely, 5.06, 13.6, and 8.62, on the BRATS2019 dataset.

Table 1.
Quantitative assessment of both the proposed and preceding models, utilizing the Dice and HD metrics on the BRATS2018 dataset.
Table 1.
Quantitative assessment of both the proposed and preceding models, utilizing the Dice and HD metrics on the BRATS2018 dataset.
| Method | Dice | HD | |||||
|---|---|---|---|---|---|---|---|
| Publication Year | WT | TC | ET | WT | TC | ET | |
| U-Net [51] | 2017 | 83.75 | 85.03 | 76.98 | 2.661 | 1.749 | 2.830 |
| RRU-Net [52] | 2019 | 84.32 | 86.17 | 78.72 | 2.321 | 1.517 | 2.724 |
| DANet [16] | 2019 | 84.28 | 85.32 | 79.15 | 2.551 | 1.770 | 2.740 |
| 3DSSBT [53] | 2020 | 87.15 | 81.55 | 77.91 | 2.584 | 1.775 | 2.768 |
| Transbts [54] | 2021 | 84.89 | 86.64 | 78.97 | 2.891 | 1.945 | 2.971 |
| DR-Unet104 [19] | 2021 | 86.77 | 79.88 | 75.11 | 2.774 | 1.882 | 2.869 |
| UNet3D [45] | 2022 | 84.57 | 72.79 | 70.67 | 2.590 | 1.605 | 2.687 |
| SwinBTS [37] | 2022 | 83.19 | 72.88 | 71.99 | 2.212 | 1.411 | 2.431 |
| HMNet [55] | 2023 | 85.89 | 74.86 | 72.44 | 2.894 | 1.842 | 2.785 |
| Ours | 2023 | 88.25 | 90.66 | 85.89 | 2.121 | 1.369 | 2.301 |
In summary, Table 2 substantiates that the proposed model excels in segmentation tasks, offering superior performance across both Dice and HD metrics when tested on the BRATS2019 and BRATS2020 datasets. Its robustness and accuracy make it a strong candidate for reliable brain tumor segmentation, outperforming other state-of-the-art methods in the field.
Table 2.
Evaluating the proposed and previous models using Dice and Hausdorff metrics on the BRATS2019 and BRATS2020 datasets.
Table 2.
Evaluating the proposed and previous models using Dice and Hausdorff metrics on the BRATS2019 and BRATS2020 datasets.
| Method | Dataset | Dice | HD | |||||
|---|---|---|---|---|---|---|---|---|
| PublicationYear | ET | WT | TC | ET | WT | TC | ||
| 3D-AR [46] | BRATS2019 | 2019 | 81.73 | 90.68 | 86.02 | 3.82 | 4.52 | 6.85 |
| DMF-Net [49] | 2019 | 80.12 | 90.62 | 84.54 | 3.06 | 4.66 | 6.44 | |
| MSMA-Net [50] | 2021 | 75.80 | 89.00 | 81.10 | 5.06 | 13.6 | 8.62 | |
| HDC-Net [48] | 2021 | 80.90 | 89.70 | 84.70 | 2.43 | 4.62 | 6.12 | |
| DLHT [56] | 2022 | 80.12 | 90.8 | 83.8 | 2.59 | 4.55 | 8.14 | |
| Edge U-Net [47] | 2023 | 81.70 | 89.84 | 86.40 | 2.86 | 4.69 | 5.67 | |
| Ours | - | 84.23 | 92.30 | 88.45 | 2.35 | 4.22 | 4.51 | |
| LCRL [34] | BRATS2020 | 2021 | 72.70 | 87.10 | 71.80 | 6.30 | 6.70 | 9.30 |
| DMF-Net [49] | 2019 | 77.33 | 89.75 | 81.67 | 2.84 | 6.19 | 6.59 | |
| SResU-Net [57] | 2021 | 75.40 | 91.00 | 83.50 | 3.84 | 4.57 | 5.58 | |
| Kiu-net [58] | 2021 | 73.21 | 87.60 | 73.92 | 6.32 | 8.94 | 9.89 | |
| HDC-Net [48] | 2021 | 77.35 | 89.30 | 81.83 | 4.19 | 6.74 | 7.98 | |
| AEA U-net [59] | 2021 | 77.30 | 90.20 | 81.50 | 4.65 | 6.15 | 7.54 | |
| 3D U-Net [18] | 2022 | 75.90 | 88.50 | 85.10 | 4.81 | 7.09 | 8.41 | |
| dResU-Net [60] | 2023 | 77.90 | 89.78 | 89.50 | 2.97 | 3.35 | 6.11 | |
| Ours | - | 80.38 | 93.78 | 89.01 | 2.33 | 4.20 | 5.37 | |
Figure 8a provides a comparative visual analysis of the brain tumor image segmentation outcomes for nine existing networks, specifically with regard to the Precision metric. As evidenced by the data, our proposed segmentation network yielded Precision coefficients of 89.09%, 90.95%, and 80.42% in the WT, TC, and ET regions, respectively. These percentages underscore the algorithm’s exceptional performance, as they surpass the corresponding Precision metrics demonstrated by the other networks under comparison. The significance of these high Precision rates cannot be overstated. Precision is a vital metric in medical imaging, particularly in brain tumor segmentation, as it quantifies the exactness of the segmented region, minimizing the risk of falsely identifying non-tumor regions as pathological. Achieving high Precision rates is crucial, as any error in tumor identification can have substantial implications for subsequent treatment planning and overall patient prognosis. The superiority of the proposed network in the WT, TC, and ET areas is particularly noteworthy. These regions are often the most challenging for algorithms to segment accurately due to their variable intensities and complex anatomical structures. The WT region, for instance, encompasses both the tumor core and the surrounding edematous tissue, making it a difficult area for precise segmentation. Likewise, the TC and ET regions are areas where the tumor is most active and where the structural irregularities are at a maximum, posing considerable challenges for segmentation. The Precision coefficients in these regions attest to the robustness and adaptability of our segmentation network, demonstrating its capacity to handle the complexities inherent in brain tumor MRI scans. Thus, the high Precision coefficients achieved in the complex WT, TC, and ET areas not only demonstrate the efficacy of our proposed model but also point toward its potential for reliably facilitating better patient care and treatment outcomes.
Moreover, we conducted a performance evaluation of the proposed model and benchmarked it against preceding models. The visual results are shown in Figure 8b, which provides a comprehensive representation of the quantitative outcomes related to brain tumor image segmentation. Specifically, these outcomes are evaluated using the Recall metric across nine distinct learning-based models, in addition to the model introduced in the current research. Delving into the details, the segmentation network developed within this study showcases performance metrics of 88.70%, 92.34%, and 85.24% for the WT, TC, and ET regions, respectively. It is noteworthy to mention that when these results are contrasted with the Recall metrics from eight other networks, our model exhibits marginally superior performance.
Furthermore, to rigorously assess the efficacy of our proposed model, we conducted a comprehensive performance evaluation that benchmarked it against a range of preceding models. These comparative results are visually encapsulated in Figure 8b, serving as an illustrative overview of the quantitative metrics. The evaluation criteria for these outcomes are particularly focused on the Recall metric, a pivotal performance indicator in the realm of image segmentation. This analysis incorporated a set of nine distinct learning-based models, thereby allowing for a robust comparative framework. Examining the results in Figure 8b reveals that our model exhibits remarkable performance characteristics. It achieved Recall rates of 88.70% in the WT area, 92.34% in the TC area, and 85.24% in the ET region. These figures gain added significance when juxtaposed with the Recall scores generated by prior models. Notably, our model’s performance displays a marginal yet statistically meaningful superiority when contrasted against the Recall metrics of these competing learning-based networks. The nuanced advantage our model holds in the Recall metric may appear subtle, but it is clinically relevant, as higher Recall rates can significantly impact the quality of diagnostic interpretations and subsequent therapeutic interventions.
4.6. Qualitative Analysis
To conclusively demonstrate the high performance and effectiveness of our proposed model, we initially conducted a series of validation experiments. Notably, these experiments were performed with and without making comparisons with previous models. The images used for this purpose, displayed in Figure 9, were sourced from the BRATS2018 dataset. After applying our enhancement algorithm to these original images, we then proceeded to segment the brain tumors using our model. According to the visual results, it is evident that our proposed model yielded outcomes that closely align with the ground-truth data. However, the segmentation outcome in the final row closely approximates the ground-truth result. Overall, these findings further corroborate the robustness and accuracy of our model.
Furthermore, we conducted another experiment to validate our proposed model’s performance and compare it with previous approaches. The segmentation outcomes are illustrated in Figure 10, which highlights the advantages of the method proposed in this paper. Notably, our approach yielded smoother segmentation along the edges of the tumor. A detailed examination of the images in rows 1 and 2 further revealed that existing methods such as HMNet [55] and TransConver [44] struggled with over-segmentation in the core tumor regions when compared with ground-truth images. Specifically, as shown in row 3, both HMNet [55] and TransConver [44] erroneously categorized pixels located above the core tumor area as belonging to the tumor itself. This is a significant point of differentiation: our proposed method more accurately segments the core tumor area, aligning more closely with the ground-truth image. Overall, these findings bolster the case for the effectiveness and precision of our segmentation method.
In our current study, aside from the preliminary evaluations that we conducted across various MRI modalities, we devoted particular attention to the FLAIR MRI modality. The selection of this modality is grounded on its prevalent use in brain tumor imaging and characterization. We leveraged the BRATS2019 dataset, a comprehensive and well-annotated dataset that has been recognized as a valuable resource for neuroimaging research, for a more granular and specialized analysis of segmentation performance. The outcomes, meticulously collated, are delineated in Figure 11, a graphical elucidation constructed to facilitate a thorough examination of our empirical observations. When benchmarking against existing state-of-the-art algorithms like 3D-AR [46], DLHT [56], dResU-Net [60], and 3D U-Net [18], a key observation is the conspicuous reduction in false-positive voxels achieved by our proposed methodology. False-positive voxels refer to the misidentification of healthy tissue as pathological, which can potentially lead to overtreatment and is thus a metric of critical significance. This reduction in false-positive rates is not just minor or incidental; it is particularly noteworthy in segments of the MRI scans that are traditionally recognized as challenging for accurate segmentation. These challenging areas include but are not limited to the enhanced and core regions of the brain, where tumor activity and anatomical complexity intermingle. The accomplishment of more precise segmentation in these complex and nuanced areas serves as a testament to the robustness of our algorithm.
Furthermore, the remarkable performance gains in these intricate segments of MRI scans are indicative of our algorithm’s capacity to adapt and function effectively even in the most convoluted scenarios. This signifies not only the algorithm’s precision but also its broad applicability and reliability across varying levels of difficulty and complexity in MRI images.
4.7. Limitations and Future Work
However, it is important to recognize the limitations inherent in our study. Specifically, the constraint imposed by utilizing a 2D network structure for segmenting inherently 3D MRI images presents a significant limitation. This dimensionality reduction potentially results in the omission of critical image information, which could impair the overall segmentation accuracy. Additionally, the proposed method using entire brain slices faces a data imbalance issue. Given the relatively small number of pixels for enhancing tumors, this imbalance could potentially deteriorate the segmentation performance of the trained network. Although we have implemented an appropriate slicing technique, the network still requires a refined method to accurately detect tumors in 3D images.
Looking ahead, future research should prioritize the exploration and development of 3D-based brain tumor image segmentation networks. Adopting a 3D-focused approach is anticipated to further improve segmentation accuracy by preserving the intricate relationships within the volumetric data. This would enable a more comprehensive understanding of tumor structures. Furthermore, we will carry out qualitative case studies to verify the model’s effectiveness. While our study marks a significant advancement in brain tumor segmentation, there remains substantial room for further progression in this dynamic field.
5. Conclusions
This study is motivated by the need to rectify persistent challenges in the domain of brain tumor image segmentation, particularly those related to the inadequate integration of local and global feature information, which compromises segmentation accuracy. Our research presents a distinct and critical advancement in the field by addressing these challenges head-on, reaffirming our commitment to enhancing MRI segmentation. Our approach commences with a crucial pre-processing phase aimed at enhancing the visual quality of MRI scans. Far from being a peripheral step, this initial process serves as a bedrock that crucially informs and influences the subsequent stages of our model’s operations. Highlighting our commitment to innovation, our model deviates from traditional paradigms by adopting a novel architectural approach. This involves the replacement of standard convolutional modules with deep residual modules in both the encoder and decoder layers of the segmentation network. This tactical modification is instrumental in mitigating the notorious problem of vanishing gradients, thereby bolstering the efficacy of the backpropagation process and enhancing the model’s learning capability. In a subsequent advancement, we integrate a TAB into our network. This unique component is engineered to synergistically blend local and global feature information. Our emphasis on creating a harmonious fusion of these features is what sets our approach apart from others, making a significant impact on the broader challenges of MRI image segmentation. The consequence of this is twofold: it not only amplifies the network’s feature learning capabilities but also sharpens its proficiency in discerning vital image attributes, thereby significantly elevating the precision of brain tumor segmentation in MRI images. Experimental validation supports the efficacy of our model, revealing that it outstrips its contemporary counterparts on several fronts, notably in terms of performance and segmentation accuracy. However, it is important to recognize the limitations inherent in our study, specifically the constraint imposed by utilizing a 2D network structure for segmenting inherently 3D medical images. This dimensionality reduction potentially results in the omission of critical image information, which could impair the overall segmentation accuracy.
Going forward, it becomes apparent that future research should prioritize the exploration and development of 3D-based brain tumor image segmentation networks. This reinforces the notion that while our contributions mark significant progress in the field, the journey of innovation in MRI image segmentation is ongoing. Such a focus would likely serve to further improve the segmentation accuracy by faithfully preserving the complex relationships within the volumetric data, thereby affording a more comprehensive and nuanced understanding of tumor structures. Therefore, while our study represents a meaningful stride toward improving brain tumor segmentation, it also sets the stage for further advancements in this continually evolving field.
Author Contributions
Z.R.: conceptualization, methodology, software, formal analysis, validation, and data processing. Z.R. and R.Z.: writing—original draft preparation. J.A.B.: investigation, resources, supervision, and project administration. J.A.B. and Z.R.: writing—review and editing; visualization. All authors have read and agreed to the published version of the manuscript.
Funding
This project was supported by Huanggang Normal University Project Number 2042022007.
Institutional Review Board Statement
Not applicable.
Data Availability Statement
The datasets and code can be made available upon request by the first and corresponding authors.
Acknowledgments
The authors wish to thank the leaders of Huanggang Normal University for providing the scientific research facility in the department of computer science.
Conflicts of Interest
The authors declare no conflict of interest.
References
- Pham, V.; Nguyen, H.; Pham, B.; Nguyen, T.; Nguyen, H. Robust engineering-based unified biomedical imaging framework for liver tumor segmentation. Curr. Med. Imaging 2023, 19, 37–45. [Google Scholar]
- Bottet, B.; Piton, N.; Selim, J.; Sarsam, M.; Guisier, F.; Baste, J.M. Beyond the Frontline: A Triple-Line Approach of Thoracic Surgeons in Lung Cancer Management—State of the Art. Cancers 2023, 15, 4039. [Google Scholar] [CrossRef]
- Aamir, M.; Rahman, Z.; Abro, W.A.; Bhatti, U.A.; Dayo, Z.A.; Ishfaq, M. Brain tumor classification utilizing deep features derived from high-quality regions in MRI images. Biomed. Signal Process. Control. 2023, 85, 104988. [Google Scholar] [CrossRef]
- Aamir, M.; Rahman, Z.; Dayo, Z.A.; Abro, W.A.; Uddin, M.I.; Khan, I.; Imran, A.S.; Ali, Z.; Ishfaq, M.; Guan, Y.; et al. A deep learning approach for brain tumor classification using MRI images. Comput. Electr. Eng. 2022, 101, 108105. [Google Scholar] [CrossRef]
- Al Smadi, A.; Abugabah, A.; Al-Smadi, A.M.; Almotairi, S. SEL-COVIDNET: An intelligent application for the diagnosis of COVID-19 from chest X-rays and CT-scans. Inform. Med. Unlocked 2022, 32, 101059. [Google Scholar] [CrossRef] [PubMed]
- Rasheed, M.; Iqbal, M.W.; Jaffar, A.; Ashraf, M.U.; Almarhabi, K.A.; Alghamdi, A.M.; Bahaddad, A.A. Recognizing Brain Tumors Using Adaptive Noise Filtering and Statistical Features. Diagnostics 2023, 13, 1451. [Google Scholar] [CrossRef]
- Ren, L.; Li, Q.; Guan, X.; Ma, J. Three-dimensional segmentation of brain tumors in magnetic resonance imaging based on improved continuous max-flow. Laser Optoelectron. Prog. 2019, 55, 111011. [Google Scholar] [CrossRef]
- Iqbal, S.; Ghani, M.U.; Saba, T.; Rehman, A. Brain tumor segmentation in multi-spectral MRI using convolutional neural networks (CNN). Microsc. Res. Tech. 2018, 81, 419–427. [Google Scholar] [CrossRef]
- Long, J.; Shelhamer, E.; Darrell, T. Fully convolutional networks for semantic segmentation. In Proceedings of the IEEE Conference on Computer Vision and Pattern Recognition, Boston, MA, USA, 7–12 June 2015; pp. 3431–3440. [Google Scholar]
- Ghiasi, G.; Fowlkes, C.C. Laplacian pyramid reconstruction and refinement for semantic segmentation. In Proceedings of the Computer Vision—ECCV 2016: 14th European Conference, Amsterdam, The Netherlands, 11–14 October 2016; Proceedings, Part III 14. Springer: Berlin/Heidelberg, Germany, 2016; pp. 519–534. [Google Scholar]
- Ronneberger, O.; Fischer, P.; Brox, T. U-net: Convolutional networks for biomedical image segmentation. In Proceedings of the Medical Image Computing and Computer-Assisted Intervention–MICCAI 2015: 18th International Conference, Munich, Germany, 5–9 October 2015; Proceedings, Part III 18. Springer: Berlin/Heidelberg, Germany, 2015; pp. 234–241. [Google Scholar]
- Hu, J.; Shen, L.; Sun, G. Squeeze-and-excitation networks. In Proceedings of the IEEE Conference on Computer Vision and Pattern Recognition, Salt Lake City, UT, USA, 18–23 June 2018; pp. 7132–7141. [Google Scholar]
- Xiao, X.; Lian, S.; Luo, Z.; Li, S. Weighted res-unet for high-quality retina vessel segmentation. In Proceedings of the 2018 9th International Conference on Information Technology in Medicine and Education (ITME), Hangzhou, China, 19–21 October 2018; pp. 327–331. [Google Scholar]
- He, K.; Zhang, X.; Ren, S.; Sun, J. Deep residual learning for image recognition. In Proceedings of the IEEE Conference on Computer Vision and Pattern Recognition, Las Vegas, NV, USA, 27–30 June 2016; pp. 770–778. [Google Scholar]
- Woo, S.; Park, J.; Lee, J.Y.; Kweon, I.S. Cbam: Convolutional block attention module. In Proceedings of the European Conference on Computer Vision (ECCV), Munich, Germany, 8–14 September 2018; pp. 3–19. [Google Scholar]
- Fu, J.; Liu, J.; Tian, H.; Li, Y.; Bao, Y.; Fang, Z.; Lu, H. Dual attention network for scene segmentation. In Proceedings of the IEEE/CVF Conference on Computer Vision and Pattern Recognition, Long Beach, CA, USA, 15–20 June 2019; pp. 3146–3154. [Google Scholar]
- Ibtehaz, N.; Rahman, M.S. MultiResUNet: Rethinking the U-Net architecture for multimodal biomedical image segmentation. Neural Netw. 2020, 121, 74–87. [Google Scholar] [CrossRef]
- Nodirov, J.; Abdusalomov, A.B.; Whangbo, T.K. Attention 3D U-Net with Multiple Skip Connections for Segmentation of Brain Tumor Images. Sensors 2022, 22, 6501. [Google Scholar] [CrossRef]
- Colman, J.; Zhang, L.; Duan, W.; Ye, X. DR-Unet104 for Multimodal MRI brain tumor segmentation. In Proceedings of the Brainlesion: Glioma, Multiple Sclerosis, Stroke and Traumatic Brain Injuries: 6th International Workshop, BrainLes 2020, Held in Conjunction with MICCAI 2020, Lima, Peru, 4 October 2020; Revised Selected Papers, Part II 6. Springer: Berlin/Heidelberg, Germany, 2021; pp. 410–419. [Google Scholar]
- Abdullah, M.A.; Alkassar, S.; Jebur, B.; Chambers, J. LBTS-Net: A fast and accurate CNN model for brain tumour segmentation. Healthc. Technol. Lett. 2021, 8, 31–36. [Google Scholar] [CrossRef]
- Awasthi, N.; Pardasani, R.; Gupta, S. Multi-threshold attention u-net (mtau) based model for multimodal brain tumor segmentation in mri scans. In Proceedings of the Brainlesion: Glioma, Multiple Sclerosis, Stroke and Traumatic Brain Injuries: 6th International Workshop, BrainLes 2020, Held in Conjunction with MICCAI 2020, Lima, Peru, 4 October 2020; Revised Selected Papers, Part II 6. Springer: Berlin/Heidelberg, Germany, 2021; pp. 168–178. [Google Scholar]
- Xu, J.H.; Teng, W.P.K.; Wang, X.J.; Nürnberger, A. A deep supervised U-attention net for pixel-wise brain tumor segmentation. In Proceedings of the Brainlesion: Glioma, Multiple Sclerosis, Stroke and Traumatic Brain Injuries: 6th International Workshop, BrainLes 2020, Held in Conjunction with MICCAI 2020, Lima, Peru, 4 October 2020; Revised Selected Papers, Part II 6. Springer: Berlin/Heidelberg, Germany, 2021; pp. 278–289. [Google Scholar]
- Shelatkar, T.; Bansal, U. Diagnosis of Brain Tumor Using Light Weight Deep Learning Model with Fine Tuning Approach. In Proceedings of the International Conference on Machine Intelligence and Signal Processing, Virtual, 12–14 March 2022; Springer: Berlin/Heidelberg, Germany, 2022; pp. 105–114. [Google Scholar]
- Çiçek, Ö.; Abdulkadir, A.; Lienkamp, S.S.; Brox, T.; Ronneberger, O. 3D U-Net: Learning dense volumetric segmentation from sparse annotation. In Proceedings of the Medical Image Computing and Computer-Assisted Intervention–MICCAI 2016: 19th International Conference, Athens, Greece, 17–21 October 2016; Proceedings, Part II 19. Springer: Berlin/Heidelberg, Germany, 2016; pp. 424–432. [Google Scholar]
- Deng, Y.; Hou, Y.; Yan, J.; Zeng, D. ELU-net: An efficient and lightweight U-net for medical image segmentation. IEEE Access 2022, 10, 35932–35941. [Google Scholar] [CrossRef]
- Zhou, Z.; Rahman Siddiquee, M.M.; Tajbakhsh, N.; Liang, J. Unet++: A nested u-net architecture for medical image segmentation. In Proceedings of the Deep Learning in Medical Image Analysis and Multimodal Learning for Clinical Decision Support: 4th International Workshop, DLMIA 2018, and 8th International Workshop, ML-CDS 2018, Held in Conjunction with MICCAI 2018, Granada, Spain, 20 September 2018; Proceedings 4. Springer: Berlin/Heidelberg, Germany, 2018; pp. 3–11. [Google Scholar]
- Liu, C.; Si, W.; Qian, Y.; Liao, X.; Wang, Q.; Guo, Y.; Heng, P.A. Multipath densely connected convolutional neural network for brain tumor segmentation. In Proceedings of the Brainlesion: Glioma, Multiple Sclerosis, Stroke and Traumatic Brain Injuries: 4th International Workshop, BrainLes 2018, Held in Conjunction with MICCAI 2018, Granada, Spain, 16 September 2018; Revised Selected Papers, Part I 4. Springer: Berlin/Heidelberg, Germany, 2019; pp. 81–91. [Google Scholar]
- Zhao, H.; Shi, J.; Qi, X.; Wang, X.; Jia, J. Pyramid scene parsing network. In Proceedings of the IEEE Conference on Computer Vision and Pattern Recognition, Honolulu, HI, USA, 21–26 July 2017; pp. 2881–2890. [Google Scholar]
- Wang, X.; Girshick, R.; Gupta, A.; He, K. Non-local neural networks. In Proceedings of the IEEE Conference on Computer Vision and Pattern Recognition, Salt Lake City, UT, USA, 18–23 June 2018; pp. 7794–7803. [Google Scholar]
- Sinha, A.; Dolz, J. Multi-scale self-guided attention for medical image segmentation. IEEE J. Biomed. Health Inform. 2020, 25, 121–130. [Google Scholar] [CrossRef] [PubMed]
- Shi, J.; Zhang, R.; Guo, L.; Gao, L.; Li, Y.; Ma, H.; Wang, J. Dual dense context-aware network for hippocampal segmentation. Biomed. Signal Process. Control. 2020, 61, 102038. [Google Scholar] [CrossRef]
- Jetley, S.; Lord, N.A.; Lee, N.; Torr, P.H. Learn to pay attention. arXiv 2018, arXiv:1804.02391. [Google Scholar]
- Wang, Y.; Deng, Z.; Hu, X.; Zhu, L.; Yang, X.; Xu, X.; Heng, P.A.; Ni, D. Deep attentional features for prostate segmentation in ultrasound. In Proceedings of the Medical Image Computing and Computer Assisted Intervention–MICCAI 2018: 21st International Conference, Granada, Spain, 16–20 September 2018; Proceedings, Part IV 11. Springer: Berlin/Heidelberg, Germany, 2018; pp. 523–530. [Google Scholar]
- Zhou, T.; Canu, S.; Vera, P.; Ruan, S. Latent correlation representation learning for brain tumor segmentation with missing MRI modalities. IEEE Trans. Image Process. 2021, 30, 4263–4274. [Google Scholar] [CrossRef]
- Mazumdar, I.; Mukherjee, J. Fully automatic MRI brain tumor segmentation using efficient spatial attention convolutional networks with composite loss. Neurocomputing 2022, 500, 243–254. [Google Scholar] [CrossRef]
- Valanarasu, J.M.J.; Oza, P.; Hacihaliloglu, I.; Patel, V.M. Medical transformer: Gated axial-attention for medical image segmentation. In Proceedings of the Medical Image Computing and Computer Assisted Intervention–MICCAI 2021: 24th International Conference, Strasbourg, France, 27 September–1 October 2021; Proceedings, Part I 24. Springer: Berlin/Heidelberg, Germany, 2021; pp. 36–46. [Google Scholar]
- Jiang, Y.; Zhang, Y.; Lin, X.; Dong, J.; Cheng, T.; Liang, J. SwinBTS: A method for 3D multimodal brain tumor segmentation using swin transformer. Brain Sci. 2022, 12, 797. [Google Scholar] [CrossRef] [PubMed]
- Bahdanau, D.; Cho, K.; Bengio, Y. Neural machine translation by jointly learning to align and translate. arXiv 2014, arXiv:1409.0473. [Google Scholar]
- Shen, T.; Zhou, T.; Long, G.; Jiang, J.; Pan, S.; Zhang, C. Disan: Directional self-attention network for rnn/cnn-free language understanding. In Proceedings of the AAAI Conference on Artificial Intelligence, New Orleans, LA, USA, 2–7 February 2018; Volume 32. [Google Scholar]
- Cai, Y.; Wang, Y. Ma-unet: An improved version of unet based on multi-scale and attention mechanism for medical image segmentation. In Proceedings of the Third International Conference on Electronics and Communication; Network and Computer Technology (ECNCT 2021), Xiamen, China, 3–5 December 2021; SPIE: Bellingham, WA, USA, 2022; Volume 12167, pp. 205–211. [Google Scholar]
- Shehab, L.H.; Fahmy, O.M.; Gasser, S.M.; El-Mahallawy, M.S. An efficient brain tumor image segmentation based on deep residual networks (ResNets). J. King Saud-Univ.-Eng. Sci. 2021, 33, 404–412. [Google Scholar] [CrossRef]
- Liu, Z.; Huang, J.; Zhu, C.; Peng, X.; Du, X. Residual attention network using multi-channel dense connections for image super-resolution. Appl. Intell. 2021, 51, 85–99. [Google Scholar] [CrossRef]
- Zhou, T. Modality-level cross-connection and attentional feature fusion based deep neural network for multi-modal brain tumor segmentation. Biomed. Signal Process. Control. 2023, 81, 104524. [Google Scholar] [CrossRef]
- Liang, J.; Yang, C.; Zeng, M.; Wang, X. TransConver: Transformer and convolution parallel network for developing automatic brain tumor segmentation in MRI images. Quant. Imaging Med. Surg. 2022, 12, 2397. [Google Scholar] [CrossRef]
- Akbar, A.S.; Fatichah, C.; Suciati, N. Single level UNet3D with multipath residual attention block for brain tumor segmentation. J. King Saud-Univ.-Comput. Inf. Sci. 2022, 34, 3247–3258. [Google Scholar] [CrossRef]
- Myronenko, A. 3D MRI brain tumor segmentation using autoencoder regularization. In Proceedings of the Brainlesion: Glioma, Multiple Sclerosis, Stroke and Traumatic Brain Injuries: 4th International Workshop, BrainLes 2018, Held in Conjunction with MICCAI 2018, Granada, Spain, 16 September 2018; Revised Selected Papers, Part II 4. Springer: Berlin/Heidelberg, Germany, 2019; pp. 311–320. [Google Scholar]
- Allah, A.M.G.; Sarhan, A.M.; Elshennawy, N.M. Edge U-Net: Brain tumor segmentation using MRI based on deep U-Net model with boundary information. Expert Syst. Appl. 2023, 213, 118833. [Google Scholar] [CrossRef]
- Luo, Z.; Jia, Z.; Yuan, Z.; Peng, J. HDC-Net: Hierarchical decoupled convolution network for brain tumor segmentation. IEEE J. Biomed. Health Inform. 2020, 25, 737–745. [Google Scholar] [CrossRef] [PubMed]
- Chen, C.; Liu, X.; Ding, M.; Zheng, J.; Li, J. 3D dilated multi-fiber network for real-time brain tumor segmentation in MRI. In Proceedings of the Medical Image Computing and Computer Assisted Intervention–MICCAI 2019: 22nd International Conference, Shenzhen, China, 13–17 October 2019; Proceedings, Part III 22. Springer: Berlin/Heidelberg, Germany, 2019; pp. 184–192. [Google Scholar]
- Zhang, Y.; Lu, Y.; Chen, W.; Chang, Y.; Gu, H.; Yu, B. MSMANet: A multi-scale mesh aggregation network for brain tumor segmentation. Appl. Soft Comput. 2021, 110, 107733. [Google Scholar] [CrossRef]
- Dong, H.; Yang, G.; Liu, F.; Mo, Y.; Guo, Y. Automatic brain tumor detection and segmentation using U-Net based fully convolutional networks. In Proceedings of the Medical Image Understanding and Analysis: 21st Annual Conference, MIUA 2017, Edinburgh, UK, 11–13 July 2017; Proceedings 21. Springer: Berlin/Heidelberg, Germany, 2017; pp. 506–517. [Google Scholar]
- Alom, M.Z.; Yakopcic, C.; Hasan, M.; Taha, T.M.; Asari, V.K. Recurrent residual U-Net for medical image segmentation. J. Med. Imaging 2019, 6, 014006. [Google Scholar] [CrossRef]
- Agravat, R.R.; Raval, M.S. 3D semantic segmentation of brain tumor for overall survival prediction. In Proceedings of the International MICCAI Brainlesion Workshop, Lima, Peru, 4 October 2020; Springer: Berlin/Heidelberg, Germany, 2020; pp. 215–227. [Google Scholar]
- Wang, W.; Chen, C.; Ding, M.; Yu, H.; Zha, S.; Li, J. Transbts: Multimodal brain tumor segmentation using transformer. In Proceedings of the Medical Image Computing and Computer Assisted Intervention–MICCAI 2021: 24th International Conference, Strasbourg, France, 27 September–1 October 2021; Proceedings, Part I 24. Springer: Berlin/Heidelberg, Germany, 2021; pp. 109–119. [Google Scholar]
- Zhang, R.; Jia, S.; Adamu, M.J.; Nie, W.; Li, Q.; Wu, T. HMNet: Hierarchical Multi-Scale Brain Tumor Segmentation Network. J. Clin. Med. 2023, 12, 538. [Google Scholar] [CrossRef]
- Munir, K.; Frezza, F.; Rizzi, A. Deep Learning Hybrid Techniques for Brain Tumor Segmentation. Sensors 2022, 22, 8201. [Google Scholar] [CrossRef] [PubMed]
- Sheng, N.; Liu, D.; Zhang, J.; Che, C.; Zhang, J. Second-order ResU-Net for automatic MRI brain tumor segmentation. Math. Biosci. Eng. 2021, 18, 4943–4960. [Google Scholar] [CrossRef] [PubMed]
- Valanarasu, J.M.J.; Sindagi, V.A.; Hacihaliloglu, I.; Patel, V.M. Kiu-net: Overcomplete convolutional architectures for biomedical image and volumetric segmentation. IEEE Trans. Med. Imaging 2021, 41, 965–976. [Google Scholar] [CrossRef] [PubMed]
- Rosas-Gonzalez, S.; Birgui-Sekou, T.; Hidane, M.; Zemmoura, I.; Tauber, C. Asymmetric ensemble of asymmetric U-net models for brain tumor segmentation with uncertainty estimation. Front. Neurol. 2021, 12, 609646. [Google Scholar] [CrossRef] [PubMed]
- Raza, R.; Bajwa, U.I.; Mehmood, Y.; Anwar, M.W.; Jamal, M.H. dResU-Net: 3D deep residual U-Net based brain tumor segmentation from multimodal MRI. Biomed. Signal Process. Control. 2023, 79, 103861. [Google Scholar] [CrossRef]
Figure 1.
MRI images of brain tumors across various modalities. The original images are presented in the first row, while the images modified using our a contrast-adjusted algorithm [3] are displayed in the subsequent row. (a) FLAIR, (b) T1, (c) T1ce, (d) T2, and (e) ground truth.
Figure 1.
MRI images of brain tumors across various modalities. The original images are presented in the first row, while the images modified using our a contrast-adjusted algorithm [3] are displayed in the subsequent row. (a) FLAIR, (b) T1, (c) T1ce, (d) T2, and (e) ground truth.

Figure 2.
Overall structure of the proposed model.

Figure 3.
Visual results of original and adjusted images. (a) FLAIR, (b) T1, (c) T1ce, (d) T2, and (e) ground truth.
Figure 3.
Visual results of original and adjusted images. (a) FLAIR, (b) T1, (c) T1ce, (d) T2, and (e) ground truth.

Figure 4.
Structure of the residual unit.

Figure 5.
Comparison of the structure between the original convolutional module and the deep residual module.
Figure 5.
Comparison of the structure between the original convolutional module and the deep residual module.

Figure 6.
Graphical representation of threefold attention block.

Figure 7.
Example of changes in loss function, batch size, and epochs.

Figure 8.
Quantitative scores of our approach against prior methods by utilizing the Precision and Recall metrics using the BRATS2018 dataset.
Figure 8.
Quantitative scores of our approach against prior methods by utilizing the Precision and Recall metrics using the BRATS2018 dataset.

Figure 9.
Segmentation results for brain tumors using our proposed model. (a) FLAIR, (b) T1, (c) T1ce, (d) T2, (e) our obtained results, and (f) ground truth. The colors in the segmentation images signify different conditions: green represents edema; yellow indicates an enhancing tumor; and red denotes both necrosis and non-enhancing regions.

Figure 10.
Comparison of segmentation results attained by proposed model and previous models. (a,f) Input image, (b,g) HMNet [55], (c,h) TransConver [44], (d,i) ours, and (e,j) ground truth.


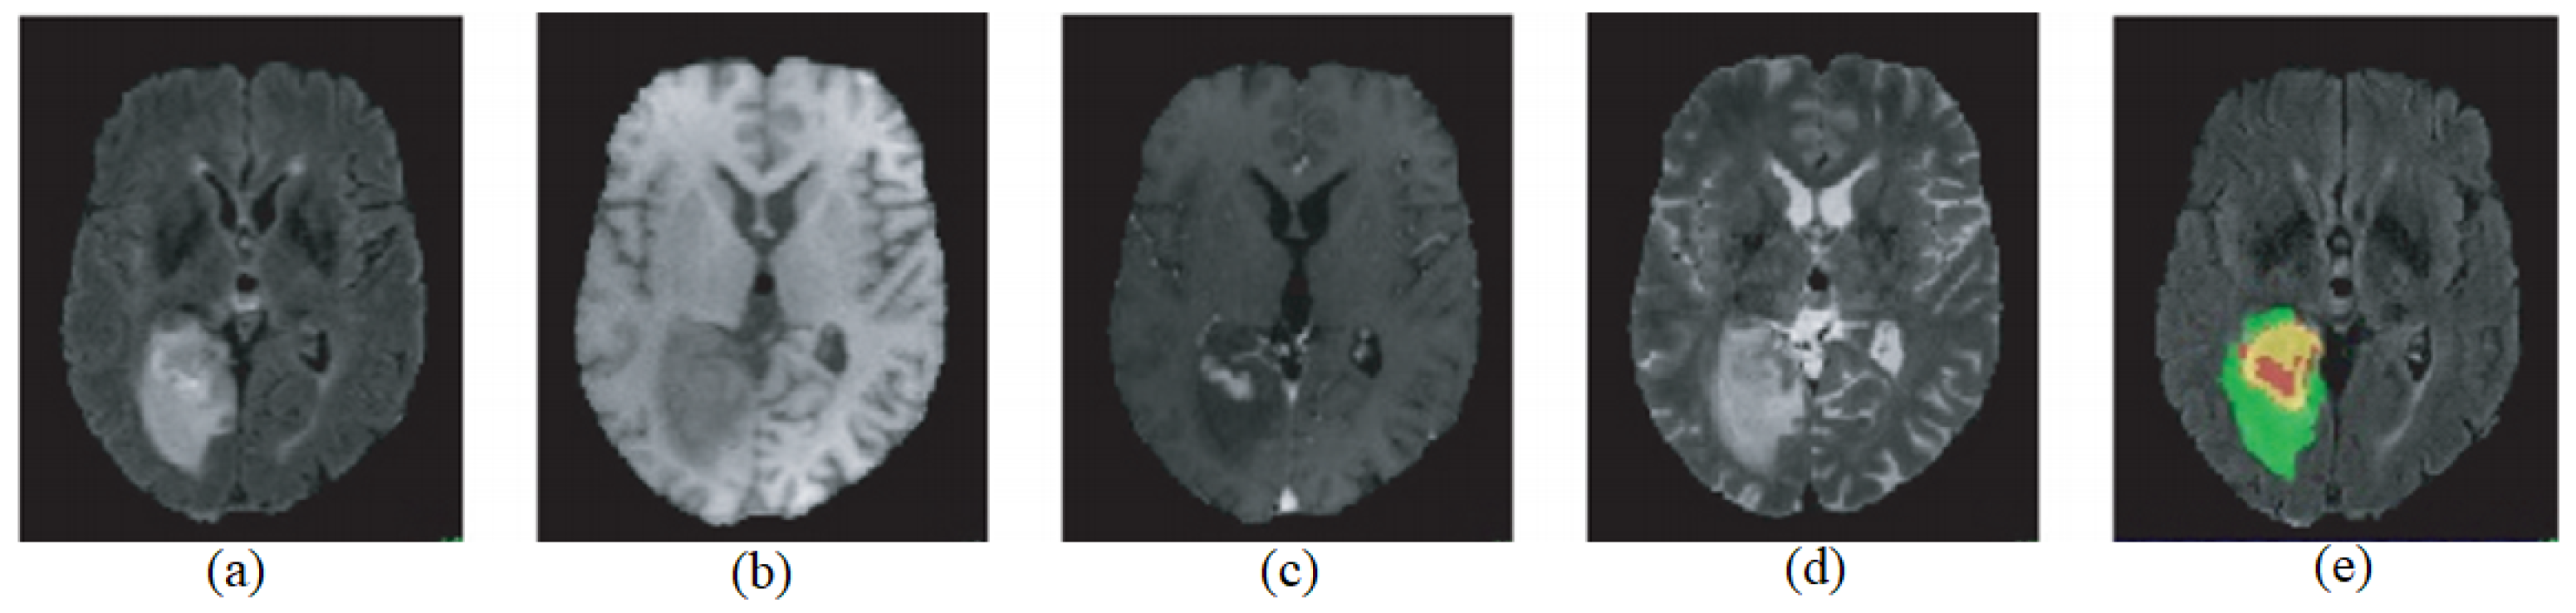
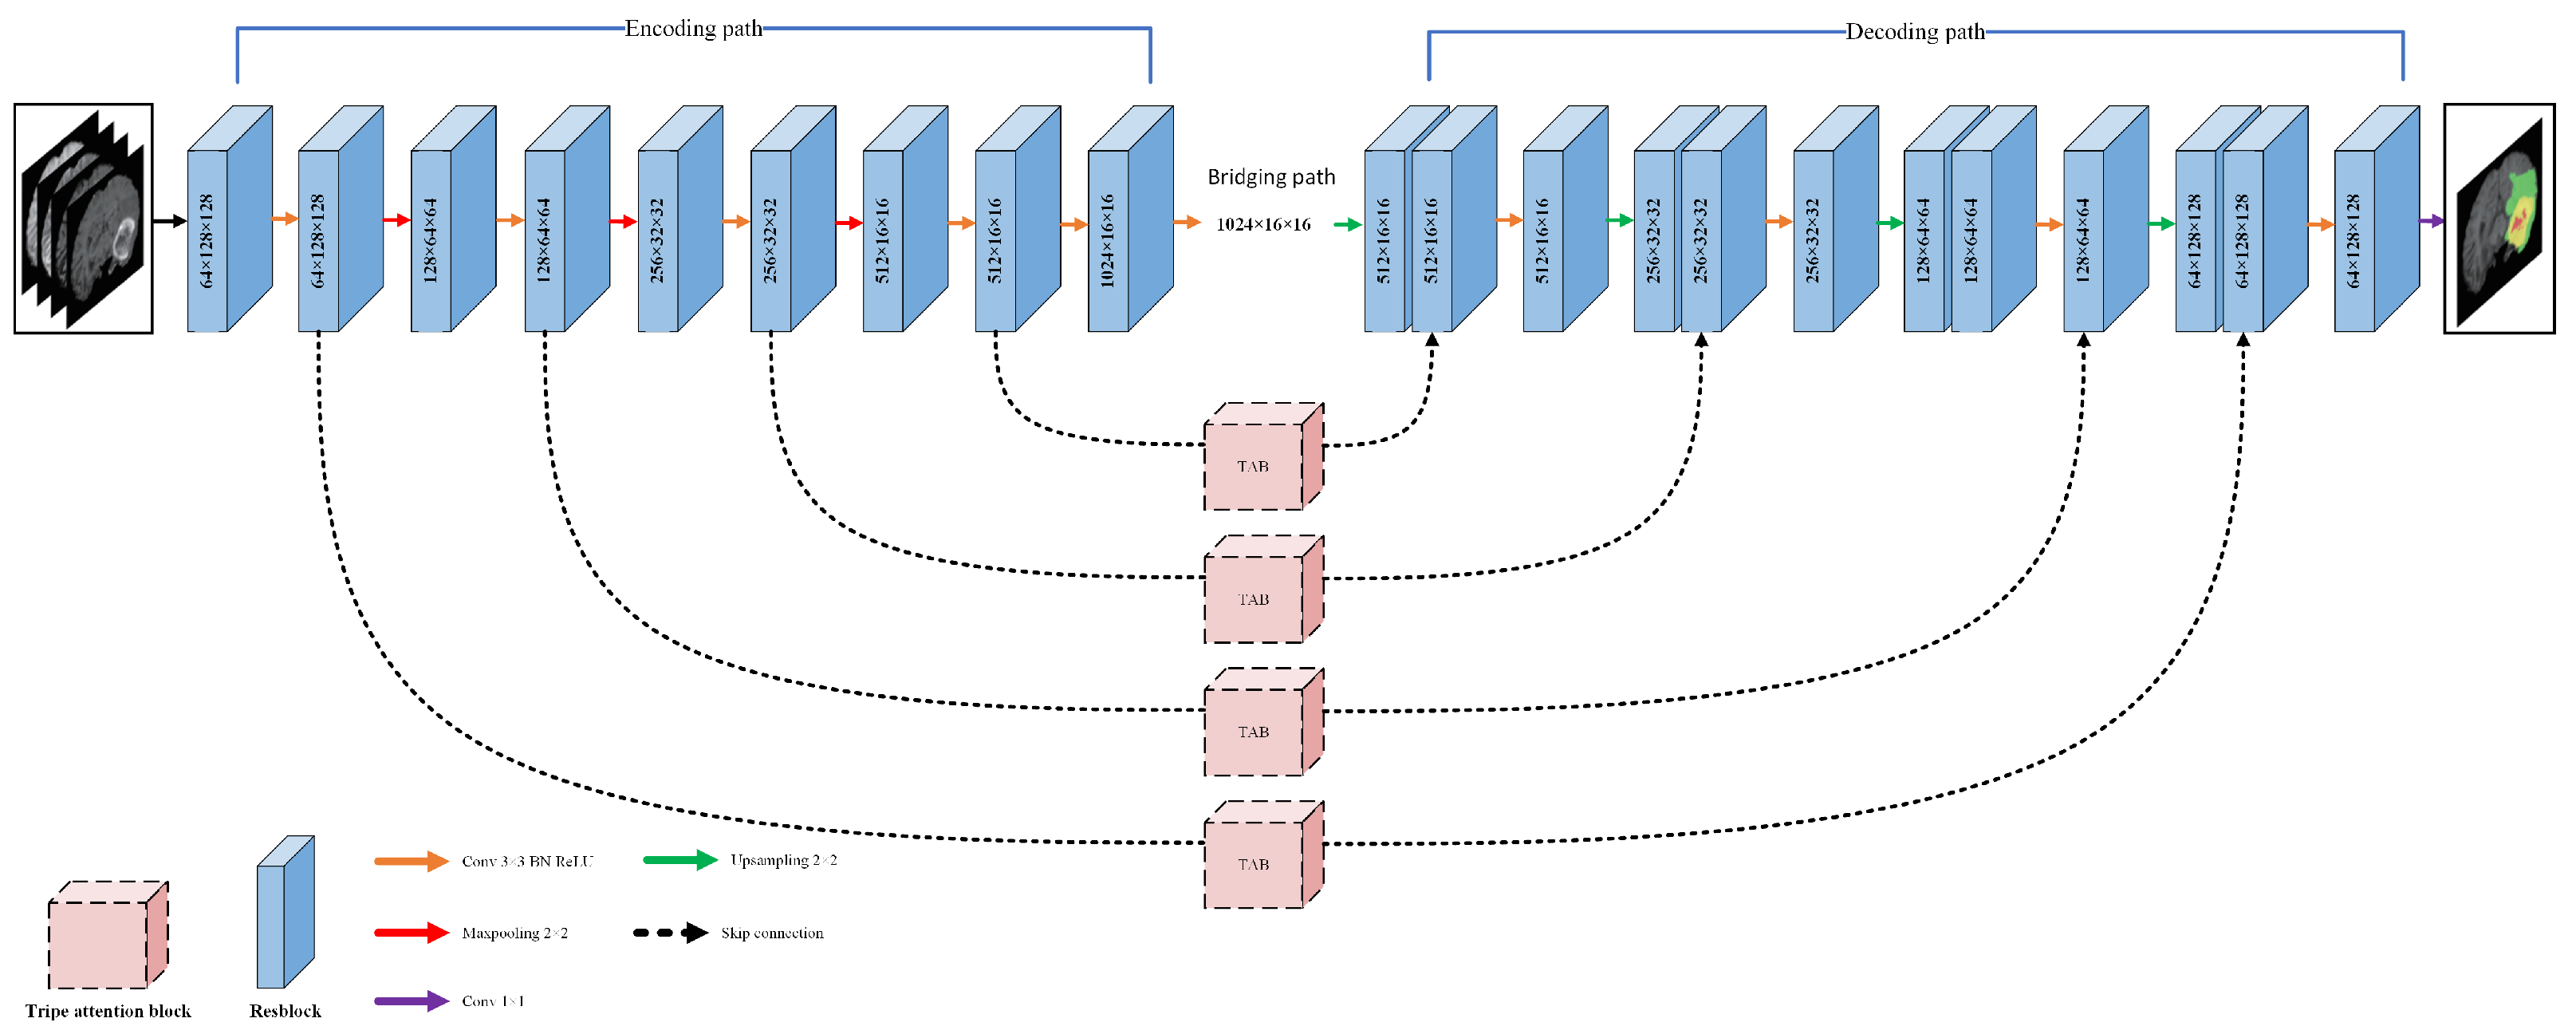
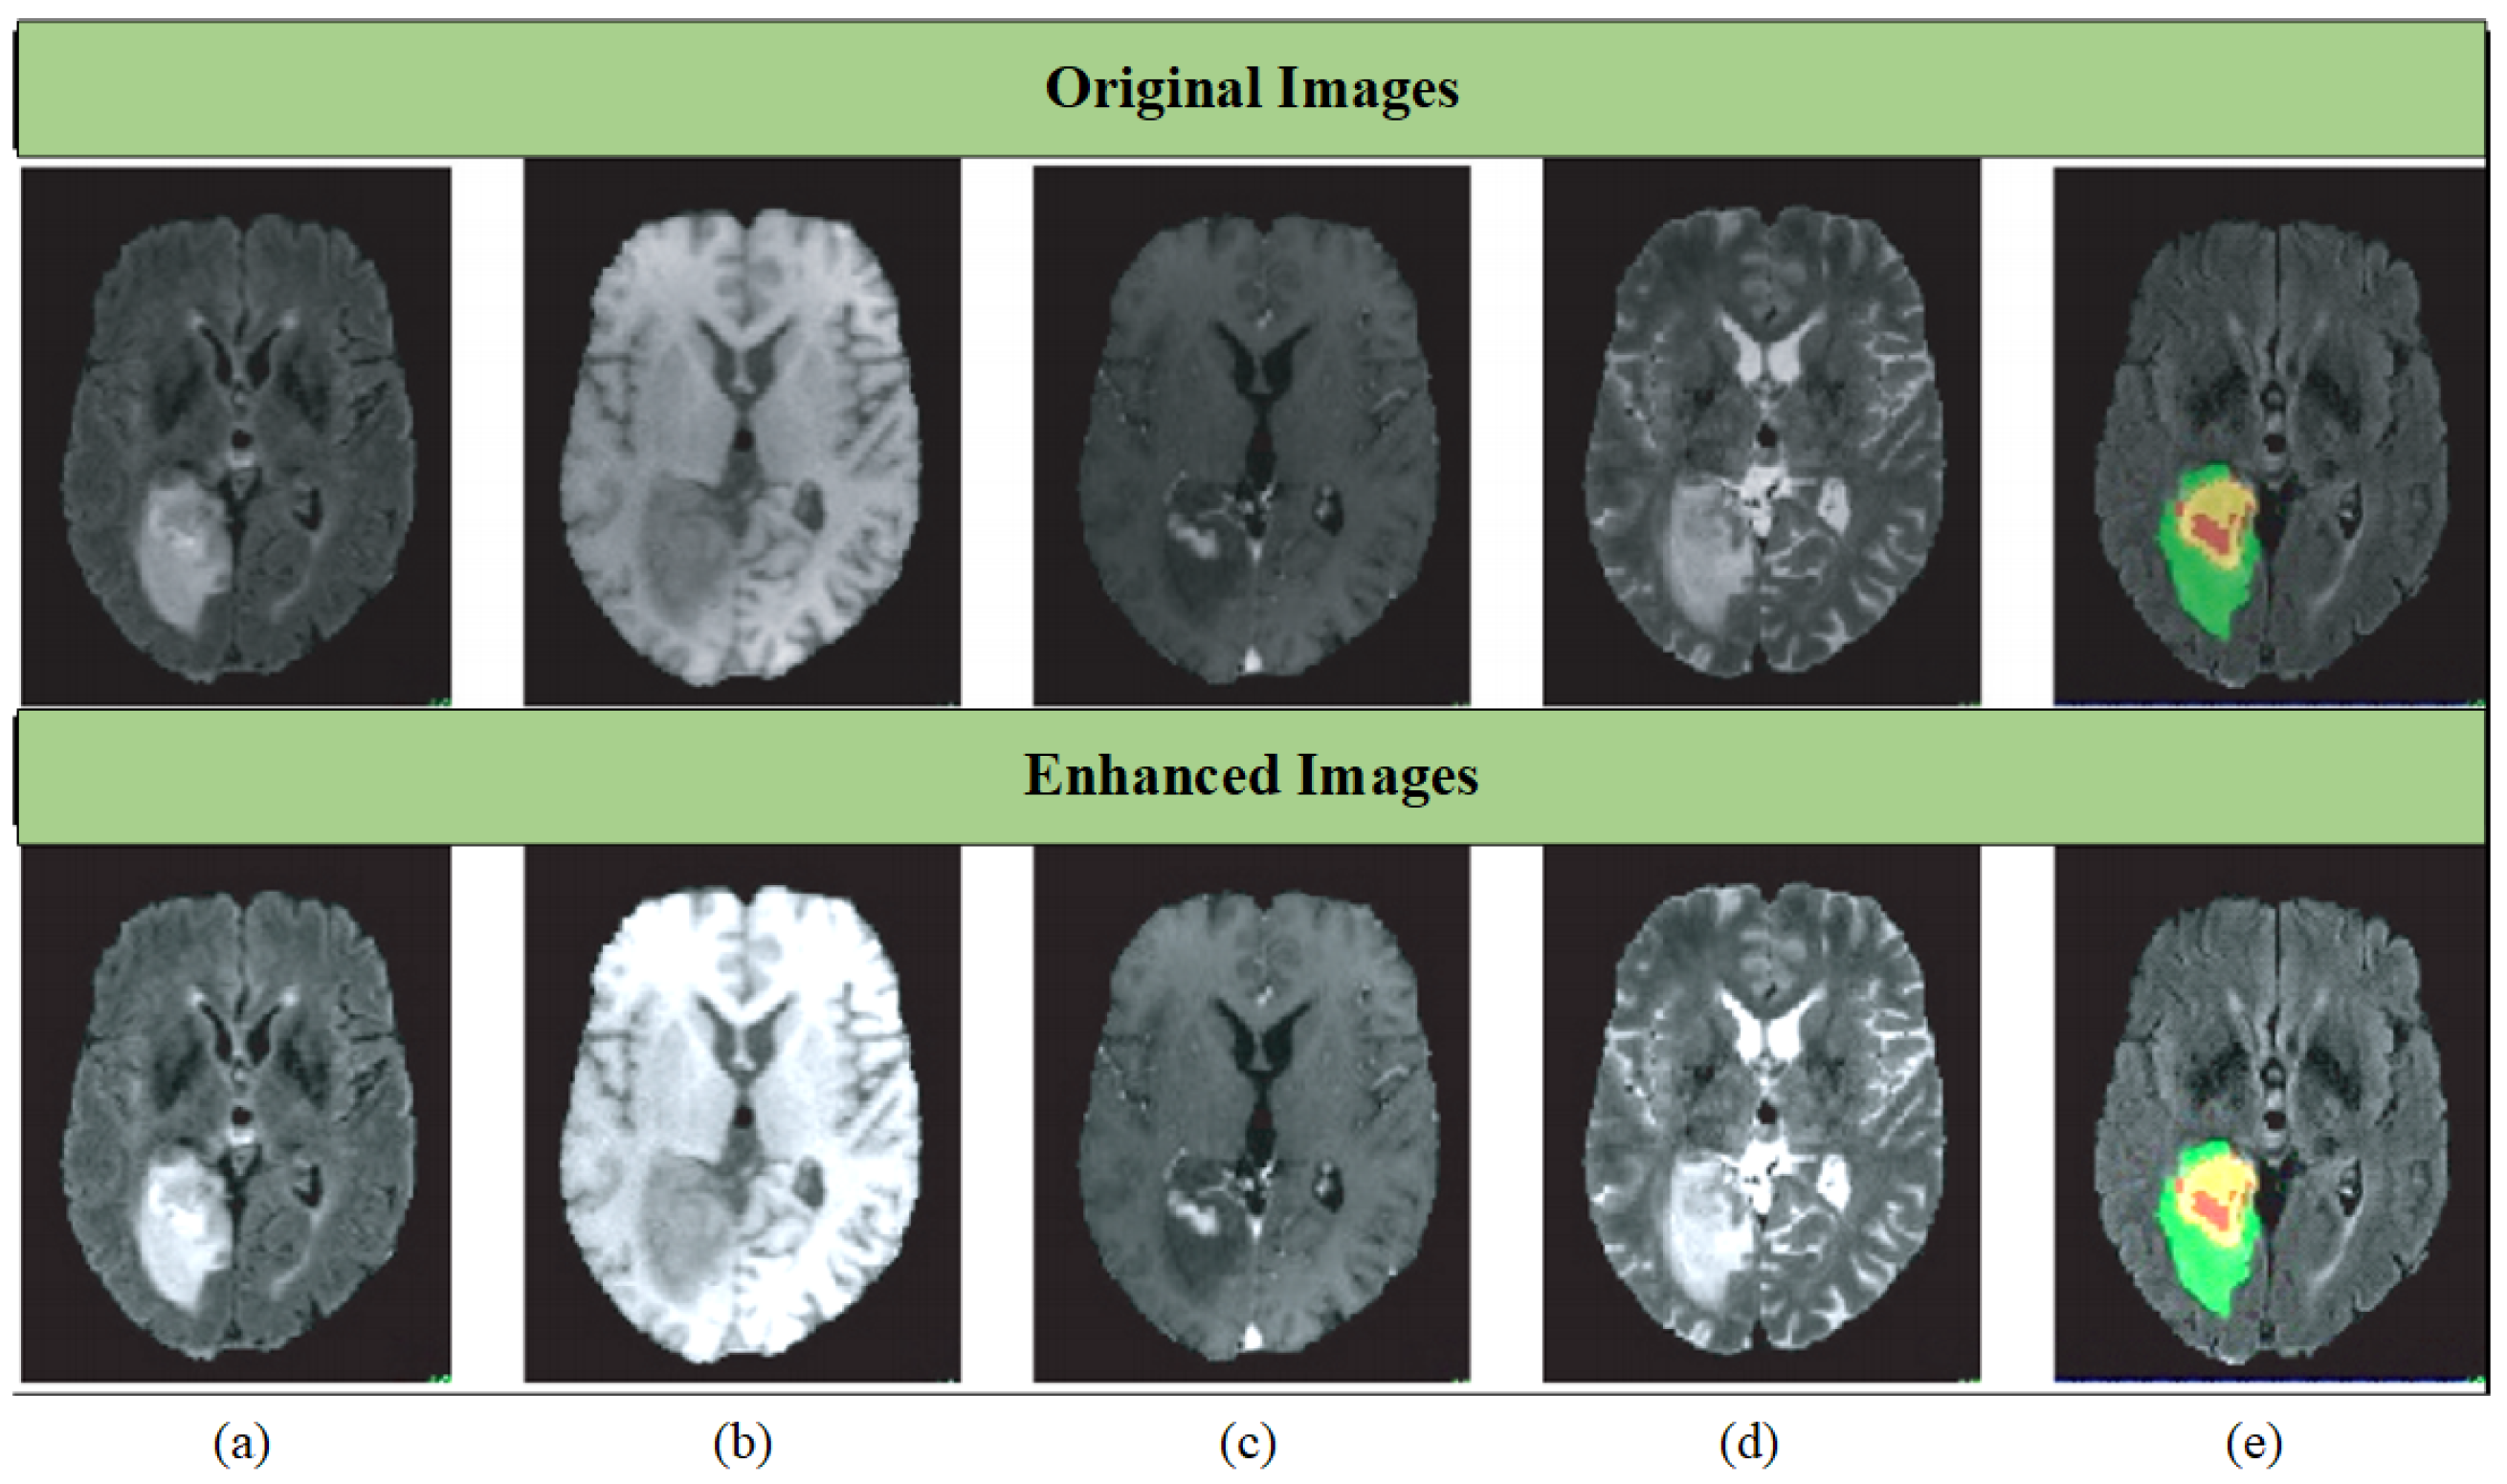
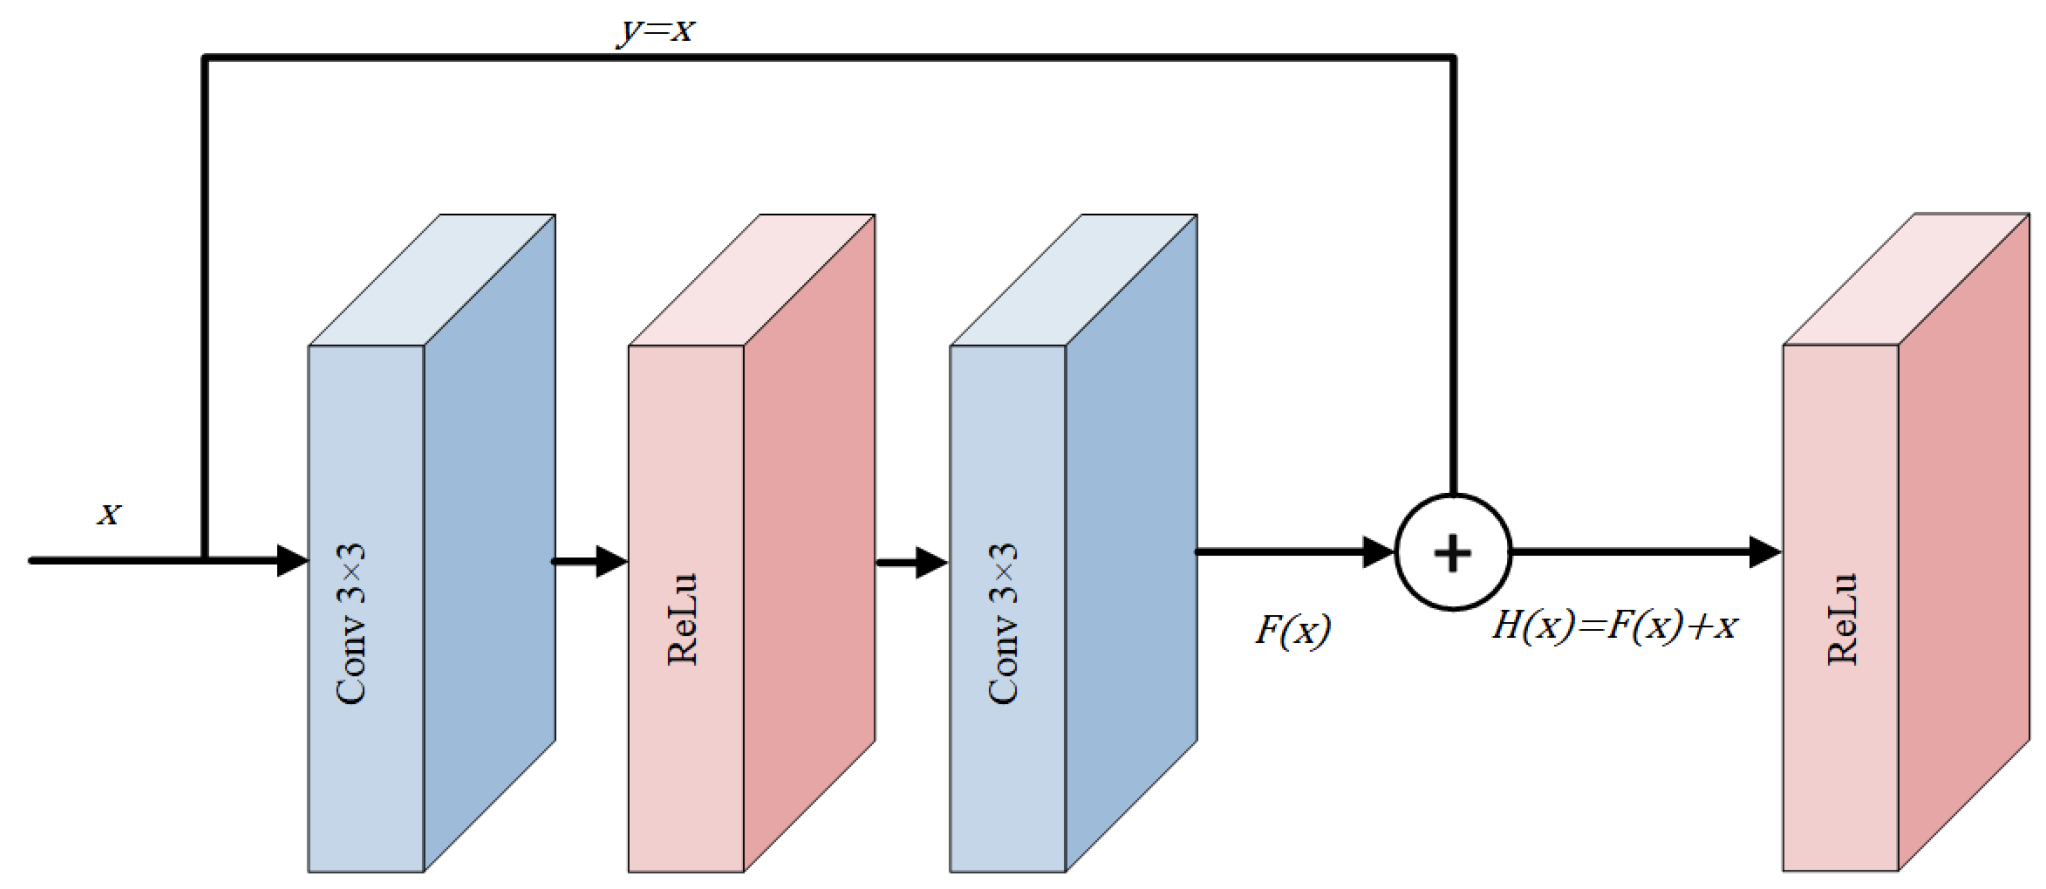
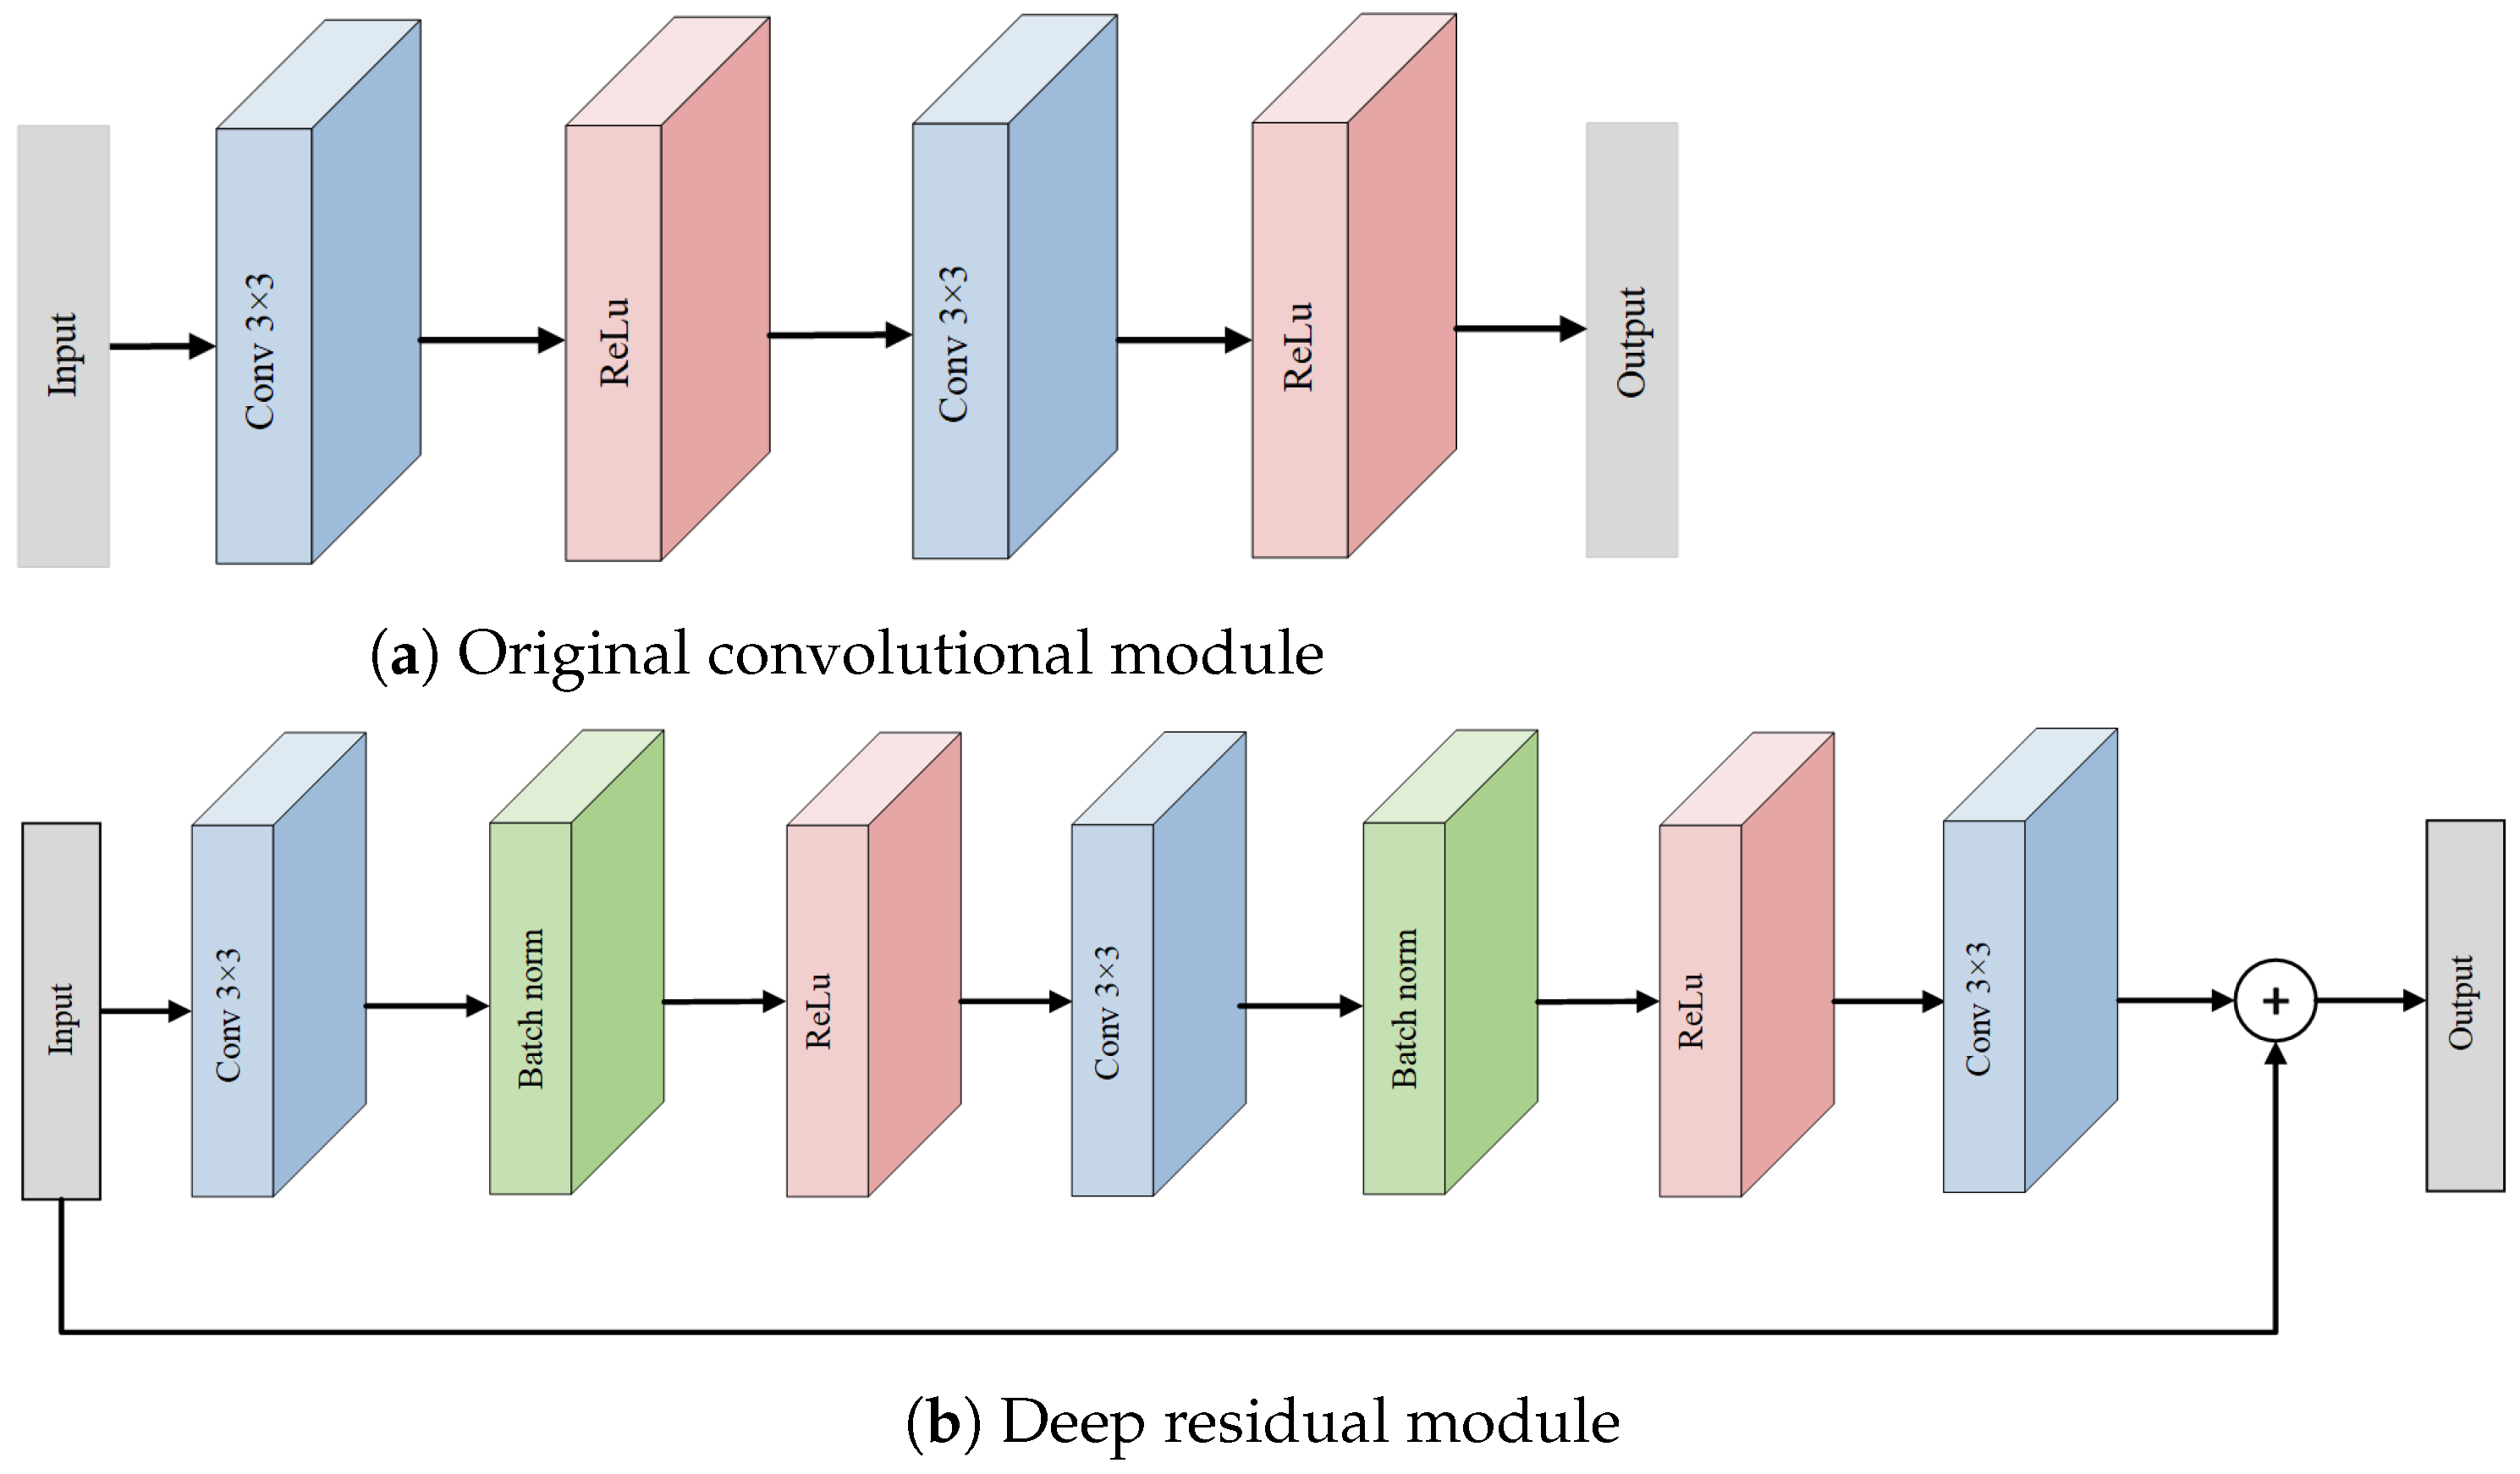
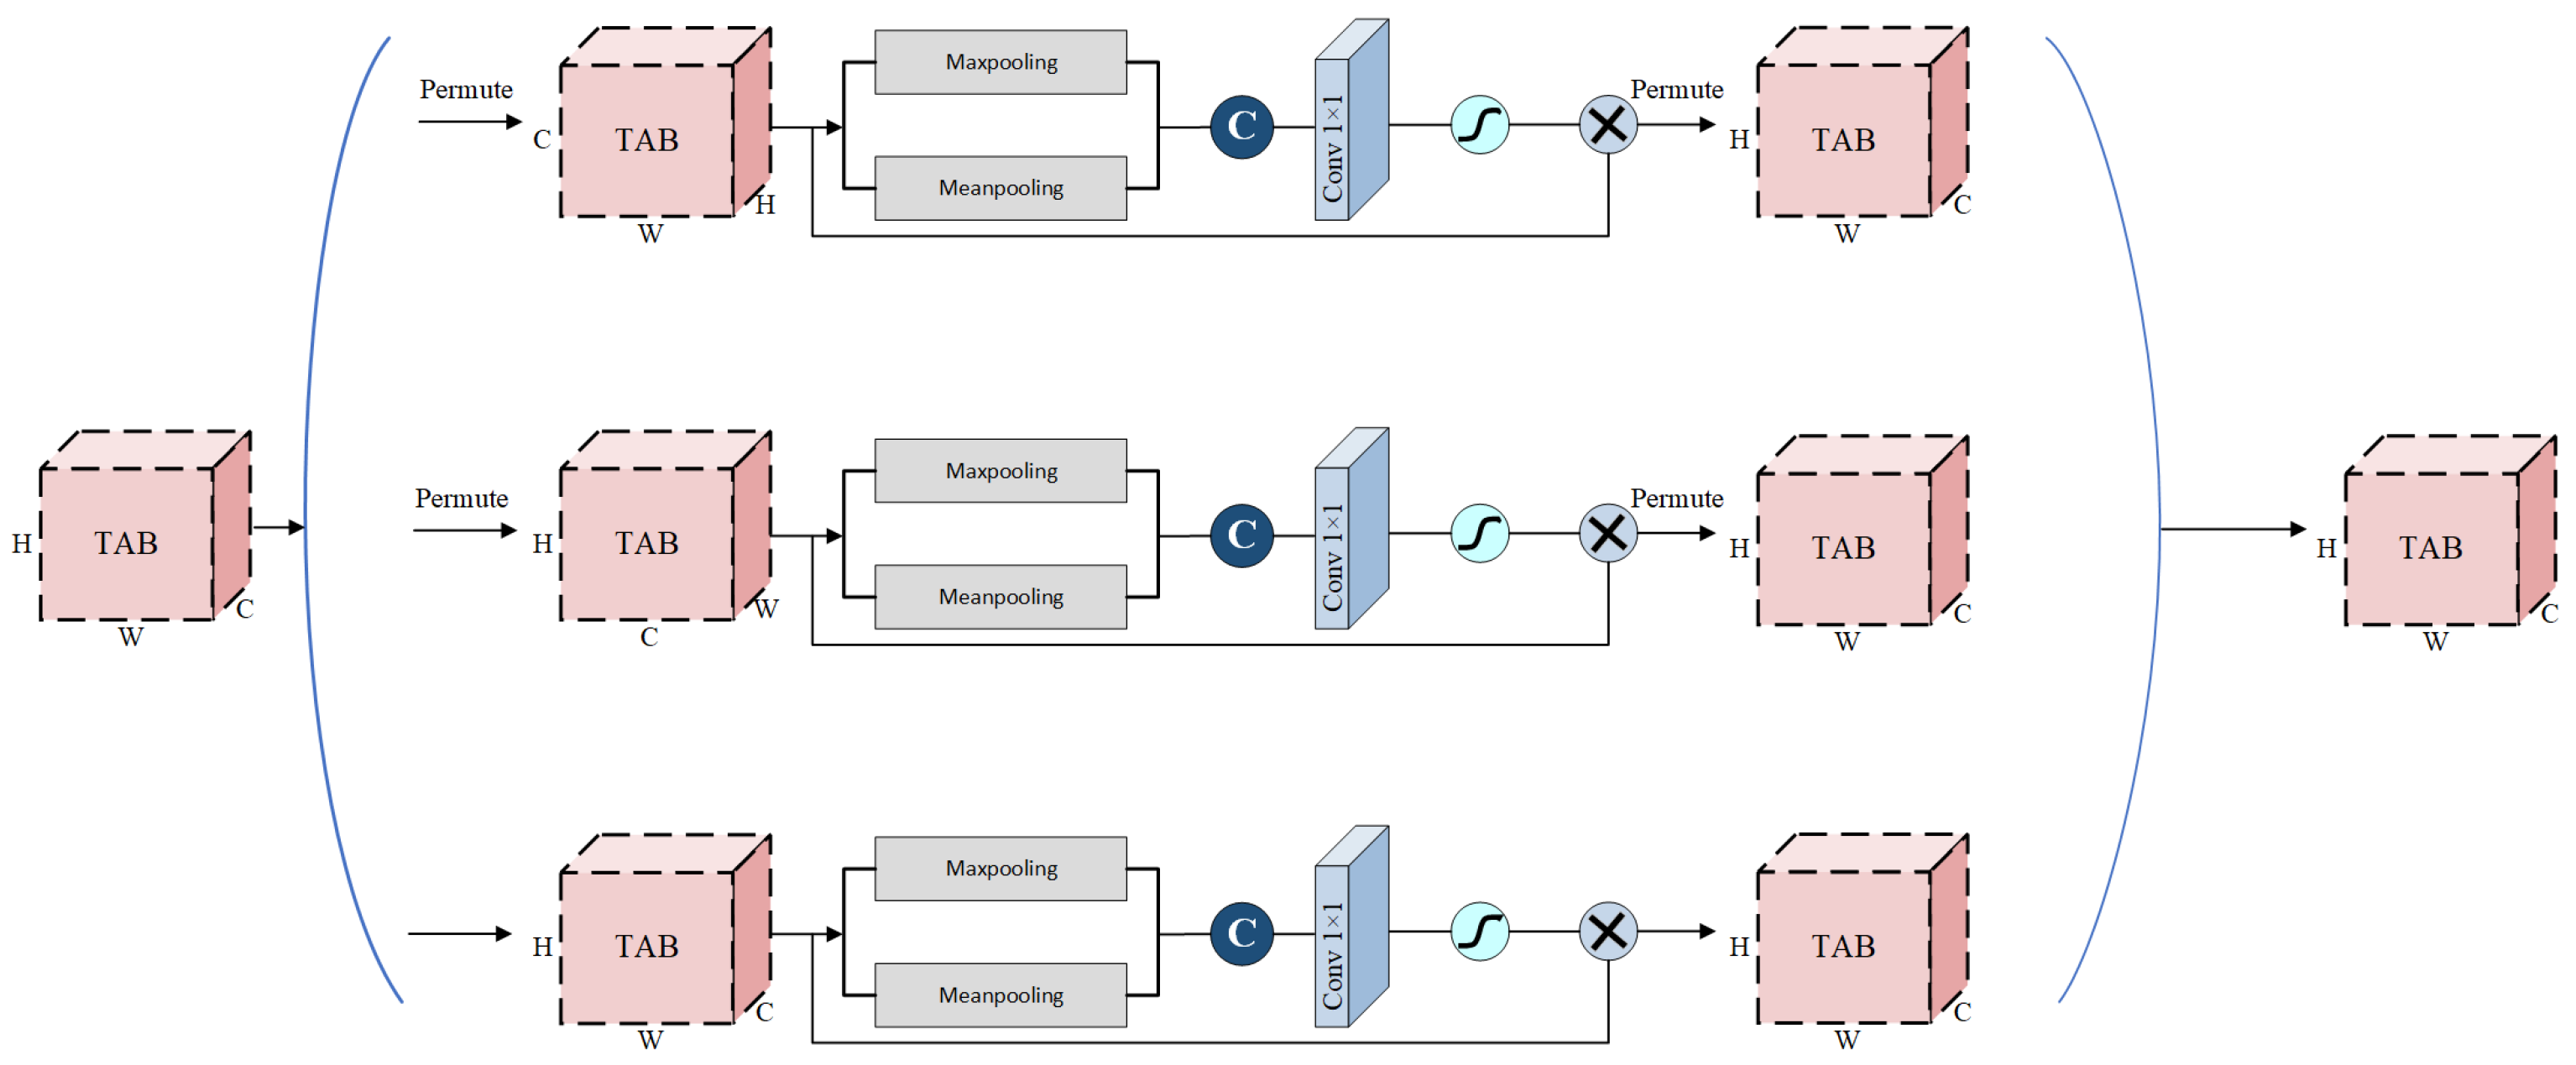
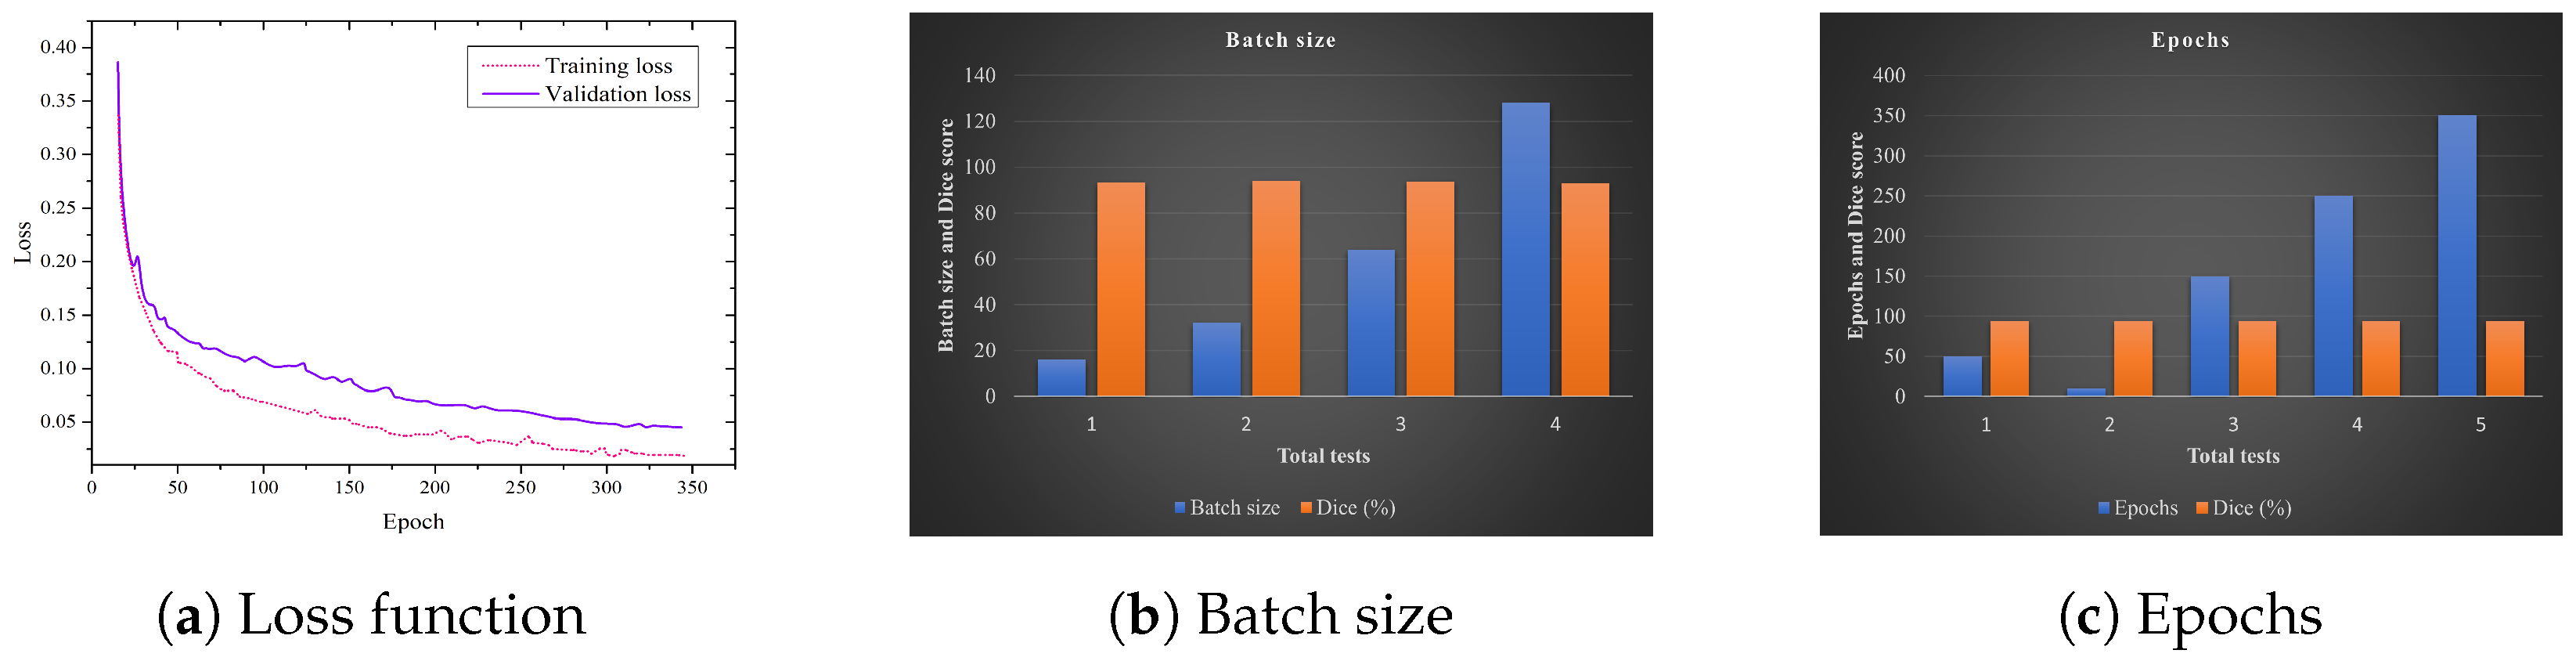
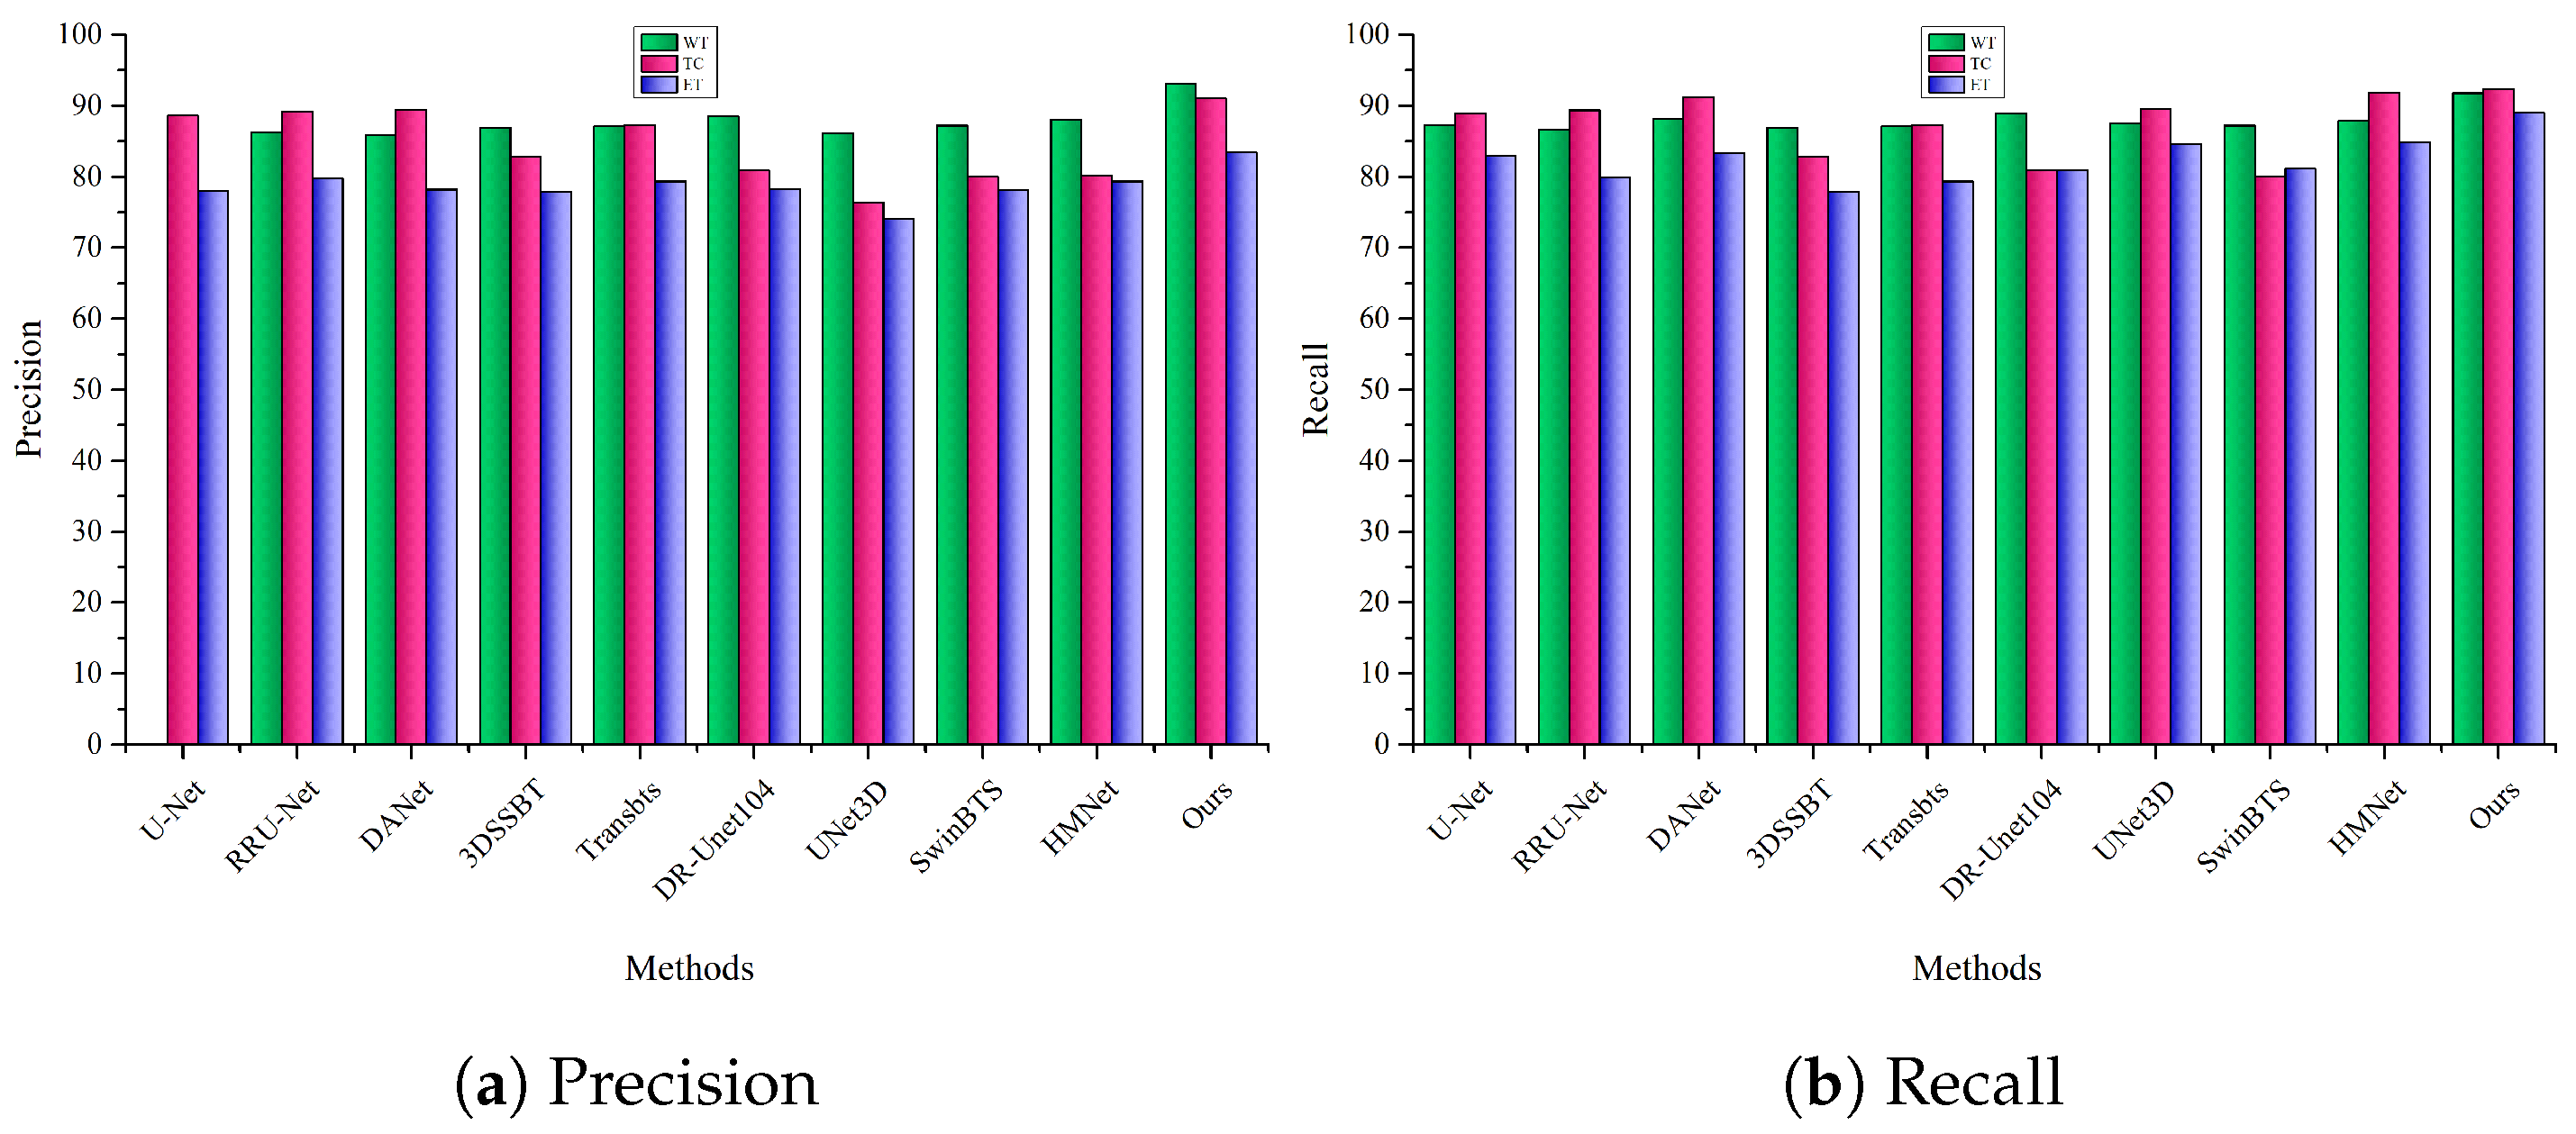
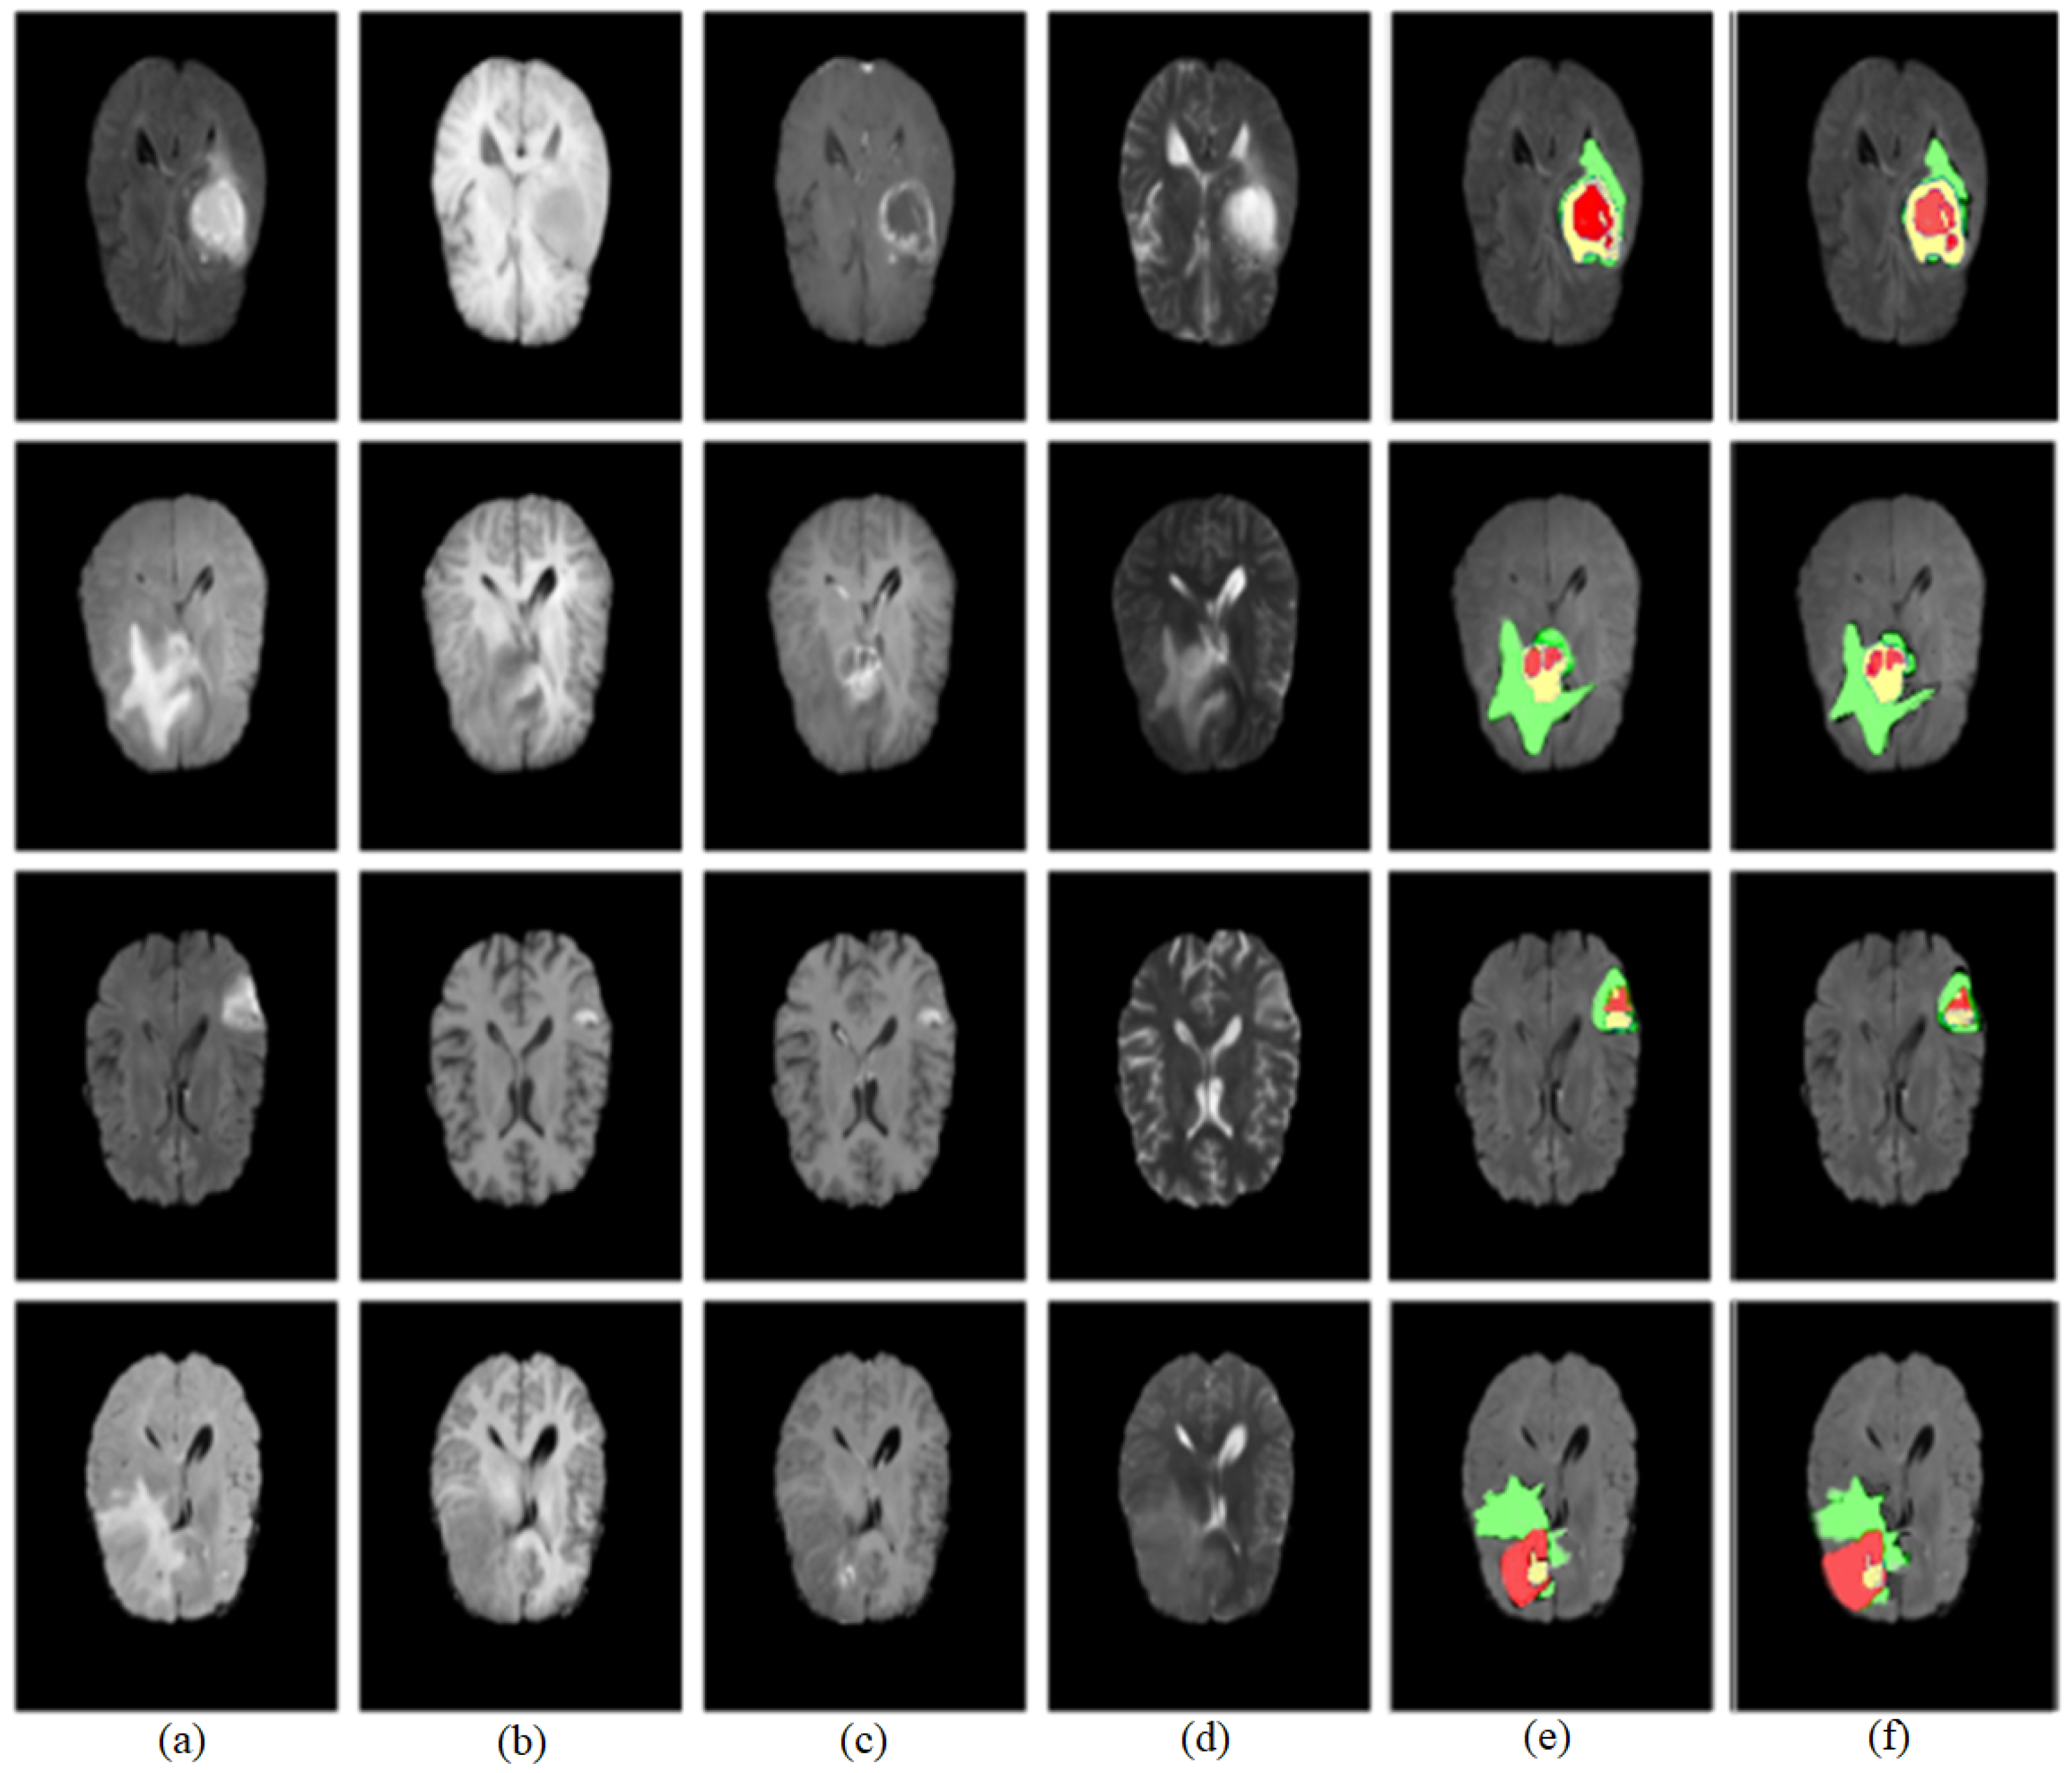
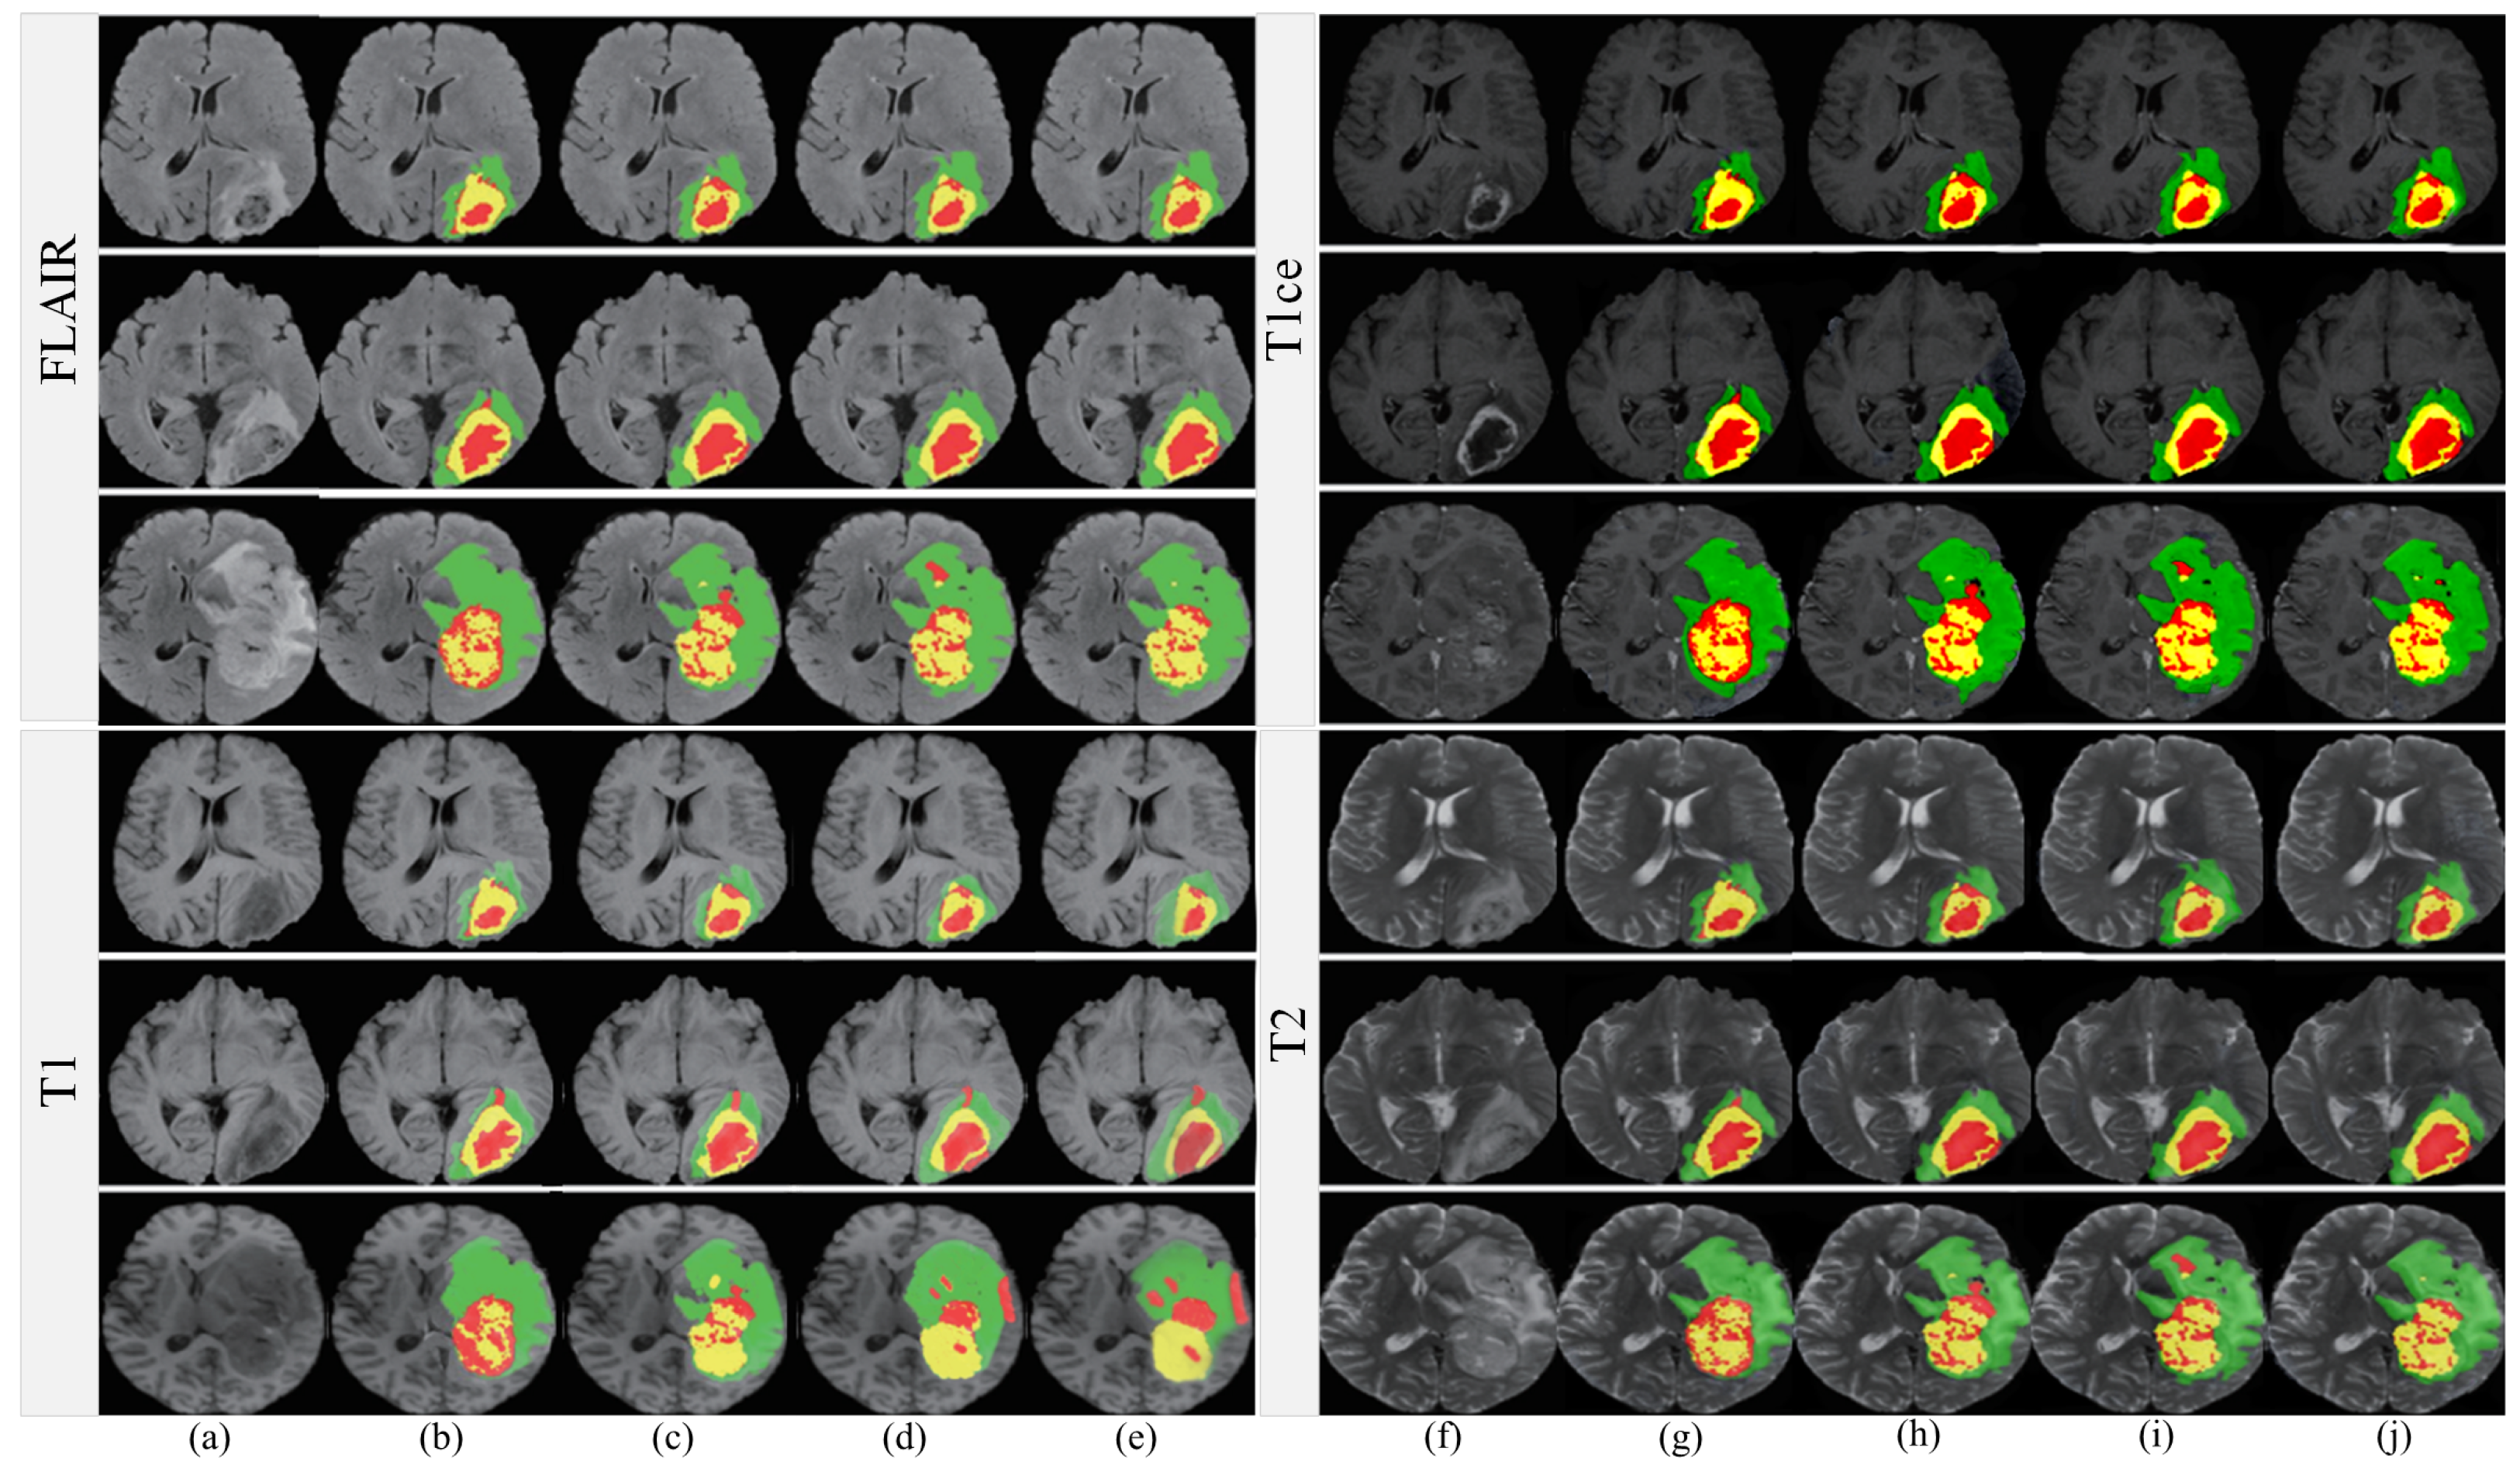
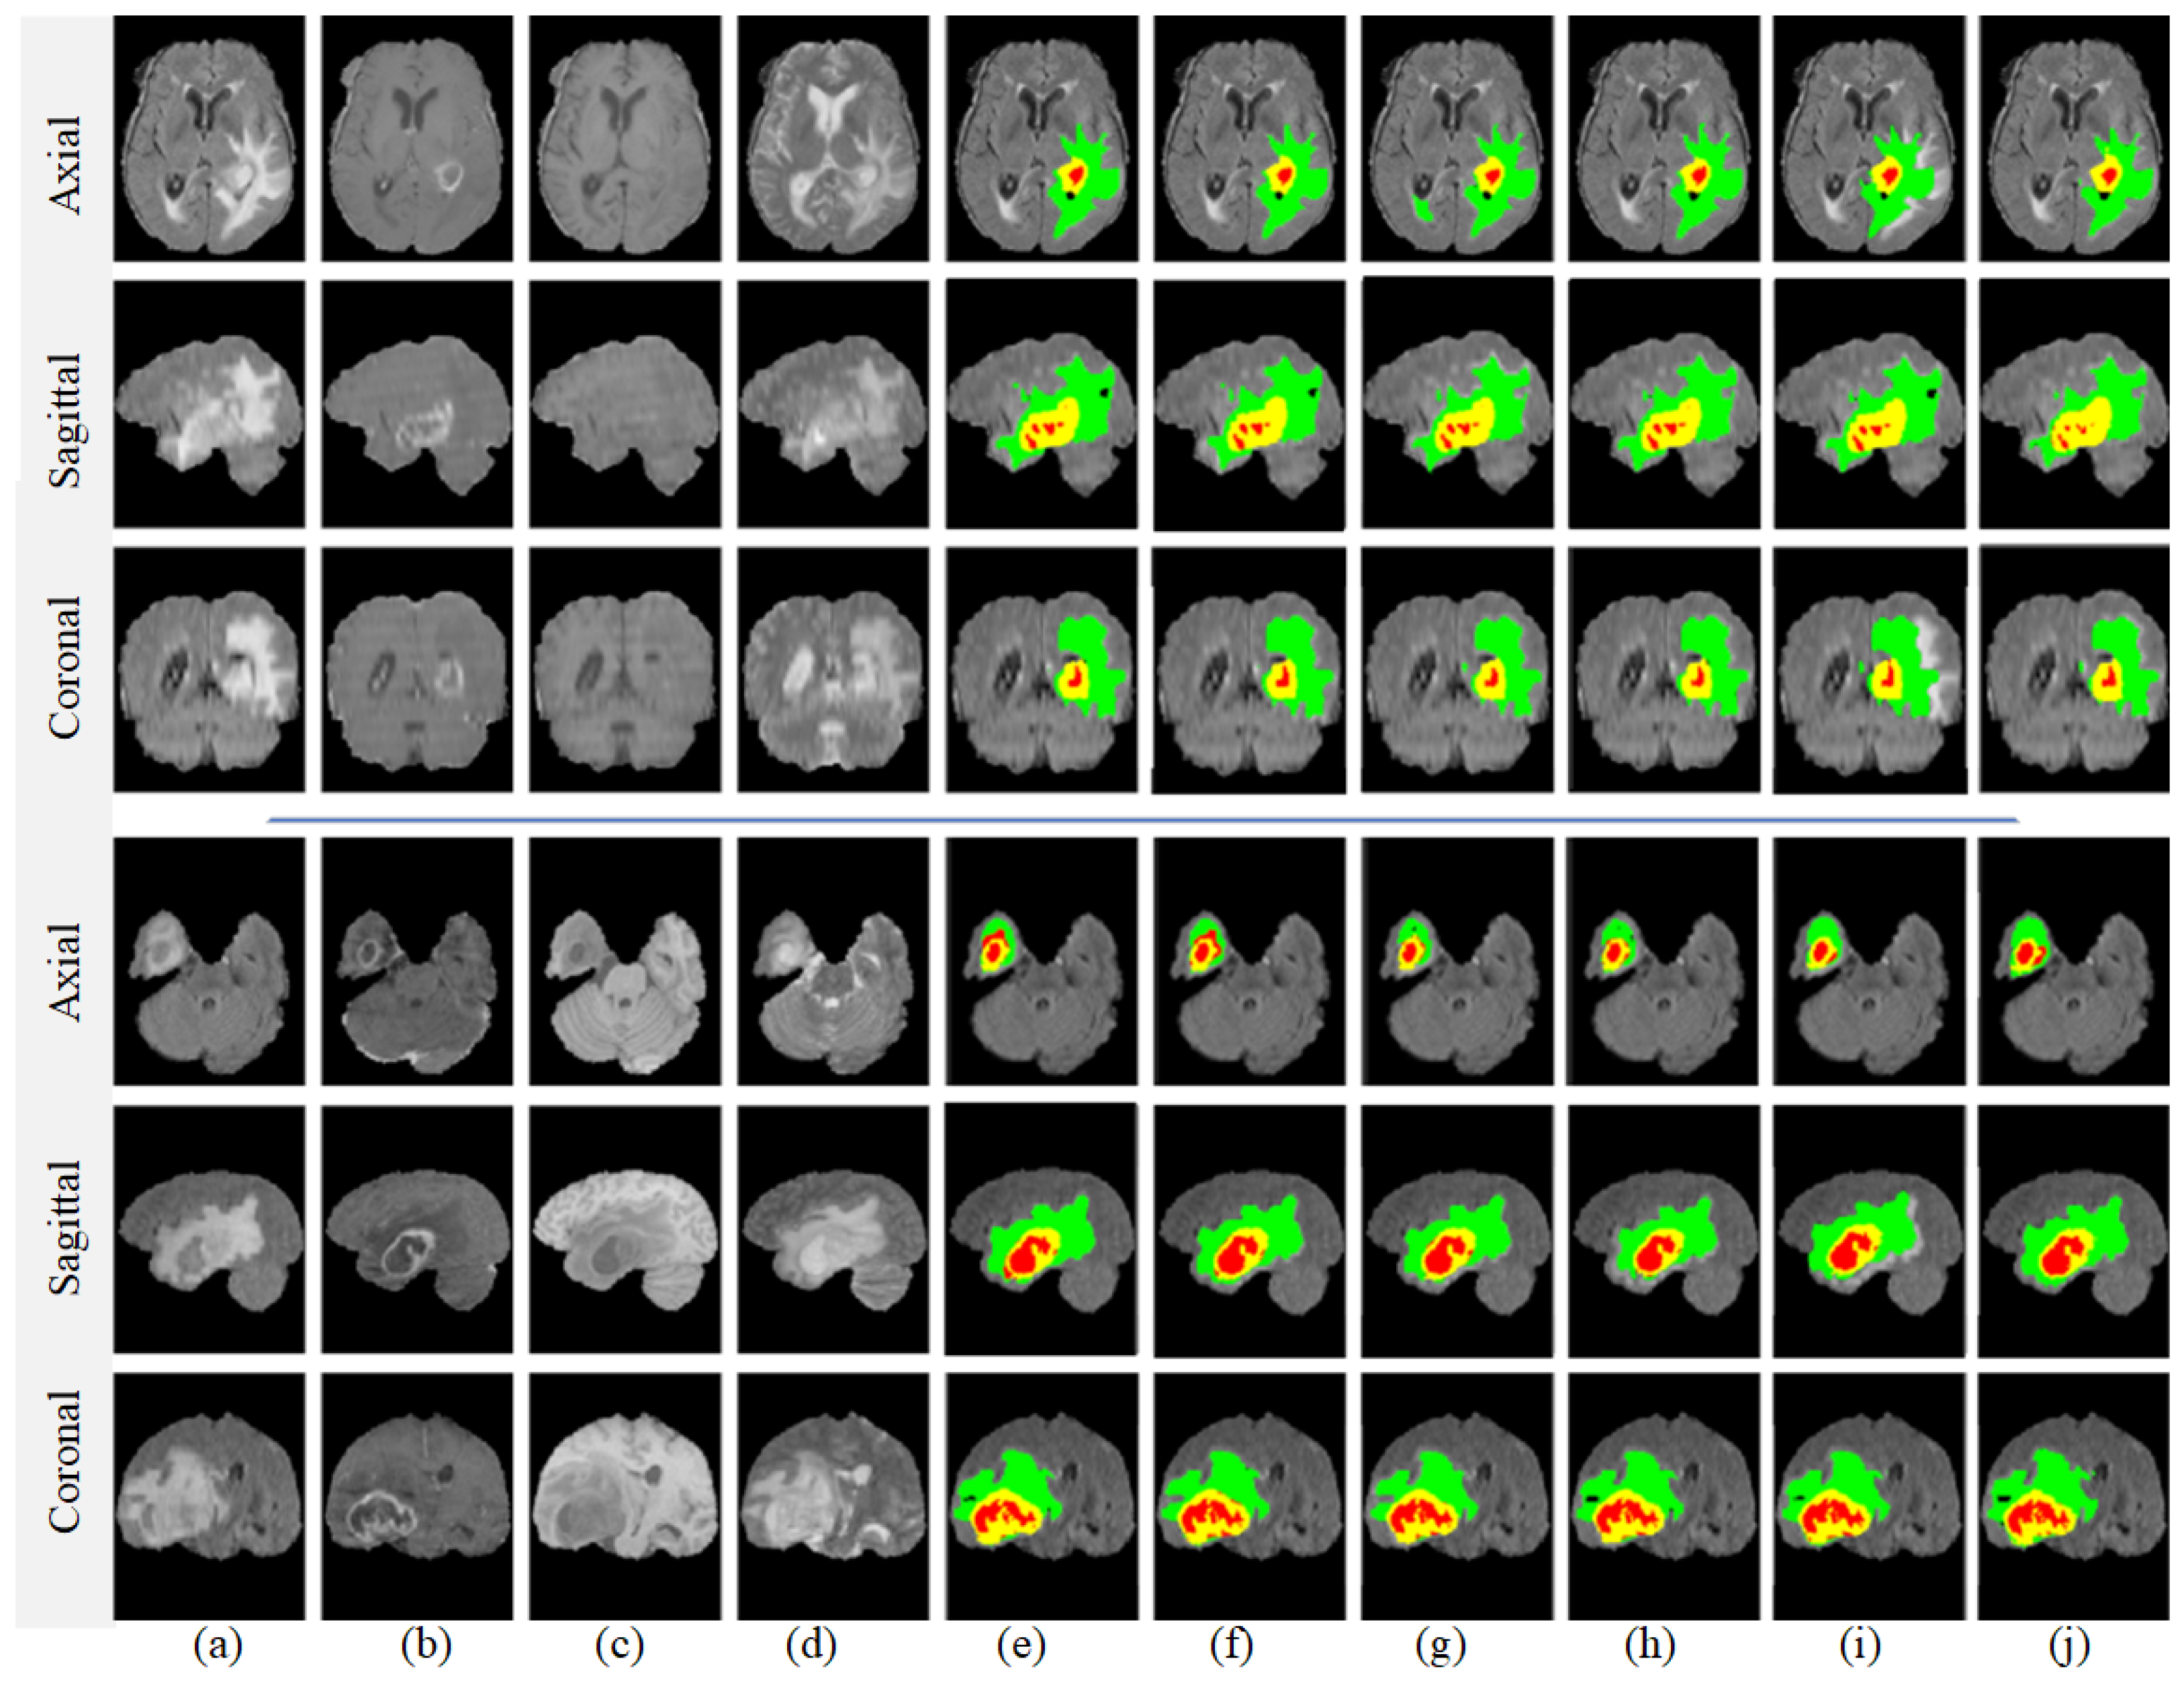
Disclaimer/Publisher’s Note: The statements, opinions and data contained in all publications are solely those of the individual author(s) and contributor(s) and not of MDPI and/or the editor(s). MDPI and/or the editor(s) disclaim responsibility for any injury to people or property resulting from any ideas, methods, instructions or products referred to in the content. |
© 2023 by the authors. Licensee MDPI, Basel, Switzerland. This article is an open access article distributed under the terms and conditions of the Creative Commons Attribution (CC BY) license (https://creativecommons.org/licenses/by/4.0/).
Share and Cite
MDPI and ACS Style
Rahman, Z.; Zhang, R.; Bhutto, J.A. A Symmetrical Approach to Brain Tumor Segmentation in MRI Using Deep Learning and Threefold Attention Mechanism. Symmetry 2023, 15, 1912. https://doi.org/10.3390/sym15101912
AMA Style
Rahman Z, Zhang R, Bhutto JA. A Symmetrical Approach to Brain Tumor Segmentation in MRI Using Deep Learning and Threefold Attention Mechanism. Symmetry. 2023; 15(10):1912. https://doi.org/10.3390/sym15101912
Chicago/Turabian StyleRahman, Ziaur, Ruihong Zhang, and Jameel Ahmed Bhutto. 2023. "A Symmetrical Approach to Brain Tumor Segmentation in MRI Using Deep Learning and Threefold Attention Mechanism" Symmetry 15, no. 10: 1912. https://doi.org/10.3390/sym15101912
Note that from the first issue of 2016, this journal uses article numbers instead of page numbers. See further details here.