Communication

Asymmetric Pattern of Correlations of Leucine Aminopeptidase Activity between Left or Right Frontal Cortex versus Diverse Left or Right Regions of Rat Brains

by
Manuel Ramírez-Sánchez
1,*,
Isabel Prieto
1,
Ana Belén Segarra
1,
Inmaculada Banegas
1,
Magdalena Martínez-Cañamero
1,
Germán Domínguez-Vías
2,
Raquel Durán
3,
Francisco Vives
3 and
Francisco Alba
4,†
1
Department of Health Sciences, University of Jaén, 23071 Jaén, Spain
2
Department of Physiology, Faculty of Health Sciences, Ceuta, University of Granada, 18071 Granada, Spain
3
Department of Physiology, Faculty of Medicine, University of Granada, 18071 Granada, Spain
4
Department of Biochemistry and Molecular Biology, Faculty of Medicine, University of Granada, 18071 Granada, Spain
*
Author to whom correspondence should be addressed.
In memoriam.
Symmetry 2023, 15(7), 1320; https://doi.org/10.3390/sym15071320
Submission received: 30 May 2023 / Revised: 13 June 2023 / Accepted: 26 June 2023 / Published: 28 June 2023
(This article belongs to the Special Issue The Study of Brain Asymmetry)

Abstract

:
Previous studies demonstrated an asymmetry of left predominance for mean values of soluble leucine aminopeptidase (LeuAP) activity in the frontal cortex (FC) and hypothalamus of adult male rats, fluorimetrically analyzed by the hydrolysis of Leu-β-naphthylamide as a substrate. No asymmetries were observed in nine other left (L) and right (R) regions obtained from rostro-caudally sectioned coronal slices. Neither had inter-hemispheric differences observed for lactate dehydrogenase (LDH), analyzed simultaneously in the same brain regions (L and R) of the same animals. However, the level of intra-hemispheric or inter-hemispheric correlation of LeuAP or LDH between such brain regions has not been analyzed. In order to obtain additional suggestions on the functional heterogeneity between regions of LeuAP and LDH, in the present investigation, the level of intra-hemispheric and inter-hemispheric correlations of the frontal cortex with the rest of the regions studied is described: (A) between the left frontal cortex (LFC) and the rest of the left regions; (B) between the right frontal cortex (RFC) and the rest of the right regions; (C) between the left frontal cortex and all of the right regions; and (D) between the right frontal cortex and all of the left regions. All of the correlations obtained were positive. The intra-hemispheric analysis showed a greater heterogeneity of values in the correlations observed between RFC and the rest of the right regions than between LFC and the rest of the left regions. Greater heterogeneity is observed when comparing RFC correlations with left regions than when comparing LFC correlations with right regions. In conclusion, the greatest heterogeneity (suggesting a greater functional variability) was observed in the right intra-hemispheric analysis and in the inter-hemispheric analysis between the RFC and the left hemisphere. The results for LDH showed a great homogeneity between regions both in the intra- and inter-hemispheric studies.

1. Introduction

Brain asymmetry is still a very unknown and open research topic [1,2,3]. The analysis of the regional cerebral interrelationship within the left or right hemispheres, as well as the study of the regional interaction between both hemispheres, can reveal interesting data on integral cerebral behavior. The study of the intra- and inter-hemispheric behavior of enzymatic activity, regulating specific neurotransmitters with known cognitive functions, in comparison with the simultaneous determination of another general metabolic enzymatic activity without specific known cognitive functions, can reveal important aspects of bilateral brain behavior. For this, especially in neurochemical studies, it is necessary to carry out research in experimental animals, such as rats, with a brain that is quite similar to the human brain, which can provide a valuable overview of certain brain processes [4]. In a previous extensive investigation on brain bilateral regional distribution in adult male rats, we described an asymmetry of left predominance in the frontal cortex and hypothalamus, for the mean level of soluble leucine aminopeptidase (LeuAP) activity [5] analyzed fluorimetrically through the hydrolysis of Leu-β-naphthylamide as a substrate [6]. No asymmetries were observed in nine other left (L) and right (R) regions, obtained from rostro-caudally sectioned coronal slices (Figure 1). This activity has been involved in the metabolism of enkephalins [7], so it may reflect their functional state. In the same animals and regions, lactate dehydrogenase activity (LDH), a classic metabolic enzyme involved in carbohydrate metabolism, was determined simultaneously, and in this case, no asymmetry was observed in any of the eleven L and R regions analyzed [2]. However, the level of intra-hemispheric or inter-hemispheric correlation of LeuAP or LDH between such brain regions has not been determined. In order to obtain additional suggestions on the functional heterogeneity between regions of LeuAP and LDH, a large analysis study of the correlations between all regions and all of the others is proposed. In the present investigation, as preliminary data of this study, the level of intra-hemispheric and inter-hemispheric correlations between the frontal cortex and the rest of the regions studied is described: (A) between the left frontal cortex (LFC) and the rest of the left regions; (B) between the right frontal cortex (RFC) and the rest of the right regions; (C) between the left frontal cortex and all the right regions; (D) between the right frontal cortex and all the left regions (Figure 2).

2. Material and Methods

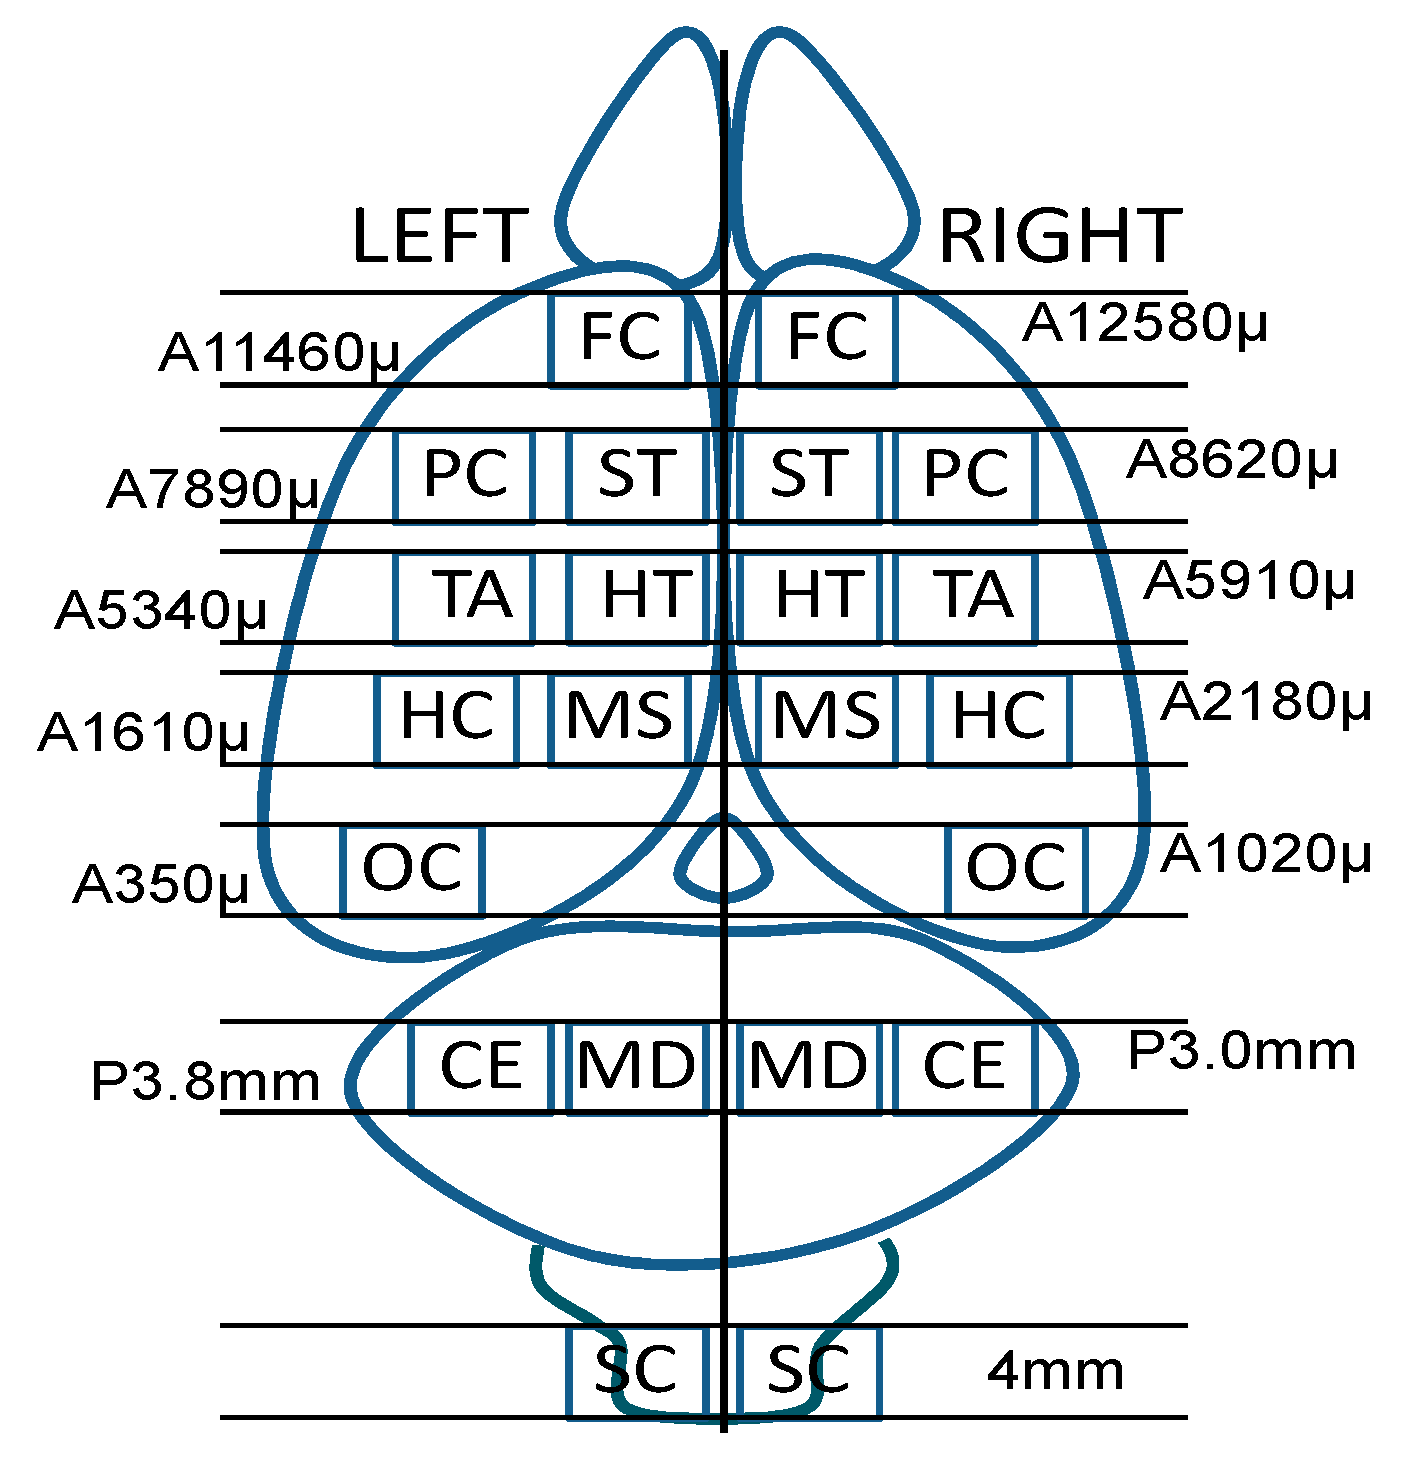
2.1. Animal Design, Collection and Sample Preparation

Male Wistar rats (n = 21) with an average weight of 250 g were used in the present investigation. For the analysis of LeuAP activity, all 21 animals were used. Eighteen such animals were used for LDH analysis. The experiments were carried out in accordance with the ethical parameters approved by the European Communities Council Directive 86/609/EEC. Animals were anesthetized with Equithensin [8] and their brains were perfused with saline, quickly extracted, and frozen on dry ice. Subsequently, coronal sections of the brains were carried out, from which selected brain regions were dissected, according to the stereotaxic atlases of König and Klippel [9] and Pellegrino and Cushman [10]. The brain regions, obtained as symmetrically as possible, from the left and right hemispheres were, in rostro-caudal direction: frontal cortex (FC), parietal cortex (PC), striatum (ST), thalamus (TA), hypothalamus (HT), hippocampus (HC), mesencephalon (MS), occipital cortex (OC), cerebellum (CE) and medulla (MD). For the spinal cord (SC), the proximal 4 mm of the cervical cord were obtained (Figure 1). Once the tissues were obtained, they were quickly homogenized in 10 volumes of 50 mM Tris HCl buffer, pH 7.4 and later ultracentrifuged (100,000× g, 30 min.). The obtained supernatants were immediately analyzed for LeuAP and LDH activities. LeuAP and LDH activities were determined in triplicate in each sample, and the average value of such determinations was selected. These assays showed high reproducibility and low variation.

2.2. Determination of LeuAP Activity

LeuAP activity was determined using Leucine-β-naphthylamide (Leu-β-NA) as a substrate, according to the modified method of Greenberg [11]. Briefly, 10 μL of supernatant was incubated for 30 min in 1 mL of the substrate solution consisting of: 0.8 mg/100 mL of Leu-β-NA, 10 mg/100 mL of bovine albumin and 10 mg/100 mL of dithiothreitol in 10 mL of phosphate buffer pH 7.4 at 25 °C. The enzymatic reaction was stopped by the addition of 1 mL, 0.1 M acetate buffer, pH 4.2. The fluorescence intensity of the released β-naphthylamide was determined at 345 nm of excitation and 412 nm of emission. The amount of protein in each sample was determined in triplicate using the Bradford method [12]. Results were expressed as LeuAP units per mg protein. One unit was considered as the amount of enzyme that hydrolyzed 1 nmol of Leu-β-NA per min.

2.3. Determination of LDH Activity

Lactate dehydrogenase activity was measured spectrophotometrically in triplicate by the standard method of Bergmeyer and Bernt [13] and expressed as milliunits of enzyme activity per mg of proteins.

2.4. Statistical Analysis
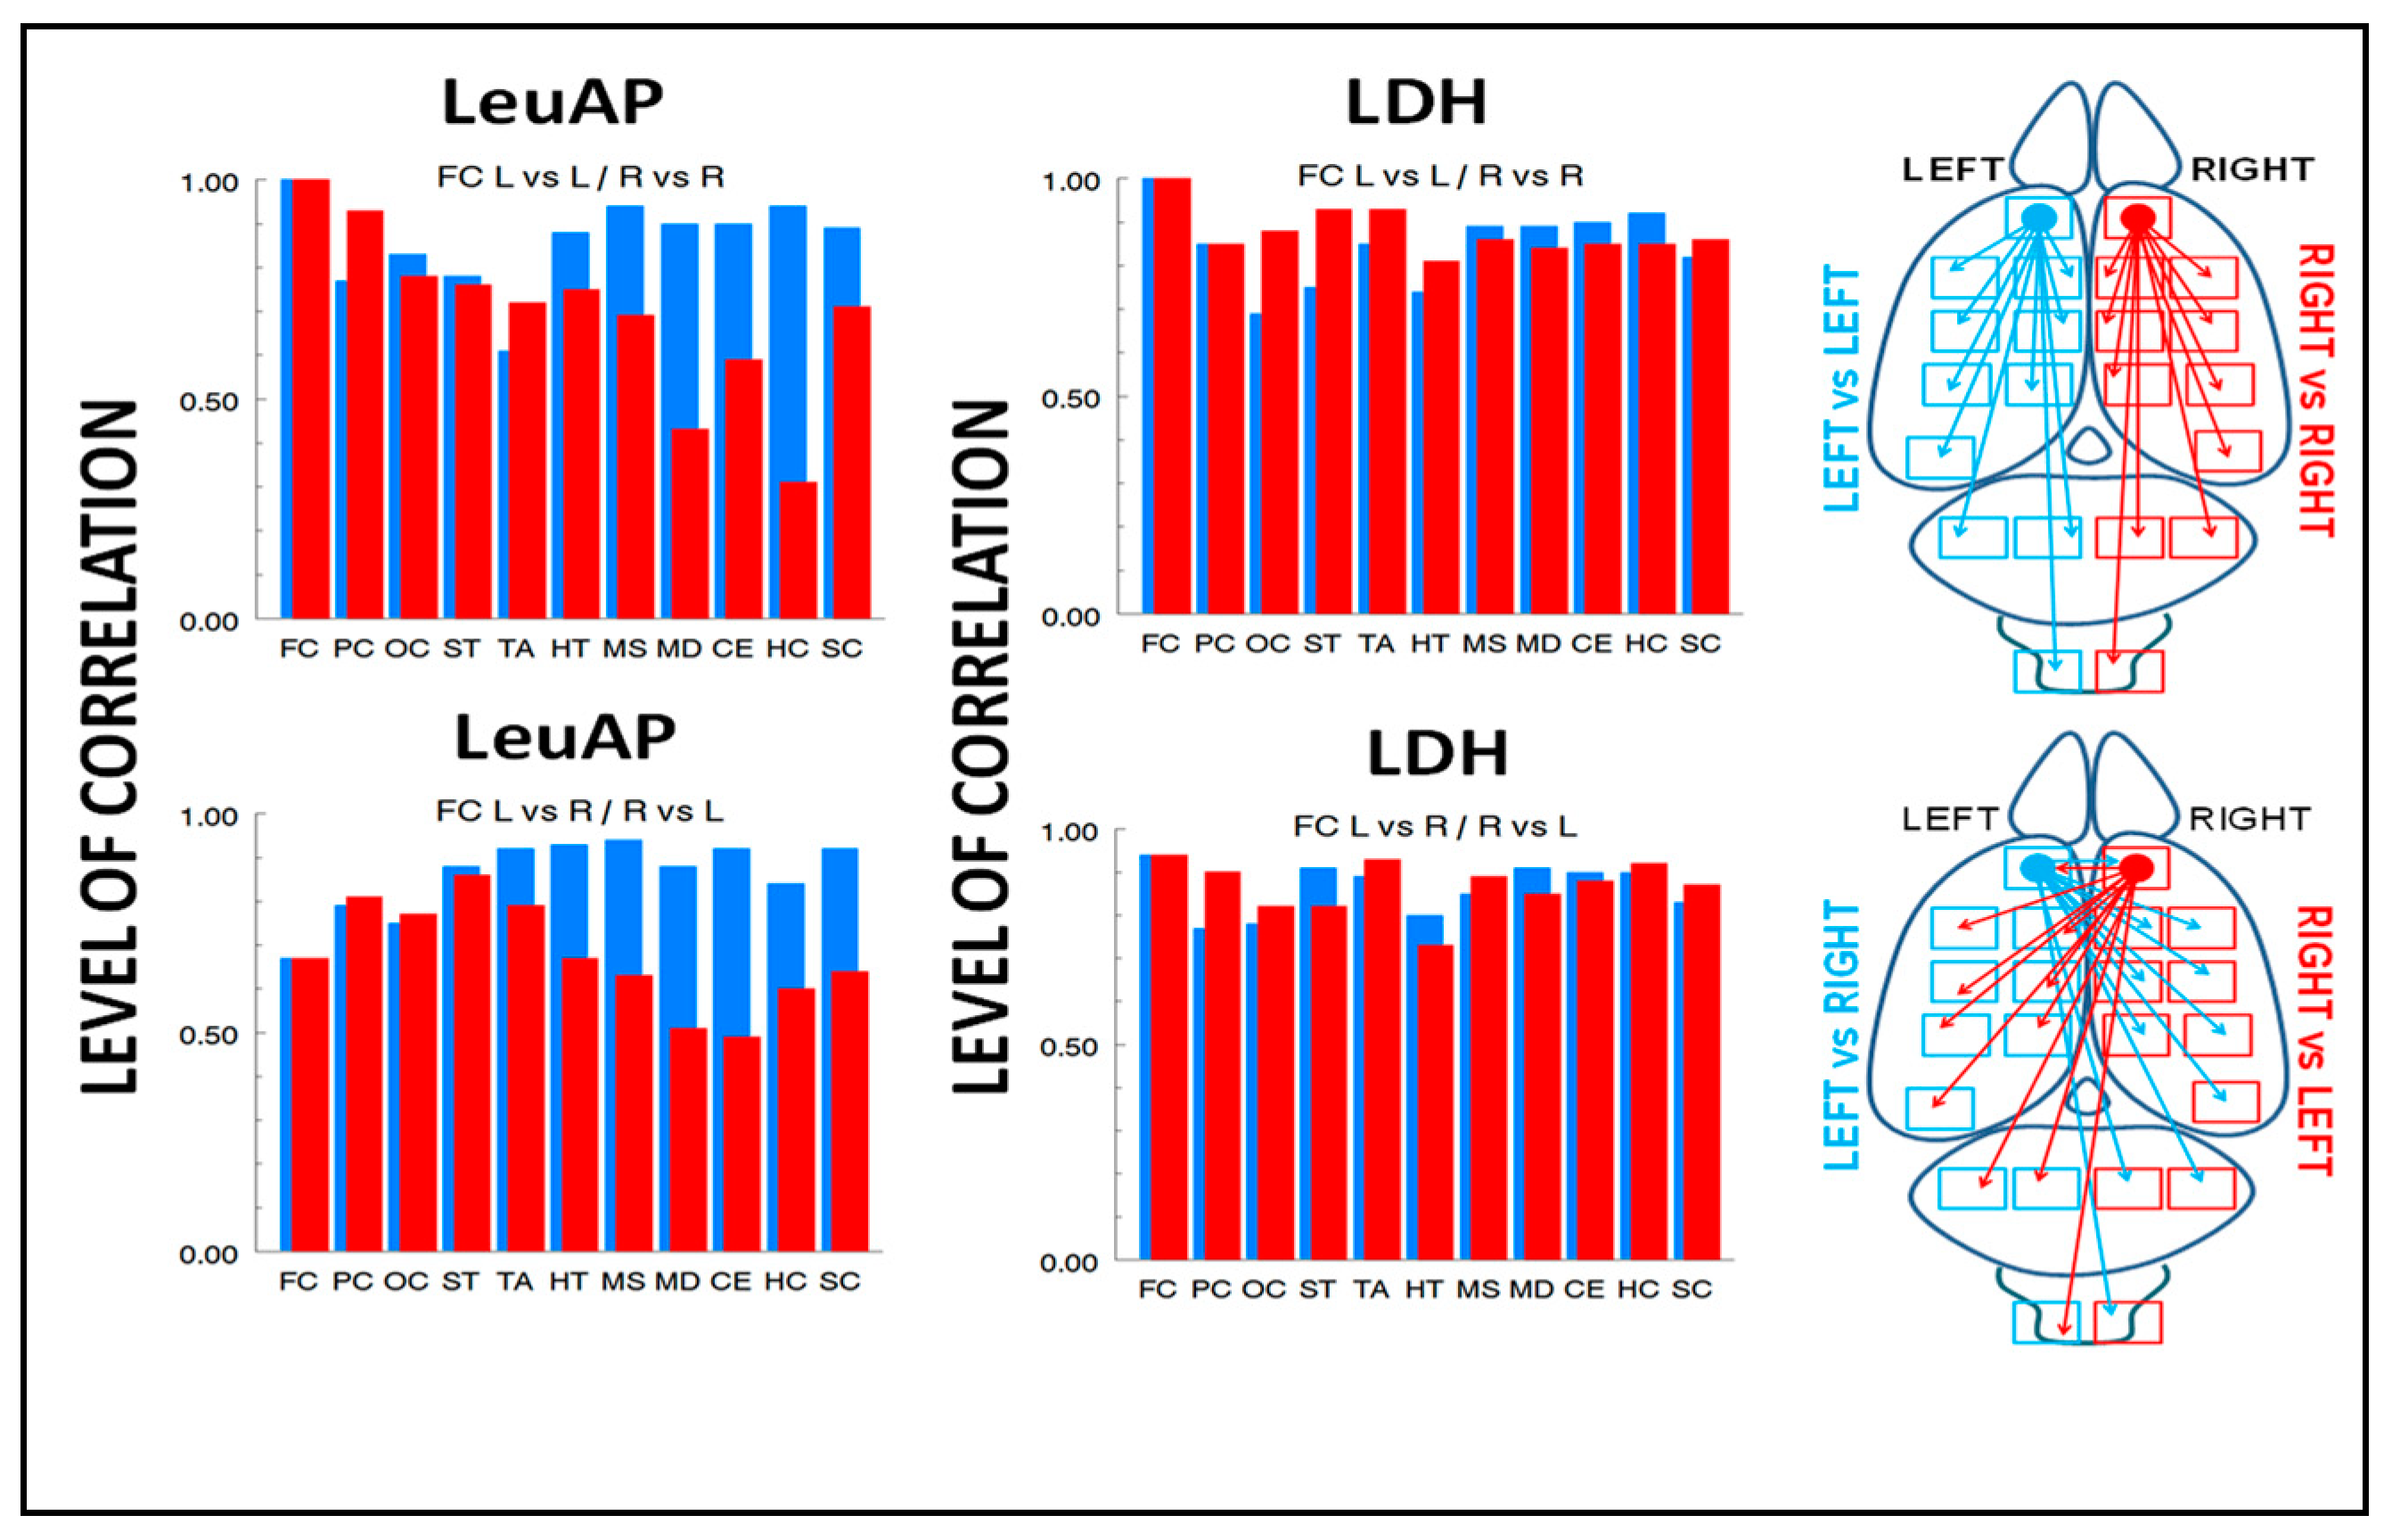
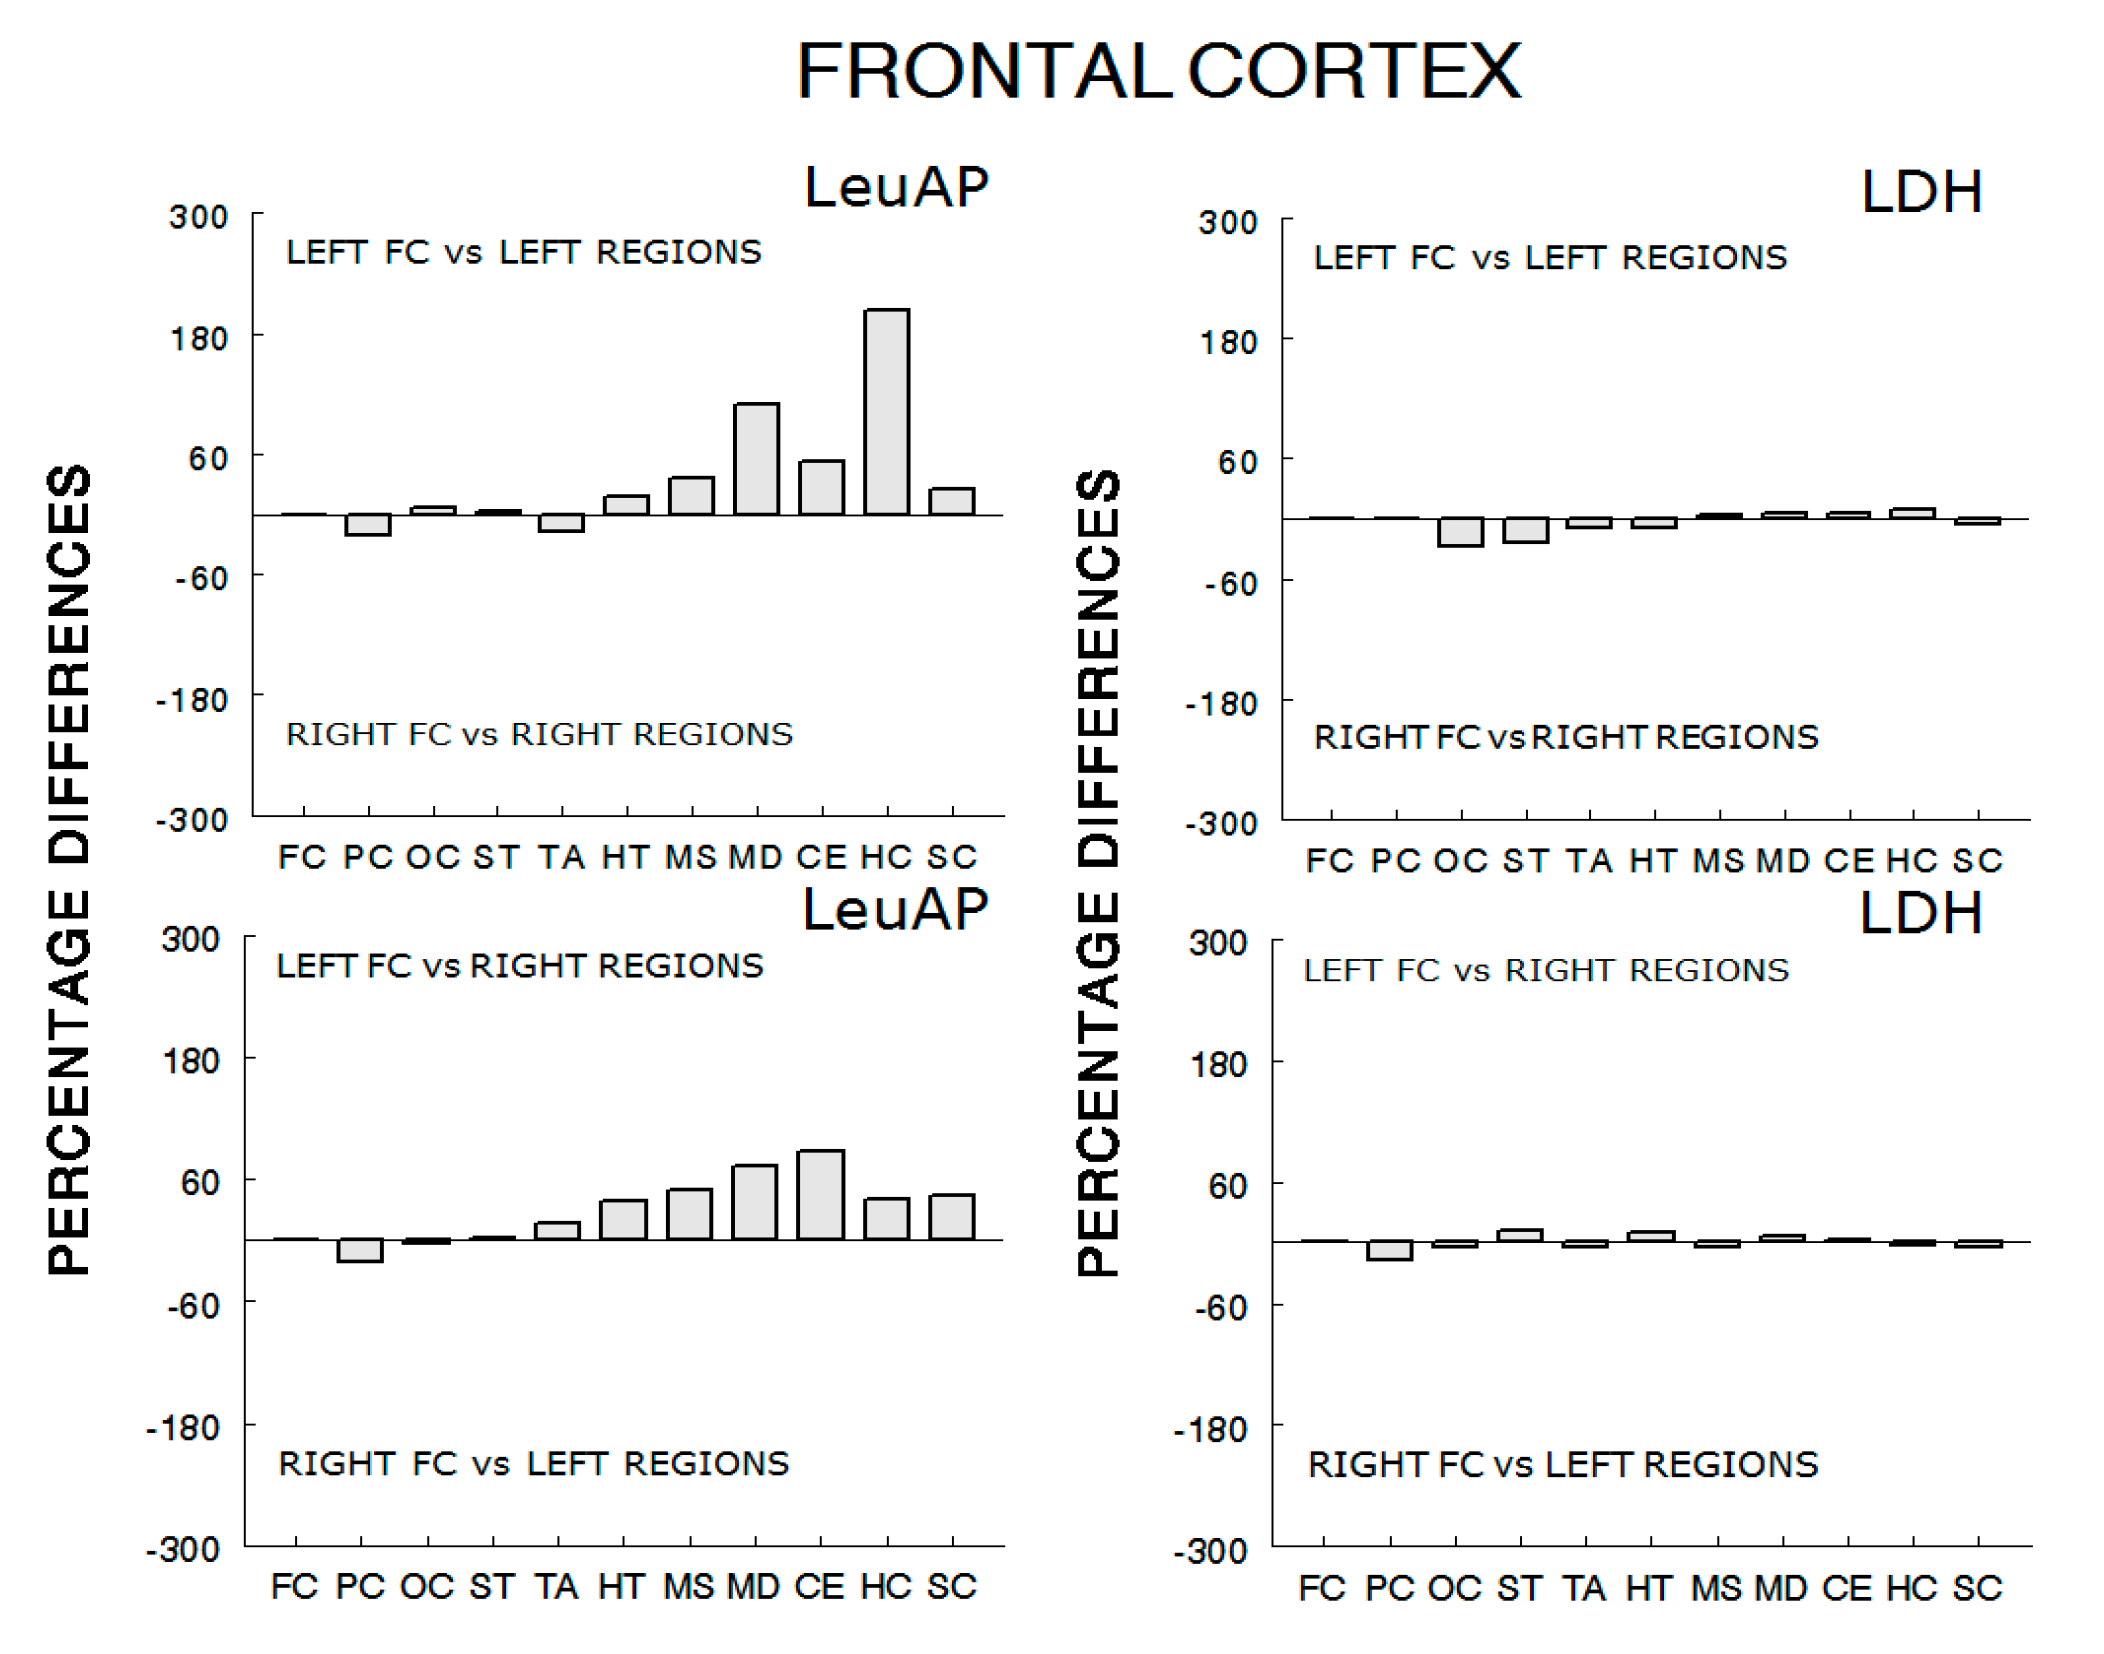
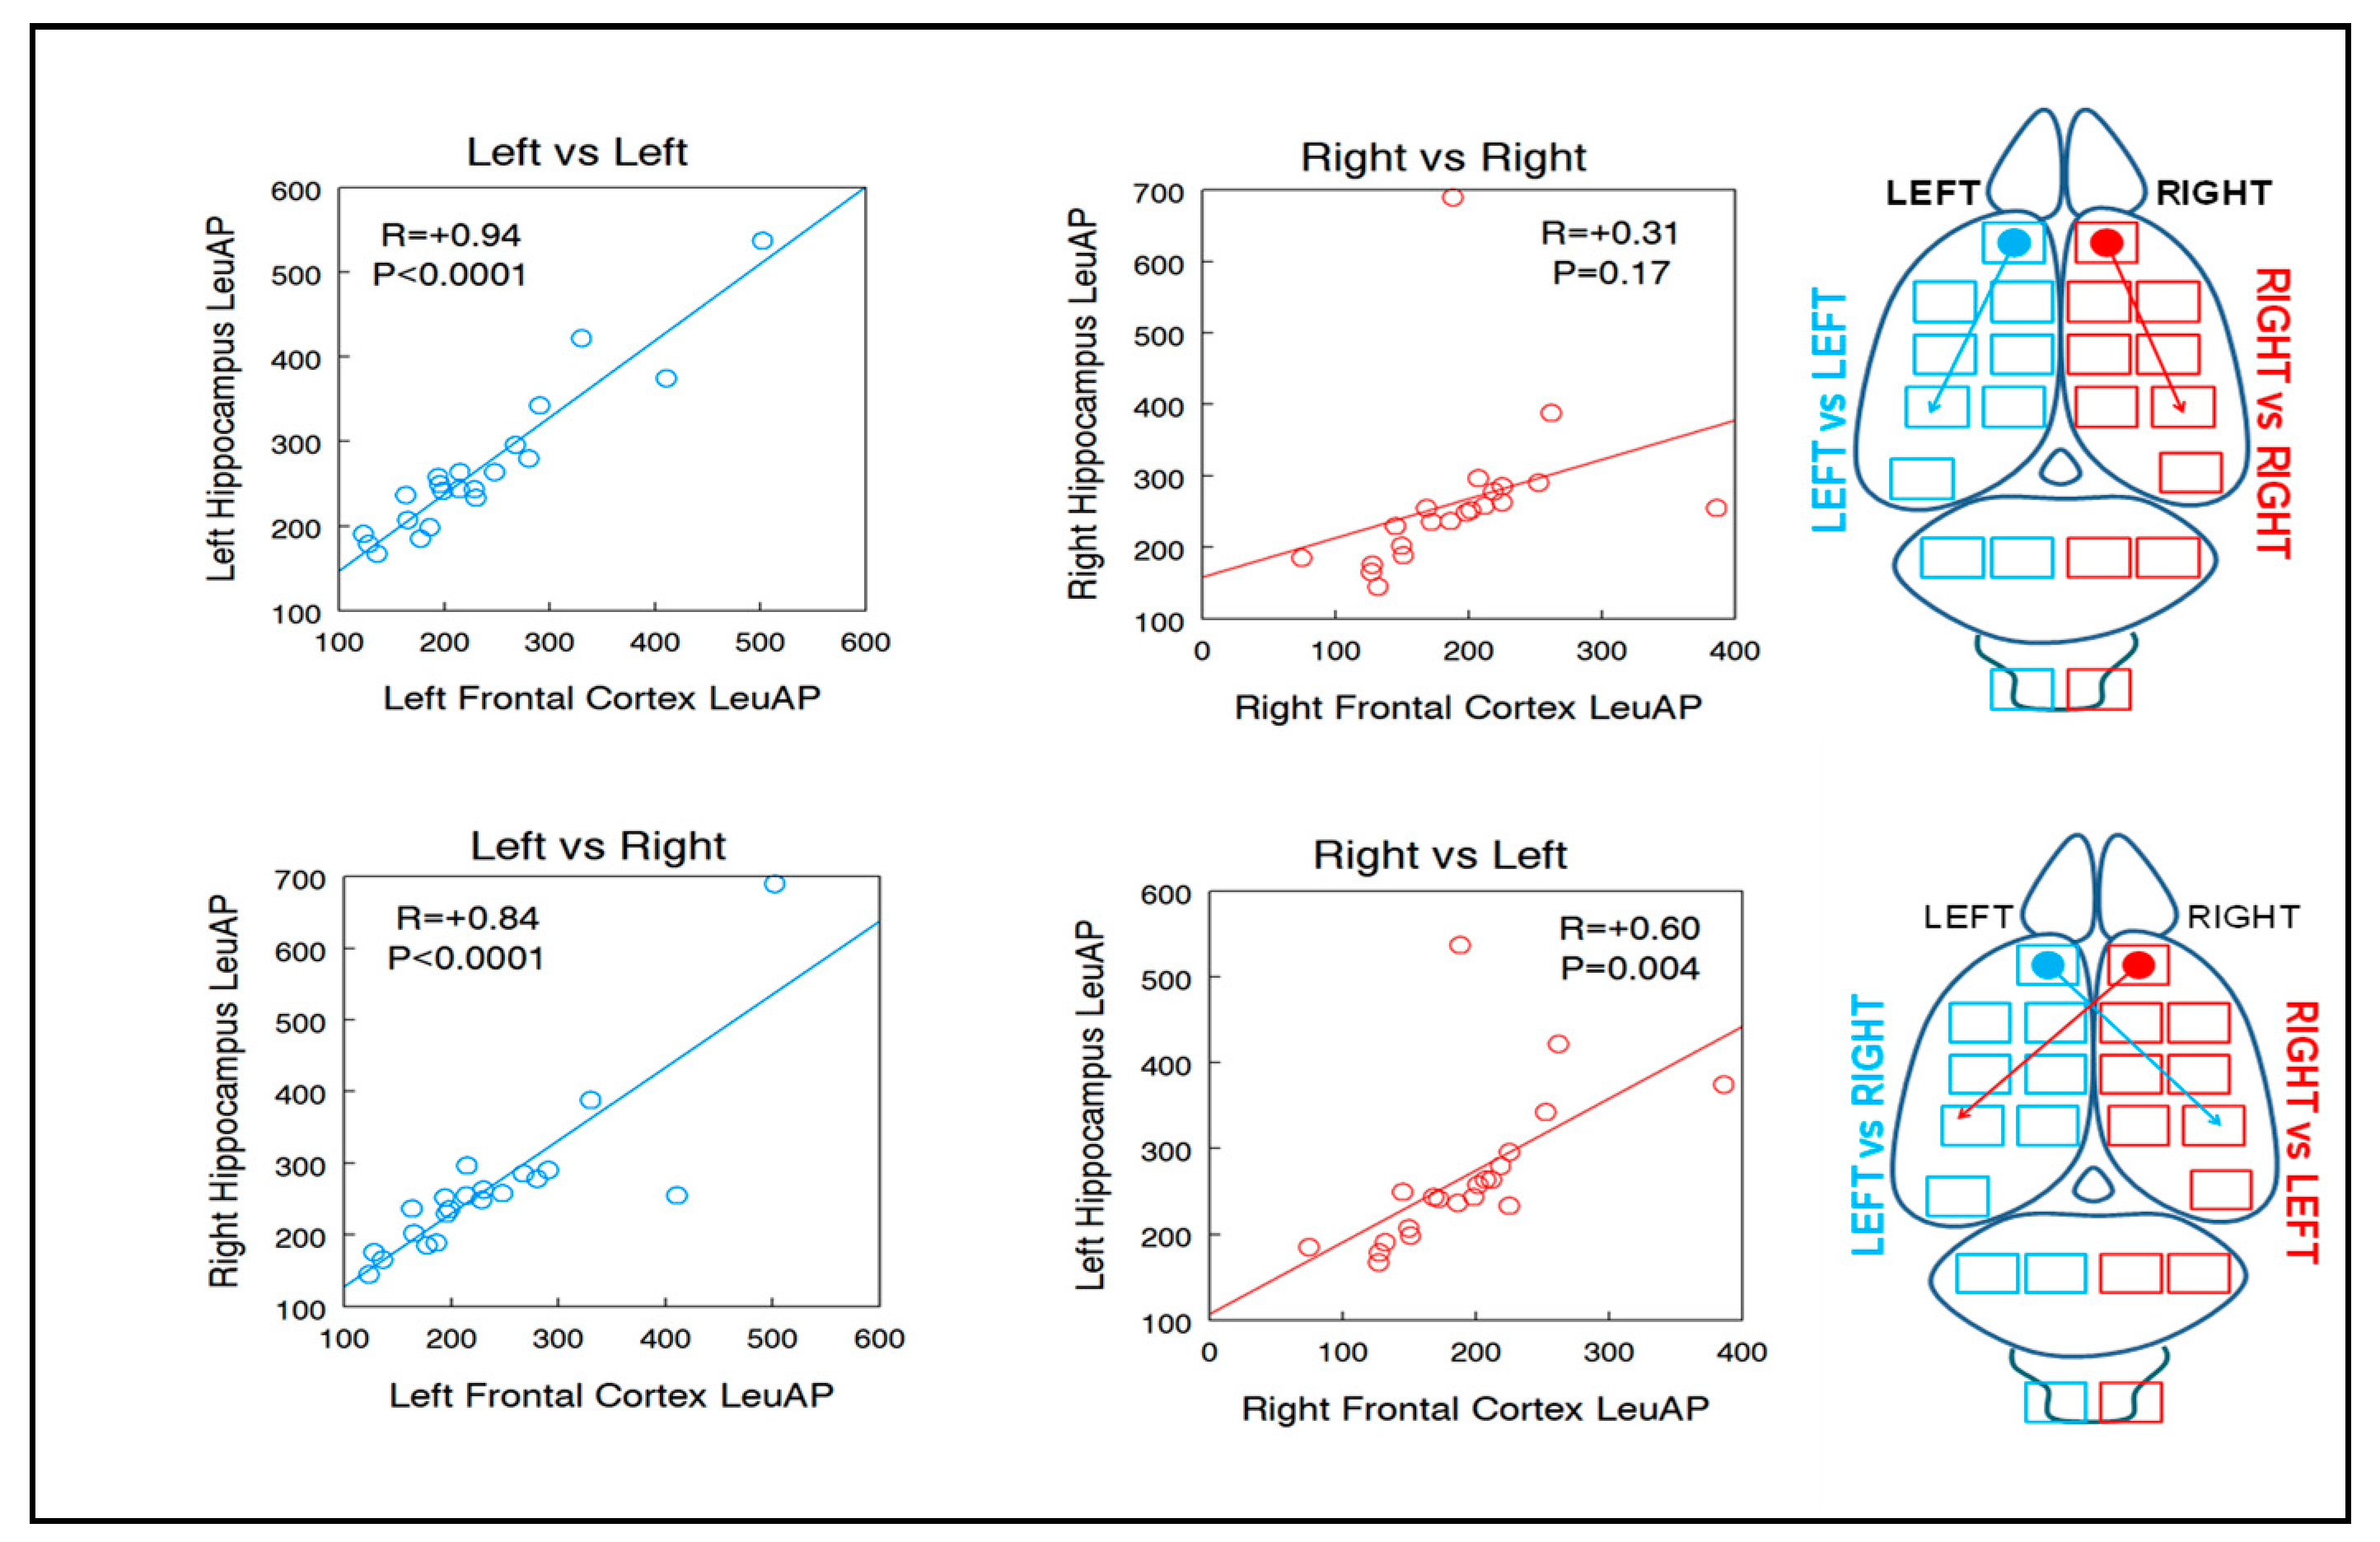
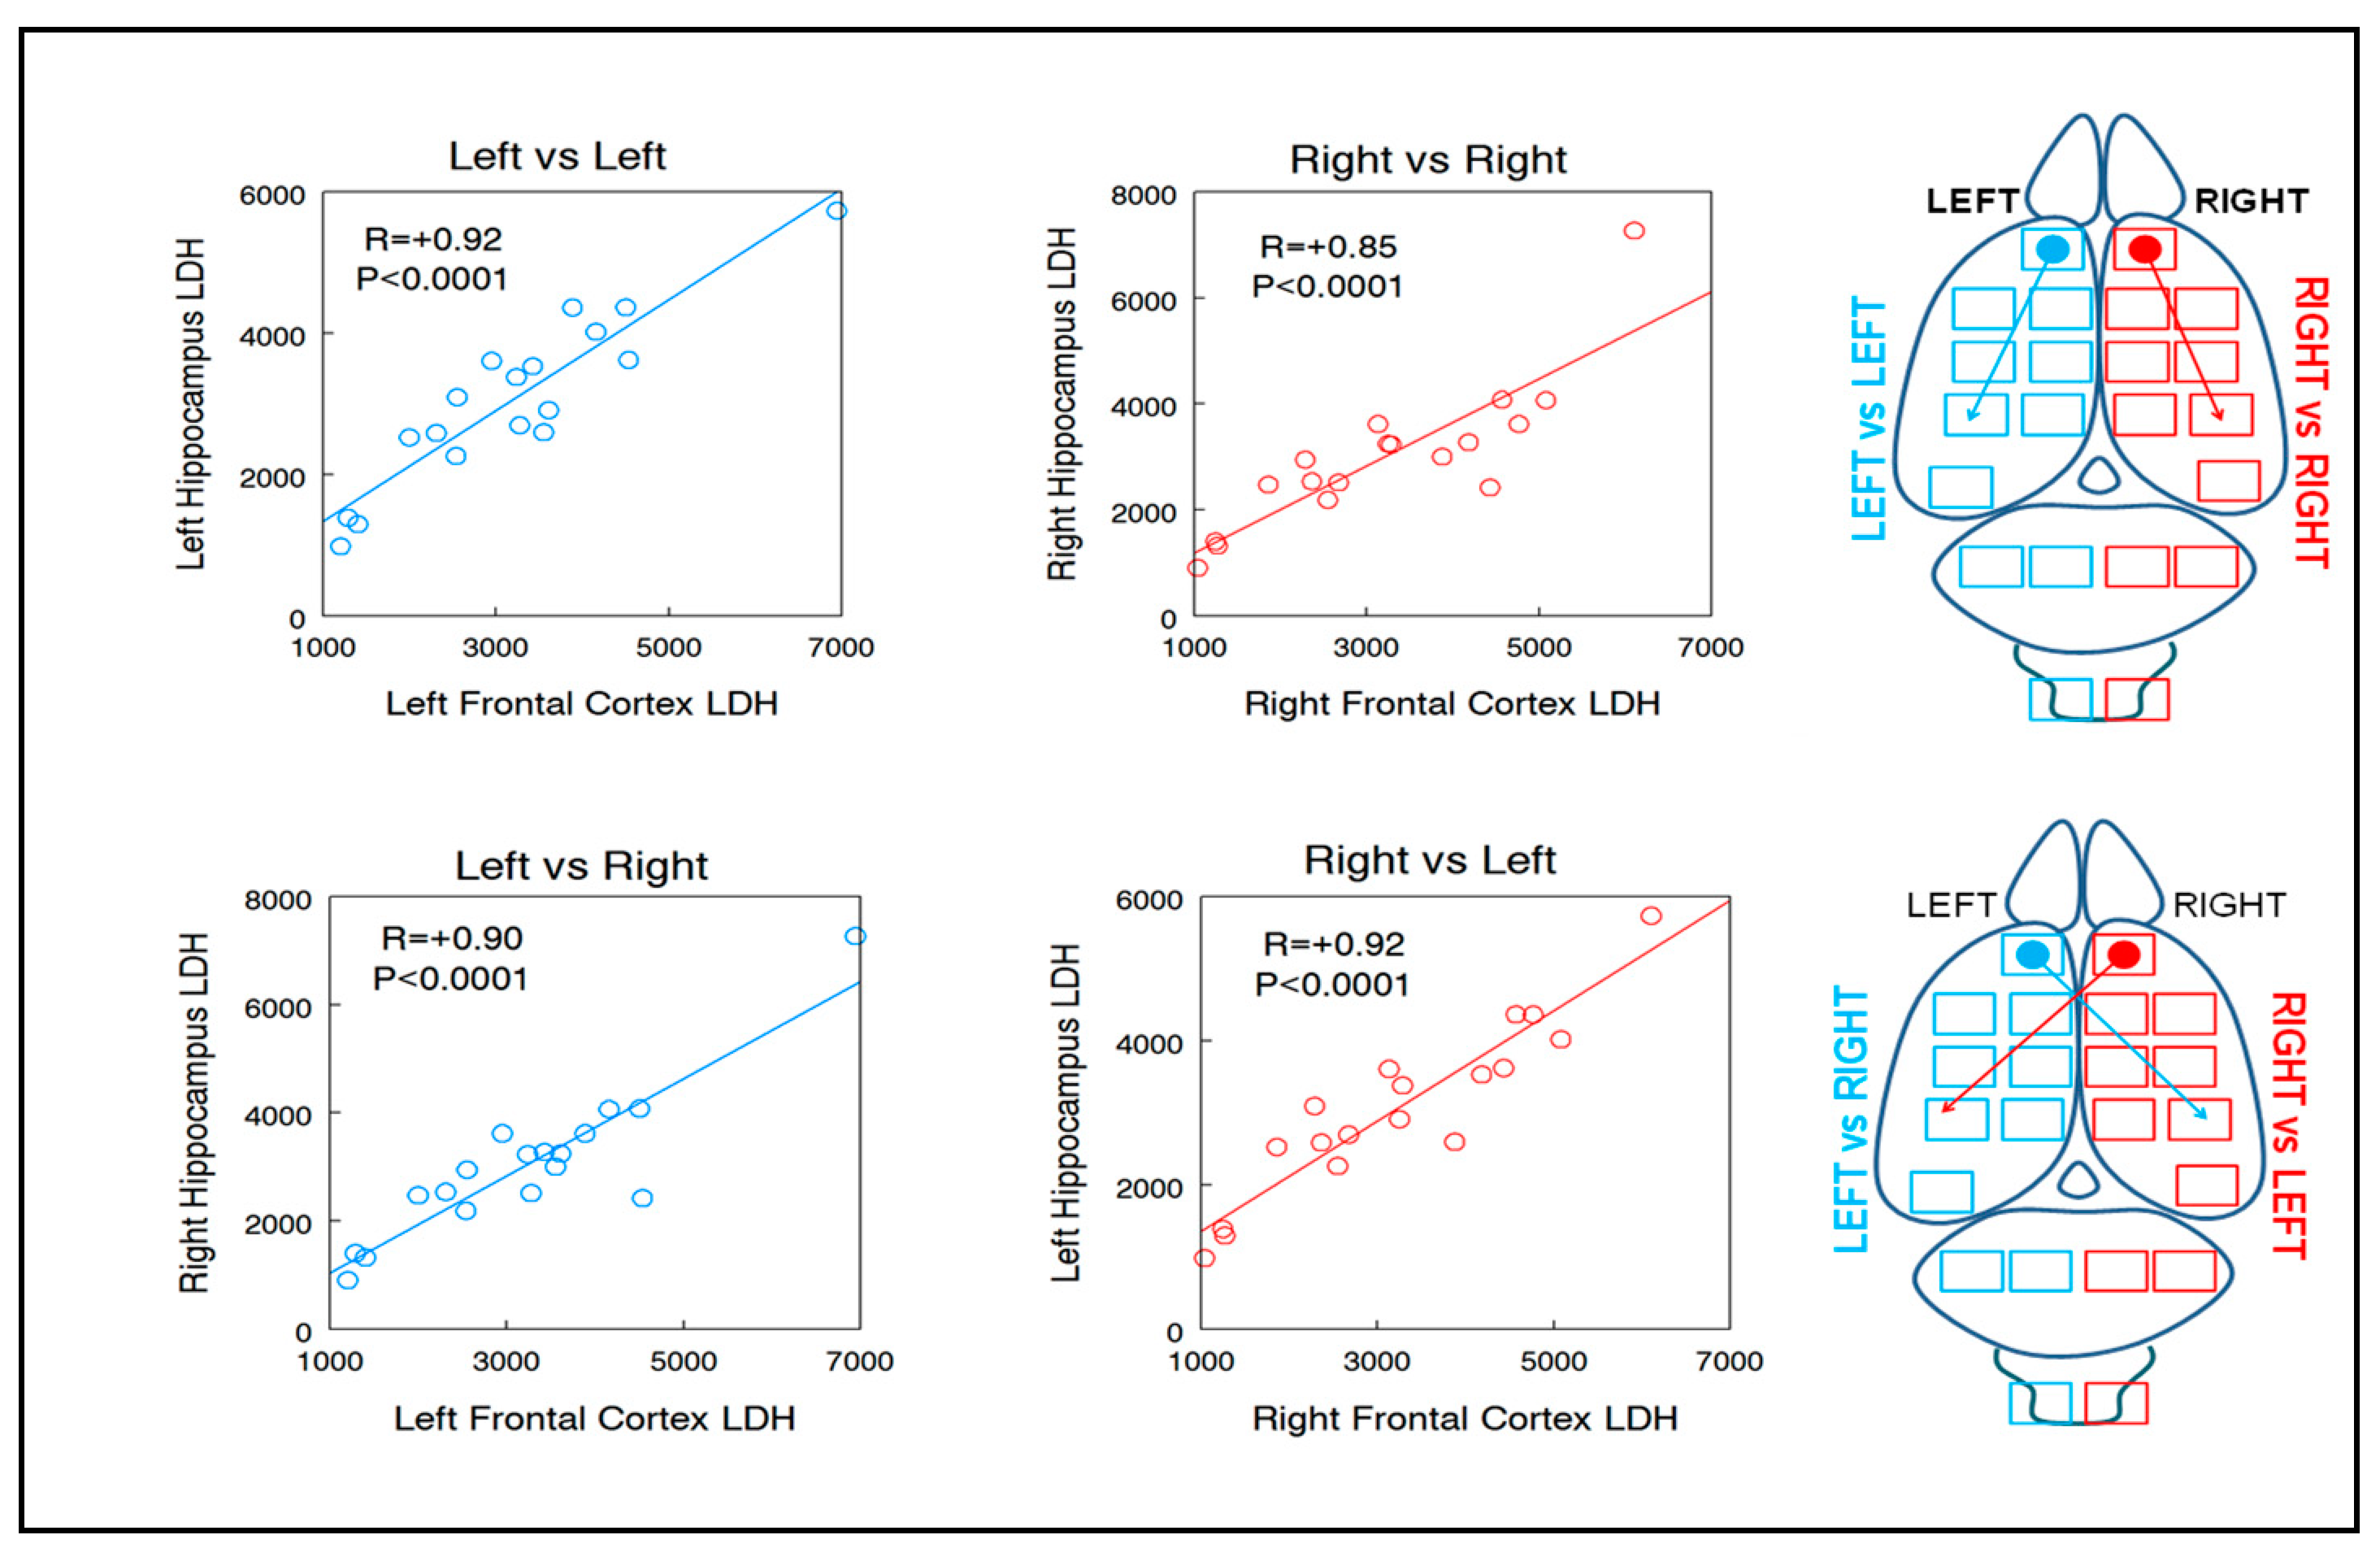
With these data, whose mean values were previously published [5], we have carried out the present correlational analyses, which consist of obtaining the levels of correlation: (A) between the left frontal cortex and the rest of the left regions; (B) between the right frontal cortex and the rest of the right regions; (C) between the left frontal cortex and all of the right regions; and (D) between the right frontal cortex and all of the left regions (Figure 2). To analyze the level of correlation between the left or right frontal cortex and the rest of the left or right regions (Figure 2), the Pearson’s correlation coefficients were calculated. The calculations were carried out using SPSS 13.0 and STATA 9.0 (STATA Corp., College Station, TX, USA).
Figure 1. Coronal slices from which the analyzed left and right regions were obtained. Tissue samples were dissected according to the König and Klippel [9] and Pellegrino and Cushman [10] stereotaxic atlases. In each coronal section, the anterior and posterior planes are indicated as anterior (A) [9] or posterior (P) [10] to the inter-auricular line, between which the various selected regions were dissected. For the spinal cord, the proximal 4 mm of the cervical cord were obtained. In rostro-caudal direction: frontal cortex (FC), parietal cortex (PC), striatum (ST), thalamus (TA), hypothalamus (HT), hippocampus (HC), mesencephalon (MS), occipital cortex (OC), cerebellum (CE), medulla (MD) and spinal cord (SC).
Symmetry 15 01320 g001
Figure 2. Intra-hemispheric and inter-hemispheric correlations of the left or right frontal cortex with the rest of the regions studied: (A) between the left frontal cortex and the rest of the left regions (blue arrows); (B) between the right frontal cortex and the rest of the right regions (red arrows); (C) between the left frontal cortex and all of the right regions (blue arrows); (D) between the right frontal cortex and all of the left regions (red arrows).
Symmetry 15 01320 g002

3. Results

The intra-hemispheric and inter-hemispheric correlation levels of the frontal cortex, as well as the percentage increases when comparing the left intra-hemispheric correlations with the right ones and when comparing the inter-hemispheric correlations of LeuAP and LDH activity with each other, are shown in Table 1 and Table 2 and are represented in Figure 3 and Figure 4. All correlation values were positive: the higher the value in one region, the higher the value in the correlated one. In the tables and figures, the cortices (FC, PC, OC) are grouped at the beginning and the subcortical regions are presented in a rostro-caudal order (ST, TA, HT, MS, MD, CE, HC, SC). The results clearly differ between LeuAP and LDH, showing greater variability in the levels of correlation obtained for LeuAP than those obtained for LDH (Figure 3 and Figure 4). The levels of correlation for LeuAP also differ if we compare the intra-hemispheric left versus left (L vs. L) with the right versus right (R vs. R) correlations (Table 1): the R vs. R correlations show greater heterogeneity than the L vs. L ones. This heterogeneity is also observed if we compare the left versus right (L vs. R) correlations with the right versus left (R vs. L) correlations: greater heterogeneity is observed in the R vs. L than in L vs. R. The above considerations do not apply to the LDH values that show much more homogeneity in the various comparisons.
The above circumstances are also observed when analyzing the percentage increase, [(higher value/lower value) − 1] × 100, between the values of L vs. L compared to those of R vs. R and between the values of L vs. R in comparison with those of R vs. L: the values are higher and more heterogeneous for LeuAP than for LDH (Figure 4). Finally, if we calculate the percentage increase between the highest and lowest value in each column, we observe that for LeuAP the highest levels are found in the R vs. R (222.5%) comparisons compared to L vs. L (63.9%), and R vs. L (75.5%) compared to L vs. R (40.2%) (Table 1). However, for LDH, the values are lower and more homogeneous (Table 2).

4. Discussion

One way to analyze the functional dynamics of neuropeptides is through the study of their metabolism by the action of proteolytic enzymes that biotransform and/or inactivate them [14]. LeuAP has been involved in enkephalin metabolism [7], so its study can provide us with valuable data to understand its functional dynamic. Research on the functional role of opioid peptides, in addition to studying their processing and/or inactivation, has been approached with various other strategies [15]. However, based on their wide distribution (not only centrally but also peripherally) and the complexity of the involved systems that sometimes overlap each other, such as their interaction with other neuropeptides and/or classical neurotransmitters, the functional role of opioids is not fully elucidated. Thus, in addition to their clear role in the induction of analgesia, opioids together with dopamine may participate in the central processes of reward. But, opioids are also involved in food consumption, encoding of aversive experiences, and other processes [15]. Regarding the inter-hemispheric distribution of opioids, there are controversial data; for example, while some authors describe an asymmetrical behavior [5,16], others report a symmetrical one [17]. The great variability that is dependent on changes in environmental and physiological conditions [1], could underlie such controversy.
Brain regions display great cellular and biochemical diversity, and mutual intra- and inter-hemispheric influences are mediated by interconnecting neural projections. Understanding the functional dynamics of this heterogeneity is still a clear challenge [18]. The analysis of intra- and inter-hemispheric interactions between regions can provide suggestions that help to partially reveal the functional dynamism in brain asymmetry. Deco et al. [18] analyze the dynamics of brain regional heterogeneity through the study of variations in excitatory/inhibitory gene expression and conclude that regional heterogeneity improves the properties of inter-regional functional connectivity. The observed heterogeneity in the brain may be a vital component to improve performance in a variety of tasks and increase its ability to adapt to new environments [19].
For the interpretation of these data, it is necessary to take into account that we are using correlation values and not mean levels from absolute data. Although correlations do not imply causations, they may be suggestive of the existence of a functional trend. The present data show a brain asymmetry that could be interpreted as a greater heterogeneity in the level of intra- and inter-hemispheric functional interaction, established by the LeuAP activity of the right frontal cortex with the same activity of various right and left brain regions. The results also demonstrate a greater homogeneity in the level of intra- and inter-hemispheric functional interaction established by the LeuAP activity of the left frontal cortex with the same activity of various left and right brain regions (Figure 3 and Figure 4). An example of the above, the interaction between the frontal cortex and hippocampus for LeuAP is represented in Figure 5. Consequently, the same could be applied to the function of their peptide substrates such as enkephalins. This functional interpretation brings a new point of view to that observed with the previously described intra- and inter-hemispheric regional mean values of cerebral LeuAP activity [5]. The idea of a high level of enzymatic activity/low substrate level, reflects another functional concept that does not include the interaction between regions like the one we observe with the present data. In addition, we could suggest that, according to previous studies, there is no doubt that this pattern of intra-brain interactions, as well as their neuro-visceral connections, would not only be asymmetric but also dynamic and could be modified depending on changes in environmental conditions and/or pathological states (reviewed in [1]).
The results for LeuAP contrast with those obtained for LDH in which no differences are observed with intra- and inter-hemispheric interactions between regions. Rather, they exhibit clear data homogeneity suggesting intra- and inter-hemispheric functional similarity for this metabolic activity (Figure 3 and Figure 4). A specific example of the above, such as the interaction between the frontal cortex and the hippocampus for LDH, is represented in Figure 6.
Interestingly, the previous study of mean values [5], also showed no intra- and inter-hemispheric differences for LDH. In conclusion, the intra- and inter-hemispheric functionality of the LeuAP of the right frontal cortex, and consequently that of its substrates, presents greater heterogeneity than that of the left frontal cortex. A LeuAP activity with greater heterogeneity in its interregional correlation levels suggests its involvement, and consequently that of its substrates such as enkephalins, in a greater diversity of functions or variety in intensity levels for the same function.
Research on the cerebral inter-hemispheric relationship has been carried out from various approaches. Noteworthy are the studies in commissurotomized human brains [20] that earned Roger Sperry the Nobel Prize in 1981 [21]. Very briefly, they proposed that both hemispheres, when connected, function as a unit, with the left or the right hemisphere leading depending on the function. When a given function is altered unilaterally, with the corpus callosum intact, this gives rise to the function being maintained (although defectively) due to the integrated action of both hemispheres. With commissurotomy, the uninjured hemisphere is released from this integration and its own residual function manifests and becomes clearly effective. Recent studies, with more sophisticated non-invasive techniques, have delved into the subject. Thus, we can cite as examples, the observation of the complexity of sensory compensatory mechanisms after unilateral brain lesions, depending on the location of the lesion or the age of the individual [22]. It has been confirmed that there is a topographic organization of the corpus callosum, which is related to specific behaviors [23]. It has also become evident that the asymmetries observed in healthy subjects are modified in pathological conditions, such as cortical asymmetries in altered mood states [24]. It is interesting to cite the reflection that creativity is not an asymmetric function but is the result of the integration of various lateralized cognitive functions [25], which is related to the idea of integral brain functioning despite the fact that individual functions are lateralized.
It is necessary to take into account that functional asymmetries must have neurochemical substrates that support them and for this, neurochemical studies in experimental animals are essential, which may provide valuable information that cannot be approached with studies on humans, but for the moment it is hard to interpret. With the results of the present investigation, and also based on our previous studies [1,26], we can confirm that cerebral asymmetry is not a static but a dynamic concept, which is modifiable in the face of physiological and pathological changes. We can also speculate, connecting with the reflections commented on above, that there is a reciprocal interaction between left and right regions, which transcends the integral asymmetric functioning of the individual, through various forms of neurovisceral connections such as through the autonomic nervous system or through the neuroendocrine system among others [1,26]. This contribution is part of a further and broader study on the multiple intra- and inter-hemispheric interactions of all of the left and right brain regions analyzed. The research was based on data collected earlier in other studies [5]. The Ethics Committee approval was not required.

Author Contributions

Conceptualization, M.R.-S. and F.A.; formal analysis, M.R.-S., I.P., A.B.S., I.B., M.M.-C., G.D.-V., R.D. and F.V.; investigation, M.R.-S., I.P., A.B.S., I.B., M.M.-C., G.D.-V., R.D. and F.V.; writing—original draft preparation, M.R.-S.; writing—review and editing, M.R.-S., I.P., A.B.S., I.B., M.M.-C., G.D.-V., R.D. and F.V.; funding acquisition, M.R.-S., I.P., A.B.S. and I.B. All authors have read and agreed to the published version of the manuscript.

Funding

This research was supported by the group of the University of Jaén “Neuroendocrinology and Nutrition” BIO-221.

Data Availability Statement

The data presented in this study are available on request from the corresponding author.

Conflicts of Interest

The authors declare no conflict of interest.

References

  1. Ramírez-Sánchez, M.; Prieto, I.; Segarra, A.B.; Banegas, I.; Martínez-Cañamero, M.; Domínguez-Vías, G.; de Gasparo, M. Brain Asymmetry: Towards an Asymmetrical Neurovisceral Integration. Symmetry 2021, 13, 2409. [Google Scholar] [CrossRef]
  2. Corballis, M.C. Bilaterally Symmetrical: To Be or Not to Be? Symmetry 2020, 12, 326. [Google Scholar] [CrossRef] [Green Version]
  3. Corballis, M.C. How Asymmetries Evolved: Hearts, Brains, and Molecules. Symmetry 2021, 13, 914. [Google Scholar] [CrossRef]
  4. Homberg, J.R.; Adan, R.A.H.; Alenina, N.; Asiminas, A.; Bader, M.; Beckers, T.; Begg, D.P.; Blokland, A.; Burger, M.E.; van Dijk, G.; et al. The continued need for animals to advance brain research. Neuron 2021, 109, 2374–2379. [Google Scholar] [CrossRef]
  5. Alba, F.; Ramirez, M.; Cantalejo, E.S.; Iribar, C. Aminopeptidase activity is asymmetrically distributed in selected zones of rat brain. Life Sci. 1988, 43, 935–939. [Google Scholar] [CrossRef]
  6. Alba, F.; Iríbar, C.; Ramírez, M.; Arenas, C. Un método fluorimétrico para la determinación de aminopeptidasas cerebrales [A fluorimetric method for the determination of brain aminopeptidases]. Arch. Neurobiol. 1989, 52, 169–173. [Google Scholar]
  7. Hui, M.; Hui, K.S. A new type of neuron-specific aminopeptidase NAP-2 in rat brain synaptosomes. Neurochem. Int. 2008, 53, 317–324. [Google Scholar] [CrossRef] [Green Version]
  8. Ramírez, M.; Prieto, I.; Banegas, I.; Segarra, A.B.; Alba, F. Neuropeptidases. Methods Mol. Biol. 2011, 789, 287–294. [Google Scholar]
  9. Konig, J.F.R.; Klippel, R.A. The Rat Brain; Krieger: Huntington, NY, USA, 1967. [Google Scholar]
  10. Pellegrino, L.J.; Cushman, A.J. A Stereotaxic Atlas of the Rat Brain; Appleton-Century-Crofts: Norwalk, CT, USA, 1967. [Google Scholar]
  11. Greenberg, L.J. Fluorometric measurement of alkaline phosphatase and aminopeptidase activities in the order of 10−14 mole. Biochem. Biophys. Res. Commun. 1962, 9, 430–435. [Google Scholar] [CrossRef]
  12. Bradford, M.M. A rapid and sensitive method for the quantitation of microgram quantities of protein utilizing the principle of protein-dye binding. Anal. Biochem. 1976, 72, 248–254. [Google Scholar] [CrossRef]
  13. Bergmeyer, H.U.; Bernt, E. Lactate dehydrogenase. UV-assay with pyruvate and NADH. In Methods of Enzymatic Analysis; Bergmeyer, H.U., Ed.; Academic Press: New York, NY, USA, 1974; pp. 574–578. [Google Scholar]
  14. Barrett, A.J.; Rawlings, N.D.; Woessner, J.F. (Eds.) The Handbook of Proteolytic Enzymes; Academic Press: London, UK, 1998. [Google Scholar]
  15. Fricker, L.D.; Margolis, E.B.; Gomes, I.; Devi, L.A. Five Decades of Research on Opioid Peptides: Current Knowledge and Unanswered Questions. Mol. Pharmacol. 2020, 98, 96–108. [Google Scholar] [CrossRef] [PubMed]
  16. Glick, S.D.; Cox, R.D. Striatal asymmetry and morphine reinforcement. Brain Res. 1980, 197, 253–255. [Google Scholar] [CrossRef]
  17. Hung, C.R.; Hong, J.S.; Bondy, S.C. Lack of asymmetrical distribution of receptor binding sites and of neurally active peptides within rat brain. Neuroscience 1982, 7, 2295–2298. [Google Scholar] [CrossRef]
  18. Deco, G.; Kringelbach, M.L.; Arnatkeviciute, A.; Oldham, S.; Sabaroedin, K.; Rogasch, N.C.; Aquino, K.M.; Fornito, A. Dynamical consequences of regional heterogeneity in the brain’s transcriptional landscape. Sci. Adv. 2021, 7, eabf4752. [Google Scholar] [CrossRef]
  19. Perez-Nieves, N.; Leung, V.C.H.; Dragotti, P.L.; Goodman, D.F.M. Neural heterogeneity promotes robust learning. Nat. Commun. 2021, 12, 5791. [Google Scholar] [CrossRef]
  20. Gazzaniga, M.S.; Sperry, R.W. Language after section of the cerebral commissures. Brain 1967, 90, 131–148. [Google Scholar] [CrossRef]
  21. Sperry, R. Some effects of disconnecting the cerebral hemispheres. Nobel Lecture, 8 December 1981. Biosci. Rep. 1982, 2, 265–276. [Google Scholar] [CrossRef]
  22. Knijnenburg, A.C.S.; Steinbusch, C.V.M.; Janssen-Potten, Y.J.M.; Defesche, A.; Vermeulen, R.J. Neuro-imaging characteristics of sensory impairment in cerebral palsy; a systematic review. Front. Rehab. Sci. 2023, 4, 1084746. [Google Scholar] [CrossRef]
  23. Fabri, M.; Polonara, G. Functional topography of the corpus callosum as revealed by fMRI and behavioural studies of control subjects and patients with callosal resection. Neuropsychologia 2023, 183, 108533. [Google Scholar] [CrossRef]
  24. Cotovio, G.; Rodrigues da Silva, D.; Real Lage, E.; Seybert, C.; Oliveira-Maia, A.J. Hemispheric asymmetry of motor cortex excitability in mood disorders—Evidence from a systematic review and meta-analysis. Clin. Neurophysiol. 2022, 137, 25–37. [Google Scholar] [CrossRef]
  25. Lindell, A.K. Lateral thinkers are not so laterally minded: Hemispheric asymmetry, interaction, and creativity. Laterality 2011, 16, 479–498. [Google Scholar] [CrossRef] [PubMed]
  26. Prieto, I.; Segarra, A.B.; Martinez-Canamero, M.; De Gasparo, M.; Zorad, S.; Ramirez-Sanchez, M. Bidirectional asymmetry in the neurovisceral communication for the cardiovascular control: New insights. Endocr. Regul. 2017, 51, 157–167. [Google Scholar] [CrossRef] [PubMed] [Green Version]
Figure 3. Representation of the levels of correlation indicated in Table 1 and Table 2. The upper figures indicate intra-hemispheric correlations between the left frontal cortex (FC) and the rest of the left regions (L vs. L) (blue bars) and correlations between right frontal cortex and rest of right regions (R vs. R) (red bars) for LeuAP and LDH. The lower figures indicate inter-hemispheric correlations between left frontal cortex (FC) and right (L vs. R) regions (blue bars) and correlations between right frontal cortex and left (R vs. L) regions (red bars) for LeuAP and LDH. Abbreviations: frontal cortex (FC), parietal cortex (PC), occipital cortex (OC), striatum (ST), thalamus (TA), hypothalamus (HT), mesencephalon (MS), medulla (MD), cerebellum (CE), hippocampus (HC), and spinal cord (SC).
Symmetry 15 01320 g003
Figure 4. The upper figures indicate the percentage increase between the levels of correlation of the left frontal cortex versus the rest of the left regions (L vs. L) and the right frontal cortex versus the rest of the right regions (R vs. R) for LeuAP (column C of Table 1) and LDH (column C of Table 2): [(higher value/lower value) − 1] × 100. The lower figures indicate percentage increases between the levels of correlation between left frontal cortex versus right regions (L vs. R) and right frontal cortex versus left regions (R vs. L) for LeuAP (column F of Table 1) and LDH (column F of Table 2): [(higher value/lower value) − 1] × 100: positive values indicate predominance of the value of L vs. L over the value of R vs. R and also of the value of L vs. R over the value of R vs. L. Negative values indicate a predominance of the value of R vs. R over the value of L vs. L and also of the value of R vs. L versus the value of L vs. R. Abbreviations: frontal cortex (FC), parietal cortex (PC), occipital cortex (OC), striatum (ST), thalamus (TA), hypothalamus (HT), mesencephalon (MS), medulla (MD), cerebellum (CE), hippocampus (HC), and spinal cord (SC).
Symmetry 15 01320 g004
Figure 5. Example of intra- and inter-hemispheric correlations of LeuAP between frontal cortex and hippocampus.
Symmetry 15 01320 g005
Figure 6. Example of intra- and inter-hemispheric correlations of LDH between frontal cortex and hippocampus.
Symmetry 15 01320 g006
Table 1. Levels of correlation and percentage of left or right predominance of leucine aminoeptidase (LeuAP) activity. All the correlation values were positive. A: Levels of correlation between the left frontal cortex (LFC) versus the rest of the left regions (L vs. L). B: Levels of correlation between the right frontal cortex (RFC) versus the rest of the right regions (R vs. R). C: Percentage increase between A and B: [(higher value/lower value) − 1] × 100: positive values indicate left predominance and negative values indicate right predominance (Figure 4). D: Levels of correlation between left frontal cortex (LFC) versus right regions (L vs. R). E: Levels of correlation between right frontal cortex (RFC) versus left regions (R vs. L). C: Percentage increase between D and E: [(higher value/lower value) − 1] × 100: positive values indicate left predominance and negative values indicate right predominance (Figure 4). The last row indicates the percentage increase between the highest and lowest value of the corresponding column. Abbreviations: frontal cortex (FC), parietal cortex (PC), occipital cortex (OC), striatum (ST), thalamus (TA), hypothalamus (HT), mesencephalon (MS), medulla (MD), cerebellum (CE), hippocampus (HC), and spinal cord (SC).
LeuAP (n = 21)
ABCDEF
L vs. LR vs. R L vs. RR vs. L
LFCRFC%LFCRFC%
LFC 1RFC 10RFC 0.67LFC 0.670
LPC 0.77RPC 0.93−20.7RPC 0.79LPC 0.81−20.8
LOC 0.83ROC 0.78+6.4ROC 0.75LOC 0.77−2.6
LST 0.78RST 0.76+2.6RST 0.88LST 0.86+2.3
LTA 0.61RTA 0.72−18RTA 0.92LTA 0.79+16.4
LHT 0.88RHT 0.75+17.3RHT 0.93LHT 0.67+38.8
LMS 0.94RMS 0.69+36.2RMS 0.94LMS 0.63+49.2
LMD 0.90RMD 0.43+109.3RMD 0.88LMD 0.51+72.5
LCE 0.90RCE 0.59+52.5RCE 0.92LCE 0.49+87.7
LHC 0.94RHC 0.31+203.2RHC 0.84LHC 0.60+40
LSC 0.89RSC 0.71+25.3RSC 0.92LSC 0.64+43.7
63.9%222.5% 40.2%75.5%
Table 2. Levels of correlation and percentage of left or right prevalence of LDH activity. All the correlation values were positive. A: Levels of correlation between the left frontal cortex (LFC) versus the rest of the left regions (L vs. L). B: Levels of correlation between the right frontal cortex (RFC) versus the rest of the right regions (R vs. R). C: Percentage increase between A and B: [(higher value/lower value) − 1] × 100: positive values indicate left predominance and negative values indicate right predominance (Figure 4). D: Levels of correlation between left frontal cortex (LFC) versus right regions (L vs. R). E: Levels of correlation between right frontal cortex (RFC) versus left regions (R vs. L). C: Percentage increase between D and E: [(higher value/lower value) − 1] × 100: positive values indicate left predominance and negative values indicate right predominance (Figure 4). The last row indicates the percentage increase between the highest and lowest value of the corresponding column. Abbreviations: frontal cortex (FC), parietal cortex (PC), occipital cortex (OC), striatum (ST), thalamus (TA), hypothalamus (HT), mesencephalon (MS), medulla (MD), cerebellum (CE), hippocampus (HC), and spinal cord (SC).
LDH (n = 18)
ABCDEF
L vs. LR vs. R L vs. RR vs. L
LFCRFC%LFCRFC%
LFC 1RFC 10RFC 0.94LFC 0.940
LPC 0.85RPC 0.850RPC 0.77LPC 0.90−16.8
LOC 0.69ROC 0.88−27.5ROC 0.78LOC 0.82−5.1
LST 0.75RST 0.93−24RST 0.91LST 0.82+10.9
LTA 0.85RTA 0.93−9.4RTA 0.89LTA 0.93−4.4
LHT 0.74RHT 0.81−9.4RHT 0.80LHT 0.73+9.5
LMS 0.89RMS 0.86+3.4RMS 0.85LMS 0.89−4.7
LMD 0.89RMD 0.84+5.9RMD 0.91LMD 0.85+7
LCE 0.90RCE 0.85+5.8RCE 0.90LCE 0.88+2.2
LHC 0.92RHC 0.85+8.2RHC 0.90LHC 0.92−2.2
LSC 0.82RSC 0.86−4.8RSC 0.83LSC 0.87−4.8
44.9%23.4% 22%28.7%
Disclaimer/Publisher’s Note: The statements, opinions and data contained in all publications are solely those of the individual author(s) and contributor(s) and not of MDPI and/or the editor(s). MDPI and/or the editor(s) disclaim responsibility for any injury to people or property resulting from any ideas, methods, instructions or products referred to in the content.

