
A Two-Step Model-Based Reconstruction and Imaging Method for Baseline-Free Lamb Wave Inspection
1
Science and Technology on Reactor System Design Technology Laboratory, Nuclear Power Institute of China, Chengdu 610213, China
2
School of Reliability and Systems Engineering, Beihang University, Xueyuan Road No. 37, Haidian District, Beijing 100191, China
3
Advanced Manufacturing Center, Ningbo Institute of Technology, Beihang University, Ningbo 315100, China
4
Key Lab of Modern Optical Technologies of Jiangsu Province, Soochow University, Suzhou 215006, China
*
Author to whom correspondence should be addressed.
Symmetry 2023, 15(6), 1171; https://doi.org/10.3390/sym15061171
Submission received: 17 March 2023
/
Revised: 10 May 2023
/
Accepted: 24 May 2023
/
Published: 30 May 2023
(This article belongs to the Special Issue New Developments in Guided Waves (GW) and Nondestructive Testing (NDT): Propagation, Design and Applications)
Abstract
:Traditional Lamb wave inspection and imaging methods heavily rely on prior knowledge of dispersion curves and baseline recordings, which may not be feasible in the majority of real cases due to production uncertainties and environmental variations. In order to solve this problem, a two-step Lamb wave strategy utilizing adaptive multiple signal classification (MUSIC) and sparse reconstruction of dispersion reconstruction is proposed. The multimodal Lamb waves are initially reconstructed in the f-k domain using random measurements, allowing for the identification and characterization of multimodal Lamb waves. Then, using local polynomial expansion and derivation, the phase and group velocities for each Lamb wave mode could be computed. Thus, the steering vectors of all potential scattering Lamb waves for each grid in the scanning area can be established, thereby allowing for the formulation of the MUSIC algorithm. To increase the precision and adaptability of the MUSIC method, the local wave components resulting from potential scatters are extracted with an adaptive window, which is governed by the group velocities and distances of Lamb wave propagation. As a result, the reconstructed dispersion relations and windowed wave components can be used to highlight the scattering features. For the method investigation, both a simulation and experiment are carried out, and both the dispersion curves and damage locations can be detected. The results demonstrate that damage localization is possible without theoretical dispersion data and baseline recordings while exhibiting a considerable accuracy and resolution.
1. Introduction
Thin-walled plates made of metal or composites are widely used in various industrial fields including aerospace engineering, civil engineering, and transportation due to their outstanding mechanical and structural performance. Nevertheless, various damages may occur due to harsh working conditions and material degradation with the increase of service time, which may result in an unexpected accident or even a catastrophe. Hence, reliable and accurate inspection techniques are urgently needed to identify and locate the damages at its early stage with the purpose of increasing structural safety and reducing maintenance costs. The Lamb wave technique has been proven to be one of the most promising structural health monitoring (SHM) and nondestructive evaluation (NDE) techniques for plate-like structures due to its superior capacities in long-distance propagation and sensitivity to various kinds of damages, which allows for the large-scale inspection of plates with a high accuracy and efficiency [1,2,3].
The principles behind Lamb wave inspection are that Lamb waves would suffer from transmission, reflection, and mode conversion when encountering structural discontinuities, thereby causing signal distortion or producing new components [4,5]. With the help of advanced signal processing methods, damage features can be further extracted and quantified from the dispersive and multimodal Lamb wave signals. For instance, the Hilbert transform [6] is commonly used for time-of-flight estimations, which allows for a distance estimation of Lamb wave propagation. Spectrum analysis [7] is adopted for nonlinearity quantification so that the damage extension can be evaluated at its early stage. Time–frequency analysis [8,9] is exploited for multimodal and dispersive Lamb wave analysis where mode conversion and propagation can be revealed. Meanwhile, phase unwrapping [10] and two-dimensional Fourier transform (2DFFT) [11,12] are carried out for local wavenumber computation and mode identification so that the thickness loss of a structure can be quantitatively evaluated. Since Lamb waves carry a wealth of structural information, the changes of structural integrity can be rationally characterized by the signatures of the measured signals.
To further locate the damages inside structures, various Lamb wave-based damage localization and imaging methods employing a certain number of sensors are explored, where the damage features are fused with the help of sensor array or wavefield scanning. Among them, the delay-and-sum imaging method [13], ToF-based triangulation method [14], probability-based diagnostic imaging [15], multi-signal classification algorithm (MUSIC) method [16], and machine learning methods [17] are widely explored in which they display an excellent performance in damage imaging. However, in the above method, the performance of damage inspection highly relies on the data quality of baseline recordings in the pristine plates. Baseline-free methods, e.g., time-reversal [18], matching pursuit, and the sparse imaging method [19,20], are also investigated while the numerical model of Lamb wave propagation must be established as a reference. This is only feasible when the material properties and structural geometry are already given. However, various uncertainties including manufacturing and temperature variation may cause a significant error in elastic parameters, thereby introducing computation errors to the derived Lamb wave dispersion curves. The wavefield method [21,22] with redundant spatial and temporal information is another choice for dispersion curves reconstruction and damage imaging by using a high-dimension Fourier transform. However, a dense number of spatial measurements is strictly required which is time-consuming and laborious.
In order to address the above issues, a two-step model-based reconstruction and imaging method is proposed for damage imaging with a small amount of sensors. Firstly, the compressed sensing method is adopted for the dispersion curves reconstruction where only direct waves are utilized in the model, so that the Lamb wave dispersion curves can be calculated with the experimental data. Subsequently, the steering vectors of all potential scattering Lamb waves for each grid in the scanning area can be predicted with a given distance. To highlight the reflection signatures, an improved model matching method utilizing the MUSIC technique is proposed by adaptively scattering signal identification and selection. Hence, the scatter sources can be located with a high accuracy without prior knowledge.
The organization of the paper is as follows. In Section 2, the fundamental of Lamb wave propagation is briefly introduced. In Section 3, the reconstruction of Lamb waves in the f-k domain with few measurements is proposed as well as the damage imaging method. Section 4 presents the performance of the proposed method on simulation data and the guidelines for damage localization. The experimental validation on composite materials is performed in Section 5 and the conclusions are summarized in Section 6.
2. Fundamentals of Lamb Wave Propagation in Thin Plates
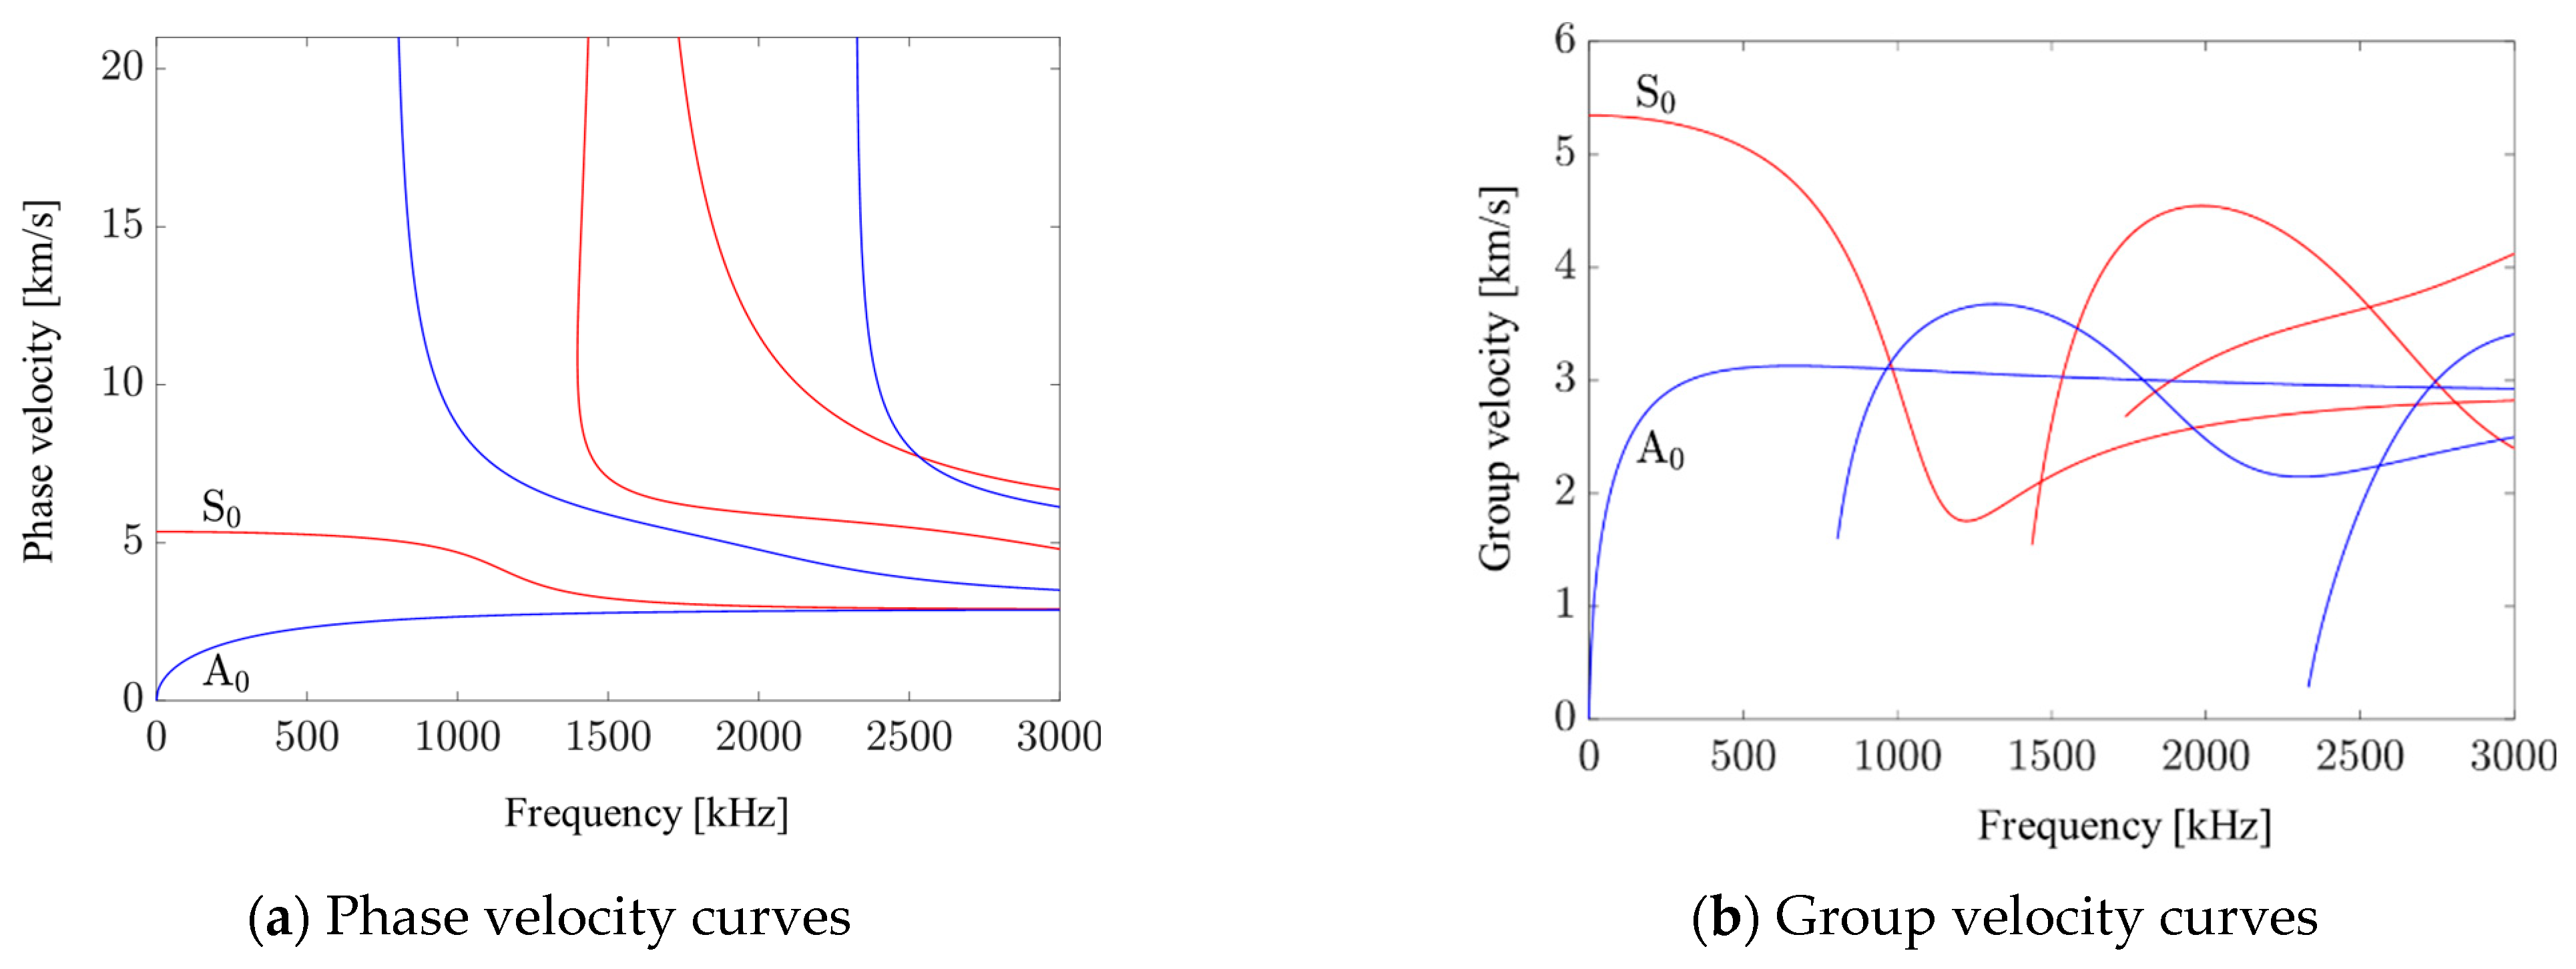
Lamb waves are a family of elastic waves propagating in traction-free plates, which are governed by the Rayleigh–Lamb equation [23]. According to the symmetry of particle motions, Lamb waves can be divided into two groups, i.e., symmetric modes and anti-symmetric modes. To describe the propagation characteristics of Lamb waves, dispersion curves are commonly used, which show the multimodal and dispersion characteristics of Lamb waves. According to the dispersion curves illustrated in Figure 1, only fundamental Lamb wave modes (i.e., A0 mode and S0 mode) exist through the entire frequency range while high-order Lamb wave modes will appear when there is an excited signal with a frequency beyond the cut-off frequencies. In most Lamb wave detection scenarios, only fundamental Lamb wave modes are used in order to reduce the number of wave components.
On the basis of the Lamb propagation model and dispersion curves, the propagation of Lamb waves can be numerically simulated with a given propagating distance d and the wavenumber k(ω), where the wavenumber can be derived through k(ω) = . Consider that only a single Lamb wave mode propagates in a two-dimensional thin plate, the Lamb wave signal captured by the location L2 after it has traveled from the source L1 can be written by
where ||•|| is the norm operation and F−1{•} represents the inverse Fourier transform. F(ω) represents the excitation spectrum and A(ω) is the amplitude modulation. For multimodal Lamb waves propagating in the plate, the response returns to a linear summation of all excitable Lamb wave modes.
When there are defects in the plate, Lamb waves scatter in a way that depends on the shape of the defect. In practice, the Born approximation, which states that multiple defects can be treated as independently secondary point sources, is useful for simplifying the scattering model of Lamb waves. As a result, the scattering wave travels the length of its path. Suppose that the kth defect is located at dk, the output signal with a pair of transducers located at L1 and L2 can be formulated by
It should be noted that the expression ignores both boundary reflections and other geometrical scatterings. When there are multiple defects in the structure, the output signal must consider all scattering paths. It is necessary to update the velocities of Lamb waves with directional dispersion curves for anisotropic plates. Although the propagation model is useful for revealing Lamb wave propagation and extracting features, it is difficult to guarantee the accuracy and reliability of the predicting results due to unavoidable variations in the dispersion curves.
3. Two-Step Lamb Wave Model-Based Reconstruction and Imaging Method
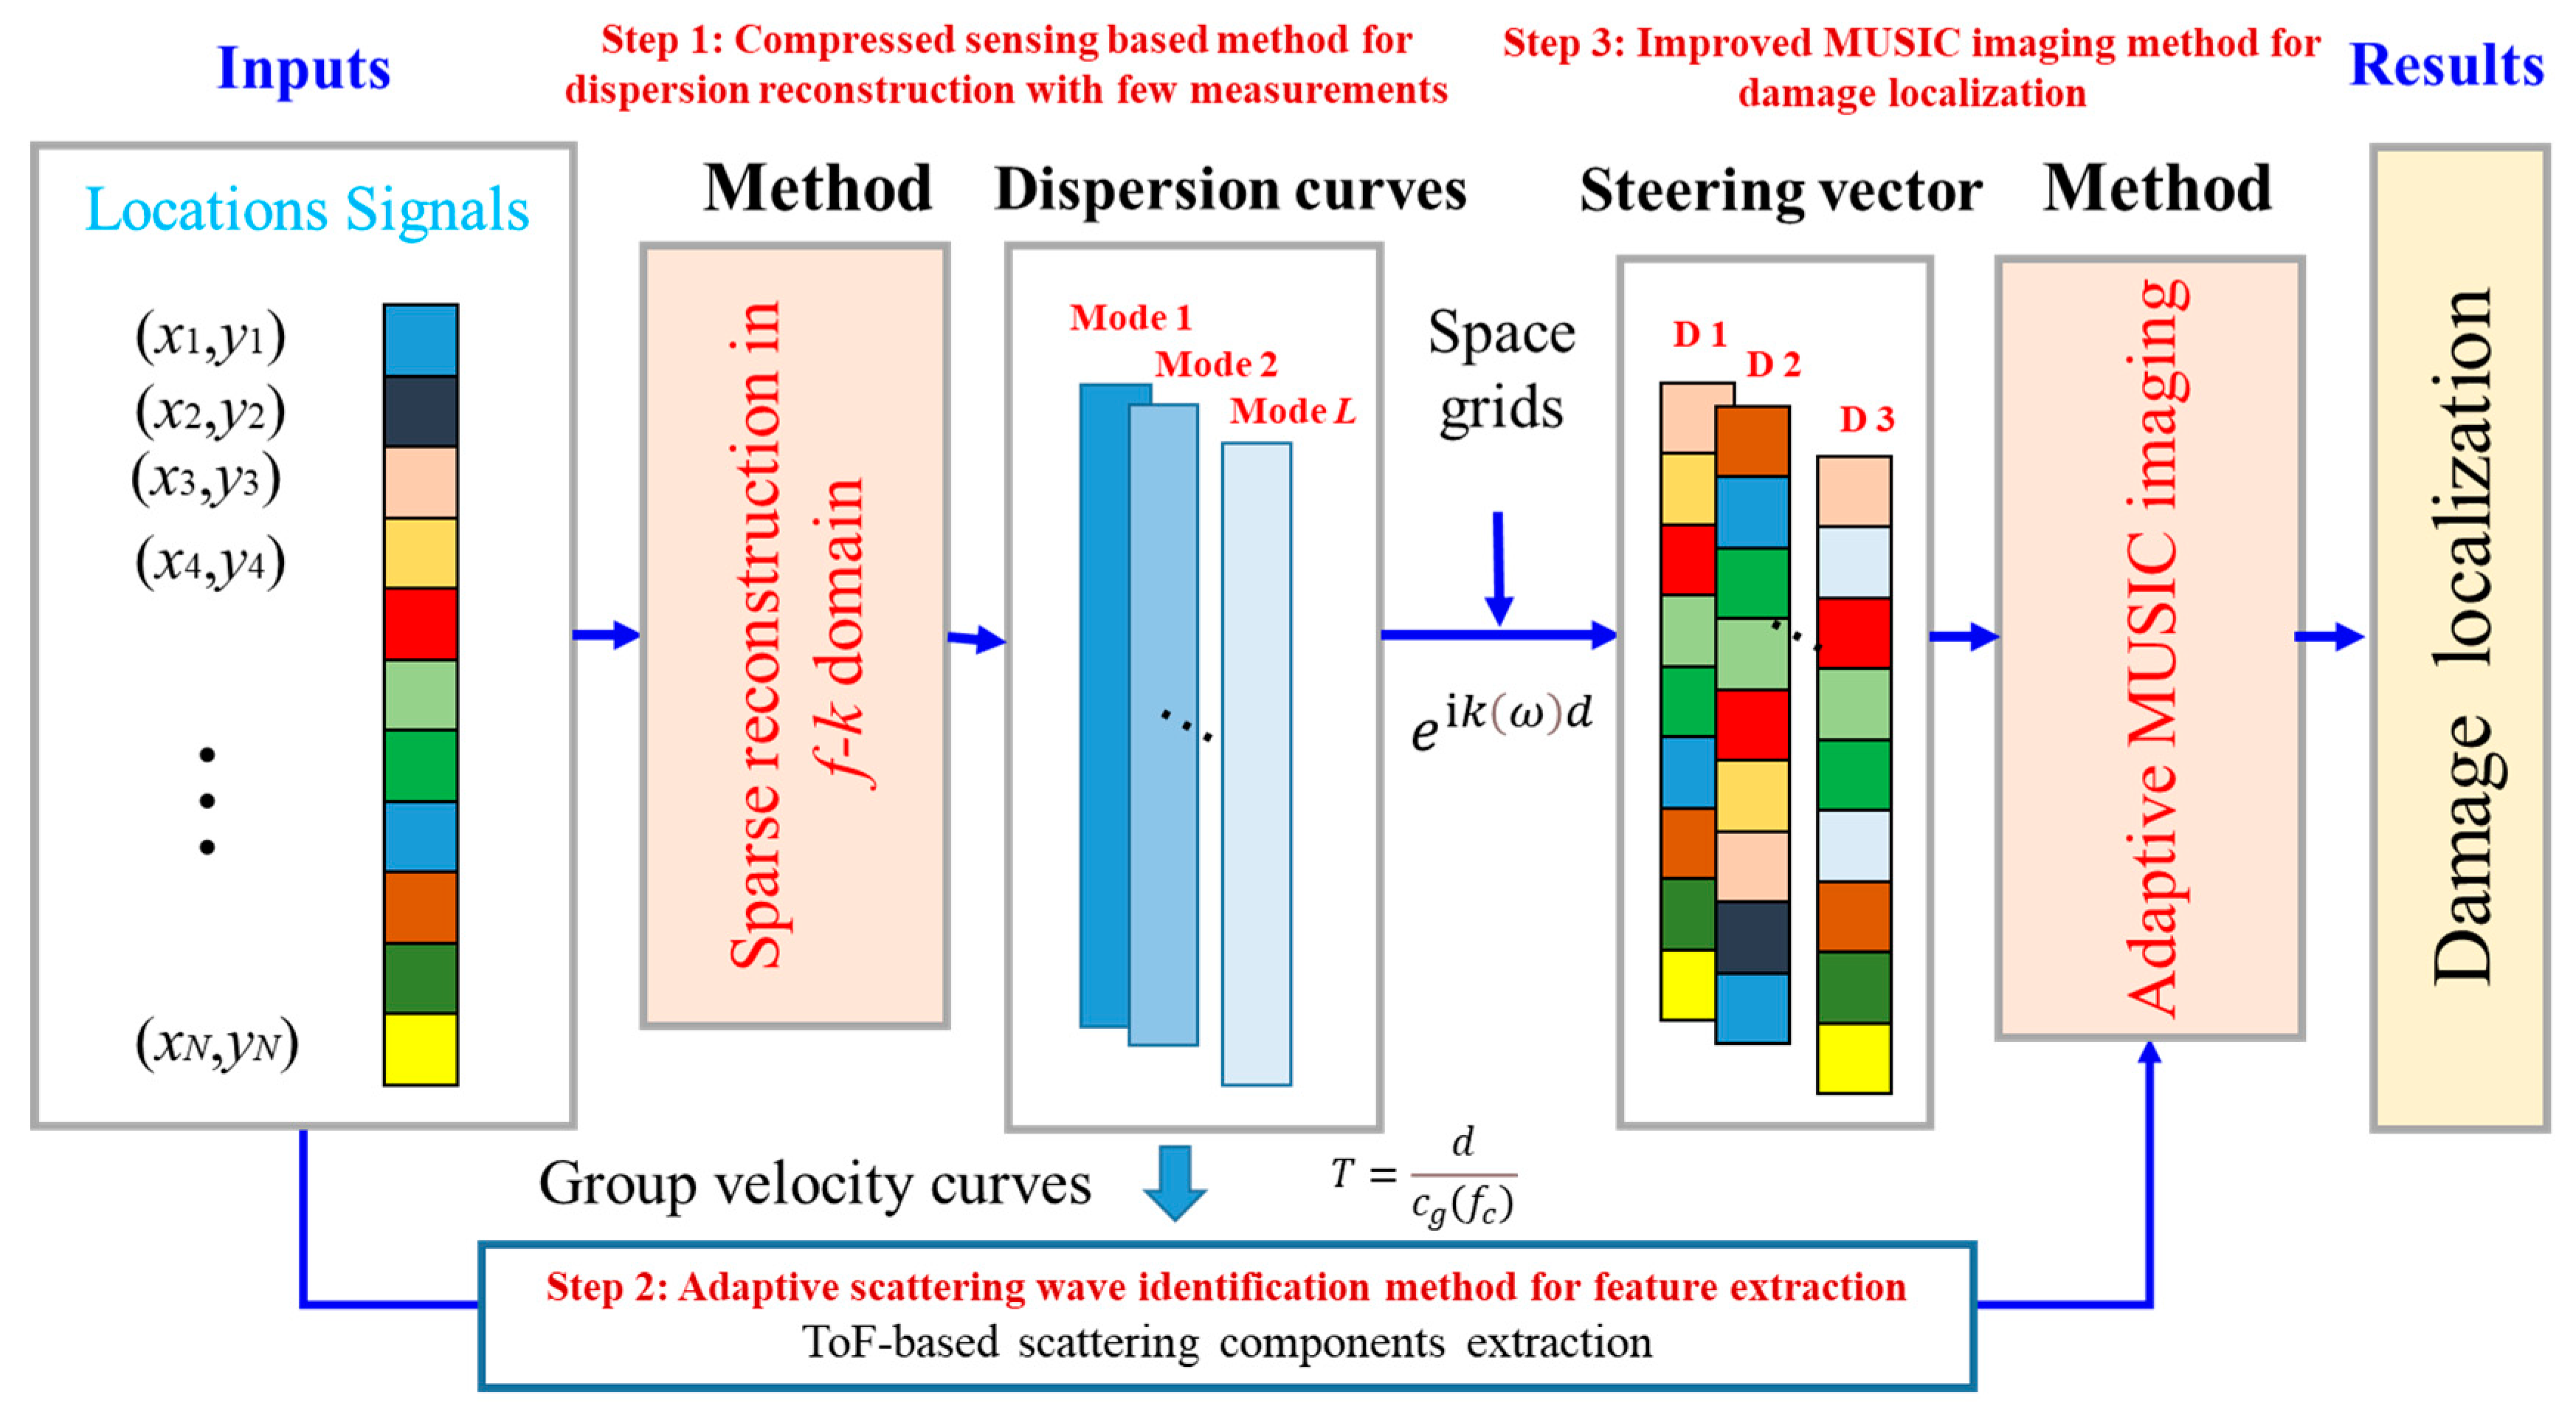
This section introduces a two-step baseline-free damage imaging method that uses sparse reconstruction for dispersion curve reconstruction and the MUSIC method for damage detection, as illustrated by the flowchart in Figure 2. To fully utilize the measured signals, the Lamb wave dispersion relation is first reconstructed by locating the incident components in the f-k domain, which has significant advantages in resisting the changes caused by material parameter variations and environmental differences in practical applications. The second step is to build a steering vector and highlight the scattering waves to improve the performance of the MUSIC imaging method. As a result, even without prior knowledge, the damage can be localized with limited space distributed measurements.
3.1. Sparse Reconstruction in f-k Domain for Directly Arrived Lamb Wave Signals
The principle of the compressed sensing method is that if a signal x can be represented in a sparse way, i.e., only a few components in the signal are non-zero, then this signal can be reconstructed with considerable accuracy from a few randomly chosen measurements. The compressed sensing method has been proven to be effective in reconstructing the component of interest from the signal sampled below the Nyquist request within different domains. The general expression of CS formulation, which is governed by [24], is
where Y is the measurement and is the sensing matrix. x is the signal in the domain that needs to be reconstructed. Under the down-sampling configuration, the dimension of the measurement signals Y is much smaller than that of the signal x.
In terms of dispersive Lamb wave processing, its representation in the f-k domain can be sparse. Hence, the sparse reconstruction of the Lamb wave signal is feasible by solving the sparse function of the Lamb wave decomposed in the f-k domain. For Lamb wave signals with a specific frequency range, the expression of amplitude distribution for each wave mode in the f-k domain can be treated as a discretized combination of frequency–wavenumber coordinates and complex magnitudes. On this basis, to simplify the representation of Lamb wave propagation, the two-dimensional amplitude distribution V(ω, k) in the f-k domain is formulated according to Equation (1), which can be defined as [25]
For K randomly distributed measurements with known locations, the collection of signals Y with distance matrix d = [d1, d2, d3…dK] of given transducer–sensor pairs at angular frequency ω for all possible Lamb wave modes can be recast into an M × 1 vector. Since the V(ω, k) is discretized with the linearly sampled frequency and wavenumber, only the specific frequency–wavenumber relations yield Lamb wave modes. Therefore, the Lamb waves described in V(ω, k) are sparse. For clarity, the linear expression of the measurements with the f-k distribution function is written as
where A is the system matrix defined by the Fourier transform operator, expressed by
To recover the dispersion relation of Lamb waves with limited measurements, the CS technique is applied by optimizing the function V(ω, k) with the minimum number of non-zero values. The Basis Pursuit Denoising (BPDN) optimization algorithm is used where the l0-norm problem is replaced by the l1-norm case in the calculation, thereby setting the problem to be a convex problem. Thus, the dispersion curves of multiple Lamb wave signals can be recovered by solving [25]
Furthermore, the dispersion relation can also be defined by locating the corresponding f-k ridges. Thus, the f-k ridges can be extracted by locating concentrated energy maps in the f-k domain, which can be extracted by
Although dispersion curves can be extracted from the sparse representation of Lamb waves in the f-k domain, the resolution is limited by the discrete process of frequency and wavenumber steps due to a calculation efficiency consideration. To further smooth and accurately approximate the dispersion curves, local polynomial interpolation is used, and the smoothed dispersion curve k′(ω) can be calculated, which performs well in terms of improving curve continuity and derivability. On this basis, the group velocity of the desired Lamb wave mode can be deviated by
As a result, the propagation characteristics of the Lamb wave can be fully driven by the direct arrived Lamb wave components in the experimental data. Both phase velocities and group velocities are obtained, and the Lamb wave propagation model is constructed.
3.2. Adaptive MUSIC Method for Damage Imaging and Localization
The traditional MUSIC method exploits the orthogonality of signal subspace and noise subspace and then applies a series of steering vectors to match the principal components of the signal features [26,27]. However, a full length signal consisting of multimode and edge reflections introduce the errors to the eigenvalue decomposition. Based on the reconstructed dispersion curves and Lamb wave propagation model, it is feasible to highlight the possible scatter waves with a propagation distance of d by adaptively filtering the signal with a temporal window T centered at d/cg and a time duration related to excitation duration. Considering the noise, the local scattering signals Y of the M sensor array for a specific location (x, y) with a propagating distance of d can be written in a matrix form
where N represents the noise and S is the virtual excitation of scatter sources. T is the adaptive temporal window with a duration same to the excitation length by ignoring the dispersion effect when using narrow band signals. Meanwhile, A is the steering vector indicating the incoming waves with respect to the sensing array, which can be written as
where k(ω) is the dispersion relation of the corresponding Lamb wave mode, which is determined through the experimental reconstruction in this paper. Since the Lamb wave is dispersive, the narrowband signal is used to suppress the dispersion and the wavenumber value at the center frequency of the signal is adopted for steering the vector construction.
To decompose the principal components of the time windowed components and find the scatter source locations, the covariance matrix of C is firstly formed before the matrix eigenvalue decomposition, which can be determined by
where the superscript ‘H’ indicates conjugate transpose operators and N is the length of the windowed signal Y(T). By eigenvalue decomposition, the covariance matrix can be decomposed into two subspaces with respect to signal and noise, which is
Where US and UN are the signal and noise subspace of the windowed waveform, respectively. ∑S and ∑N are the corresponding eigenvalue matrix. In general, the signal subspace and the noise subspace are orthogonal, which means that the noise subspace and signal subspace are irrelevant when a scattering source exists. Since the signal subspace can be predicted with the steering vector and scatter source location, the possibility of damage location can be estimated by
where d(x,y) is the distance matrix regarding the Lamb wave propagating from the source to the spatial point (x, y) and then to the sensor array. When incoming waves travel from a true scattering source, the likelihood of a damage location increases significantly. As a result, by searching all possible scattering sources in the detection area, the damage can be localized. It should be noted that damage size is ignored with the proposed method due to the Born approximation. As reflections always occur at the edge of the damage, the reflection features would focus around the damage. The detected location of the damage resulting from all sensor pairs is approximated by the mean location of all edge reflection points, which can be used for damage center detection. Meanwhile, the smallest damage that can be detected is also determined by the wavelength of the excited Lamb waves. This can be designed accordingly with the excitation optimization. In addition, the largest size of damage that can be detected is determined by the wavelength, excitation duration, and the arrangement of measurements comprehensively. In this paper, the damage size is optimized for the method investigation.
4. Simulation Study of Multiple Damage Imaging in Aluminum Plate
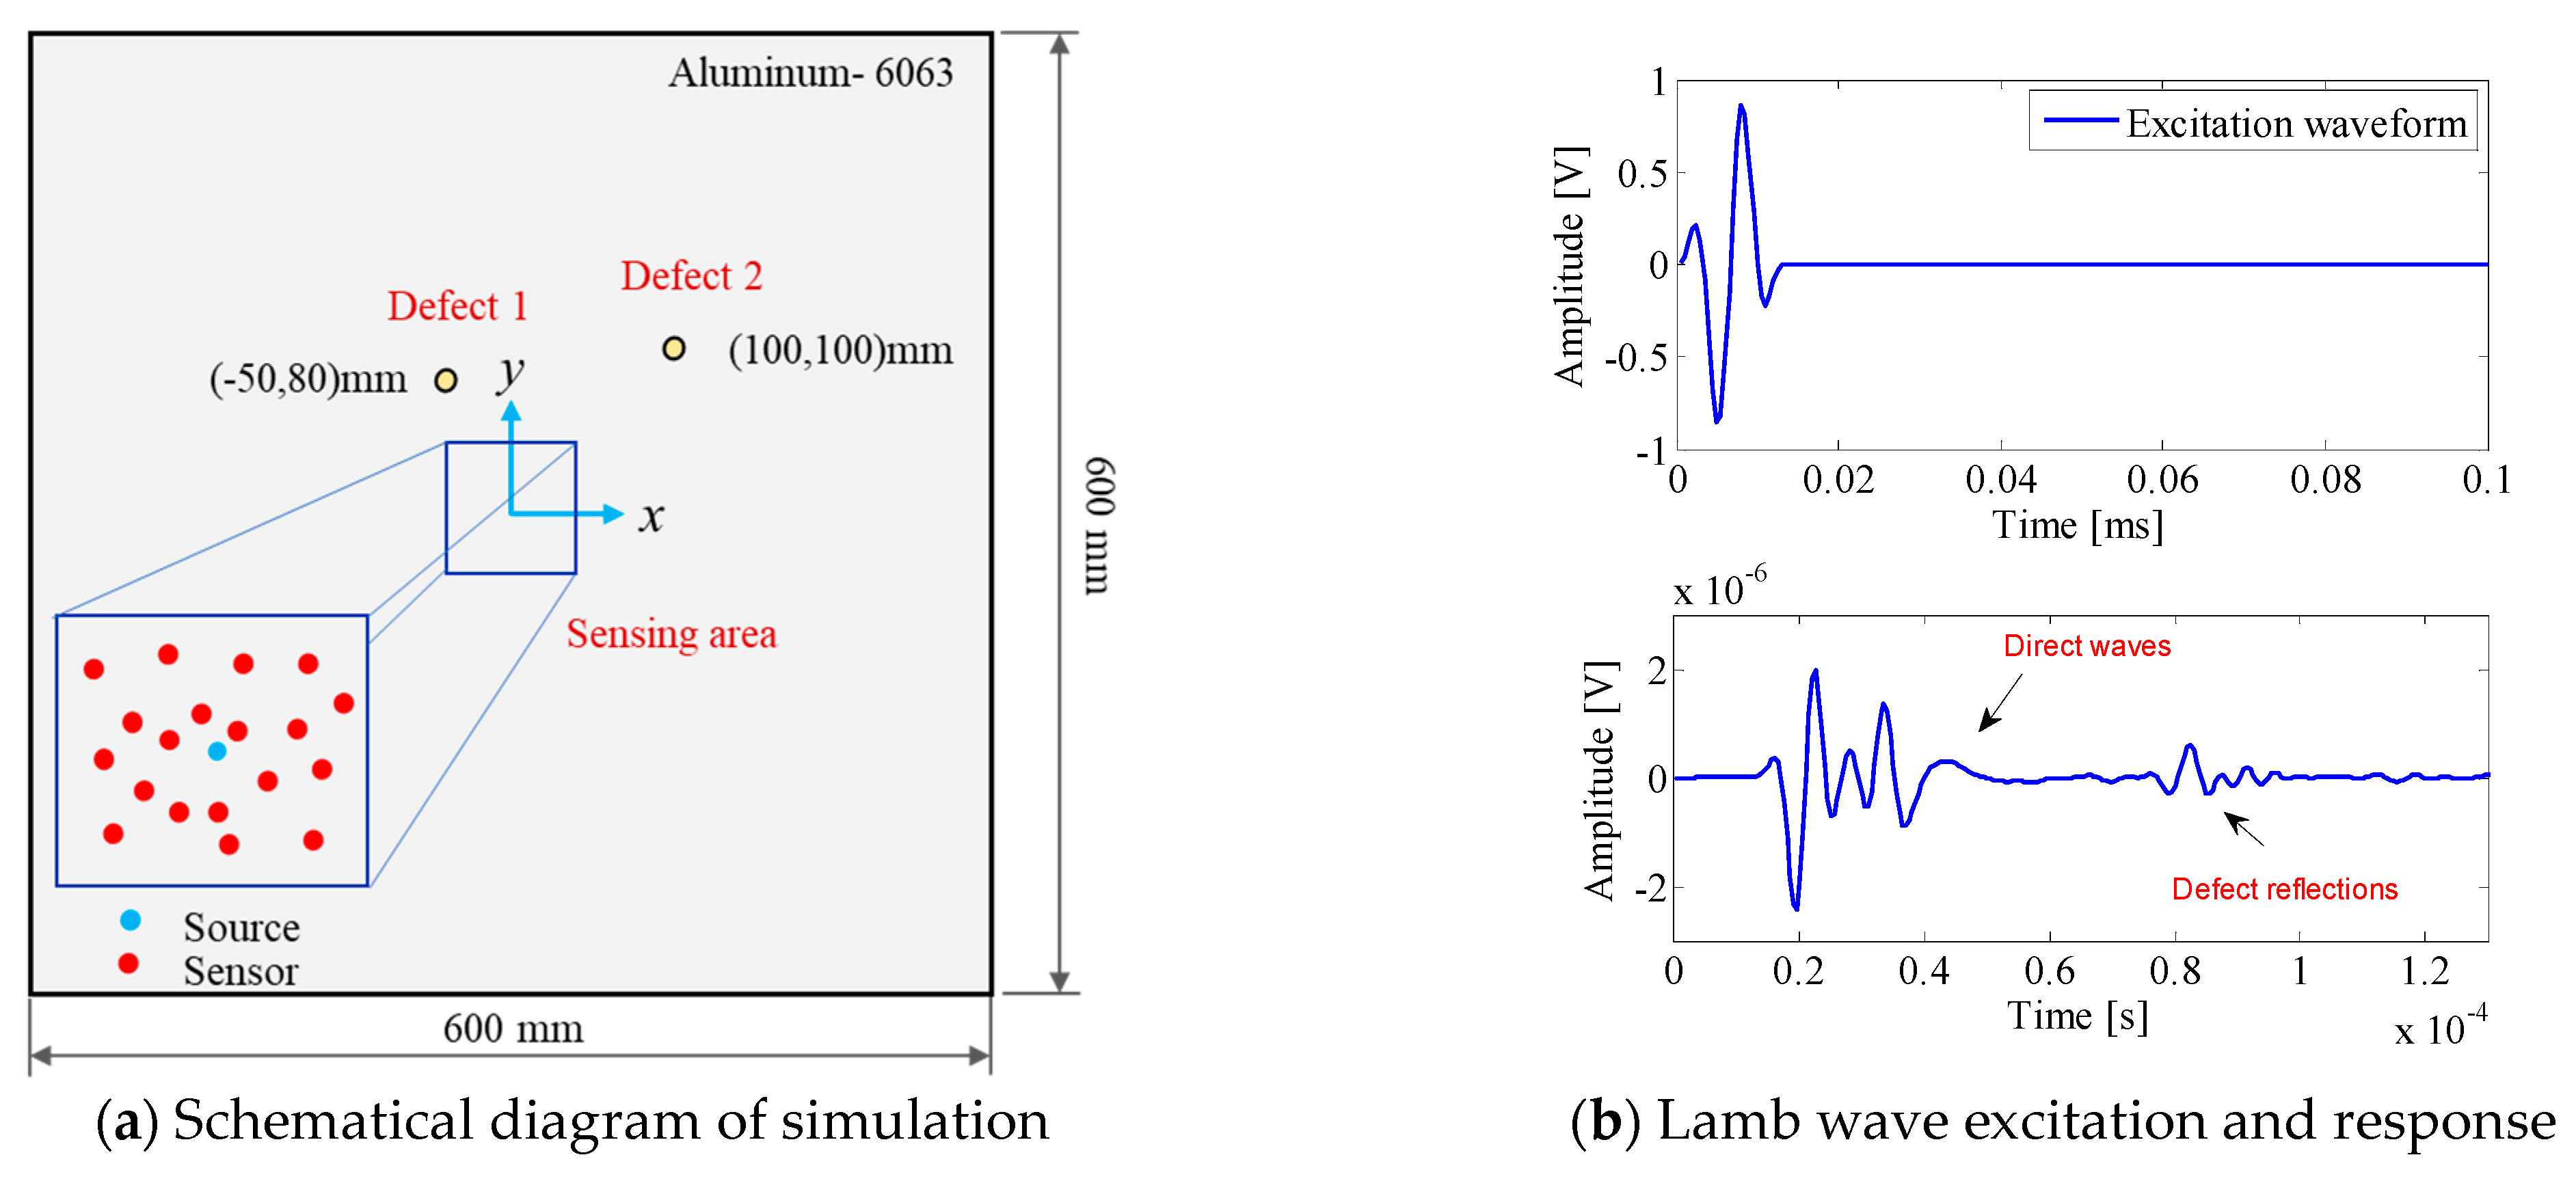
In order to introduce and verify the combined sparse reconstruction method, an aluminum plate (6063-Alumium) with a dimension of 600 mm × 600 mm × 2 mm was modeled and analyzed with the COMSOL software. Two through-hole damages with a diameter of 10 mm are created in the plate as artificial defects. The simulation setup and sensing area are shown in Figure 3a, A 2-cycle toneburst signal centered at 150 kHz is employed as the excitation signal. Measurements of 15 and 30 in the sensing area are randomly selected to establish the signal matrix. The excitation waveform and the example temporal response are given in Figure 3b. It can be seen in the example signal that the reflections in the amplitude are much smaller than that of the direct waves. Hence, the weak defect features must be processed in order to improve the damage imaging quality.
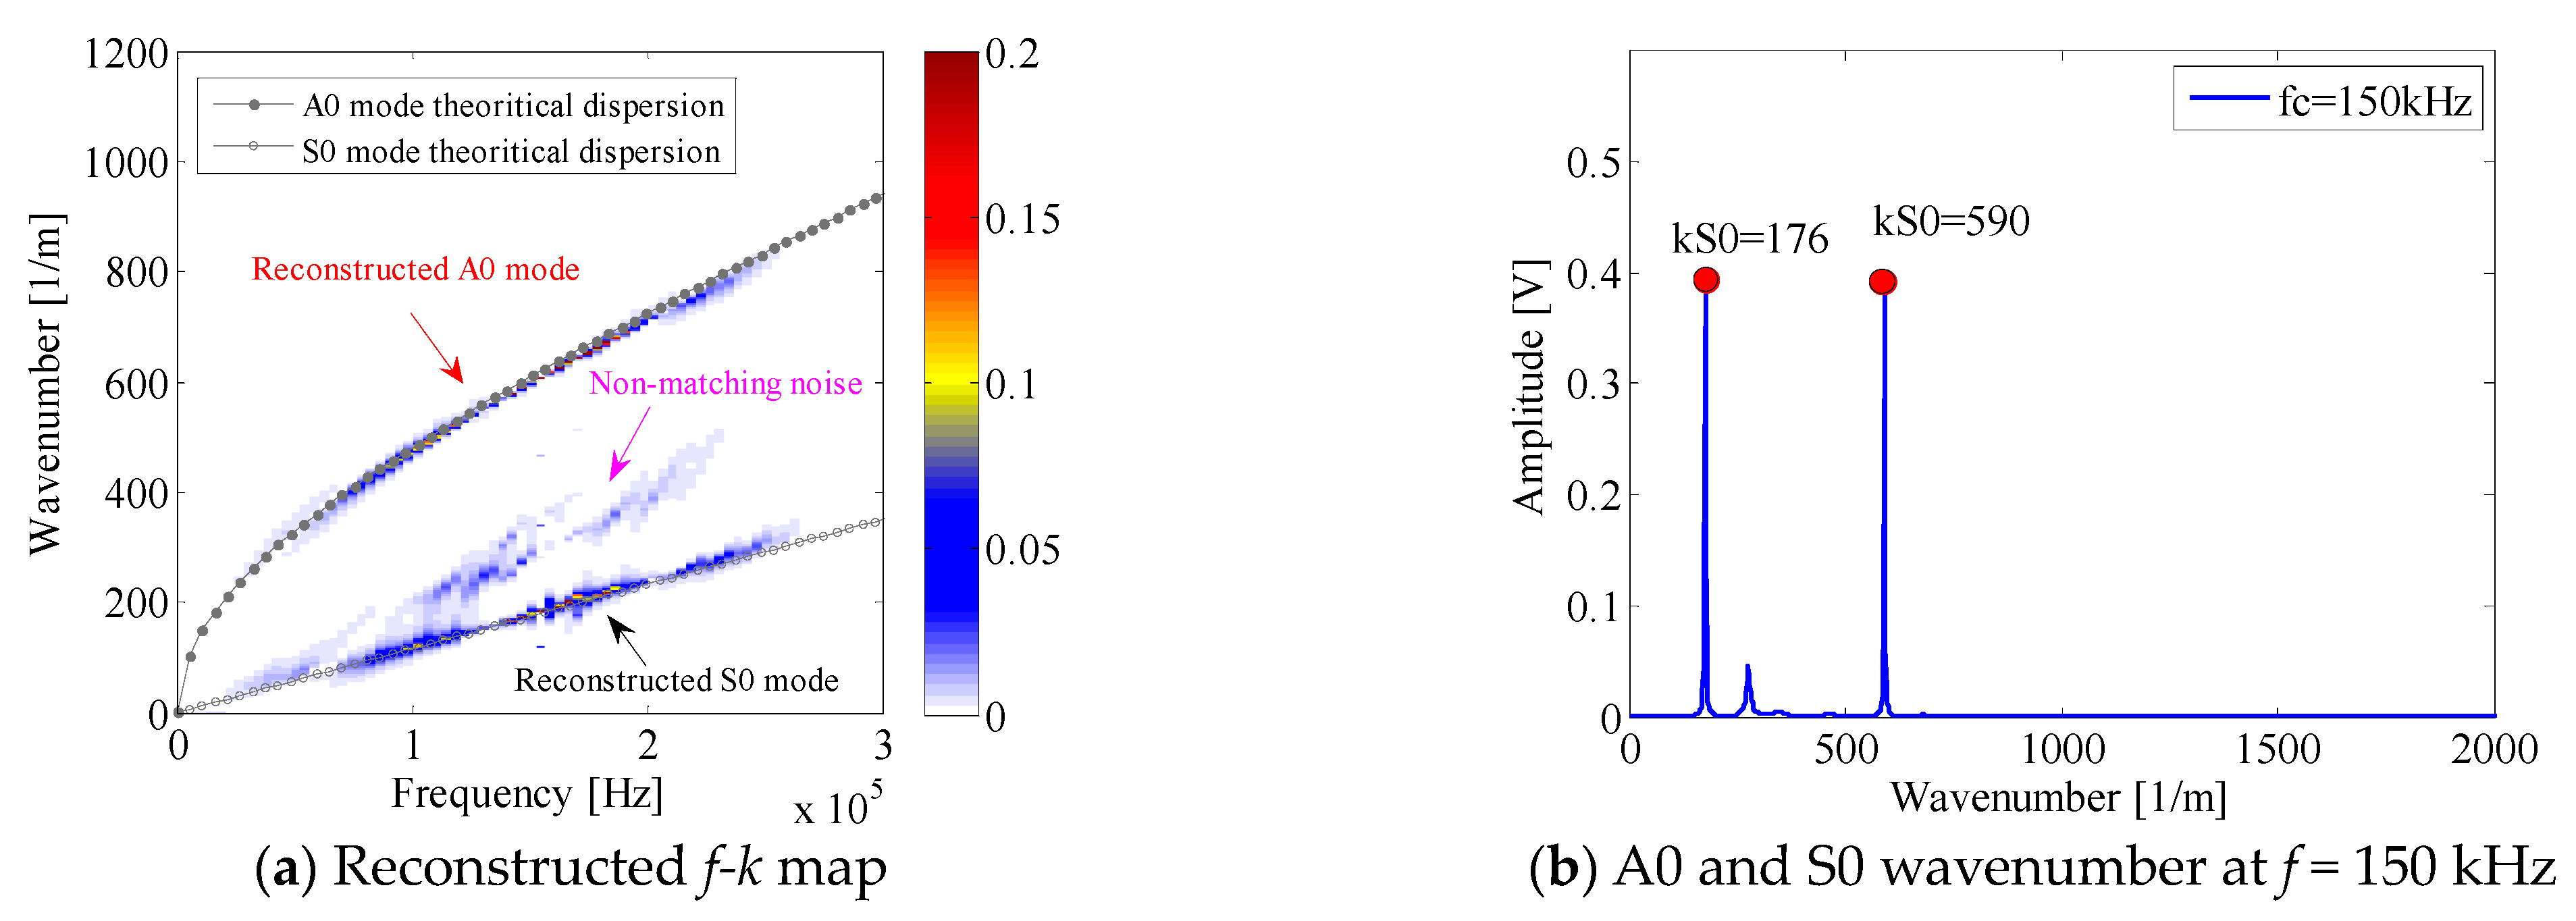
Supposing that the material properties are unknown, the reconstruction of Lamb wave dispersion relations is firstly conducted based on the sparse reconstruction model in the f-k domain. With the given locations of the measurements and the measuring matrix represented in the frequency domain, the f-k domain representation of simulated Lamb wave signals can be calculated, as shown in Figure 4a. Since the sensing matrix formulated by the Lamb wave propagation model only considers the direct arrived components, the direct Lamb wave components can be accurately recovered while the reflections are reconstructed as non-matching noise in the f-k map. By searching the ridges of concentrated wave components, the reconstructed dispersion curves can be extracted, which agrees well with the theoretical results. In order to predict the steering vector of single-frequency Lamb wave signals within the detection area, the wavenumber of the Lamb wave signal centered at fc is extracted for illustration, as shown in Figure 4b, which are 176 1/m and 590 1/m for the S0 and A0 mode, respectively. To show the accuracy of the reconstructed dispersion curves, the estimated wavenumber error is calculated through
where kreal is the theoretical wavenumber value and krec is the reconstructed wavenumber value with a frequency of fc. The estimated wavenumber error for the A0 and S0 mode with a central frequency of 150 kHz and 30 measurements are 3.3% and 4%.
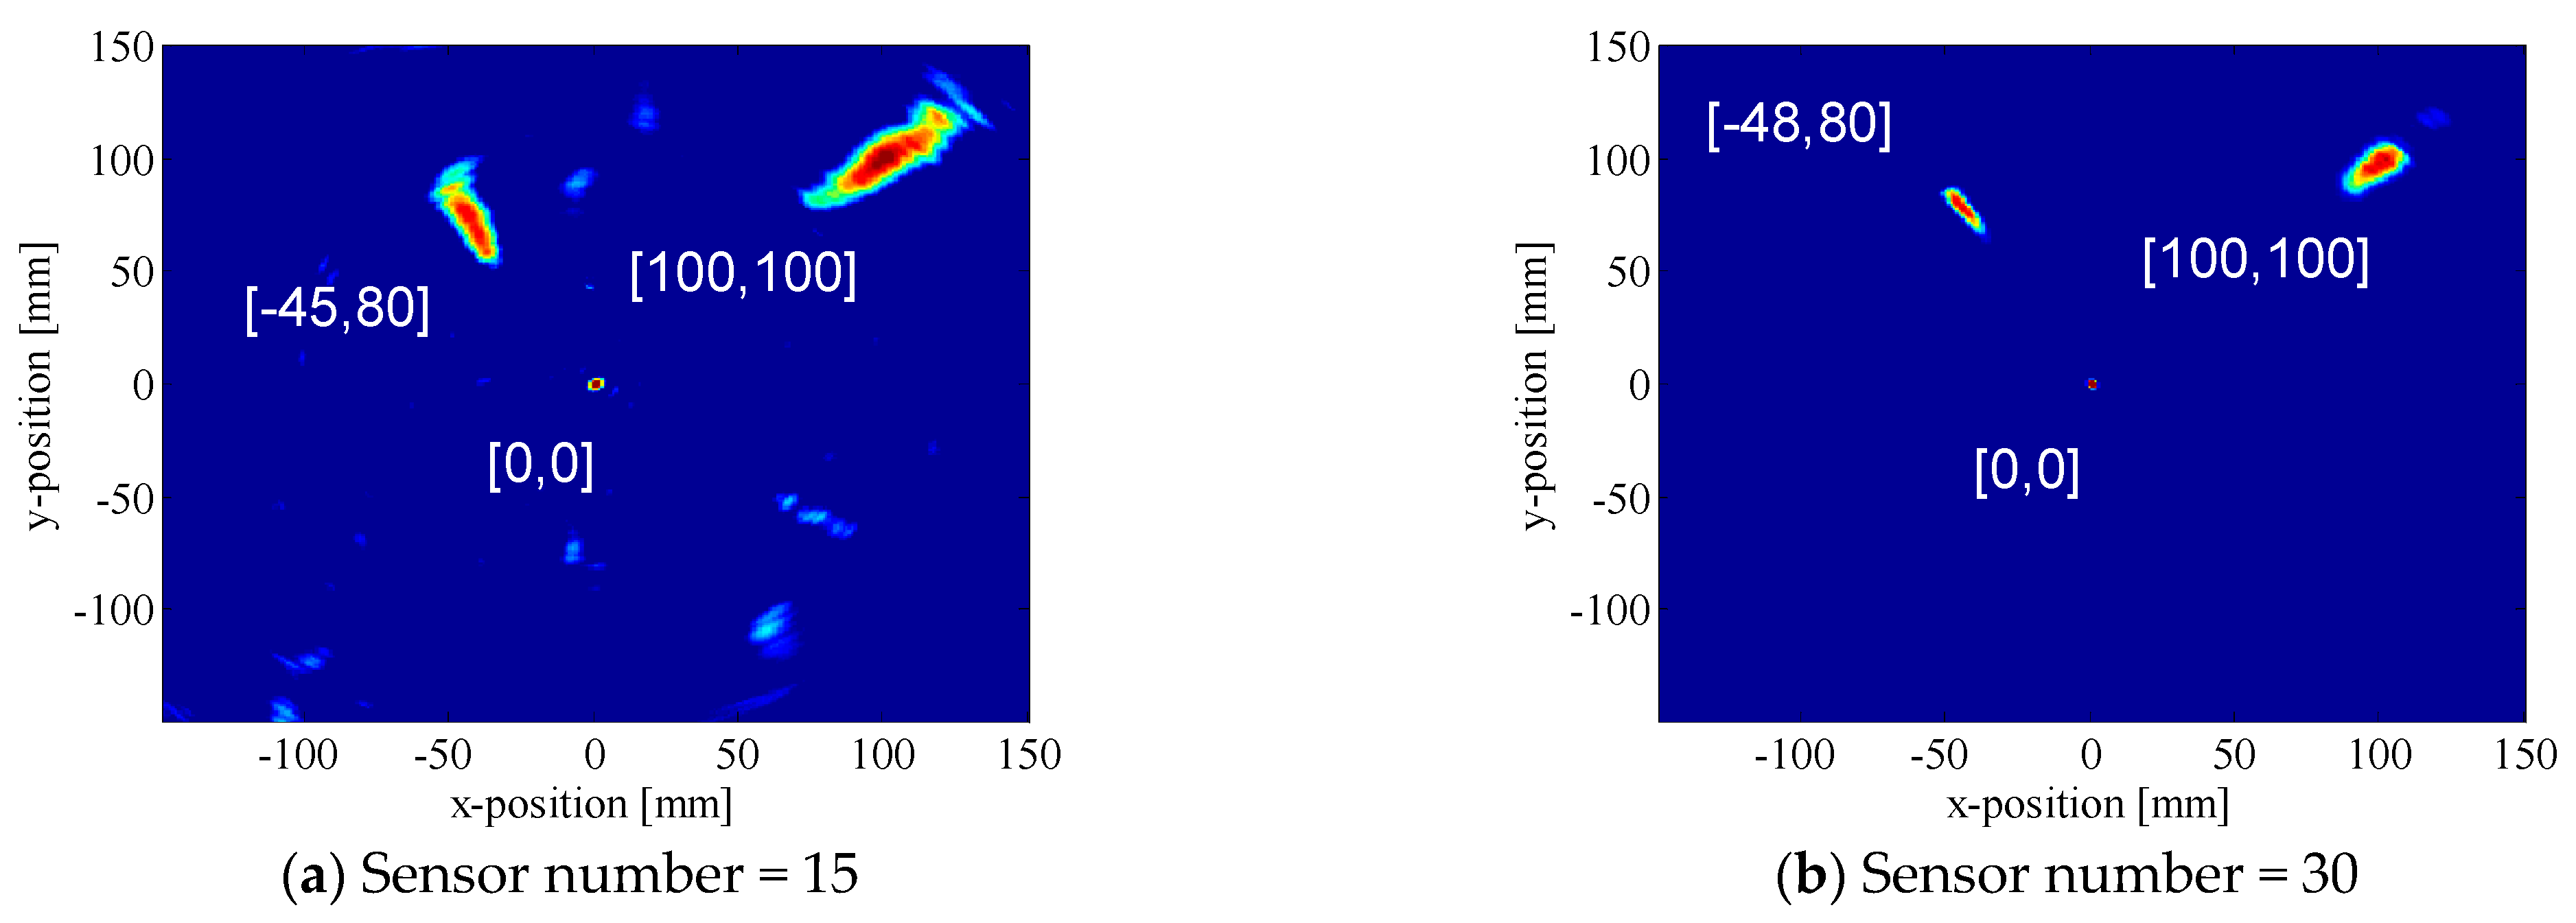
On the basis of the estimated dispersion relation of Lamb wave signals, the group velocity of the Lamb wave centered at 150 kHz can be further calculated. Hence, for each candidate scatter source location, the signal matrix can be updated by adaptive windowed signals instead of the full-length measurement signals. Meanwhile, the steering vector of the single-frequency Lamb wave signal can also be established with the given sensor locations and the estimated wavenumber. Here, the A0 mode Lamb wave is adopted for imaging method verification. Through the local MUSIC imaging method, the simulated damage imaging results with 15 and 30 random measurements are shown in Figure 5. The spatial point with the local largest probability indicates the scatter source. The comparative results show that the proposed method can localize the damage and excitation source with considerable accuracy. Specifically, the distance between the detected damage (45, 80 mm) and the real damage location of defect 1 (50, 80 mm) is 5 mm, and this can be further reduced with the increasing measurements (distance with 2 mm for 30 measurements). Meanwhile, the localization of defect 2 (100, 100 mm) and the excitation source (0, 0 mm) are evaluated precisely. Meanwhile, more measurements would result in a better imaging quality. Since only the A0 mode is modeled and used in the MUSIC imaging formulation, the results also show that the proposed method has a strong resistance to multimodal Lamb wave signals.
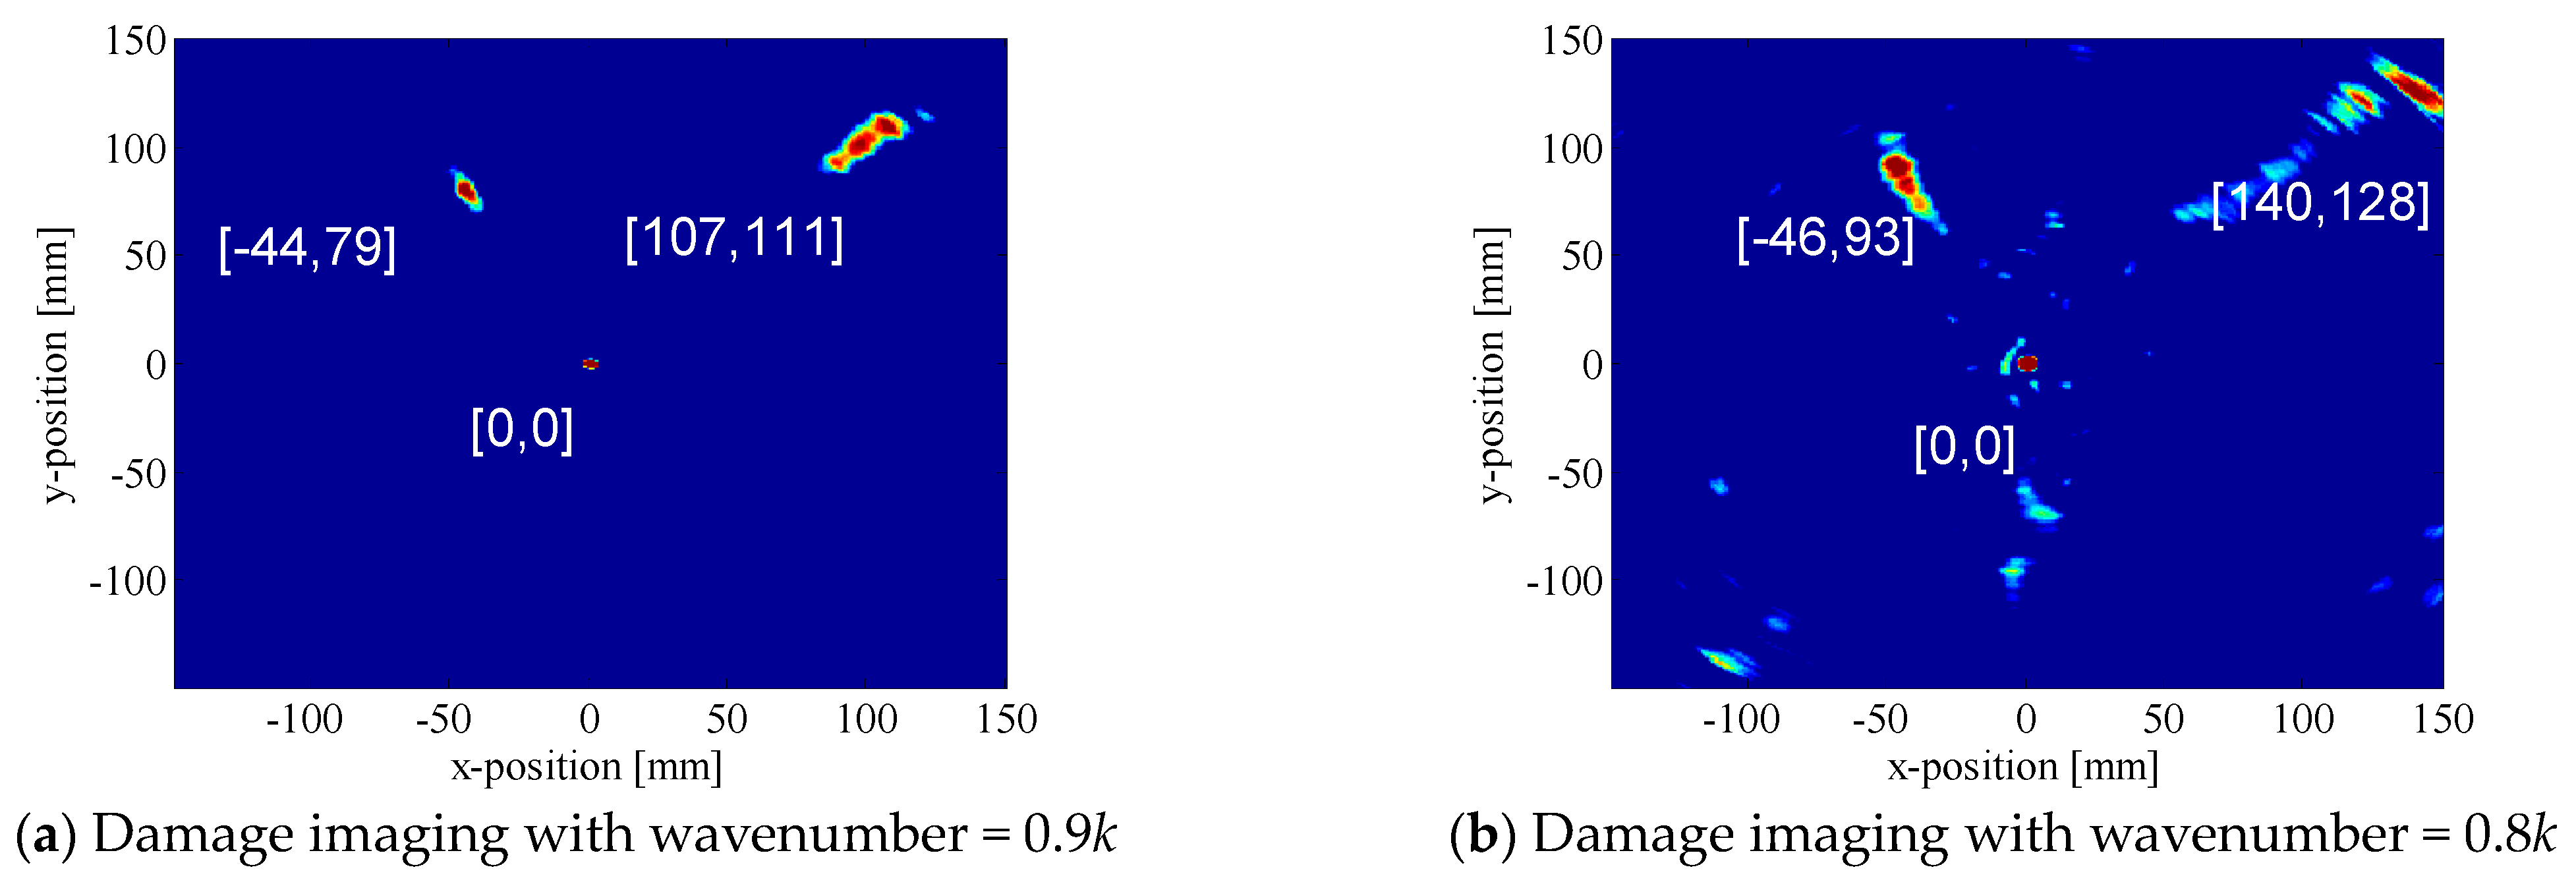
As we all know, the accuracy of the steering vector is a prerequisite for damage localization. The mismatched wavenumber results would introduce the localization error in the final damage imaging. To verify the performance of dispersion curves in damage detection and imaging, the artificial errors of a wavenumber with 10% and 20% variations are introduced to the formulation of steering vectors. Thus, the accuracy and robustness of the local MUSIC method can be investigated, which can be demonstrated by the imaging results shown in Figure 6. The results indicate that the localization error increases accordingly with the wavenumber variation. Meanwhile, the imaging quality is also affected by the wrong matching results. In the case of the real test scenario, the uncertainties introduced by environmental variations and material parameter errors would worsen the accuracy of the theoretical dispersion results. Therefore, the more accurate dispersion curves obtained from the experimental reconstruction using the proposed method is exceedingly meaningful for highly accurate damage imaging.
5. Experimental Validation with a Composite Plate
5.1. Experimental Setups
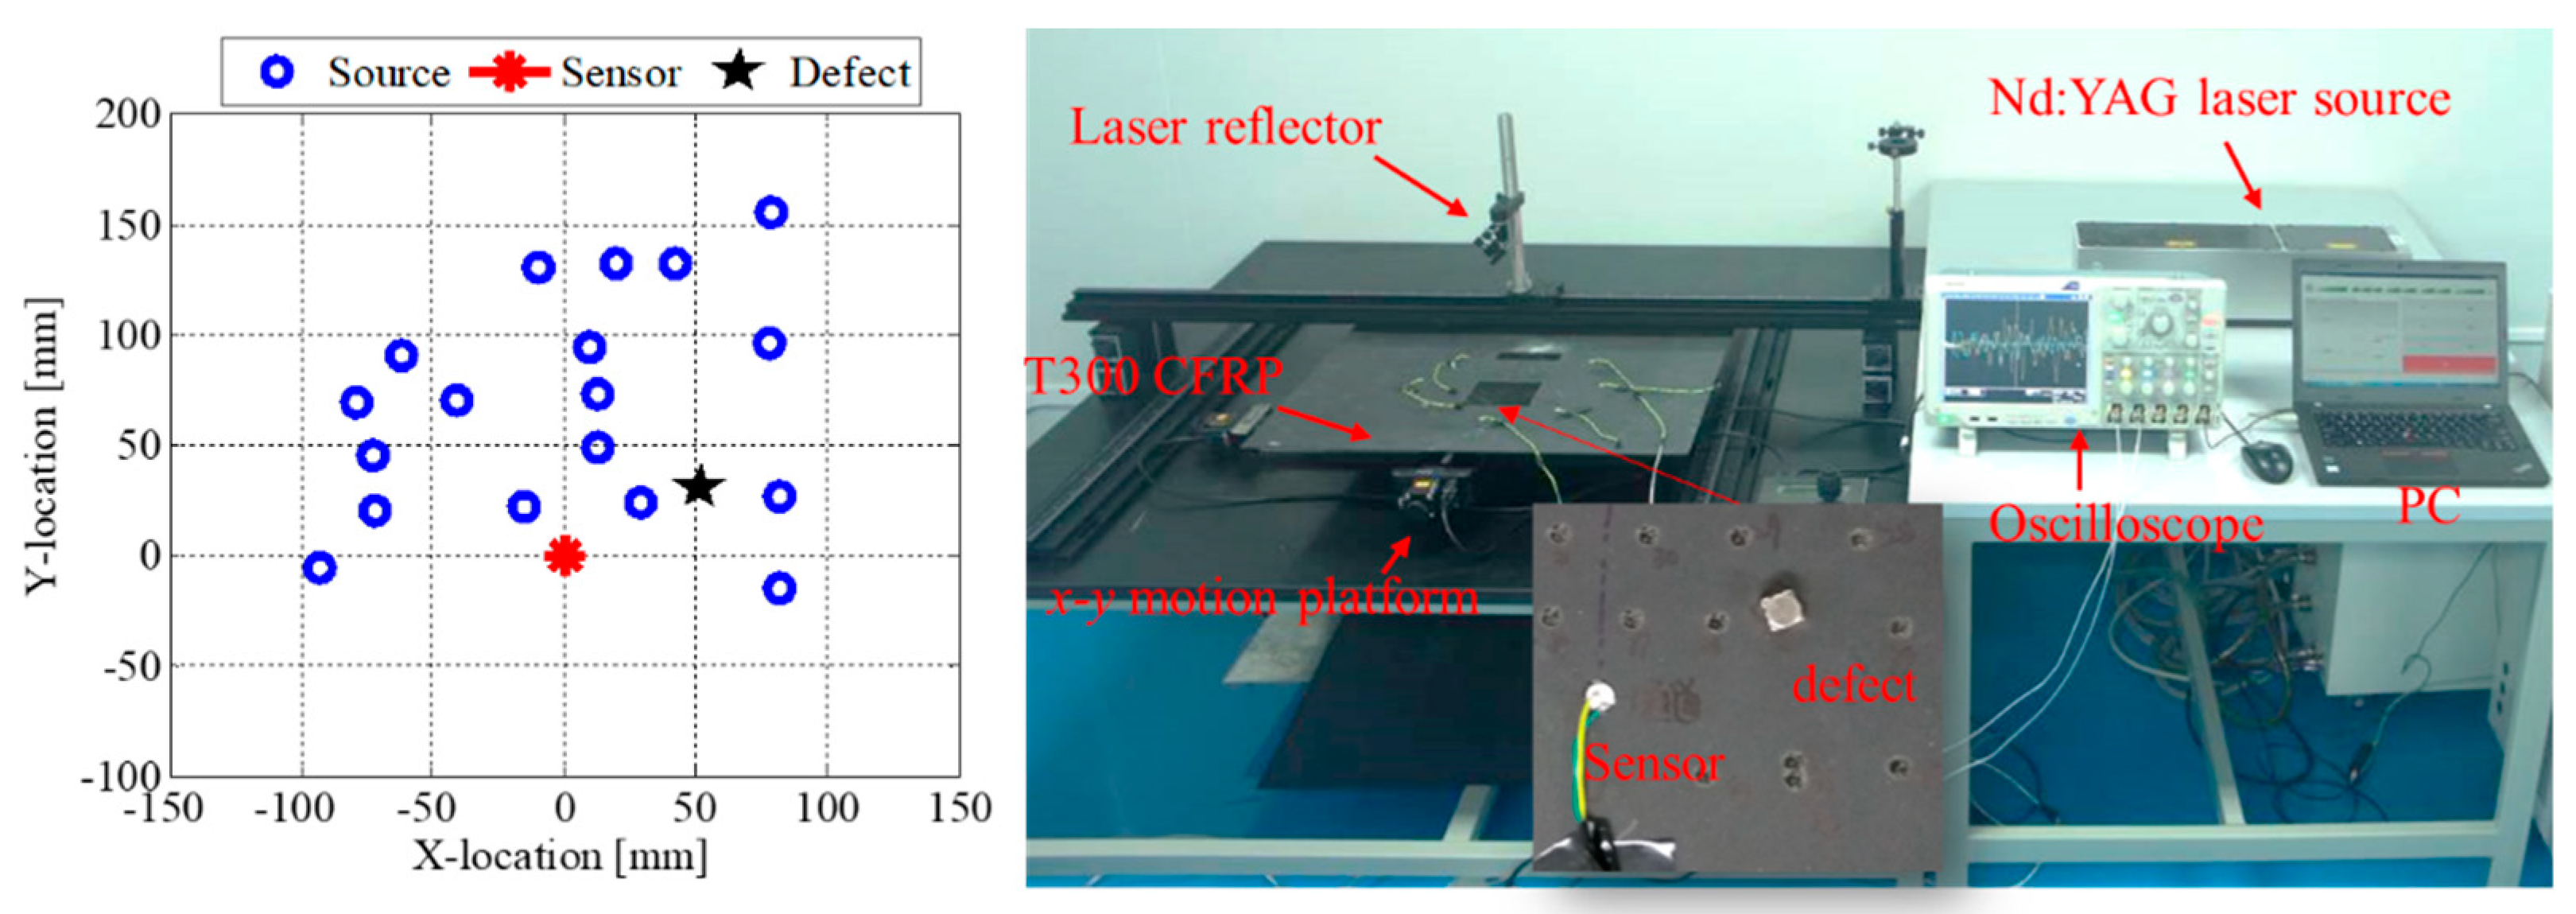
The experiment was carried out on a 2 mm thick composite plate (T300) with a dimension of 600 mm × 600 mm × 2 mm and a layup of [+45/−45/0/90]2s. A schematic diagram of the experimental setup is given in Figure 7. Lamb waves are produced by an A Nd: YAG laser (Innolas spotlight 600) and then captured by a PZT. An x-y motion platform is used for changing the excitation source, thereby allowing for arbitrary position Lamb wave excitation. An x-y coordinate system centered at PZT is established for the spatial orientation. In this paper, 20 sources are randomly chosen to excite the Lamb waves, thereby forming a signal matrix consisting of 20 groups of data. The sampling rate is set to be 10 MHz and 10,000 data points are recorded for each group of data. An artificial damage with a diameter of 10 mm centered at 52, 30 mm was simulated by bonding an additive mass on the plate. Hence, the structural information can be captured by the broadband Lamb wave signals.
5.2. Signal Processing for Laser-Generated Lamb Waves
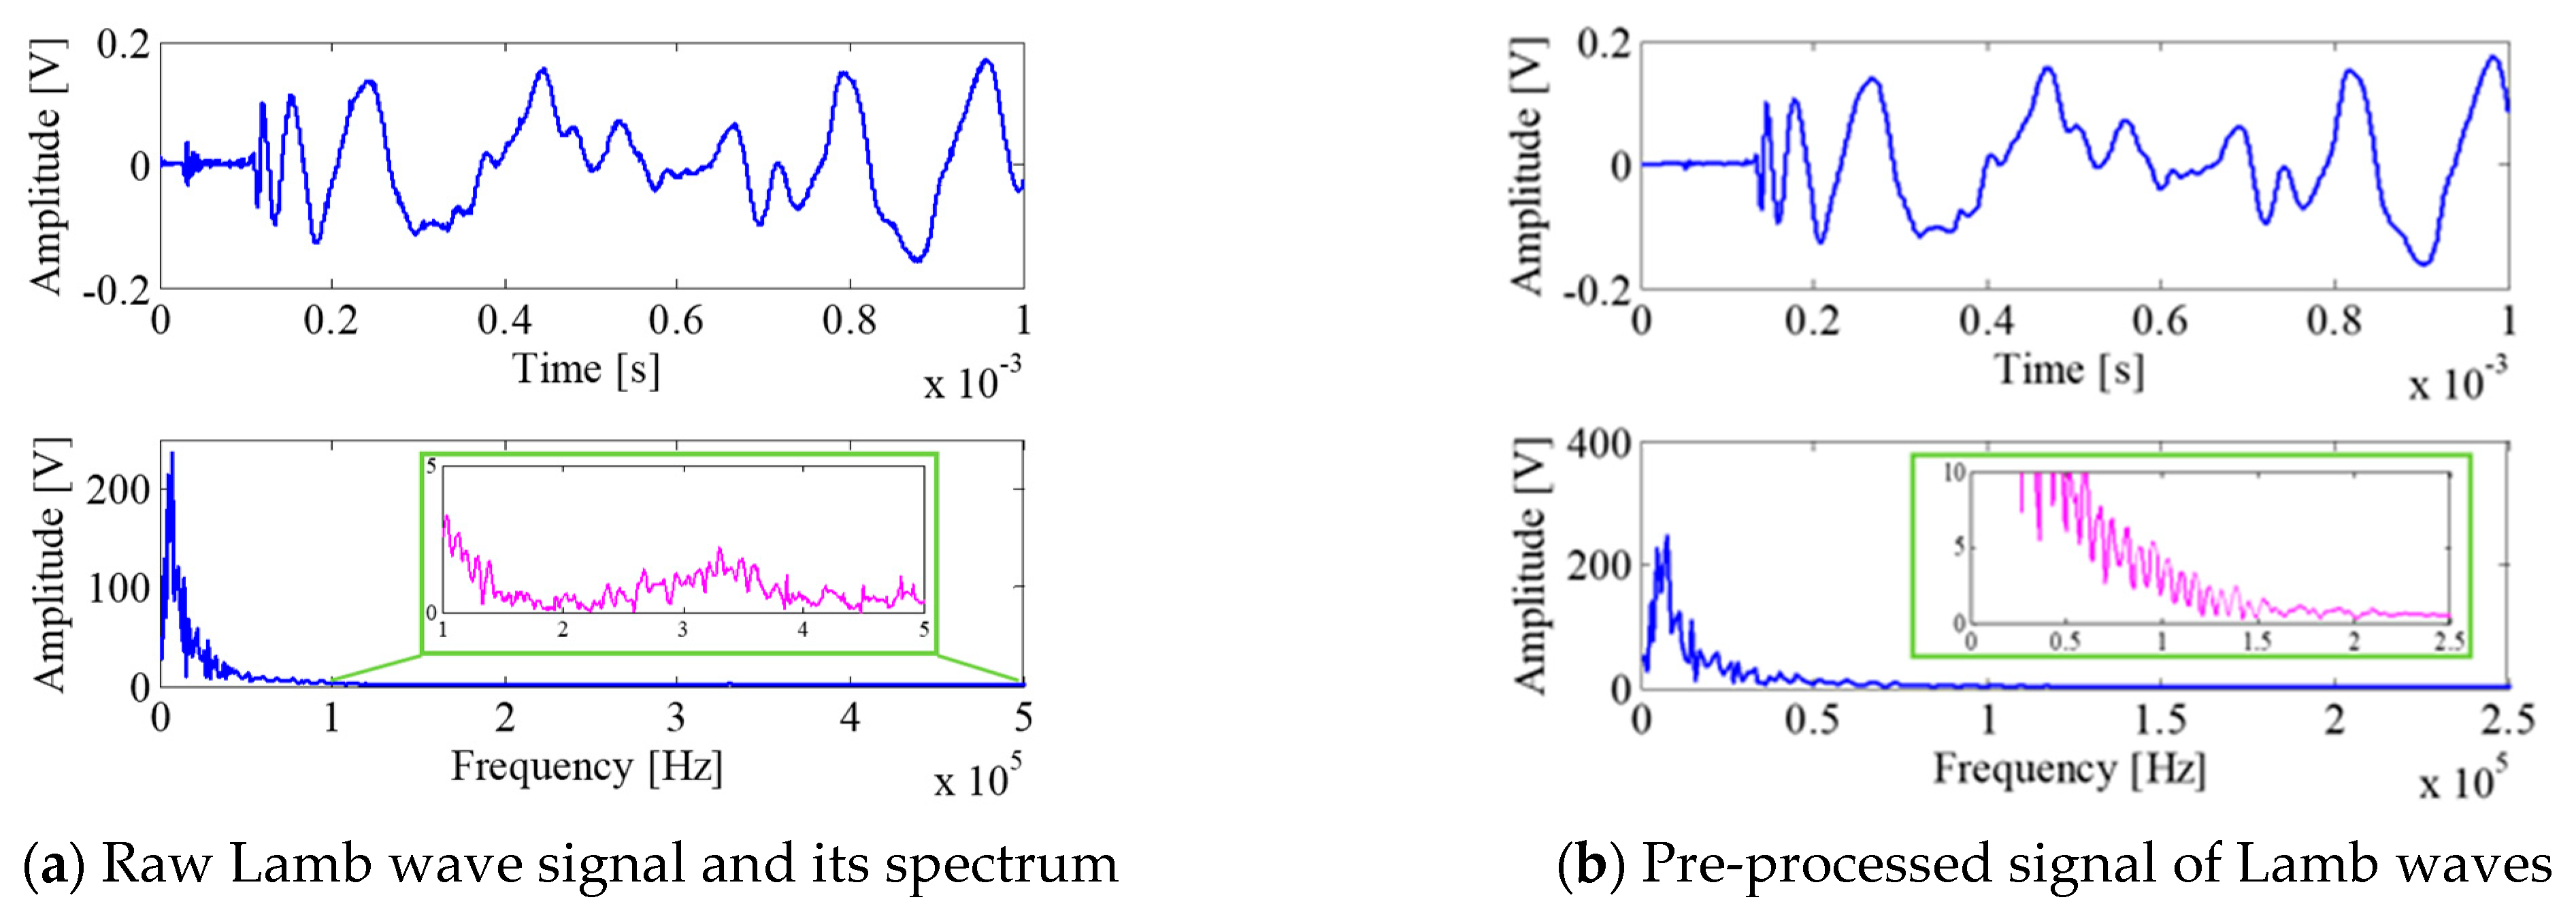
Although laser-generated Lamb waves are broadband, most of the energy is concentrated in a low frequency. Figure 8a shows the raw signals from the experimental recordings; it can be seen that the dominated Lamb wave signals are falling below 200 kHz. Since the ablation effect of laser excitation would dominate the out-displacement excitation, the A0 mode is obvious in the response signal. S0 mode signals are weak in the excitable frequency range which may cause computational instability of the CS algorithm. Meanwhile, the limited frequency range of the Lamb wave signal can reduce the computational labor effectively. To eliminate the low-frequency interference and increase the computational efficiency, the band-pass filtering among [1, 200 kHz] is applied to the measured signals. Hence, the A0 mode components of Lamb signals are dominantly extracted and the computational reliability can also be guaranteed, as shown in Figure 8b.
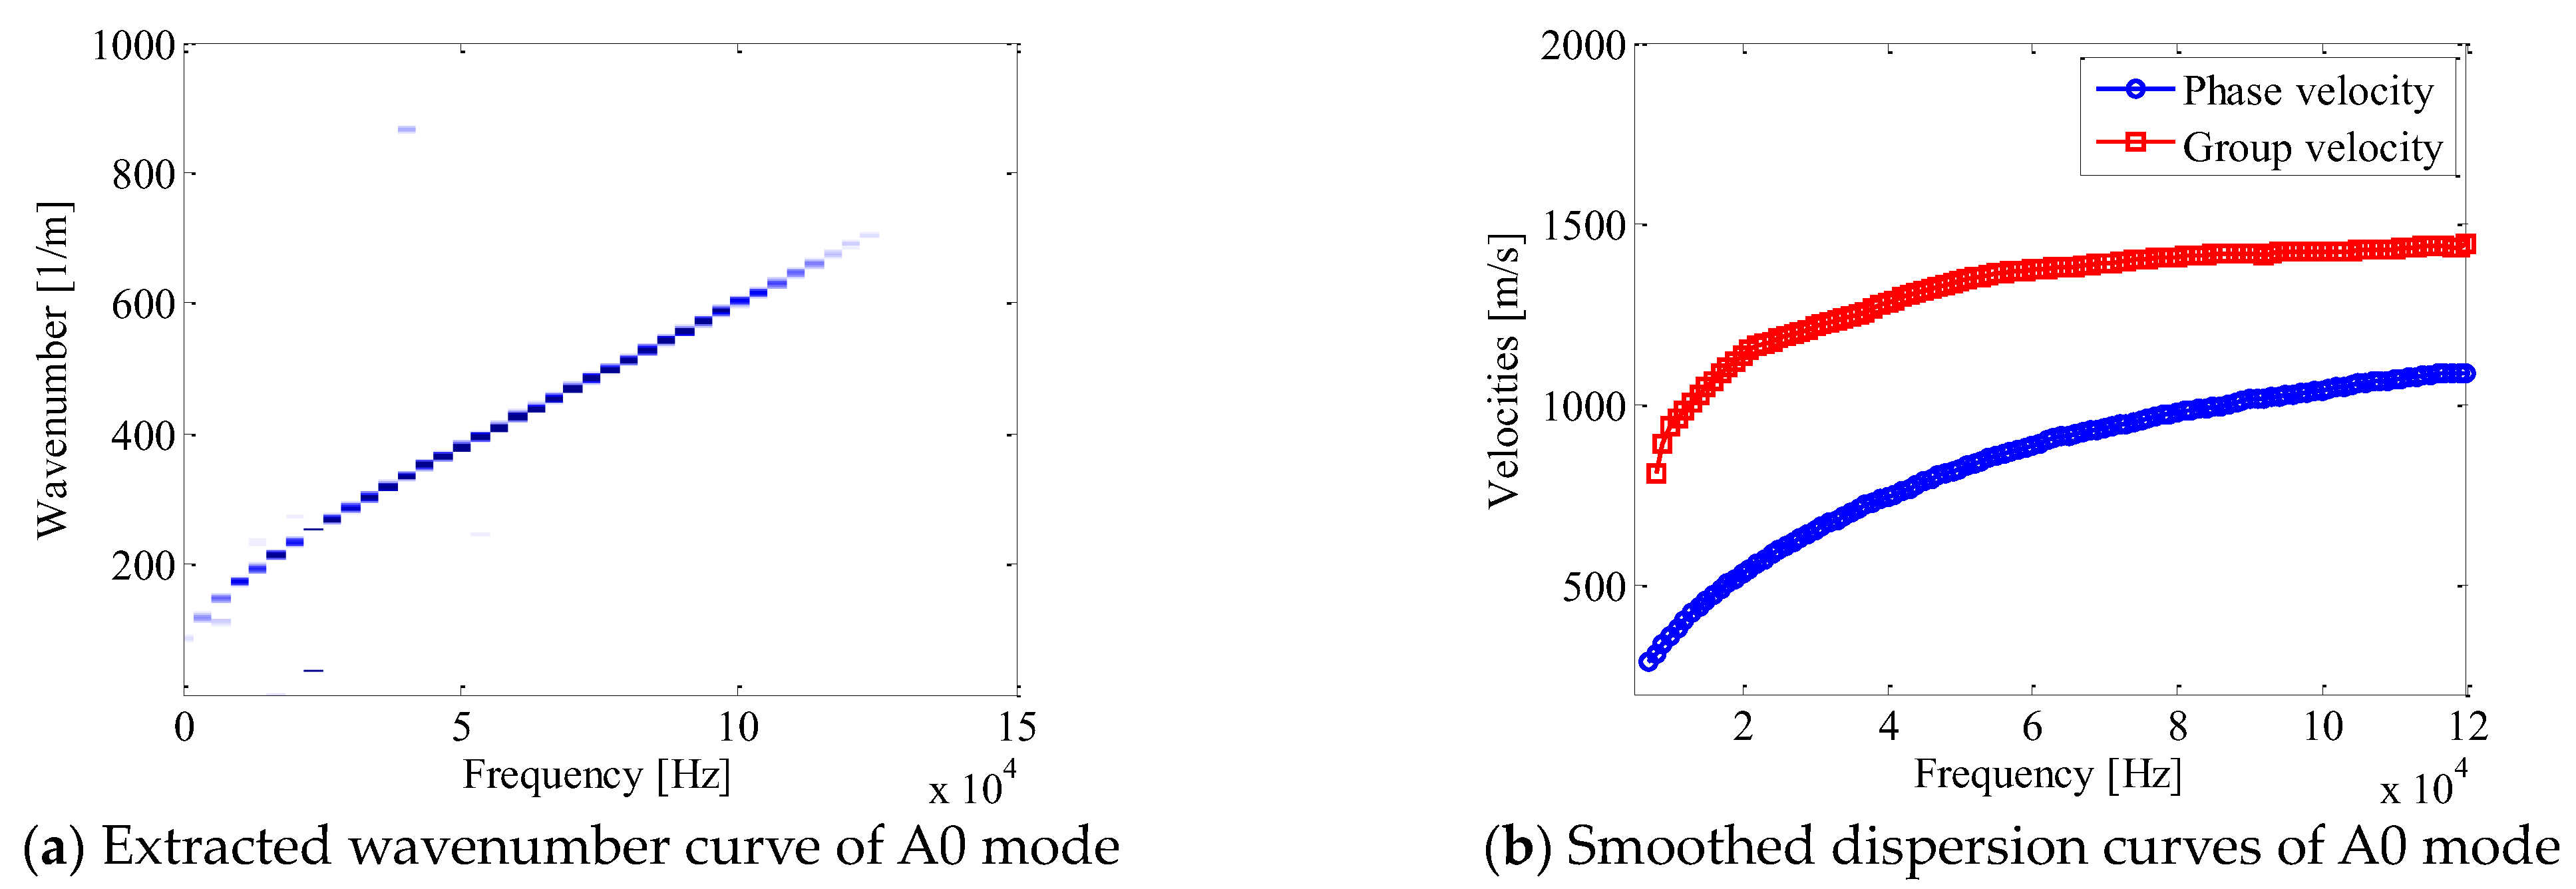
Furthermore, the processed signal matrix with a dimension of 20 × 10,000 is submitted into the CS reconstructed algorithm with the sparse transformation of Lamb waves in the f-k domain. Hence, the A0 mode is clearly recovered in the f-k map. Since the S0 mode components are not dominated in the signal and the reflections resulting from damage and boundaries decay fast in composite materials, the weak reflections and the S0 mode signal in the f-k domain are covered by a strong direct wave. Thus, only the A0 mode of the Lamb wave in the f-k distribution is effectively recovered with a high resolution and SNR, as shown in Figure 9a. In this experiment, the A0 mode Lamb wave is employed for the damage imaging illustration.
Furthermore, the dispersion relation for the A0 mode can be extracted by searching the peaks through scanning the frequency axis. As the experimental signals would be affected by amplitude modulation and attenuation, only the results in a particular frequency range can be calculated, referred to in Figure 9a. According to the CS result, the A0 mode Lamb wave within the frequency range of 5, 120 kHz can be clearly extracted and the velocities are calculated and interpolated, as shown in Figure 9b. Therefore, the propagation character can be revealed where only experimental data are employed, which demonstrates the effectiveness of the dispersion reconstruction of the proposed method.
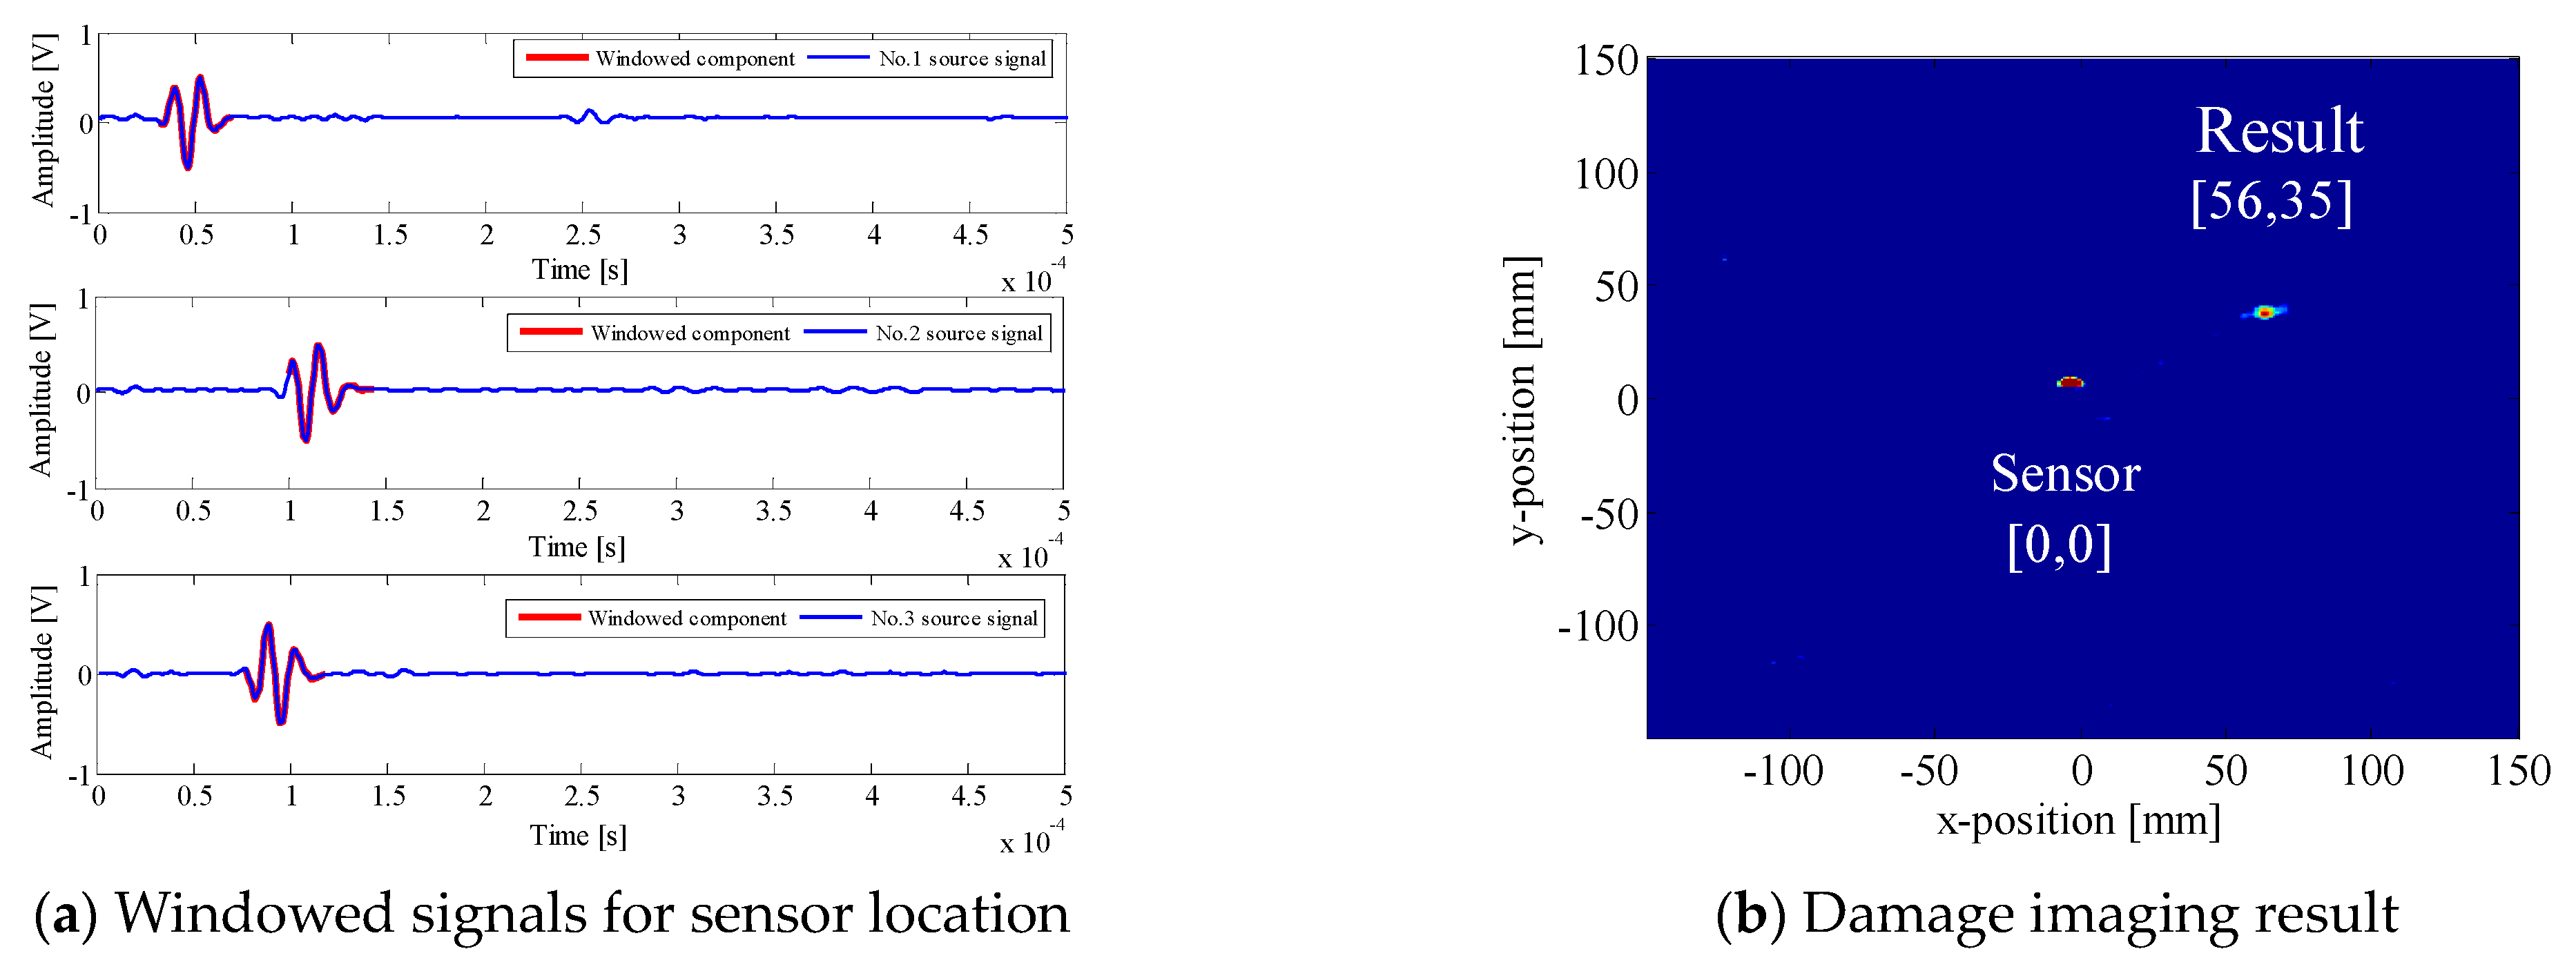
To extract the dominated components through the broadband signals and eliminate the low-frequency interference, the toneburst-like window centered at 80 kHz is applied to filter the measured signals. To establish the steering vectors of the A0 mode in a composite plate for damage imaging purposes, the wavenumber at fc = 80 kHz is extracted with the wavenumber estimated to be 515 1/m and the group velocity to be 1415 m/s. For each source and sensor pair, the signal matrix used for the MUSIC algorithm is extracted according to the TOF of the potential scatter waves for each grid, which is illustrated in Figure 10a. On this basis, the weak reflections can be highlighted in the imaging algorithm. Meanwhile, the steering vector is also established for each location with an estimated wavenumber and propagation distance. Finally, the artificial damage can be imaged with high accuracy and resolution, as shown in Figure 10b. The identified location of the damage is 56, 35 mm, which agrees well with the true location of 52, 30 mm. It can be seen that there is a minor error in the localization, which is primarily caused by the geometry size of the artificial damage due to the physical reflection of the Lamb wave at the edge of the damage. The accuracy of the damage localization validates the proposed method’s effectiveness.
6. Conclusions
In this paper, a two-step method for high resolution damage imaging using sparse reconstruction and the adaptive MUSIC algorithm is proposed, making full use of direct waves and weak reflections without the need for prior knowledge or baseline recordings. Based on the simulation and experimental investigation presented in this paper, the following conclusions may be drawn:
- (1)
- A sparse reconstruction method with less experimental data is effective for dispersion curve reconstruction. With a simulation investigation, the estimated wavenumber errors for the S0 and A0 mode are 3.3% and 4%, respectively. The dispersion curves reconstructed from the measured data could be more useful and flexible in a variety of test scenarios when material properties are unknown or working conditions change over time.
- (2)
- Adaptive filtered scattering signals can improve eigenvalue decomposition and reflection identification by enhancing the weak damage features in a covariance analysis. Hence, the damage index gets amplified compared with traditional decomposing methods adopting full length signals.
- (3)
- With the adaptive MUSIC method, the damage can be located with considerable accuracy by a few measurements without baseline recordings. The localization error is less than 5 mm with 30 measurements in the simulation case and roughly 4.5 mm in the experiment investigation. The proposed method provides a potential way for damage detection and localization in various NDE and SHM applications.
Author Contributions
Conceptualization, F.G.; Methodology, H.F.; Validation, W.L.; Resources, H.F. and F.G.; Writing—original draft, H.F. and F.G.; Writing—review & editing, K.Z. All authors have read and agreed to the published version of the manuscript.
Funding
The work is supported by the National Natural Science Foundation of China (Grant No. 52275077), the Ningbo Natural Science Foundation (Grant No. 2021J012), and the Key Lab of Modern Optical Technologies of Jiangsu Province, Soochow University (Grant No. KJS2136).
Data Availability Statement
Data will be made available on request.
Acknowledgments
The work is supported by the National Natural Science Foundation of China (Grant No. 52275077), the Ningbo Natural Science Foundation (Grant No. 2021J012), and the Key Lab of Modern Optical Technologies of Jiangsu Province, Soochow University (Grant No. KJS2136), which are highly appreciated by the authors.
Conflicts of Interest
The authors declare no conflict of interest.
References
- Gorgin, R.; Luo, Y.; Wu, Z. Environmental and operational conditions effects on Lamb wave based structural health monitoring systems: A review. Ultrasonics 2020, 105, 106114. [Google Scholar] [CrossRef] [PubMed]
- Yang, T.; Zhou, W.; Yu, L. Guided Wave-Based Damage Detection of Square Steel Tubes Utilizing Structure Symmetry. Symmetry 2023, 15, 805. [Google Scholar] [CrossRef]
- Mitra, M.; Gopalakrishnan, S. Guided wave based structural health monitoring: A review. Smart Mater. Struct. 2016, 25, 053001. [Google Scholar] [CrossRef]
- Lee, B.C.; Staszewski, W.J. Lamb wave propagation modelling for damage detection: I. Two-dimensional analysis. Smart Mater. Struct. 2007, 16, 249. [Google Scholar] [CrossRef]
- Shan, S.; Cheng, L. Two-dimensional scattering features of the mixed second harmonic A0 mode Lamb waves for incipient damage localization. Ultrasonics 2022, 119, 106554. [Google Scholar] [CrossRef] [PubMed]
- Hu, M.; He, J.; Zhou, C.; Shu, Z.; Yang, W. Surface damage detection of steel plate with different depths based on Lamb wave. Measurement 2022, 187, 110364. [Google Scholar] [CrossRef]
- Ding, X.; Xu, C.; Deng, M.; Zhao, Y.; Bi, X.; Hu, N. Experimental investigation of the surface corrosion damage in plates based on nonlinear Lamb wave methods. NDT E Int. 2021, 121, 102466. [Google Scholar] [CrossRef]
- Ding, X.; Xu, C.; Deng, M.; Zhao, Y.; Bi, X.; Hu, N. Determination of Lamb wave phase velocity dispersion using time–frequency analysis. Smart Mater. Struct. 2019, 28, 115029. [Google Scholar] [CrossRef]
- Feng, B.; Ribeiro, A.L.; Ramos, H.G. A new method to detect delamination in composites using chirp-excited Lamb wave and wavelet analysis. NDT E Int. 2018, 100, 64–73. [Google Scholar] [CrossRef]
- Cai, J.; Yuan, S.; Qing, X.P.; Chang, F.-K.; Shi, L.; Qiu, L. Linearly dispersive signal construction of Lamb waves with measured relative wavenumber curves. Sens. Actuators A Phys. 2015, 221, 41–52. [Google Scholar] [CrossRef]
- Chang, C.Y.; Yuan, F.G. Extraction of guided wave dispersion curve in isotropic and anisotropic materials by Matrix Pencil method. Ultrasonics 2018, 89, 143–154. [Google Scholar] [CrossRef] [PubMed]
- Spytek, J.; Pieczonka, L.; Stepinski, T.; Ambrozinski, L. Mean local frequency-wavenumber estimation through synthetic time-reversal of diffuse Lamb waves. Mech. Syst. Signal Process. 2021, 156, 107712. [Google Scholar] [CrossRef]
- Xu, C.-B.; Yang, Z.-B.; Tian, S.-H.; Chen, X.-F. Lamb wave inspection for composite laminates using a combined method of sparse reconstruction and delay-and-sum. Compos. Struct. 2019, 223, 110973. [Google Scholar] [CrossRef]
- Kijanka, P.; Manohar, A.; di Scalea, F.L.; Staszewski, W.J. Damage location by ultrasonic Lamb waves and piezoelectric rosettes. J. Intell. Mater. Syst. Struct. 2015, 26, 1477–1490. [Google Scholar] [CrossRef]
- Liu, Z.; Zhong, X.; Dong, T.; He, C.; Wu, B. Delamination detection in composite plates by synthesizing time-reversed Lamb waves and a modified damage imaging algorithm based on RAPID. Struct. Control. Health Monit. 2017, 24, e1919. [Google Scholar] [CrossRef]
- Engholm, M.; Stepinski, T. Direction of arrival estimation of Lamb waves using circular arrays. Struct. Health Monit. 2011, 10, 467–480. [Google Scholar] [CrossRef]
- Gao, F.; Hua, J. Damage characterization using CNN and SAE of broadband Lamb waves. Ultrasonics 2022, 119, 106592. [Google Scholar] [CrossRef]
- Mori, N.; Biwa, S.; Kusaka, T. Damage localization method for plates based on the time reversal of the mode-converted Lamb waves. Ultrasonics 2019, 91, 19–29. [Google Scholar] [CrossRef]
- Agarwal, S.; Mitra, M. Lamb wave based automatic damage detection using matching pursuit and machine learning. Smart Mater. Struct. 2014, 23, 085012. [Google Scholar] [CrossRef]
- Xu, B.; Giurgiutiu, V.; Yu, L. Lamb waves decomposition and mode identification using matching pursuit method. In Proceedings of the Sensors and Smart Structures Technologies for Civil, Mechanical, and Aerospace Systems 2009, San Diego, CA, USA, 9–12 March 2009; Volume 7292, pp. 161–172. [Google Scholar] [CrossRef]
- Xie, J.; Ding, W.; Zou, W.; Wang, T.; Yang, J. Defect Detection inside a Rail Head by Ultrasonic Guided Waves. Symmetry 2022, 14, 2566. [Google Scholar] [CrossRef]
- Kudela, P.; Radzienski, M.; Ostachowicz, W. Impact induced damage assessment by means of Lamb wave image processing. Mech. Syst. Signal Process. 2018, 102, 23–36. [Google Scholar] [CrossRef]
- Zhongqing, S. Identification of Damage Using Lamb Waves, Identification of Damage Using Lamb Waves; Springer: London, UK, 2009. [Google Scholar]
- Donoho, D.L. Compressed sensing. IEEE Trans. Inf. Theory 2006, 52, 1289–1306. [Google Scholar] [CrossRef]
- Zhao, W.; Li, M.; Harley, J.B.; Jin, Y.; Moura, J.M.F.; Zhu, J. Reconstruction of Lamb wave dispersion curves by sparse representation with continuity constraints. J. Acoust. Soc. Am. 2017, 141, 749–763. [Google Scholar] [CrossRef] [PubMed]
- He, J.; Yuan, F.G. Lamb wave-based subwavelength damage imaging using the DORT-MUSIC technique in metallic plates. Struct. Health Monit. 2016, 15, 65–80. [Google Scholar] [CrossRef]
- Xu, C.; Zuo, H.; Deng, M. Dispersive MUSIC algorithm for Lamb wave phased array. Smart Mater. Struct. 2022, 31, 025033. [Google Scholar] [CrossRef]
Figure 1.
Dispersion curves of Lamb waves in 2 mm-Al plate.

Figure 2.
Flowchart of the proposed damage detection method.

Figure 3.
Simulation setups for Lamb wave measurement.

Figure 4.
Reconstructed dispersion relations with 30 simulation measurements.

Figure 5.
Damage imaging results with a sensor number of 15 and 30.

Figure 6.
Comparative study of imaging accuracy with wavenumber variation.

Figure 7.
Schematic diagram of the experimental setup.

Figure 8.
Example of laser-generated Lamb wave signal.

Figure 9.
Experimental recovery of Lamb wave dispersion for A0 mode.

Figure 10.
Adaptive signal highlight and damage imaging result.

Disclaimer/Publisher’s Note: The statements, opinions and data contained in all publications are solely those of the individual author(s) and contributor(s) and not of MDPI and/or the editor(s). MDPI and/or the editor(s) disclaim responsibility for any injury to people or property resulting from any ideas, methods, instructions or products referred to in the content. |
© 2023 by the authors. Licensee MDPI, Basel, Switzerland. This article is an open access article distributed under the terms and conditions of the Creative Commons Attribution (CC BY) license (https://creativecommons.org/licenses/by/4.0/).
Share and Cite
MDPI and ACS Style
Fan, H.; Gao, F.; Li, W.; Zhang, K. A Two-Step Model-Based Reconstruction and Imaging Method for Baseline-Free Lamb Wave Inspection. Symmetry 2023, 15, 1171. https://doi.org/10.3390/sym15061171
AMA Style
Fan H, Gao F, Li W, Zhang K. A Two-Step Model-Based Reconstruction and Imaging Method for Baseline-Free Lamb Wave Inspection. Symmetry. 2023; 15(6):1171. https://doi.org/10.3390/sym15061171
Chicago/Turabian StyleFan, Hang, Fei Gao, Wenhao Li, and Kun Zhang. 2023. "A Two-Step Model-Based Reconstruction and Imaging Method for Baseline-Free Lamb Wave Inspection" Symmetry 15, no. 6: 1171. https://doi.org/10.3390/sym15061171
Note that from the first issue of 2016, this journal uses article numbers instead of page numbers. See further details here.