
Accurate Determination of Enantiomeric Excess Using Raman Optical Activity


Department of Optics, Palacký University Olomouc, 771 46 Olomouc, Czech Republic
*
Author to whom correspondence should be addressed.
Symmetry 2022, 14(5), 990; https://doi.org/10.3390/sym14050990
Submission received: 4 April 2022
/
Revised: 25 April 2022
/
Accepted: 9 May 2022
/
Published: 12 May 2022
(This article belongs to the Special Issue Asymmetric Molecules and Chirality Recognition)
Abstract
:The optical purity of a chiral sample is of particular importance to the analytical chemistry and pharmaceutical industries. In recent years, the vibrational optical activity (VOA) has become established as a sensitive and nondestructive technique for the analysis of chiral molecules in solution. However, the relatively limited accuracy in the range of about 1–2% reported in published papers and the relatively small spread of experimental facilities to date have meant that vibrational spectroscopy has not been considered a common method for determining enantiomeric excess. In this paper, we attempt to describe, in detail, a methodology for the determination of enantiomeric excess using Raman optical activity (ROA). This method achieved an accuracy of 0.05% for neat α-pinene and 0.22% for alanine aqueous solution, after less than 6 h of signal accumulation for each enantiomeric mixture, which we believe is the best result achieved to date using vibrational optical activity techniques. An algorithm for the elimination of systematic errors (polarization artifacts) is proposed, and the importance of normalizing ROA spectra to correct for fluctuations in excitation power is established. Results comparable to those obtained with routinely used chemometric analysis by the partial least squares (PLS) method were obtained. These findings show the great potential of ROA spectroscopy for the quantitative analysis of enantiomeric mixtures.
1. Introduction
Chiroptical spectroscopy involves spectroscopic techniques based on the differences in the interactions of left- and right-handed circularly polarized radiation with chiral molecules. In this article, we focus on vibrational Raman optical activity, which detects the differential signal in Raman scattering [1,2] and its use to detect enantiomeric excess.
Since the 1970s, vibrational optical activity techniques have been constantly improved. The first milestone for potential widespread use in this field was the first commercial vibrational circular dichroism (VCD) spectrometer introduced in 1997, followed by a commercial ROA spectrometer in 2005. As the VOA signal is usually four to five orders weaker than the parent signal, spectra are somewhat susceptible to experimental artifacts. In addition, relatively large sample volumes (usually tens of µL) and concentrations (usually tens of mg/mL) are needed. The advantage of ROA is the ease of measuring samples in aqueous solutions, while the advantage of VCD is less restrictions on sample fluorescence.
One of the main applications of VOA is the determination of the absolute configuration and the measurement of optical purity of chiral samples. The optical purity of a chiral sample can be characterized by the enantiomeric excess (EE) defined as
where and are the molar amounts of each enantiomer A and B in the sample. The absolute value of EE is 100% for the optically pure sample and 0% for the racemic mixture [2].
Thus far, the most common method for the determination of enantiomeric excess is chiral chromatography; however, this is a demanding experimental method, and special columns must be used for different chiral substances. Furthermore, chiral capillary electrophoresis (CE) is a promising method that allows enantioselective separation in a small volume. It is suitable for nonvolatile compounds and provides a better separation of both forms than does high-performance liquid chromatography (HPLC) [3].
Enantiomeric excess can be measured by optical rotation (OR) or optical rotary dispersion (ORD); however, the signals are often dependent on concentration and other experimental parameters. VOA spectroscopy is a noninvasive method where a large number of vibrational bands can be observed and are useful for determining EE. This also makes it possible to better identify experimental artifacts or other impurities present in the sample that make the determination of EE more reliable.
The first EE determination with the VCD spectrometer was done in 1990 with a remarkable accuracy of 1% measured for deuterated chiral hydrocarbons in the gas phase. The main instrumental limitation was a long-term instrumental drift caused by changes in temperature and humidity, small optical throughput and a low resolution around 14 cm−1 [4]. Five years later, the EE of α-pinene by ROA in the right-angle scattering geometry has been recorded with accuracies of 0.1% for the one-component chiral sample and 1.5% for the two-component chiral sample [5]. However, these results were based on a limited statistical ensemble, and they were never verified or reproduced.
The accuracy of EE determination by Fourier-transform VCD for one chiral species (α-pinene in CCl4) was found to be around 1% and for two chiral species (camphor and borneol) to be around 2% in the mid-IR region and 2% and 3% in the near-IR region [6,7].
In recent years, efforts have been made to determine the EE of chiral compounds in the solid state using VCD spectroscopy [8], which is important for compounds that are insoluble in organic solvents or when the racemization process in the chiral sample is too fast in the liquid phase; however, the solid sample required more care that the liquid isotropic samples [9]. Based on a linear regression for selected VCD bands, the accuracy of the EE determination was 2.4%. The study was supplemented by the EE determination of camphor in CCl4 solution with an accuracy of 1.1% [4,6].
In this paper, we demonstrate the methodology of EE determination by the ROA measurement of two test compounds, neat α-pinene and alanine in an aqueous solution. We discuss limits of the presented method and compare the results with alternative statistical method known as partial least squares (PLS) [6,10]. An approach to effective systematic artifact elimination based on discrepancies in a mirror image of the opposite enantiomers is introduced, and a large improvement in the accuracy of the enantiomeric excess determination is achieved.
2. Procedure for Determining the Enantiomeric Excess
2.1. Sample Preparation
Suppose that we have two samples A and B of the same chiral substance with enantiomeric excesses and (the most common situation is ). We will mix these samples in mass ratios and to have a total of N different enantiomeric mixtures. For the i-th enantiomeric mixture, the enantiomeric excess is then given by:
where and and by definition (“pure” enantiomeric forms are included in the set). For real samples, it is not possible to achieve exactly unit enantiomeric excess. Moreover, the enantiomeric excesses of the two “pure” forms are also often not precisely known. Thus, in practice, two approximations can be used: we declare both the enantiomeric excesses and to be in absolute value unitary, and then we can write:
or we declare the enantiomeric excess to be unitary, and then the following approximation can be used:
where the constant needs to be determined.
2.2. Raman and ROA Spectra Measurements and Normalization
We measure Raman spectra (circular intensity sums) and ROA spectra (circular intensity differences) for N samples, all usually normalized to the used excitation energy (laser power measured at the sample multiplied by the acquisition time). The wavenumber index ν varies from 1 to M (the number of spectral points). Therefore, the dataset represents a matrix of size N × M.
The ROA signal can be easily affected by intensity fluctuations caused by the laser instability or possibly also by thermal fluctuations in the sample. Therefore, the ROA intensity normalization according to the parent Raman spectra was necessary. The situation is often complicated by the fact that, in addition to the Raman signal, a fluorescent background from impurities in the sample is also detected in the spectrum. Moreover, this background is not stable and changes during the measurement. Therefore, before determining the Raman integral intensity, the background in all Raman spectra must first be subtracted to obtain the spectra . Normalized ROA spectra are then calculated as
where the sum (intensity integral) is performed over the selected spectral region. The selection of the reference spectra from the set is arbitrary; however, we chose our reference A for simplicity.
In the case of a chiral solute in solution, differences in the molar concentrations of “pure” forms must also be included in the Raman intensity normalization.
2.3. Enantiomeric Excess Determination—Method 1
The simplest method for determining the enantiomeric excess is to solve the linear equation:
where is one element of the matrix N × M of all ROA spectra, is one element of the column vector N × 1 representing the enantiomeric excesses that we want to determine (note that EE determined from the spectra will be labelled with a hat, while EE determined using weighed “pure” forms A and B will be labelled without a hat), and is one element of the row vector 1 × M representing the ROA spectra of reference A, which is usually the first row of matrix D. This is a set of overdetermined linear equations that can be solved by the least squares method as:
The basic assumption of this method is that the enantiomeric excess of reference A is unity (100%). All spectra for which the enantiomeric excess is determined are compared with reference A. The smallest number of spectra used is therefore N = 2. The resulting enantiomeric excess is always determined relative to reference A.
2.4. Enantiomeric Excess Determination—Method 2
As an alternative and often used method a partial least squares algorithm (PLS) with five-fold cross-validation was used to construct predictive models for the EE determination using leave-one-out procedure. In this procedure, ROA spectra and EE determined by weighting (, ) were used as a training set and response to predict the EE of the omitted ROA spectrum . Only one PLS component was needed to adequately fit the ROA data.
The implementation of PLS regression in the MATLAB software was used [6,7,10,11,12]. It can be shown that at least two spectra (usually two “pure” enantiomers A and B) must be used for the training set of the PLS method; therefore, the minimum number of measured spectra is three. The determination of the enantiomeric excess may be subject to systematic error if the enantiomeric excesses in the training set are incorrectly determined, which may be the case if the relative enantiomeric excesses of the reference pure forms A and B from which the mixtures for the training set are prepared are not correctly determined.
2.5. Evaluation of Enantiomeric Excess Determination Errors
Enantiomeric excess determination errors are evaluated as differences between EE determined from spectra and EE determined from the sample preparation (3):
The enantiomeric excess of “pure” forms A and B is always specified by the manufacturers only with some precision, and therefore it can be assumed not to be the same. Therefore, we can try to determine the constant by determining the relative enantiomeric excess of form B according to relation (4) assuming that the average error (or sum of all errors) is zero.
We can then find a general idea of the correctness of the determination of EE by evaluating the standard deviation of the errors (from the assumed correct zero average error value) as:
2.6. Correction of Artifacts in ROA Spectra
It is known that the artifacts occurring in ROA spectra are proportional to the degree of circularity (ref. Hug and Hangartner [13]) or the difference of the orthogonally polarized Raman spectra, and thus it is reasonable to assume that these artifacts will be the same in all ROA spectra of the enantiomeric mixtures used. In our experience, this condition is well satisfied in ROA spectrometers constructed according to the original work of W. Hug [14], which have precisely synchronized all motorized linear rotators.
The simplest and universally used method for determining artifacts a is to sum the ROA spectra of the two “pure” forms and similarly, by subtraction, receive the true ROA spectrum Dtrue.
However, if both “pure” forms are not available, or if we want to use all measured ROA spectra with different enantiomeric excess to increase the signal-to-noise ratio in the artifact spectrum, a set of linear equations can be used:
with unknowns and . This set is overdetermined for N > 2, and, in this case, the solution of ROA artifact-free spectrum and artifact spectrum can be found by the method of least squares. It is also worth noting that known enantiomeric excesses can be used from both sample preparation or measurements . However, these values are usually a little different and have little effect on the resulting spectrum of artifacts .
Finally, the artifact spectra are subtracted from ROA spectra:
and the corrected spectra are used for further improved calculation of the enantiomeric excess.
3. Materials and Methods
3.1. Chemicals and Sample Preparation
Both enantiomers of α-pinene were purchased from Sigma-Aldrich, specifically (1S)-(−)-α-pinene (305715-5G) and (1R)-(+)-α-pinene (268070-5G), and the manufacturer states that the optical purity exceeds 97% for both samples. A relatively large total volume of 0.75 mL was used for each EE mixture of α-pinene, in order to reduce errors in the EE determination caused by weighting: first, the prevailing enantiomer of α-pinene was pipetted into a 1.5 mL glass vial and closed with a screw cap, which prevented evaporation of the sample. After weighting, the second enantiomer was added, and the sample was mildly stirred.
For alanine (Ala), aqueous stock solutions of both enantiomers L-Ala (Fluka 05129-25g, molar concentration 1.204 M) and D-Ala (Fluka 05140-5g, molar concentration 1.208 M) were prepared by adding deionized water to the weighted powder to match a 5 mL marker of a volumetric flask with volume error of 0.025 mL. Stock solutions were filtered through Millex-GV filters with PVDF membrane 0.22 μm pore size. The total volume 0.5 mL of solutions was then used for the final preparation of EE mixtures by weighting.
Analytical weights (Adam Equipment) with a 0.01 mg resolution were used in all cases. The maximal error given by mass measurement fluctuations was estimated to be 0.1 mg, which corresponds to approx. 0.02% error of the enantiomeric excess determined according to Equation (3).
Nine samples of different EE (regularly distributed from −100% to 100%) were prepared (N = 9) and measured in nonconsecutive order: the measurement orders of the mixtures with approximate EEs for α-pinene and alanine were 100, −100, 0, 25, −25, 50, −50, 75 and −75 (see Table 1) and 100, −100, 75, 0, −75, 50, −50, 25 and −25 (see Table 2), respectively.
3.2. Instrumentation
All presented Raman and ROA spectra were measured using a ROA spectrometer developed by Palacký University Olomouc in collaboration with the companies ZEBR and Meopta-optica [15]. The instrument is based on W. Hug’s design using back-scattering geometry, a scattered circular polarization (SCP) modulation scheme and a Nd:YAG laser with a 532 nm excitation wavelength [13,14]. The samples were measured in a rectangular fused silica cell of 70 μL volume in the temperature cell, thus, ensuring a stable temperature 25.0 ± 0.1 °C. The laser power at the sample was set to 266 mW for α-pinene and 772 mW for alanine, which are the usual powers used for similar samples [14].
Raman and ROA spectra were simultaneously collected in the full range from 40 to 4000 cm−1. However, since the ROA:Raman ratio is small in the high-wavenumber spectral range around 3000 cm−1, only data from one camera in spectral range 40 to 2400 cm−1 were used for further processing in all cases [15]. The spectral resolution was ~6 cm−1, and the spectra intensity is given as the number of detected electrons per excitation energy, e·J −1, i.e., the intensity correction procedure was not applied.
3.3. Data Processing
Analyzed spectra were exported in 84 blocks (3.9 min per of accumulation time per block) and 10 blocks (34 min per of accumulation time per block) for α-pinene and alanine, respectively. The data were also smoothed with the Savitzky–Golay filter for further processing. Various limited spectral ranges from the full dataset were tested for Raman baseline correction, ROA intensity normalization (Equation (5)), EE determination (Equation (7) or PLS) and artifact correction (Equations (12) and (13)), and these will be discussed further.
The Raman baseline correction needed for ROA spectra normalization played a key role in the performance of the EE determination. For the baseline correction, we used asymmetric least square smoothing algorithm [16], where an optimal asymmetry parameter 1.3 × 10⁻⁴ and smoothness parameter 3.2 × 10⁵ were set both for α-pinene and alanine. The chosen baseline parameters were relatively robust and, within one order of magnitude, led to similar results. An alternative approach to effectively estimate the baseline is the iterative polynomial smoothing method [17]. When applied to the presented data set, it led to similar results but with a longer computing time. All data were processed and further analyzed in MATLAB software.
4. Results and Discussion
Two samples were used to determine the enantiomeric excess: α-pinene, which occurs as a liquid at room temperature and is often used as a chiroptical calibration standard. Furthermore, alanine was used as a prototype chiral molecule investigated in aqueous solution. Alanine is the simplest chiral amino acid, which is also readily available in both enantiomers.
The procedure for processing the enantiomeric excess was first illustrated on spectra in the basic setup (parameters for Savitzky–Golay smoothing, spectral range selection for Raman baseline correction, ROA normalization, artifact correction and EE determination), and the basic observed aspects of the EE determination and possible sources of measurement errors will be explained by these results. Then, the refinement parameters for the spectra processing will be discussed in order to obtain the most accurate and precise results. Finally, we will discuss the question of how the overall accuracy of the EE determination (standard deviation of errors of the EE determination) depends on the required measurement time.
4.1. Basic Processing Routine
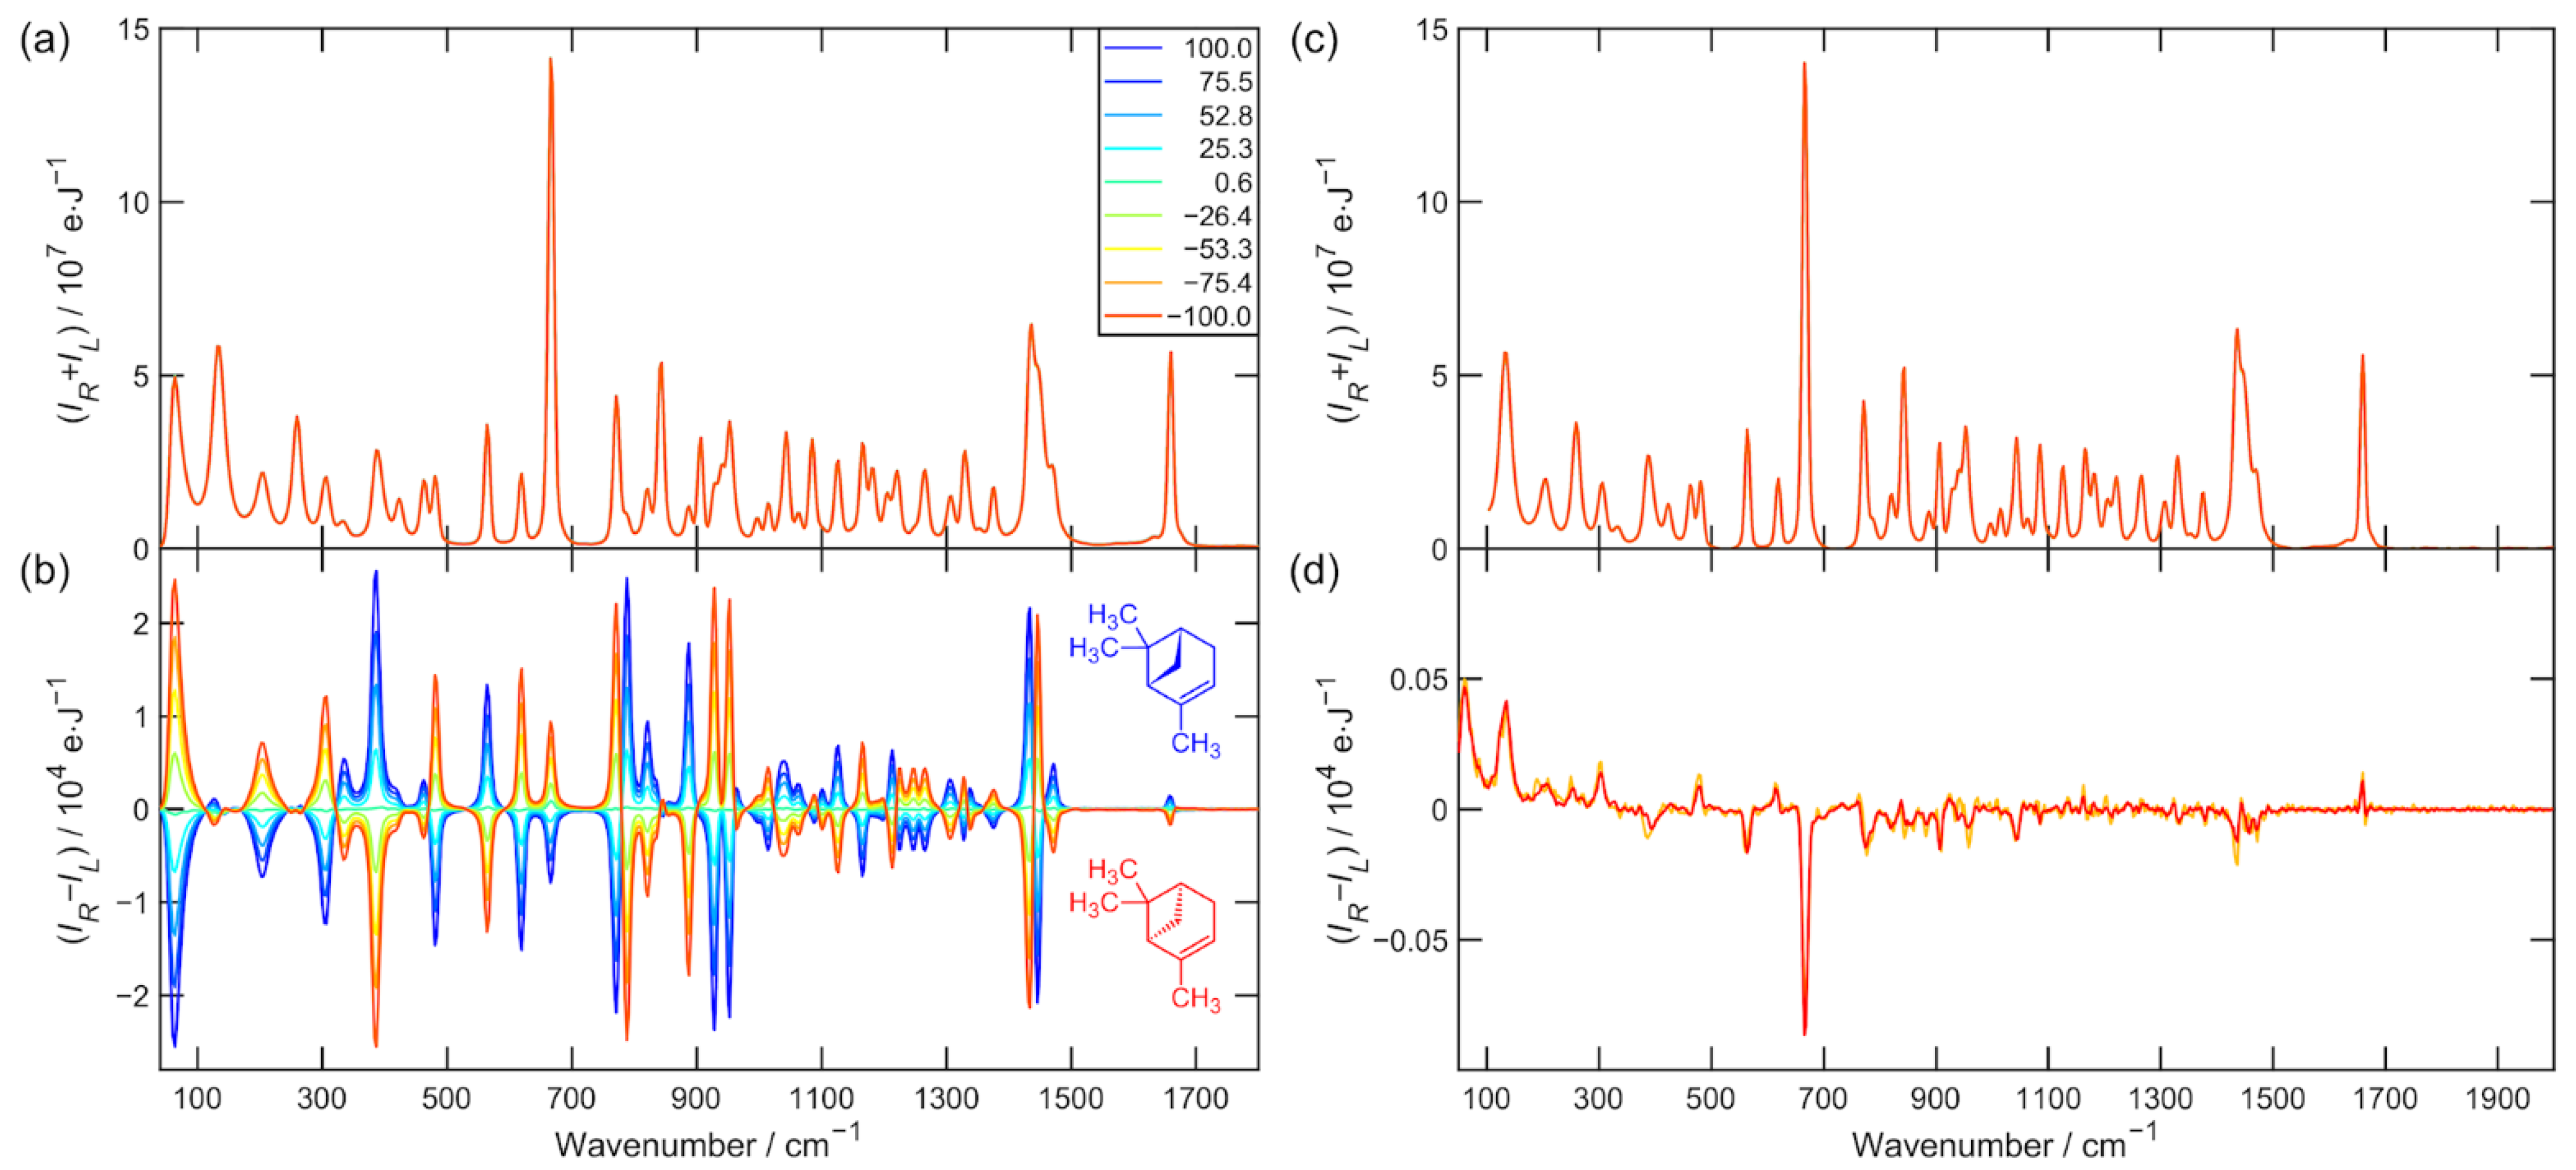
The Raman and ROA raw data used for the further analysis of α-pinene and alanine (nine enantiomeric mixtures) are presented in Figure 1a,b and Figure 2a,b. All spectra were then subjected to third-order five-point Savitzky–Golay smoothing. The spectral region 100–2000 cm−1 was used in all mentioned aspects of data processing. Figure 1c and Figure 2c show the Raman spectrum after baseline correction, and Figure 1d and Figure 2d show the spectrum of the ROA artifacts determined by Equations (11) and (12). The elevated Raman baseline was effectively corrected by the asymmetric least squares smoothing algorithm taken from [16]. The aim of this procedure was not to make the baseline as flat as possible but to unify Raman spectra in the data set before the ROA normalization.
The results of the EE analysis for α-pinene and alanine aqueous solution are listed in Table 1 and Table 2, respectively. The columns in these tables have the following meanings: i is the sample number (not in the order in which the spectra were measured; see Materials and Methods), nnorm is the ROA normalization factor determined according to Equation (5) after the Raman baseline correction, is the EE calculated from sample preparation according to Equation (3), is the EE determined from ROA spectra according to Equation (6), is the corresponding EE determination error according to Equation (8), and are the recalculated EEs and corresponding errors calculated according to Equation (9) based on the assumption that reference B has a different EE than reference A and that the sum of errors is zero. The following four columns , , and have the same meaning; the artifact spectra according to Equation (13) were subtracted from the experimental ROA spectra to obtain the artifact-free ROA spectra needed for the calculation. The last two columns and represent EEs determined by the leave-one-out PLS algorithm applied to baseline corrected and normalized spectra before the systematic artifact correction and their corresponding errors determined by Equation (8), respectively. The bottom line of the tables represents the standard deviation of the errors determined according to Equation (10) for the respective columns.
By comparing the standard deviations of the errors of EE determination and , it can be said that using the assumption that the EE of the “pure” forms A and B need not be the same and that the sum of the errors is zero according to Equation (9) leads to a significant increase in the precision of the EE determination (the standard deviations of the errors of EE determination decreased roughly 1.6× for α-pinene and 9× in the case of alanine in aqueous solution) but not necessarily to improvement of the accuracy, which can be demonstrated by large deviations from −100% of EE of reference B (row i = 9, especially for alanine). Note that absolute values of EE of reference B above 100% are possible, since they are relative to reference A and indicate that reference B has a higher EE than reference A.
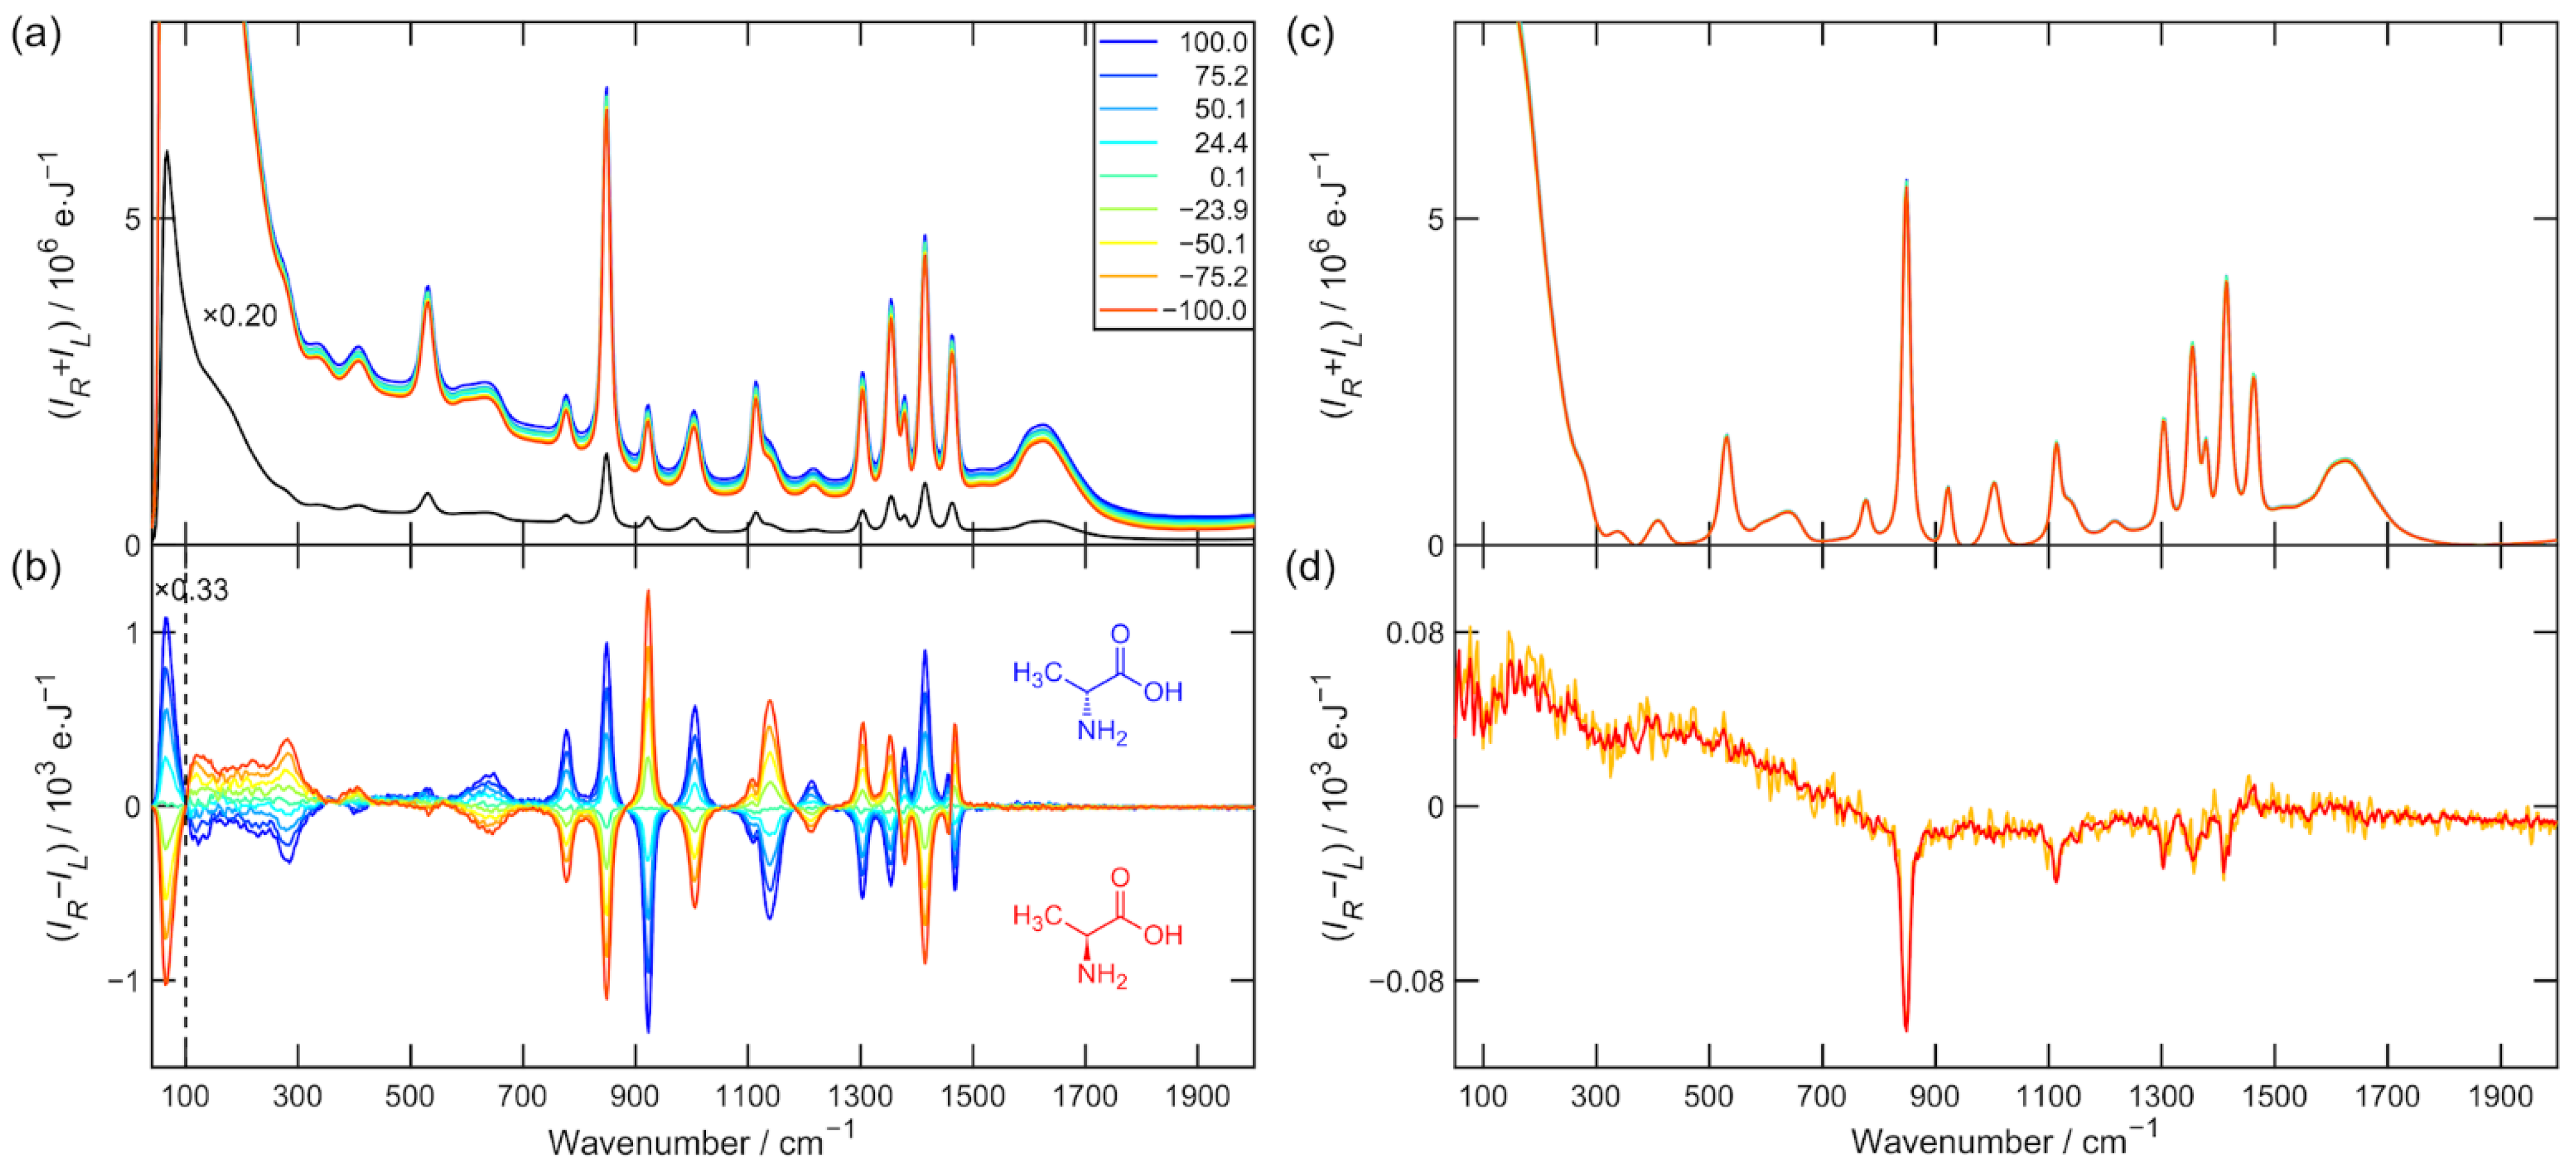
The data presented in Table 1 and Table 2 for the ROA spectra after subtraction of artifacts and especially the values and do not suggest much improvement at first glance. However, the results for the determination of EE (row i = 9) clearly indicate that there has been a significant improvement in accuracy after artifact subtraction. The artifact spectra of α-pinene and alanine are plotted in Figure 1d and Figure 2d. Strongly polarized and also the most intense Raman bands, such as α-pinene breathing vibration 667 cm−1 or alanine CN and CC stretching vibration 848 cm−1 are the most artifact prone [13]. They constitute approximately 10% of the measured ROA signal.

Table 1.
Enantiomeric excess analysis of α-pinene spectra depicted in Figure 1. See text for detailed descriptions.
Table 1.
Enantiomeric excess analysis of α-pinene spectra depicted in Figure 1. See text for detailed descriptions.
| i | ||||||||||||
|---|---|---|---|---|---|---|---|---|---|---|---|---|
| 1 | 1.000 | 100.00 | 100.00 | 0.00 | 100.00 | 0.00 | 100.00 | 0.00 | 100.00 | 0.00 | 100.34 | −0.34 |
| 2 | 1.005 | 75.49 | 75.32 | 0.17 | 75.52 | 0.21 | 75.28 | 0.21 | 75.49 | 0.21 | 75.43 | 0.06 |
| 3 | 1.004 | 52.79 | 52.69 | 0.11 | 52.86 | 0.17 | 52.62 | 0.18 | 52.79 | 0.18 | 52.72 | 0.07 |
| 4 | 0.997 | 25.28 | 25.21 | 0.07 | 25.38 | 0.17 | 25.11 | 0.17 | 25.28 | 0.17 | 25.15 | 0.13 |
| 5 | 0.994 | 0.59 | 0.64 | −0.06 | 0.72 | 0.08 | 0.51 | 0.08 | 0.59 | 0.08 | 0.50 | 0.08 |
| 6 | 1.004 | −26.39 | −26.22 | −0.17 | −26.22 | 0.00 | −26.38 | −0.01 | −26.39 | −0.01 | −26.45 | 0.05 |
| 7 | 1.000 | −53.28 | −53.00 | −0.27 | −53.07 | −0.07 | −53.21 | −0.07 | −53.28 | −0.07 | −53.33 | 0.06 |
| 8 | 0.996 | −75.41 | −74.96 | −0.45 | −75.17 | −0.21 | −75.19 | −0.21 | −75.40 | −0.21 | −75.34 | −0.07 |
| 9 | 0.995 | −100.00 | −99.39 | −0.61 | −99.73 | −0.34 | −99.65 | −0.35 | −100.00 | −0.34 | −99.80 | −0.20 |
| 0.28 | 0.17 | 0.18 | 0.18 | 0.15 | ||||||||
Table 2.
Enantiomeric excess analysis results of the alanine spectra depicted in Figure 2. See text for detailed descriptions.
Table 2.
Enantiomeric excess analysis results of the alanine spectra depicted in Figure 2. See text for detailed descriptions.
| i | ||||||||||||
|---|---|---|---|---|---|---|---|---|---|---|---|---|
| 1 | 1.000 | 100.00 | 100.00 | 0.00 | 100.00 | 0.00 | 100.00 | 0.00 | 100.00 | 0.00 | 100.13 | −0.13 |
| 2 | 1.021 | 75.23 | 74.24 | 0.99 | 74.74 | 0.51 | 74.73 | 0.50 | 75.23 | 0.50 | 74.78 | 0.45 |
| 3 | 1.009 | 50.08 | 48.84 | 1.23 | 49.09 | 0.25 | 49.78 | 0.30 | 50.08 | 0.30 | 49.89 | 0.19 |
| 4 | 1.028 | 24.37 | 23.13 | 1.24 | 22.87 | −0.25 | 24.62 | −0.25 | 24.37 | −0.25 | 24.74 | −0.38 |
| 5 | 1.003 | 0.08 | −1.88 | 1.96 | −1.89 | −0.01 | 0.20 | −0.12 | 0.08 | −0.12 | 0.23 | −0.15 |
| 6 | 1.035 | −23.93 | −26.33 | 2.41 | −26.37 | −0.04 | −23.88 | −0.05 | −23.93 | −0.05 | −23.91 | −0.02 |
| 7 | 1.020 | −50.12 | −53.24 | 3.12 | −53.08 | 0.16 | −50.24 | 0.12 | −50.12 | 0.12 | −50.40 | 0.28 |
| 8 | 1.027 | −75.21 | −78.26 | 3.04 | −78.67 | −0.41 | −74.85 | −0.37 | −75.21 | −0.37 | −74.93 | −0.29 |
| 9 | 1.022 | −100.00 | −103.74 | 3.74 | −103.95 | −0.20 | −99.87 | −0.13 | −100.00 | −0.13 | −100.09 | 0.09 |
| 2.28 | 0.26 | 0.26 | 0.26 | 0.26 | ||||||||
The determination of EE by PLS is quite robust to artifacts in ROA spectra. ROA artifact correction had minimal influence on the results obtained from the PLS method, and therefore these results are not shown in the tables. The PLS method gives only slightly better results than the simple artifact reduction method that we described. A major advantage of our method may be that the stated accuracies are achieved for independent pairs of spectra (only two spectra are needed), one of which was chosen as reference A.
Coincidentally, the determined EE of reference B for both α-pinene and alanine is close to 100% within the error margin. Therefore, correction of the enantiomeric purity of reference B according to Equation (9) does not yield a significant improvement. However, if the EEs of the two “pure” forms were different, we believe that this correction may represent a substantial improvement in the results.
The importance of Raman baseline correction and ROA normalization is described by comparing Table 1 and Table 2 with Table 3 and Table 4, where the Raman baseline correction and ROA normalization were not applied (nnorm factor was set to unity). The results show that, unless the baseline correction and the resulting normalization of the ROA spectra is performed, it is not possible to reduce the standard deviation of the errors of EE below 0.26% for α-pinene and approximately 1% for alanine.
4.2. Optimization of Parameters for EE Determination
The first of the parameters whose optimal values that we attempted to find were the Savitzky–Golay smoothing parameters. The results of the determination of the standard deviation of the EE determination errors after artifact correction , together with the coefficient cB1 indicating the determined EE of reference B, are shown in Table 5. Other parameters were set as in the previous section.
The results show that a slight reduction in the standard deviation was achieved for mild smoothing; however, the overall accuracy of the EE determination was not very dependent on the smoothing parameters as long as the smoothing and subsequent resolution degradation was not overly significant.
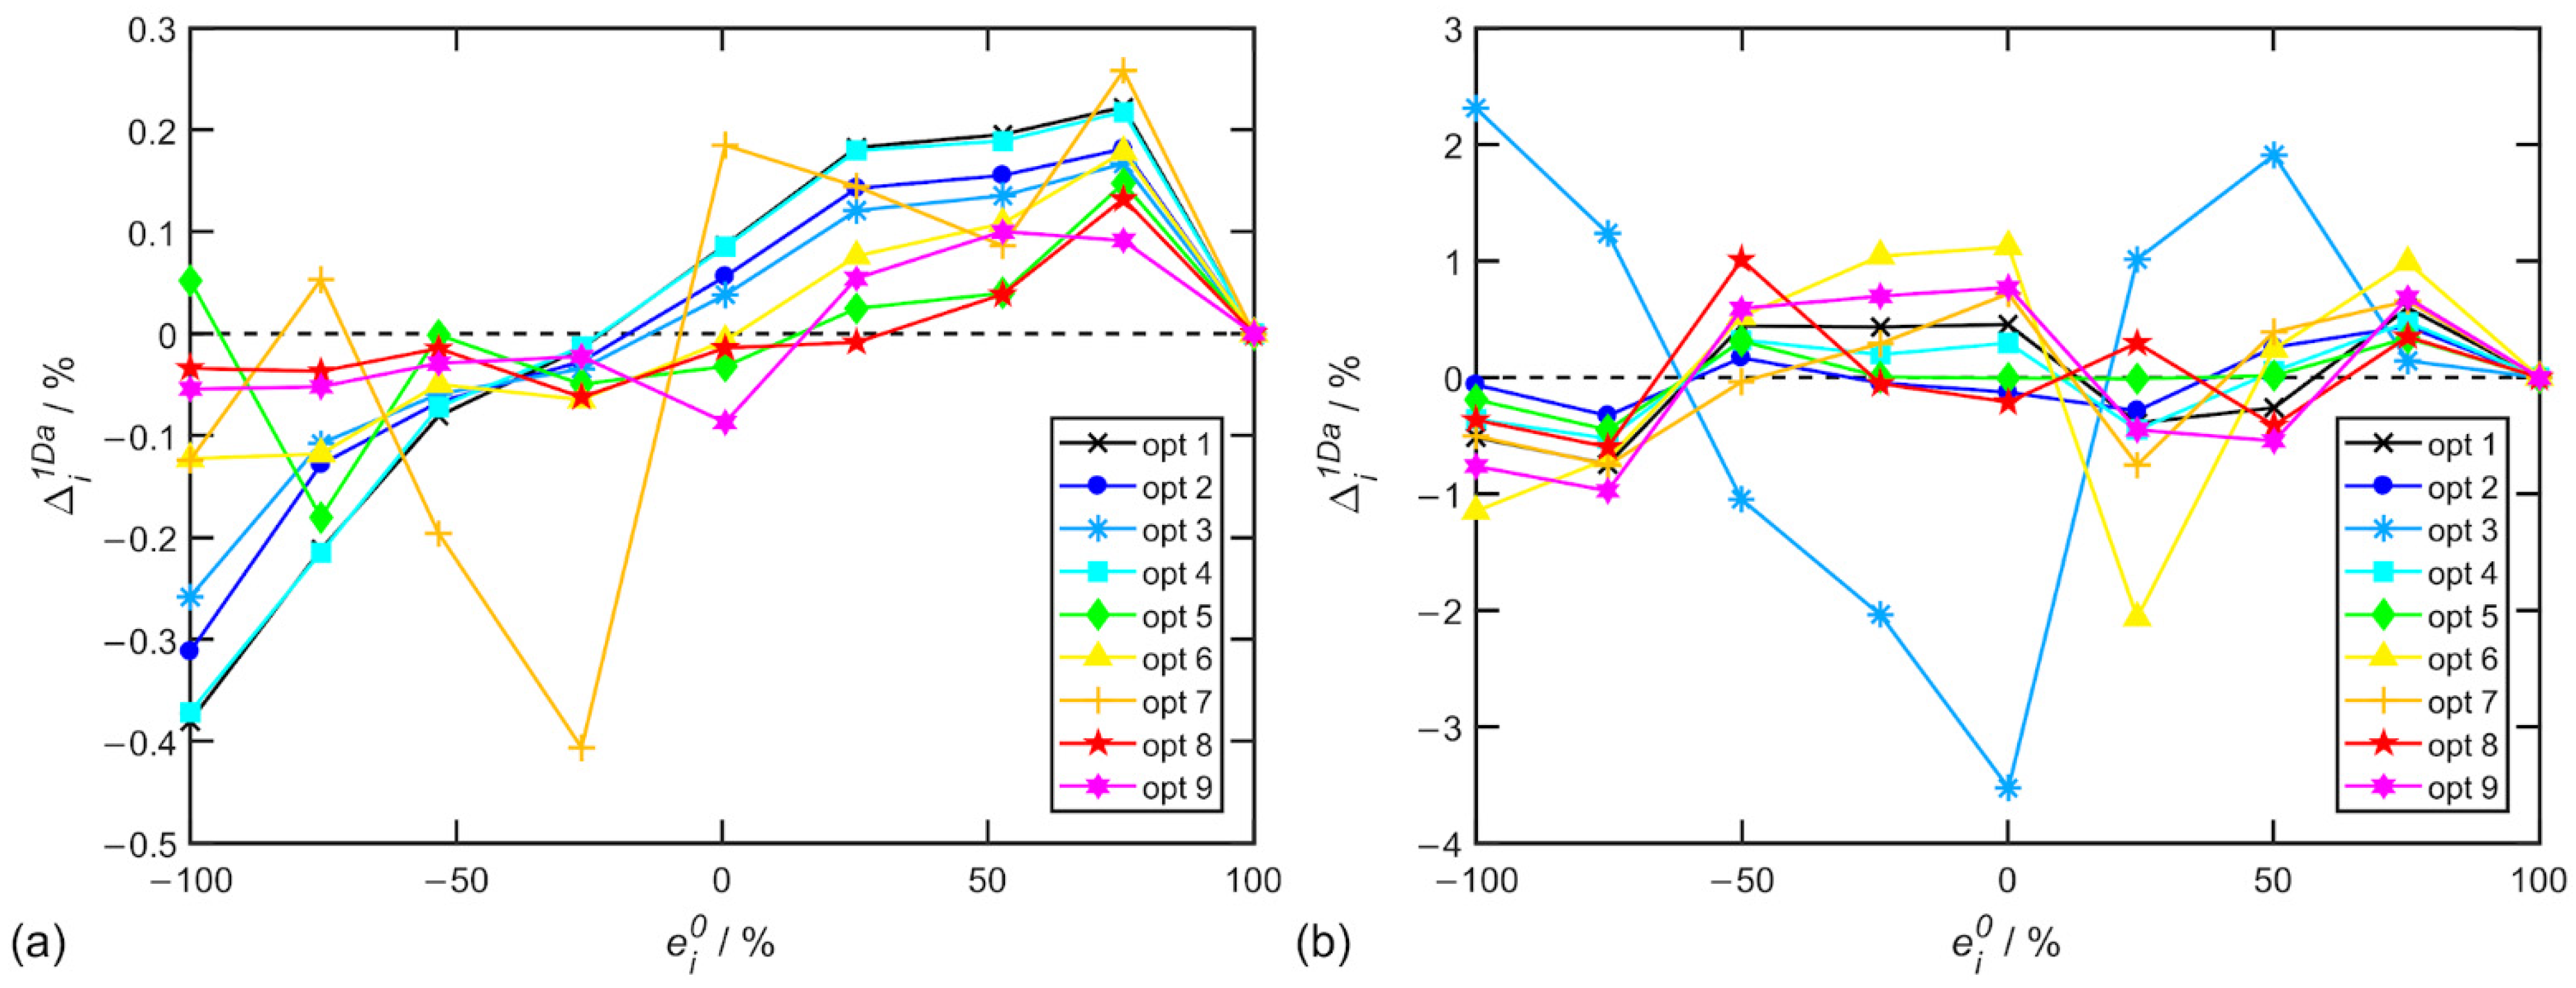
Another important set of parameters was the spectral range selection for Raman baseline correction, ROA normalization, artifact correction and EE determination. For the evaluations, we used the standard deviation of the EE determination errors after artifact correction again with the coefficient cB1, and the results are shown in Table 6 for α-pinene and in Table 7 for alanine. Individual EE determination errors for options in Table 6 and Table 7 are depicted in Figure 3.
The spectral ranges were chosen considering the presence of dominant artifacts at 667 cm−1 for α-pinene and 848 cm−1 for alanine, which divide the spectrum into approximately two halves. For α-pinene, it was also important to include a relatively isolated polarized band around 1660 cm−1 and a region towards 2000 cm−1 where bands corresponding to fundamental vibrations do not occur; however, this region can be important for the correct determination of the background in Raman spectra.
These results confirm that the appropriate choice of spectral range for baseline correction and ROA normalization can lead to a substantial reduction in EE determination errors. Table 6 shows that, if the spectral range used for normalization of α-pinene’s spectra is limited to 1500–1800 cm−1, i.e., around the relatively isolated spectral band of 1660 cm−1, the most accurate results can be obtained.
However, two caveats must be added. First, α-pinene is a substance that undergoes air oxidation over longer time scales of weeks and one of the most pronounced changes is in the vicinity of the 1660 cm−1 band (see Figure A1). Second, the region 1700 cm−1 and above, while free of fundamental vibrations, contains a number of low-intensity but significant bands from combinatorial vibrations (ref. [15]) that make proper baseline correction not an easy task.
Not overly surprisingly, the exclusion of the bands carrying the largest artifacts leads to an increase in the accuracy of the EE determination, for example, limiting the EE determination to the 700–1500 cm−1 range for α-pinene. However, it was surprising that even higher accuracy of EE determination for α-pinene was achieved for another drastic reduction of the spectral range for EE determination to only a few bands in the 700–940 cm−1 region. Admittedly, these bands achieve a large ROA to Raman ratio and are little burdened by artifacts.
Therefore, the whole reliable spectral region 100–2000 cm−1 can be used as the first choice; however, an appropriate choice of spectral ranges can lead to a substantial increase in the accuracy of the EE determination.
4.3. Dependence of EE Determination Accuracy on Measurement Time
In the last section, we attempted to use the measured data to investigate how the accuracy of the EE determination depends on the measurement time of the ROA spectra. In other words, we try to answer the question of how long ROA measurements are needed to be able to achieve a certain accuracy of EE determination.
The ROA spectra are generally shot-noise limited [13]. As the signal-to-noise ratio increases with a square root of the exposition time, it is reasonable to describe the standard deviation of EE determination errors as:
where is the standard deviation expected for the unit exposition time t and is the limit of the standard deviation for infinite time measurement, which can be interpreted as a residual systematic error.
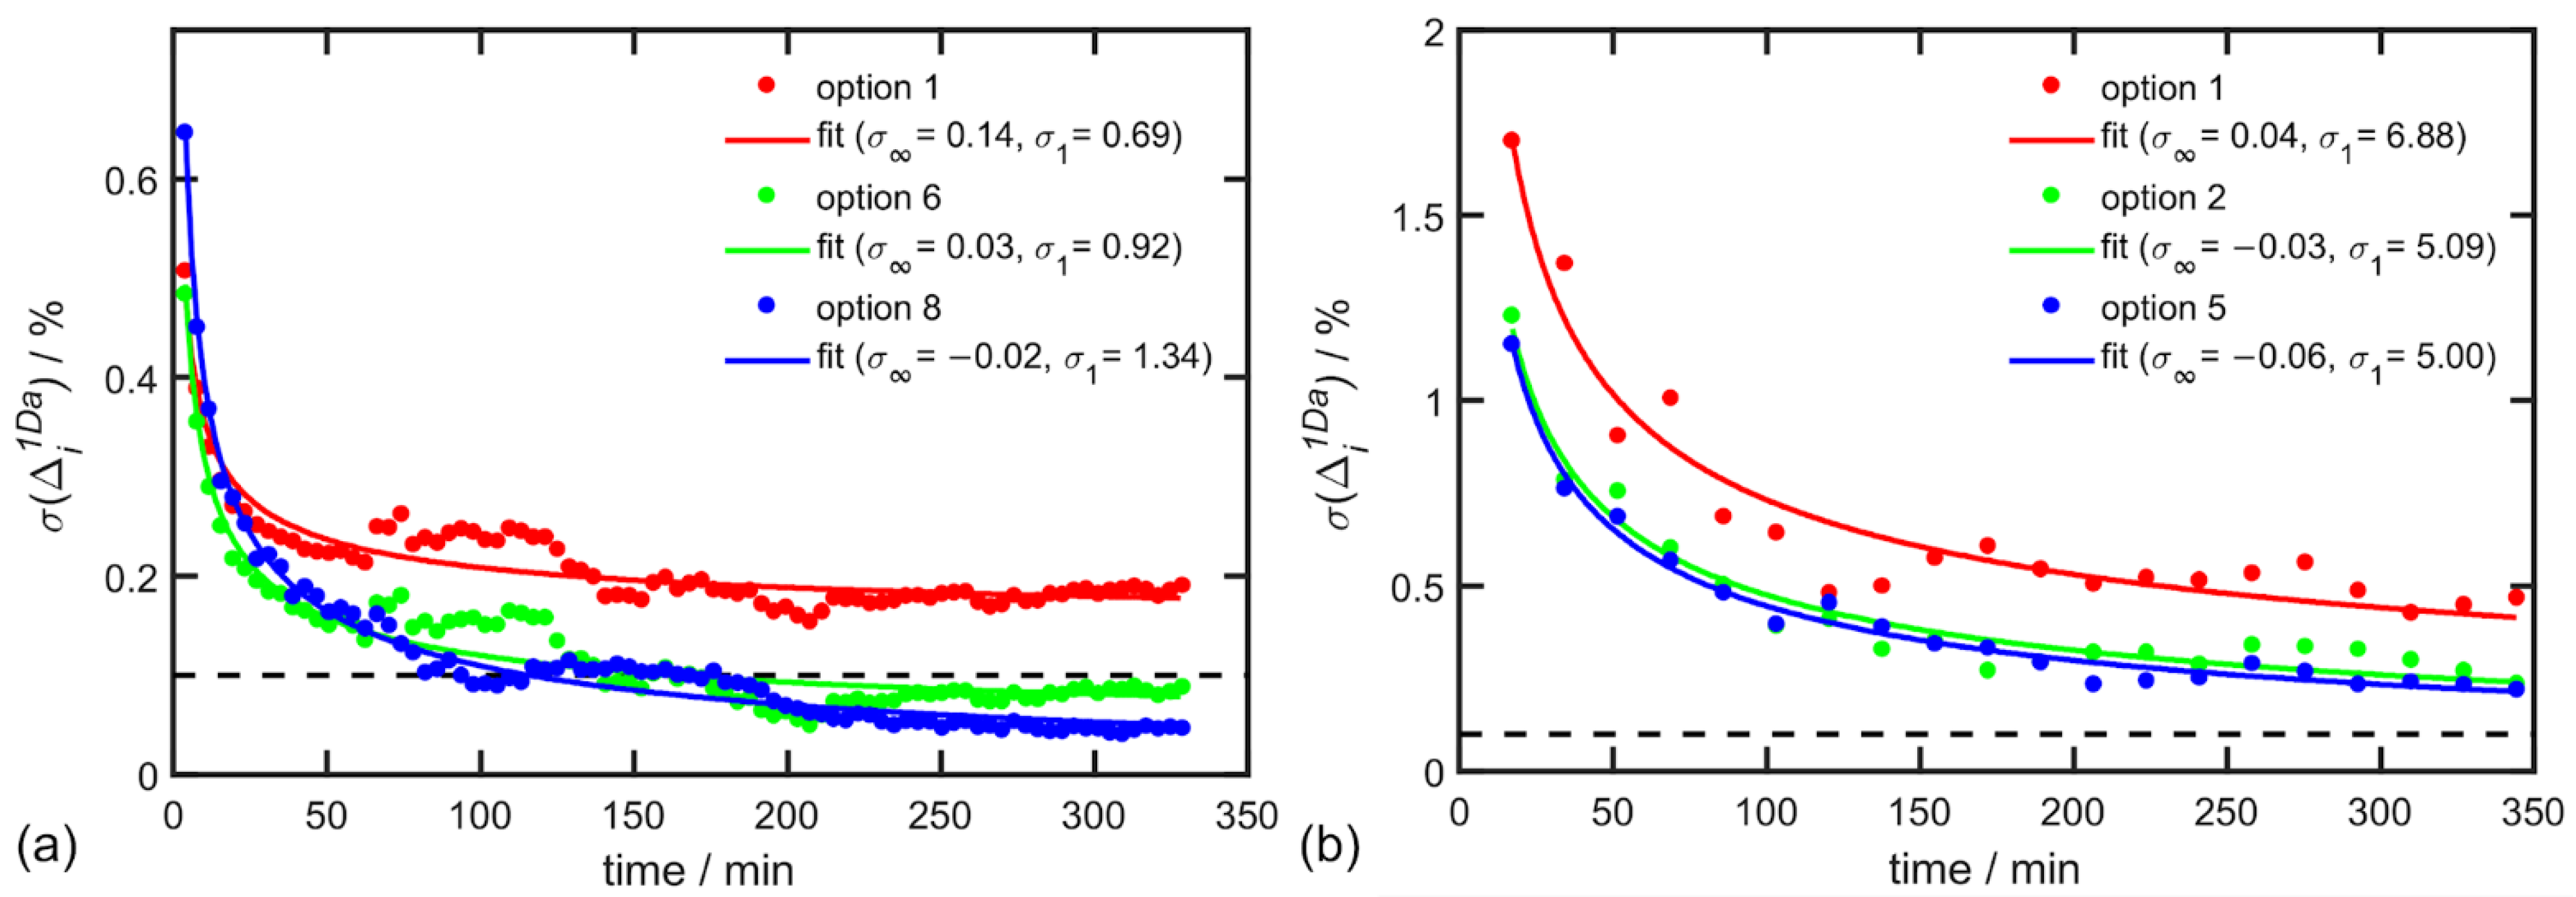
Raman and ROA spectra were exported periodically during the experiment, for α-pinene every 3.91 min and for alanine every 17.2 min. The time dependence of was then calculated for every cumulative step for three different combinations of parameters listed in Table 6 and Table 7 and results are depicted in Figure 4.
In the case of α-pinene, the EE accuracy of 0.1% was already achieved after 100 min of exposition time and accuracy of 0.05% after 330 min of exposition time for the best choice of parameters (option 8 in Table 6). A similar convergence was confirmed by alanine in aqueous solution but with a lower accuracy ~0.22% after 345 min. The worse accuracy for alanine is caused by the ten-times weaker ROA signal in comparison to α-pinene in the analyzed spectral region.
5. Conclusions
We demonstrated a new methodology of enantiomeric excess (EE) determination by Raman optical activity (ROA). This method is based on an effective algorithm that includes Raman baseline correction, ROA intensity normalization and a systematic error elimination procedure applied to the experimental ROA data. A large improvement in the precision, but not accuracy, was achieved when one of the reference samples was found to be less than 100% pure, and its enantiomeric purity was determined with respect to the zero-sum EE error assumption. When experimental artifacts were subtracted from the ROA experimental spectra, the accuracy of the EE determination was improved. Similarly, accurate predicted enantiomeric excess determination was achieved using the PLS algorithm.
Nine approximately equally distributed mixtures of neat α-pinene were used as the first chiral test. Special care had to be taken during the preparation as the α-pinene oxidation decomposition could affect the measured relative Raman intensities and disrupt the EE determination. An accuracy of 0.18% after 330 min of exposition was achieved when the full spectral region (100–2000 cm−1) was chosen for normalization and EE determination. For carefully selected spectral regions for the ROA normalization and the EE analysis, a higher accuracy of 0.05% could be achieved.
Another chiral sample often used for benchmark studies in vibrational spectroscopy is alanine in an aqueous solution. It has an approximately order of magnitude weaker ROA signal compared with α-pinene. The accuracy was determined to be 0.26% for nine enantiomeric mixtures of L-Ala and D-Ala after a 345 min accumulation measurement. A slightly better accuracy of 0.22% could be obtained for EE determination within a selected spectral region with stronger bands and a better signal-to-noise ratio.
We conclude that ROA spectroscopy proved to be a valuable non-destructive technique in the quantitative analysis of enantiomeric mixtures with an accuracy around 0.1% with reasonable accumulation times.
Author Contributions
J.K. conceived the presented idea and organized the project. P.M. and J.K. worked on the methodology. P.M., J.K. and J.H. co-wrote the manuscript. J.H. prepared samples. J.H. and P.M. conducted ROA experiments. P.M. wrote software for the spectra processing. J.K., R.Č., M.D. and M.V. collaborated on the ROA spectrometer construction. All authors have read and agreed to the published version of the manuscript.
Funding
This research was funded by the Czech Grant Agency (22-04669S) and by a student grant of the Palacký University Olomouc (IGA_PrF_2022_001).
Institutional Review Board Statement
Not applicable.
Informed Consent Statement
Not applicable.
Data Availability Statement
Raw data are available from the corresponding author on request.
Conflicts of Interest
The authors state that they pursue the commercialization of the ROA spectrometer as employees of Palacký University Olomouc in cooperation with ZEBR and Meopta-optica companies.
Appendix A
Appendix A.1. Note Regarding Oxidation of α-Pinene
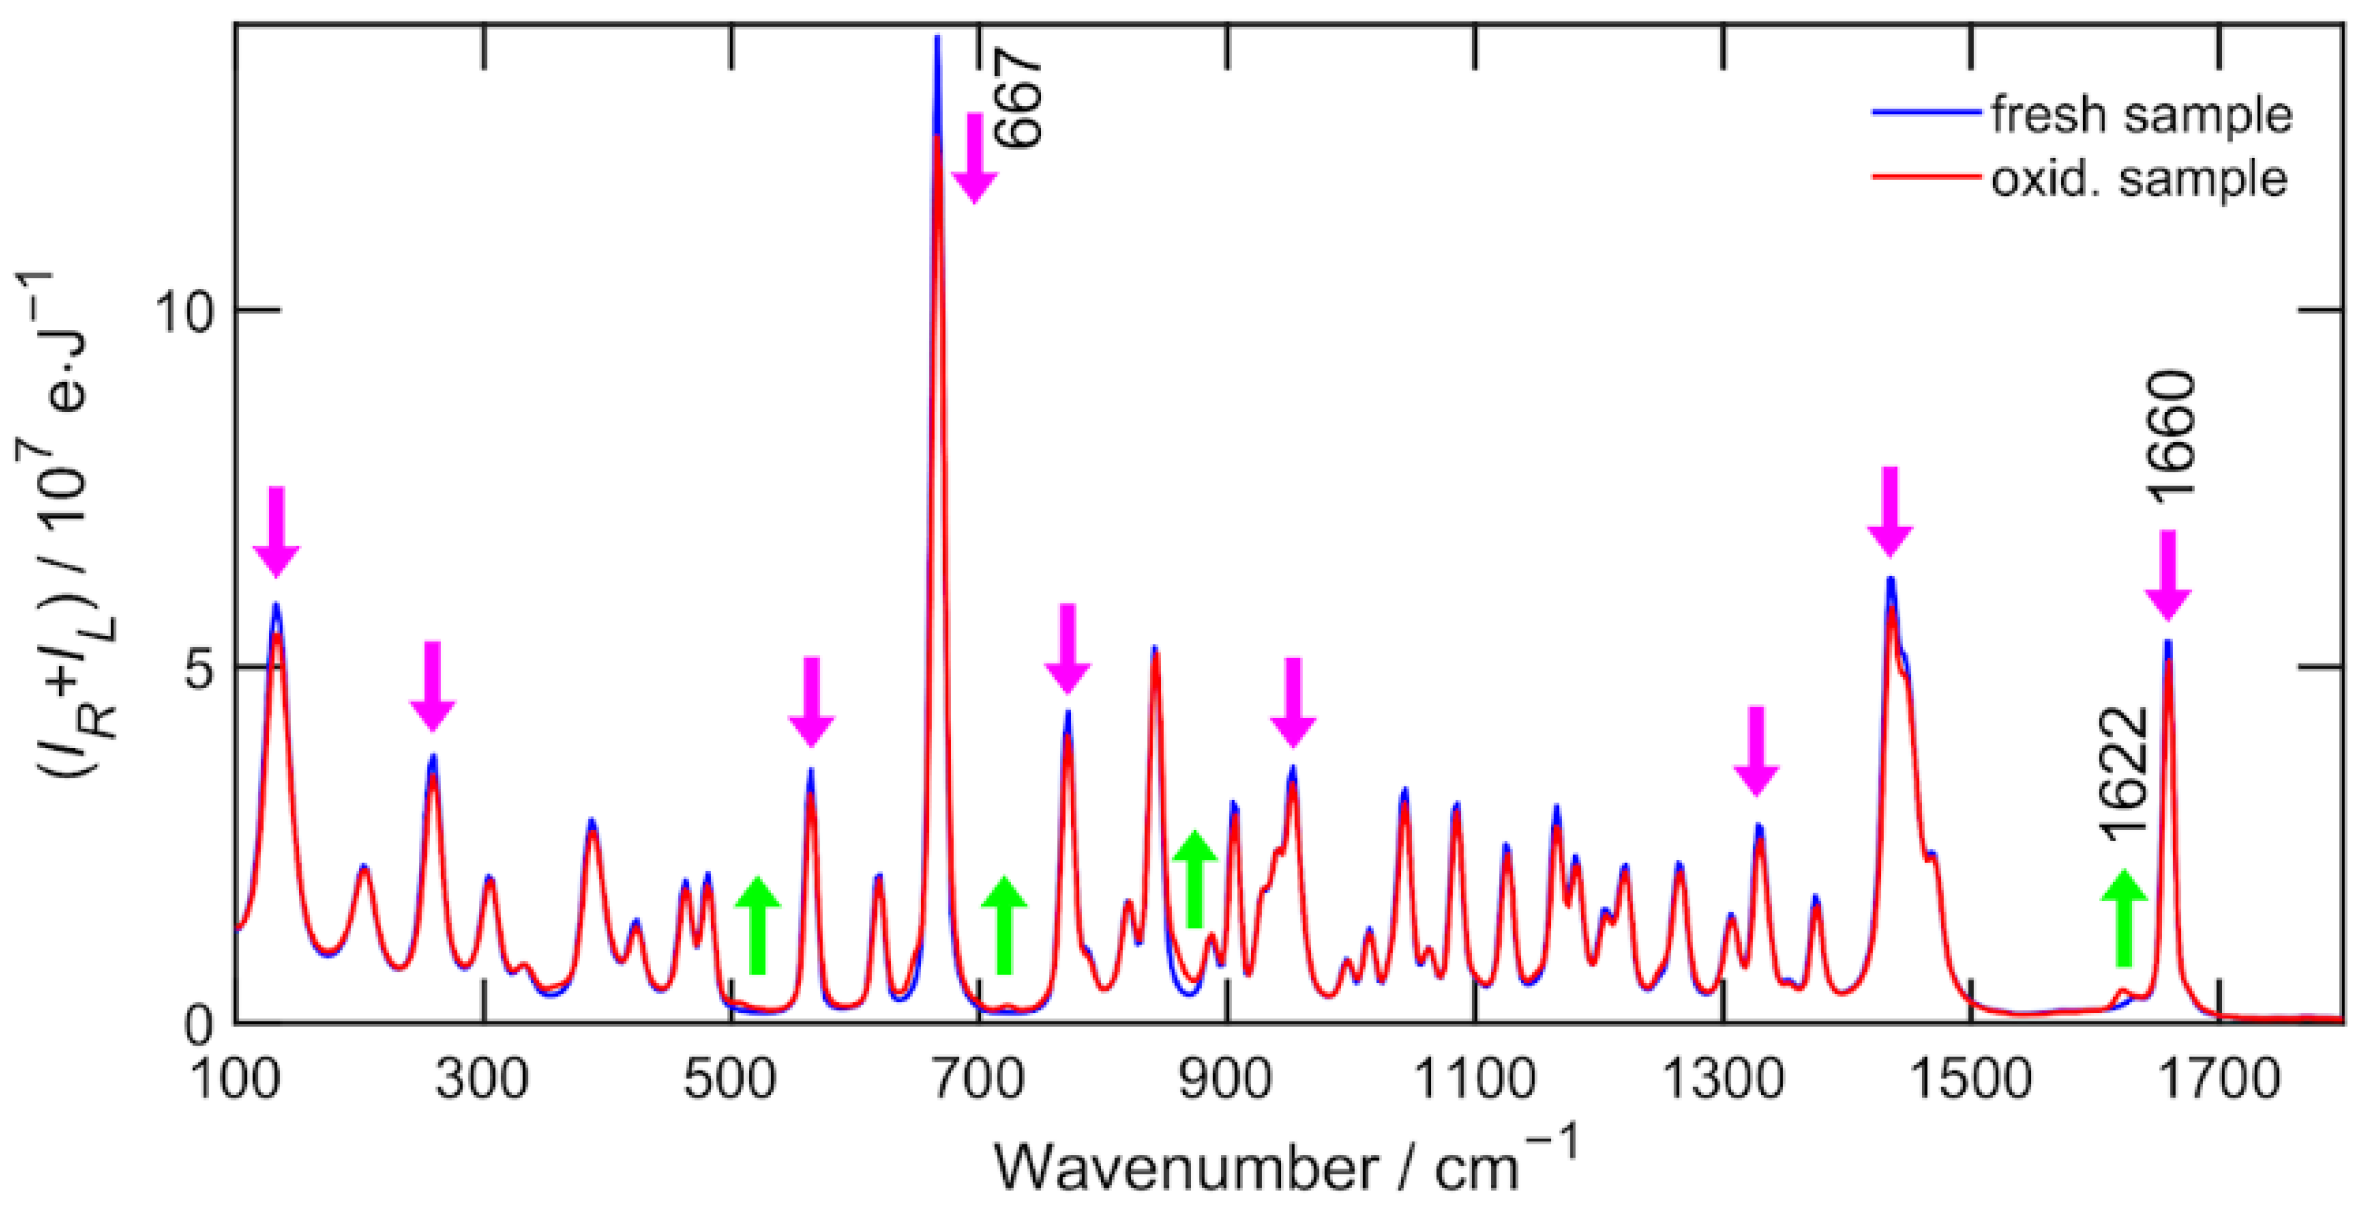
It must be noted that α-pinene oxidizes while exposed to the air. The main oxidation products are α-pinene oxide, verbenyl hydroperoxide, verbenol and verbenone [18]. The oxidization is faster for smaller volumes and larger size of the area exposed to the air. Fortunately, Raman spectroscopy is a sensitive technique to monitor such changes as shown in Figure A1. Oxidization affects the relative Raman intensities and prevents the correct enantiomeric excess determination. The sideband 1622 cm−1 of α-pinene C=C stretching fundamental vibration 1660 cm−1 is a good marker of the oxidation beginning and the presence of oxidation products in the sample. Therefore, special care has to be taken during the preparation and measurement of α-pinene enantiomeric mixtures and to use α-pinene as a primary reference standard in general.
Figure A1.
Raman spectrum of α-pinene as a fresh sample measured immediately after the bottle opening (blue) and an old oxidized sample (red). The significant intensity changes are marked by arrows. The most characteristic band is 1622 cm−1 sideband of C=C stretching 1660 cm−1.
Figure A1.
Raman spectrum of α-pinene as a fresh sample measured immediately after the bottle opening (blue) and an old oxidized sample (red). The significant intensity changes are marked by arrows. The most characteristic band is 1622 cm−1 sideband of C=C stretching 1660 cm−1.

References
- Barron, L.D. Molecular Light Scattering and Optical Activity, 2nd ed.; Cambridge University Press: Cambridge, UK, 2004. [Google Scholar]
- Nafie, L.A. Vibrational Optical Activity: Principles and Applications; Wiley: Chichester, UK, 2011. [Google Scholar]
- Chankvetadze, B. Capillary Electrophoresis in Chiral Analysis; John Wiley: Chichester, UK; New York, NY, USA, 1997. [Google Scholar]
- Spencer, K.M.; Cianciosi, S.J.; Baldwin, J.E.; Freedman, T.B.; Nafie, L.A. Determination of Enantiomeric Excess in Deuterated Chiral Hydrocarbons by Vibrational Circular Dichroism Spectroscopy. Appl. Spectrosc. 1990, 44, 235–238. [Google Scholar] [CrossRef]
- Hecht, L.; Phillips, A.L.; Barron, L.D. Determination of enantiomeric excess using Raman optical activity. J. Raman Spectrosc. 1995, 26, 727–732. [Google Scholar] [CrossRef]
- Guo, C.; Shah, R.D.; Dukor, R.K.; Cao, X.; Freedman, T.B.; Nafie, L.A. Determination of Enantiomeric Excess in Samples of Chiral Molecules Using Fourier Transform Vibrational Circular Dichroism Spectroscopy: Simulation of Real-Time Reaction Monitoring. Anal. Chem. 2004, 76, 6956–6966. [Google Scholar] [CrossRef] [PubMed]
- Guo, C.; Shah, R.D.; Dukor, R.K.; Cao, X.; Freedman, T.B.; Nafie, L.A. Enantiomeric Excess Determination by Fourier Transform Near-Infrared Vibrational Circular Dichroism Spectroscopy: Simulation of Real-Time Process Monitoring. Appl. Spectrosc. 2005, 59, 1114–1124. [Google Scholar] [CrossRef] [PubMed]
- Quesada-Moreno, M.M.; Virgili, A.; Monteagudo, E.; Claramunt, R.M.; Avilés-Moreno, J.R.; López-González, J.J.; Alkorta, I.; Elguero, J. A Vibrational Circular Dichroism (VCD) Methodology for the Measurement of Enantiomeric Excess in Chiral Compounds in the Solid Phase and for the Complementary Use of NMR and VCD Techniques in Solution: The Camphor Case. Analyst 2018, 143, 1406–1416. [Google Scholar] [CrossRef] [PubMed]
- Merten, C.; Kowalik, T.; Hartwig, A. Vibrational Circular Dichroism Spectroscopy of Solid Polymer Films: Effects of Sample Orientation. Appl. Spectrosc. 2008, 62, 901–905. [Google Scholar] [CrossRef]
- Kinalwa, M.N.; Blanch, E.W.; Doig, A.J. Accurate Determination of Protein Secondary Structure Content from Raman and Raman Optical Activity Spectra. Anal. Chem. 2010, 82, 6347–6349. [Google Scholar] [CrossRef]
- Rosipal, R.; Krämer, N. Overview and Recent Advances in Partial Least Squares. In Proceedings of the Subspace, Latent Structure and Feature Selection, Berlin/Heidelberg, Germany, 23–25 February 2005; pp. 34–51. [Google Scholar]
- de Jong, S. SIMPLS: An Alternative Approach to Partial Least Squares Regression. Chemom. Intell. Lab. Syst. 1993, 18, 251–263. [Google Scholar] [CrossRef]
- Hug, W.; Hangartner, G. A novel high-throughput Raman spectrometer for polarization difference measurements. J. Raman Spectrosc. 1999, 30, 841–852. [Google Scholar] [CrossRef]
- Hug, W. Virtual Enantiomers as the Solution of Optical Activity’s Deterministic Offset Problem. Appl. Spectrosc. 2003, 57, 1–13. [Google Scholar] [CrossRef] [PubMed]
- Michal, P.; Čelechovský, R.; Dudka, M.; Kapitán, J.; Vůjtek, M.; Berešová, M.; Šebestík, J.; Thangavel, K.; Bouř, P. Vibrational Optical Activity of Intermolecular, Overtone, and Combination Bands: 2-Chloropropionitrile and α-Pinene. J. Phys. Chem. B 2019, 123, 2147–2156. [Google Scholar] [CrossRef] [PubMed]
- Eilers, P.; Boelens, H. Baseline Correction with Asymmetric Least Squares Smoothing. Leiden Univ. Med. Cent. Rep. 2005, 1, 5. [Google Scholar]
- Wang, T.; Dai, L. Background Subtraction of Raman Spectra Based on Iterative Polynomial Smoothing. Appl. Spectrosc. 2016, 71, 1169–1179. [Google Scholar] [CrossRef] [PubMed]
- Neuenschwander, U.; Guignard, F.; Hermans, I. Mechanism of the Aerobic Oxidation of Alpha-Pinene. ChemSusChem 2010, 3, 75–84. [Google Scholar] [CrossRef] [PubMed]
Figure 1.
(a) Raman and (b) ROA spectra of neat liquid α-pinene enantiomeric mixtures after 5.5 h of exposition time each. The legend shows EE determined from sample preparation. (c) Raman spectra after baseline correction. (d) ROA artifact spectrum calculated according to Equation (11) is depicted in orange and calculated according to Equation (12) is red.

Figure 2.
(a) Raman and (b) ROA spectra of alanine enantiomeric mixtures in water solution at a molar concentration cca 1.2 M after 5.7 h of exposition time each. The legend shows the EE determined from the sample preparation. The Raman spectrum of the reference (black) was multiplied by a factor of 0.2 in order to show strong low-wavenumber Raman scattering. (c) Raman spectra after baseline correction. (d) ROA artifact spectrum calculated according to Equation (11) is depicted in orange and calculated according to Equation (12) is red.

Figure 3.
Errors of EE determination for (a) α-pinene and (b) alanine for various options in spectral range selection described in Table 6 and Table 7, respectively.

Figure 4.
Dependence of on the total exposition time of one mixture for α-pinene (a), 3.91 min per step) and for alanine (b), 17.22 min per step). Selected options point to the parameters listed in Table 6 and Table 7, respectively. The data were fitted by the function in Equation (14).

Table 3.
Enantiomeric excess analysis results of α-pinene. This table has the same structure as Table 1, only the ROA normalization factors nnorm are set to unity.
Table 3.
Enantiomeric excess analysis results of α-pinene. This table has the same structure as Table 1, only the ROA normalization factors nnorm are set to unity.
| i | ||||||||||||
|---|---|---|---|---|---|---|---|---|---|---|---|---|
| 1 | 1.000 | 100.00 | 100.00 | 0.00 | 100.00 | 0.00 | 100.00 | 0.00 | 100.00 | 0.00 | 100.42 | −0.42 |
| 2 | 1.000 | 75.49 | 74.93 | 0.57 | 75.49 | 0.56 | 74.93 | 0.57 | 75.49 | 0.57 | 75.00 | 0.49 |
| 3 | 1.000 | 52.79 | 52.46 | 0.34 | 52.79 | 0.33 | 52.46 | 0.34 | 52.79 | 0.34 | 52.56 | 0.24 |
| 4 | 1.000 | 25.28 | 25.28 | −0.01 | 25.27 | −0.02 | 25.29 | −0.02 | 25.28 | −0.02 | 25.37 | −0.10 |
| 5 | 1.000 | 0.59 | 0.65 | −0.06 | 0.57 | −0.07 | 0.66 | −0.07 | 0.59 | −0.07 | 0.67 | −0.08 |
| 6 | 1.000 | −26.39 | −26.13 | −0.26 | −26.41 | −0.28 | −26.11 | −0.28 | −26.39 | −0.28 | −26.15 | −0.25 |
| 7 | 1.000 | −53.28 | −53.00 | −0.28 | −53.29 | −0.30 | −52.97 | −0.30 | −53.28 | −0.30 | −53.08 | −0.20 |
| 8 | 1.000 | −75.41 | −75.27 | −0.14 | −75.43 | −0.16 | −75.25 | −0.16 | −75.40 | −0.16 | −75.47 | 0.06 |
| 9 | 1.000 | −100.00 | −99.95 | −0.05 | −100.02 | −0.07 | −99.92 | −0.08 | −100.00 | −0.08 | −100.31 | 0.31 |
| 0.26 | 0.26 | 0.27 | 0.27 | 0.28 | ||||||||
Table 4.
Enantiomeric excess analysis results of alanine solutions. This table has the same structure as Table 2, only the ROA normalization factors nnorm are set to unity.
Table 4.
Enantiomeric excess analysis results of alanine solutions. This table has the same structure as Table 2, only the ROA normalization factors nnorm are set to unity.
| i | ||||||||||||
|---|---|---|---|---|---|---|---|---|---|---|---|---|
| 1 | 1.000 | 100.00 | 100.00 | 0.00 | 100.00 | 0.00 | 100.00 | 0.00 | 100.00 | 0.00 | 102.09 | −2.09 |
| 2 | 1.000 | 75.23 | 72.68 | 2.55 | 74.84 | 2.16 | 73.11 | 2.12 | 75.23 | 2.12 | 73.79 | 1.44 |
| 3 | 1.000 | 50.08 | 48.38 | 1.70 | 49.29 | 0.91 | 49.13 | 0.95 | 50.08 | 0.95 | 49.81 | 0.26 |
| 4 | 1.000 | 24.37 | 22.49 | 1.87 | 23.18 | 0.68 | 23.71 | 0.65 | 24.37 | 0.65 | 24.03 | 0.34 |
| 5 | 1.000 | 0.08 | −1.87 | 1.95 | −1.49 | 0.38 | −0.20 | 0.28 | 0.08 | 0.28 | −0.23 | 0.31 |
| 6 | 1.000 | −23.93 | −25.44 | 1.51 | −25.88 | −0.44 | −23.47 | −0.45 | −23.93 | −0.46 | −23.77 | −0.16 |
| 7 | 1.000 | −50.12 | −52.18 | 2.06 | −52.48 | −0.30 | −49.79 | −0.32 | −50.12 | −0.32 | −50.58 | 0.47 |
| 8 | 1.000 | −75.21 | −76.23 | 1.02 | −77.97 | −1.74 | −73.54 | −1.67 | −75.21 | −1.67 | −74.36 | −0.85 |
| 9 | 1.000 | −100.00 | −101.49 | 1.49 | −103.15 | −1.66 | −98.45 | −1.55 | −100.00 | −1.55 | −99.71 | −0.29 |
| 1.72 | 1.16 | 1.13 | 1.13 | 0.93 | ||||||||
Table 5.
Enantiomeric excess analysis results of α-pinene in the spectral range 100–2000 cm−1 for different Savitzky–Golay smoothing parameters.
Table 5.
Enantiomeric excess analysis results of α-pinene in the spectral range 100–2000 cm−1 for different Savitzky–Golay smoothing parameters.
| Order | Window Size | Order | Window Size | ||||
|---|---|---|---|---|---|---|---|
| 0 | 1 | 0.18 | 100.00 | 2 | 9 | 0.18 | 100.00 |
| 0 | 3 | 0.18 | 100.00 | 2 | 11 | 0.16 | 100.00 |
| 0 | 5 | 0.18 | 100.00 | 2 | 13 | 0.25 | 100.00 |
| 0 | 7 | 0.19 | 100.00 | 2 | 15 | 0.36 | 100.00 |
| 0 | 11 | 0.20 | 100.00 | 3 | 5 | 0.18 | 100.00 |
| 0 | 15 | 0.22 | 100.00 | 3 | 9 | 0.18 | 100.00 |
| 1 | 3 | 0.18 | 100.00 | 3 | 11 | 0.16 | 100.00 |
| 1 | 5 | 0.18 | 100.00 | 3 | 13 | 0.25 | 100.00 |
| 2 | 5 | 0.18 | 100.00 | 3 | 15 | 0.36 | 100.00 |
Table 6.
Table for Figure 3a. Enantiomeric excess analysis results of α-pinene for different spectral ranges in each step of the EE determination.
Table 6.
Table for Figure 3a. Enantiomeric excess analysis results of α-pinene for different spectral ranges in each step of the EE determination.
| Option | Baseline Correction | Raman Normalization | Artifact Correction | EE Determination | ||||||
|---|---|---|---|---|---|---|---|---|---|---|
| 1 | 100 | 1500 | 100 | 1500 | 50 | 1700 | 100 | 1500 | 0.19 | 100.00 |
| 2 | 100 | 1500 | 1000 | 1500 | 50 | 1700 | 100 | 1500 | 0.15 | 100.00 |
| 3 | 100 | 1500 | 1300 | 1500 | 50 | 1700 | 100 | 1500 | 0.13 | 100.00 |
| 4 | 100 | 2000 | 100 | 1500 | 50 | 2000 | 100 | 1500 | 0.19 | 100.00 |
| 5 | 100 | 1700 | 1500 | 1800 | 50 | 2000 | 100 | 1500 | 0.08 | 100.00 |
| 6 | 100 | 2000 | 1500 | 1800 | 50 | 2000 | 100 | 1500 | 0.10 | 100.00 |
| 7 | 100 | 2000 | 1500 | 1800 | 50 | 2000 | 50 | 300 | 0.20 | 100.00 |
| 8 | 100 | 2000 | 1500 | 1800 | 50 | 2000 | 700 | 940 | 0.05 | 100.00 |
| 9 | 100 | 2000 | 1500 | 1800 | 50 | 2000 | 700 | 1500 | 0.06 | 100.00 |
Table 7.
Table for Figure 3b. Enantiomeric excess analysis results of alanine for different spectral ranges in each step of the EE determination.
Table 7.
Table for Figure 3b. Enantiomeric excess analysis results of alanine for different spectral ranges in each step of the EE determination.
| Option | Baseline Correction | Raman Normalization | Artifact Correction | EE Determination | ||||||
|---|---|---|---|---|---|---|---|---|---|---|
| 1 | 50 | 2000 | 100 | 1500 | 50 | 2000 | 50 | 1500 | 0.47 | 100.00 |
| 2 | 50 | 2000 | 100 | 1500 | 50 | 2000 | 100 | 1500 | 0.24 | 100.00 |
| 3 | 50 | 2000 | 100 | 1500 | 50 | 2000 | 100 | 750 | 1.80 | 100.00 |
| 4 | 50 | 2000 | 100 | 1500 | 50 | 2000 | 750 | 1500 | 0.34 | 100.00 |
| 5 | 50 | 2000 | 100 | 1500 | 50 | 2000 | 900 | 1500 | 0.22 | 100.00 |
| 6 | 50 | 2000 | 100 | 1500 | 50 | 2000 | 820 | 890 | 1.04 | 100.00 |
| 7 | 50 | 2000 | 100 | 1500 | 50 | 2000 | 750 | 1050 | 0.53 | 100.00 |
| 8 | 50 | 2000 | 100 | 1500 | 50 | 2000 | 1280 | 1490 | 0.46 | 100.00 |
| 9 | 50 | 2000 | 100 | 1500 | 50 | 2000 | 50 | 105 | 0.66 | 100.00 |
Publisher’s Note: MDPI stays neutral with regard to jurisdictional claims in published maps and institutional affiliations. |
© 2022 by the authors. Licensee MDPI, Basel, Switzerland. This article is an open access article distributed under the terms and conditions of the Creative Commons Attribution (CC BY) license (https://creativecommons.org/licenses/by/4.0/).
Share and Cite
MDPI and ACS Style
Michal, P.; Hudecová, J.; Čelechovský, R.; Vůjtek, M.; Dudka, M.; Kapitán, J. Accurate Determination of Enantiomeric Excess Using Raman Optical Activity. Symmetry 2022, 14, 990. https://doi.org/10.3390/sym14050990
AMA Style
Michal P, Hudecová J, Čelechovský R, Vůjtek M, Dudka M, Kapitán J. Accurate Determination of Enantiomeric Excess Using Raman Optical Activity. Symmetry. 2022; 14(5):990. https://doi.org/10.3390/sym14050990
Chicago/Turabian StyleMichal, Pavel, Jana Hudecová, Radek Čelechovský, Milan Vůjtek, Michal Dudka, and Josef Kapitán. 2022. "Accurate Determination of Enantiomeric Excess Using Raman Optical Activity" Symmetry 14, no. 5: 990. https://doi.org/10.3390/sym14050990
Note that from the first issue of 2016, this journal uses article numbers instead of page numbers. See further details here.