
An Evolutionary Numerical Method of Supply Chain Trust Networks with the Degree of Distribution


1
School of Economics and Management, Guangxi Normal University, Guilin 541004, China
2
School of Business, Suzhou University of Science and Technology, Suzhou 215009, China
3
Carlson School of Management, University of Minnesota, Minneapolis, MN 55455, USA
*
Authors to whom correspondence should be addressed.
Symmetry 2022, 14(3), 587; https://doi.org/10.3390/sym14030587
Submission received: 21 February 2022
/
Revised: 5 March 2022
/
Accepted: 11 March 2022
/
Published: 16 March 2022
(This article belongs to the Special Issue Meta-Heuristics for Manufacturing Systems Optimization)
Abstract
:We study the structure of supply chain trust networks (SCTNs) by analyzing the evolution of the networks. An SCTN here comprises enterprises in a fully competitive market connected through the preferential attachment mechanism. A Markov chain analysis is used to understand how various factors affect the structure of the SCTNs. The evolution of the SCTNs is also analyzed to identify the asymmetric conditions required for the degree distribution of the SCTNs to obey the power law distribution. The simulation results show that, when the degree of willingness to initiate a trust relationship and the attractiveness index of the supply chain networks meet certain criteria, the underlying network is of a scale-free nature.
1. Introduction
The supply chain is a kind of channel strategy based on mutually interdependent and cooperative enterprises. Enterprises need to break organizational boundaries and establish trust relationships with other members in order to maximize the value of the supply chain. The formation of trust relationships among enterprises in a supply chain is a process of interactions among enterprises. A crisis of trust can negatively influence the operation of the supply chain, consumers’ rights, and market trading rules [1]. Pezeshki et al. [2] and Chica et al. [3] suggested that trust could also be an effective tool for promoting sharing in an era of rapid development of the sharing economy. In addition, Johnston et al. [4] and Dyer et al. [5] studied that trust was a powerful prerequisite for effective cooperation and an important indicator of positive performance results and competitive advantages in the relationship between supply chain organizations. The asymmetric construction of a trust relationship in a supply chain is, therefore, a problem worthy of being studied.
Here, a supply chain can be regarded as a complex adaptive system. Hearnshaw and Wilson [6] investigated a combined supply chain complex network model and, through empirical verification, pointed out that efficient supply chain structures present scale-free characteristics. Empirical research from the perspective of complex networks also showed that supply chain network embedding has a significant impact on supply chain performance, that the node degree is the core dimension of supply chain network structure embedding, and that trust is the core dimension of the embedded relationship. Based on the complex network theory, Ma et al. [7] constructed an improved LSSC structural model to measure the vulnerability of a supply chain. Capaldo and Giannoccaro [8] analyzed 10 representative supply chain network structure models by using the NK model and demonstrated that the higher the dependence of a supply chain, the lower the trust. Their results also showed that the interdependence structure of the supply chain plays a moderating role in the relationship between trust and performance of the supply chain. Similarly, trust-based selection rules have been shown to be the preferred method for supplier selection and that such rules can also moderately reduce the impact of supply chain disruption [9]. Based on an artificial neural network, Tsai and Hung [10] showed that trust has a great impact on the supply chain performance.
Trust is seen as a behavioral strategy of virtual supply chain enterprises. The establishment and cultivation of trust between organizations is one of the key factors to realize effective supply chain management [11,12]. Helbing et al. [13] proposed for the first time that the bullwhip effect in supply chain management is related to the topology of the supply chain network itself. The bullwhip effect of the supply chain was reduced by the control algorithm based on the robustness of the complex dynamic network [14]. Hou et al. [15] built a dynamic supply chain network, where firms can select suppliers according to the trust, the selling price, or just randomly. The simulation results showed that the trust-based rule is the most robust one against random and targeted disruptions. Evolutionary game theory has previously been used to study the dynamic evolution of trust in general [3,16,17,18,19] and cross-organizational alliances in particular [6,20,21]. The coevolution of the network structure and emergence of cooperation was studied in four classes of social dilemmas, representing the prisoner’s dilemma, Hawk-Dove, snowdrift, and coordination classes of games [22]. Huang and Wilkinson [6] introduced the dynamic evolution model of trust in business relationships and pointed out that the change in trust depends on the experience, interaction, key events, and results of actions. Fang et al. [23] proposed a new evolution model of a supply chain with manufacturers as the core based on the external market demand and internal competition–cooperation to understand the development law of the supply chain. Shi and Ma [20] constructed an evolutionary game model of the influencing factors of trust input in a dual-channel supply chain and found that trust evaluation affects the enthusiasm of trust input by the members of the dual-channel supply chain and that the supply chain can reach evolutionary stable equilibrium only when the trust input and output are ideal. Zhu et al. [24] proposed a network node trust evolution model based on some fuzzy correlation measures and simulated the dynamic distribution of trust among different nodes in the network; their simulation results showed that the equilibrium of adjacent nodes is the opposite of the neighboring nodes. Meanwhile, the Analytic Network Process (ANP) is the most comprehensive framework. The ANP allows interdependence and feedback among various standards. Such feedback best captures the complex effects of interplay in human society, especially when risk and uncertainty are involved [25,26]. The stronger the node, the closer the relationship between the node and other nodes in the network and the higher the importance of the node in the network [27].
To date, the research about supply chain trust has failed to reflect the interactions and ignore the influence of the supply chain network structure on its trust. Therefore, this paper uses the complex network theory to establish the evolution model of supply chain trust networks (SCTNs) and analyzes the evolutionary rules of the supply chain trust network and the strategies to manage a supply chain trust crisis. We regard the supply chain network as a complex and open system and consider the development process of supply chain enterprises in a competitive market. According to the construction of a network priority connection mechanism and a measure method of the supply chain trust degree, the evolutionary mechanism of the supply chain networks is designed based on the complex network theory. We use the Markov chain method to analyze the influence of the supply chain trust on the supply chain network structure and propose a management strategy for promoting supply chain trust. Specifically, we try to answer the following problems:
(1) What are the structural characteristics of the supply chain trust network? Based on the complex network theory, how do we identify the structural characteristics of the supply chain trust network?
(2) What is the degree distribution of the trust network in a supply chain? How do we determine the characteristics of the supply chain trust network according to the degree distribution?
(3) According to the evolutionary rules of the supply chain trust network, how do we make a reasonable supply chain trust governance strategy to control the evolution process and outcome of the supply chain trust network?
Our contributions are as follows:
(1) The structural characteristics of the supply chain trust network are identified. Additionally, according to the priority connection mechanism, with the measurement method of the supply chain trust degree, the evolution mechanism of the supply chain trust network is established.
(2) The conditions of the degree distribution and power law distribution of the supply chain trust network are studied. Through the test conditions, it is determined that a supply chain trust network can evolve into a scale-free network.
(3) With the evolutionary rules of the supply chain trust network, the evolution process and results of the supply chain trust network are controlled, and the strategies for managing the supply chain trust crisis are put forward.
Evolutionary game is a broad range of research, and it has successfully been applied to several production industries, such as manufacturing, logistics, and so on. Given the above, we use evolutionary game theory and complex network theory to study the evolution of SCTNs in this paper. We regard the supply chain network as a complex and open system and consider the development process of supply chain enterprises in a competitive market. The asymmetric evolutionary mechanism of the supply chain networks, in our study, is designed based on complex network theory combined with a method for calculating the supply chain trust degree. We use the Markov chain method to analyze the influence of supply chain trust on the supply chain network structure and propose a management strategy for promoting supply chain trust. We describe the problem being studied in detail in the following section. Following this, we discuss the SCTN evolution model in Section 3, present and analyze the simulation results in Section 4, and draw conclusions in Section 5.
2. Problem Description
The SCTN is denoted as , the collection of SCTN nodes is , and the collection of SCTN edges is . Any side x in E corresponds to a pair of nodes in V, such that . The formation of SCTNs is accompanied by the information transformation among the nodes, which covers the whole dynamic logic process of information collection, creation, aggregation, diffusion, transfer, learning, and absorption among the node organizations. Through the flow of information, the connections between nodes grow from nothing, from sparse to dense, and gradually grow into a trust network.
- Node selection
The nodes of the SCTN correspond to different members of the supply chain network, i.e., raw material suppliers, manufactures, distributors, retailers, and service providers. Although the supply chain members have different types and roles, they are all considered as nodes and are not differentiated in the SCTN. Consumers, however, are not regarded as nodes of the network owing to their large numbers.
- 2.
- Edge connection and direction
The edges of the SCTN represent an interaction relationship between members (or nodes) of the network, which is a trust relationship based on cooperation. When there is cooperation between two nodes, a new link connecting the nodes is generated and indicates mutual trust between them. The lack of a connection between two nodes indicates that they do not trust each other. Although the trust relationship built by a pair of nodes may be inconsistent with the degree of trust on each other, the asymmetry of this trust relationship only affects the closeness of the trust relationship and not the trust relationship itself. Therefore, the SCTN can be regarded as an undirected network.
- 3.
- Edge weights
The weight of each edge in the SCTN represents the degree of trust between the connected nodes. In two nodes with a cooperative relationship, the trust degree has a direction, and the trust degree between the nodes may be different in each direction. However, only mutual trust can form a cooperative relationship between the two nodes. An edge represents mutual trust between two nodes, which reflects the strength of the trust relationship. The strength of the trust relationship is, in turn, determined by the respective trust degree of the two nodes. Therefore, the weight of an edge in the SCTN is a function of the respective trust degrees of the two nodes.
3. SCTN Evolution Model
3.1. Evolution Mechanism of SCTN
Assuming that all the enterprises in the supply chain network are in a perfectly competitive market, the SCTN can be regarded as a dynamic open system. Enterprises (nodes) can freely enter or leave the network and choose other enterprises (nodes) for cooperation. When an enterprise discovers the network to be profitable, it can become a member of the network and build cooperative relationships with other nodes in the network. Conversely, upon finding the network to be unprofitable, an enterprise can dissolve the cooperative relationships with its partner nodes and exit the network. Nodes in the network can independently choose their partners for establishing cooperative relationships or terminate existing relationships based on their own criteria of choosing cooperative partners. Various prior studies have shown that, under similar evolution mechanisms, supply chain networks have scale-free characteristics [25,28,29]. Similarly, other studies have also shown that the degree of distribution of supply chain networks, under similar evolution models, is power law distribution.
In the internal network, there are nodes connected with each other, edges, and the weight of each edge . Based on the literature presented above regarding the development of network evolution rules and the dynamic evolution process of the supply chain, we formulated the following evolutionary rules for the SCTN:
- Adding new nodes
A new node with edges is added to the network with probability , and the new node will be connected to internal nodes of the network. New nodes connect with old nodes with a preferential attachment probability of , where is the limit of node , and is the total limit of the nodes in the SCTN. This process is repeated times for each node.
- Adding new edges
We add edges for each node i with probability . First, a node is chosen as one endpoint of the edge with probability . Then, another node is randomly selected from among the non-adjacent nodes of node to be the other endpoint of the new edge. This process is repeated times.
- Deleting an edge
We delete old edges with probability . First, we choose one node which has edge as one side of the deleted edge. Then we randomly choose another node as the other side of the deleted edge in the non-adjacent nodes of nodes , and repeat the process times.
After steps, the number of nodes in the SCTN is , the number of edges is , and the total degree is , where is the willingness of a new node to build a trust relationship with an existing node , is the willingness of an existing node in the network to establish a trust relationship with another existing node , is the willingness to dissolve trust relationship between nodes and . Higher the willingness to construct a trust relationship, greater the possibility of constructing a trust relationship; and higher the willingness to dissolve a trust relationship, greater the possibility of dissolving the trust relationship. The willingness in both cases is measured by the trust between both parties. Trust degree is a measure of one node’s trust on the other; however, building a trust relationship requires mutual agreement. When one party has a high degree of trust and the other party has a low degree of trust, the possibility of constructing a trust relationship is low. Hence, the degree of willingness to construct a trust relationship is a function of the trustworthiness of the two nodes on each other. We represent the trust of node on node as , where represents the step of adding a new node in any evolution time step, is the step of adding a new edge, and is the step of deleting the old edge. This is further simplified as .
Additionally, represents the attractiveness index of the SCTN to new nodes, represents the attractiveness index of the SCTN to existing nodes, and represents the attractive index of the SCTN for dissolving the trust relationship between existing nodes.
3.2. SCTN Degree Distribution Analysis
The degree distribution of the SCTN refers to the probability distribution of the degrees of the nodes in the network. The probability distribution function is the fraction of nodes in the network with degree . It can be used to depict the impact of the trust relationship of the supply chain on the trust networks. The methods for solving the complex network degree distribution include the Markov chain method [21], the Mean Field Theory [30], the rate equation method [31], and the Martingale method [32], among others. In this paper, the Markov chain method will be used for calculating the degree distribution of the SCTN.
A new node with connected edges is added to the initial network with probability . Then, the probability that an internal node of the network is connected to the new node is:
The edges are then added to the network with probability . The probability that an internal node of the network is connected to node is:
The former term in the right-hand bracket of the first equal sign of Equation (2) indicates that node is selected as one endpoint of the new edge with the preferred probability, and the latter indicates that node is selected as one endpoint of the new edge with the preferred probability. Vi represents the set of all neighbor nodes that are connected to node . In fact, the probabilities of the above two options are equal.
existing edges are removed from the network with probability . The probability that an existing edge between internal nodes and of the network is removed is:
The former term in the right-hand bracket of the first equal sign of Equation (3) indicates that node i is selected as the endpoint of the existing edge to be deleted with preferential probability. The latter term indicates that node is selected as the endpoint of the deleted old edge with preferential probability. Node i is selected randomly as the endpoint of the existing edge to be deleted. The probabilities of the two selection methods are equal.
According to Equations (1)–(3), the probability that node in SCTN adds a new connected edge at time t is calculated as:
Similarly, the probability that node in the SCTN removes a connected edge at time t is:
Then, the probability that node neither adds a new edge nor removes an existing one at time is:
It can be seen that the degree of the SCTN node is a Markov chain, which is denoted as . The possible values of are the state space of For any non-negative integer t, any , when , the single-step state transition matrix of is derived from the evolution mechanism of the SCTN as follows:
For any , let exist, , and ; then, has a steady-state distribution.
Due to , make , and make , . According to the existence condition of the steady distribution of the Markov chain of the evolutionary network and the condition that the degree distribution of the network obeys the power law distribution, we can derive that the degree distribution of the supply chain trust evolution network obeys the power law distribution and its expression.
When , i.e., , the degree distribution of the supply chain trust evolution network obeys the power law distribution, and the power law index is . In this case, is a scale-free network. When is large, the degree distribution is as follows, where is a constant.
When , i.e., , the degree distribution of the supply chain trust evolution network does not obey the power law distribution; thus, is not a power law decay. In this case, is not a scale-free network. When is large, the degree distribution is:
When , the degree distribution of the of the supply chain trust evolution network obeys the power law distribution, and the power law index is . The power law index is related to the willingness to construct trust relationship and the attractiveness index of the supply chain network. Therefore, the structure of the SCTN will be affected by its willingness to build trust relationships as well as the attractiveness index of supply chain network.
3.3. Evolution Analysis of SCTN
The process of supply chain node enterprises choosing to either establish or dissolve trust relationships represents the interactions between supply chain nodes and enterprises, and the interactions between supply chain node enterprises and supply chain network environments represent the process of evolution of the SCTN.
According to the evolution mechanism of the SCTN, under certain conditions, it can evolve into a scale-free network. In order to further understand its evolution into a scale-free network, the evolution process needs to be analyzed. The SCTN expands rapidly in the early stages of evolution. In the initial stages of its establishment, it continues to profit, and enterprises outside the network become attracted to it. Therefore, in the initial stage of evolution, nodes of the SCTN are very attractive to external enterprises, and the overall attractiveness of the SCTN is also high. The SCTN continues to expand in the middle of the evolutionary process. After the rapid expansion of the network’s scale in the early stages of evolution, the number of enterprises in the network will increase, and the profitability of the supply chain network will decline. As cooperation is accompanied by competition, the degree of competition between enterprises increases, and the enterprises within the network constantly seek new partners and ways to cooperate and constantly build new trust relationships (either horizontally or vertically). Therefore, in the middle of the evolution process, enterprises in the SCTN are less attractive to enterprises outside the network, and the overall attractiveness of the SCTN also decreases. However, at this time, the attraction between the internal nodes of the network and the attraction of the network reconnection both keep increasing.
Finally, the SCTN decreases gradually in the latter stages of evolution. It is more mature, but its profitability will not have increased further. The attraction between nodes without a trust relationship within the network decreases, along with the possibility of network reconnection. At the same time, the repulsive force between the nodes with a trust relationship within the network will gradually increase the attraction in dissolving the trust relationships.
The attraction of a node is reflected in its willingness to build trust relationships, and the attraction of the network can be reflected in the number of nodes in the network. It can be seen that various attractive forces affect the evolution process and network structure of the SCTN. Additionally, network evolution is also selective, except for the increase in the number of networks and the edge of the network. It is more likely that highly connected nodes will be selected as one end with continuous edges, and this property runs through the evolution process. It is precisely because of the growth and preference of network evolution that the SCTN can evolve into a scale-free network.
4. Simulation and Results
Although the willingness of nodes in the SCTN to build trust relationships and the attractiveness index of the SCTN have different values during different stages of the network’s evolution, the parameters are simplified without compromising the evolution outcome. This helps to simplify the simulation. Since the combination of various parameters of the SCTN will affect its structure, a representative assignment combination will be selected to describe the degree distribution of the SCTN. The evolution process of the SCTN will then be analyzed. Assuming that the values of nodes and are the same, then . The parameter settings for four different test cases are listed in Table 1. The evolution process of the SCTN with 100 nodes was simulated for these parameter values. In order to obtain the steady-state distribution of the network, Cases 1–3 were repeated 100 times.
The values of the parameters for Case 1 are , which satisfies the condition that the network degree distribution obeys the power law distribution , i.e., . The theoretical analysis shows that the degree of distribution of the SCTN should be subject to power law distribution.
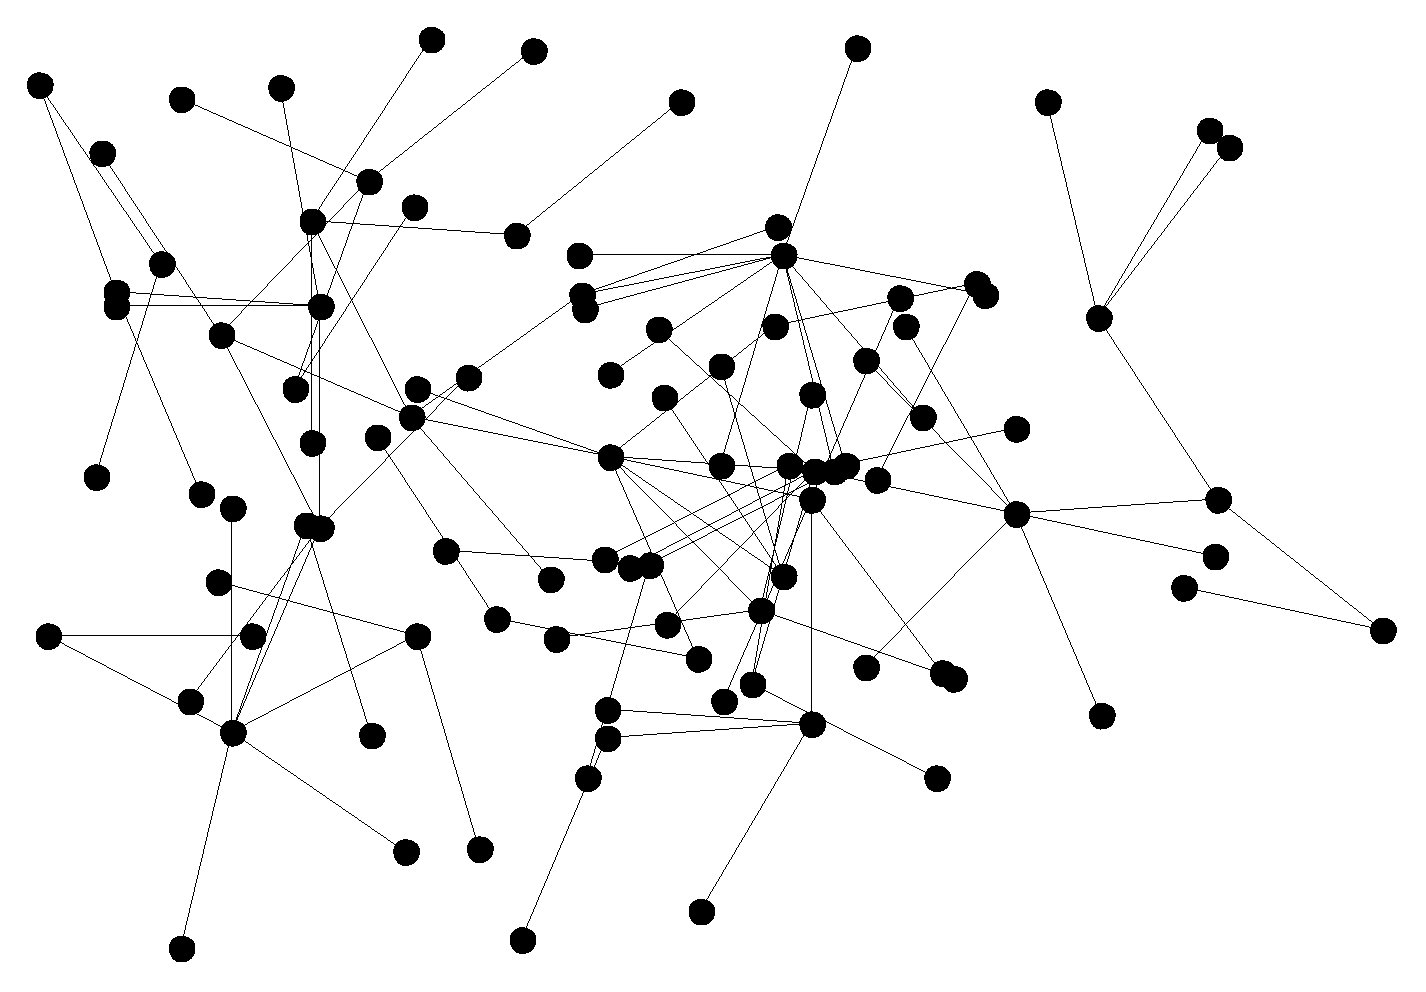
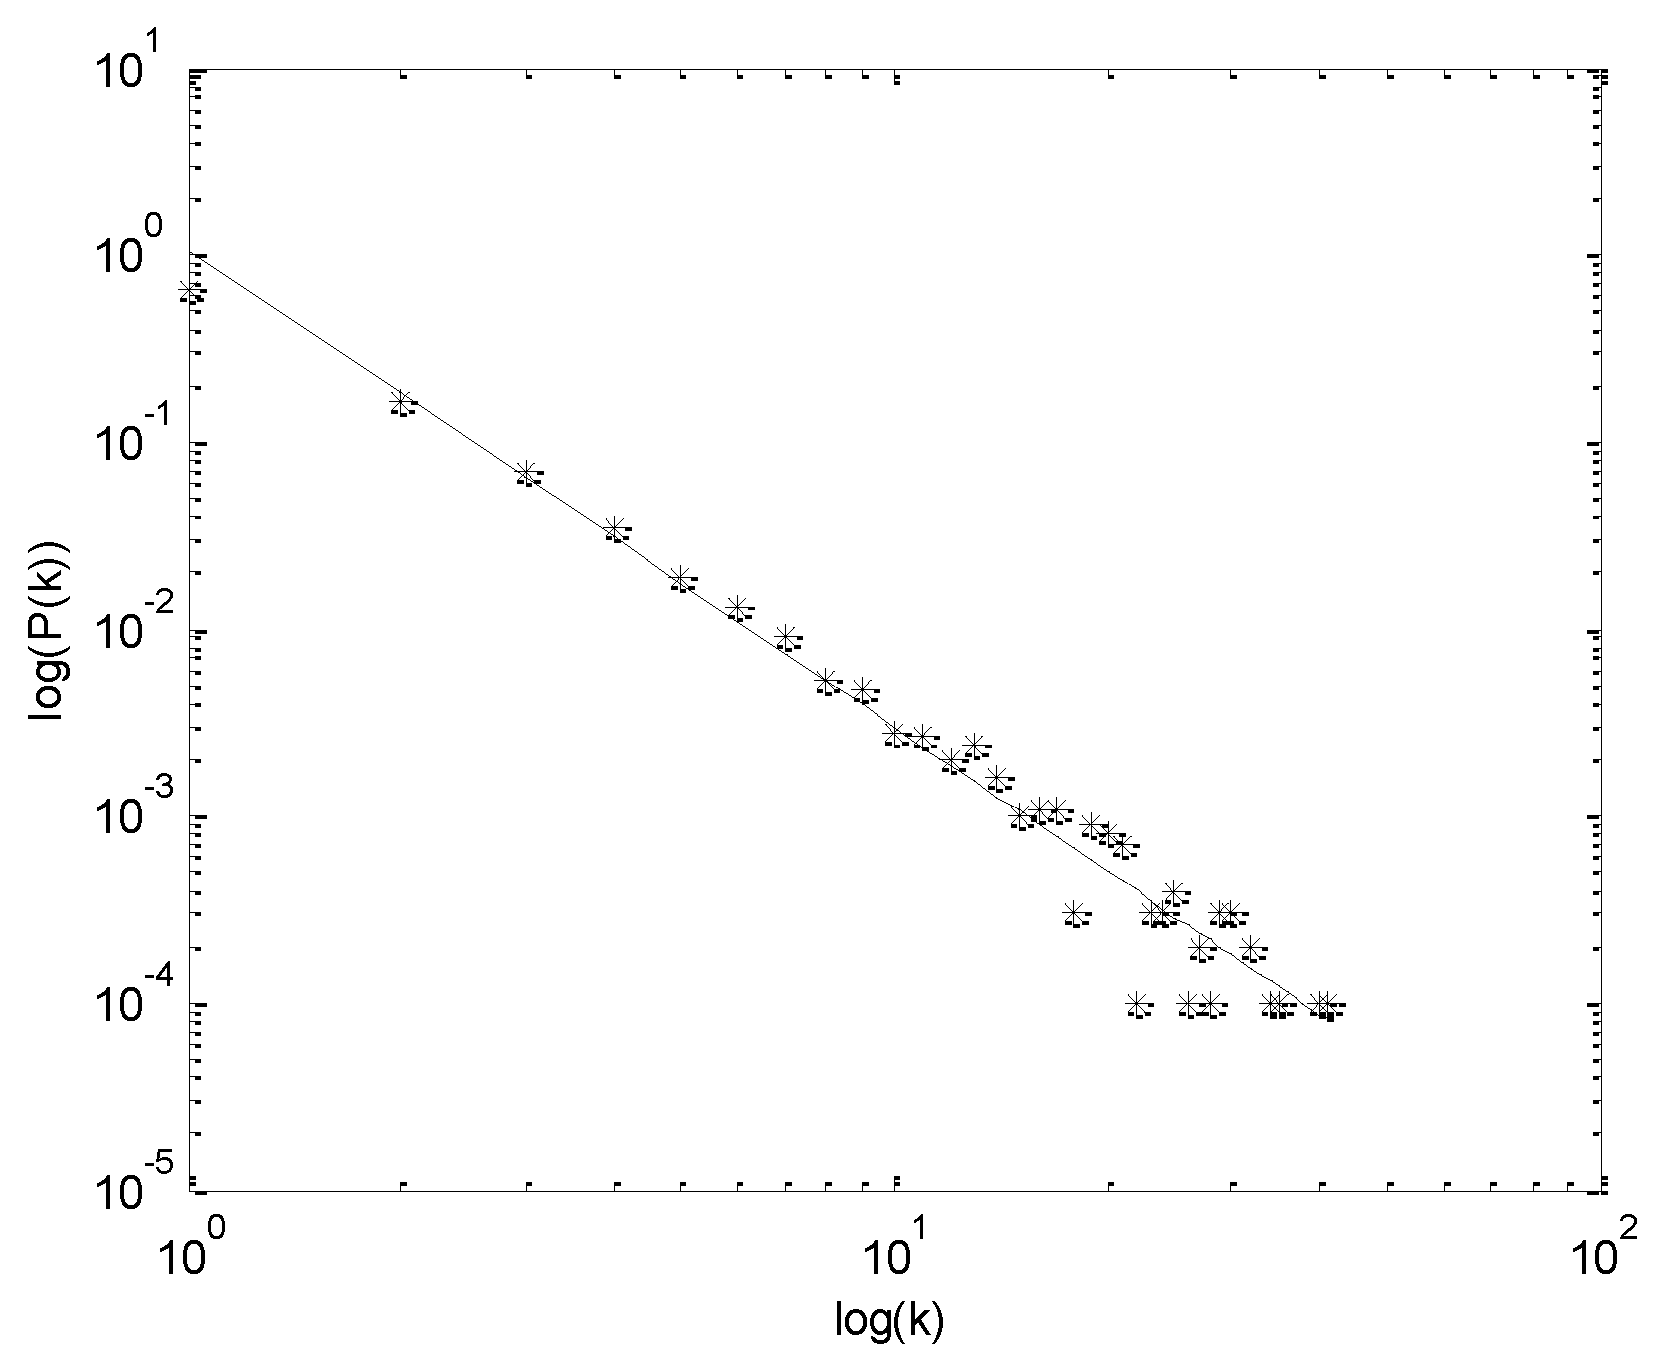
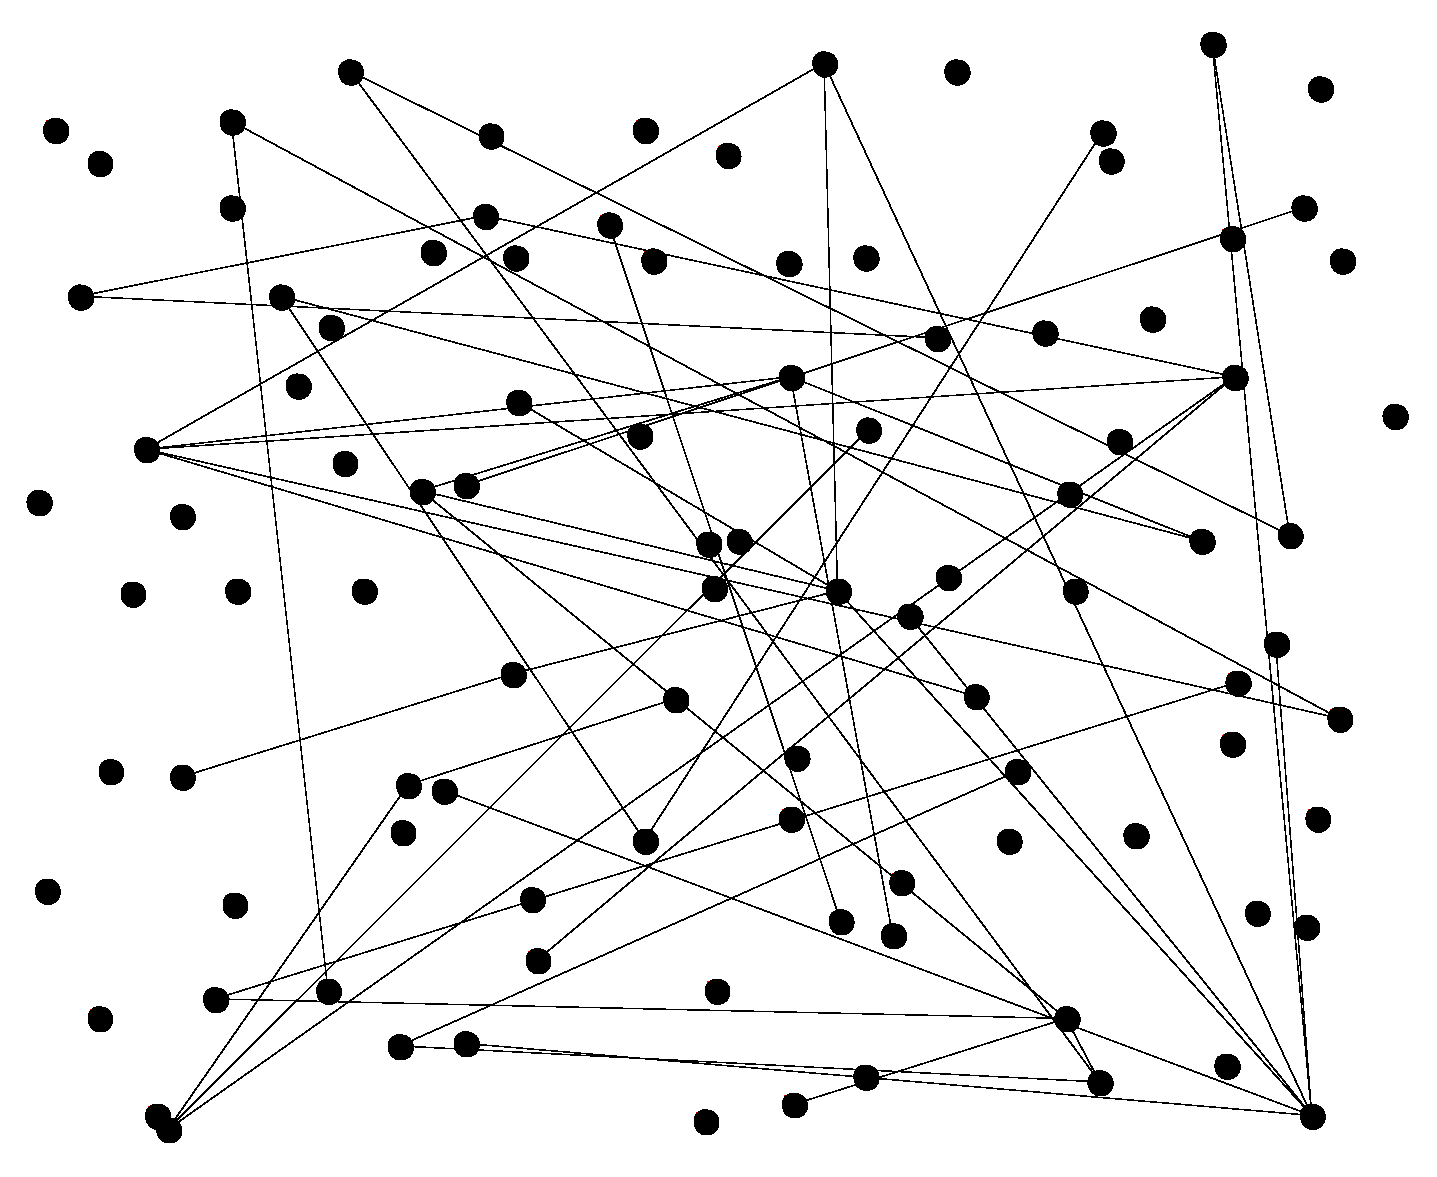
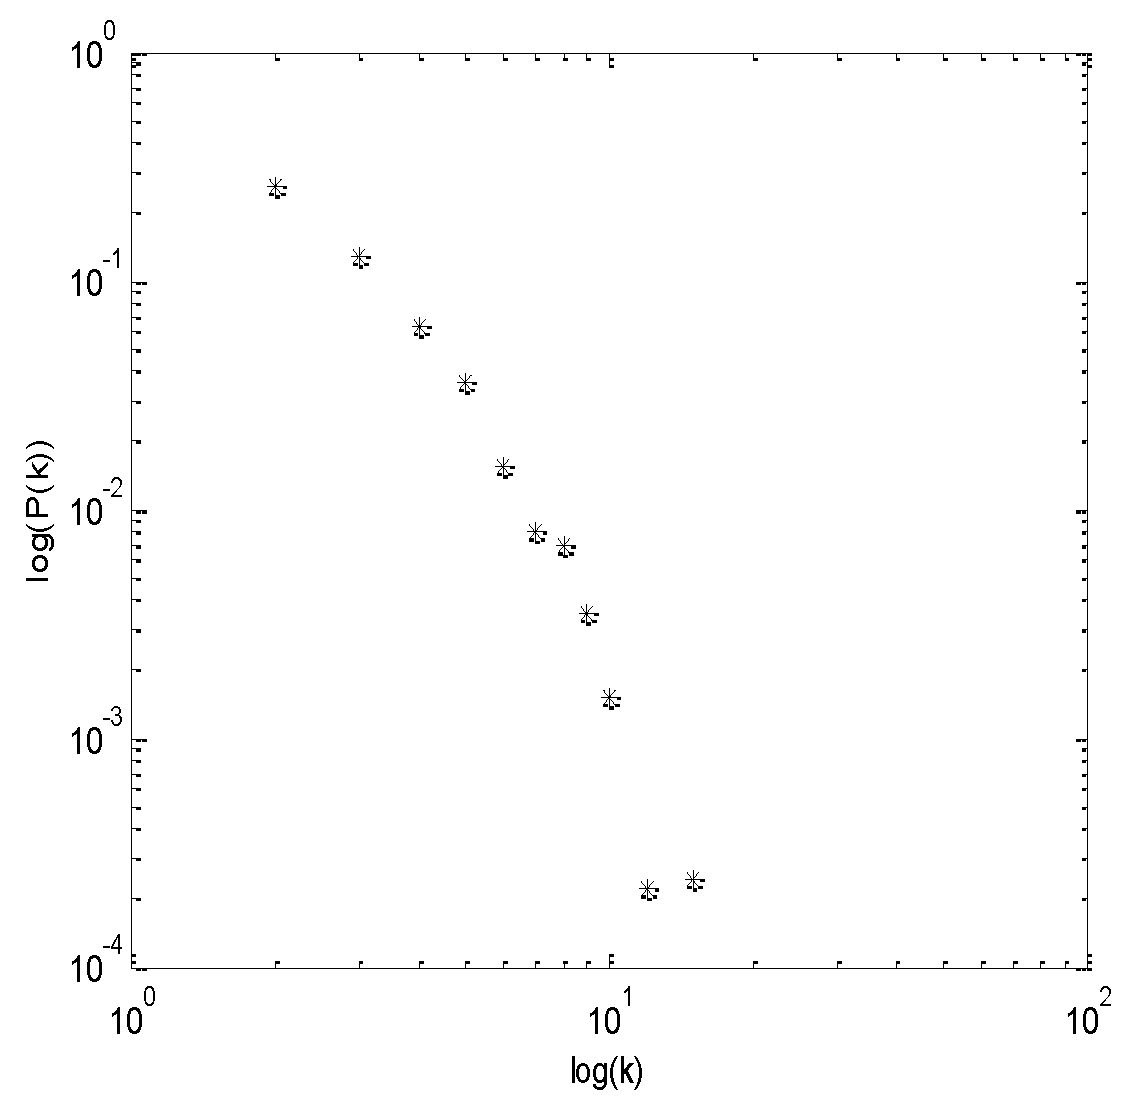
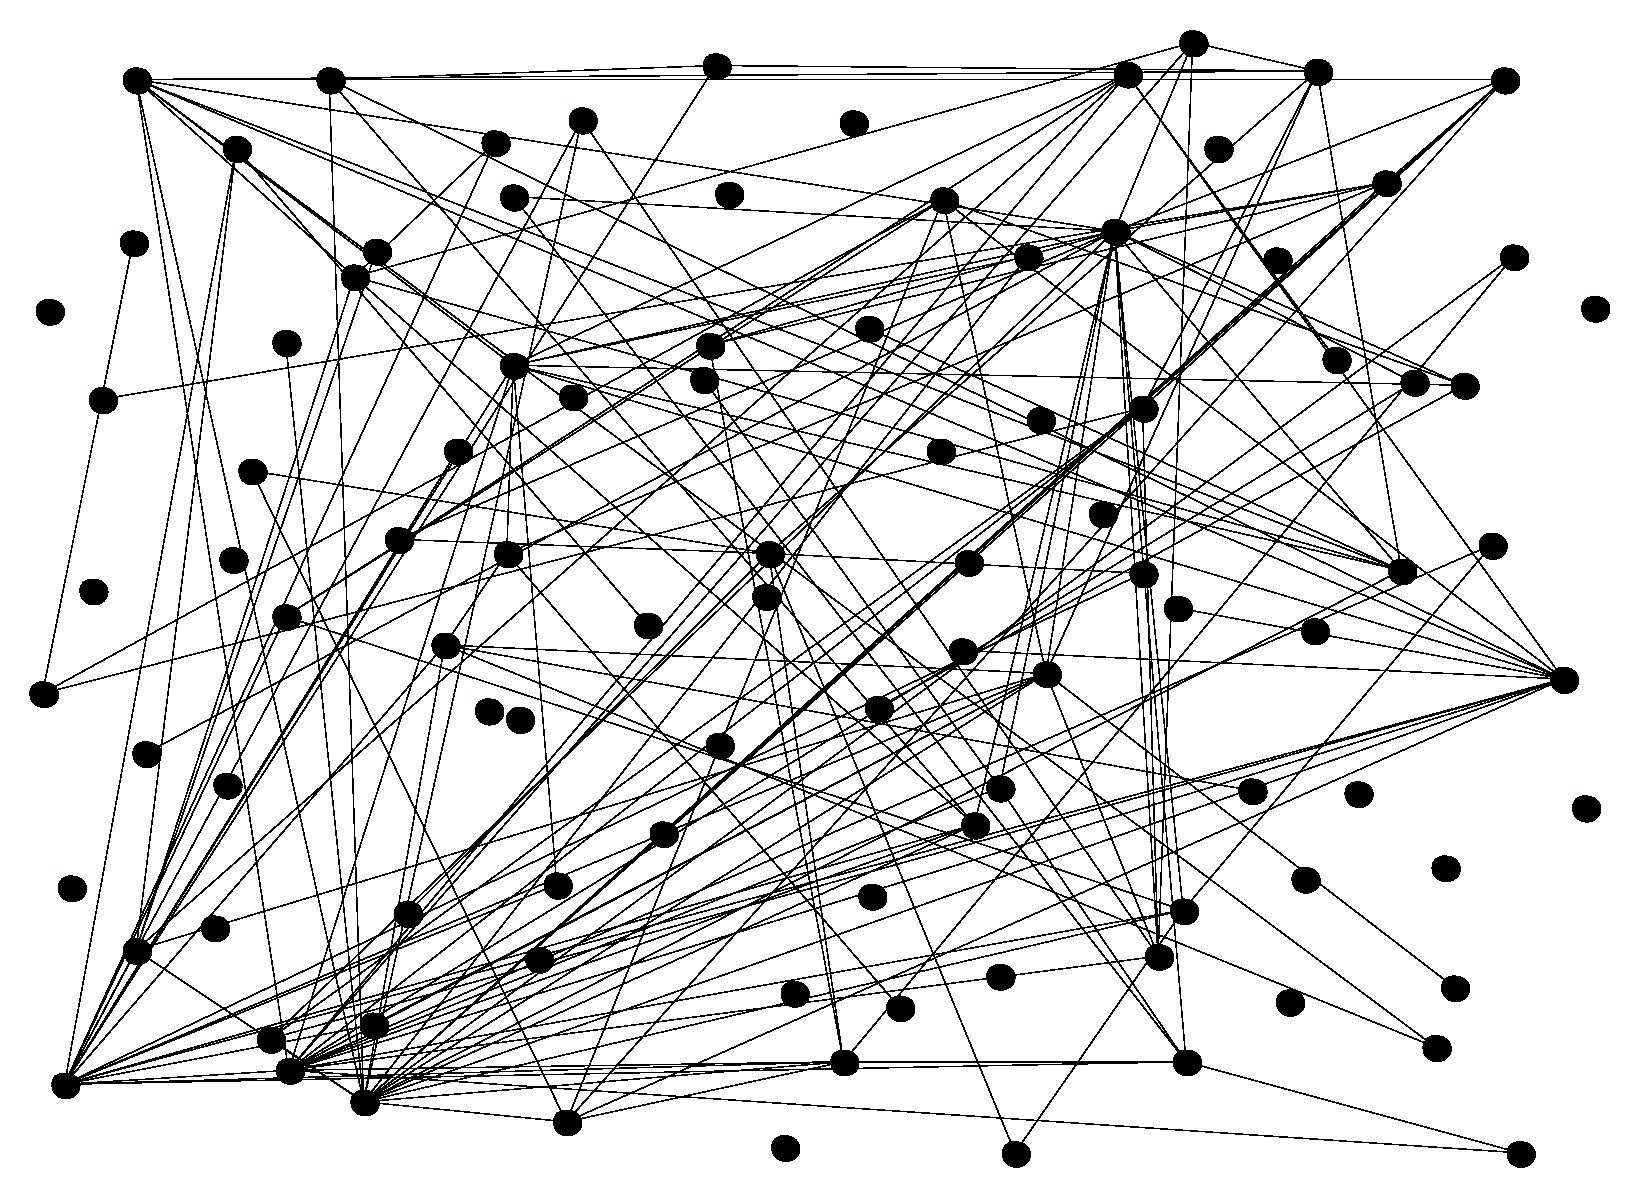
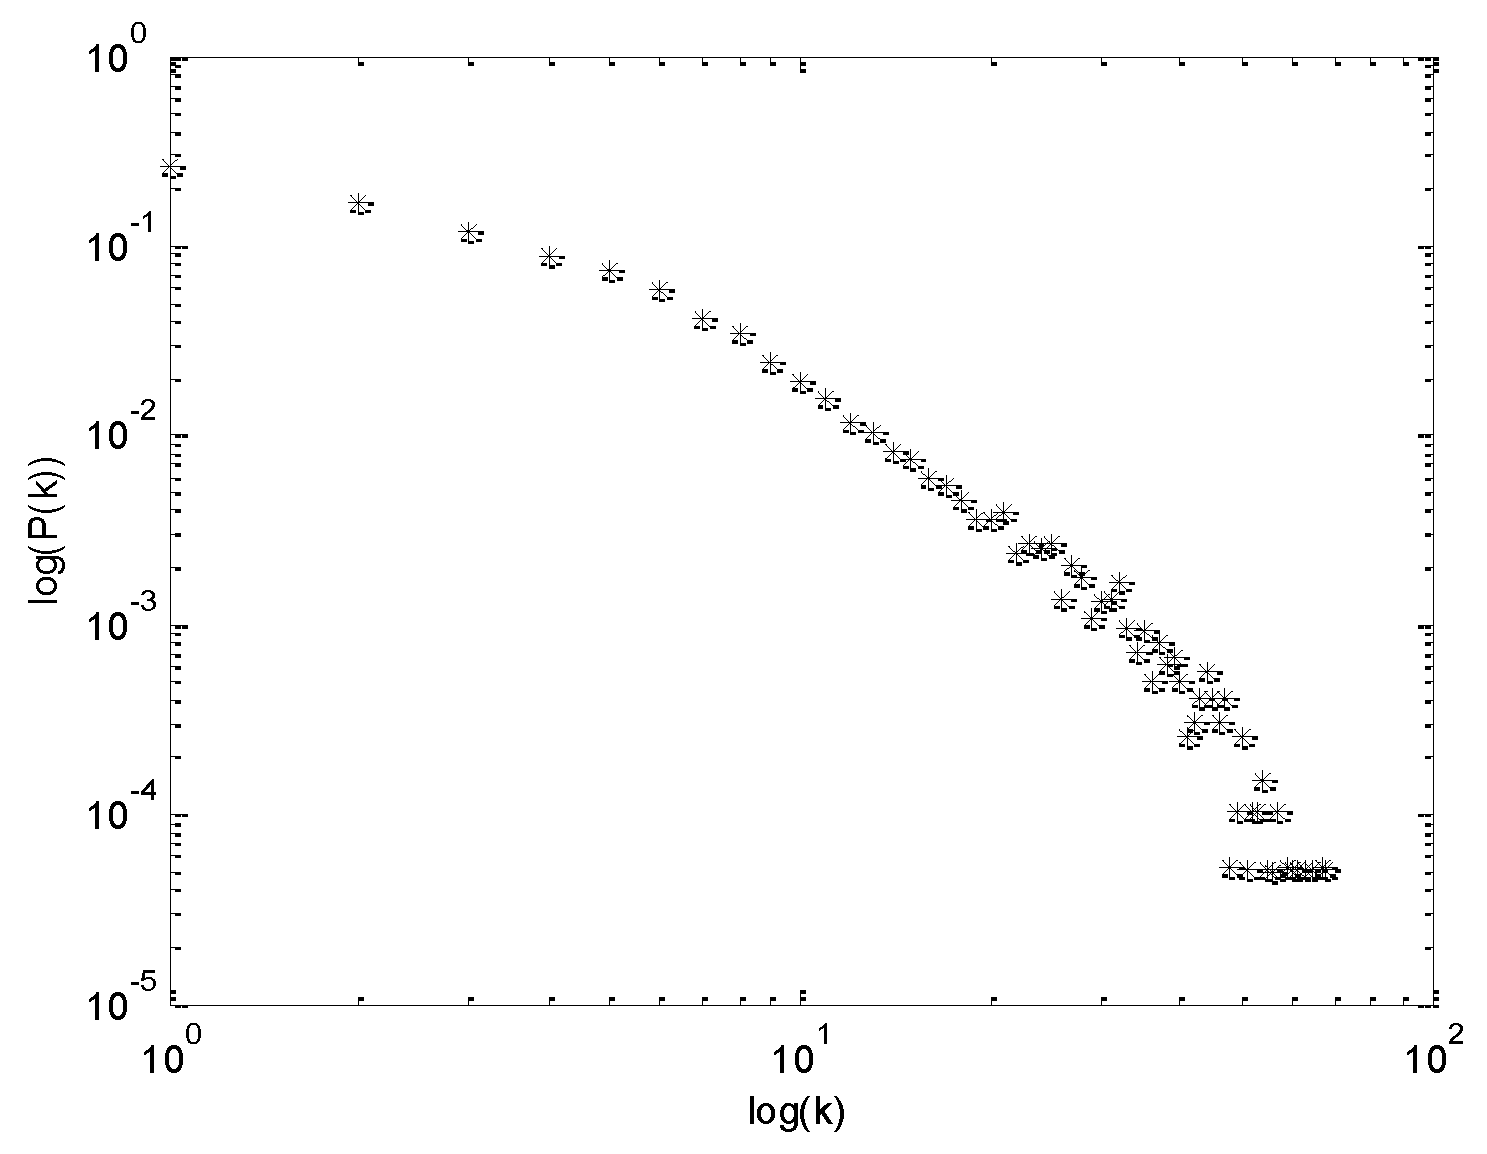
Figure 1 shows the structural diagram of the SCTN obtained by simulation based on Case 1, which reflects the scale-free characteristics of the SCTN. Figure 2 further demonstrates the scale-free nature of the SCTN. The scatter points in the graph indicate the probability of the degree of the network node being k. These scatter points form an approximately straight line. Since the power law distribution is displayed as a slanted straight line in the logarithmic coordinate system, we can conclude that the degree of SCTN obeys the power law distribution and that the SCTN exhibits scale-free characteristics. The straight line that fits the scatter points in Figure 2 is expressed as , which is the degree of distribution expression. It can be seen that the power law index for Case 1 is 2.6, which is close to the power law index obtained by the power law index formula, i.e., 3. This proves the validity of the evolution model of the trust network in the supply chain.
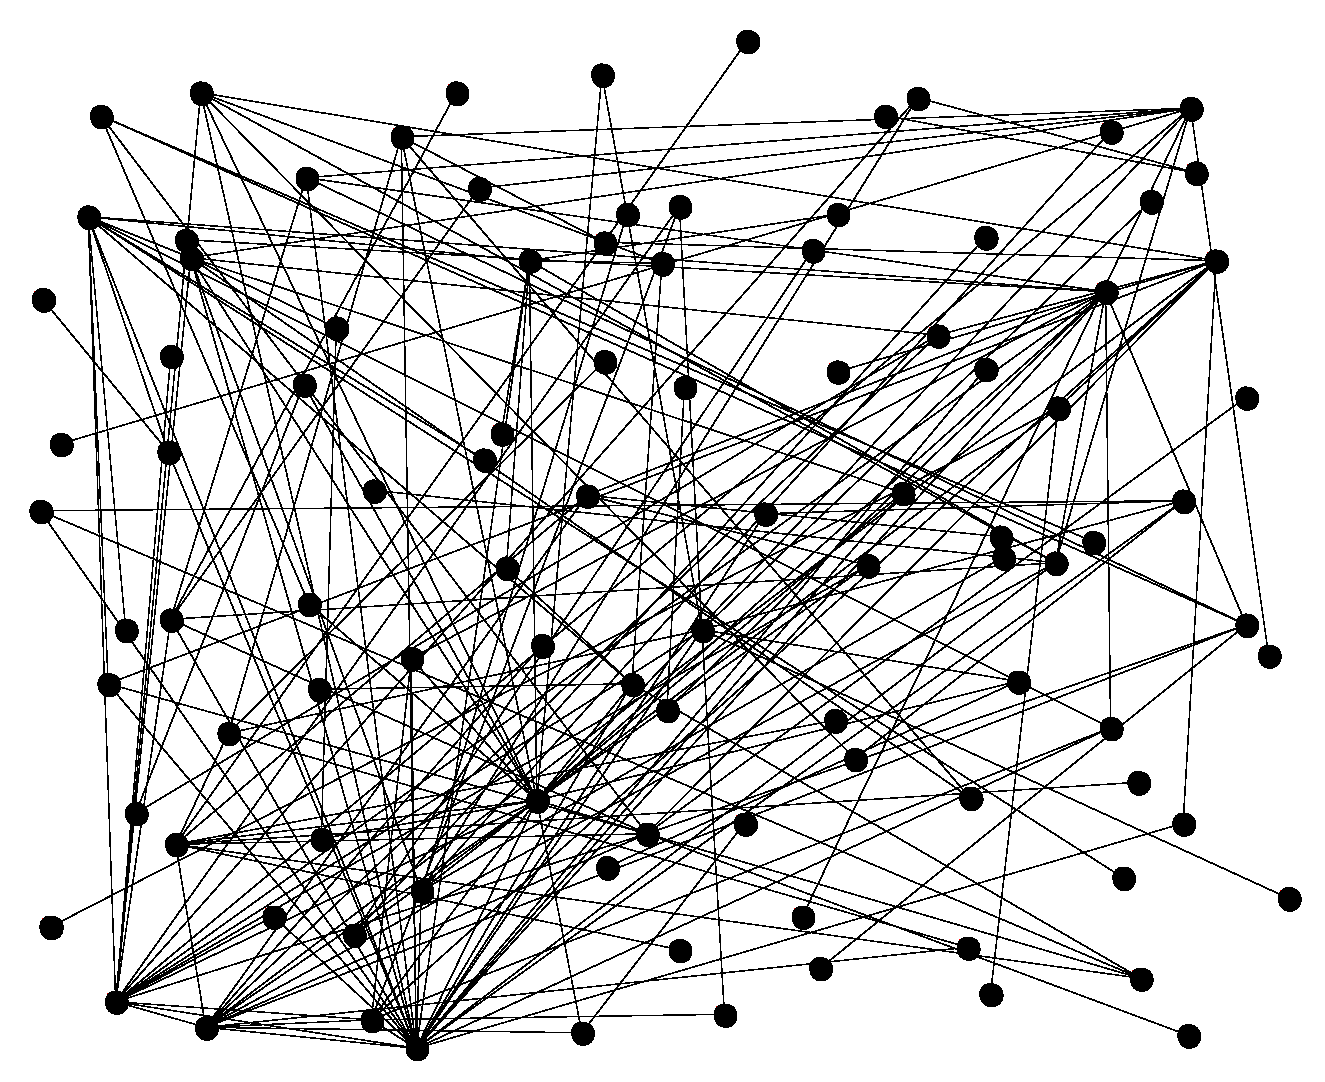
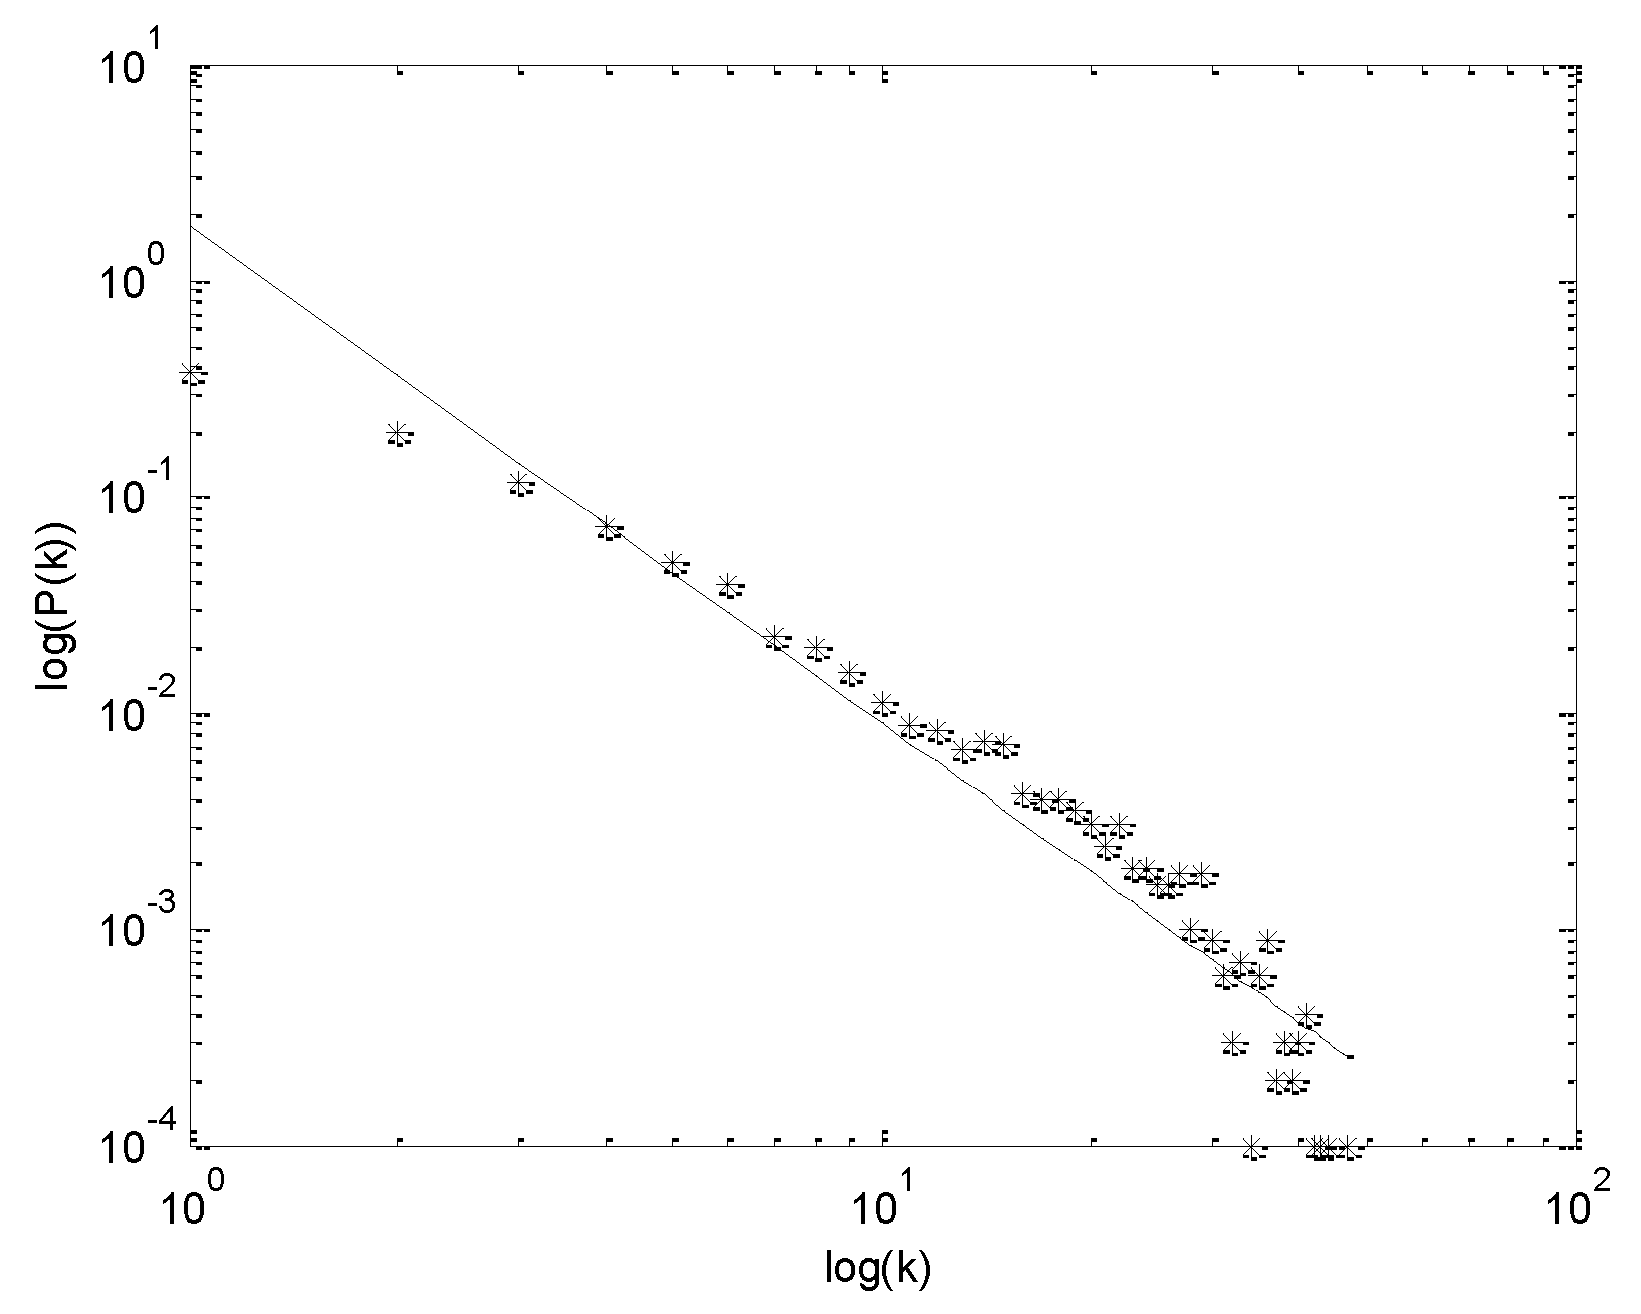
The parameters for Case 2: and satisfy the condition of the power degree distribution of the network degree distribution, which is . The simulation results for Case 2 are shown in Figure 3 and Figure 4. It is obvious from Figure 3 that the SCTNs presents scale-free characteristics. The scatter on the graph effectively fits the straight line in the graph. Figure 4 further proves that the degree of SCTN obeys the power law distribution under the evolution mechanism. The formula for the fitted straight line is , which is the degree distribution expression. The power law index for Case 2 is 2.3, which is approximately equal to the value obtained by the power law index formula, i.e., 7.3. Therefore, we can conclude that Test 2 effectively simulates the evolution process of the SCTN.
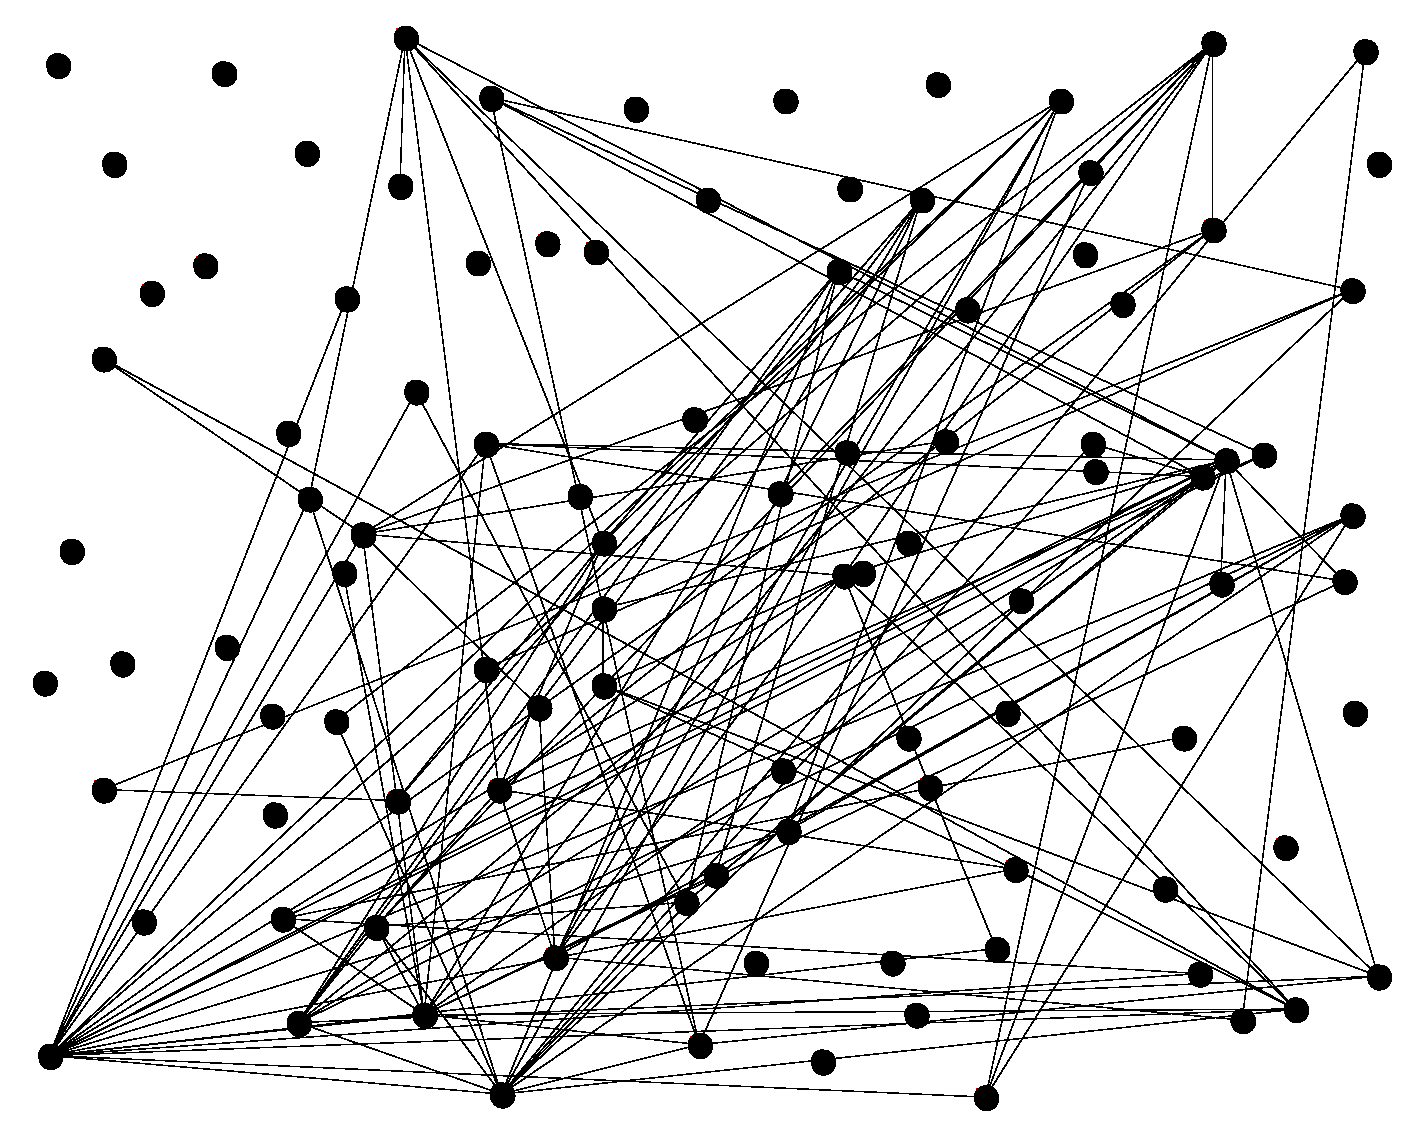
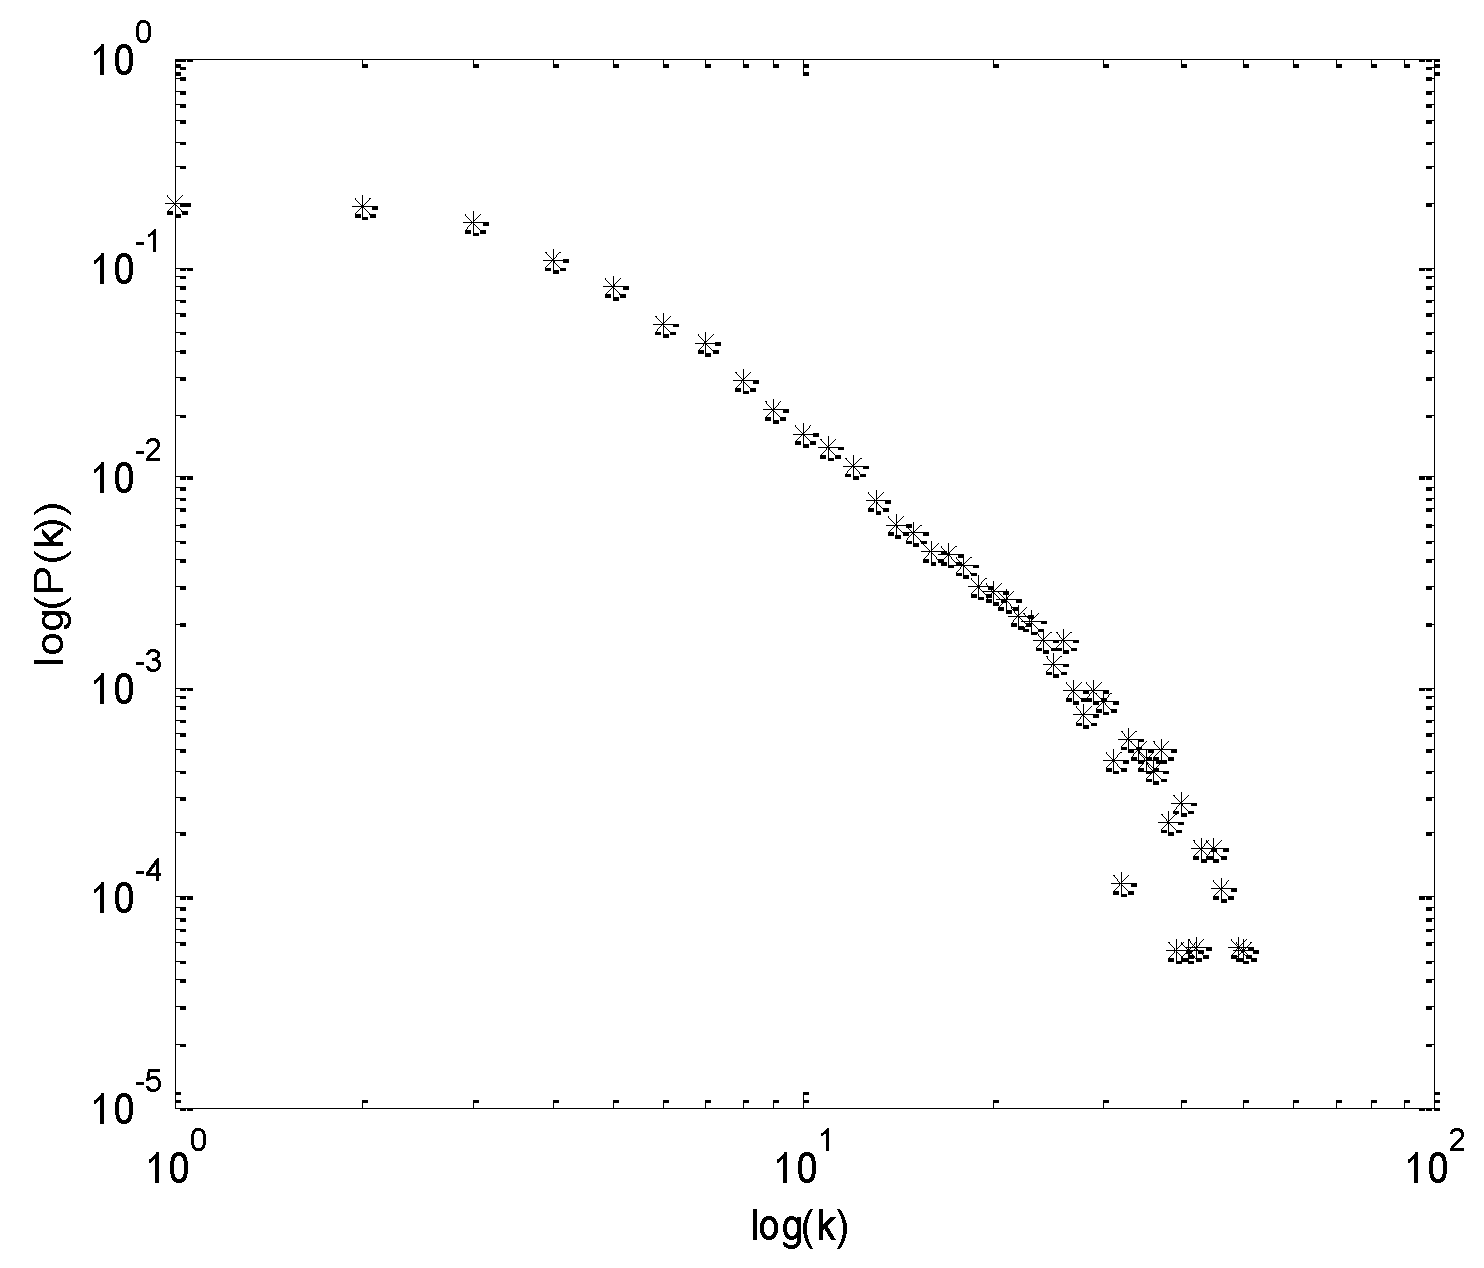
The parameter values for Case 3 are and . These values do not satisfy the condition that the network degree distribution obey the power law, which is , i.e., . Through theoretical analysis, we observe that the SCTN does not obey the power law distribution. The simulation results for Case 3 are shown in Figure 5 and Figure 6. It can be seen from Figure 5 that the network does not clearly reflect scale-free characteristics, and the scatter points in Figure 6 also do not effectively fit a slanted straight line in the logarithmic coordinates. Therefore, the degree of SCTN formed under the evolution mechanism of Case 3 does not obey the power law distribution.
Comparing the parameter values for Cases 1 and 2, it can be seen that the evolution mechanism for Case 1 includes the addition of new nodes, the generation of new connections, and the removal of existing connections. The evolution mechanism for Case 2, however, does not include the removal of existing connections. In brief, the evolution mechanism of Case 1 supports both increase and decrease of the network, whereas Case 2 supports only network growth. Hence, the different evolutionary results for the two cases can be seen from Figure 1 and Figure 3 that the network line density of Case 1 is smaller than that of Case 2. Similarly, nodes with large network degrees can be easily identified in Figure 3, whereas they cannot be easily identified in Figure 1. It can also be seen that both networks do not have standard degree characteristics, but the degree of display is different for the two cases. Figure 2 and Figure 4 show that the degrees of the two networks obey the power law distribution and that the slope of the straight line of Figure 2 is smaller than the slope of Figure 4, i.e., the power law index of Case 1 is larger than that of Case 2.
Comparing Cases 1 and 3, it can be seen from the parameter values that the evolution mechanism for both cases include the addition of new nodes, the generation of new connections, and the removal of existing connections. The probability of removing an existing connection is 1 in both cases. However, the probabilities of adding a new node and adding a new connection are both 1 in Case 1, as opposed to 0.65 in Case 3. Therefore, Case 3 has attenuated evolution. Figure 5 has many more side edges compared with Figure 1, and there are also many isolated points. Therefore, the network formed by Case 3 cannot display scale-free characteristics. It can also be seen from Figure 2 and Figure 6 that the scatter points in the figure are, respectively, fitted with a slanted straight line and a curve in the double-logarithmic coordinates. Hence, the degree of the evolutionary network of Case 1 obeys the power law distribution, while this is not the case for Case 3.
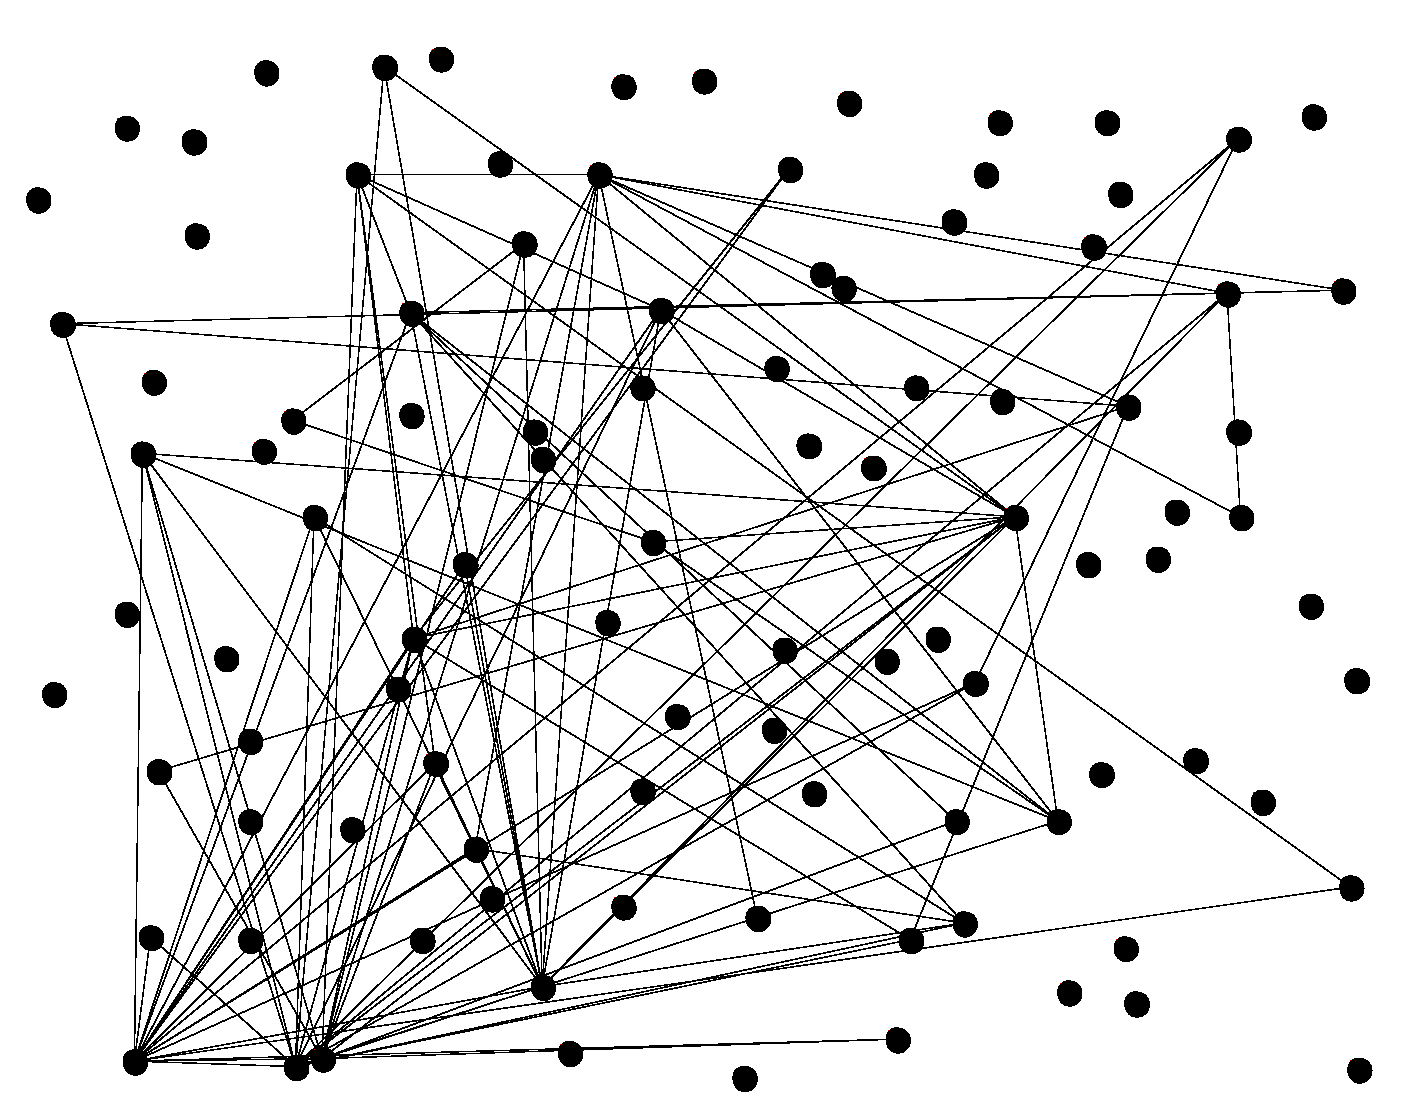
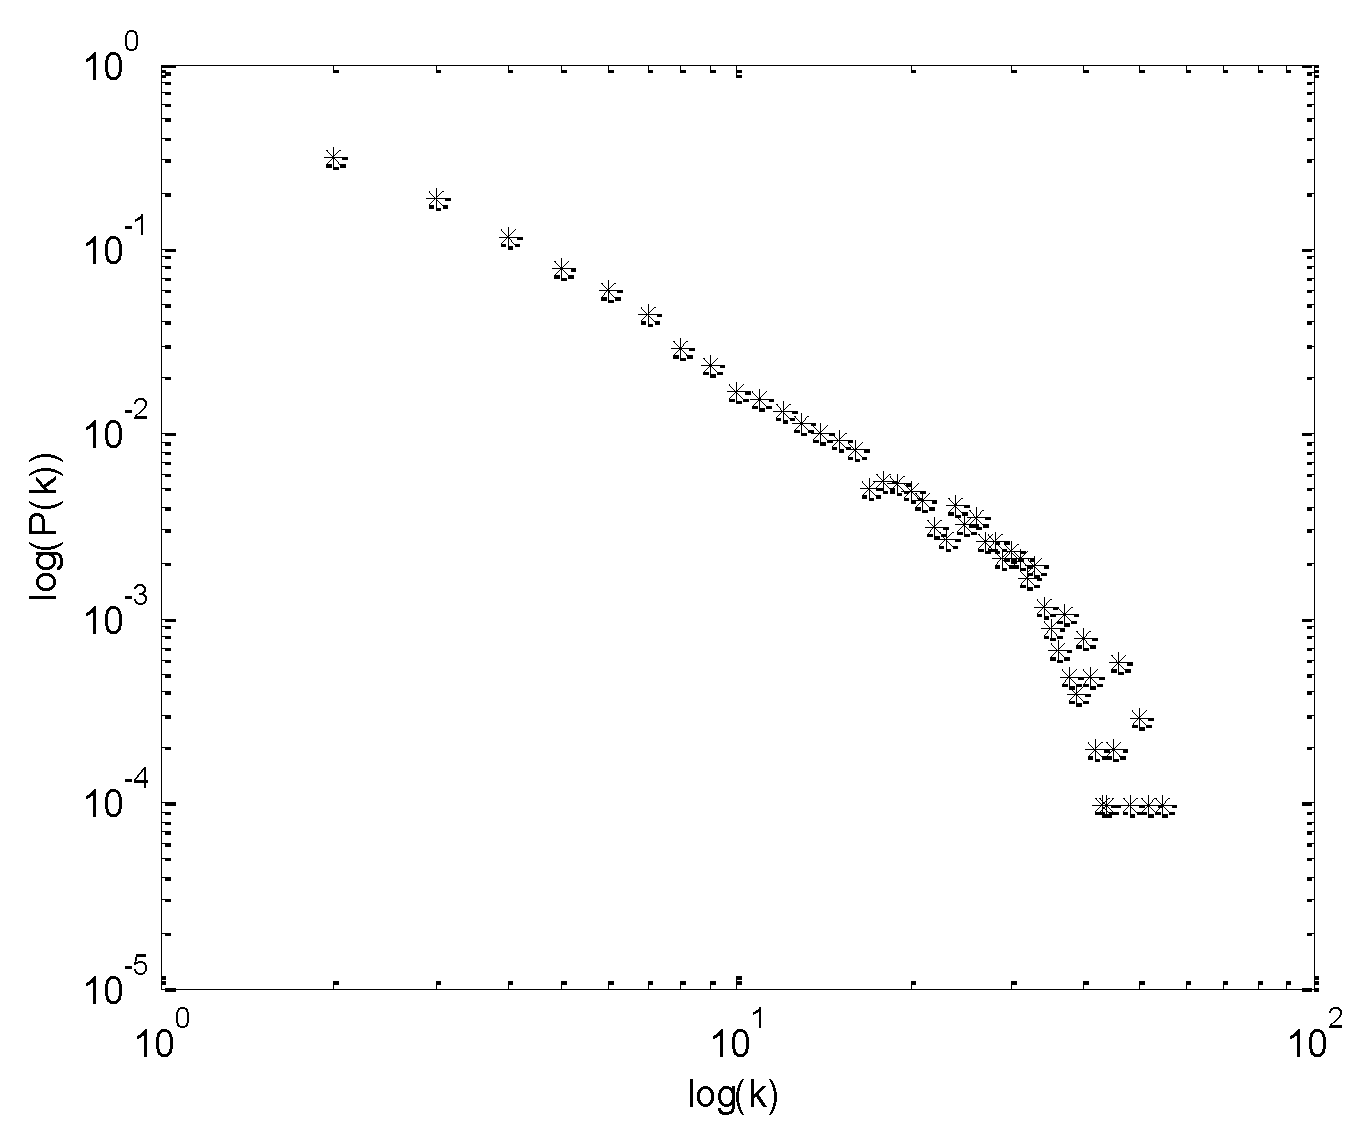
Case 4 involves the construction of an initial network with 4 nodes and 12 connected edges and then evolution into a network with 300 nodes after 300 time steps. The parameters take different values at different stages of evolution. For the first 100 time steps, , , and ; thus, the evolution of the network mostly involves adding new nodes. From the 101st to 200th time steps, , , ; thus, the evolution of the network mostly involves the addition of new connections, but there is also the removal of existing connections with a lower probability. During the 201–300th time steps, ,, ; therefore, the evolution of the network mostly consists of removing existing connections, and new nodes are no longer added. Throughout the evolution process, changes from large to small, increases then decreases, and decreases then increases.
The simulation results for Case 4 are shown in Figure 7, Figure 8, Figure 9, Figure 10, Figure 11 and Figure 12. Figure 7, Figure 9 and Figure 11 correspond to the structure diagram of the SCTN at the 100th, 200th, and 300th time steps, respectively. Similarly, Figure 8, Figure 10 and Figure 12 correspond to the degree distribution map of the SCTN at the 100th, 200th, and 300th time steps, respectively. We can see that there are many points in Figure 7 that have not yet joined the network. In Figure 9, most of the unconnected nodes are added to the network, and the number of connections has also increased. However, in Figure 11, the number of nodes exiting the network has increased.
The above experiments demonstrate that, whether the degree distribution of the SCTN obeys the power law distribution and whether its structure shows scale-free characteristics depends on the willingness of the SCTN to build the trust relationship and the attractiveness index of the supply chain network. Therefore, the desired SCTN can be constructed by controlling the willingness to build trust relationships and the attractiveness index of the supply chain network.
5. Conclusions
The supply chain network can be regarded as a complex and open system. We studied the structure of the SCTNs, composed of enterprises in a completely competitive market, by analyzing the evolution process of the SCTNs. We designed the evolution mechanism of the SCTNs, using the preferential attachment mechanism of network construction and a method for measuring the supply chain trust degree, to understand the inherent laws of the network structure and factors influencing the supply chain trust. The simulation results showed that, under certain evolution mechanisms and asymmetric evolution conditions, when the willingness to construct trust relationships and the attractiveness index of the supply chain network meet certain conditions, the SCTN can evolve into a scale-free network. Dominant companies represent only a few nodes in the network, whereas a vast majority of the nodes represent nondominant companies.
Therefore, in order to improve the supply chain trust, leading companies in the supply chain network should adopt trust-based partner selection rules and adjust their willingness to build trust relationships and construct a scale-free supply chain network. Additionally, it was observed that the attractiveness index helps to increase the level of trust in supply chain networks.
Author Contributions
Conceptualization and writing—review and editing, X.Z.; methodology, M.Z.; writing—original draft preparation, X.Z.; visualization, X.Z. and M.Z.; supervision, Y.L. and Y.Y.; project administration, X.Z. and Y.Y.; and funding acquisition, X.Z. All authors have read and agreed to the published version of the manuscript.
Funding
This work was supported by the Natural Science Foundation of China (Grant No. 71662007), the Natural Science Foundation of Guangxi (Grant No. 2018GXNSFAA281311), and the Social Science Foundation of China (Grant No. 21BGJ027).
Institutional Review Board Statement
Not applicable.
Informed Consent Statement
Informed consent was obtained from all subjects involved in the study.
Data Availability Statement
The data used to support the findings of this study are available from the corresponding author upon request.
Acknowledgments
The authors would like to thank the reviewers for their helpful comments and constructive suggestions, which have been very useful for improving the presentation of this paper.
Conflicts of Interest
The authors declare no conflict of interest.
References
- Ebrahim-Khanjari, N.; Hopp, W.; Iravani, S.M.R. Trust and Information Sharing in Supply Chains. Prod. Oper. Manag. 2012, 21, 444–464. [Google Scholar] [CrossRef] [Green Version]
- Pezeshki, Y.; Baboli, A.; Cheikhrouhou, N.; Modarres, M.; Akbari Jokar, M.R. A rewarding-punishing coordination mechanism based on Trust in a divergent supply chain. Eur. J. Oper. Res. 2013, 230, 527–538. [Google Scholar] [CrossRef]
- Chica, M.; Chiong, R.; Adam, M.T.P.; Teubner, T. An Evolutionary Game Model with Punishment and Protection to Promote Trust in the Sharing Economy. Sci. Rep. 2019, 9, 19789. [Google Scholar] [CrossRef] [PubMed] [Green Version]
- Johnston, D.A.; McCutcheon, D.M.; Stuart, F.I.; Kerwood, H. Effects of supplier trust on performance of cooperative supplier relationships. J. Oper. Manag. 2004, 22, 23–38. [Google Scholar] [CrossRef]
- Dyer, J.H.; Chu, W. The Role of Trustworthiness in Reducing Transaction Costs and Improving Performance: Empirical Evidence from the United States, Japan, and Korea. Organ. Sci. 2003, 14, 57–68. [Google Scholar] [CrossRef] [Green Version]
- Hearnshaw, E.J.S.; Wilson, M.M.J. A complex network approach to supply chain network theory. Int. J. Oper. Prod. Manag. 2013, 33, 442–469. [Google Scholar] [CrossRef]
- Ma, F.; Xue, H.; Yuen, K.F.; Sun, Q.; Zhao, S.; Zhang, Y.; Huang, K. Assessing the Vulnerability of Logistics Service Supply Chain Based on Complex Network. Sustainability 2020, 12, 1991. [Google Scholar] [CrossRef] [Green Version]
- Capaldo, A.; Giannoccaro, I. How does trust affect performance in the supply chain? The moderating role of interdependence. Int. J. Prod. Econ. 2015, 166, 36–49. [Google Scholar] [CrossRef]
- Hou, Y.; Xiong, Y.; Wang, X.; Liang, X. The effects of a trust mechanism on a dynamic supply chain network. Expert Syst. Appl. 2014, 41, 3060–3068. [Google Scholar] [CrossRef]
- Tsai, J.-M.; Hung, S.-W. Supply chain relationship quality and performance in technological turbulence: An artificial neural network approach. Int. J. Prod. Res. 2016, 54, 2757–2770. [Google Scholar] [CrossRef]
- Panayides, P.M.; Venus Lun, Y.H. The impact of trust on innovativeness and supply chain performance. Int. J. Prod. Econ. 2009, 122, 35–46. [Google Scholar] [CrossRef]
- Handfield, R.B.; Bechtel, C. The role of trust and relationship structure in improving supply chain responsiveness. Ind. Mark. Manag. 2002, 31, 367–382. [Google Scholar] [CrossRef]
- Helbing, D.; Armbruster, D.; Mikhailov, A.S.; Lefeber, E. Information and material flows in complex networks. Phys. Stat. Mech. Its Appl. 2006, 363, xi–xvi. [Google Scholar] [CrossRef]
- Wei, Y.; Wang, H.; Chen, F. Exploring the Impact of Network Structure and Demand Collaboration on the Dynamics of a Supply Chain Network Using a Robust Control Approach. Math. Probl. Eng. 2015, 2015, 1–13. [Google Scholar] [CrossRef] [Green Version]
- Hou, Y.; Wang, X.; Wu, Y.J.; He, P. How does the trust affect the topology of supply chain network and its resilience? An agent-based approach. Transp. Res. Part E-Logist. Transp. Rev. 2018, 116, 229–241. [Google Scholar] [CrossRef]
- Manapat, M.L.; Nowak, M.A.; Rand, D.G. Information, irrationality, and the evolution of trust. J. Econ. Behav. Organ. 2013, 90, S57–S75. [Google Scholar] [CrossRef]
- Abbass, H.; Greenwood, G.; Petraki, E. The N-Player Trust Game and its Replicator Dynamics. IEEE Trans. Evol. Comput. 2016, 20, 470–474. [Google Scholar] [CrossRef] [Green Version]
- Chica, M.; Chiong, R.; Kirley, M.; Ishibuchi, H. A Networked N-Player Trust Game and Its Evolutionary Dynamics. Ieee Trans. Evol. Comput. 2018, 22, 866–878. [Google Scholar] [CrossRef]
- Lu, K.; Wang, J.; Li, M. An Eigentrust dynamic evolutionary model in P2P file-sharing systems. Peer-Peer Netw. Appl. 2016, 9, 599–612. [Google Scholar] [CrossRef]
- Shi, K.; Ma, H. Evolution of trust in a dual-channel supply chain considering reciprocal altruistic behavior. Adv. Complex Syst. 2016, 19, 1650014. [Google Scholar] [CrossRef]
- Shi, D.; Chen, Q.; Liu, L. Markov chain-based numerical method for degree distributions of growing networks. Phys. Rev. E 2005, 71, 036140. [Google Scholar] [CrossRef] [PubMed] [Green Version]
- Bandyopadhyay, A.; Kar, S. Coevolution of cooperation and network structure in social dilemmas in evolutionary dynamic complex network. Appl. Math. Comput. 2018, 320, 710–730. [Google Scholar] [CrossRef]
- Fang, H.; Jiang, D.; Yang, T.; Fang, L.; Yang, J.; Li, W.; Zhao, J. Network evolution model for supply chain with manufactures as the core. PLoS ONE 2018, 13, e0191180. [Google Scholar] [CrossRef] [Green Version]
- Zhu, L.; Wang, L.; Yang, Y.; Yao, C. Research on Evolutionary Model for Trust of Nodes Based on the Fuzzy Correlation Measures. Wirel. Pers. Commun. 2018, 102, 3647–3662. [Google Scholar] [CrossRef]
- Xu, N.-R.; Liu, J.-B.; Li, D.-X.; Wang, J. Research on Evolutionary Mechanism of Agile Supply Chain Network via Complex Network Theory. Math. Probl. Eng. 2016, 2016, 4346580. [Google Scholar] [CrossRef] [Green Version]
- Wei, J.Y.; Yan, X.M.; Bi, R. The Application of ANP in the Trust Relationship in Supply Chain Partnership. Key Eng. Mater. 2010, 439–440, 783–787. [Google Scholar] [CrossRef]
- Bellingeri, M.; Cassi, D.; Vincenzi, S. Efficiency of attack strategies on complex model and real-world networks. Phys. Stat. Mech. Appl. 2014, 414, 174–180. [Google Scholar] [CrossRef] [Green Version]
- Sun, H.; Wu, J. Scale-free characteristics of supply chain distribution networks. Mod. Phys. Lett. B 2005, 19, 841–848. [Google Scholar] [CrossRef]
- Wiedmer, R.; Griffis, S.E. Structural characteristics of complex supply chain networks. J. Bus. Logist. 2021, 42, 264–290. [Google Scholar] [CrossRef]
- PETERSON, C. Mean Field Theory Neural Networks for Feature Recognition, Content Addressable Memory and Optimization. Connect. Sci. 1991, 3, 3–33. [Google Scholar] [CrossRef]
- Krapivsky, P.L.; Rodgers, G.J.; Redner, S. Degree distributions of growing networks. Phys. Rev. Lett. 2001, 86, 5401–5404. [Google Scholar] [CrossRef] [PubMed] [Green Version]
- Bollobás, B.; Riordan, O.; Spencer, J.; Tusnády, G. The degree sequence of a scale-free random graph process. Random Struct. Algorithms 2001, 18, 279–290. [Google Scholar] [CrossRef] [Green Version]
Figure 1.
Trust network evolution model for Case 1.

Figure 2.
Degree distribution of the trust network evolution for Case 1.

Figure 3.
Trust network evolution model for Case 2.

Figure 4.
Degree distribution of the trust network evolution for Case 2.

Figure 5.
Trust network evolution model for Case 3.

Figure 6.
Degree distribution of the trust network evolution for Case 3.

Figure 7.
Trust network evolution model for Case 4 at t = 100.

Figure 8.
Degree distribution of the network evolution for Case 4 at t = 100.

Figure 9.
Trust network evolution model for Case 4 at t = 200.

Figure 10.
Degree distribution of the network evolution for Case 4 at t = 200.

Figure 11.
Trust network evolution model for Case 4 at t = 300.

Figure 12.
Degree distribution of the network evolution for Case 4 at t = 300.


Table 1.
SCTN evolution model parameter settings.
| Case 1 | 1 | 1 | 1 | |
| Case 2 | 1 | 1 | 0 | |
| Case 3 | 0.65 | 0.65 | 1 | |
| Case 4 | t = 100 | 1 | 0.65 | 0 |
| t = 200 | 0.65 | 1 | 0.65 | |
| t = 300 | 0 | 0.65 | 1 |
Publisher’s Note: MDPI stays neutral with regard to jurisdictional claims in published maps and institutional affiliations. |
© 2022 by the authors. Licensee MDPI, Basel, Switzerland. This article is an open access article distributed under the terms and conditions of the Creative Commons Attribution (CC BY) license (https://creativecommons.org/licenses/by/4.0/).
Share and Cite
MDPI and ACS Style
Zhang, X.; Zhang, M.; Luo, Y.; Yi, Y. An Evolutionary Numerical Method of Supply Chain Trust Networks with the Degree of Distribution. Symmetry 2022, 14, 587. https://doi.org/10.3390/sym14030587
AMA Style
Zhang X, Zhang M, Luo Y, Yi Y. An Evolutionary Numerical Method of Supply Chain Trust Networks with the Degree of Distribution. Symmetry. 2022; 14(3):587. https://doi.org/10.3390/sym14030587
Chicago/Turabian StyleZhang, Xuelong, Maojun Zhang, Yuxi Luo, and Yanling Yi. 2022. "An Evolutionary Numerical Method of Supply Chain Trust Networks with the Degree of Distribution" Symmetry 14, no. 3: 587. https://doi.org/10.3390/sym14030587
Note that from the first issue of 2016, this journal uses article numbers instead of page numbers. See further details here.