Differential Entropy Analysis of the Acoustic Characteristics of a Biomimetic Dynamic Sonar Emitter


1
School of Mechanical and Electronic Engineering, Shandong Jianzhu University, Jinan 250101, China
2
Shandong University–Virginia Tech International Laboratory, School of Physics, Shandong University, Jinan 250100, China
3
Department of Mechanical Engineering, Virginia Tech, Blacksburg, VA 24061, USA
*
Author to whom correspondence should be addressed.
†
These authors contributed equally to this work.
Symmetry 2020, 12(3), 391; https://doi.org/10.3390/sym12030391
Submission received: 17 February 2020
/
Revised: 26 February 2020
/
Accepted: 27 February 2020
/
Published: 3 March 2020
(This article belongs to the Special Issue Symmetry in Mechanical Engineering Ⅱ)
Abstract
:Active noseleaf deformations during pulse emission observed in hipposiderid and rhinolophid bats have been shown to add a time dimension to the bats’ acoustic emission characteristics beyond the established dependencies on frequency and direction. In this study, a dense three-dimensional acoustic characteristics were obtained by the time series of smoothed signal amplitudes at different directions and frequencies collected by a biomimetic dynamic sonar emitter. These data have been analyzed using differential entropy which was used as a measure to compare the encoding capacity for sensory information between the three different dimensions. The capacity for sensory information encoding measured in this way along time dimension was found to be similar to that along the frequency dimension. But both of them provided less information than provided by the direction dimension.
1. Introduction
Bats use biosonar to navigate and find food, i.e., they emit ultrasonic pulses and listen to the returning echoes from which they extract a large portion of the sensory information they need about their surroundings [1,2]. Some bat species, such as horseshoe bats (Rhinolophidae) and the related Old World leaf-nosed bats (Hipposideridae), emit their biosonar pulses through the nostrils. In these cases, the nostrils are surrounded by elaborate baffles called “noseleaves” that act as interfaces between the biosonar’s ultrasonic source and the free field [3]. Through diffracting the outgoing waves, the noseleaves determine the shape of the bats’ emission beam pattern, i.e., how the emitted energy is distributed as a function of direction and frequency [4,5]. This control over the emission characteristics of the biosonar may help the bats obtain and encode additional sensory information above that provided by static noseleaf positions during a biosonar pulse.
Besides relying on the static geometry of their noseleaves, both rhinolophid and hipposiderid bats also have the ability to alter their noseleaf shapes during pulse emission through muscular actuation [6]. Numerical and biomimetic robotic studies have suggested that these dynamic noseleaf deformations can alter the shape of the emission beam and hence, add a time-dependence to the emission characteristics which hence becomes a function of direction, frequency, and time [5,7,8]. Information-theoretic analysis has shown that the time dimension could support the encoding of additional, useful sensory information [9,10,11]. These findings lead to the hypothesis that the sensory coding capacity differs among the three dimensions. If the noseleaf motion has a function for sensory information encoding, the variability along the time dimension should not be negligible compared to the other dimensions that are known to be used by the bats.
Previous work has compared the sensory encoding capacity along the time and frequency dimensions using joint differential entropy and relative entropy but have not included the direction dimension [10,11]. Here, the goal has been to compare the information-coding capacity along all three dimensions. If the time and frequency dimension are of similar importance to the biosonar sense, we would expect them to be similar in terms of their information coding capacity. Since representing a function of three independent variables requires more data than could be obtained from a behaving animal under controlled conditions, we have used a biomimetic reproduction of a hipposiderid noseleaf (Figure 1a–c, [7]) to collect the experimental data. Based on this data, we have assessed the information coding capacity using differential entropy because it is a good match for our continuous data and does not require an arbitrary discretization [12].
2. Results
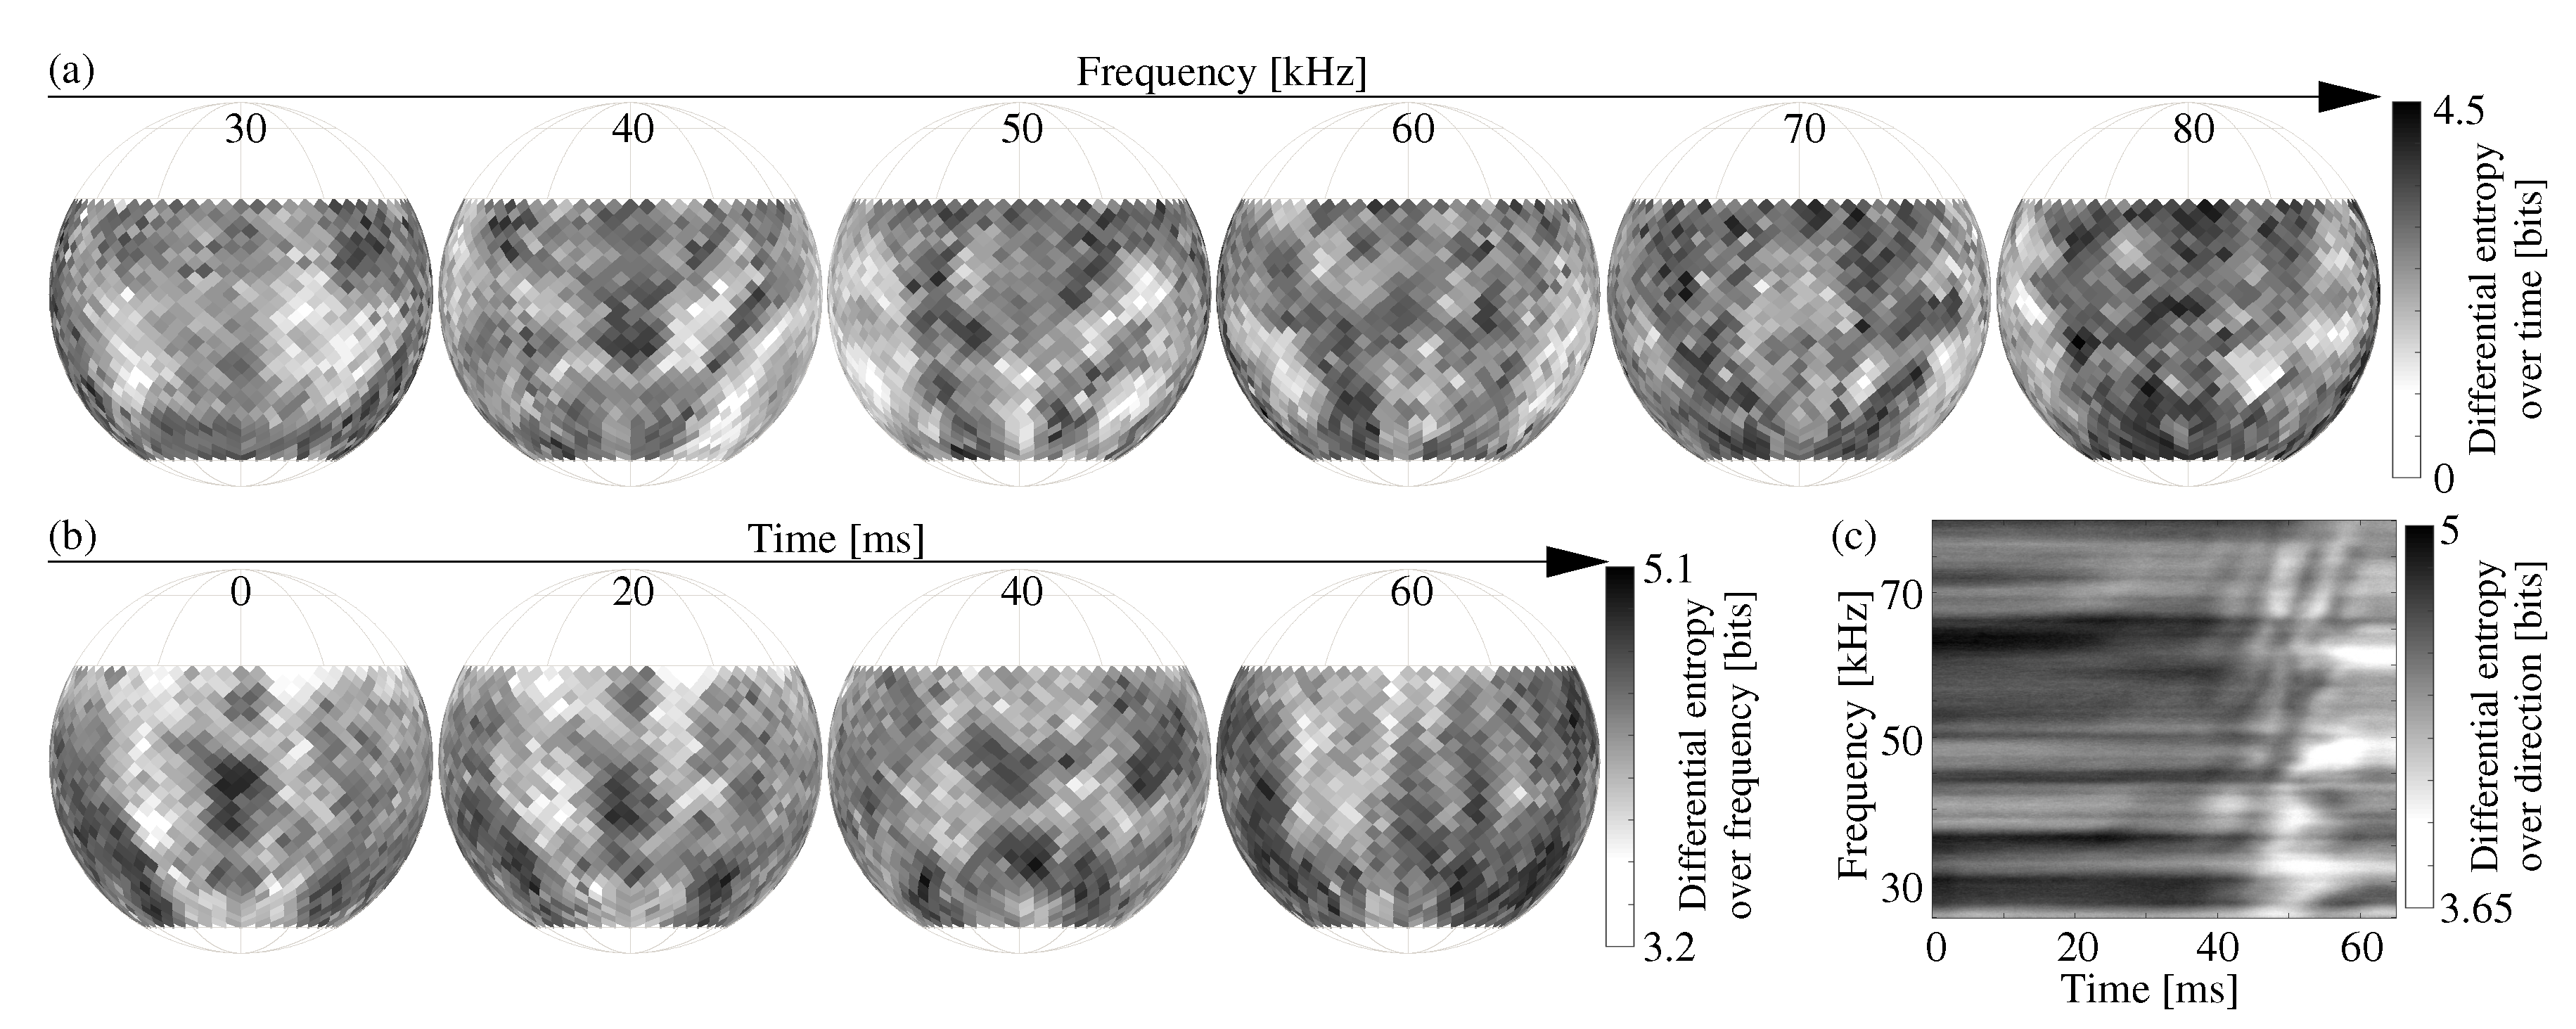
Differential entropy measured over each of the three studied dimensions (direction, frequency, time) depended on the fixed values along the other two dimensions (Figure 2). For the time dimension, the values of differential entropy changed with direction as well as with frequency. Looking at the entropy as a function of direction (Figure 2a) did not reveal any deterministic patterns, i.e., there were no trends or spatial clusters in the variations that accounted for 22 ± 3% of the mean value (mean: 2.55 ± 0.14 bits, standard deviation, std: 0.55 ± 0.05 bits). Averaging the patterns over frequency failed to bring forth any discernible patterns, and the variations only decreased slightly to approximately 21 ± 5% of the mean (std: 0.52 ± 0.1 bits, mean: 2.55 ± 0.22 bits).
A similar behavior was observed for differential entropy taken over the frequency dimension as a function of direction at different points in time (Figure 2b). For each time step, the patterns appeared to be random with variations that were much smaller than the variations of differential entropy over time (mean: 4.24 ± 0.05 bits, std: 0.22 ± 0.02 bits, i.e., ≈5.2 ± 0.4% of the mean). Once again, averaging the patterns over time did not reveal any discernible patterns, and the variation decreased slightly to approximately 3.7 ± 1.2% (std: 0.15 ± 0.05 bits, mean: 4.24 ± 0.16 bits).
Unlike the distribution over time and frequency, differential entropy computed over the direction as a function of time and frequency showed an overall trend with a decrease starting around t = 45 ms for most frequencies, which coincided with the motion slowing down as it approached its maximum (Figure 2c). As previously observed along the other dimensions, the variation—over time and frequency in this case—was again fairly small compared to the value of differential entropy (mean: 4.5 bits, std: 0.2 bits, i.e., ≈4.4% of the mean). In summary, it was found that the differential entropy over all three dimensions (time, frequency, direction) distributed was almost uniform over the other two fixed dimensions.
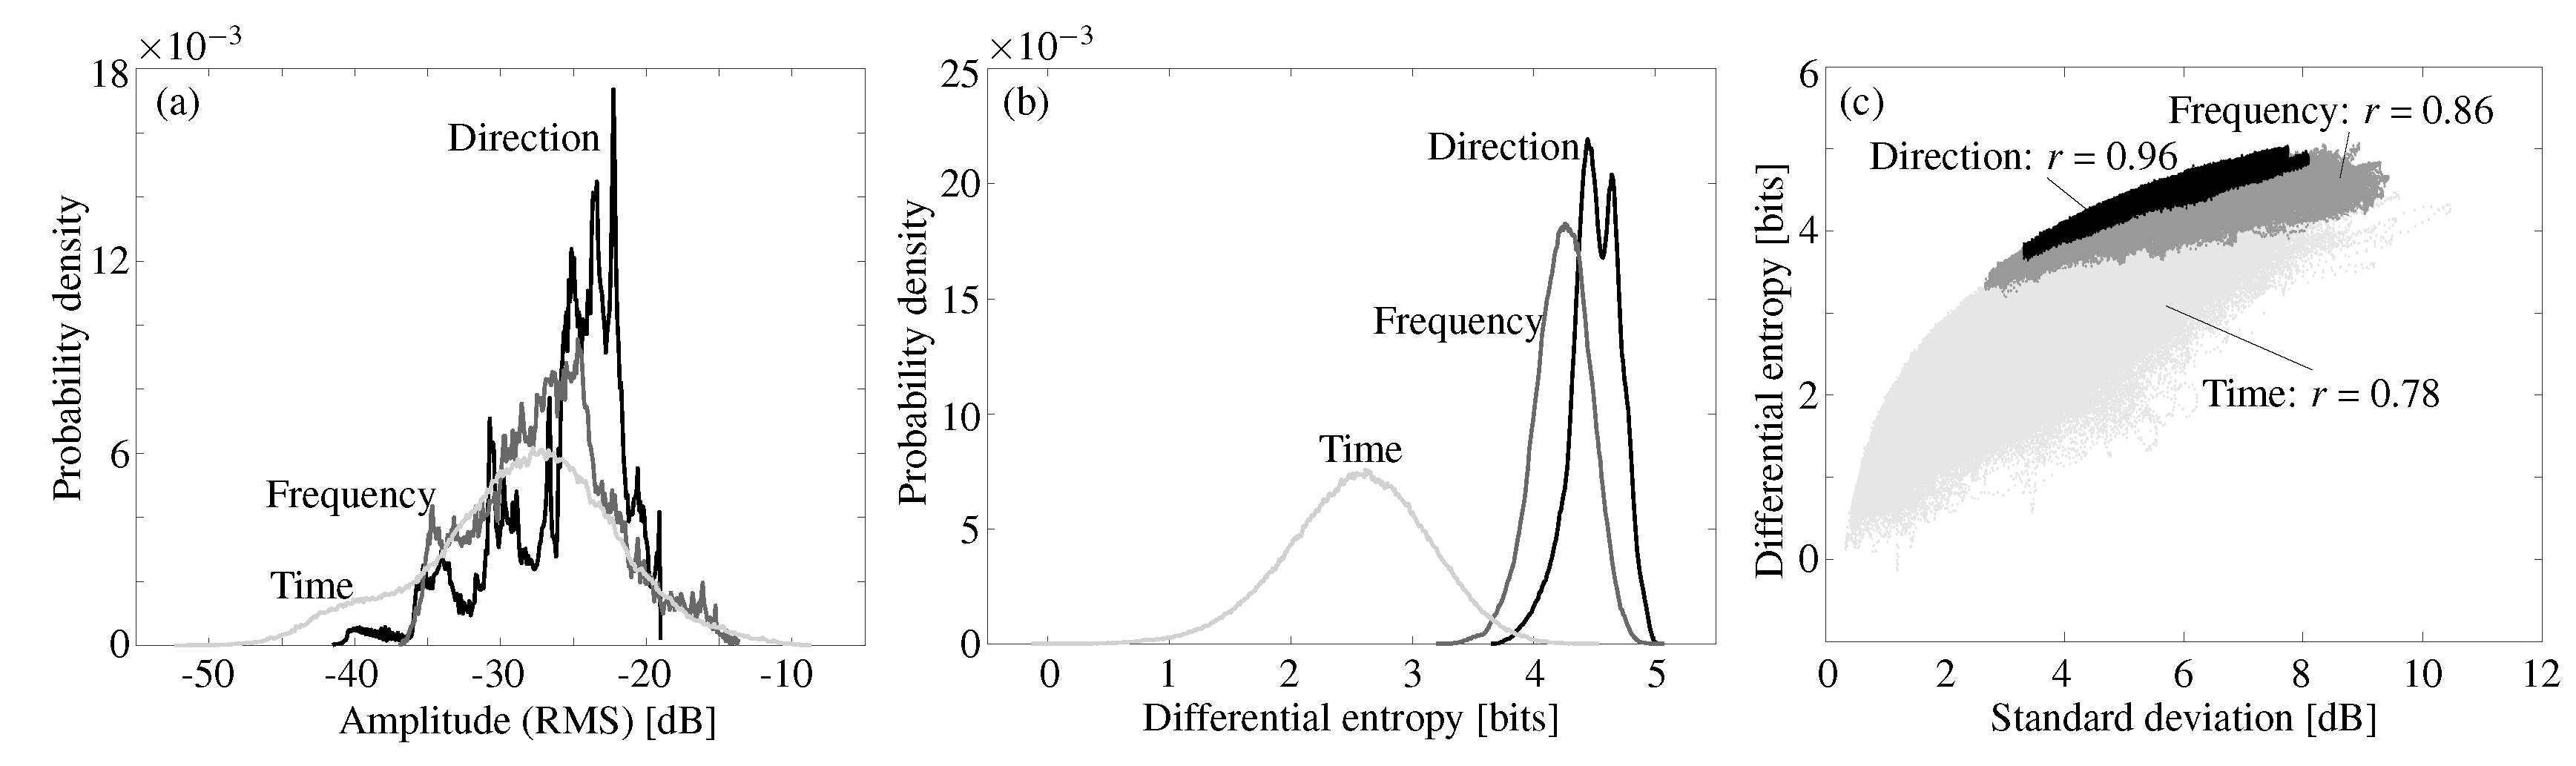
The amplitudes, i.e., the root-mean-square values, of the emission gains occupied a similar range of values across the three dimensions (mean: −27 dB, std: 5.1 dB, over all the values across the three dimensions, Figure 3a). But while the shape of the distribution over direction was skewed heavily to the right, it was almost symmetrically bell-shaped for the time dimension. The shape of the distribution over frequency was somewhat intermediate between the distribution shapes obtained along the time and direction dimensions. Unlike the amplitude distributions, the distributions of the differential entropy values showed a pronounced difference between the three dimensions in terms of location and spread (Figure 3b). While all three distributions were approximately symmetric and bell-shaped, the distributions for the direction and frequency dimensions had higher mode values and were also more concentrated than the distribution over time. However, the ranges of entropy values covered by the three different distributions still overlapped with the high-value tail of the distribution over time covering the value ranges of differential entropy of the distributions for frequency and direction.
The standard deviations of the data predicted the differential entropy over direction and frequency with correlation coefficients r = 0.96 and 0.86 respectively (Figure 3c). However, the slope of the regression line was shallow for both dimensions (direction and frequency). In contrast to this, the relation between differential entropy and standard deviation scattered over a large range for the time dimension.
3. Discussion
The differential entropy estimates here indicate that the capacity for the encoding of sensory information is uniform over direction within the angular range studied (180 in azimuth, 90 in elevation). This could be taken as an indication that the sensory information encoding on the emission-side of bat biosonar is designed to operate equally well over this range. This would be similar to human hearing, which serves to sense the entire surroundings of a person [13], whereas highly accurate vision is limited to a narrow foveal region [14]. The results presented here show no indication the information-encoding capacity of dynamic biosonar emission has fovea—no matter whether over frequency or time. This analysis does not include, however, any likely dependence of the signal-to-noise ratio on direction, i.e., the directional nature of the emission will result in a reduced signal-to-noise ratio for off-center directions.
The capacity for the encoding of sensory information through variability along the time dimension was found to be clearly less than the capacity associated with frequency and direction. However, their differences seemed not substantial, e.g., the mode of sensory information encoded in time (2.64 bits) was about 1.62 bits less than in frequency (4.26 bits), i.e., the encoding capacity along the time and frequency dimension were similar. While differential entropy is not an absolute measure of uncertainty in continuous variables, unlike discrete entropy, but a measure to compare the difference between probability densities under common conditions [12]. Therefore, whether the amount of sensory information encoded in time is sufficient for the sensory tasks remains unknown. The results presented here do confirm [10] that both the frequency and time dimensions have an amount of variability (as quantified by differential entropy) that would make them suitable substrates for the encoding of sensory information. Hence, hipposiderid bats could rely on the temporal dimension in addition to the frequency dimension to encode the biosonar information they need. Future work will be needed to assess the utility of the different dimensions of the emission characteristics with respect to specific sensing tasks, and estimate how the use of movable noseleaves might reduce the weight needed for implementation of biosonar by drones.
4. Materials and Methods
4.1. Experimental Setup
To obtain a densely sampled representation of three-dimensional acoustic emission characteristics similar to a bat’s, we have created a biomimetic noseleaf baffle modeled after Pratt’s roundleaf bat (Hipposideros pratti) (Figure 1a–c, [7]). For this shape, we have retained five main features seen in hipposiderid bats (anterior leaf, posterior leaf, coronet, and two nostril flaps, Figure 1a) and removed small irregularities. We have cast the result from a flexible material (Ecoflex 00-30, Smooth-On, Inc., Macungie, PA, USA) and actuated it with two stepper motors (PKP213D05A, Oriental Motor Co., Ltd., Japan, Figure 1c) to reproduce the closing and opening motion of the anterior leaf, posterior leaf, and coronet observed in bats. An electrostatic transducer (600 Series, SensComp Inc., Livonia, MI, USA) served as an acoustic source for each nostril. We matched its diameter (38 mm) to that of the nostrils through a conical funnel (length: 100 mm). We recorded the emitted ultrasonic pulse (duration: 170 ms, sampling rate: 500 kHz, 10 or 6 constant frequency components contained) from different directions with a capacitive pressure measurement microphone ( inch, type 4138, Büel and Kæjr, Nærum, Denmark) at a distance of 1 m from the noseleaf. The direction dimension was sampled at 1,040 points spaced over 180 in azimuth and 90 in elevation using an equal-area pixel discretization of a sphere (HEALPix, resolution level 4, Figure 1d, [15]). We recorded the acoustic characteristics for the entire closing motion (duration: 65 ms, sampling rate: 500 kHz, Figure 1e) and omitted the opening motion because of temporal mirror symmetry. We scaled the biomimetic noseleaf by a factor of 2.5× relative to the bat and investigated a frequency band between 25 to 80 kHz (sampled at 56 equidistant frequencies), i.e., equivalent to a biosonar frequency band from the constant frequency component of the second (strongest) harmonic up to a potential fifth harmonic (about 60 to 150 kHz).
4.2. Signal Preprocessing
The signals for the entire closing motion (65 ms) were cut out from the recorded signals (190 ms) for each direction sample (Figure 1e), according to the pulse-width modulation (PWM) control signal for stepper motors and the trajectories of the main shape features reconstructed by a pair of high-speed video cameras (frame rate: 1057.36 Hz, image resolution: 1280 × 1024 pixels, Chronos 1.4, Kron Technologies, New Westminster, BC, Canada, [11]). We then filtered the cut signals to extract the time-domain signals for each frequency component using an FIR bandpass filter (an equiripple filter with a −6 dB-bandwidth of 3.3 kHz, a passband ripple of 1 dB, and a stopband attenuation of 60 dB). The envelopes of the time-domain signals were extracted as the magnitudes of the analytic signal constructed using the Hilbert transform. Hence, the three-dimensional acoustic characteristics created by the biomimetic noseleaf emitter were obtained by the envelope amplitudes for each sampled direction and frequency (Figure 1f).
4.3. Differential Entropy Estimation
Differential entropy was used to compare the sensory coding capacity between the different dimensions of the acoustic characteristics. To avoid the introduction of a bias into the differential entropy estimates due to large differences in the number of samples along each dimension, we resampled the time and frequency dimensions to approximate the number of samples along the direction dimension (1040): along the time dimension, we reduced the number of samples from 32,500 (65 ms duration sampled at 500 kHz) to 1084 (sampling period of 0.06 ms). Along the frequency dimension, we interpolated from 56 samples to 1101 samples (from 25 to 80 kHz in steps of 50 Hz) using a Gaussian kernel smoothing regression (bandwidth of 600 Hz, i.e., the distance between the original samples and hence resulted in a smooth interpolation that did not introduce any artificial high-frequency features into the results).
The differential entropy over each dimension was estimated using a non-parametric estimator based on k-th-nearest neighbor (k-NN) distances [16]:
where X is a vector of normalized amplitudes of the acoustic characteristics along one dimension for fixed values of the other two dimensions. The amplitudes were normalized by the respective root-mean-square value; is the digamma function (i.e., the derivative for the logarithm of gamma function); k is the neighborhood size (here, k = 4 was used as suggested in [16]); N is the number of samples in X with N = 1084, 1040, and 1101 for time, direction, and frequency dimension, respectively; d = 1 is the dimension of X; is the distance of the ith sample in X to its kth nearest neighbor. Calculations for differential entropy based on this estimator were performed numerically (TIM 1.2.0, Kalle Rutanen, Tampere University of Technology).
Author Contributions
Conception and design of the experiments, L.Y. and R.M.; implementation of the experiments, L.Y.; data analysis, L.Y. and R.M.; writing—original draft preparation, L.Y. and R.M.; funding acquisition, R.M. All authors have read and agreed to the published version of the manuscript.
Funding
This research was funded by the National Natural Science Foundation of China (Grant No. 11374192, 11574183, and 31270414), the Fundamental Research Fund of Shandong University (Grant No. 2014QY008).
Acknowledgments
L.Y. was supported by a fellowship of China Scholarship Council.
Conflicts of Interest
The authors declare no conflict of interest.
References
- Habersetzer, J.; Schuller, G.; Neuweiler, G. Foraging behavior and Doppler shift compensation in echolocating hipposiderid bats, Hipposideros bicolor and Hipposideros speoris. J. Comp. Physiol. A 1984, 155, 559–567. [Google Scholar] [CrossRef] [Green Version]
- Neuweiler, G.; Metzner, W.; Heilmann, U.; Rübsamen, R.; Eckrich, M.; Costa, H. Foraging behaviour and echolocation in the rufous horseshoe bat (Rhinolophus rouxi) of Sri Lanka. Behav. Ecol. Sociobiol. 1987, 20, 53–67. [Google Scholar] [CrossRef]
- Robinson, M.F. A relationship betwen echolocation calls and noseleaf widths in bats of the genera Rhinolophus and Hipposideros. J. Zool. 1996, 239, 389–393. [Google Scholar] [CrossRef]
- Zhuang, Q.; Müller, R. Noseleaf furrows in a horseshoe bat act as resonance cavities shaping the biosonar beam. Phys. Rev. Lett. 2006, 97, 218701. [Google Scholar] [CrossRef] [PubMed]
- Gupta, A.K.; Webster, D.; Müller, R. Interplay of lancet furrows and shape change in the horseshoe bat noseleaf. J. Acoust. Soc. Am. 2015, 138, 3188–3194. [Google Scholar] [CrossRef] [PubMed]
- Göbbel, L. Morphology of the external nose in Hipposideros diadema and Lavia frons with comments on its diversity and evolution among leaf-nosed Microchiroptera. Cells Tissues Organs 2002, 170, 39–60. [Google Scholar] [CrossRef] [PubMed]
- Yang, L.; Yu, A.; Müller, R. Design of a dynamic sonar emitter inspired by hipposiderid bats. Bioinspir. Biomim. 2018, 13, 056003. [Google Scholar] [CrossRef] [PubMed]
- He, W.; Pedersen, S.C.; Gupta, A.K.; Simmons, J.A.; Müller, R. Lancet dynamics in greater horseshoe bats, Rhinolophus ferrumequinum. PLoS ONE 2015, 10, e0121700. [Google Scholar] [CrossRef] [PubMed]
- Müller, R.; Gupta, A.K.; Zhu, H.; Pannala, M.; Gillani, U.S.; Fu, Y.; Caspers, P.; Buck, J.R. Dynamic Substrate for the Physical Encoding of Sensory Information in Bat Biosonar. Phys. Rev. Lett. 2017, 118, 158102. [Google Scholar] [CrossRef] [PubMed] [Green Version]
- Gupta, A.K.; Webster, D.; Müller, R. Entropy analysis of frequency and shape change in horseshoe bat biosonar. Phys. Rev. E 2018, 97, 062402. [Google Scholar] [CrossRef] [PubMed] [Green Version]
- Yang, L.; Müller, R. Assessing continuous sensory information encoding capacity by a biomimetic dynamic sonar emitter. Bioinspir. Biomim. 2019, 14, 056003. [Google Scholar] [CrossRef] [PubMed]
- Michalowicz, J.V.; Nichols, J.M.; Bucholtz, F. Handbook of Differential Entropy; Chapman and Hall/CRC: Boca Raton, FL, USA, 2013. [Google Scholar]
- Blauert, J. Spatial Hearing: The Psychophysics of Human Sound Localization; MIT Press: Cambridge, CA, USA, 1997. [Google Scholar]
- Provis, J.M.; Dubis, A.M.; Maddess, T.; Carroll, J. Adaptation of the central retina for high acuity vision: Cones, the fovea and the avascular zone. Prog. Retin. Eye Res. 2013, 35, 63–81. [Google Scholar] [CrossRef] [PubMed] [Green Version]
- Górski, K.M.; Hivon, E.; Banday, A.J.; Wandelt, B.D.; Hansen, F.K.; Reinecke, M.; Bartelmann, M. HEALPix: A Framework for High-Resolution Discretization and Fast Analysis of Data Distributed on the Sphere. Astrophys. J. 2004, 622, 759–771. [Google Scholar] [CrossRef]
- Kraskov, A.; Stögbauer, H.; Grassberger, P. Estimating mutual information. Phys. Rev. E 2004, 69, 066138. [Google Scholar] [CrossRef] [PubMed] [Green Version]
Figure 1.
Experimental design and methods for establishing 3-dimensional acoustic emission characteristics. A flexible biomimetic noseleaf model (a) was simplified with five main shape features from the noseleaf of Pratt’s roundleaf bats (b). A biomimetic dynamic sonar emitter (c) assembled with actuation and ultrasound generation systems was mounted on a pain-tilt to scan over 1040 direction samples (d). Anterior and posterior portions of the noseleaf baffle were actuated by stepper motors according to the input motion control signal (dark gray dashed line in (e)). The displacement of the posterior leaf (dark gray solid line in (e)) was reconstructed by a pair of high-speed video cameras. An example of time-domain signal (light gray shadow in (e)) at 55 kHz was extracted from the raw received signal by a bandpass filter. The 3D acoustic characteristics were established by combining the time series of envelope amplitudes (black solid line in (e)) at each fixed direction and frequency. (f) Examples of beampatterns as a function of time and frequency.

Figure 2.
Examples of differential entropy estimates taken over the dimensions of time (a), frequency (b), and direction (c), respectively, for a set of fixed values along the remaining two dimensions.
Figure 2.
Examples of differential entropy estimates taken over the dimensions of time (a), frequency (b), and direction (c), respectively, for a set of fixed values along the remaining two dimensions.

Figure 3.
Probability density function estimates for root-mean-square values of the amplitudes (a) and differential entropy (b) over time (black lines), frequency (dark gray lines), and direction (light gray lines) dimension, respectively. (c) Correlation between differential entropy and standard deviation over the dimensions of time (light gray symbols, , ), frequency (medium gray symbols, , ), and direction (black symbols, , ).

© 2020 by the authors. Licensee MDPI, Basel, Switzerland. This article is an open access article distributed under the terms and conditions of the Creative Commons Attribution (CC BY) license (http://creativecommons.org/licenses/by/4.0/).
Share and Cite
MDPI and ACS Style
Yang, L.; Müller, R. Differential Entropy Analysis of the Acoustic Characteristics of a Biomimetic Dynamic Sonar Emitter. Symmetry 2020, 12, 391. https://doi.org/10.3390/sym12030391
AMA Style
Yang L, Müller R. Differential Entropy Analysis of the Acoustic Characteristics of a Biomimetic Dynamic Sonar Emitter. Symmetry. 2020; 12(3):391. https://doi.org/10.3390/sym12030391
Chicago/Turabian StyleYang, Luhui, and Rolf Müller. 2020. "Differential Entropy Analysis of the Acoustic Characteristics of a Biomimetic Dynamic Sonar Emitter" Symmetry 12, no. 3: 391. https://doi.org/10.3390/sym12030391
Note that from the first issue of 2016, this journal uses article numbers instead of page numbers. See further details here.