Symmetry and Balance as Factors of Aesthetic Appreciation: Ethel Puffer’s (1903) “Studies in Symmetry” Revised


Department of Psychology, Universität Konstanz, 78464 Konstanz, Germany
*
Author to whom correspondence should be addressed.
Symmetry 2019, 11(12), 1468; https://doi.org/10.3390/sym11121468
Submission received: 16 November 2019
/
Revised: 26 November 2019
/
Accepted: 30 November 2019
/
Published: 2 December 2019
(This article belongs to the Special Issue Empirical Aesthetics)
Abstract
:Symmetry and balance are basic concepts in art theory for the composition of pictures. It is assumed that well-balanced pictures are preferred to unbalanced ones. One of the first experimental studies to test this assumption was conducted more than a century ago by Ethel Puffer. By applying a production method, she found little evidence for the hypothesis that balance is favorable for the aesthetical appreciation of pictures. Instead, she observed that other construction principles competing with balance, such as bilateral symmetry and closeness, were applied. The aim of the present study was to repeat some of Puffer’s experiments with modern methods and to examine whether her results are replicable. In two experiments, we also found little to no evidence for balance. Moreover, as in Puffer’s study, participants used closeness and bilateral symmetry as principles. However, compared to that study, the relative frequency of use of these principles was quite different.
1. Introduction
Pictorial composition is one of the most important concepts in art and design [1,2,3,4,5]. It concerns the harmonious arrangement of components of an artwork into a unified whole. Of the various principles of composition, geometric or static bilateral symmetry is one of the simplest ones, i.e., the exact duplication of elements about the medial vertical axis. Pictures and designs with this property are usually pleasing to look at [6]. However, also non-symmetric pictures can be aesthetically appealing. Therefore, in order to maintain symmetry as a general principle of good composition, it has been assumed that such pictures often have some hidden symmetry, i.e., are symmetric with respect to the perceptual weights of the elements in a picture. This kind of symmetry has been called aesthetic symmetry [7], or dynamic symmetry [8] and is closely related to the concept of perceptual balance [9].
In his influential book on design, Ross [1] provided a rather general definition of balance by stating that a balanced arrangement of elements in a picture “… is a Harmony of Positions due to the coincidence of two centers, the center of the attractions and the center of the framing” (p. 24). Obviously, this definition treats both horizontal and vertical balance equally. However, such a two-dimensional concept of balance, where both dimensions are combined and treated equally, has been investigated empirically only recently [10,11,12,13,14,15,16]. The first empirical studies on balance were mainly concerned with the horizontal arrangement of elements in a picture, although some researchers also examined vertical balance [17].
With respect to horizontal balance, it has been assumed that a picture is liked, if the perceptual weights on one side of a picture counterbalance those on the other side. Thus, the elements in a picture are considered as weights on a beam scale, or seesaw. This mechanical metaphor has often been applied to investigate how balanced a picture is. McManus et al. [18], for instance, asked their participants to position a fulcrum underneath a picture so that the perceptual weights in the picture were horizontally balanced. If a picture is well balanced towards the midline, then the fulcrum should be placed underneath the center of the frame. McManus et al. found, however, that for many pictures the balance point was slightly left of center.
This example demonstrates that mechanical balance can be a helpful metaphor for investigating perceptual balance. However, its application is based on several assumptions. First of all, it has to be assumed that persons attribute weights to each element in a picture. This is not implausible, because by lifting real objects in our everyday activities, we steadily associate their weight with certain object features such as color, brightness, or other properties. Nevertheless, measuring the perceptual weights of picture elements is not straightforward, unless one makes simplifying assumptions. For instance, if one believes that brightness plays a crucial role for the perceptual weight of an object, then a simple approach is to assume that dark elements are heavier than bright ones, and, given an equal brightness, that large elements are heavier than small ones. Accordingly, the weight of an object can be computed by a simple gray-value integration method, i.e., by integrating the gray values over the object’s area (e.g., [14]). This type of perceptual weight has to be distinguished from weights based on higher level properties such as perceptual salience, which is related to visual attention [19,20]. However, irrespective of how weight is determined, we further have to assume that persons are able to perceive the common center of ‘mass’ of all the perceptual element weights in a picture. At least for simple configurations, it has been shown that this assumption is justified [21,22].
Early experimental research on perceptual balance [7,23] tested the mechanical metaphor and found more or less support. Although the methods and procedures applied in these studies were state of the art at that time, from our perspective, they are improvable. Moreover, they were rather effortful, and therefore, only a few participants were observed. Therefore, the aim of the present study was to repeat some of the early experiments with modern methods and more participants to examine to what extent the early results are replicable.
As far as we know, the first experimental study on perceptual balance was conducted by Edgar Pierce [7] during his time as a graduate student in Hugo Münsterberg’s lab at Harvard University. Pierce was concerned with the question: “Can a feeling of symmetry, that is, of aesthetical equality of the two halves, remain when the two sides are not geometrically identical, and if so, what are the conditions under which this can result—what variations of one side seem aesthetically equal to the variations of the other side?” (p. 484).
For his experiments, he used a 100 × 100 cm board covered with a black rubber surface. It had two invisible slits from one side to the other, which were used to hold and move objects by means of a slider on the backside. In one of the simpler arrangements, the physical midline was marked with a permanent 20 cm long white line. A 10 cm long vertical line was positioned on the right half of the display at a fixed distance of 20 cm from the midline, while there were movable objects such as a star, a square, or a vertical line on the left side, respectively. The experimenter could slide the movable object alternately towards and from the midline and the participants were asked to say “stop” when it reached the most “agreeable” position. After this decision, the participants were asked whether the composition gave any aesthetical feeling of symmetry or balance.
As a result, some participants made adjustments in accord with mechanical balance. For instance, a variable short line was stopped at a greater distance from the center than a long vertical line, whereas others ignored the size differences and simply placed the variable element at the laterally symmetric location. Further persons chose locations closely related to the golden section.
Despite noting individual differences, Pierce [7] derived some general relations from his results. For instance, he concludes that a short line must be farther out than a long one, a thin line farther out than a bold line, etc. Thus, by and large, Pierce’s results can be interpreted as supporting the concept of mechanical balance.
A few years later, Ethel Puffer [23], who was also a graduate student in Hugo Münsterberg’s Harvard Psychology Lab, criticized Pierce’s [7] study for several reasons. First, by explicitly asking his participants whether the adjusted configuration was balanced, Pierce excluded any other possibility than that of mechanical balance. Second, by permanently showing a line at the center, he strongly accentuated the midline and divided the frame into two clearly visible halves. Finally, by focusing on averaged data, performance was not represented adequately, given the large individual differences.
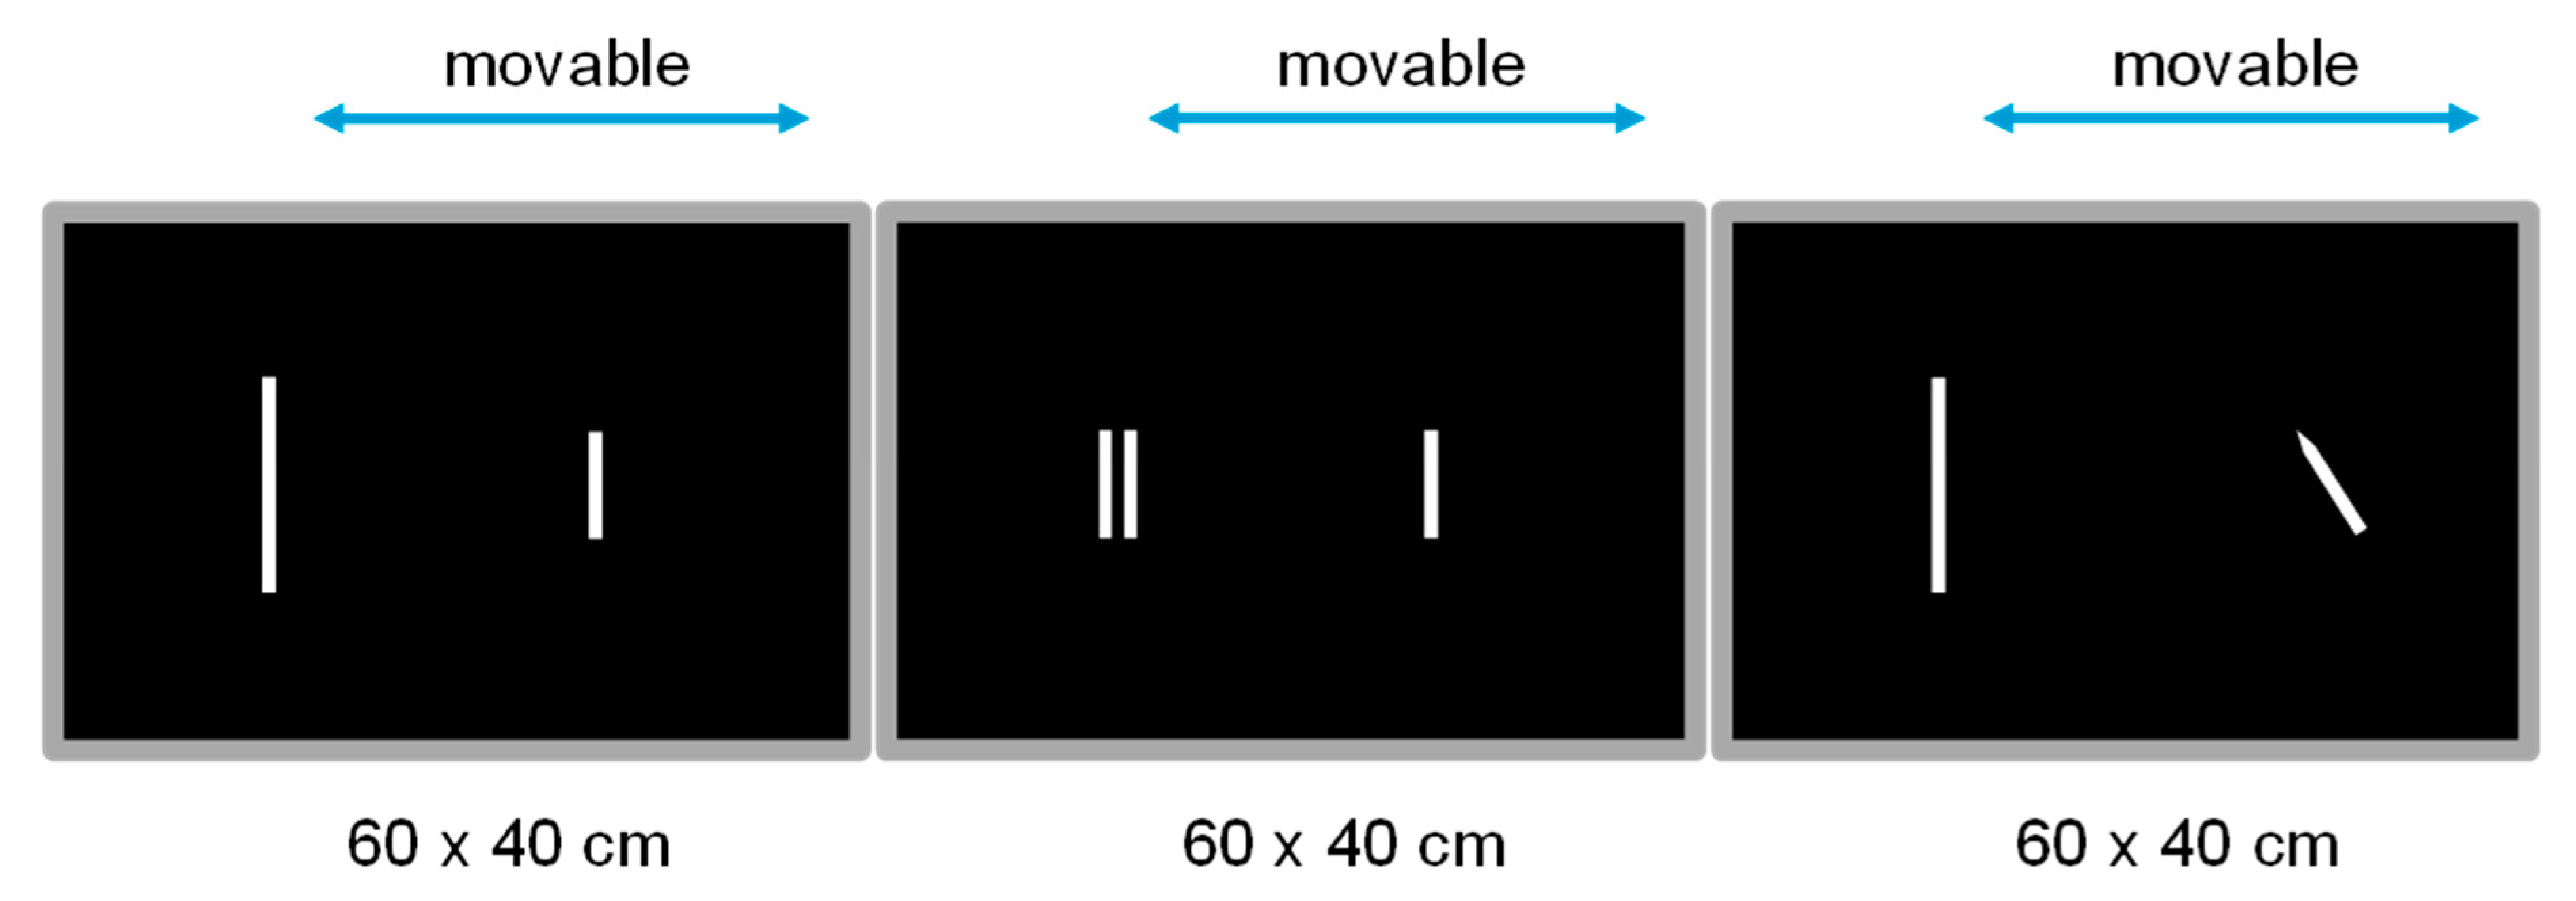
In her own study on symmetry and balance, Puffer [23] used arrangements of lines and other figures that were attached to a rectangular black surface (60 × 40 cm) with a gray frame (see Figure 1). There was a fixed element F on one side (left or right) of the surface, and a variable element V on the other side. F was placed successively at different distances from the center, respectively. In her various experiments, Puffer used elements of different size (short, long, or double lines), elements that suggested movement (oblique or curved lines), elements that arouse what she called “intrinsic interest”, i.e., attracted attention, and elements with perspective depth. In all cases, Puffer’s nine participants were asked to horizontally move the variable element V, which was always a vertical long or short line, until they found a position that made the arrangement most aesthetically pleasing. Finding such a position of V was the result of a long series of trials, so that each participant made only about ten choices per hour. They were never asked whether the resulting arrangement was balanced.
Overall, Puffer’s results provided little support for mechanical balance as a design principle. As in Pierce’s study, there were large individual differences, which is why she did not compute averages but discussed her results on an individual level. Some persons behaved in accord with mechanical balance, at least in some conditions, whereas others even placed V close to F on the same side, which is incompatible with mechanical balance.
The preferred positions also depended on the element type. Preference for mechanical balance occurred most often when F was oblique (Exp. III, see Figure 2). For lines of different sizes (Exp. I (a) and I (b), see Figure 2), in some cases there was even a reversal of mechanical balance. For instance, with a short fixed line near the center, a larger movable line was positioned at a greater distance. For double lines (Exp. II, see Figure 2), reversals were even more pronounced. However, they only occurred when mechanical balance would have brought both elements near the center of the frame. From the comments of her participants, Puffer concluded that they considered the whole picture and often tried to avoid a large black space. In any case, even if mechanical balance was reversed, the participants had a feeling of equilibrium.
In addition to the preference for mechanical balance and its reversal, there were also other preferred positions. Some of them were close to the center, while others approached bilateral symmetry. The latter, however, did not occur for double lines.
Taken together, Puffer’s results do not support mechanical balance as an important principle of aesthetic composition. Nevertheless, they have been interpreted as compatible with this metaphor (e.g., [5,24]). Since the exact role of mechanical balance for composition is still under dispute, the purpose of the current study was to repeat some of Puffer’s pioneering experiments with modern methods and a larger sample of participants.
2. Experiment 1
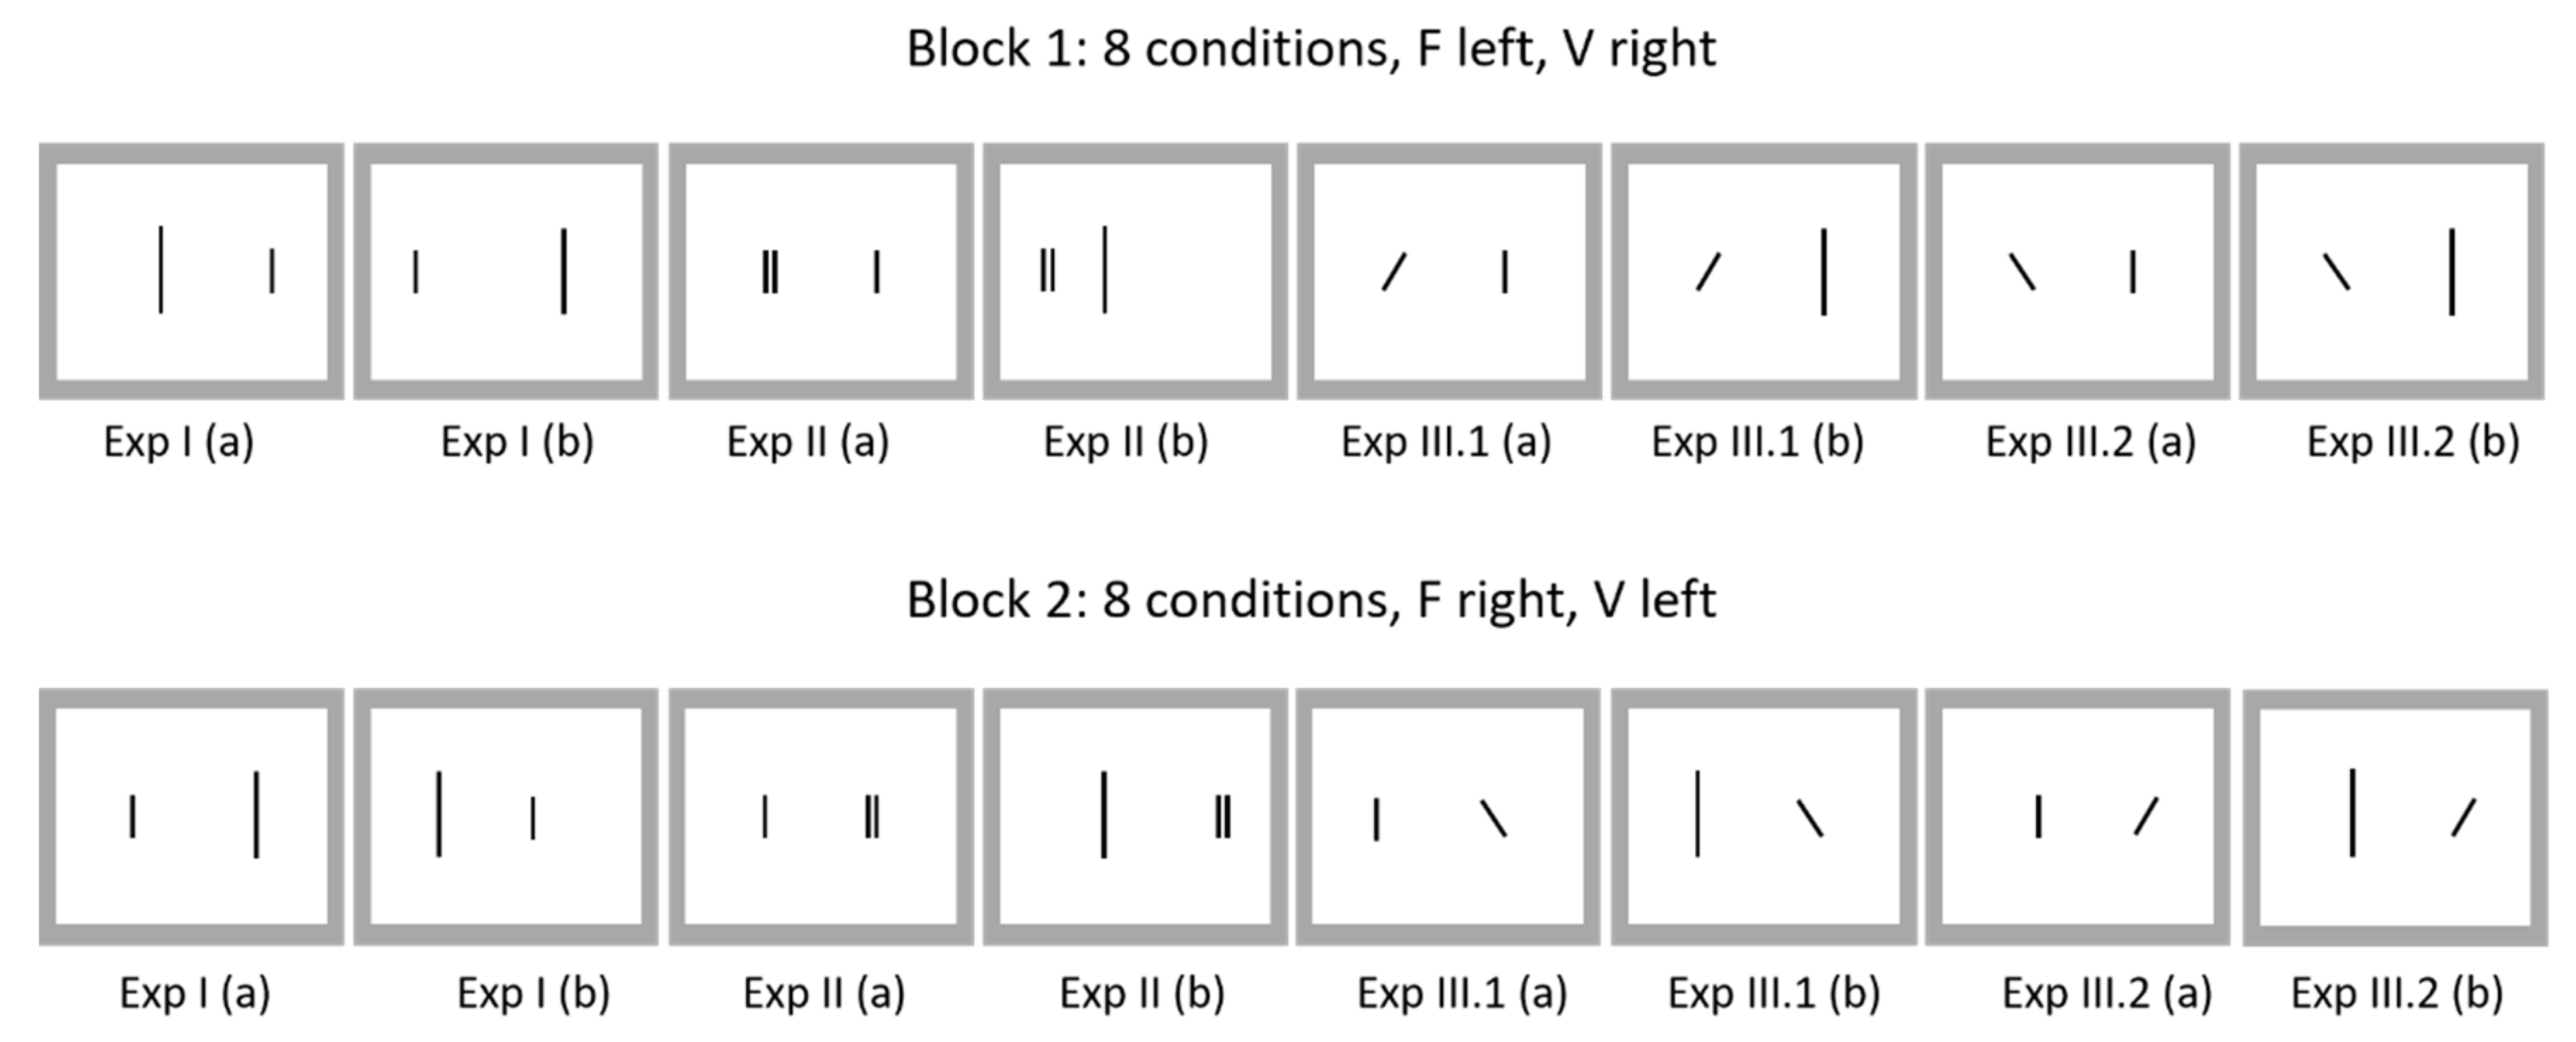
In our first experiment we wanted to repeat Puffer’s [23] experiments I to III and examine to what extent the results are replicable. Of the considered elements, one was fixed on one side at one out of five positions. As variable element V served a short or a long line on the opposite side, respectively. The task of the participants was to place V at a position so that the configuration was aesthetically pleasing. Figure 2 shows examples of the corresponding main conditions.
In view of the results of Pierce [7] and Puffer [23], we derived several hypotheses. The first one was that the concept of mechanical balance plays an important role in placing the variable element. Curiously, for some of Puffer’s conditions, F can only be balanced when V is moved to a position outside the frame. The second hypothesis concerned lateral symmetry. If we consider the distance between the midline and the location of F, then V should be placed opposite at that distance. Finally, inspired by Puffer’s results, we hypothesized that some persons prefer positions close to the fixed element, which we call “closeness”. As will be shown, after inspecting our results, we also came up with one further hypothesis to explain some preferences.
2.1. Method
2.1.1. Participants
Fifty-one persons (12 males, 39 females; mean age 25.5, SD = 7.96), mostly students from different disciplines of the University of Konstanz, were recruited via a local online system (ORSEE, [25]). For participation, they received a voucher worth €3. The study was performed in accordance with the ethical standards of the Declaration of Helsinki (1964) and its later amendments and with the ethics and safety guidelines of the University of Konstanz. Participants were informed that they are free to withdraw from the study at any point without any negative consequences. Informed consent was obtained from all participants by check-marking a box on the informed-consent page before the actual experiment started.
2.1.2. Stimuli
As fixed element F, we used one of five different element types, which had the same proportions as in Puffer: A short vertical line (10 × 80 pixels), a long vertical line (10 × 160 pixels), a double line (two lines at 10 × 80 pixels, 10 pixels apart), an oblique line (10 × 80 pixels) pointing in at 45°, and an oblique line (10 × 80 pixels) pointing out at 45°. The oblique lines were pointed at the upper end. As variable element V, the short vertical and the long vertical line were used, respectively. Each F type was combined with each of the two V types, except that of its own type, which resulted in eight conditions: Long-short, short-long, double-short, double-long, oblique-in-short, oblique-in-long, oblique-out-short, and oblique-out-long, where the first term always denotes the F type (see Figure 2 for all combinations).
For each element type, F was successively presented at one of five locations (40, 80, 120, 160, and 200 pixels from the center) along the horizontal midline, respectively. As Puffer was not clear in this respect, we decided to present the center of F at these locations. Consequently, the inner edge distance could differ between different F, e.g., between single-line and double-lines. The five F locations combined with the eight F–V combinations resulted in 40 different conditions. Additionally, there was a left (F-left, V-right) and a right (F-right, V-left) version, as in Puffer’s study. The stimulus area (without gray frame) had an extension of 600 × 400 pixels and was horizontally centered on the screen with a light blue background (see Figure 3).
2.1.3. Procedure
The program for the online experiment was written in Javascript. Participants could choose between German and English instructions. They were asked to use a notebook or desktop computer and instructed how to scale their browser window (full-screen mode) so that all relevant elements were optimally visible. The actual experiment started with a short instruction that informed about the task and continued by requiring the participants to work through two main blocks (F-right, F-left) at 40 stimuli, whose order was randomized. Within each block, the eight element-type combinations were presented in a randomized order. The five different locations for F for each combination, however, were always presented in a stepwise manner from the location closest to the center to the most outward location.
Participants’ task was to move V with the computer mouse (via drag and drop) to a position that produced the most pleasing arrangement. V could be moved horizontally anywhere between the location of F and the opposite gray border with a minimum distance of 2 pixels to the fixed element and to the frame, respectively. The initial position of V was chosen randomly within that range. There was no time limit. The participants could end a trial and forward to the next one by pressing a NEXT-button. However, this was possible only after they had moved V. At the end, the participants had the opportunity to write a comment. Altogether, the experiment lasted about 12 to 15 min.
2.2. Results
Fifty-one participants completed the online experiment. Unfortunately, due to technical issues, some data were missing. As a consequence, the data of four persons were discarded completely. Of the remaining 47 persons (11 males, mean age 25.09, SD = 7.43), six had missing data for the F-right block and five for the F-left block, respectively. Therefore, 41 data sets were analyzed for F-right, and 42 data sets for F-left. Data are complete for 39 participants. A first analysis revealed that the data from the two blocks F-left and F-right are rather similar, as has also been the case in Puffer’s [23] study. Therefore, the positions in the F-right data were mirrored and added to the F-left data, resulting in 83 data sets.
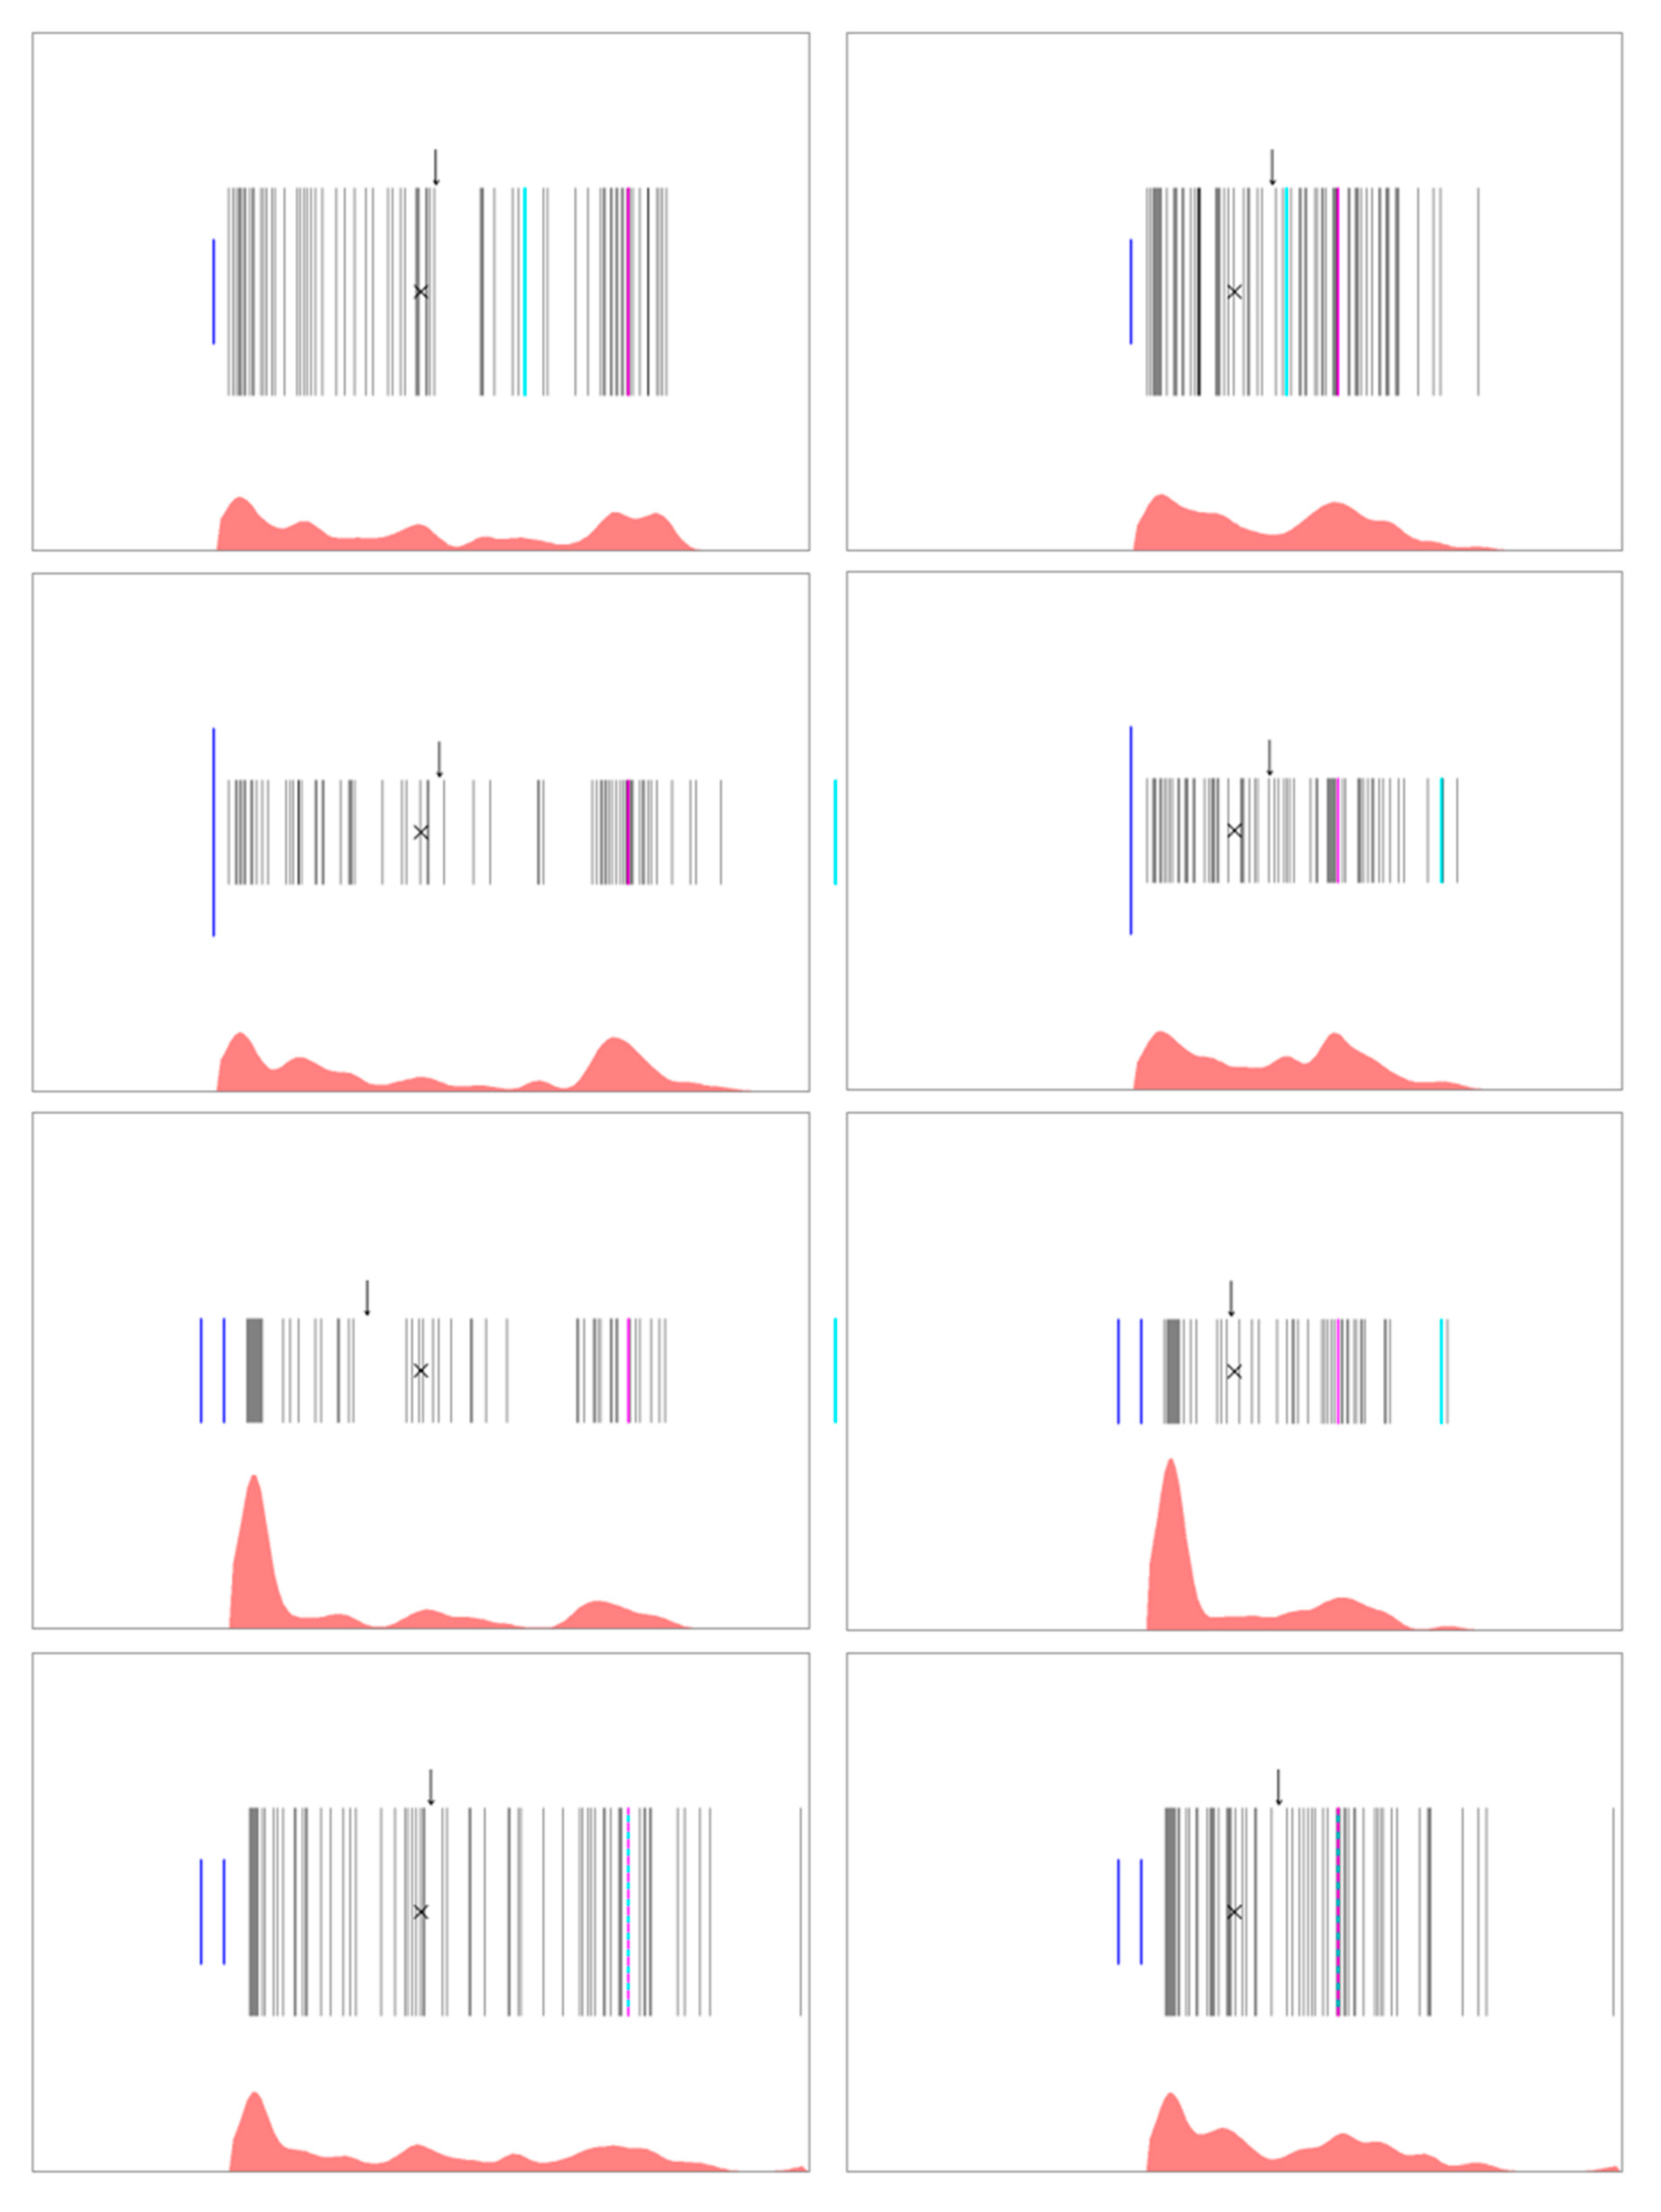
Example data are shown in Figure 4, where each row shows the data for two different locations of F for all eight conditions, respectively. As can be seen, the lines are not uniformly distributed. Rather, as expected, they cluster at some locations. To see to what extent the clusters coincide with our hypotheses, we computed the corresponding positions and marked them in the figure by thick colored lines. To calculate the positions for mechanical balance, we used the simple gray-value integration method (see above). Merely for the closeness hypothesis, we show no marks, because there was no single location.
As mentioned above, for the two most outer F positions (160 and 200 pixels) in the long-short and double-short conditions, there are no positions for mechanical balance within the frame. Moreover, for double-long and the oblique-short conditions, the positions for mechanical balance and symmetry coincide.
By visually inspecting the data in Figure 4 alone, one can already see that the lines do not cluster around the positions for mechanical balance (turquoise line). In most of the conditions there is some clustering around the symmetry position. Most striking, though, is the frequent occurrence of closeness, i.e., the clustering near F, which is especially pronounced for the double-line element. The small down-pointing arrows above the V areas indicate the mean of the adjusted locations. The means clearly support Puffer’s critique to Pierce [7] that they do not represent the performance of the participants.
By visual inspection, we also had the impression that in some cases, participants placed the line at the center of the frame. Therefore, we also tested this hypothesis.
2.2.1. Testing the Hypotheses
Although the validity of some of our hypotheses can already be assessed by visual inspection, we also wanted to do some statistical tests. For this objective, we considered the adjusted line positions for each condition as a spatial point (line) pattern [26]. Specifically, we assumed that the lines were placed in accordance with an inhomogeneous Poisson process. For such a process, the number of points that one can expect in a given region is expressed by its intensity function. For a homogeneous process the intensity is constant across all regions. This is certainly not the case for our data. To estimate the intensity for each region, we applied the R [27] function “density.ppp” from the library “spatstat” [26], where the standard deviation (sigma) of the smoothing kernel was set to 10. The results are shown as intensity plot at the bottom of each panel in Figure 4. The estimated intensity is more informative than the shown lines, because multiple lines might superimpose at some positions.
For testing our hypotheses, we analyzed whether the region of interest for a hypothesis has a higher mean intensity, i.e., contains more points (lines), than the outer region. As the region of interest, we defined 10% of the adjustment range around the position of the respective hypothesis. The intensity in this region was contrasted with that of the same size surrounding this region. One exception was closeness. For this hypothesis we used the range (10%) next to F as region of interest and contrasted its intensity with the range (10%) next to that region. By this method, we were able to detect local clusters. For testing whether the intensity in the region of interest was significantly higher than that in the outer region, we applied the R-function “poisson.test”.
All four hypotheses were tested separately for all eight element conditions, where we considered only three out of the five F locations: 80, 120, and 160 pixels, respectively. One reason for this selection was that the regions of interest of some hypotheses overlap, depending on the length of the adjustment area. The possible overlap is greatest for the F location closest (40 pixels) to the center. To reduce the overlap, we excluded this condition from the analysis. We also excluded the 200 pixel location, because here the position for mechanical balance was outside the frame for the conditions long-short and double-short. Moreover, for these two conditions, the location for mechanical balance was also outside the frame for the 160 pixel location. Therefore, for these two conditions we excluded this F location and included the innermost F location (40 pixels) instead. Thus, for each of the eight main conditions, we considered three out of the five F locations. It should also be noted that for some conditions, the positions for mechanical balance and symmetry coincide (for examples see Figure 4).
For each hypothesis, we performed a Poisson test (α = 0.05) for each of the eight main conditions and the respective three F locations, to see whether more lines were positioned in the corresponding region of interest than in the surrounding region. Since it would have been very cumbersome to consider each of the 24 tests for each hypothesis individually, the outcomes were summed over the main conditions and considered F locations. The results are listed in Table 1, where the single-digit numbers represent the number of significant differences (max = 3 for each main condition, max = 24 overall) between the region of interest and the outer region. The numbers in parenthesis are the corresponding summed numbers of lines.
As can be seen in Table 1, for mechanical balance, the differences were significant only for three of the 24 tests. More specifically, they occurred only in conditions 5 and 7. In these conditions, F was an oblique line and V a short line, respectively. Thus, in these cases the regions of interest for balance and symmetry were overlapping. The region of interest for symmetry was significant in six of the 24 tests, mostly, when V was short, but not when F consisted of double lines. Closeness was produced most frequently (significant in 14 of 24 tests), especially in conditions, where F was a double line or F was oblique and V was short. Centering was produced in nine of the 24 conditions. It should be noted, however, that one of the significant tests occurred in the double-short condition, where we included the F location closest to the center, for which the region of interest was rather similar to that for closeness.
The large number of tests for each hypothesis might be considered as problematic, because of the inflation of false positives. For the present number of 24 tests, this means that, given our significance level of 5%, one test can be expected to be significant due to an alpha error. However, because the situation is the same for all hypotheses, their comparison should nevertheless be meaningful. Moreover, we also tested the difference in the number of lines between the inner and outer regions for each hypothesis across all main conditions and F locations. For these overall tests the risk of false positives does not inflate. The results are shown in the last row in Table 1. For balance we have a rate ratio of 1.18, p = 0.057, for symmetry of 1.73, p < 0.001, for closeness of 4.96, p < 0.001, and for centering of 1.94, p < 0.001. The latter also remains significant (ratio = 1.66, p < 0.001), if we exclude the problematic double-short condition.
2.2.2. Adjustment Times
We also registered how much time the participants spent on their adjustments. Since some adjustment times were rather long (max = 4 h), presumably due to a long break between two adjustments, and others quite short (min = 1.54 s), we trimmed the data by excluding the 2% shortest and 2% longest adjustment times for each condition. The resulting mean adjustment times and their standard deviation (in parenthesis) for the eight conditions are: 5.88 (3.44), 5.87 (3.19), 6.21 (3.22), 5.93 (3.04), 5.57 (3.52), 5.58 (3.51), 5.83 (3.96), and 5.57 (3.56) s. Their average is 5.80 s (3.43 s). Summing up the adjustment times over all trials resulted in 7.74 min.
2.2.3. Individual Performance
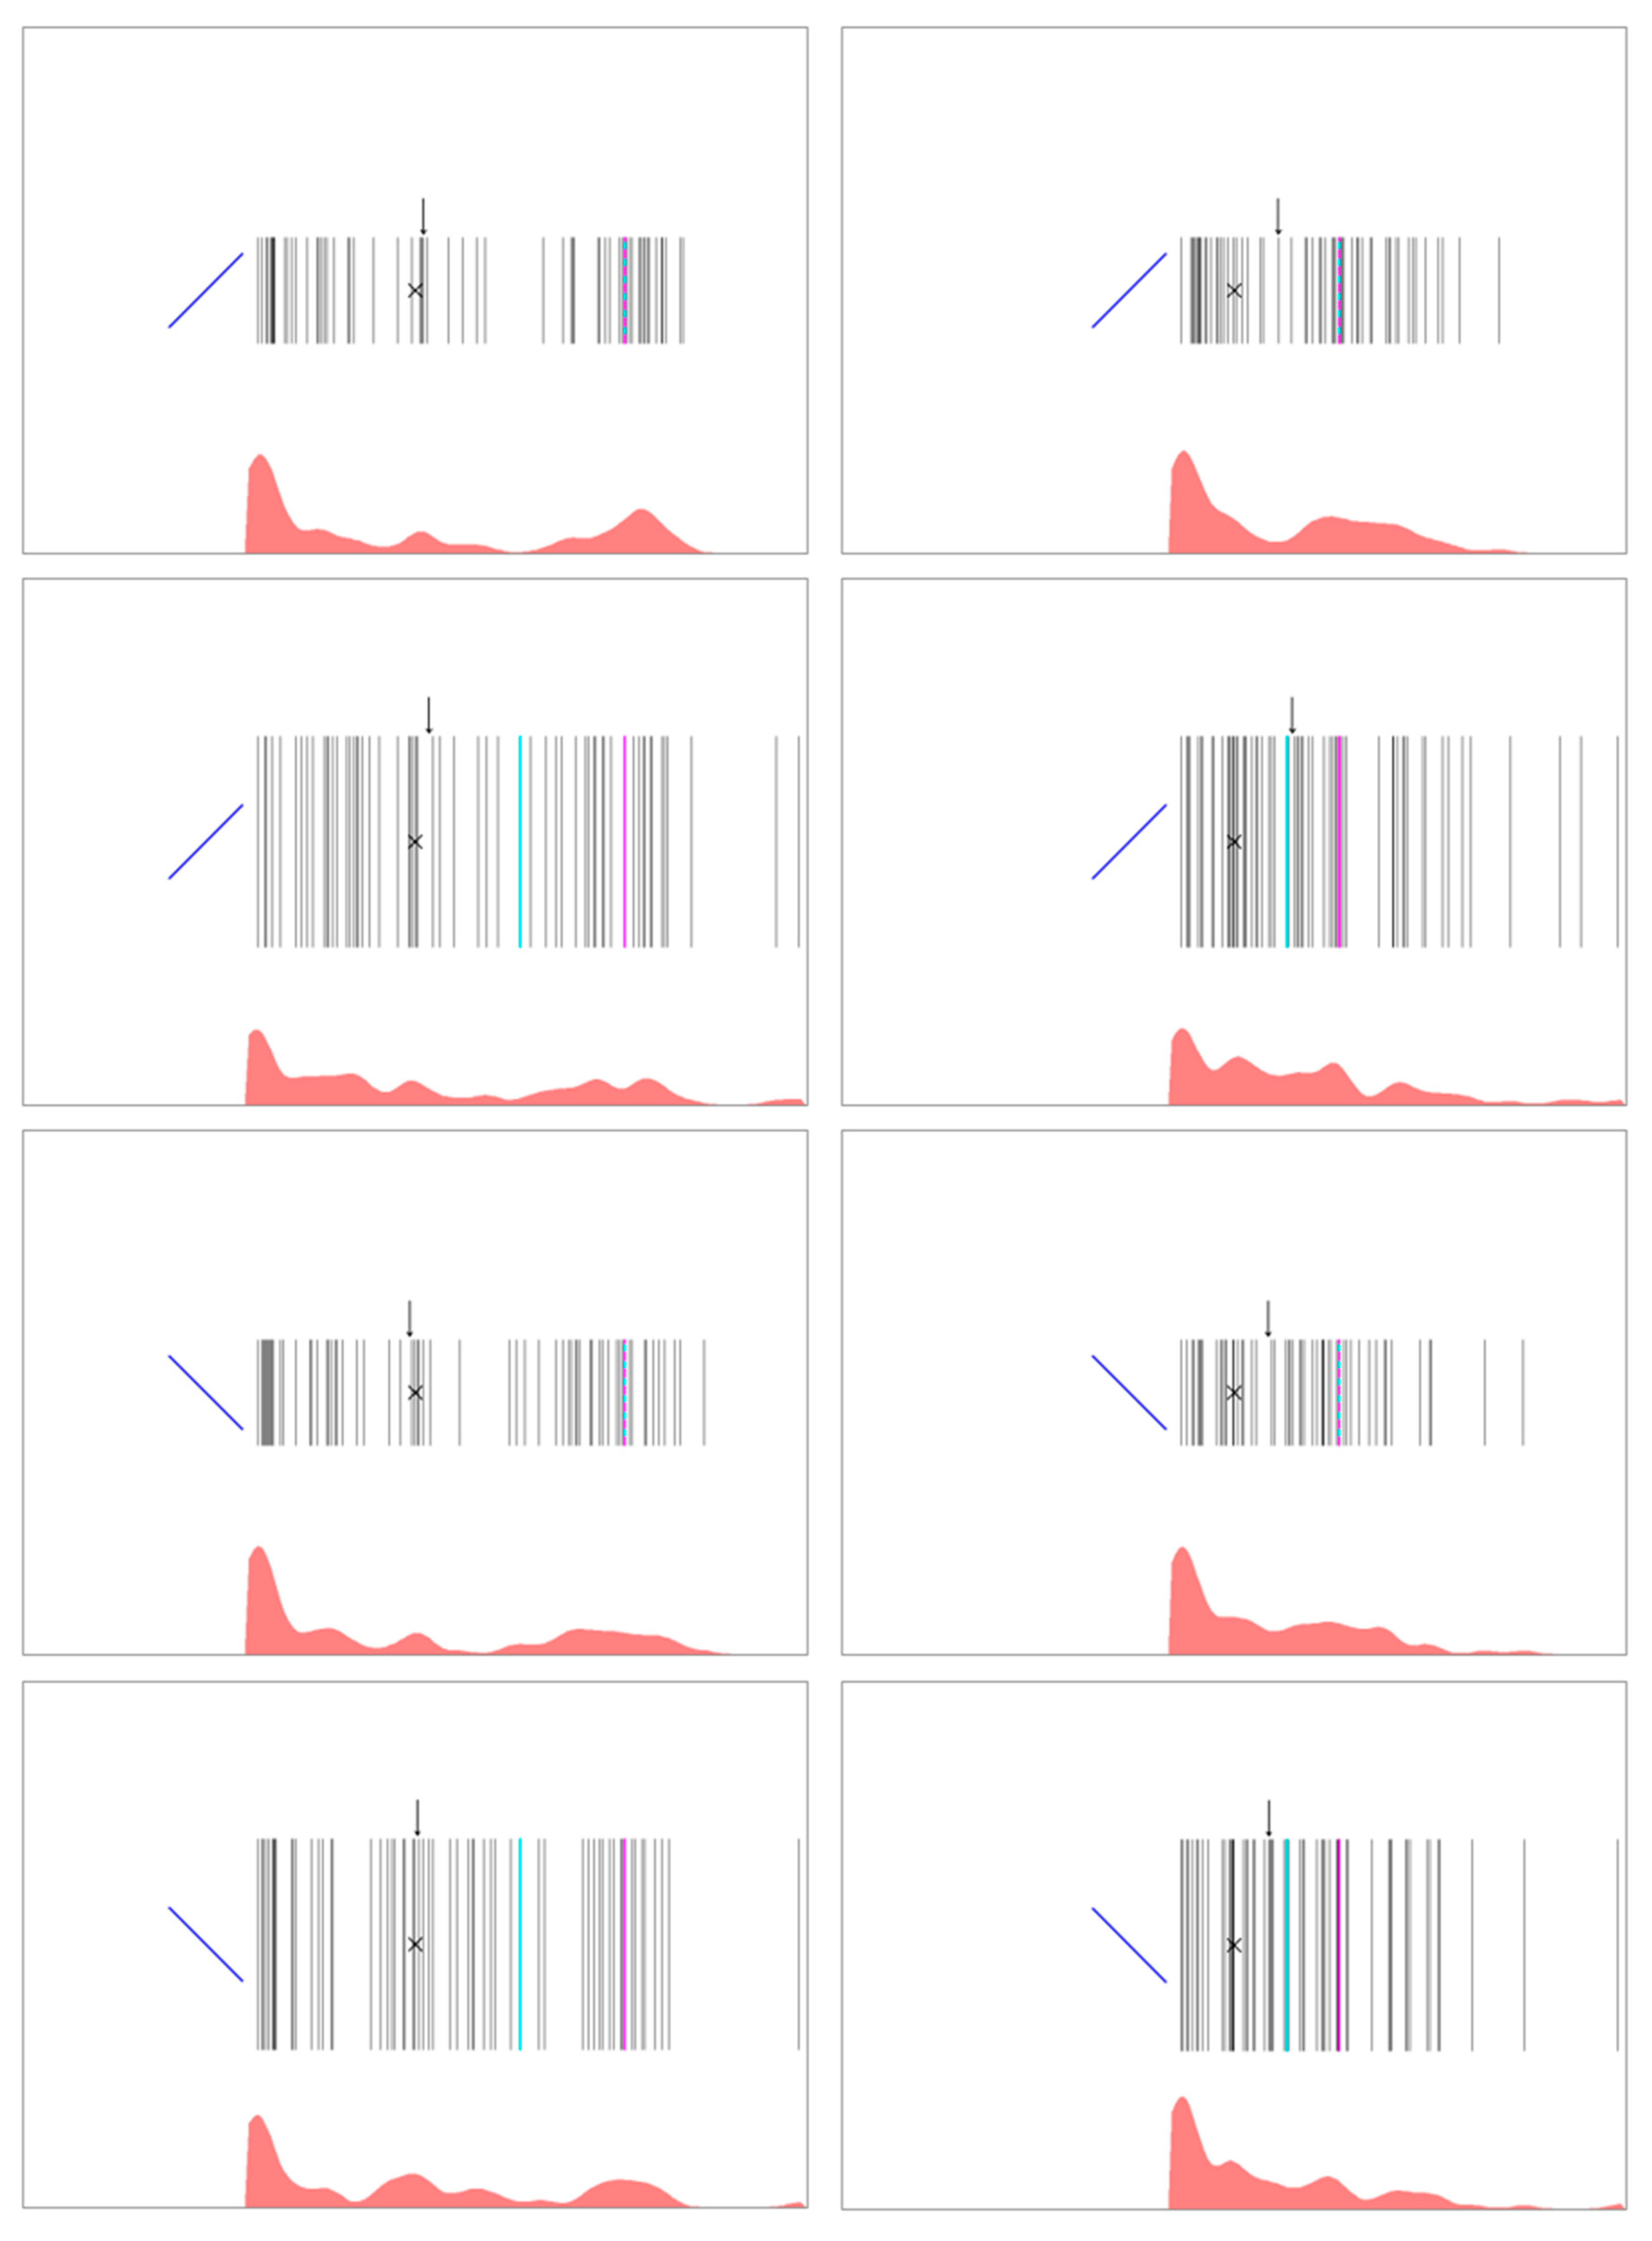
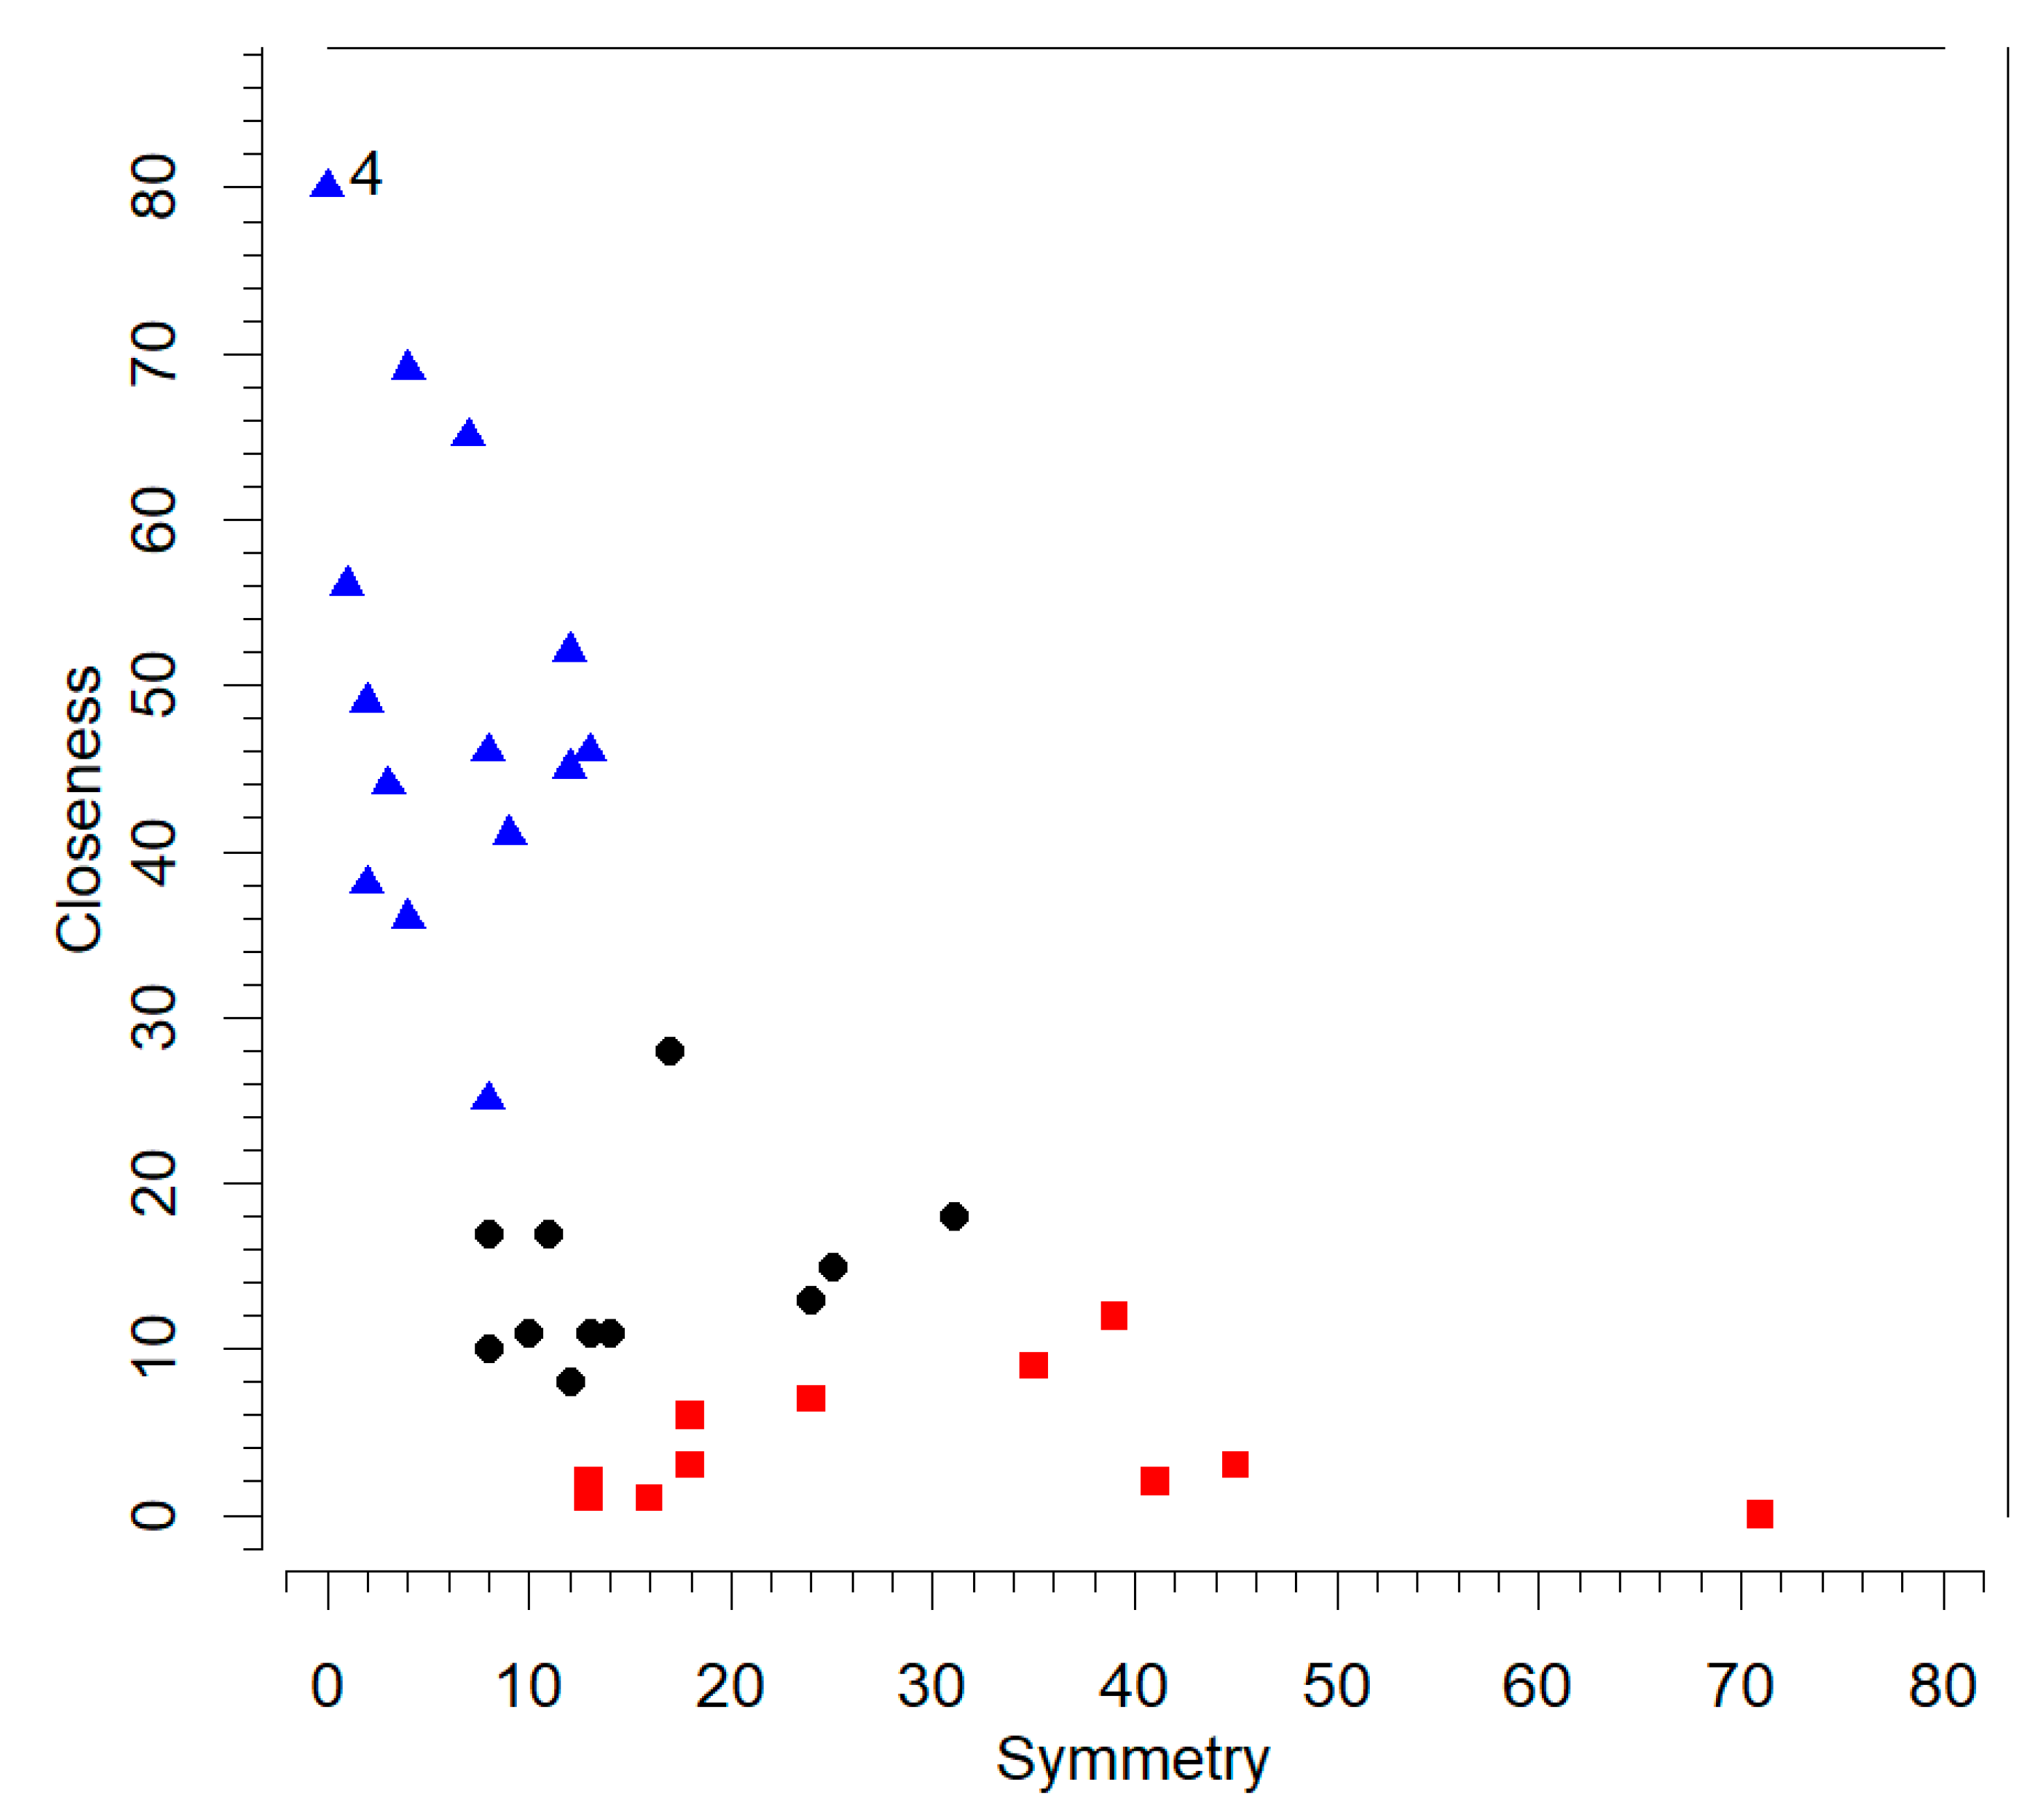
We also explored individual performance to see how consistent each participant positioned the lines. The individual data for two example conditions are shown in Figure 5. With such data, we analyzed which strategies the individual participants applied, but only with respect to the most prevalent strategies: Symmetry and closeness. To categorize the produced positions, we used the same regions of interest as before (see also Figure 5). For testing which strategy the individuals preferred, we tested the difference in production, again with the R-function “poisson.test”. As a result, we found that 11 persons produced more positions according to symmetry than to closeness, whereas 17 showed the opposite pattern (see Figure 6). Eleven persons could not be assigned to either of the two strategies. It should be noted that these classifications only mean that participants chose one of these two strategies significantly more often than the other one.
2.3. Discussion
Although our participants took only seconds for each line adjustment rather than minutes, as in Puffer’s [23] study, the data are similar in several aspects. First of all, there is little evidence for mechanical balance as a strategy for creating pleasing compositions. Although there was a significant number of corresponding adjustments in the two oblique-short conditions, this can also be explained by symmetry, as the locations predicted by the two hypotheses coincided for these conditions. Since symmetry was also used as a strategy in other conditions, it is likely that the positions in the oblique-short conditions were not produced to realize mechanical balancing, but symmetry.
Symmetric configurations were produced for at least one F location in five of the eight main (element-type) conditions, while closeness occurred in six of the main conditions. If we consider the test for all three F locations in each of the eight main conditions, then 14 of the 24 tests (eight main conditions × three F locations) are significant for closeness, but only six for symmetry. Symmetry was mainly produced when V was short, but not when F consisted of double lines. The latter was also observed by Puffer [23].
Although closeness has already been reported by Puffer [23], we were surprised by its frequency in our results. It was very frequently produced in conditions, where F was a double line or an oblique line, and V was short, i.e., when the length of all line elements was similar. Concerning our ex-post-facto centering hypothesis, the analyses revealed that this strategy was applied in nine of the 24 conditions. However, the regions of interest overlapped in some conditions (where F was near the center) with that of closeness.
The dominance of closeness was also reflected by individual performance. In contrast, only less than one third of the persons preferred symmetry over closeness. Moreover, the dominance of the preferred strategy was much more pronounced in the first group. About one third of participants applied both strategies equally often. It should be noted that Figure 6 can also be used to assess how frequently other strategies were applied. For instance, if a person produced closeness on 30 trials and symmetry on 16 trials, then the difference to 80, i.e., 34, gives the number of trials where another strategy was used.
Taken together, our data indicate that, although symmetry and centering were also applied as principles of good composition, closeness occurred by far most frequently. A possible reason for this unexpected result could have been that the distance of F from the center increased stepwise for each element type of V. Consequently, at the beginning of a given main condition, F appeared near the center, so that for various reasons the participants also placed V close to the center, which might have produced some nice configurations. When F was then sequentially placed further away from the center, many participants could have wanted to maintain the configuration. Therefore, closeness could be the result of a carry-over effect from the first trial in a condition to the subsequent trials.
Although Puffer [23] also increased the distance of F from the midline in a stepwise manner, we reasoned that the corresponding effect on closeness was stronger in our case, because the much shorter adjustment times might have favored carry-over effects. To test whether this was indeed the case, we conducted a second experiment.
3. Experiment 2
This experiment was similar to Experiment 1, except that all trials, i.e., also the F locations, were randomized in each block. If positional carry-over effects between trials have been responsible for the frequent closeness in our first experiment, then this principle should be applied less frequently in the present experiment.
Moreover, because we proposed the centering hypothesis only ex post facto in Experiment 1, this experiment was also an opportunity to see whether this result can be replicated.
3.1. Method
Forty persons (14 males, 26 females; mean age 24.2, SD = 6.20), mostly students from different disciplines of the University of Konstanz, were recruited via our local online system as in Experiment 1. They participated for a voucher worth €3. No participant had previously participated in Experiment 1. The procedure was identical to that of Experiment 1, except that the F locations were randomized.
3.2. Results
The data set of one participant was incomplete due to technical issues, and additionally three participants reported a small displacement between the variable line and the mouse cursor. Therefore, their data were excluded from the analysis (remaining 36 participants: 14 males, mean age 24.3, SD = 6.52).
The data were analyzed in the same way as in Experiment 1. The results of the statistical tests with respect to the four hypotheses are shown in Table 2. As can be seen, tests for mechanical balance are significant only in one of 24 conditions tested, and this was a condition where the location for balance coincides with that for symmetry. Whereas symmetry was significant four times, closeness was again by far the most frequently applied strategy (11 of 24 test were significant). The majority of significant tests occurred with oblique F and short V, but again also for double-line F. This time, centering was significant only in two main conditions, and only for one F location, respectively. One of these conditions was double-short, where we included the F location closest to the center. Insofar, this result should be taken with care.
Concerning our overall analyses, the rate ratios for balance was 1.14, p = 0.161, for symmetry 1.51, p < 0.001, for closeness 4.63, p < 0.001, and for centering 1.65, p < 0.001. Even if we ignore the problematic double-short condition for the latter strategy (see above), the ratio is still significant, 1.43, p < 0.001.
3.2.1. Adjustment Times
The trimmed mean adjustment times for the eight conditions were: 5.21 (2.70), 5.29 (3.05), 5.66 (2.94), 5.60 (3.36), 4.84 (2.90), 5.12 (3.58), 5.08 (3.27), and 4.90 (2.88) s. Their average is 5.21 s (3.09 s). Across all trials, the adjustment times sum up to 6.95 min.
3.2.2. Individual Performance
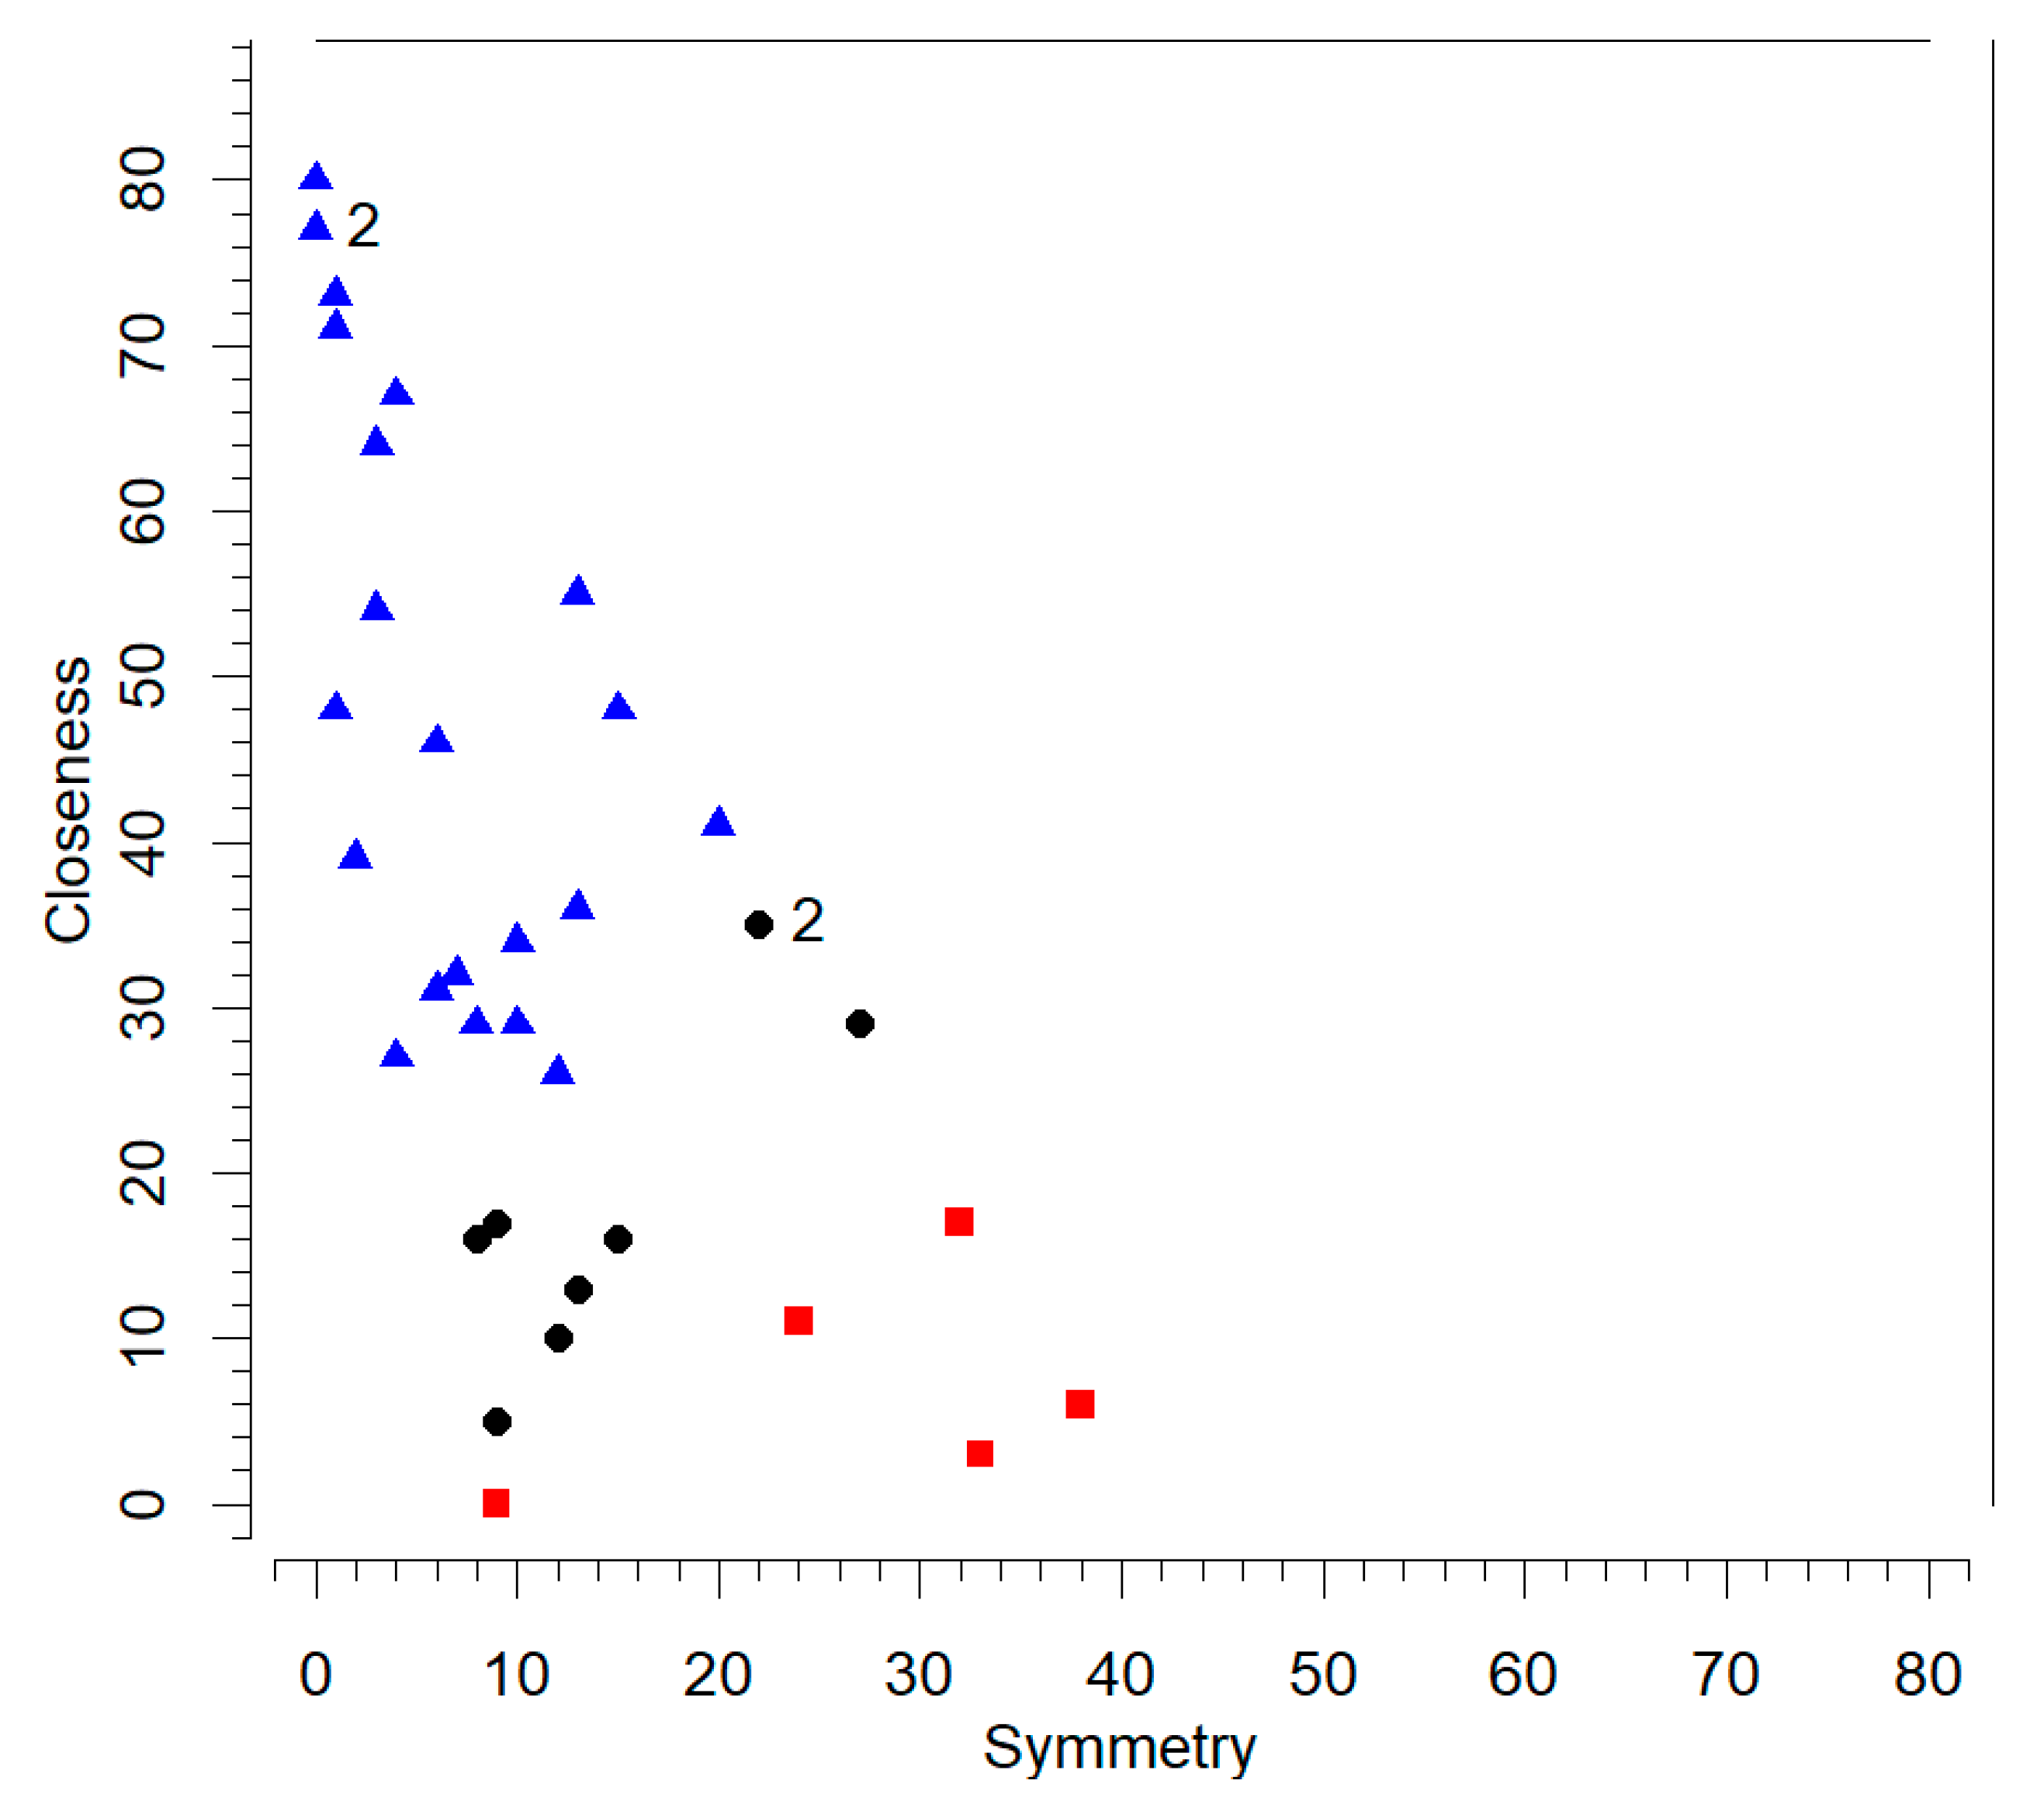
As in the previous experiment, we analyzed how many participants preferred the symmetry or closeness strategy. As a result, five persons produced a symmetric arrangement more often, whereas 22 placed more lines in accord with the closeness hypothesis. Nine persons could not be assigned to either of the two strategies. Figure 7 illustrates these findings.
3.3. Discussion
Even though the F locations were randomized in this experiment, the results are, by and large, similar to those from the previous experiment. Different from our expectation, closeness was not only again the most frequently applied strategy, its dominance was even more pronounced than in Experiment 1. The analysis of the individual data revealed that more than half of the participants (22 of 36) preferred closeness over symmetry. These results demonstrate that the frequency of closeness in Experiment 1 was not due to carry-over effects caused by the stepwise increase of the distance between the fixed element and the midline.
Symmetry and centering also occurred less frequently than in our previous experiment. Centering was significant only in two tests, compared to nine tests in Experiment 1. Nevertheless, the overall tests were again significant for both strategies, indicating that they still played some role. In line with Experiment 1, there was again no evidence for the application of mechanical balance.
4. General Discussion
The aim of the present study was to repeat some of the experiments on symmetry and balance conducted by Ethel Puffer [23] more than a century ago. She used a large (60 × 80 cm) board with an element of a certain form attached on one side at a fixed location and asked her nine participants to position a variable line so that the configuration was aesthetically most pleasing. Here, we updated her method and used an online experiment, where the variable line had to be moved on a screen with a computer mouse. A first striking difference in performance between the two experiments was that Puffer’s participants took about 6 min for each adjustment, whereas ours spent only about 5 s. Despite these large differences in adjustment times and the whole setup, some of the results obtained in Experiment 1 were similar.
First of all, as in Puffer, we found little to no evidence for the application of mechanical balance as a principle for producing aesthetically pleasing compositions. Rather, geometric symmetry was applied as principle, in the sense that participants often moved the variable element to a position that was laterally symmetric to that of the fixed element, but without paying attention to size and form differences between the fixed and variable elements. A similar performance was observed by Pierce, [7] as well as by Puffer [23]. A possible reason of why size and form differences were largely ignored could have been that they were relatively small. This is supported by the fact that symmetry was practically absent for double lines, which differed most in this respect. That lateral symmetry played an important role as design principle might have several reasons. For instance, there is not only a relatively high general preference for symmetry, it is also relatively easy to realize. This corresponds to the idea that people prefer symmetry, because it facilitates fluent processing, which generates positive subjective feelings [28].
Furthermore, after visual inspection of our data, we had the impression that participants often placed the variable line at the center of the frame. Therefore, we also considered centering as a strategy, which was confirmed by our statistical analysis.
An unexpected result was that the variable line was often placed very close to the fixed element. Although Puffer had already reported that some of her participants placed the variable line near the fixed element, it occurred by far not as frequently as in our experiment. Here, closeness occurred for almost all element types. Moreover, the analysis of individual performance revealed that several participants exclusively used closeness as a strategy. Moreover, more participants preferred closeness over symmetry than vice versa. How can the strong tendency to produce closeness be explained? Puffer concluded from comments of her participants that they wanted to construct a configuration without necessarily forming a figure. Moreover, for them the clustered elements were set off against the blackness on the other side. Puffer had the impression that the black space on the opposite side had some meaning such as a deep vista or an expanse of sky.
Although Puffer’s account of closeness is interesting, we questioned that it accounts for the frequent application of this principle in our first experiment. Therefore, we hypothesized that the stepwise increase of the distance between the fixed element and the midline in combination with the short adjustment times might have produced carry-over effects from the shortest distance, where closeness is an obvious strategy, to longer distances.
To test our hypothesis, we conducted a second experiment, which was similar to the first one, except that the location of the fixed element and the element type were randomized across trials. As a result, the number of significant tests decreased substantially for all of our hypotheses (from 29 in Experiment 1, to 17 in Experiment 2, counting tests for overlapping hypotheses only once). The largest decrease occurred for centering, which was now practically absent. However, different from our expectation, closeness occurred again very frequently. The relative number of persons that preferred closeness over symmetry even increased. These results indicate that the stepwise procedure had an effect on the frequency of use of specific design principles, but that it was not responsible for the strong tendency in Experiment 1 to produce compositions based on closeness.
What else could explain the high frequency of closeness in our experiments? One reason might be that this principle was also relatively easy to apply, presumably, even easier than symmetry, and therefore strongly met the needs of our participants who are used to act quickly on the computer. However, an alternative and more plausible account is to assume that the participants adopted a specific perspective. The comments given by our participants suggest that some of them took a local perspective, i.e., focused more on composing a pleasing configuration from the elements, which usually resulted in closeness, while others adopted a global perspective and tried to produce a pleasing picture as a whole. Given these two perspectives, it is reasonable to assume that our computer-based method, where the participants had to focus on the variable line to drag it to another position, and where we had no control of the viewing distance, favored a local perspective, and, therefore, the production of closeness. The situation might be similar to drawing, where a local focus is also particularly useful [29]. This account might explain the difference between our and Puffer’s results with respect to the frequency of closeness.
As already mentioned, similar to Puffer, we found only weak support for mechanical balance—at least if one does not assume empty space to have perceptual weight. This result could also have been due to our specific method. Both Puffer’s and our study applied the method of production, which is one of the three methods, besides the method of choice and the method of use, proposed by Fechner [30]. The method of production has the advantage that it offers a large range of possibilities. In contrast, if the method of choice is applied for investigating balance, the researcher presents a more and a less balanced configuration and asked the participants which one they prefer. In such situations the more balanced one is usually preferred, and it is concluded that balance is important, and that people generally prefer balanced pictures. The present study, however, shows, as did Puffer’s study a century ago, that even for relatively simple arrangements, almost no person produces mechanically balanced configurations, when she or he is free also to apply other principles. One reason could be that balance is more difficult to produce than symmetry and closeness. Perhaps, art experts might have produced more balanced compositions, because of their knowledge about balance, and because they prefer symmetry less than non-experts [31,32].
If the positive role of mechanical balance for liking was only measurable in settings where all other variables are held constant, the importance of balance as a design principle was largely reduced. However, the attraction of balance as an aesthetic principle might depend on the applied method and the stimuli. As mentioned in the Introduction, more recent experiments did not restrict their investigation to the horizontal balance of simple elements, but examined to what extent the center of mass of multiple and more complex elements deviates from the center of the frame irrespective of direction [10,11,12,13,14,15,16]. All these studies find support for a positive relation between balance and liking.
Interestingly, also for this two-dimensional approach, there is a study that used the method of production. Locher et al. [33] asked their participants to construct interesting and pleasant designs from nine identical shapes of different sizes within a square frame located on a table. As a result, for most of the compositions the center of gravity was close to the geometric center of the frame.
Taken together, these results indicate that the answer to whether balance is an important design principle or not, depends on the stimulus material and the specific task. If multiple elements can be positioned freely in a frame, then mechanical balance is usually taken into account. In this case the geometric center of a display functions as an “anchor” around which the construction is organized [2]. However, if there are only two elements in a frame, and one of them is fixed on one side, and the other can be moved along the horizontal midline only, then there are other, more attractive principles for designing a pleasing composition, such as closeness and lateral symmetry of the location of these two elements no matter whether the composition as a whole is balanced or not.
Author Contributions
Conceptualization, R.H. and K.T.; Methodology, R.H. and K.T.; Software, R.H.; Validation, R.H. and K.T.; Formal analysis, R.H.; Investigation, R.H.; Resources, R.H.; Data curation, R.H.; Writing—original draft preparation, R.H.; Writing—review and editing, K.T. and R.H.; Visualization, R.H. and K.T.
Funding
This research received no external funding.
Acknowledgments
We thank Martin G. Fillinger for his helpful comments.
Conflicts of Interest
The authors declare no conflict of interest.
References
- Ross, D.W. A Theory of Pure Design: Harmony, Balance, Rhythm; Houghton, Mifflin: Boston, MA, USA, 1907. [Google Scholar]
- Arnheim, R. The Power of the Center: A Study of Composition in the Visual Arts; University of California Press: Berkeley, CA, USA, 1983. [Google Scholar]
- Bouleau, C. The Painter’s Secret Geometry: A Study of Composition in Art; Dover Publications Inc.: Dover, Kent, UK, 2014. [Google Scholar]
- Kandinsky, W. Point and Line to Plane; Dearstyne, H.; Rebay, H., Translators; Dover Publications Inc.: New York, NY, USA, 1926/1979. [Google Scholar]
- Langfeld, H.S. The Aesthetic Attitude; Harcourt Brace & Company: New York, NY, USA, 1920. [Google Scholar] [CrossRef]
- Pecchinenda, A.; Bertamini, M.; Makin, A.D.J.; Ruta, N. The Pleasantness of Visual Symmetry: Always, Never or Sometimes. PLoS ONE 2014, 9, e92685. [Google Scholar] [CrossRef]
- Pierce, E. Studies from the Harvard Psychological Laboratory (II): The aesthetics of simple forms. I. Symmetry. Psychol. Rev. 1894, 1, 483–495. [Google Scholar] [CrossRef]
- Locher, P.J.; Nodine, C. The perceptual value of symmetry. Comput. Math. Appl. 1989, 17, 475–484. [Google Scholar] [CrossRef]
- Locher, P.J. Contemporary experimental aesthetics: Procedures and findings. In Handbook of the Economics of Art and Culture; Victor, A.G., David, T., Eds.; Elsevier: Amsterdam, The Netherlands, 2014; Volume 2, pp. 49–80. [Google Scholar]
- Hübner, R.; Fillinger, M.G. Perceptual balance, stability, and aesthetic appreciation: Their relations depend on the picture type. i-Perception 2019, 10, 1–17. [Google Scholar] [CrossRef] [PubMed]
- Fillinger, M.G.; Hübner, R. The relations between balance, prototypicality, and aesthetic appreciation for Japanese calligraphy. Empir. Stud. Arts 2018. [Google Scholar] [CrossRef]
- Hübner, R.; Fillinger, M.G. Comparison of objective measures for predicting perceptual balance and visual aesthetic preference. Front. Psychol. 2016, 7, 335. [Google Scholar] [CrossRef]
- Wilson, A.; Chatterjee, A. The assessment of preference for balance: Introducing a new test. Empir. Stud. Arts 2005, 23, 165–180. [Google Scholar] [CrossRef]
- McManus, I.; Stöver, K.; Kim, D. Arnheim’s Gestalt theory of visual balance: Examining the compositional structure of art photographs and abstract images. i-Perception 2011, 2, 615–647. [Google Scholar] [CrossRef]
- Thömmes, K.; Hübner, R. Instagram Likes for Architectural Photos Can Be Predicted by Quantitative Balance Measures and Curvature. Front. Psychol. 2018, 9. [Google Scholar] [CrossRef]
- Locher, P.J.; Gray, S.; Nodine, C. The structural framework of pictorial balance. Perception 1996, 25, 1419–1436. [Google Scholar] [CrossRef]
- Pierce, E. Studies from the Harvard Psychological Laboratory (V): The aesthetics of simple forms. II. The functions of the elements. Psychol. Rev. 1896, 3, 270–282. [Google Scholar] [CrossRef]
- McManus, I.; Edmondson, D.; Rodger, J. Balance in pictures. Br. J. Psychol. 1985, 76, 311–324. [Google Scholar] [CrossRef]
- Jahanian, A.; Vishwanathan, S.V.N.; Allebach, J.P. Learning visual balance from large-scale datasets of aesthetically highly rated images. In Proceedings of the SPIE, Human Vision and Electronic Imaging XX, San Francisco, CA, USA, 9–12 February 2015; Volume 9394. [Google Scholar]
- Abeln, J.; Fresz, L.; Amirshahi, S.A.; McManus, I.C.; Koch, M.; Kreysa, H.; Redies, C. Preference for Well-Balanced Saliency in Details Cropped from Photographs. Front. Hum. Neurosci. 2016, 9, 704. [Google Scholar] [CrossRef] [PubMed]
- Friedenberg, J.; Liby, B. Perceiving the center of three-body displays: The role of size-ratio, symmetry, elongation, and gravity. Open Behav. Sci. J. 2008, 2, 13–22. [Google Scholar] [CrossRef]
- Friedenberg, J.; Liby, B. Perception of two-body center of mass. Atten. Percept. Psychophys. 2002, 64, 531–539. [Google Scholar] [CrossRef] [PubMed]
- Puffer, E.D. Studies in symmetry. Psychol. Rev. Monogr. Suppl. 4 Harv. Psychol. Stud. 1 1903, 1, 467–539. [Google Scholar]
- Cohn, J. ‘Puffer, E.D. Studies in Symmetry. Psychol. Rev. Monograph. Suppl. 4 Harv. Psychol. Stud. 1 1906’. Zeitschrift für Psychologie und Physiologie der Sinnesorgane 1906, 40, 215–218. [Google Scholar]
- Greiner, B. Subject pool recruitment procedures: Organizing experiments with ORSEE. J. Econ. Sci. Assoc. 2015, 1, 114–125. [Google Scholar] [CrossRef]
- Baddeley, A.; Rubak, E.; Turner, R. Spatial Point Patterns: Methodology and Applications with R; Chapman and Hall; CRC: Boca Raton, FL, USA, 2015. [Google Scholar]
- R Core Team. R: A Language and Environment for Statistical Computing; R Foundation for Statistical Computing, 2017. Available online: https://www.R-project.org/ (accessed on 01 December 2019).
- Reber, R.; Schwarz, N.; Winkielman, P. Processing fluency and aesthetic pleasure: Is beauty in the perceiver’s processing experience? Personal. Soc. Psychol. Rev. 2004, 8, 364–382. [Google Scholar] [CrossRef]
- Chamberlain, R.; Wagemans, J. Visual arts training is linked to flexible attention to local and global levels of visual stimuli. Acta Psychol. 2015, 161, 185–197. [Google Scholar] [CrossRef]
- Fechner, G.T. Zur Experimentalen Ästhetik; Hirzel: Leipzig, Germany, 1871. [Google Scholar]
- Leder, H.; Tinio, P.P.; Brieber, D.; Kröner, T.; Jacobsen, T.; Rosenberg, R. Symmetry is not a universal law of beauty. Empir. Stud. Arts 2019, 37, 104–114. [Google Scholar] [CrossRef]
- Weichselbaum, H.; Leder, H.; Ansorge, U. Implicit and Explicit Evaluation of Visual Symmetry as a Function of Art Expertise. i-Perception 2018, 9, 1–24. [Google Scholar] [CrossRef] [PubMed]
- Locher, P.J.; Stappers, P.J.; Overbeeke, K. The role of balance as an organizing design principle underlying adults’ compositional strategies for creating visual displays. Acta Psychol. 1998, 99, 141–161. [Google Scholar] [CrossRef]
Figure 1.
Three examples of arrangements applied in Puffer’s [23] study. The black surface had an extension of 60 × 40 cm. The width of the elements was 1 cm and their length 16 or 8 cm, respectively.
Figure 1.
Three examples of arrangements applied in Puffer’s [23] study. The black surface had an extension of 60 × 40 cm. The width of the elements was 1 cm and their length 16 or 8 cm, respectively.

Figure 2.
Example displays for all main conditions (combinations of F and V) used in Experiment 1, based on Puffer’s (1903) original study (Exp. I–III). The shapes of the lines are simplified.
Figure 2.
Example displays for all main conditions (combinations of F and V) used in Experiment 1, based on Puffer’s (1903) original study (Exp. I–III). The shapes of the lines are simplified.

Figure 3.
Example displays for some conditions (short-long, double-long, oblique-in-long, and oblique-out-long) in Experiment 1 (Block 1: F-left, V-right).
Figure 3.
Example displays for some conditions (short-long, double-long, oblique-in-long, and oblique-out-long) in Experiment 1 (Block 1: F-left, V-right).

Figure 4.
This figure shows two examples of results for each of the eight main conditions in Experiment 1. Each row corresponds to one condition. The left and right columns represent the F location of 80 and 160 pixels, respectively. Each black line indicates an adjusted position for the variable element. The arrow above the lines indicates the mean of all V positions and the cross indicates the center of the frame. The turquoise line represents the location for mechanical balance, and the magenta line that for bilateral symmetry (relative to F). The distribution at the bottom reflects the estimated intensities (see text for details).


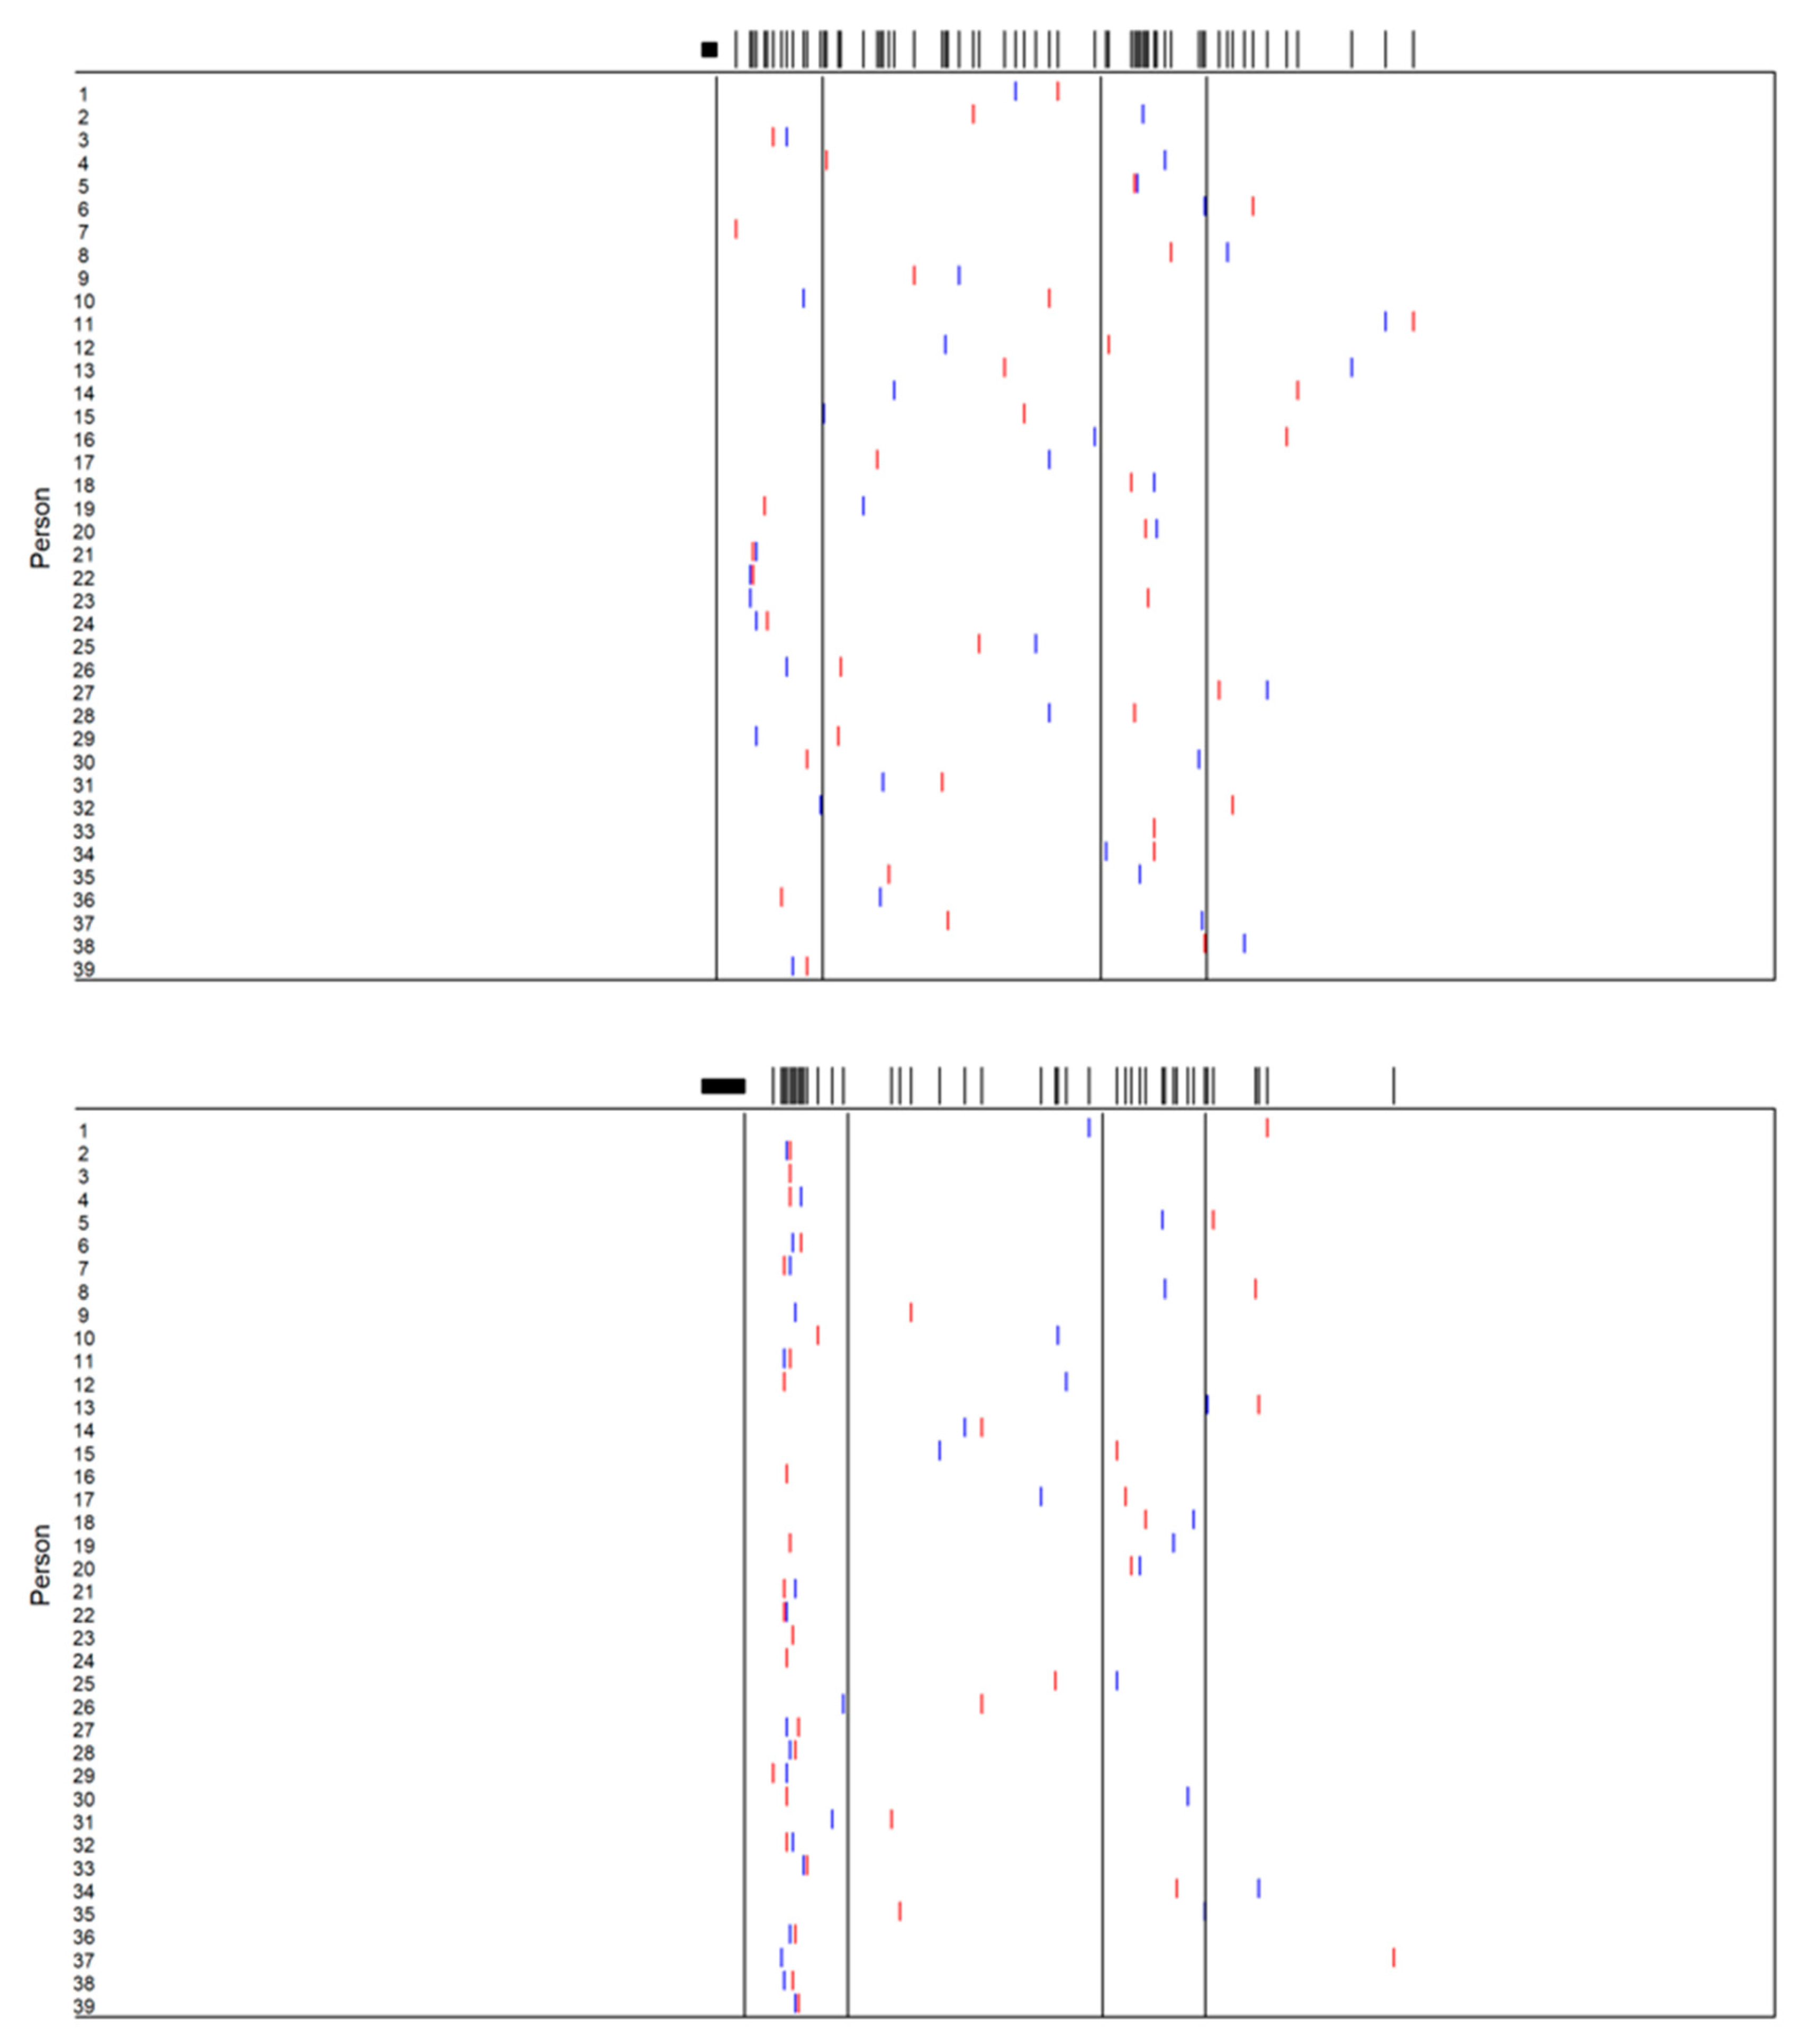
Figure 5.
Individual performance of our 39 participants (Experiment 1) in the long-short (upper panel) and double-short (lower panel) conditions (F location: 80 pixels). The filled rectangles represent the fixed elements. The left and right border indicate the center and inner edge of the fixed element, respectively. The red and blue lines show the adjusted positions in the F-right and F-left block, respectively. The long vertical lines indicate the regions of interest for closeness and symmetry.

Figure 6.
This figure shows preferences of the 39 participants (Experiment 1) with respect to symmetry and closeness. Each point represents one participant and indicates how many of her or his 80 adjustments are located in the region of interest for symmetry or closeness, respectively. The blue triangles represent participants who more often chose positions according to the closeness hypothesis than those in accord with symmetry. The red squares represent persons with the reversed preference. The black circles stand for participants that preferred neither of the two strategies. The single digit indicates that the adjacent point represents four participants.

Figure 7.
This figure shows the performance of the 36 participants in Experiment 2. Each point represents a participant and indicates how many of her or his 80 adjustments are located in the region of interest for symmetry or closeness, respectively. The blue triangles represent participants who more often adjusted positions according to the closeness hypothesis than to the symmetry hypothesis. The red squares represent participants for which the relation was reversed. The black circles represent participants that preferred neither of the two strategies. The digits indicate that the adjacent point represents two participants.


Table 1.
Number of significant tests (maximum 3) in each of the eight element-type conditions for the four hypotheses, respectively, in Experiment 1. For further details, see the text.
Table 1.
Number of significant tests (maximum 3) in each of the eight element-type conditions for the four hypotheses, respectively, in Experiment 1. For further details, see the text.
| Balance | Symmetry | Closeness | Centering | |
|---|---|---|---|---|
| 1 short-long | 0(19:28) | 1(56:27) | 1(58:17) | 1(35:19) |
| 2 long-short | 0(10:17) | 1(59:42) | 0(61:20) | 0(39:45) |
| 3 double-short | 0(8:4) | 0(33:19) | 3(153:7) | 1(67:11) |
| 4 double-long | 0(42:28) | 0(42:28) | 2(72:16) | 3(42:13) |
| 5 obl.-in-short | 2(52:22) | 2(52:22) | 3(94:20) | 0(28:24) |
| 6 obl.-in-long | 0(20:26) | 1(40:23) | 0(71:23) | 1(41:22) |
| 7 obl.-out-short | 1(40:25) | 1(40:25) | 3(98:19) | 1(35:16) |
| 8 obl.-out-long | 0(17:26) | 0(32:19) | 2(92:19) | 2(51:24) |
| Sum | 3(208:176) | 6(354:205) | 14(699:141) | 9(338:174) |
Table 2.
Number of significant tests in each of the eight main conditions for the four hypotheses, respectively, in Experiment 2. For further details, see text.
Table 2.
Number of significant tests in each of the eight main conditions for the four hypotheses, respectively, in Experiment 2. For further details, see text.
| Balance | Symmetry | Closeness | Centering | |
|---|---|---|---|---|
| 1 short-long | 0(11:18) | 2(45:21) | 1(70:18) | 0(21:17) |
| 2 long-short | 0(13:14) | 1(44:28) | 0(59:28) | 0(36:33) |
| 3 double-short | 0(7:5) | 0(14:12) | 3(142:15) | 1(57:15) |
| 4 double-long | 1(36:22) | 1(36:22) | 0(73:19) | 0(25:15) |
| 5 obl.-in-short | 0(26:14) | 0(26:14) | 2(98:14) | 0(24:21) |
| 6 obl.-in-long | 0(11:19) | 0(16:21) | 1(89:23) | 0(32:22)) |
| 7 obl.-out-short | 0(22:13) | 0(22:13) | 3(100:14) | 1(39:19) |
| 8 obl.-out-long | 0(13:17) | 0(19:16) | 1(96:26) | 0(33:20) |
| Sum | 1(139:122) | 4(222: 147) | 11(727:157) | 2(267:162) |
© 2019 by the authors. Licensee MDPI, Basel, Switzerland. This article is an open access article distributed under the terms and conditions of the Creative Commons Attribution (CC BY) license (http://creativecommons.org/licenses/by/4.0/).
Share and Cite
MDPI and ACS Style
Hübner, R.; Thömmes, K. Symmetry and Balance as Factors of Aesthetic Appreciation: Ethel Puffer’s (1903) “Studies in Symmetry” Revised. Symmetry 2019, 11, 1468. https://doi.org/10.3390/sym11121468
AMA Style
Hübner R, Thömmes K. Symmetry and Balance as Factors of Aesthetic Appreciation: Ethel Puffer’s (1903) “Studies in Symmetry” Revised. Symmetry. 2019; 11(12):1468. https://doi.org/10.3390/sym11121468
Chicago/Turabian StyleHübner, Ronald, and Katja Thömmes. 2019. "Symmetry and Balance as Factors of Aesthetic Appreciation: Ethel Puffer’s (1903) “Studies in Symmetry” Revised" Symmetry 11, no. 12: 1468. https://doi.org/10.3390/sym11121468
Note that from the first issue of 2016, this journal uses article numbers instead of page numbers. See further details here.