Effect of Time Delay on Laser-Triggered Discharge Plasma for a Beyond EUV Source


1
College of Science, Northeast Forestry University, Harbin 150040, China
2
National Key Laboratory of Tunable Laser Technology, Harbin Institute of Technology, Harbin 150080, China
*
Author to whom correspondence should be addressed.
Symmetry 2019, 11(5), 658; https://doi.org/10.3390/sym11050658
Submission received: 10 April 2019
/
Revised: 1 May 2019
/
Accepted: 4 May 2019
/
Published: 11 May 2019
Abstract
:We demonstrate the beyond extreme ultraviolet (BEUV) emission by a laser-triggered discharge source with the laser-current delay between 0.6 µs and 3 µs. The spectra at different electron temperatures are simulated theoretically, and the spectra at different laser-current delays are measured experimentally. The theoretical and experimental results show that the lower vapor velocity at longer laser-current delay time is beneficial for increasing the steady-state time of plasma at high temperature, thereby increasing the output intensity and spectral purity of 6.76 nm. The radiation intensity of 6.76 nm (0.6% bandwidth) increases about 240% when the delay increases from 0.6 to 3 μs.
1. Introduction
In the last decades, photolithography has been widely used in the semiconductor industry. At present, the most popular photolithography methods use 193 nm ArF excimer lasers and 13.5 nm extreme ultraviolet (EUV) lithography (EUVL). Two types of EUV sources exist for high-volume manufacturing (HVM) application: Sn laser-produced plasma (LPP) [1] and Sn laser-triggered discharge (LTD) plasma [2] These sources are based on emission from resonance 4p64dn–4p64dn−14f and 4p54dn+1 (4–4 transitions) with n = 6~0 for Sn8+–Sn14+ transitions [3], known as unresolved transition arrays (UTAs) [4]. After two decades of research, EUVL using λ = 13.5 nm radiation has been applied in the semiconductor industry to achieve the 7 nm node.
In order to keep pace with Moore’s law, beyond EUV (BEUV) lithography (BEUVL) technology using 6.x nm radiation has been extensively studied to attain higher integrated electronic devices. It is shown that a design with a LaB/N multilayer reflector should be optimal for BEUV sources. A reflective coefficient of 74.5% at 6.66 nm with LaN/B multilayer has been achieved [5], and changing the thickness of each bilayer can slightly tune the wavelength corresponding to maximum reflectance [6]. Moreover, the resist sensitivity has been evaluated for the beyond extreme ultraviolet BEUV source around 6.x nm [7,8].
The relationship between 4d–4f and 4p–4d transition probabilities and the wavelength of lanthanides was calculated and measured by different methods. The results show that highly ionized Tb and Gd plasma are primary light-source candidates for BEUVL, and have their highest intensities at 6.52 and 6.76 nm, respectively [9,10,11,12]. Highly ionized Tb and Gd can generate strong narrowband radiations, which are attributed to the n = 4 − n = 4 UTAs.
At present, the research of BEUV sources is mainly focused on improving the conversion efficiency. The laser power density, spot size, target purity, laser pulse width, incident angle, and spectral changes for different radiation angles are systematically studied by LPP [12,13,14,15]. There are few studies on Gd LTD BEUV sources. LTD plasma can generate deep-ultraviolet to X-ray radiation. The system has the characteristics of low cost, high repetition rate, selective spectral wavelength according to target, and ability to control the generation time. In this way, the LTD source has application in the fields of X-ray metrology and microscopy, and can also be used as a detection source for key components in BEUV lithography machines.
For an LTD source, laser-induced plasma is the injection source for the latter Z-pinch process. The plasma characteristics during the initial [16], Z-pinch [2,17], or recovery stage [18] of an Sn LTD EUV source, triggered by one or two double ns lasers, have been studied extensively by using spectroscopic or optical techniques. After the laser shot, the plasma state changes with time. The expansion process of pre-plasma induced by the laser affects the subsequent pinch process and the radiant properties of the pinch [19]. Different laser-current delays lead to changes in the Z-pinch process. So far, the research on Gd LTD sources has been reported very little. Study of the delay between the laser and the current, which will reveal the BEUV source evolution during the laser-triggered discharge, can be useful for optimizing the intensity of the BEUV emission. In this paper, we report the dynamics of laser-assisted discharge plasma based on time-resolved BEUV spectroscopy, and discuss possible ways to improve the intensity of the BEUV emission.
2. Experimental Apparatus
Figure 1 shows the schematic of the experimental setup. A high purity, planar gadolinium target with a thickness of 3 mm is the source for BEUV generation. A Q-switched Nd:YAG laser (Continuum Minilite II) operating in single pulse mode with a wavelength of 1.06 μm, pulse energy of 20 mJ, power density of 1010 W cm−2 at a focal spot diameter of 45 μm FWHM, and pulse width of 8 ns FWHM, available when the latter is used. The laser pulse passes through the center of the hollow anode electrode (tungsten–copper material), which has a 10 cm focal length planoconvex BK7 glass lens. The laser incident is then perpendicular to the planar Gd target. The pre-pulse intensity at 1064 nm is sufficient to produce a pre-plasma. However, it is not high enough to produce a detectable BEUV emission. After five laser shots, the target was rotated. The measured spectrum is the average of the five shots.
The time-integrated emission spectrum was measured by a BEUV spectral detection system, which consists of a 1 m Rowland circle grazing incidence spectrometer (McPherson 248/310 G), an X-ray CCD camera (Andor, DO920P-BN) and a data acquisition system. The spectral resolution is better than 0.04 nm. Meanwhile, the spectrometer axis is vertical to the discharge plasma axis, which is denoted as the axis between the anode and the cathode electrodes, and coincided with the focused laser.
The chamber is evacuated to ~10−3 Pa by the mechanical and molecular pumps. In order to avoid both absorption of BEUV radiation and self-discharge, we maintained a low pressure. In addition, the electrodes are at a close distance (6 mm), and the discharge voltage is about 20 kV. Voltage was measured by a high voltage probe and current was measured by a Rogowski coil, whose outputs were recorded by a digital oscilloscope (Tektronix, P6015A).
Compared to traditional power supply, this system can control the generation and process of discharge at a required time by changing the delay between laser and voltage. Figure 2 shows the schematic diagram of the power supply based on three-level magnetic pulse compression, which differs from conventional LTD sources [20]. Figure 3 illustrates the time sequences of the laser irradiation, the voltage on C4, and the plasma current Ip. A computer gives two signals simultaneously to trigger the thyratron (PT in Figure 2) in the electric power source and the delay/pulse generator (DG535), which controls the laser. A high voltage is formed after an inherent delay T1, which is decided by the capacitances of C2, C3, C4, the inductances of MS1, MS2, MS3, and the final Z-pinch device. Meanwhile, the delay T2 is controlled by the DG535. A high voltage is generated and maintained until the laser is focused on the Gd target, which is used to form pre-pulse plasma. Then, the pre-plasma bridges both electrodes to ignite discharge. The pre-plasma is pinched by the current to generate high-temperature plasma, which can radiate BEUV emissions. In this way, the delay dt between the pre-pulse plasma and the current can be changed by controlling the DG535.
Figure 4 shows the relationships between the laser signal (a, black line), voltage (b, red line), and discharge current (c, blue line) for two conditions A and B. In condition A, the high voltage is maintained until the plasma ignited by the laser is passing through the cathode and the anode. On the contrary, when the laser has ablated the Gd long before the voltage is loaded between the two electrodes for condition B, the two electrodes are filled with pre-ionized plasma produced by the laser. Then, discharging occurs when the core of the last loop is saturated.
As shown in Figure 4, the laser-current delay dt (~10% of laser pulse to 10% of current) is defined as the time interval between the laser irradiation (pre-plasma) and the onset of the current (breakdown), which is one of the key factors for plasma formation. The time corresponding to the increase in current (~10% to 90% of current) was about 140 ns, and the typical current was about 8 kA. For condition A, as seen in Figure 4, no discharge occurs at dt smaller than 600 ns, with the smaller dt dependent mainly on the gap distance, the laser irradiation intensity, and the target material [21]. In this way, it can be estimated that the mean velocity of laser plasma is about 1.0 × 106 cm/s. In this paper, dt is set and recorded between 600 ns and 5 μs. Moreover, the pinch time should be about 230 ns after the voltage is broken down, according to the dip in the current [16,22].
3. Theoretical Calculations
The atomic data for the theoretical simulation of the Gd spectra are calculated by the Hartree-Fock approximate Cowan codes. Research shows that the configuration interaction (CI), which causes considerable changes in wavelength and the intensity of EUV lines [23], is to be taken into account between the 4dn, 4dn−1f, 4dn−15p, 4dn−15f, and 4p54dn+1 configurations. The configuration setups and scaling factors are according to S. S. Churilov [24]. Figure 5 shows the ion populations of a collisional–radiative (C–R) model under different electron temperatures, which are used to weight the spectra at each ion stage. The spectra for each ion stage are then summed to give theoretical spectra for a given temperature [25]. The chosen electron density is as 1019 cm−3, which is the typical density for an LTD source [26]. Moreover, the electron density has almost no effect on the C–R model results when the electron density is under 1021 cm−3 [27].
A Boltzmann distribution appropriate to the temperature was used to weight the population of the upper states for each stage [28]. The oscillator strength, gf, calculated using the Cowan codes, show that the resonant emission around 6.76 nm (0.6% band) is mainly generated by the n = 4 − n = 4 (Δn = 0) unresolved transition array with ion stages from Gd15+ to Gd25+ and the 4f–5g transitions with the ion stages from Gd15+ to Gd16+. In this way, 6.76 nm emissions were achieved among the electron temperatures from 50 to 220 eV. According to the Bennett relation, the electron temperature is mainly dependent on the plasma character ignited by the laser [22] and the discharge current during the Z-pinch process. A wider range of electron temperatures means that BEUV radiation can be achieved under a wide range of initial plasma conditions and currents.
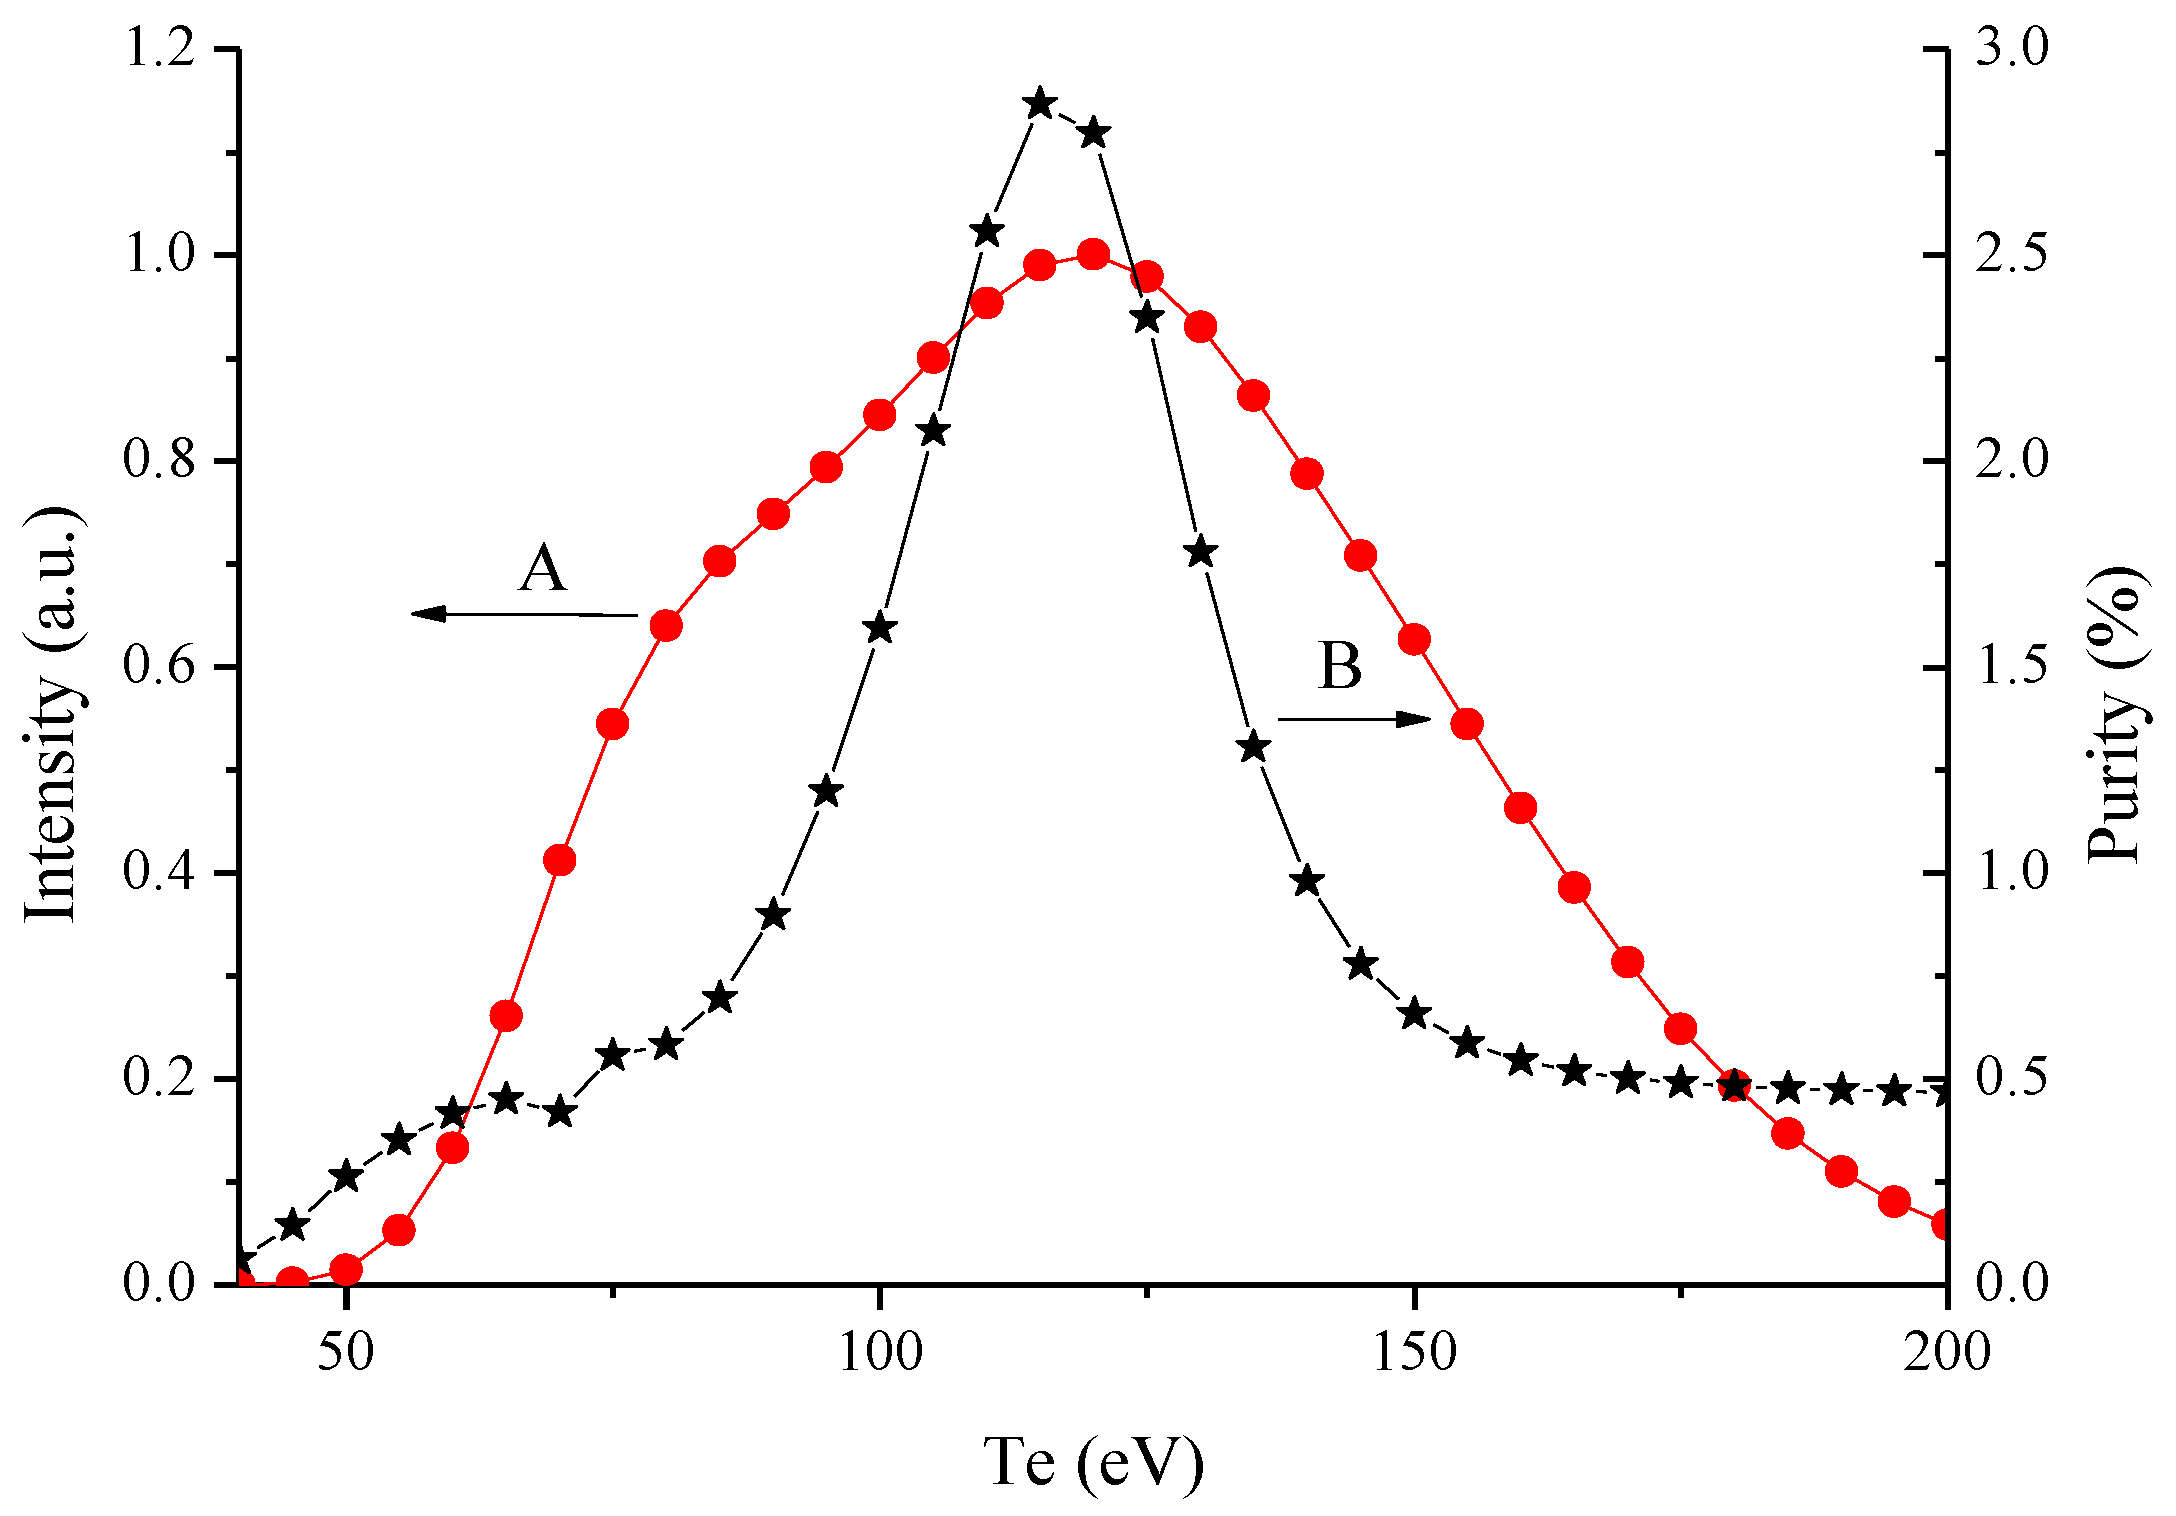
Figure 6 shows the intensity and spectral purity at 6.76 nm in the 0.6% band [29] as a function of electron temperature, where spectral purity is the 0.6% band radiation around 6.76 nm compared to the total radiation between 6 and 8 nm. Here, we chose the wavelength 6.76 nm mainly because the radiation intensity of this wavelength is the strongest in a wide range of electron temperatures [9], and it is also the peak wavelength in most laser plasma experiments. Moreover, the experiments and simulations show that the peak reflectivity of the reflector near 6.65–6.80 nm is almost the same for LaN/B4C [30]. It can be clearly seen that when the electron temperature is higher than 75 eV, the 6.76 nm radiation intensity increases rapidly. When the electron temperature is near 115 eV, the maximum abundance and intensity of 6.76 nm in 0.6% radiation can be achieved. At this time, there are mainly Gd17+~Gd20+ ions in the plasma.
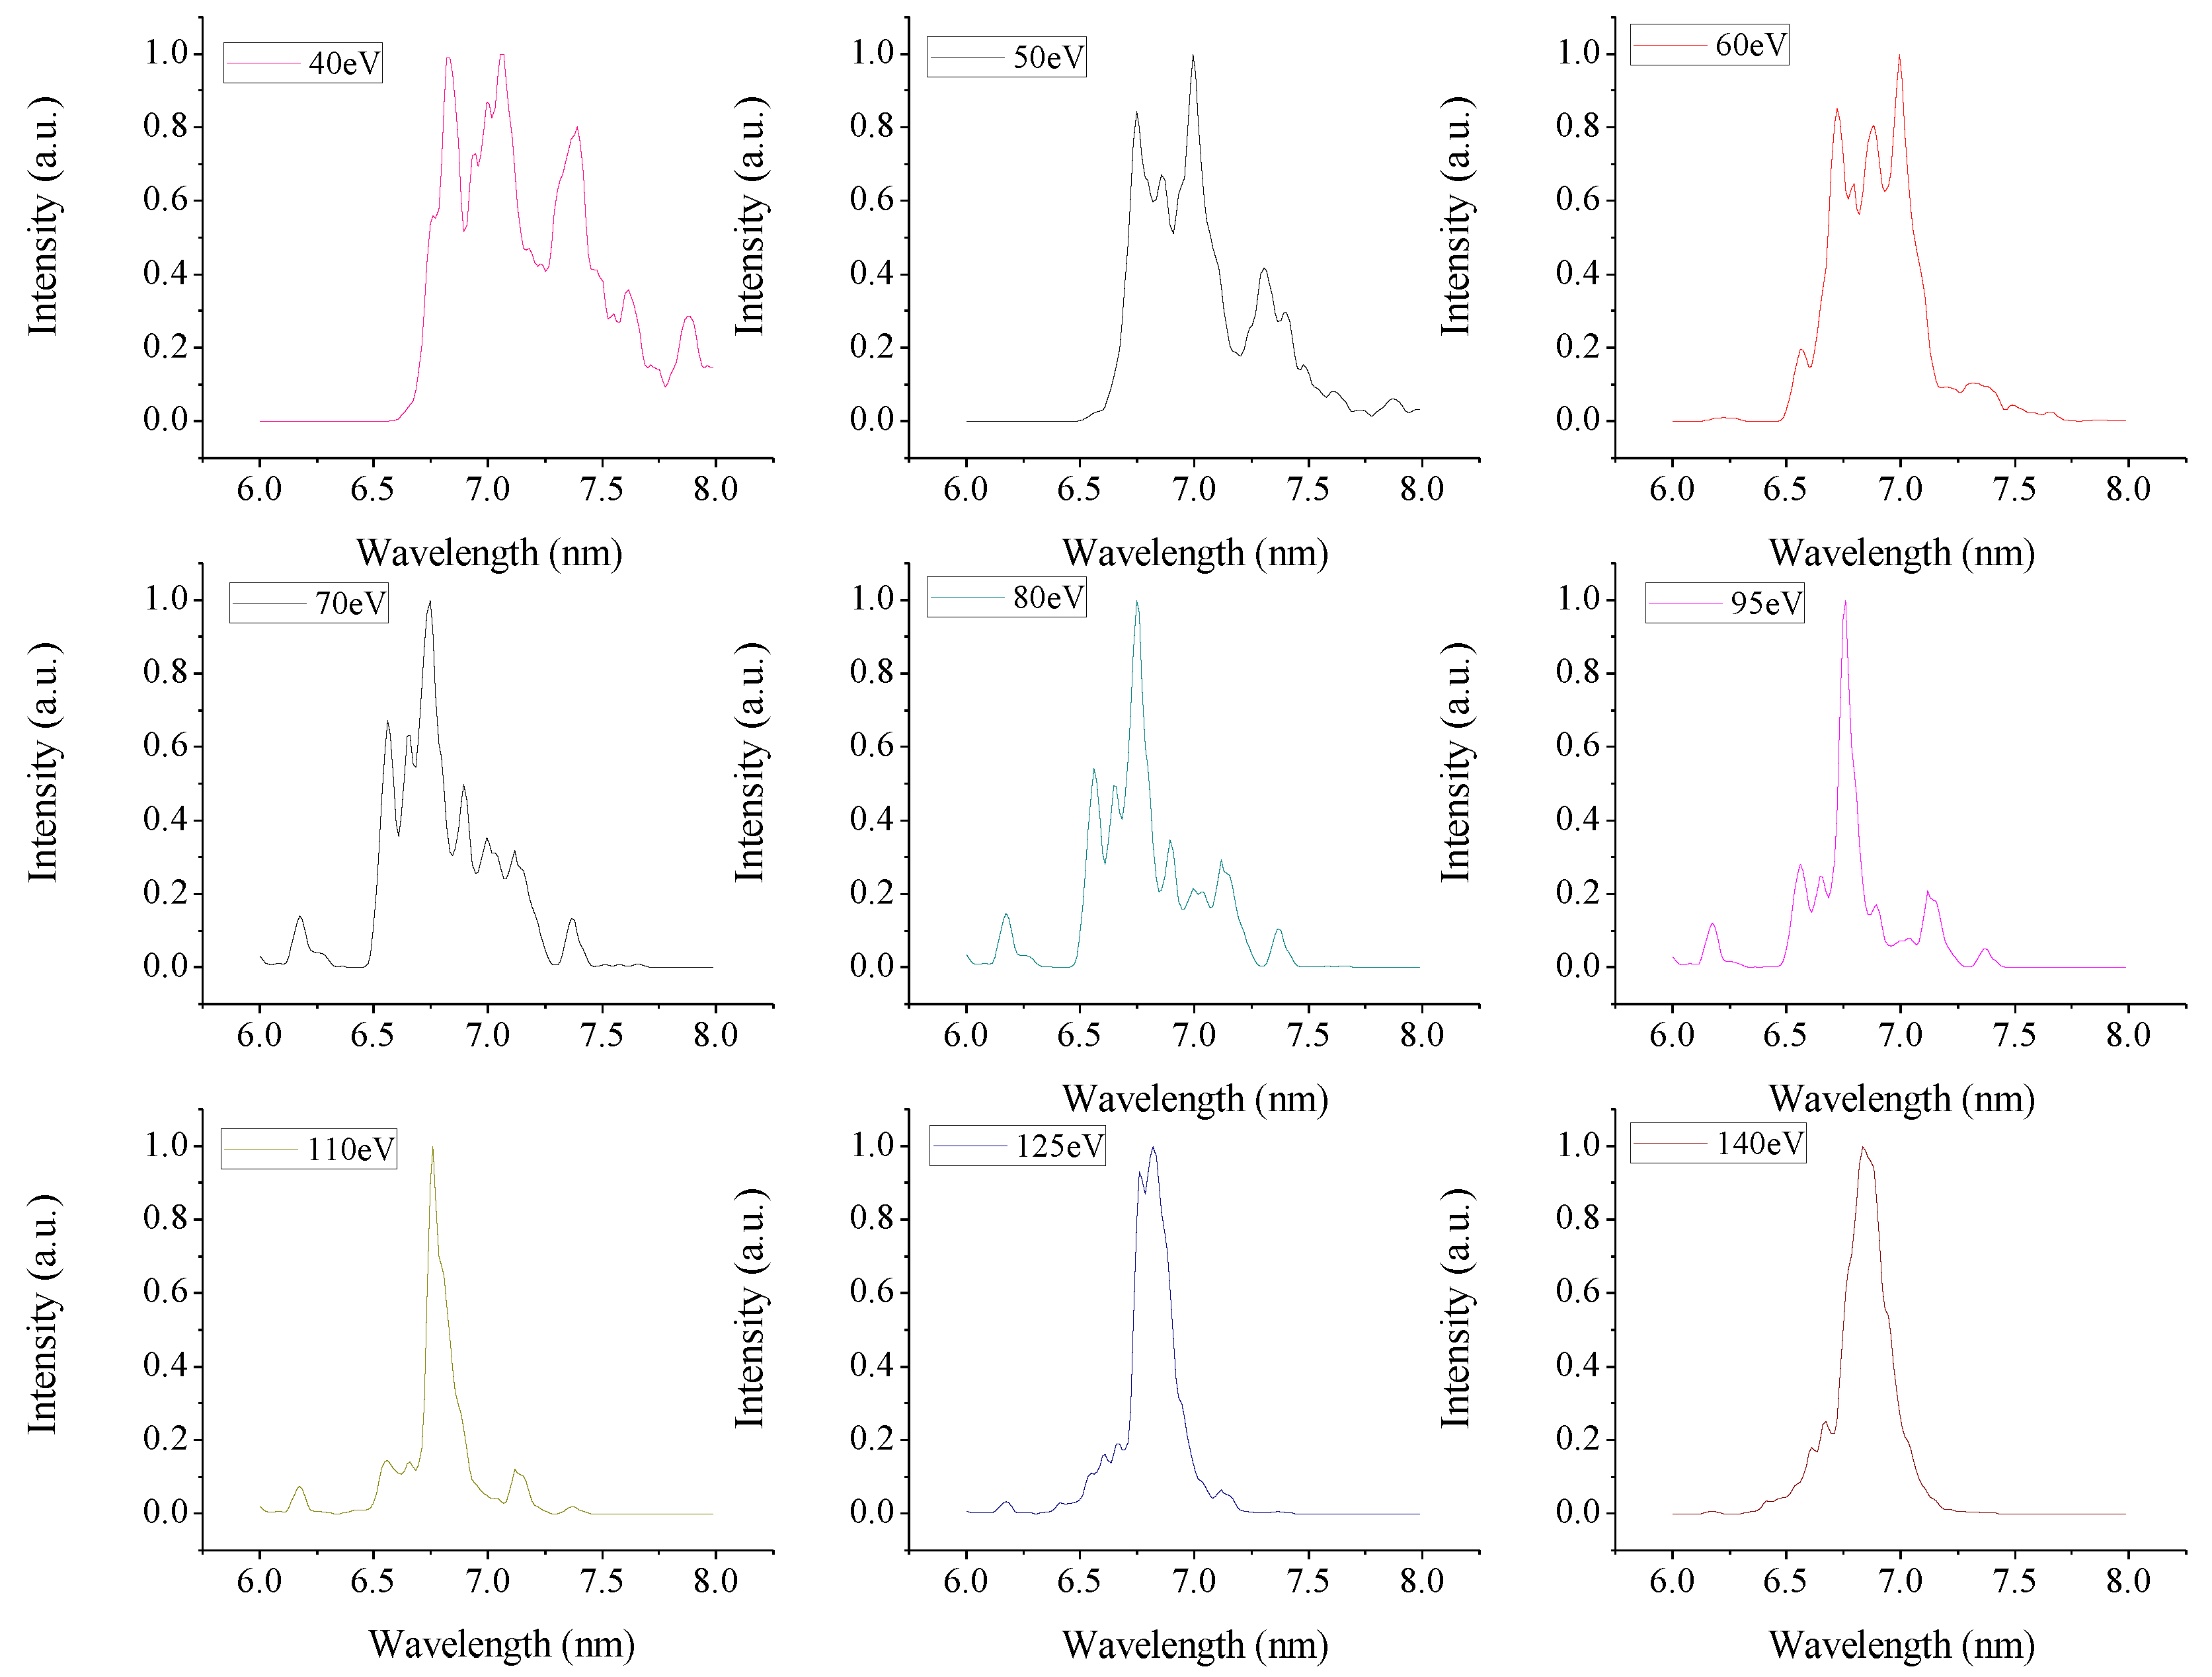
The LTD plasma is optically thin compared with the LPP plasma from early research [19], so opacity effects are ignored, as well as the effects of satellite emission. Figure 7 shows the theoretical Gd spectra as a function of electron temperature and wavelength between the electron temperatures 40 and 140 eV, and the theoretical spectra are convolutions of a Gaussian instrumental function.
It can be seen that the shape of the spectra changes obviously with the increase of electron temperature. The spectra in the range 7.2–8.0 nm, which are mainly generated by the 4d–4f and 4f–5g transitions of Gd11+~Gd14+ ions, can be seen when the electron temperature was lower than 50 eV. With the increase of electron temperature, the intensity of the spectra near 6.76 nm increased obviously. When the electron temperature increased to 110 eV, an obvious peak near 6.76 nm appeared in the spectra. There were two peaks at 6.53 and 7.14 nm on both sides, which were generated by the 4d–4f transition of Gd16+ and Gd17+ ions, respectively. At this time, the purity of the spectra reached the maximum at 6.76 nm, and the conversion efficiency peaked. As the electron temperature continued to increase, the peak value of the spectra drifted to a long wavelength. When the electron temperature was higher than 150 eV, the peak of the spectra near 6.76 nm almost disappeared.
4. Experimental Results and Discussion
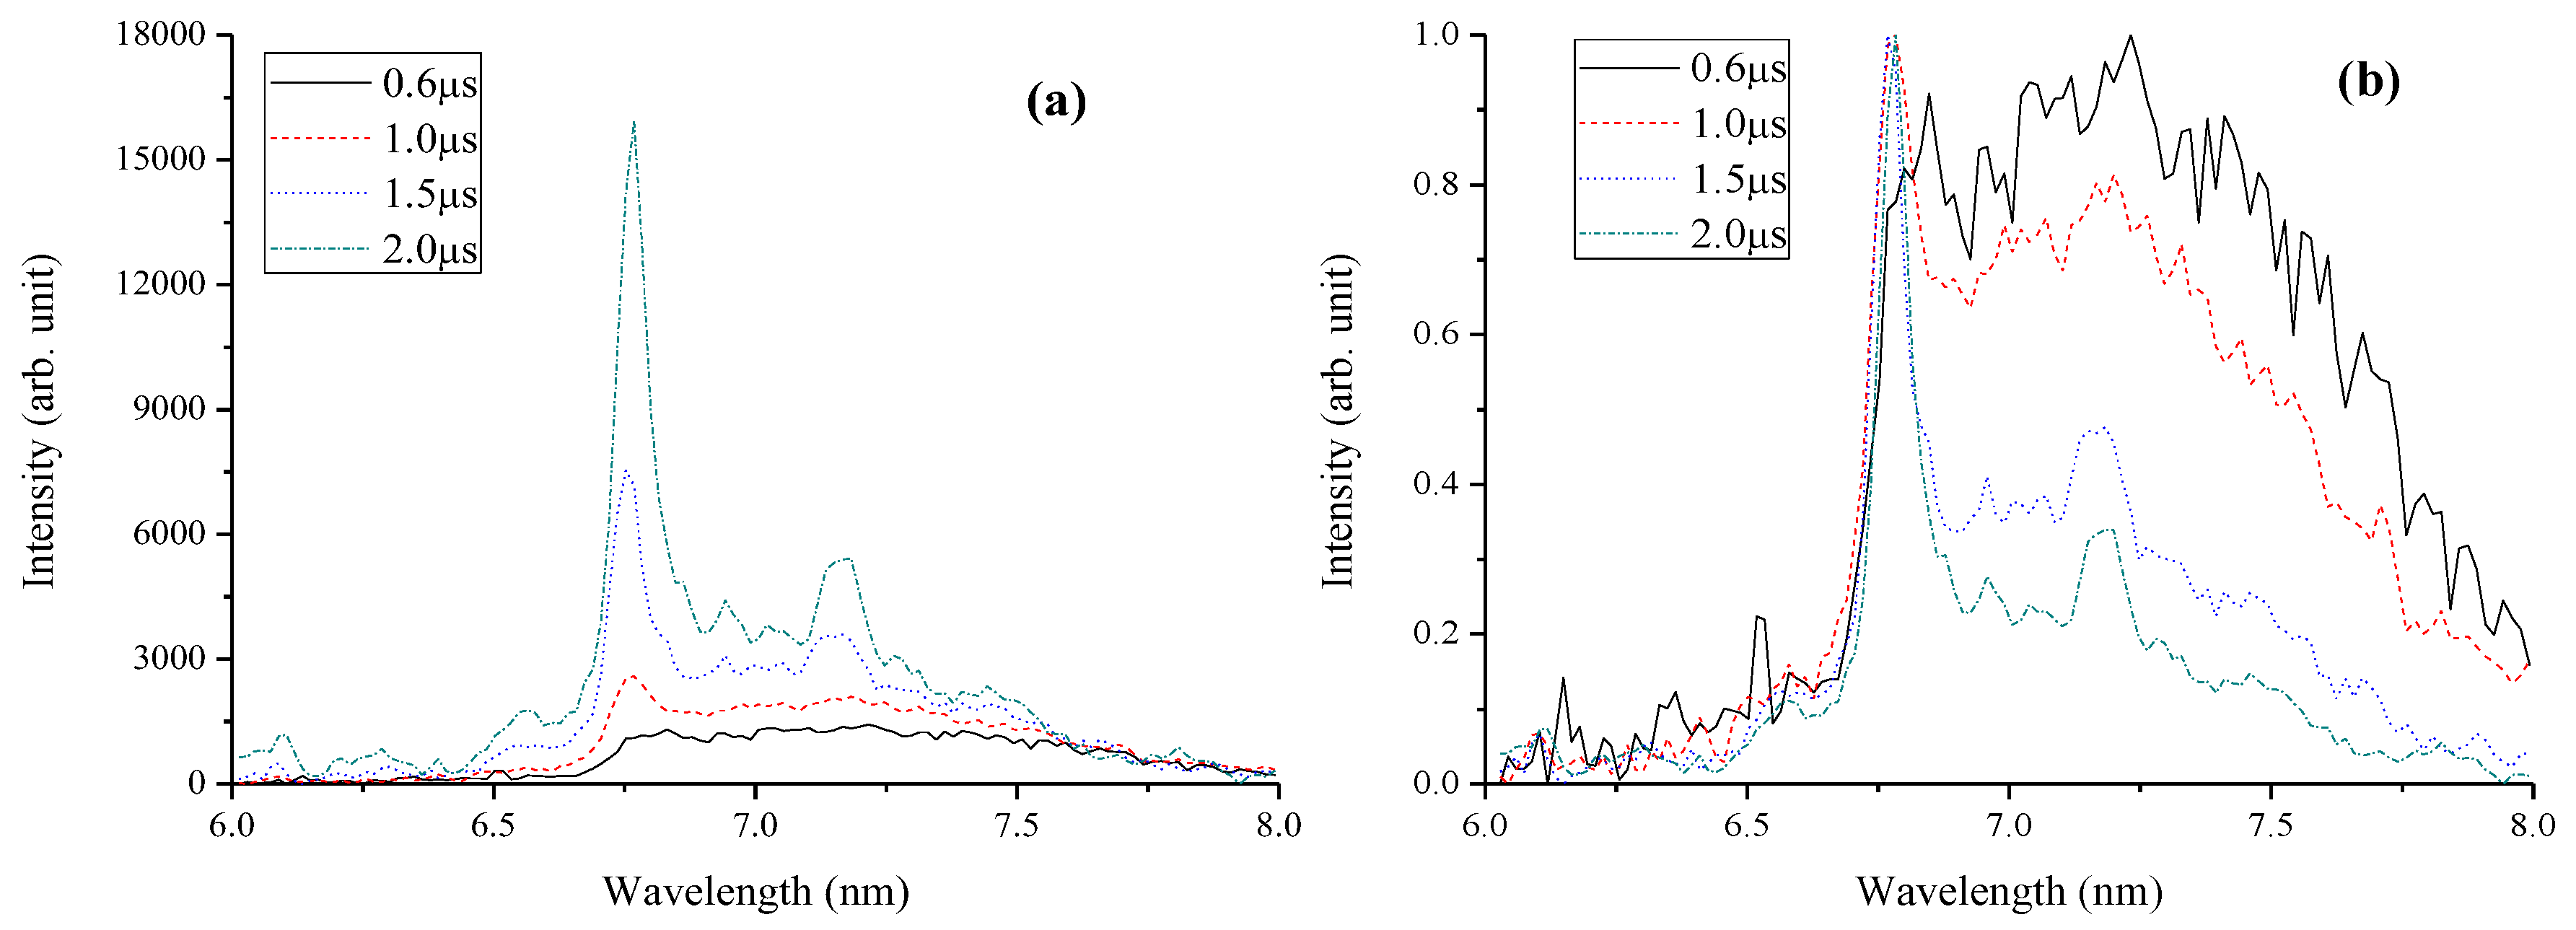
Figure 8a shows the time-integrated Gd BEUV emission spectra of the LTDs under different laser-current delays. The laser-pulse energy and focal-spot diameter remained constant. In Figure 8b each spectrum distribution was normalized to compare the shapes of different delays. In fact, the discharge current is basically unchanged under different delay conditions when the voltage is maintained. Compared with LTD and LPP spectra, the intensity of the LTD spectra at 7.2 and 6.76 nm was higher than shown in [7], which indicates that there are fewer satellites in LTD.
As seen in Figure 8, the presence of resonance lines near 7.14 nm from Ag-like Gd17+, is clearly demonstrated by small intensity peaks in all spectra. It can be seen clearly that the spectral intensity between 6.5 and 7.6 nm increases with the laser-current delay. The experimental spectra, which are time-integrated, indicate the mean charge state during the plasma lifetime. In this way, the mean charge state increases with the delay, as shown in Figure 5 and Figure 7. By contrast, the spectra are almost the same between 7.6 and 8 nm. According to the calculation results of atomic parameters, the spectra in the range of 7.6–8 nm mainly come from Gd11+~Gd12+ ions, which indicates that the density of these ions is basically unchanged when the delay changes. Moreover, the spectra are almost the same as that of 2 μs when the delay is longer than 2 μs. However, the plasma is nearly impossible to break when the delay is longer than 8 μs.
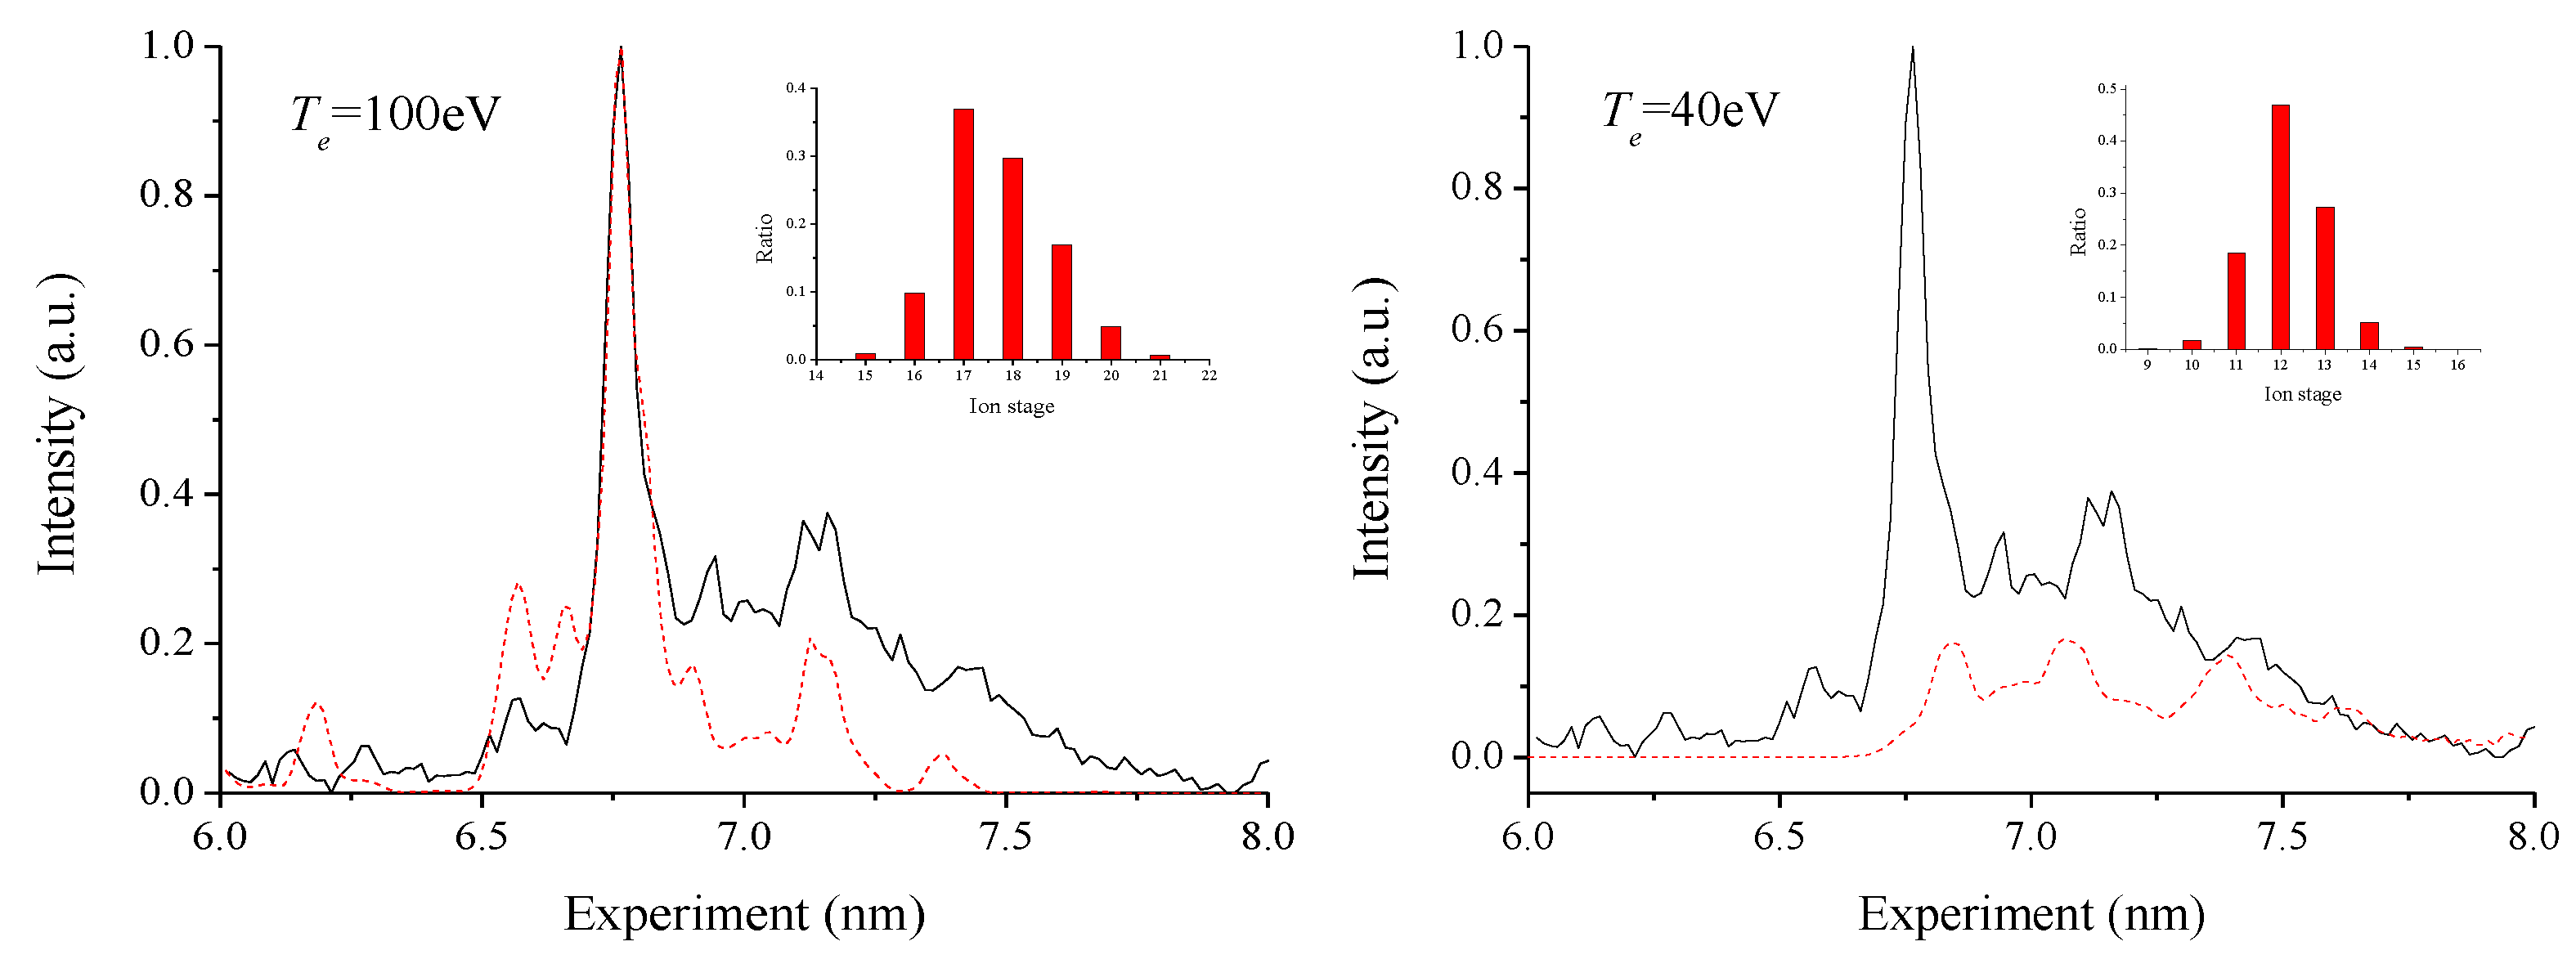
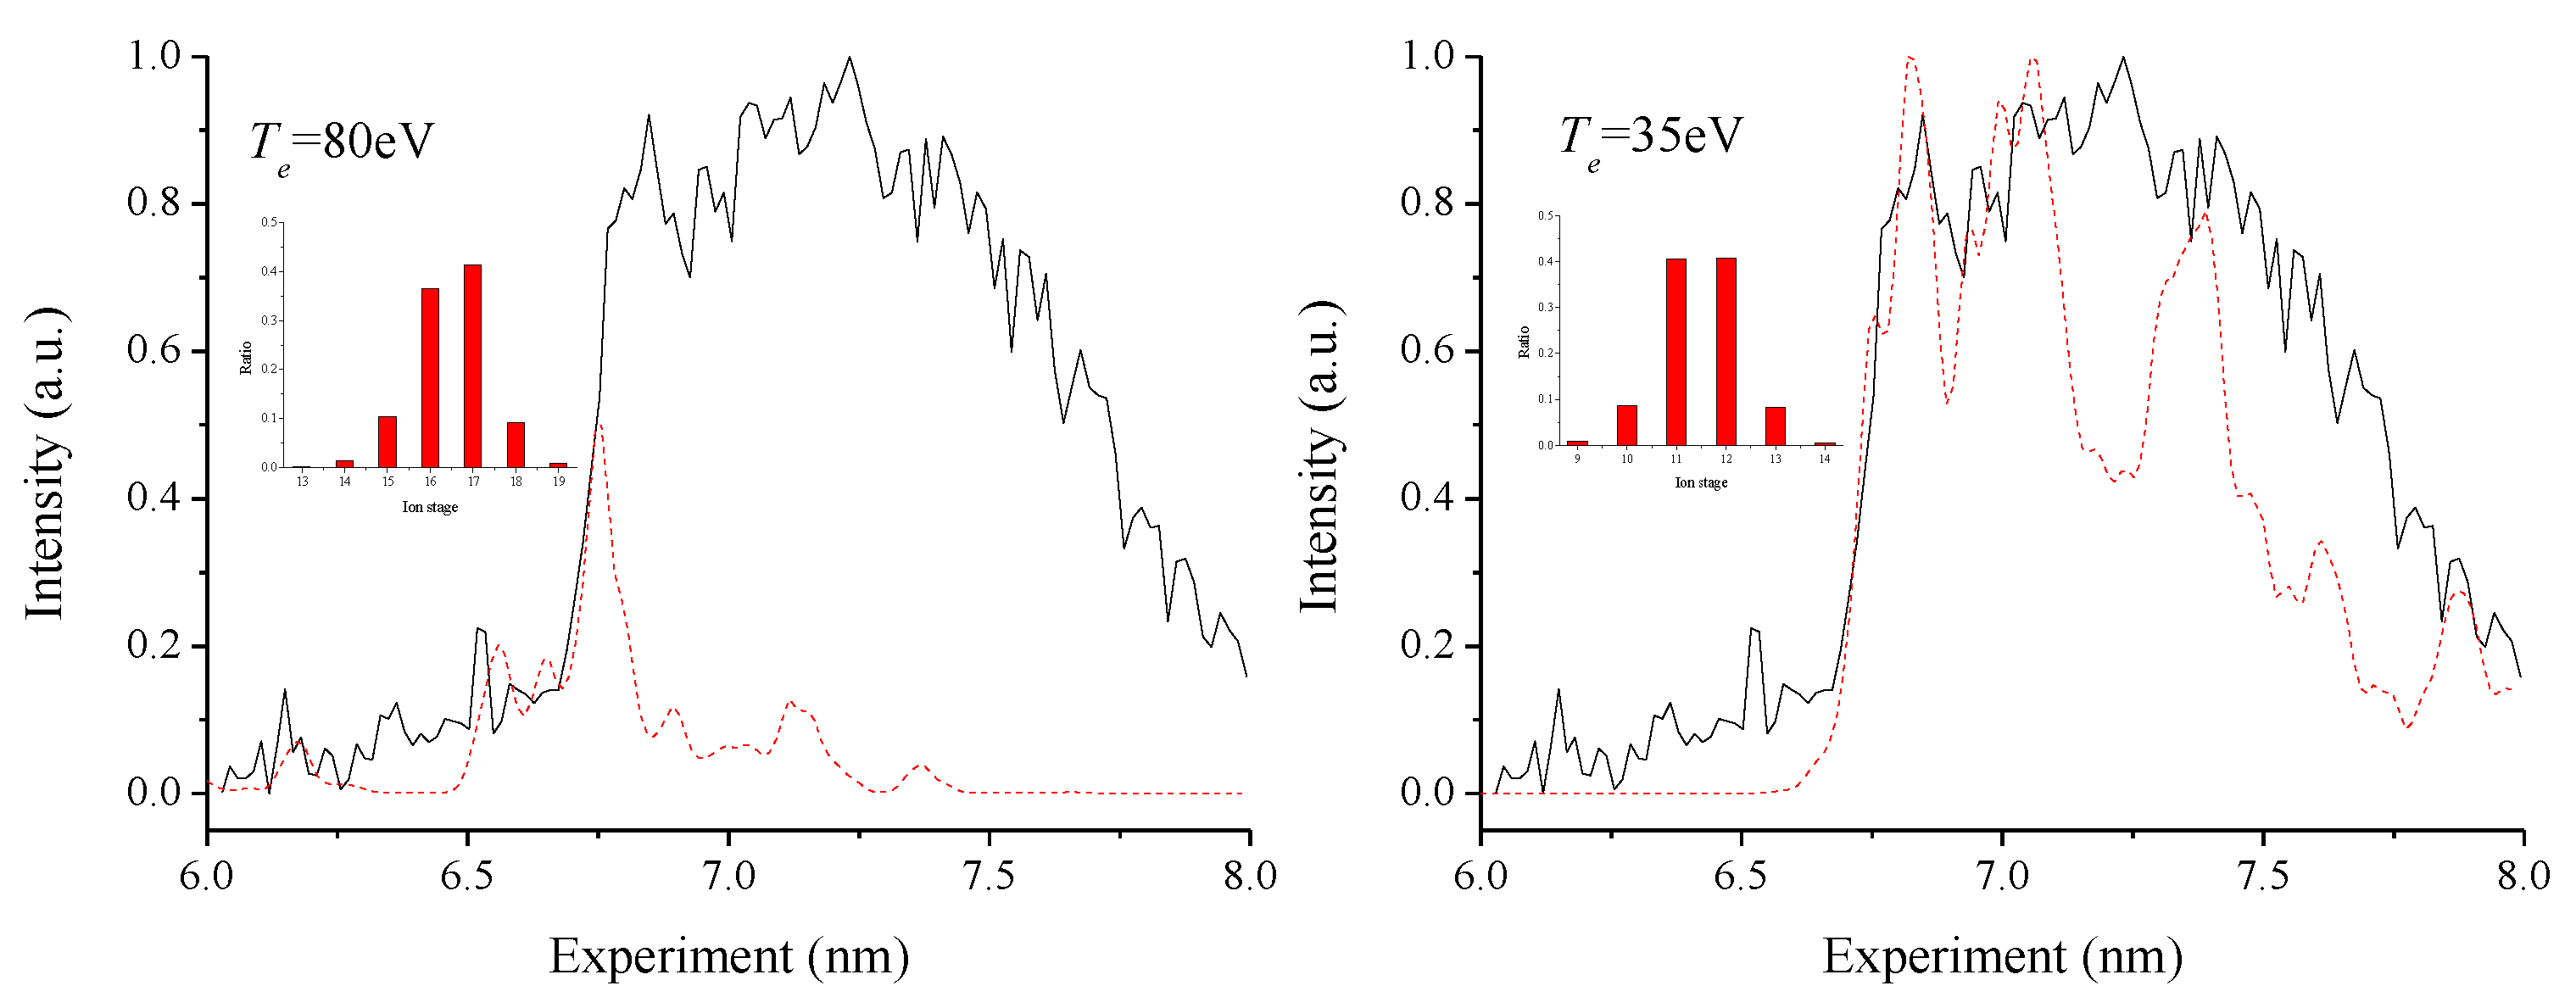
Figure 9 and Figure 10 show the comparisons with theoretical simulations for steady-state electron temperatures under the delays of 2 and 0.6 μs. The corresponding ion stage populations are indicated in the figures. The longer wavelength emission is mainly generated by the species which contain an open outermost 4f subshell. Dominant ion stages also change among these subshells with the change in plasma temperature. In this way, the spectra should vary drastically between discrete and quasi-continuums, depending on the plasma temperature. The results from the plasma temperature of 100 eV are in good agreement with the short wavelength spectra, while the long wavelength spectra are in good agreement with those of the plasma temperature of 40 eV when the delay is 2 μs. Correspondingly, these temperatures are 80 and 35 eV, respectively, when the delay is 0.6 μs. In fact, the experimental spectra are time-integrated. Therefore, during the whole pinch process, the experimental spectra should be generated by the sum of plasmas from different electron temperatures. In this paper, simulated spectra with two different temperatures are used to fit the short and long wavelength spectra, respectively. According to the theoretical Gd spectra, a higher temperature makes the spectra move to a shorter wavelength. In this way, the middle-wavelength spectra should be generated by the plasma between these two simulated temperatures, which leads to the mismatch between the experimental and theoretical spectra.
For the source, the energy output E is proportional to the plasma lifetime t and the plasma density, which are decided by the ionization and recombination of the ions. The vapor density decay is slower than the vapor velocity following a laser ablation of Gd later than 0.5 μs [31,32]. In this way, we should make plasma, which can generate spectra around 6.76 nm, maintain a steady state for as long as possible. Lower vapor velocity is useful for achieving this purpose. When the laser-current delay is long, the radiation spectra mainly come from the high-temperature plasma, which indicates that the plasma is in the high-temperature state for a longer time during the discharge process. Under the same discharge current, the faster vapor velocity leads to a smaller time of flight. The plasma rapidly leaves the discharge area, which will result in a lower plasma temperature. The smaller the equilibrium time of Z-pinch, the lower the radiation intensity and average electron temperature. In other words, a longer laser-current delay is better for getting high-temperature plasma, whereas an overly long delay results in plasma of insufficient density, making the pre-plasma hard to break down at high voltage and, also, have poor stability.
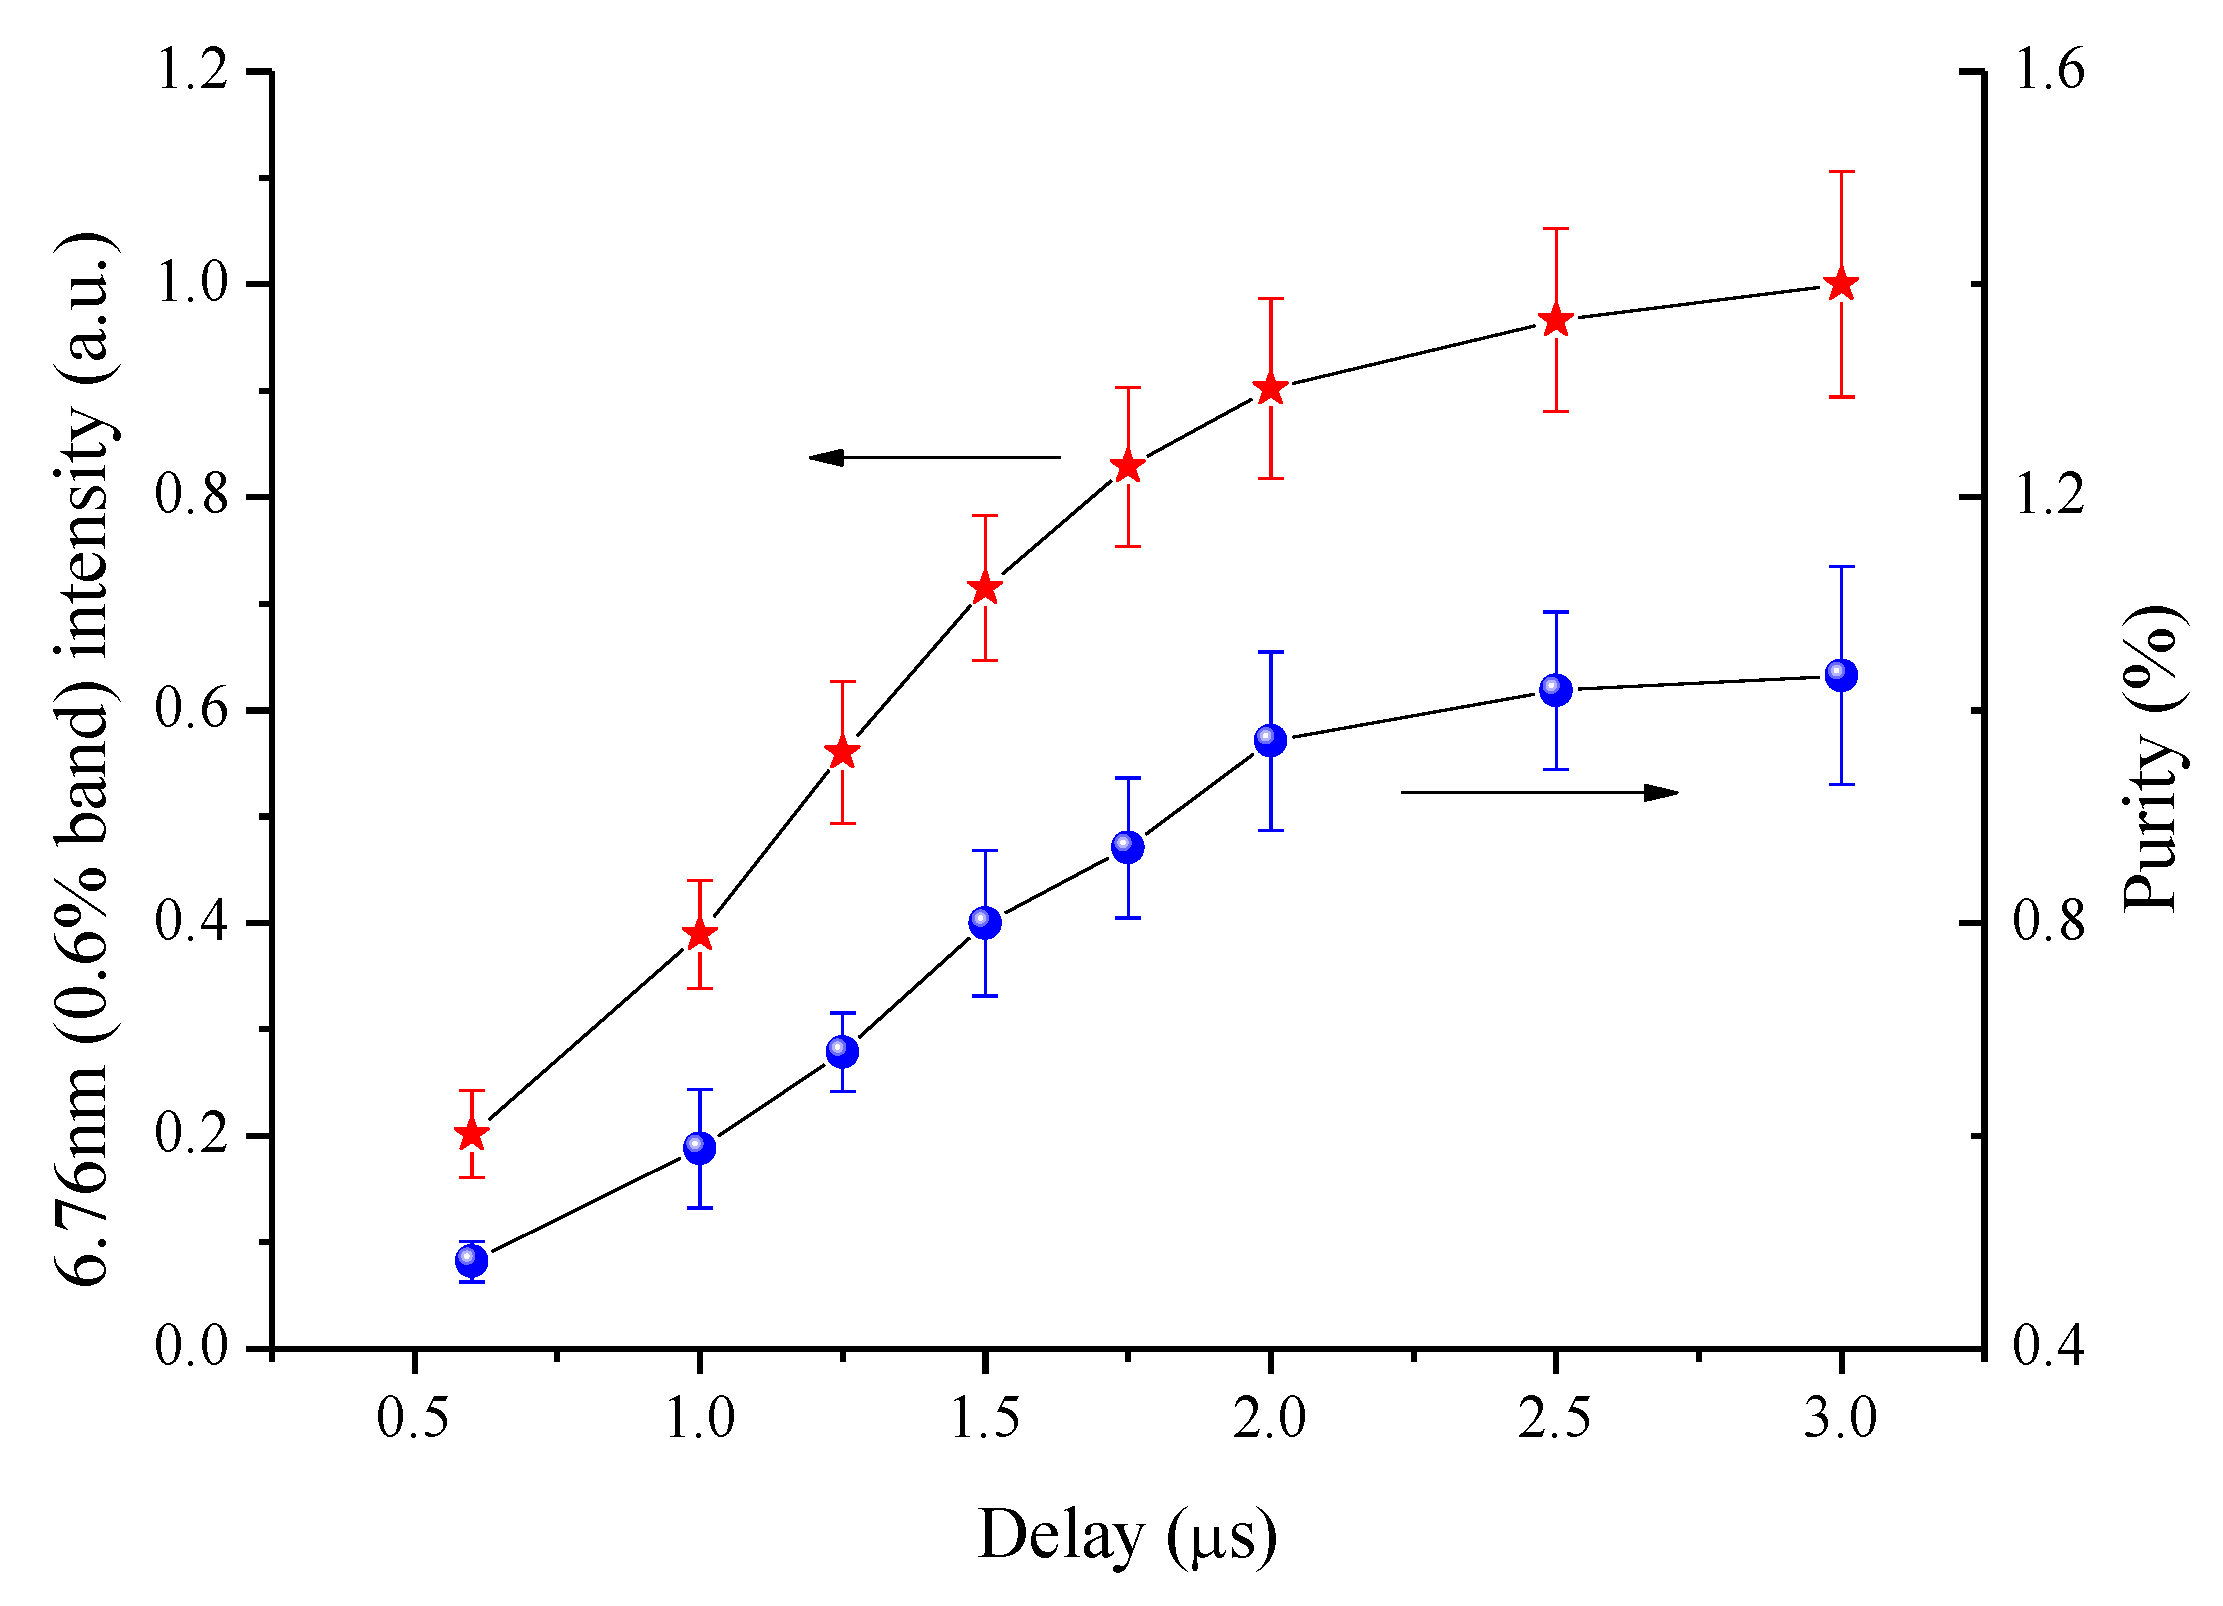
Figure 11 shows the intensity for 6.76 nm in 0.6% band (star, red) and spectral purity (blue, circular) as functions of laser-current delay. It can be seen that when the delay increases from 0.6 to 3 μs, the radiation intensity of 6.76 nm (0.6% bandwidth) increases about 240%, but the stability of the light intensity decreases. On the other hand, the spectral purity increases with an increase in delay, which shows that a longer delay is more conducive to improving the efficiency of the light source.
In this experiment, the optimal delay for 6.76 nm radiation was not obtained. On the one hand, the higher temperature is less than the optimal temperature of 115 eV, according to Figure 9. Therefore, we will try to increase the discharge current in the future. On the other hand, limited laser intensity may limit pre-plasma density, which can affect the emission intensity, so we will also study the effects of delay under different laser intensities by changing the focus lens.
5. Summary
In conclusion, we studied the laser-current delay on the emission of Gd laser-triggered discharge plasma using both experiments and simulations. The shape of the spectra changes obviously with the increase of electron temperature. The synthetic spectra predict that the purity of the 6.76 nm (0.6% band) emission and the conversion efficiency reach their maximums when the electron temperature is close to 115 eV. The mean charge state, electron temperature, as well as the 6.76 nm emission increase with the laser-current delay when the current is maintained. Longer delay leads to lower vapor velocity, which can make the plasma at the high temperature last for a longer time and achieve a stronger 6.76 nm radiation. When the delay increases from 0.6 to 3 μs, the radiation intensity of 6.76 nm (0.6% bandwidth) increases 240%, but the stability of the light intensity decreases. Moreover, the spectral purity increases with the delay, which means that longer delay is more conducive to improving the efficiency of the source.
Author Contributions
The authors have worked together to complete this research.
Funding
This work has been supported by the Fundamental Research Funds for the Central Universities (No. 2572018BC18) and Natural Science Foundation of Heilongjiang Province of China (No. QC2016078).
Conflicts of Interest
The authors declare no conflict of interest.
References
- Musgrave, C.S.; Murakami, T.; Ugomori, T.; Yoshida, K.; Fujioka, S.; Nishimura, H.; Atarashi, H.; Iyoda, T.; Nagai, K. High-space resolution imaging plate analysis of extreme ultraviolet (EUV) light from tin laser-produced plasmas. Rev. Sci. Instrum. 2017, 88, 033506. [Google Scholar] [CrossRef] [PubMed] [Green Version]
- Lim, S.; Kamohara, T.; Hosseini, S.H.R.; Katsuki, S. Dependence of current rise time on laser-triggered discharge plasma. J. Phys. D Appl. Phys. 2016, 49, 295207. [Google Scholar] [CrossRef]
- Churilov, S.S.; Ryabtsev, A.N. Analyses of the Sn IX–Sn XII spectra in the EUV region. Phys. Scr. 2006, 73, 614–619. [Google Scholar] [CrossRef]
- Zakharov, S.V.; Zakharov, V.S.; Novikov, V.G.; Mond, M.; Choi, P. Plasma dynamics in a hollow cathode triggered discharge with the influence of fast electrons on ionization phenomena and EUV emission. Plasma Sources Sci. Technol. 2008, 17, 024017. [Google Scholar] [CrossRef]
- Kuznetsov, D.S.; Yakshin, A.E.; Sturm, J.M.; Bijkerk, F. Grazing-incidence La/B-based multilayer mirrors for 6.x nm wavelength. J. Nanosci. Nanotechnol. 2019, 19, 585–592. [Google Scholar] [CrossRef] [PubMed]
- Naujok, P.; Yulin, S.; Bianco, A.; Mahne, N.; Kaiser, N.; Tunnermann, A. La/B4C multilayer mirrors with an additional wavelength suppression. Opt. Express 2015, 23, 4289–4295. [Google Scholar] [CrossRef]
- Belmonte, G.K.; Moura, C.A.D.; Reddy, P.G.; Gonsalves, K.E.; Weibel, D.E. EUV photofragmentation and oxidation of a polyarylene—Sulfonium resist: XPS and NEXAFS study. J. Photochem. Photobiol. Chem. 2018, 364, 373–381. [Google Scholar] [CrossRef]
- Oyama, T.G.; Oshima, A.; Washio, M.; Tagawa, S. Evaluation of resist sensitivity in extreme ultraviolet/soft x-ray region for next-generation lithography. AIP Adv. 2011, 1, 042153. [Google Scholar] [CrossRef] [Green Version]
- Li, B.; Otsuka, T.; Higashiguchi, T.; Yugami, N.; Jiang, W.; Endo, A.; Dunne, P.; O’Sullivan, G. Investigation of Gd and Tb plasmas for beyond extreme ultraviolet lithography based on multilayer mirror performance. Appl. Phys. Lett. 2012, 101, 013112. [Google Scholar] [CrossRef]
- Kilbane, D.; O’Sullivan, G. Extreme ultraviolet emission spectra of Gd and Tb ions. J. Appl. Phys. 2010, 108, 104905. [Google Scholar] [CrossRef] [Green Version]
- Higashiguchi, T.; Li, B.; Suzuki, Y.; Kawasaki, M.; Ohashi, H.; Torii, S.; Nakamura, D.; Takahashi, A.; Okada, T.; Jiang, W.; et al. Characteristics of extreme ultraviolet emission from mid-infrared laser-produced rare-earth Gd plasmas. Opt. Express 2013, 21, 31837–31845. [Google Scholar] [CrossRef]
- Ohashi, H.; Higashiguchi, T.; Li, B.; Suzuki, Y.; Kawasaki, M.; Kanehara, T.; Aida, Y.; Torii, S.; Makimura, T.; Jiang, W.; et al. Tuning extreme ultraviolet emission for optimum coupling with multilayer mirrors for future lithography through control of ionic charge states. J. Appl. Phys. 2014, 115, 033302. [Google Scholar] [CrossRef]
- Yin, L.; Wang, H.; Reagan, B.A.; Baumgarten, C.; Gullikson, E.; Berrill, M.; Shlyaptsev, V.N.; Rocca, J.J. 6.7-nm emission from Gd and Tb plasmas over a broad range of irradiation parameters using a single laser. Phys. Rev. Appl. 2016, 6, 034009. [Google Scholar] [CrossRef]
- Yoshida, K.; Fujioka, S.; Higashiguchi, T.; Ugomori, T.; Tanaka, N.; Ohashi, H.; Kawasaki, M.; Suzuki, Y.; Suzuki, C.; Tomita, K.; et al. Efficient extreme ultraviolet emission from one-dimensional spherical plasmas produced by multiple lasers. Appl. Phys. Express 2014, 7, 086202. [Google Scholar] [CrossRef]
- Tian, Y.; Song, X.L.; Xie, Z.; Gao, J.; Dou, Y.P.; Li, B.C.; Lin, J.Q.; Tomie, T. Sharpening of the 6.8 nm peak in an Nd: YAG laser produced Gd plasma by using a pre-formed plasma. AIP Adv. 2016, 6, 035108. [Google Scholar] [CrossRef]
- Xie, Z.; Wu, J.; Dou, Y.; Lin, J.; Tomie, T. Plasma dynamics in the initial stage of a laser-triggered discharge-plasma. J. Appl. Phys. 2018, 124, 213303. [Google Scholar] [CrossRef]
- Zhu, Q.; Yamada, J.; Kishi, N.; Watanabe, M.; Okino, A.; Horioka, K.; Hotta, E. Investigation of the dynamics of theZ-pinch imploding plasma for a laser-assisted discharge-produced Sn plasma EUV source. J. Phys. D Appl. Phys. 2011, 44, 145203. [Google Scholar] [CrossRef]
- Lu, P.; Katsuki, S.; Watanebe, T.; Akiyama, H. Electrical recovery after laser-assisted discharge for highly repetitive plasma EUV source. IEEE Trans. Plasma Sci. 2011, 39, 1849–1854. [Google Scholar] [CrossRef]
- Beyene, G.A.; Tobin, I.; Juschkin, L.; Hayden, P.; O’Sullivan, G.; Sokell, E.; Zakharov, V.S.; Zakharov, S.V.; O’Reilly, F. Laser-assisted vacuum arc extreme ultraviolet source: A comparison of picosecond and nanosecond laser triggering. J. Phys. D Appl. Phys. 2016, 49, 225201. [Google Scholar] [CrossRef]
- Vinokhodov, A.Y.; Krivtsun, V.M.; Lash, A.A.; Borisov, V.M.; Yakushev, O.F.; Koshelev, K.N. High-brightness laser-induced EUV source based on tin plasma with an unlimited lifetime of electrodes. Quantum Electron. 2016, 46, 81–87. [Google Scholar] [CrossRef]
- Lu, P.; Katsuki, S.; Tomimaru, N.; Ueno, T.; Akiyama, H. Dynamic characteristics of laser-assisted discharge plasmas for extreme ultraviolet light sources. Jpn. J. Appl. Phys. 2010, 49, 096202. [Google Scholar] [CrossRef]
- Kieft, E.R.; van der Mulen, J.J.A.M.; Banine, V. Subnanosecond thomson scattering on a vacuum arc discharge in tin vapor. Phys. Rev. E Stat. Nonlinear Soft Matter Phys. 2005, 72, 026415. [Google Scholar] [CrossRef] [PubMed]
- Su, M.G.; Min, Q.; Cao, S.Q.; Sun, D.X.; Hayden, P.; O’Sullivan, G.; Dong, C.Z. Evolution analysis of EUV radiation from laser-produced tin plasmas based on a radiation hydrodynamics model. Sci. Rep. 2017, 7, 45212. [Google Scholar] [CrossRef] [Green Version]
- Churilov, S.S.; Kildiyarova, R.R.; Ryabtsev, A.N.; Sadovsky, S.V. EUV spectra of Gd and Tb ions excited in laser-produced and vacuum spark plasmas. Phys. Scr. 2009, 80, 045303. [Google Scholar] [CrossRef]
- Colombant, D. X-ray emission in laser-produced plasmas. J. Appl. Phys. 1973, 44, 3524. [Google Scholar] [CrossRef]
- Masnavi, M.; Nakajima, M.; Sasaki, A.; Hotta, E.; Horioka, K. Potential of discharge-based lithium plasma as an extreme ultraviolet source. Appl. Phys. Lett. 2006, 89, 031503. [Google Scholar] [CrossRef]
- Yoshida, K.; Fujioka, S.; Higashiguchi, T.; Ugomori, T.; Tanaka, N.; Kawasaki, M.; Suzuki, Y.; Suzuki, C.; Tomita, K.; Hirose, R. Density and X-ray emission profile relationships in highly ionized high-Z laser-produced plasmas. Appl. Phys. Lett. 2015, 106, 121109. [Google Scholar] [CrossRef]
- Li, B.; Dunne, P.; Higashiguchi, T.; Otsuka, T.; Yugami, N.; Jiang, W.; Endo, A.; O’Sullivan, G. Gd plasma source modeling at 6.7 nm for future lithography. Appl. Phys. Lett. 2011, 99, 231502. [Google Scholar] [CrossRef]
- Otsuka, T.; Kilbane, D.; Higashiguchi, T.; Yugami, N.; Yatagai, T.; Jiang, W.; Endo, A.; Dunne, P.; O’Sullivan, G. Systematic investigation of self-absorption and conversion efficiency of 6.7 nm extreme ultraviolet sources. Appl. Phys. Lett. 2010, 97, 231503. [Google Scholar] [CrossRef] [Green Version]
- Makhotkin, I.A.; Zoethout, E.; Louis, E.; Yakunin, A.M.; Müllender, S.; Bijkerk, F. Spectral properties of La/B- based multilayer mirrors near the boron K absorption edge. Opt. Express 2012, 20, 11778–11786. [Google Scholar] [CrossRef]
- Hosokai, T.; Yokoyama, T.; Zhidkov, A.; Sato, H.; Hotta, E.; Horioka, K. Elongation of extreme ultraviolet (at 13.5 nm) emission with time-of-flight controlled discharges and lateral fuel injection. J. Appl. Phys. 2008, 104, 053306. [Google Scholar] [CrossRef]
- Song, X.L.; Song, X.W.; Dou, Y.P.; Tian, Y.; Xie, Z.; Gao, X.; Lin, J.Q.; Science, S.O. Out-of-band radiation and spatio-temporal characterization of Gd target laser plasma sources. Spectrosc. Spect. Anal. 2016, 36, 3114–3118. [Google Scholar]
Figure 1.
Schematic diagram of the experimental setup.

Figure 2.
Schematic diagram of the power supply.

Figure 3.
Time series diagram of the experimental setup.

Figure 4.
Relationships between the laser signal (a, black line), voltage (b, red line), the discharge current (c, blue line) for two conditions. (A) The high voltage is maintained until the plasma ignited by the laser passes through the cathode and the anode. (B) The laser ablated the Gd long before the voltage is loaded between the two electrodes.

Figure 5.
Relationships between the ionic population and average ionization of Gd plasma as functions of electron temperature at the electron density of 1019 cm−3.
Figure 5.
Relationships between the ionic population and average ionization of Gd plasma as functions of electron temperature at the electron density of 1019 cm−3.

Figure 6.
Plots of the spectral purity and the intensity of 6.76 nm (0.6% bandwidth) as a function of electron temperature.
Figure 6.
Plots of the spectral purity and the intensity of 6.76 nm (0.6% bandwidth) as a function of electron temperature.

Figure 7.
Theoretical Gd spectra as a function of electron temperature between 40 and 140 eV. Intensities are normalized at each maximum.
Figure 7.
Theoretical Gd spectra as a function of electron temperature between 40 and 140 eV. Intensities are normalized at each maximum.

Figure 8.
Time-integrated Gd beyond extreme ultraviolet (BEUV) emission spectra of the laser-triggered discharges (LTDs) under different laser-current delay: (a) original spectra between 6.0 and 8.0 nm; (b) normalized spectra according to each maximum.
Figure 8.
Time-integrated Gd beyond extreme ultraviolet (BEUV) emission spectra of the laser-triggered discharges (LTDs) under different laser-current delay: (a) original spectra between 6.0 and 8.0 nm; (b) normalized spectra according to each maximum.

Figure 9.
Comparison of theoretical spectra (red, dashed line) with the experimental spectra (black, solid line) at electron temperatures 100 and 40 eV for a laser-current delay of 2 μs. The fractions of the contributing ion stages for the two electron temperatures are given in the inset.
Figure 9.
Comparison of theoretical spectra (red, dashed line) with the experimental spectra (black, solid line) at electron temperatures 100 and 40 eV for a laser-current delay of 2 μs. The fractions of the contributing ion stages for the two electron temperatures are given in the inset.

Figure 10.
Comparison of theoretical spectra (red, dashed line) with the experimental spectra (black, solid line) at electron temperatures 80 and 35 eV for a laser-current delay of 0.6 μs. The fractions of the contributing ion stages for the two electron temperatures are given in the inset.
Figure 10.
Comparison of theoretical spectra (red, dashed line) with the experimental spectra (black, solid line) at electron temperatures 80 and 35 eV for a laser-current delay of 0.6 μs. The fractions of the contributing ion stages for the two electron temperatures are given in the inset.

Figure 11.
Plots of intensity for 6.76 nm in 0.6% band (star, red) and spectral purity (blue, circular) as a function of laser-current delay.
Figure 11.
Plots of intensity for 6.76 nm in 0.6% band (star, red) and spectral purity (blue, circular) as a function of laser-current delay.

© 2019 by the authors. Licensee MDPI, Basel, Switzerland. This article is an open access article distributed under the terms and conditions of the Creative Commons Attribution (CC BY) license (http://creativecommons.org/licenses/by/4.0/).
Share and Cite
MDPI and ACS Style
Xu, Q.; Tian, H.; Zhao, Y.; Wang, Q. Effect of Time Delay on Laser-Triggered Discharge Plasma for a Beyond EUV Source. Symmetry 2019, 11, 658. https://doi.org/10.3390/sym11050658
AMA Style
Xu Q, Tian H, Zhao Y, Wang Q. Effect of Time Delay on Laser-Triggered Discharge Plasma for a Beyond EUV Source. Symmetry. 2019; 11(5):658. https://doi.org/10.3390/sym11050658
Chicago/Turabian StyleXu, Qiang, He Tian, Yongpeng Zhao, and Qi Wang. 2019. "Effect of Time Delay on Laser-Triggered Discharge Plasma for a Beyond EUV Source" Symmetry 11, no. 5: 658. https://doi.org/10.3390/sym11050658
Note that from the first issue of 2016, this journal uses article numbers instead of page numbers. See further details here.