Systematic Review

Diagnostic Performance of Artificial Intelligence in Rib Fracture Detection: Systematic Review and Meta-Analysis

by
Marnix C. L. van den Broek
*,
Jorn H. Buijs
,
Liselotte F. M. Schmitz
and
Mathieu M. E. Wijffels
Trauma Research Unit, Department of Surgery, Erasmus MC, University Medical Center Rotterdam, 3000 CA Rotterdam, The Netherlands
*
Author to whom correspondence should be addressed.
Surgeries 2024, 5(1), 24-36; https://doi.org/10.3390/surgeries5010005
Submission received: 15 November 2023 / Revised: 22 December 2023 / Accepted: 27 December 2023 / Published: 16 January 2024

Abstract

:
Artificial intelligence (AI) is a promising tool for diagnosing rib fractures. To date, only a few studies have quantified its performance. The objective of this systematic review was to assess the accuracy of AI as an independent tool for rib fracture detection on CT scans or radiographs. This was defined as the combination of sensitivity and specificity. PubMed (including MEDLINE and PubMed Central) was systematically reviewed according to the PRISMA statement followed by citation searching among studies up to December 2022. Methods of the analysis and inclusion criteria were prespecified in a protocol and published on PROSPERO (CRD42023479590). Only diagnostic studies of independent AI tools for rib fracture detection on CT scans and X-rays reporting on sensitivity and/or specificity and written in English were included. Twelve studies met these criteria, which included 11,510 rib fractures in total. A quality assessment was performed using an altered version of QUADAS-2. Random-effects meta-analyses were performed on the included data. If specificity was not reported, it was calculated on a set of assumptions. Pooled sensitivity and specificity were 0.85 (95% CI, 0.78–0.92) and 0.96 (95% CI, 0.94–0.97), respectively. None of the included studies used X-rays. Thus, it can be concluded that AI is accurate in detecting rib fractures on CT scans. Overall, these findings seemed quite robust, as can be concluded from the study quality assessment, therefore AI could potentially play a substantial role in the future of radiological diagnostics.

1. Introduction

1.1. Rationale

Thoracic trauma is a common type of injury, as it accounts for 10–15% of all trauma-related hospital admissions [1]. In patients with thoracic trauma, a traumatic rib fracture is the most common type of injury. These fractures are clinically relevant because they are associated with significant pulmonary morbidity, mortality and decreased long-term quality of life [2,3], and early detection can improve their mortality and pulmonary morbidity [4,5].
Imaging modalities that are commonly used in the evaluation of trauma patients are radiography and CT. Radiography, on the one hand, is quick and is therefore useful in initial critical management and triage [6]. CT on the other hand, gives a better insight into the injury severity and is more likely to detect additional findings that may change management [6], but its interpretation can be very time-consuming and its error rate can increase with time pressure and a noisy environment, which are common during the examination of trauma patients [7,8].
Artificial intelligence (AI) is a technology that could potentially solve these issues, as AI can provide interpretations almost instantaneously and its error rate is not affected by factors such as time pressure and a noisy environment. In addition to that, AI has already been proven to be effective in other visual recognition tasks in the medical field: previous studies have found that AI was equally capable as physicians in identifying pulmonary embolism [9], stroke [10], skin cancer [11] and diabetic retinopathy [12].
To date, only one review has been published on the performance of AI in the detection of rib fractures. It concluded that the use of AI in rib fracture detection is a very promising application of the technology and that AI can aid radiologists in interpreting images. In addition to lacking a systematic approach, this article only included three articles and lacked any quantitative analysis [13].
To increase the level of evidence and to enable future comparisons, the current systematic review aimed to gather and compare related clinical studies systematically, quantifying the accuracy of AI in detecting rib fractures and assessing the quality of the evidence available.

1.2. Objectives

Diagnostic case–control studies, diagnostic cohort studies and diagnostic randomized controlled trials (RCTs) were reviewed to examine the sensitivity and specificity of AI in the detection of rib fractures. These studies were included if they evaluated the performance of AI tools in detecting rib fractures that were previously diagnosed in a thoracic X-ray or CT scan by at least two radiologists. The results of these studies needed to be based on AI-only achievements. This decision was made to investigate the potential of AI in replacing radiologists and to reduce heterogeneity that results from human influences.

2. Materials and Methods

2.1. Protocol and Registration

Methods of the analysis and inclusion criteria were prespecified in a protocol and published on PROSPERO (CRD42023479590). The PRISMA statement was used to validate the research process [14].

2.2. Eligibility Criteria

Eligibility criteria were based on PICOS (Table 1): studies reporting on patients with rib fractures of all types (fresh, healing and old fractures, partial and complete fractures, etc.) that were diagnosed by at least two radiologists via evaluation of a CT scan or thoracic X-ray were included. All types of AI which have been trained in the identification of rib fractures were examined. Furthermore, studies from which the sensitivity and/or specificity of the AI on its own could be extracted were included, and studies where that was not the case were excluded. Accuracy was used as the primary outcome, which was defined as the combination of sensitivity and specificity. Finally, only diagnostic case–control studies, diagnostic cohort studies and diagnostic RCTs were included.

2.3. Information Sources

A multi-database search on PubMed (including MEDLINE and PubMed Central) was performed to identify all relevant studies up to December 2022. In addition to that, a citation search was performed among the studies that resulted from the PubMed search, by screening all the titles presented by the “Cited by” tool. The citation search was used to assess the completeness of the initial search in identifying relevant articles.

2.4. Search

Relevant search terms were selected from the MeSH tree of the National Library of Medicine and from relevant studies that were manually identified on PubMed. This resulted in the following search:
“(Artificial intelligence [MeSH Terms] OR Artificial intelligence OR AI OR Machine learning OR Deep Learning OR Convolutional Neural Network OR Transfer Learning OR Computer-Aided Detection) AND (Rib fractures [MeSH Terms] OR rib fracture OR Broken rib)”.
The initial PubMed search was performed on 9 December 2022, and the citation search was conducted on 11 December 2022. Articles published after these dates were not reviewed. Limitations or filters, such as language, were not used.
To ensure reproducibility, the methods section was reviewed by another group of researchers from the Erasmus University of Rotterdam. The same search was conducted by the other group to confirm whether they obtained the same number of results. Furthermore, their feedback was utilized to improve the methods.

2.5. Study Selection

Three researchers independently selected studies for evaluation of eligibility by screening the title and abstract of all the retrieved studies. If a researcher deemed a study eligible, the same or another researcher evaluated the full text of the study for correspondence with the earlier defined PICOS in a structured manner using a spreadsheet. If the full text met all the PICOS criteria, it was included in the systematic review and meta-analysis. If a researcher was not sure if the PICOS criteria were met for a certain article, all three researchers discussed the study until they reached a consensus.

2.6. Data Collection Process

All of the data were extracted by two members of the research team (MB, JB or LS). Disagreement was solved by discussion between these two members. If the two researchers could not reach an agreement, the third researcher decided on the issue. If not all the data that was needed for the meta-analysis were available, the authors were sent an email with a request for additional data. Additional data would have been extracted in the same way as the data found initially.

2.7. Data Items

The following data were extracted from the included studies: (1) characteristics of participants (method of diagnosis, characteristics of fracture type); (2) type of intervention (AI or AI in combination with specialists); (3) outcome measures (including sensitivity and specificity); (4) study type (diagnostic case–control studies, diagnostic cohort studies or diagnostic RCT).

2.8. Risk of Bias in Individual Studies

To perform a quality assessment, a modified version of the Quality Assessment of Diagnostic Accuracy Studies 2 (QUADAS-2) tool was used [15] (Table S2, Text S1). Each included study was randomly assigned to two researchers for quality assessment. The two researchers scored the studies independently on 7 different domains (1A, 1B, 2A, 2B, 3A, 3B, 4), and if they agreed, the scores were accepted immediately. Discrepancies in the two assessments per study were solved by discussion. If the two researchers could not reach a consensus, a third researcher decided on the number of points that would be attributed to the domain of discrepancy. The final sum of the points given to a study placed the study into a quality score group: a total score of ≤2 was rated as low quality, scores of 3 and 4 as intermediate quality, and a score of ≥5 as high quality. This quality control was performed to test the hypothesis that the quality of the included studies influenced the performance of the AI.

2.9. Summary Measures

Accuracy was selected as the primary outcome and consisted of sensitivity and specificity. Secondary outcomes were F1-score, precision, positive predictive value (PPV), negative predictive value (NPV) and time, which are included in the supplementary material, but are not further discussed in this systematic review.

2.10. Synthesis of Results

For the synthesis of results, the meta-analysis tool of IBM SPSS statistics version 29.0.0.0 was used.
Many studies did not present the outcomes to the reader immediately. Therefore, some of the missing outcomes were derived from other data. To calculate the specificity of the AI, the numbers of true negatives were needed, which were quite often not mentioned in the studies. To estimate the number of true negatives, the assumption was made that every included patient had 24 ribs. From there, the total number of ribs in the study was calculated. Furthermore, it was assumed that every rib could only be broken once. By subtracting the number of fractures from the total number of ribs, the number of ribs that were not broken could be calculated: the true negatives.
Separate meta-analyses were performed on the different outcomes present in the gathered data. Random-effects models were used for these meta-analyses, independently of a calculated statistic of heterogeneity, as there was a good chance of between-study variability because of the lack of standardization in the diagnostic study type and because of the novelty of AI.
The amount of heterogeneity from the different studies in both outcomes was assessed through an I² analysis. The I² statistic was chosen because its power does not increase excessively for large amounts of included studies, unlike the power of the conventional chi-squared test.

2.11. Risk of Bias across Studies

A visual assessment of the risk of publication bias for the outcomes was performed by looking for asymmetry in their funnel plots. Additionally, an Egger’s test was performed if the meta-analysis included more than 10 studies and the meta-analysis was deemed prone to publication bias after assessment of the funnel plots. A threshold of ten studies was used, as the power of the Eggers test is otherwise usually too low to distinguish chance from real asymmetry [16].
Furthermore, the risk of within-study selective reporting was assessed by giving each study a score based on the number of outcomes stated in the methods section, but not reported on in the results section. Every such discrepancy was awarded 1 point. The total number of points a study received indicated the risk of within-study selective reporting. A total score of 0 was rated as low risk, a score of 1 as intermediate risk, and scores greater than 1 as high risk.

2.12. Additional Analyses

Sensitivity analyses, through which the different outcomes were examined according to the different domains of the quality assessment (risk of bias and concerns regarding applicability in patient selection, index test(s), reference standard and flow and timing) were prespecified.

3. Results

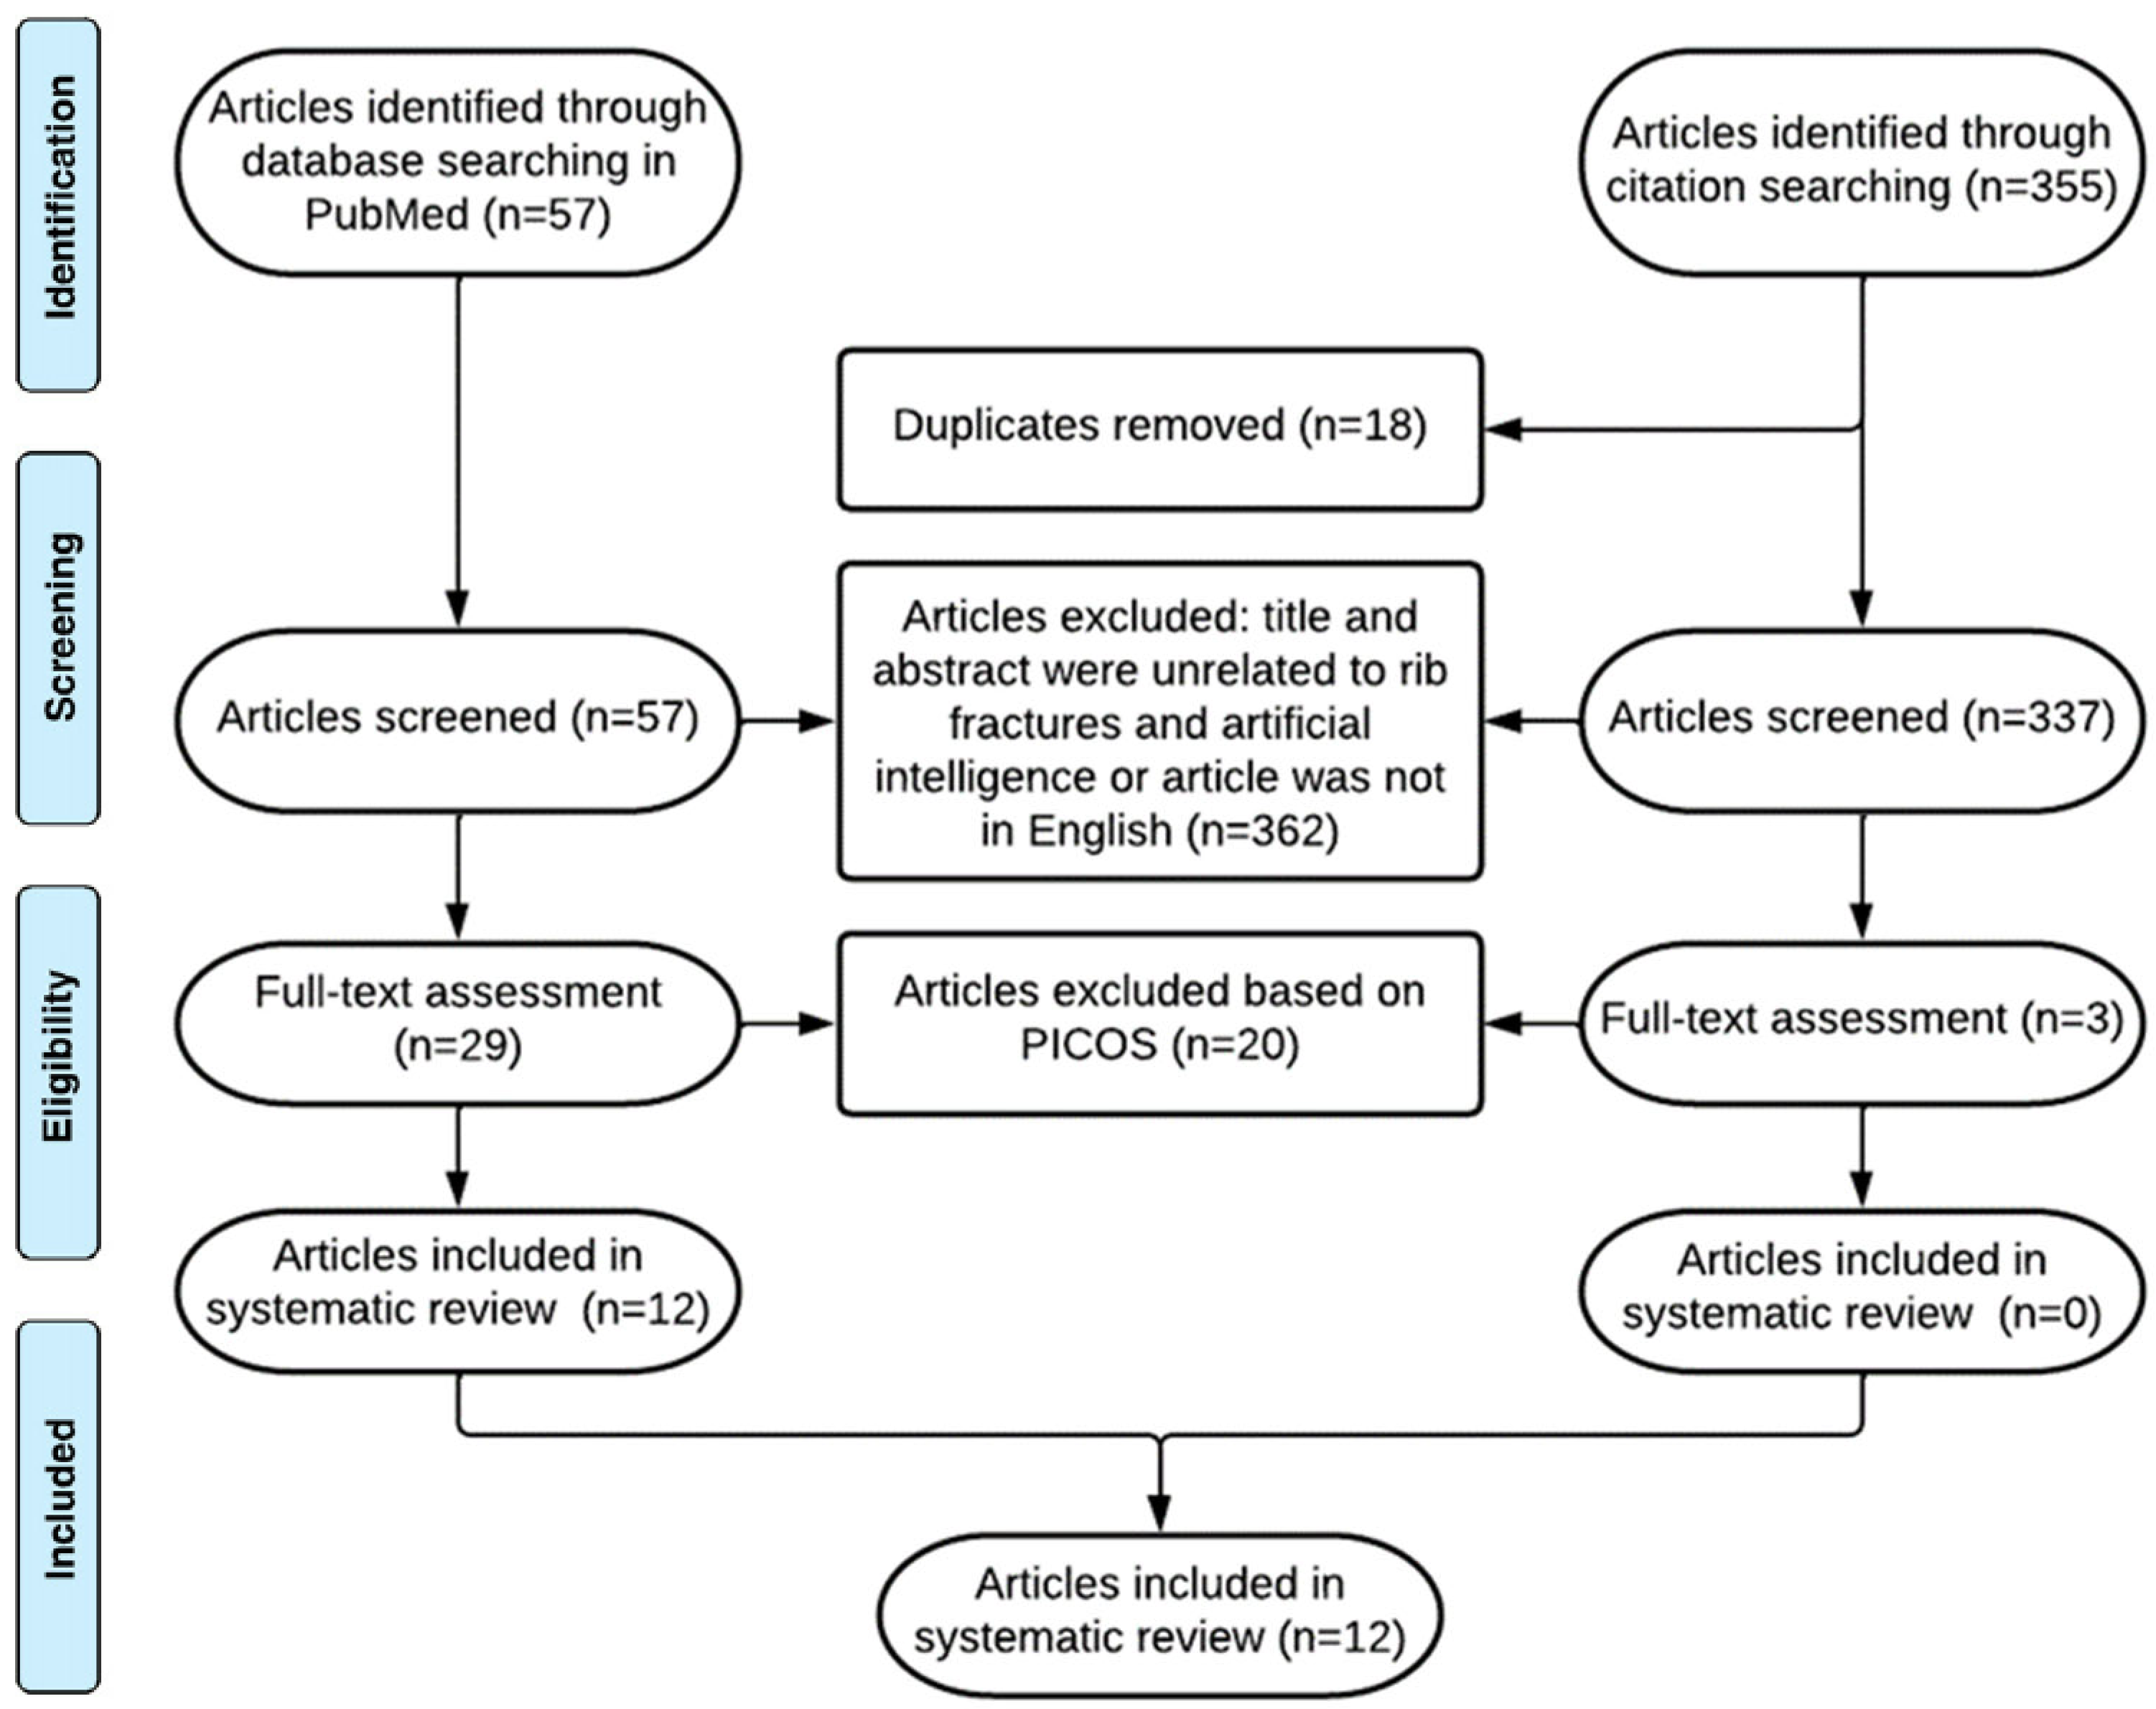
3.1. Study Selection

A total of 57 studies were identified through the multi-database search and another 355 through citation searching (Figure 1). After duplicates were removed manually, 394 studies were left, which were then screened for relevance to this review. In total, 362 studies were excluded based on this screening (the title or abstract was unrelated to rib fractures and/or AI or the study was not in English). On the remaining 32 studies, a full-text assessment was performed, through which 20 more studies were excluded. In the end, 12 studies were included in the systematic review [17,18,19,20,21,22,23,24,25,26,27,28], all of which were identified in the initial search. Unpublished relevant studies were not obtained.

3.2. Study Characteristics

There were quite large differences in the sizes of the datasets, ranging from 30 to 1613 included patients or scans (Table 2). Furthermore, all included studies had CT scans as their input feature and all studies presented sensitivity as one of their outcomes that were relevant to this systematic review. The reference standard was quite similar for all the included studies, and all of them were retrospective. The quality of the studies ranged from intermediate to high quality: 2 studies with intermediate quality [18,19] and 10 studies with high quality [17,20,21,22,23,24,25,26,27,28].

3.3. Risk of Bias within Studies: Quality Assessment

In total, 6 of the 12 studies were awarded full points on patient selection, and 2 studies scored 0 points (Table S4). As for the domain of the index test, 9 studies were given the full points and none scored 0 points. Furthermore, in the assessment of the reference test, 8 studies were given full points, and none received 0 points. Flow and timing were also assessed, and all studies were deemed worth the full number of points. In the end, 2 studies received the label “intermediate quality” [18,19], and 10 received the label “high quality” [17,20,21,22,23,24,25,26,27,28]. No studies were given the label “poor quality”.

3.4. Results of Individual Studies

Results were collected from all the included studies (Table S5.1). Most of the articles presented sensitivity in text or tables. The other metrics were only rarely presented to the reader, so they needed to be calculated.

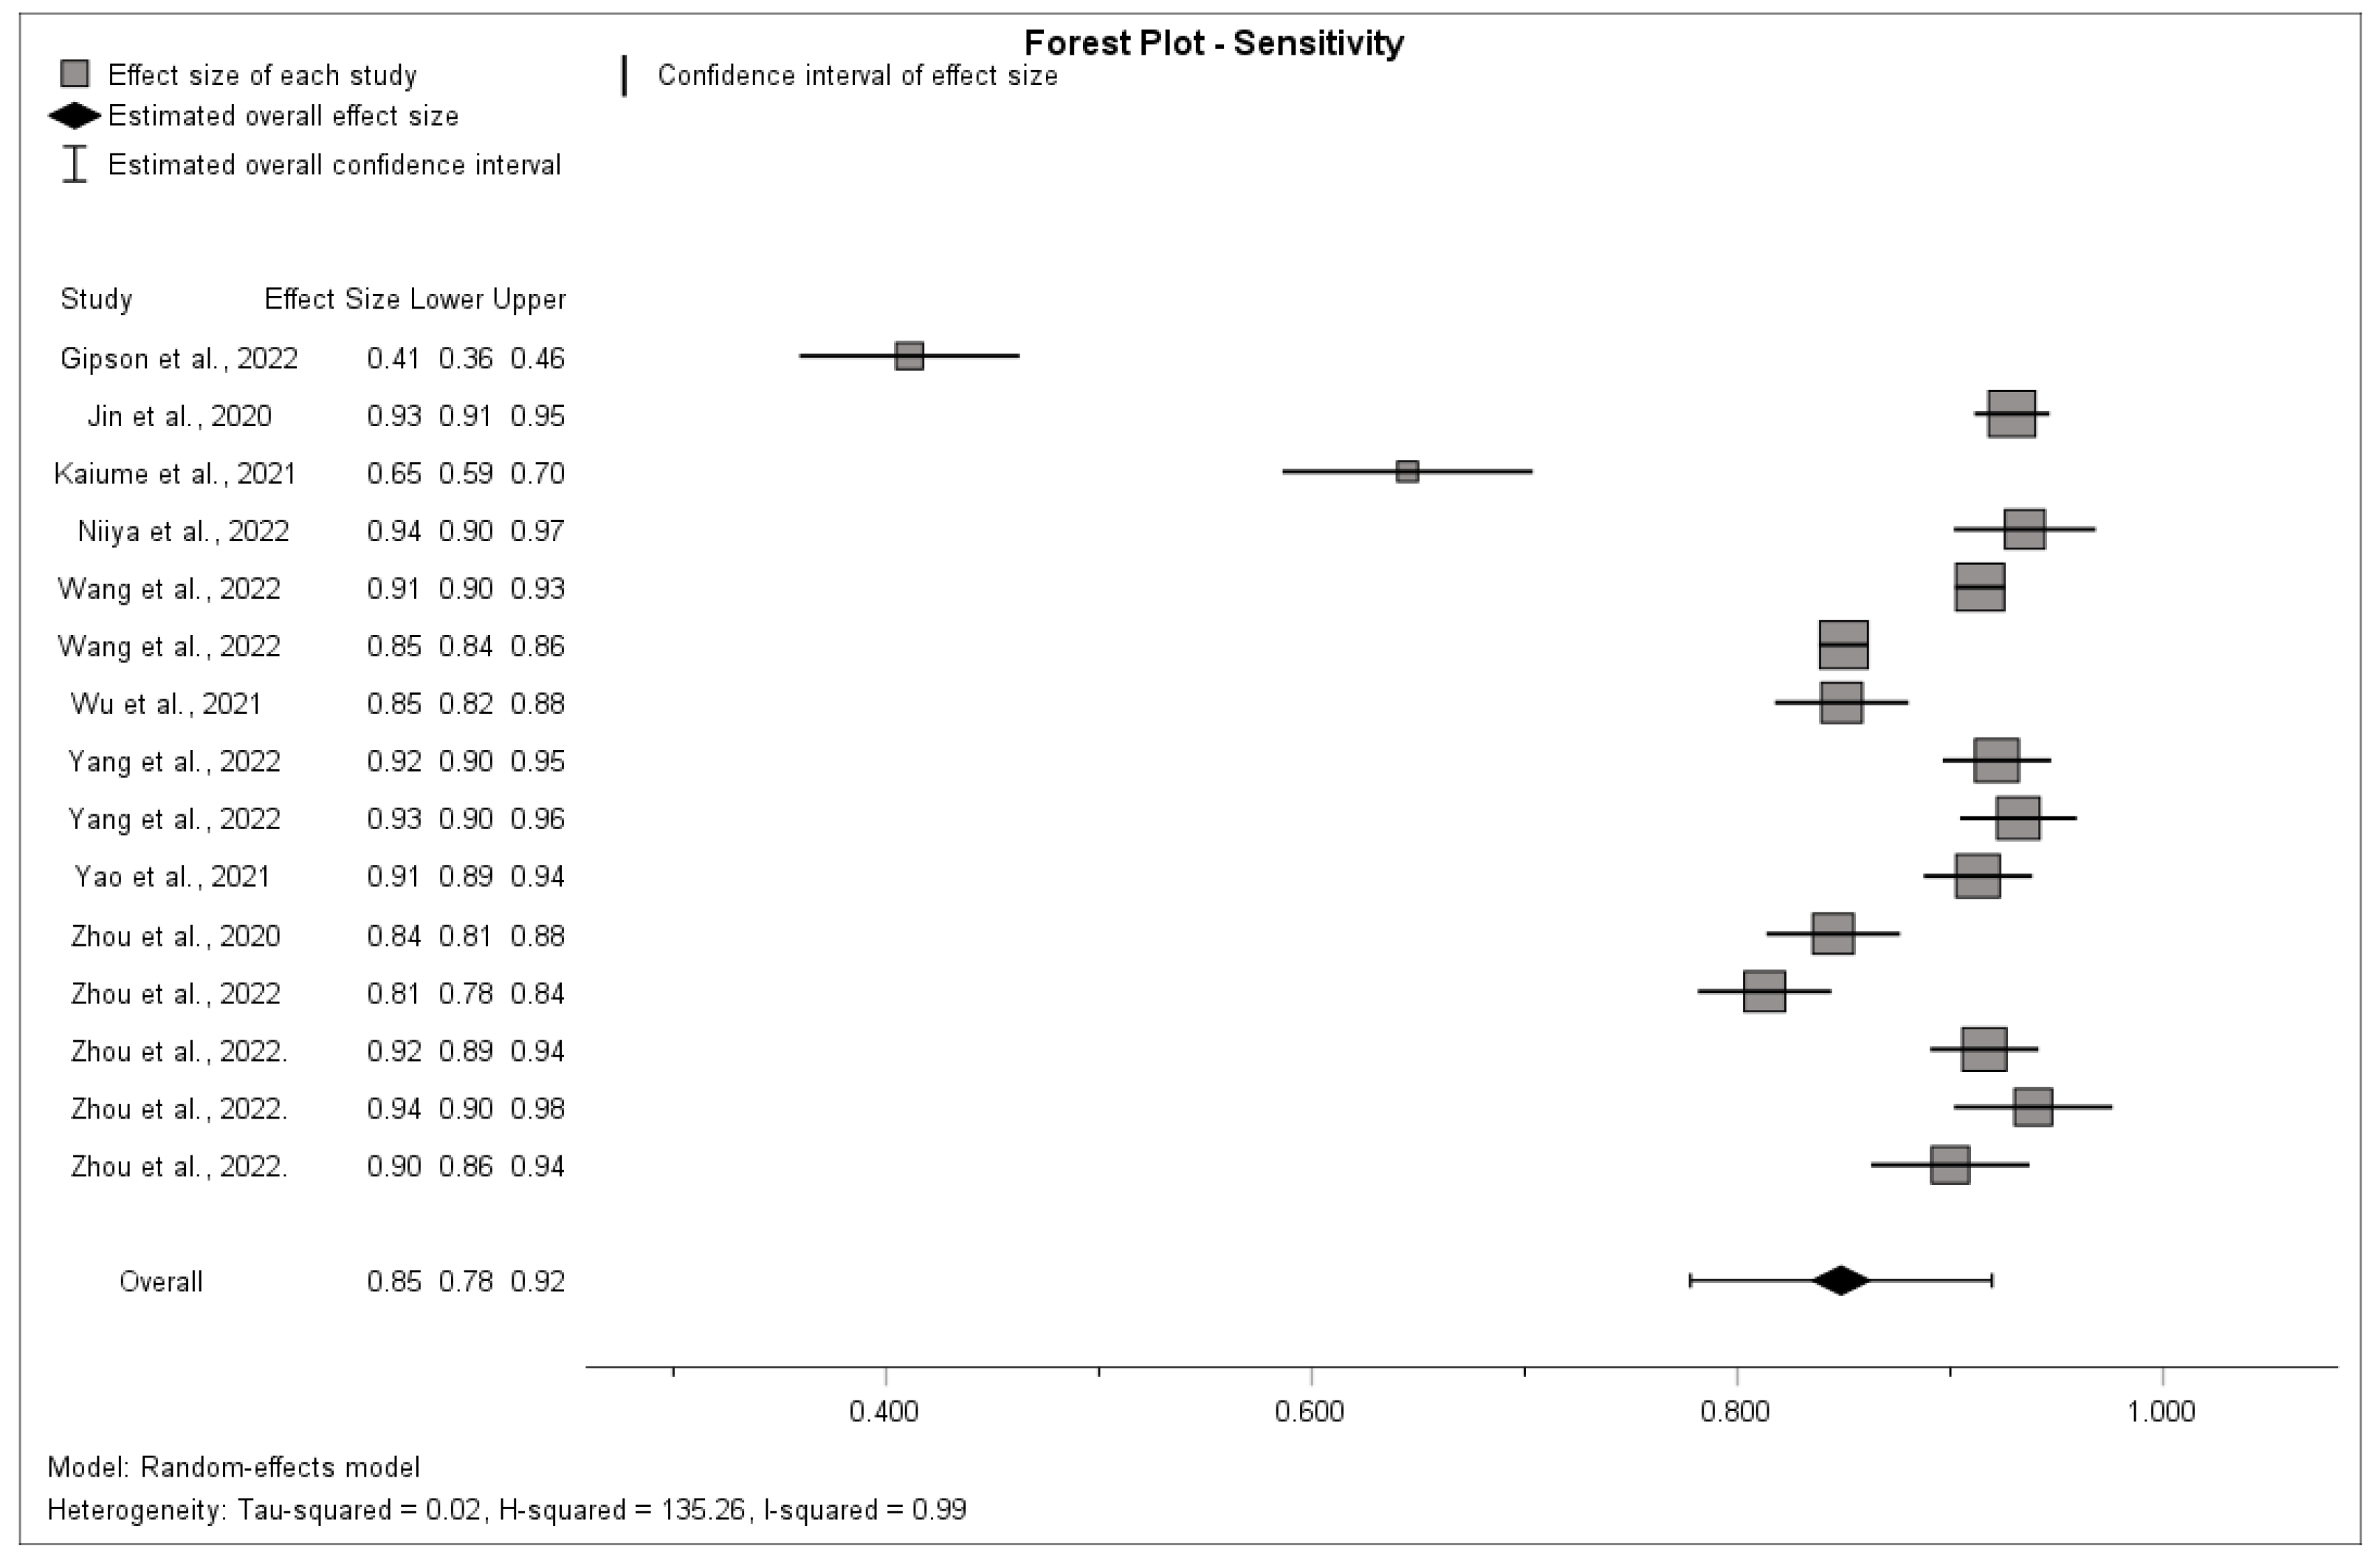
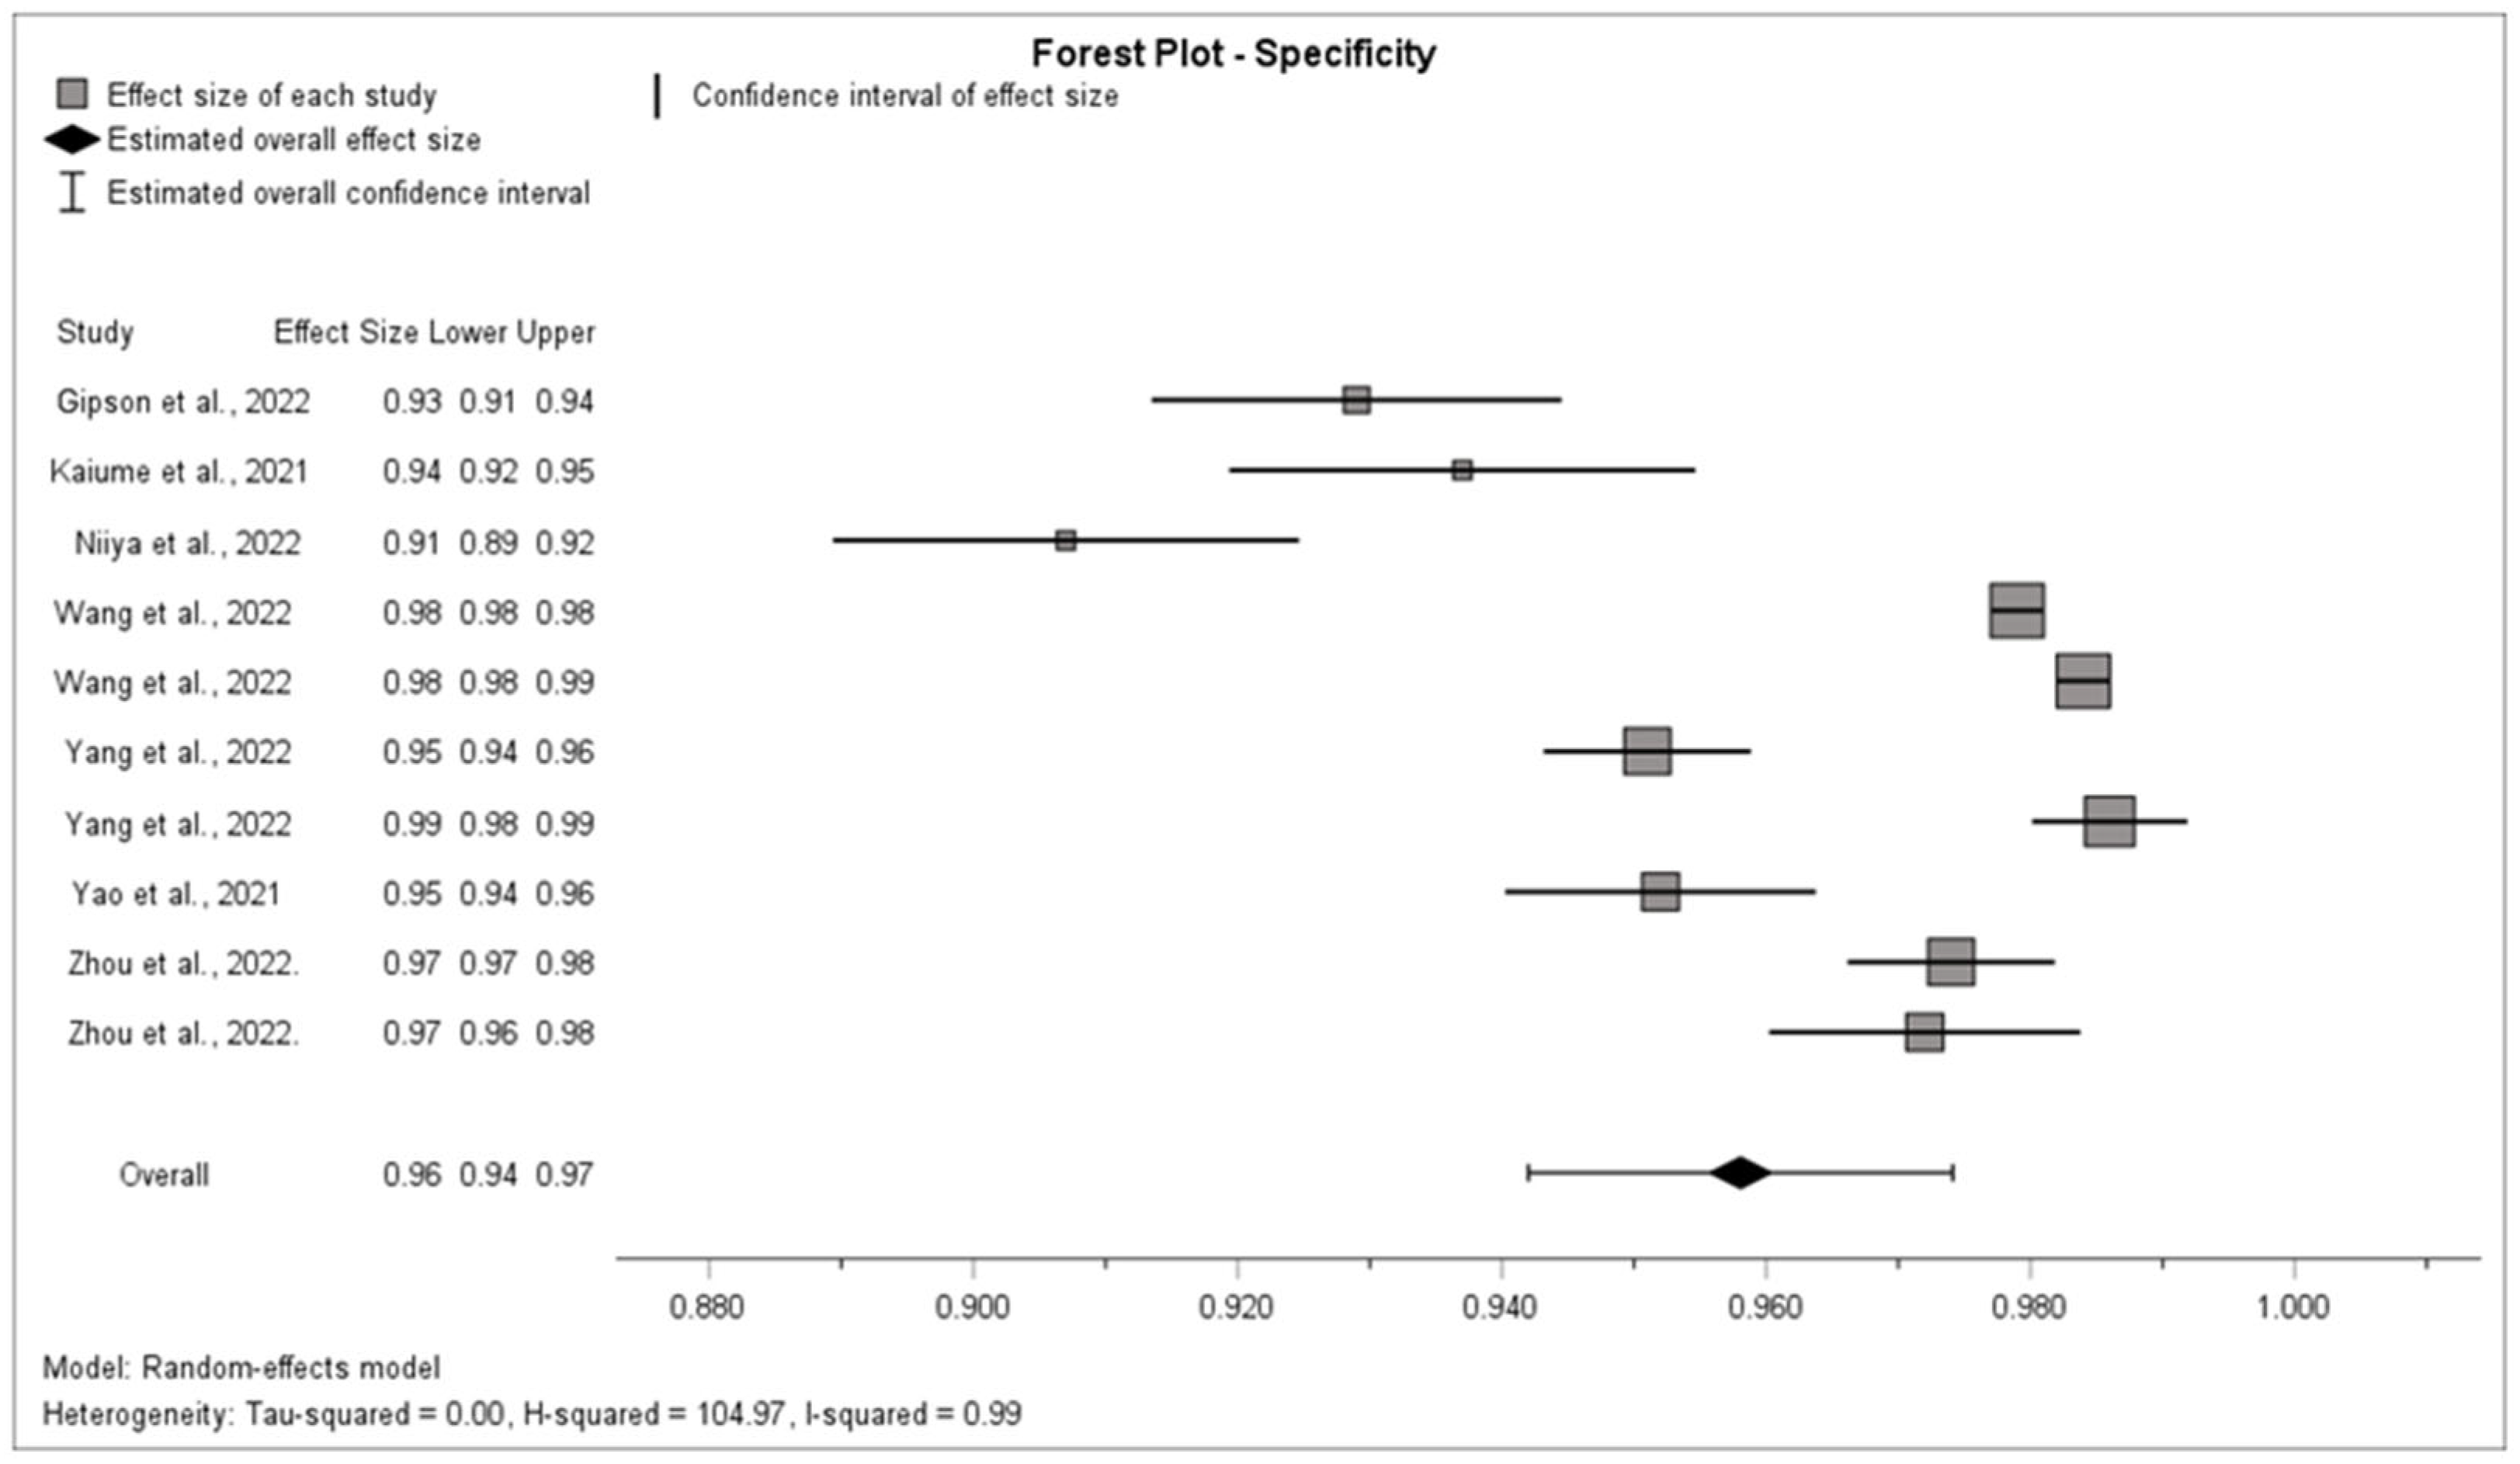
3.5. Synthesis of Results

Data on sensitivity were available for all 12 studies as 15 sensitivities from 15 datasets. This included 11,510 rib fractures. In the meta-analysis, the overall sensitivity was 0.85 (95% CI, 0.78–0.92) and there was strong evidence of heterogeneity (I² = 0.99) (Figure 2).
The specificity was calculated in three ways: The first calculation only included specificities that could be taken from the studies directly or could be calculated using other values present. For the second calculation, only values that were partially based on the previously defined set of assumptions were included. The third calculation included all the values.
Data on specificity were directly available for two studies: one study [28] presented the specificity in the text and the other study [22] presented numbers on true negatives and false positives from which the specificity could be calculated directly. A meta-analysis was conducted on the two datasets of these two studies, which included 2300 undamaged ribs. In this first meta-analysis on the specificity, the overall specificity was 0.94 (95% CI, 0.92–0.96) (Figure S2.6).
For five other studies [19,21,24,25,26], the specificity could be calculated by combining the false positives with an estimation of the number of true negatives. A meta-analysis was conducted on the eight datasets of these five studies, which included 79,891 undamaged ribs. In this second meta-analysis of the specificity, the overall specificity was 0.96 (95% CI, 0.94–0.98) (Figure S2.6).
A third meta-analysis was conducted on the combined ten datasets of a total of seven studies [19,21,22,24,25,26,28], which included 82,191 undamaged ribs. In this meta-analysis, the overall specificity was 0.96 (95% CI, 0.94–0.97), and there was strong evidence of heterogeneity (I² = 0.99) (Figure 3).
A heterogeneity of around an I² of 0.99 was found for both tested metrics. This high I² statistic can probably be explained by differences in datasets used for training and testing, and by differences in the type of AI used. Often, these study characteristics were unclear, and therefore it was not possible to further narrow down an explanation of the identified heterogeneity.

3.6. Risk of Bias across Studies

3.6.1. Assessment of the Risk of Publication Bias

The possibility of publication bias was assessed visually by evaluating a funnel plot of each outcome for asymmetry. Multiple factors can be responsible for an asymmetric funnel plot, including poor study quality, true study heterogeneity, reporting biases, artifactual causes, and asymmetry by chance. The funnel plot of the sensitivity shows asymmetry, which may indicate publication bias (Figure S3.1). However, some of the smaller studies [26,28] show smaller values for the different detection measurements. This would argue against publication bias because smaller studies have a bigger risk of finding significantly large false positive effect estimates when performing multiple analyses. After all, smaller studies have more sampling errors in their effect estimates [16]. Larger effects may seem worthy of publishing, but in this case, the study findings are relatively small and were still published. This reduces the chance of it being publication bias, since small values are less interesting to publish, and are thus likely not published selectively. This also applies to the asymmetry of the specificity funnel plot, where there are small studies with small effect estimates and large studies with big effect estimates (Figure S3.2). Selective outcome reporting and selective analysis reporting are unlikely since they were assessed and deemed low risk. As there is quite a substantial amount of asymmetry in the funnel plot of the sensitivity (Figure S3.1), the odds of it being caused by chance are also quite small. Poor methodological design and true heterogeneity of differences between studies, on the other hand, are more probable causes. Thus, the asymmetry of the plot may have been caused by the use of multiple types of AI with different trainings in each study.
In the funnel plot of the specificity, asymmetry is also visible (Figure S3.2). As mentioned before, there is a substantial difference in study size and use of various AIs, causing the effect estimates to be different as well. Selective outcome reporting and selective analysis reporting are, again, probably not the cause of the asymmetry since they were assessed and deemed low risk. There is most likely no publication bias in the funnel plot of the specificity as the same logic applies to the asymmetry here as for the asymmetry in the sensitivity plot (Figures S3.1 and S3.2). The chances of it being artefactual, based on chance or fraud are also quite slim because the studies seem consistent. Thus, in this case, the asymmetry is also likely to be of methodological origin and thus caused by actual heterogeneity between studies.

3.6.2. Assessment of the Risk of Within-Study Selective Reporting

All outcomes that were relevant to this systematic review and that were stated in the methods sections of the included studies were reported in the results sections of the included studies. Thus, all studies were rated as having a low risk of within-study selective reporting (Figure S3.6).

3.7. Additional Analysis

All subgroup analyses were prespecified and were conducted according to the quality score group of the studies and according to the score, studies received for a certain quality domain (1A, 1B, 2A, 2B, 3A, 3B, 4).
The sensitivity was smaller in studies with an unclear risk of bias regarding the reference standard (3A) (0.41, 95% CI: 0.36–0.46) compared with studies with a low concern in the same domain (0.88, 95% CI: 0.84–0.92) (Figure S4.5).
No other differences in diagnostic performance were found through subgroup analyses according to the quality score group of the studies and according to the remaining quality domains for both outcomes (Figures S4.1–4.4 and S4.6–4.15).

4. Discussion

4.1. Summary of Evidence

The objective of this systematic review was to assess the performance of AI as an independent tool for rib fracture detection on CT scans or X-rays of patients with possible rib fractures, using the metrics of sensitivity and specificity. The meta-analysis resulted in an overall sensitivity of 0.85 (95% CI, 0.78–0.92) with strong evidence of heterogeneity (I² = 0.99) and overall specificity of 0.96 (95% CI, 0.94–0.97) with strong evidence of heterogeneity (I² = 0.99). In total, 15 sensitivities from 15 databases from all 12 studies [17,18,19,20,21,22,23,24,25,26,27,28] and 10 specificities from 10 databases from 7 studies [19,21,22,23,24,25,26,28] were used to complete this meta-analysis. All sensitivities were extracted directly from the articles or calculated without making any assumptions. For the specificities, it was not possible to avoid making assumptions since only two specificities were directly available. Therefore, the other five specificities were based on assumptions. This demonstrates that the presence of rib fractures can be detected and ruled out accurately, but that caution must be taken about relying on the AI’s specificity.

4.2. Limitations

4.2.1. Outcome Level

For this meta-analysis, data from different studies were combined to estimate diagnostic performance with more precision than is possible in a single study. This creates the main limitation of this meta-analysis: patient population, type of index test, type of reference standard and outcome definitions are (likely) not the same across studies.

4.2.2. Study and Review Level

No extra articles were identified from the citation search in addition to the articles that were identified through the initial search. Therefore, there is no reason to believe that the initial search was incomplete.
An important limitation is that not all the data from the identified research were available to us. In the search for data, the articles and the available corresponding supplementary materials were checked, emails were sent to all the authors for additional information, and data were calculated where possible. Still, a considerable amount of data was not available, especially for the numbers of true negatives and the metrics relating to that value. Because of this, two assumptions were made which are likely to have influenced the calculations of the specificity. No significant difference was found, however, between the directly calculated specificity and the one calculated using assumptions, which would suggest that the assumptions made were quite accurate (Figure S2.6).
A quality assessment of the different studies was performed, which resulted in two studies [18,19] receiving the label “intermediate quality” and the other ten studies [17,20,21,22,23,24,25,26,27,28] receiving the label “high quality”. This could either be because most of the included studies are at a high level or because the quality assessment was not discriminatory enough.
An assessment of heterogeneity for the different outcomes that were calculated was conducted, and a lot of the outcomes were found to be heterogeneous. Further specification of the cause of this heterogeneity was not possible, as a couple of important factors were not available, which made it more difficult to generalize conclusions.
Furthermore, it was not possible to retrieve all the research identified as relevant. An assessment of within-study selective reporting was performed for which all studies were found to be of low risk. This assessment was made on the consistency of the methods and results in sections of the included articles. For this analysis, protocols of the included studies were not searched/made use of, which would have been a more robust way of checking the risk of within-study selective reporting.
In addition to that, an assessment of the risk of publication bias was conducted, through which asymmetries in the funnel plots of both outcomes were found. The asymmetries were likely caused by poor methodological design and true heterogeneity between studies, as different studies used multiple types of AI with training sets of variable quality and variable populations. The chance of the asymmetries being caused by publication bias was deemed low, but this could still be the cause, as the interpretation of such data is common.
Finally, the initial PubMed search was repeated on 3 January 2023, and now 58 articles were identified in comparison to the previously found 57 articles. The newly identified article stated that it was published on 3 December 2022 and should therefore have ended up in the initial search. It is unclear how this could have happened, but as the article in question was a review and dealt with a subject that was irrelevant to this systematic review, it would not have had any influence on the results if it had been identified earlier.

5. Conclusions

5.1. Implications for Practice

This review demonstrates that AI is accurate at diagnosing rib fractures on CT scans. This is in line with the current literature, as other systematic reviews have found similar sensitivities and specificities for the application of AI in fracture detection.
Yang et al., for example reported a pooled sensitivity of 0.96 and specificity of 0.94 for the application of AI in detecting long-bone fractures [29]. Additionally, Yang et al. reported a pooled sensitivity of 0.91 and specificity of 0.95 for the application of AI in detecting all types of fractures. They concluded that deep learning is the most promising method to assist in the diagnosis of orthopedic fractures, but that it cannot be used yet as an independent diagnostic tool.
In addition to that, Kuo et al. reported a pooled sensitivity of 0.91 and specificity of 0.91 and cautiously concluded that AI is non-inferior to clinicians in terms of diagnostic performance in fracture detection, showing promise as a useful diagnostic tool [30].
As AI seems to have a similar accuracy for identifying rib fractures, it is reasonable that it can be used in similar ways as Yang et al. and Kuo et al. have proposed. It could, for example, aid radiologists in detecting rib fractures by serving as a screening tool or functioning as a second opinion. Alternatively, it could act as a tool in teaching (resident) radiologists.
It should be noted that as with any other screening tool, rib fractures labeled by the AI tool might not always be clinically relevant: depending on the dataset, the AI is trained upon, it might also label old, healed or very small fractures, which might not always have to be treated. Furthermore, in the application as a second opinion, users should be wary of too much reliance on AI, as it is still unknown how it compares to a human counterpart in this role. Finally, during the training of AI, bias can be introduced into the system. To minimize this risk, it is important to check and monitor the tool. This is especially the case when using the tool for teaching the new generation of radiologists.
As diagnosing rib fractures is only a small aspect of the diverse set of diagnostic skills that radiologists possess, the AIs investigated in this systematic review cannot replace the completeness of the radiologists’ interpretation. Combining the AIs in this systematic review with AIs trained in detecting other relevant findings (pneumothorax, hemothorax, vascular injury, etc.), however, could result in a tool that might come closer to replacing a radiologist. This was not further investigated, as it was beyond the scope of this systematic review.

5.2. Implications for Research

Further research should be conducted to find out how AI compares to medical specialists in rib fracture detection, as this would make conclusions regarding the technology more clinically relevant. Additionally, future studies should compare different forms of AI to optimize the technology’s performance.
Both of these goals could be achieved in a trial in which a dataset of CT scans or X-rays is analyzed by different types of AI and by radiologists for the presence of rib fractures. This would shed light on how AI compares to radiologists, but on into which type of AI is most suited for this particular task.
Although there is still a lot of research needed to put AI into practice, this systematic review confirms the bright foresight of AI in radiology, as it can accurately detect and rule out the presence of rib fractures.

Supplementary Materials

The following supporting information can be downloaded at: https://www.mdpi.com/article/10.3390/surgeries5010005/s1, Table S1: PICOS specified per criterium, Table S2: Quality assessment tool (modified QUADAS-2), Table S3: Study characteristics of the included studies, Table S4: Quality assessment of the included studies, Table S5.1: Results of individual studies—Primary outcomes, Table S5.2: Results of individual studies—All outcomes, Text S1: Rationale behind the modifications to the QUADAS-2 tool, Figure S1: PRISMA flow chart showing study selection from databases and citation searching, Figures S2.1–S2.5: Forest plots of the primary and secondary outcomes, Figure S2.6: Forest plot of the specificity comparison based on availability, Figures S3.1–S3.5: Funnel plots of the primary and secondary outcomes, Figure S3.6: Assessment of risk of within-study selective reporting, Figures S4.1–S4.7: Forest plots of the sensitivity, comparison on individual domains, Figures S4.8–S4.14: Forest plots of the specificity, comparison on individual domains, Figure S4.15: Forest plot of the sensitivity, comparison based on quality score.

Author Contributions

Conceptualization, M.C.L.v.d.B., J.H.B., L.F.M.S. and M.M.E.W.; methodology, M.C.L.v.d.B. and J.H.B.; software, M.C.L.v.d.B.; validation, M.C.L.v.d.B., J.H.B. and L.F.M.S.; formal analysis, M.C.L.v.d.B. and J.H.B.; investigation, M.C.L.v.d.B., J.H.B. and L.F.M.S.; resources, M.C.L.v.d.B. and J.H.B.; writing—original draft preparation, M.C.L.v.d.B., J.H.B. and L.F.M.S.; writing—review and editing, M.C.L.v.d.B., J.H.B. and M.M.E.W.; visualization, M.C.L.v.d.B. and J.H.B.; supervision, M.M.E.W.; project administration, M.C.L.v.d.B. and L.F.M.S. All authors have read and agreed to the published version of the manuscript.

Funding

This research received no external funding.

Institutional Review Board Statement

Ethical review and approval were waived for this study due to the design of this literature study.

Informed Consent Statement

Patient consent was waived due to the design of this literature study.

Data Availability Statement

The data presented in this study are available in “Diagnostic Performance of Artificial Intelligence in Rib Fracture Detection—Supplementary Materials”.

Acknowledgments

We thank Esther M.M. van Lieshout for her feedback during the early stages of our research. Furthermore, we received different licenses from the Erasmus MC to access journals. Some of these journals had articles that we included in our final selection of articles.

Conflicts of Interest

The authors declare no conflicts of interest.

Abbreviations

AIArtificial intelligence
CTComputer tomography
I-square statistic
NPVNegative predictive value
PPVPositive predictive value
RCTRandomized controlled trials

References

  1. Ziegler, D.W.; Agarwal, N.N. The morbidity and mortality of rib fractures. J. Trauma 1994, 37, 975–979. [Google Scholar] [CrossRef] [PubMed]
  2. Marasco, S.; Lee, G.; Summerhayes, R.; Fitzgerald, M.; Bailey, M. Quality of life after major trauma with multiple rib fractures. Injury 2015, 46, 61–65. [Google Scholar] [CrossRef]
  3. Bulger, E.M.; Arneson, M.A.; Mock, C.N.; Jurkovich, G.J. Rib fractures in the elderly. J. Trauma 2000, 48, 1040–1047. [Google Scholar] [CrossRef] [PubMed]
  4. Chrysou, K.; Halat, G.; Hoksch, B.; Schmid, R.A.; Kocher, G.J. Lessons from a large trauma center: Impact of blunt chest trauma in polytrauma patients-still a relevant problem? Scand. J. Trauma Resusc. Emerg. Med. 2017, 25, 42. [Google Scholar] [CrossRef] [PubMed]
  5. Kasotakis, G.; Hasenboehler, E.A.; Streib, E.W.; Patel, N.; Patel, M.B.; Alarcon, L.; Bosarge, P.L.; Love, J.; Haut, E.R.; Como, J.J. Operative fixation of rib fractures after blunt trauma: A practice management guideline from the Eastern Association for the Surgery of Trauma. J. Trauma Acute Care Surg. 2017, 82, 618–626. [Google Scholar] [CrossRef] [PubMed]
  6. Omert, L.; Yeaney, W.W.; Protetch, J. Efficacy of thoracic computerized tomography in blunt chest trauma. Am. Surg. 2001, 67, 660–664. [Google Scholar] [CrossRef] [PubMed]
  7. Park, S.H.; Song, H.H.; Han, J.H.; Park, J.M.; Lee, E.J.; Park, S.M.; Kang, K.J.; Lee, J.H.; Hwang, S.S.; Rho, S.C. Effect of noise on the detection of rib fractures by residents. Investig. Radiol. 1994, 29, 54–58. [Google Scholar] [CrossRef]
  8. Sokolovskaya, E.; Shinde, T.; Ruchman, R.B.; Kwak, A.J.; Lu, S.; Shariff, Y.K.; Wiggins, E.F.; Talangbayan, L. The Effect of Faster Reporting Speed for Imaging Studies on the Number of Misses and Interpretation Errors: A Pilot Study. J. Am. Coll. Radiol. 2015, 12, 683–688. [Google Scholar] [CrossRef]
  9. Weikert, T.; Winkel, D.J.; Bremerich, J.; Stieltjes, B.; Parmar, V.; Sauter, A.W.; Sommer, G. Automated detection of pulmonary embolism in CT pulmonary angiograms using an AI-powered algorithm. Eur. Radiol. 2020, 30, 6545–6553. [Google Scholar] [CrossRef]
  10. Nagel, S.; Sinha, D.; Day, D.; Reith, W.; Chapot, R.; Papanagiotou, P.; Warburton, E.A.; Guyler, P.; Tysoe, S.; Fassbender, K.; et al. e-ASPECTS software is non-inferior to neuroradiologists in applying the ASPECT score to computed tomography scans of acute ischemic stroke patients. Int. J. Stroke 2017, 12, 615–622. [Google Scholar] [CrossRef]
  11. Esteva, A.; Kuprel, B.; Novoa, R.A.; Ko, J.; Swetter, S.M.; Blau, H.M.; Thrun, S. Dermatologist-level classification of skin cancer with deep neural networks. Nature 2017, 542, 115–118. [Google Scholar] [CrossRef]
  12. Gulshan, V.; Peng, L.; Coram, M.; Stumpe, M.C.; Wu, D.; Narayanaswamy, A.; Venugopalan, S.; Widner, K.; Madams, T.; Cuadros, J.; et al. Development and Validation of a Deep Learning Algorithm for Detection of Diabetic Retinopathy in Retinal Fundus Photographs. JAMA 2016, 316, 2402–2410. [Google Scholar] [CrossRef] [PubMed]
  13. Blum, A.; Gillet, R.; Urbaneja, A.; Gondim Teixeira, P. Automatic detection of rib fractures: Are we there yet? EBioMedicine 2021, 63, 103158. [Google Scholar] [CrossRef] [PubMed]
  14. Liberati, A.; Altman, D.G.; Tetzlaff, J.; Mulrow, C.; Gotzsche, P.C.; Ioannidis, J.P.A.; Clarke, M.; Devereaux, P.J.; Kleijnen, J.; Moher, D. The PRISMA statement for reporting systematic reviews and meta-analyses of studies that evaluate health care interventions: Explanation and elaboration. PLoS Med. 2009, 6, e1000100. [Google Scholar] [CrossRef] [PubMed]
  15. Whiting, P.F.; Rutjes, A.W.S.; Westwood, M.E.; Mallett, S.; Deeks, J.J.; Reitsma, J.B.; Leeflang, M.M.G.; Sterne, J.A.C.; Bossuyt, P.M.M. QUADAS-2 Group QUADAS-2: A revised tool for the quality assessment of diagnostic accuracy studies. Ann. Intern. Med. 2011, 155, 529–536. [Google Scholar] [CrossRef] [PubMed]
  16. Sterne, J.A.C.; Sutton, A.J.; Ioannidis, J.P.A.; Terrin, N.; Jones, D.R.; Lau, J.; Carpenter, J.; Rucker, G.; Harbord, R.M.; Schmid, C.H.; et al. Recommendations for examining and interpreting funnel plot asymmetry in meta-analyses of randomised controlled trials. BMJ 2011, 343, d4002. [Google Scholar] [CrossRef]
  17. Zhou, Q.; Tang, W.; Wang, J.; Hu, Z.; Xia, Z.; Zhang, R.; Fan, X.; Yong, W.; Yin, X.; Zhang, B.; et al. Automatic detection and classification of rib fractures based on patients’ CT images and clinical information via convolutional neural network. Eur. Radiol. 2021, 31, 3815–3825. [Google Scholar] [CrossRef]
  18. Zhou, Z.; Fu, Z.; Jia, J.; Lv, J. Rib Fracture Detection with Dual-Attention Enhanced U-Net. Comput. Math. Methods Med. 2022, 2022, 8945423. [Google Scholar] [CrossRef]
  19. Zhou, Q.; Hu, Z.; Tang, W.; Xia, Z.; Wang, J.; Zhang, R.; Li, X.; Chen, C.; Zhang, B.; Lu, L.; et al. Precise anatomical localization and classification of rib fractures on CT using a convolutional neural network. Clin. Imaging 2022, 81, 24–32. [Google Scholar] [CrossRef]
  20. Zhou, Q.Q.; Wang, J.; Tang, W.; Hu, Z.C.; Xia, Z.Y.; Li, X.S.; Zhang, R.; Yin, X.; Zhang, B.; Zhang, H. Automatic Detection and Classification of Rib Fractures on Thoracic CT Using Convolutional Neural Network: Accuracy and Feasibility. Korean J. Radiol. 2020, 21, 869–879. [Google Scholar] [CrossRef]
  21. Yang, C.; Wang, J.; Xu, J.; Huang, C.; Liu, F.; Sun, W.; Hong, R.; Zhang, L.; Ma, D.; Li, Z.; et al. Development and assessment of deep learning system for the location and classification of rib fractures via computed tomography. Eur. J. Radiol. 2022, 154, 110434. [Google Scholar] [CrossRef] [PubMed]
  22. Yao, L.; Guan, X.; Song, X.; Tan, Y.; Wang, C.; Jin, C.; Chen, M.; Wang, H.; Zhang, M. Rib fracture detection system based on deep learning. Sci. Rep. 2021, 11, 23513–23517. [Google Scholar] [CrossRef] [PubMed]
  23. Wu, M.; Chai, Z.; Qian, G.; Lin, H.; Wang, Q.; Wang, L.; Chen, H. Development and Evaluation of a Deep Learning Algorithm for Rib Segmentation and Fracture Detection from Multicenter Chest CT Images. Radiol. Artif. Intell. 2021, 3, e200248. [Google Scholar] [CrossRef]
  24. Wang, S.; Wu, D.; Ye, L.; Chen, Z.; Zhan, Y.; Li, Y. Assessment of automatic rib fracture detection on chest CT using a deep learning algorithm. Eur. Radiol. 2022, 33, 1824–1834. [Google Scholar] [CrossRef] [PubMed]
  25. Niiya, A.; Murakami, K.; Kobayashi, R.; Sekimoto, A.; Saeki, M.; Toyofuku, K.; Kato, M.; Shinjo, H.; Ito, Y.; Takei, M.; et al. Development of an artificial intelligence-assisted computed tomography diagnosis technology for rib fracture and evaluation of its clinical usefulness. Sci. Rep. 2022, 12, 8363–8365. [Google Scholar] [CrossRef]
  26. Kaiume, M.; Suzuki, S.; Yasaka, K.; Sugawara, H.; Shen, Y.; Katada, Y.; Ishikawa, T.; Fukui, R.; Abe, O. Rib fracture detection in computed tomography images using deep convolutional neural networks. Medicine 2021, 100, e26024. [Google Scholar] [CrossRef] [PubMed]
  27. Jin, L.; Yang, J.; Kuang, K.; Ni, B.; Gao, Y.; Sun, Y.; Gao, P.; Ma, W.; Tan, M.; Kang, H.; et al. Deep-learning-assisted detection and segmentation of rib fractures from CT scans: Development and validation of FracNet. EBioMedicine 2020, 62, 103106. [Google Scholar] [CrossRef]
  28. Gipson, J.; Tang, V.; Seah, J.; Kavnoudias, H.; Zia, A.; Lee, R.; Mitra, B.; Clements, W. Diagnostic accuracy of a commercially available deep-learning algorithm in supine chest radiographs following trauma. Br. J. Radiol. 2022, 95, 20210979. [Google Scholar] [CrossRef]
  29. Yang, S.; Yin, B.; Cao, W.; Feng, C.; Fan, G.; He, S. Diagnostic accuracy of deep learning in orthopaedic fractures: A systematic review and meta-analysis. Clin. Radiol. 2020, 75, 713.e17–713.e28. [Google Scholar] [CrossRef]
  30. Kuo, R.Y.L.; Harrison, C.; Curran, T.; Jones, B.; Freethy, A.; Cussons, D.; Stewart, M.; Collins, G.S.; Furniss, D. Artificial Intelligence in Fracture Detection: A Systematic Review and Meta-Analysis. Radiology 2022, 304, 50–62. [Google Scholar] [CrossRef]
Figure 1. PRISMA flow chart showing study selection from databases and citation searching.
Surgeries 05 00005 g001
Figure 2. Forest plot of the sensitivity of AI in rib fracture detection [18,19,20,21,22,23,24,25,26,27,28].
Surgeries 05 00005 g002
Figure 3. Forest plot of the specificity of AI in rib fracture detection [19,21,22,24,25,26,28].
Surgeries 05 00005 g003
Table 1. PICOS specified per criterion.
CriteriaDescription
P: Population of interestCT scans or thoracic X-rays of patients that were analyzed for the presence of rib fractures by at least 2 radiologists, which was stated as the reference standard.
I: InterventionDiagnostic detection by an artificial intelligence tool on its own
C: ComparisonAll comparisons
O: OutcomeNumber of true positives, true negatives, false positives and false negatives and/or the sensitivity and specificity
S: Study typeDiagnostic case–control studies, diagnostic cohort studies and diagnostic RCTs
Table 2. Characteristics of the included studies.
Author, YearNumber of Patients or CT Scans in Dataset 1Imaging ModalityReference StandardComparisonsRelevant OutcomesType of StudyQuality
Gipson et al., 2022 [28]1400CTContemporaneous CT reportsComparison with reference standard and performance of radiologists using the AI toolSensitivity, specificity, TP, FN, FP and TNRetrospective diagnostic cohort studyHigh
Jin et al., 2020 [27]120CTFive radiologists with 3 to 20 years of experienceComparison with different AI toolsSensitivityRetrospective diagnostic cohort studyHigh
Kaiume et al., 2021 [26]39CTTwo radiologists with 26 and 6 years of image interpretation experienceDiagnostic performance rib fractures of two intern doctorsSensitivityRetrospective diagnostic cohort studyHigh
Niiya et al., 2022 [25]56CTTwo radiologists with 6 and 9 years of experienceComparison with a reference standardSensitivityRetrospective diagnostic case–control studyHigh
Wang et al., 2022 [24]1613CTTwo radiologists with at least 9 years of experience, and in case of inconclusion they made consensus with a senior radiologist with at least 20 years of experienceComparison with six attending radiologistsSensitivity and specificityRetrospective diagnostic case–control studyHigh
Wu et al., 2021 [23]105CTThree radiologists with 6, 10 and 14 years of experience and one senior radiologist with 18 years of experienceComparison radiologists who used AI to diagnoseSensitivityRetrospective diagnostic case–control studyHigh
Yang et al., 2022 [21]120CTTwo experienced musculoskeletal radiologists with at least 10 years of experience and a third radiologist was invited to participate if there was a discussionComparison with the diagnosis of three radiologists, with 5, 7 and 21 years of experience; those radiologists were not the same as the radiologists who determined the reference standardSensitivity, TP, FP, TN and FNRetrospective diagnostic cohort studyHigh
Yao et al., 2021 [22]100CTThree experienced radiologists (over 10 years experience) and checking by two senior radiologists (over 15 years experience)Comparison of the performance between AI, radiologist and radiologic–AI collaborationSensitivityRetrospective diagnostic cohort studyHigh
Zhou et al., 2020 [20]30CTTwo experienced musculoskeletal radiologists with 8 and 9 years of experience and two senior radiologists with 20 and 14 years of experience; if the conclusion was inconsistent, one thoracic surgeon was invited to participate in the discussionComparison with the performance of five attending radiologists with 6–8 years of experience; there was no overlap between those radiologists and the radiologists who determined the reference standardSensitivity and FPMulticenter retrospective diagnostic case–control studyHigh
Zhou et al., 2021 [17]260CTTwo experienced musculoskeletal radiologists with 8 and 9 years of experience, two senior radiologists with 20 and 14 years of experience and one thoracic surgeon in case of inconclusionFive radiologists with 6 to 8 years of experience with no overlap with the radiologists who determined the reference standardSensitivity and specificityMulticenter retrospective diagnostic cohort studyHigh
Zhou et al., 2022 [18]164CTTwo musculoskeletal radiologists withfive years of experience and one senior musculoskeletal radiologist with more than ten years of experienceComparison with different AI toolsSensitivityRetrospective diagnostic cohort studyIntermediate
Zhou et al., 2022. [19]Internal dataset: 90External dataset: 38CTTwo experienced musculoskeletal radiologists (9 and 10 years of experience), two senior radiologists (21 and 15 years of experience) and, in case of doubt, one thoracic surgeonComparison with the diagnosis of five radiologists with 7–9 years of CT diagnosis experience which were different from the radiologists who determined the reference standardSensitivity, TP, FN and FPMulticenter retrospective diagnostic cohort studyIntermediate
1 The number of included patients and included CT scans was deemed as being the same, as it is likely that the large majority of included patients underwent a single CT scan.
Disclaimer/Publisher’s Note: The statements, opinions and data contained in all publications are solely those of the individual author(s) and contributor(s) and not of MDPI and/or the editor(s). MDPI and/or the editor(s) disclaim responsibility for any injury to people or property resulting from any ideas, methods, instructions or products referred to in the content.

