1. Introduction
1.1. Decision Support Systems
Sustainable fisheries provide the sustainable exploitation of fishery resources, ensuring that the socioeconomic needs of the affected human communities are met, while maintaining ecosystem state sustainability. This is a complex and challenging concept, since it includes biological, ecological and socioeconomic concerns that demand a holistic approach. In recent decades, traditional fishery management, focused on single species or stocks and resources, has gradually evolved towards ecosystem-based fisheries management (EBFM). However, the way to operationalize EBFM remains unclear and challenging, and fishery managers are still seeking guidance on what measures or combination thereof would best meet the multiple and often conflicting objectives of EBFM [
1,
2,
3,
4]. Such an approach requires additional tools and indicators that are effectively managed at a finer scale [
5].
The complexity of the fisheries management system stems from the dynamic nature of the marine environment and the many stakeholder groups with conflicting interests. This leads to the conclusion that the design of decision support concept as a tool to improve decision making and subsequently to improve the implementation of sustainable fisheries management is in fact an ill-defined problem. Ill-structured problems offer multiple solutions and solution paths, and require multiple criteria to evaluate possible solutions. The use of operational methods and modelling of different concepts for strategic planning of fishery activities and management measures helps decision makers to make valuable decisions that ensure long-term sustainability. Multicriteria methods are significant and may enhance decision-making processes, independently or in combination, depending on the issue. These kinds of problems should be approached differently, as the preferences of a range of stakeholder groups need to be considered. Where the problem is based on several multicriteria models using specific data, a specific decision support system may be created to improve the quality of decision support processes when sustainably managing the bottom trawl fleet.
There are several existing definitions of decision support systems (DSS) e.g., [
6,
7,
8]. Keen and Scott-Morton [
6] defined DSS as a system that couples the intellectual resources of individuals with the capabilities of the computer to improve the quality of decisions. In the present study, DSS is defined as the iterative interaction between one or more computer applications and user or group of users that provide a higher quality base for decision-making regarding ill-defined problems.
Several authors have applied DSS to fisheries management. Some have designed DSS to develop an optimal harvesting plan for the fishing industry [
9], while others used DSS to manage fishery externalities in an exclusive economic zone [
10]. Carrick and Ostendorf [
11] used spatial information techniques and near real-time fishery-independent survey data for the development of a spatial DSS. In some cases, DSS has been used as a management approach to determine the optimal inter- and intra-annual fishing plans in terms of fishing efforts in different sub-areas and time periods [
12]. A common characteristic of these DSSes is that none focuses on fishery fleet management or is based on a multicriteria analysis approach. The decision support concept (DSC) outlined here is a variation of DSS, characterized by the absence of an iterative approach that instead focuses on a single problem requiring a decision. The DSC considers sustainable fleet management planning as a multicriteria problem and employs multicriteria decision aid techniques to model and solve it. The DSC can also be described as a defined course for the engagement of adequate data and models based on DSS logic with the aim of accomplishing a specific task. In this case, this is the improvement of decision-making processes for sustainable management of the bottom trawl fleet. Such an approach has been exercised in other research areas [
13,
14,
15,
16,
17,
18] and might be useful for the design of a DSC for sustainable management of the bottom trawl fleet.
1.2. Management Measures of the Bottom Trawl Fisheries in the Adriatic
Since the Adriatic Sea is a multispecies and multi-gear marine environment, an ecosystem approach to fisheries management is indispensable. The demersal resources of the Adriatic Sea are unique, making management very demanding. A significant number of species are exploited using different gear with bottom trawler fishing prevailing. Multispecies and multi-gear stocks that are biologically common are economically shared among fleets of different countries. For the majority of commercially important species, a negative trend is present for abundance and biomass indices, suggesting overly intensive fishing pressure [
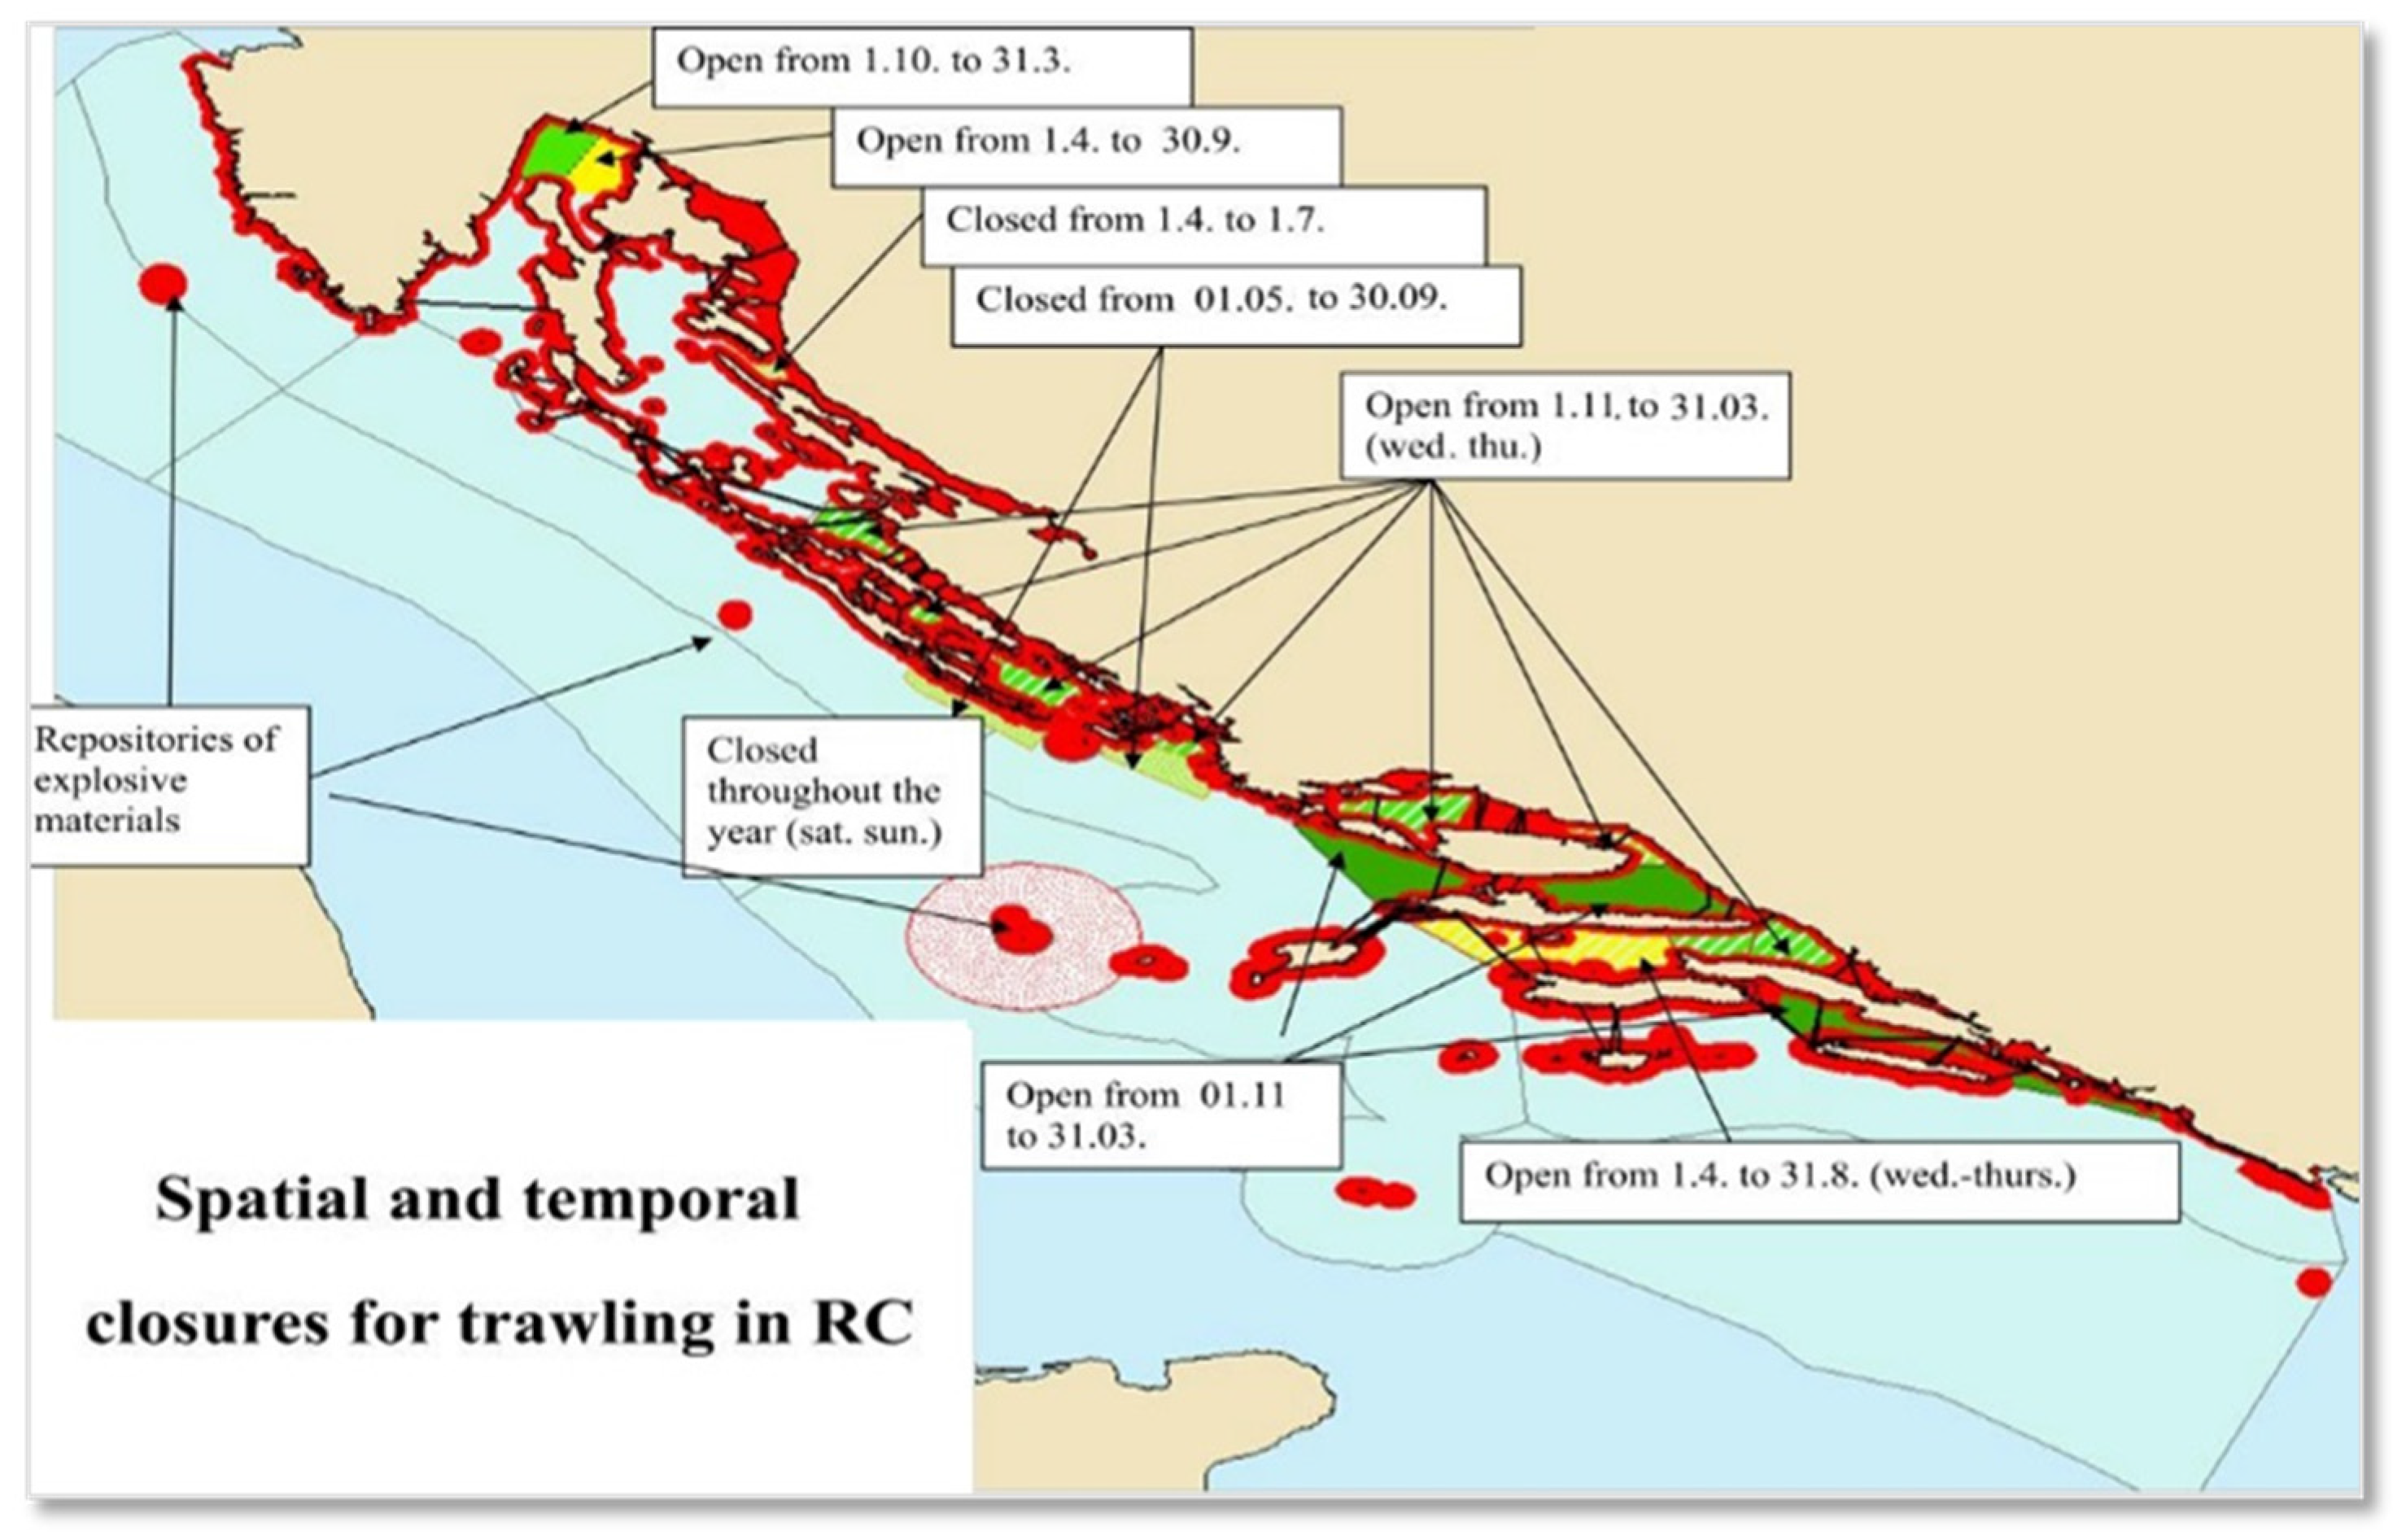
19]. The Croatian fleet operating along the eastern Adriatic (Mediterranean and Black Sea Geographical Sub-Areas—GSA 17), account for 40%, 27% and 31% of the total number, total GT, and total kW. Croatian trawl fishing involves mostly smaller and older ships, and virtually 99% of all fishing takes place in territorial waters. In addition to spatial and temporal regulations (
Figure 1), there are controls of the fishing effort, selectivity of fishing gears, and protection of reproductive or juvenile specimens through the prescribed minimum catch size.
Some other regulations for bottom trawl fisheries are applied, such as the minimum size of cod-end in the inner sea, spatial regulation considering the propelling engine strength, permanent bans for certain zones, spatial-temporal ban to protect immature fish and other marine organisms, ban on the issuance of new licenses and addition of new types of fishing (fishing tools and equipment) to valid licenses, regulation in E, F and G zones (Ordinance on commercial fishing at sea, Official Gazette 63/2010, 141/2010, 148/2010, 52/2011 and 144/2011), design and technical characteristics of fishing gear and equipment, and the amount of gear that can be used in fishing (Official Gazette 148/2010, 25/2010). Regulation of fishing in certain areas (Official Gazette, no. 148/2004, 152/2004, 55/2005, 96/2006, 123/2009 and 130/2009) and prohibition of fishing by bottom trawling tools in specific habitats and areas of the fishing sea under special fishing regulation.
According to the official data [
20], Croatia has 790 licenses for trawler fishing. Among vessels with the license for trawler fishing, 66% listed trawler fishing as their primary activity, and the number of trawl fishing vessels with a fishing effort above the minimum work days is around 450. Trawlers are divided into three categories by length. The first group (36%) consists of small boats up to 12 m in length overall (m LOA) and they are characterized by the fact that they operate in a narrow coastal area near the home port. The second group (49%) are vessels of 12 to 18 m LOA, and they consist of vessels that fish in the coastal area and on the high seas. The third group (15%) are large vessels over 18 m LOA and they typically fish in the open sea for several days and are less connected to the home port. The medium length of trawlers in Croatia is 14.39 m LOA with an average engine power (kW) of 142.82 kW and average gross tonnage (GT) of 23.87 GT [
20].
The Croatian bottom trawl fleet is old and technically and technologically obsolete. Almost 60% of bottom trawlers are older than 30 years with an average vessel age of 38 years. Currently there is a management measure to reduce the intensity of exploitation, thus the fishing effort needs to be reduced by implementing measures to permanently exclude certain fishing vessels from fishing. According to the Croatian management plan for bottom trawl fisheries [
20], and the corresponding EU legislation [
21], one of the measures to be implemented is fleet capacity reduction measured in total GT and kW. The aim is to reduce the capacity of the active trawl fleet by 10% to 15% using authorization procedures and permanent exclusion of certain vessels from fishing with reimbursement. According to the Fleet Report [
22], the targeted reduction is expected to be achieved in 2019.
The objective of the present study was to develop a decision support concept that could be used to assist government and other decision makers in creating instruments, or combinations of instruments, to shape management strategies and related policies for the bottom trawl fleet, with a focus on optimizing the fishing fleet to ensure long-term sustainability and to align the intensity of exploitation with the condition of the resources. Application of the DSC was performed for the Adriatic bottom trawl fisheries.
2. Materials and Methods
2.1. Functioning of the Decision Support Concept
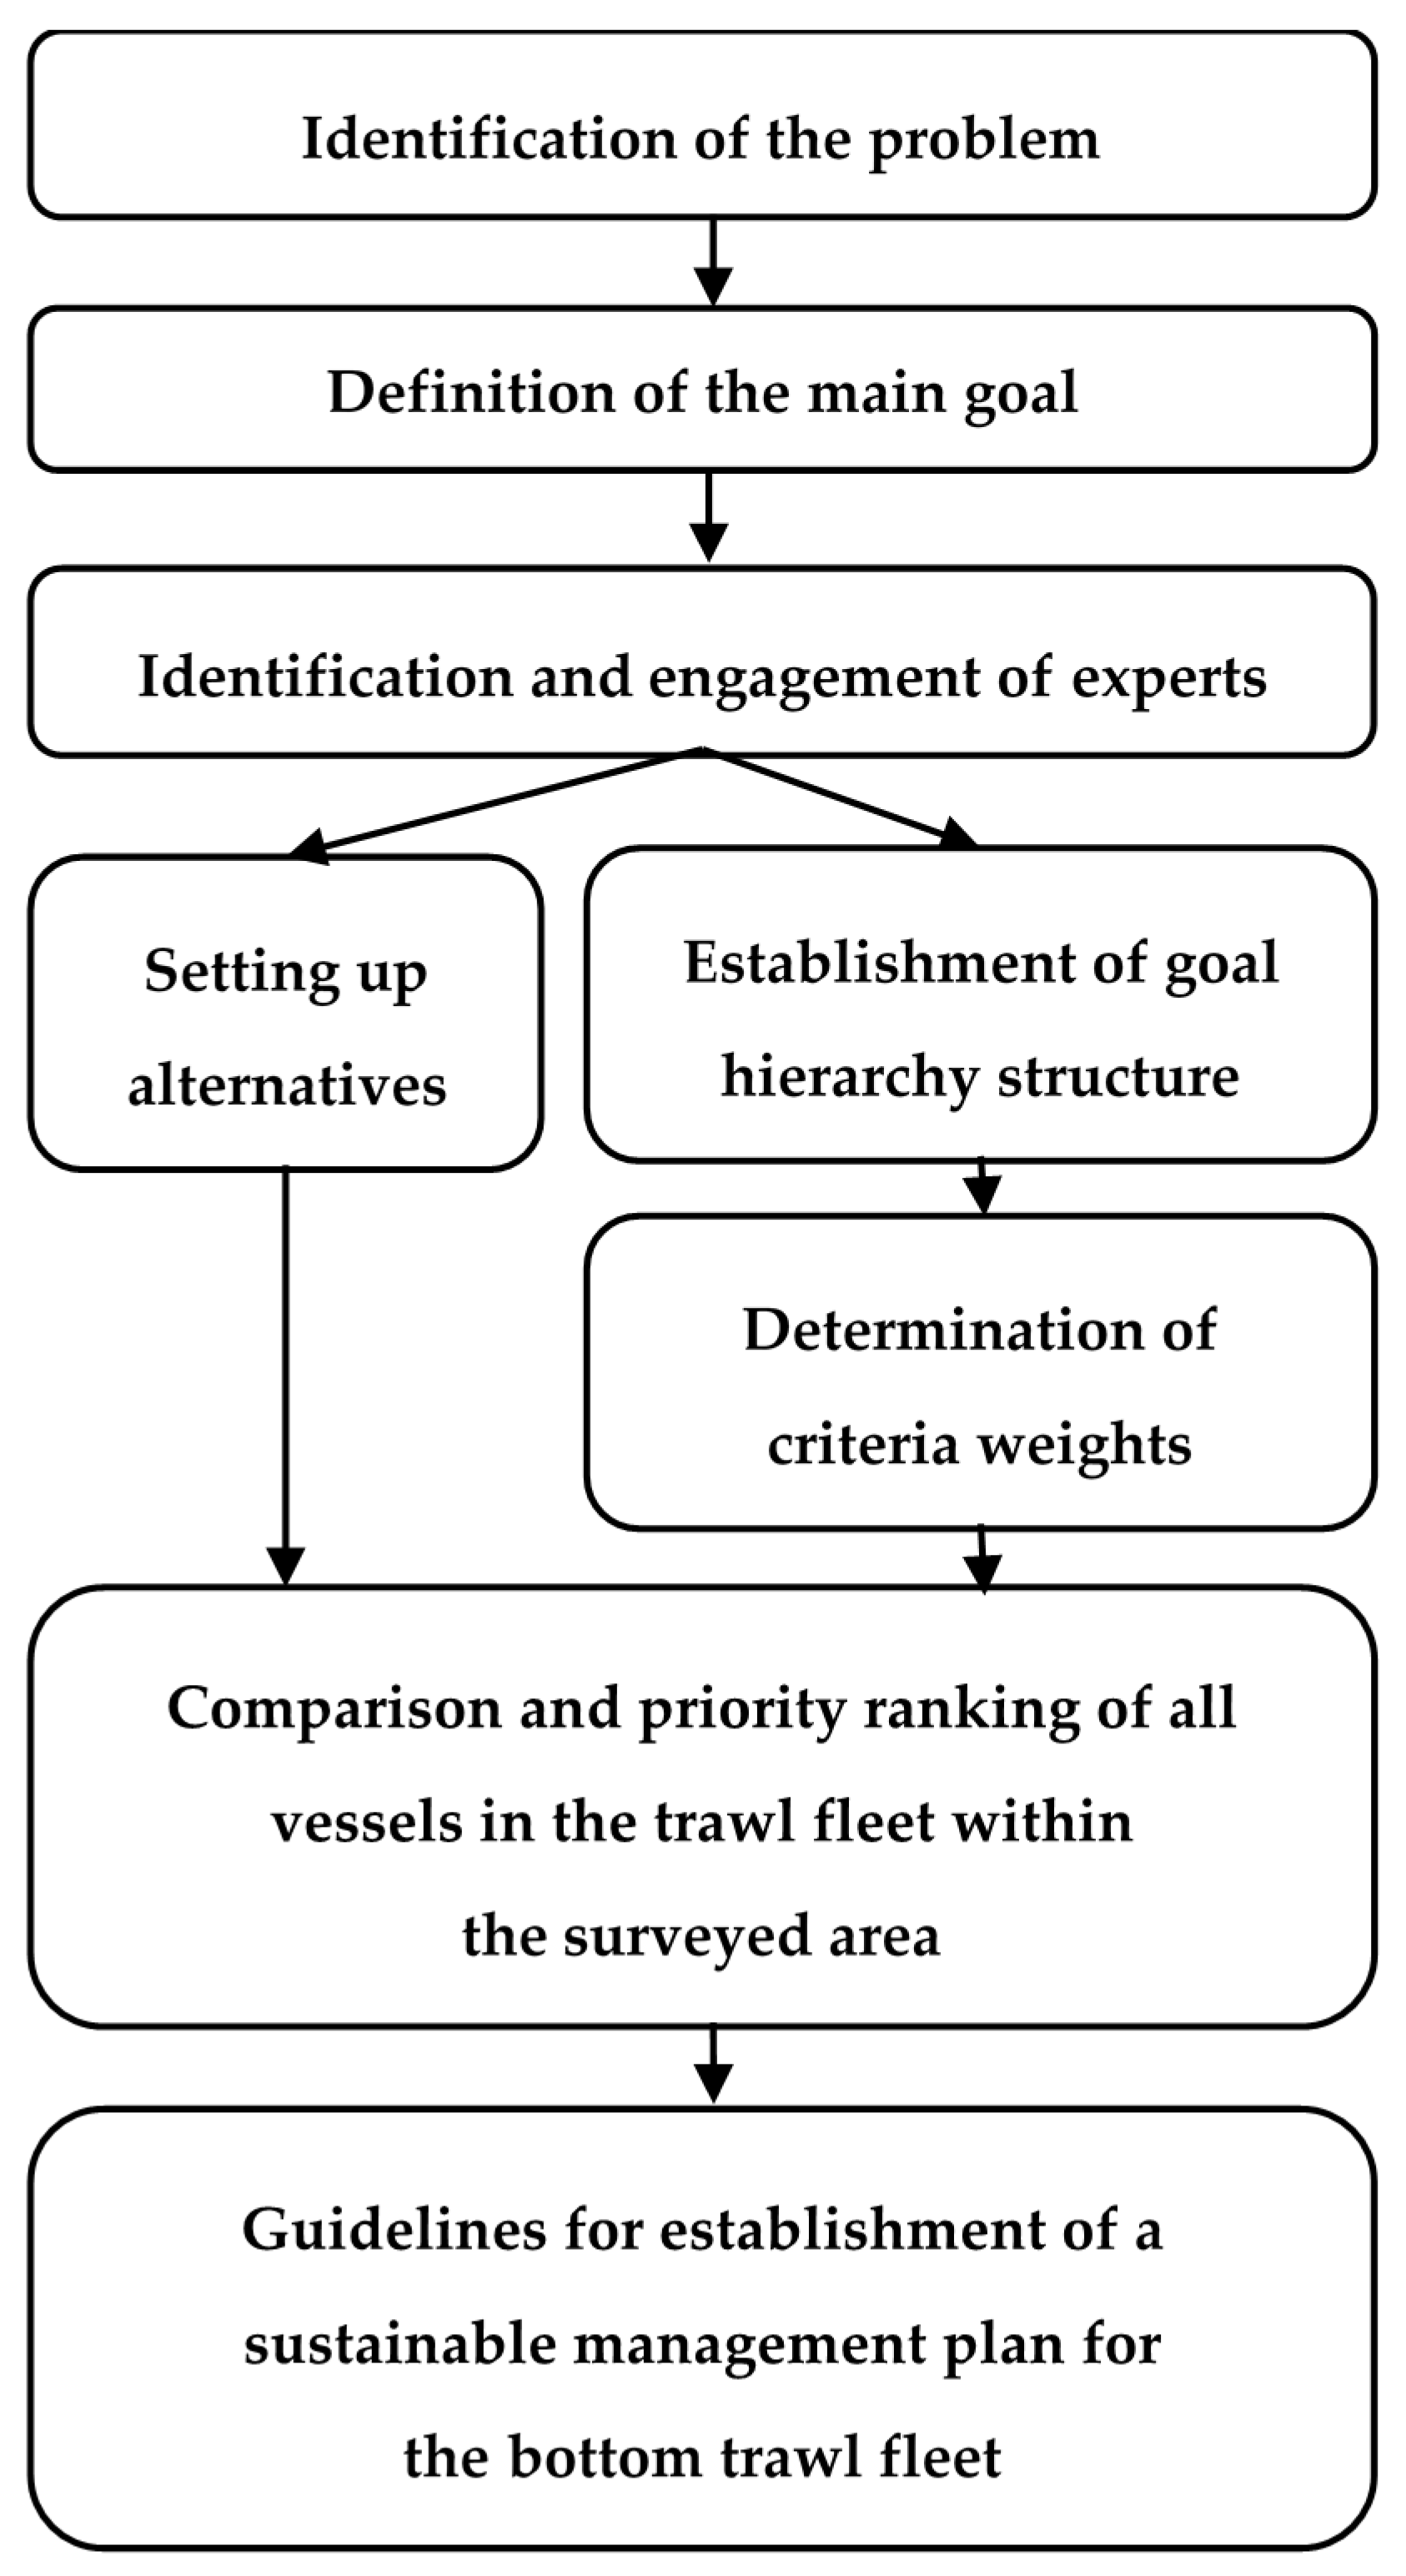
Herein we propose a decision support concept (DSC) for the sustainable management of the bottom trawl fleet (SMBTF) by applying ecosystem-based principles and involving experts from all relevant stakeholder groups in the decision-making process. The concept represents the methodology to be used by decision makers in strategic planning in the field of SMBTF, with the aim of reducing the fleet by identifying vessels to be bought out. Following the principles and logic of the DSC, and according to the sequence and patterns of decision-making processes identified as important within the SMBTF, a novel original DSC was generated for the SMBTF (
Figure 2).
The DSC for the proposed methodology is based on DSS logic, and the methodology is founded on combining data from the database and the model, and their processing, as in DSS. It can be viewed as a precisely defined procedure of the application of certain models from the base model (here Analytic Hierarchy Process (AHP), Preference Ranking Organization Method for Enrichment Evaluations (PROMETHEE), goal tree) for the processing of specific data (in this case, those that pertain to trawl fishery fleet management, and are important for ensuring EBM). The DSC presents a new way of connecting different multicriteria methods. Their connection has been achieved through the proposal of formation of a goal tree of the participating stakeholders. The conceived goal tree, with its 15 criteria, has the flexibility to change criteria; however, the method of including experts in the decision-making process through the determination and assessment of criteria does not change.
These elements of the proposed DSC of SMBTF are described in greater detail in the subsections below.
2.1.1. Identifying the Problem, Defining the Main Goal, Identifying and Engaging Experts
The first step in implementing the proposed concept is identification of an ill-structured problem and defining the main goal that will contribute to solving the problem. Ill-structured problems possess multiple criteria for evaluation solutions, solution paths, parameters that are not easily manipulated, and contain uncertainty as to which concepts, rules and principles are necessary for the solution or how they are organized [
23,
24]. Once the main goal has been defined, relevant stakeholder groups associated with the problem need to be identified. Involving stakeholders in decision-making processes and creating better management practices play a vital role in achieving sustainability of the fishery sector [
9]. Identification of stakeholders for their involvement in the management process is not a straightforward task. Several authors defined the main stakeholder groups for the fishery sector (e.g., [
25,
26]). In this case, the four main stakeholder groups were identified and invited to participate in the execution of the DSC SMBTF. The inclusion of stakeholders in decision-making processes followed the technique proposed by Mladineo
et al. [
13] and Jajac
et al. [
14,
15].
Experts were selected based on their professional background (biology, economy, sociology, technology and politics) and with a minimum of ten years of experience in the fisheries field. Experts were representatives of the defined stakeholder groups, selected according to the criteria of expertise, experience in the area of focus of that group, and based on their positive influence on “their” group. Their task was to express the opinions of the stakeholder groups they represent in the implementation of the AHP method, to establish the objectives and to determine their weighting values. Their opinions were based on their sound knowledge of the issues and their communication with the entire stakeholder group. The experts continuously cooperated with their stakeholder groups and the DSC developers through the iterative process, expressing their views on the analyzed issues and the preferences of their stakeholder group, through the identification of criteria and evaluation of relations among criteria.
The DSC developers worked with the experts of all stakeholder groups and after several iterations the final appearance of the goal tree was achieved. This process resulted in transparency of the decision-making process, as stakeholders were involved in multiple phases of the decision-making process, and ultimately, cooperation was stimulated among stakeholder groups via the cooperation of their experts. Aiming to avoid subjectivity in assessment and evaluation, two experts for each stakeholder group were selected as representatives. After engaging the experts, four different groups were formed as being relevant to the bottom trawl fishery sector: fishers, environmentally focused non-governmental organizations (eNGOs), fisheries scientists, and government.
2.1.2. Setting up Alternatives and Establishing the Goal Hierarchy Structure (Goal Tree)
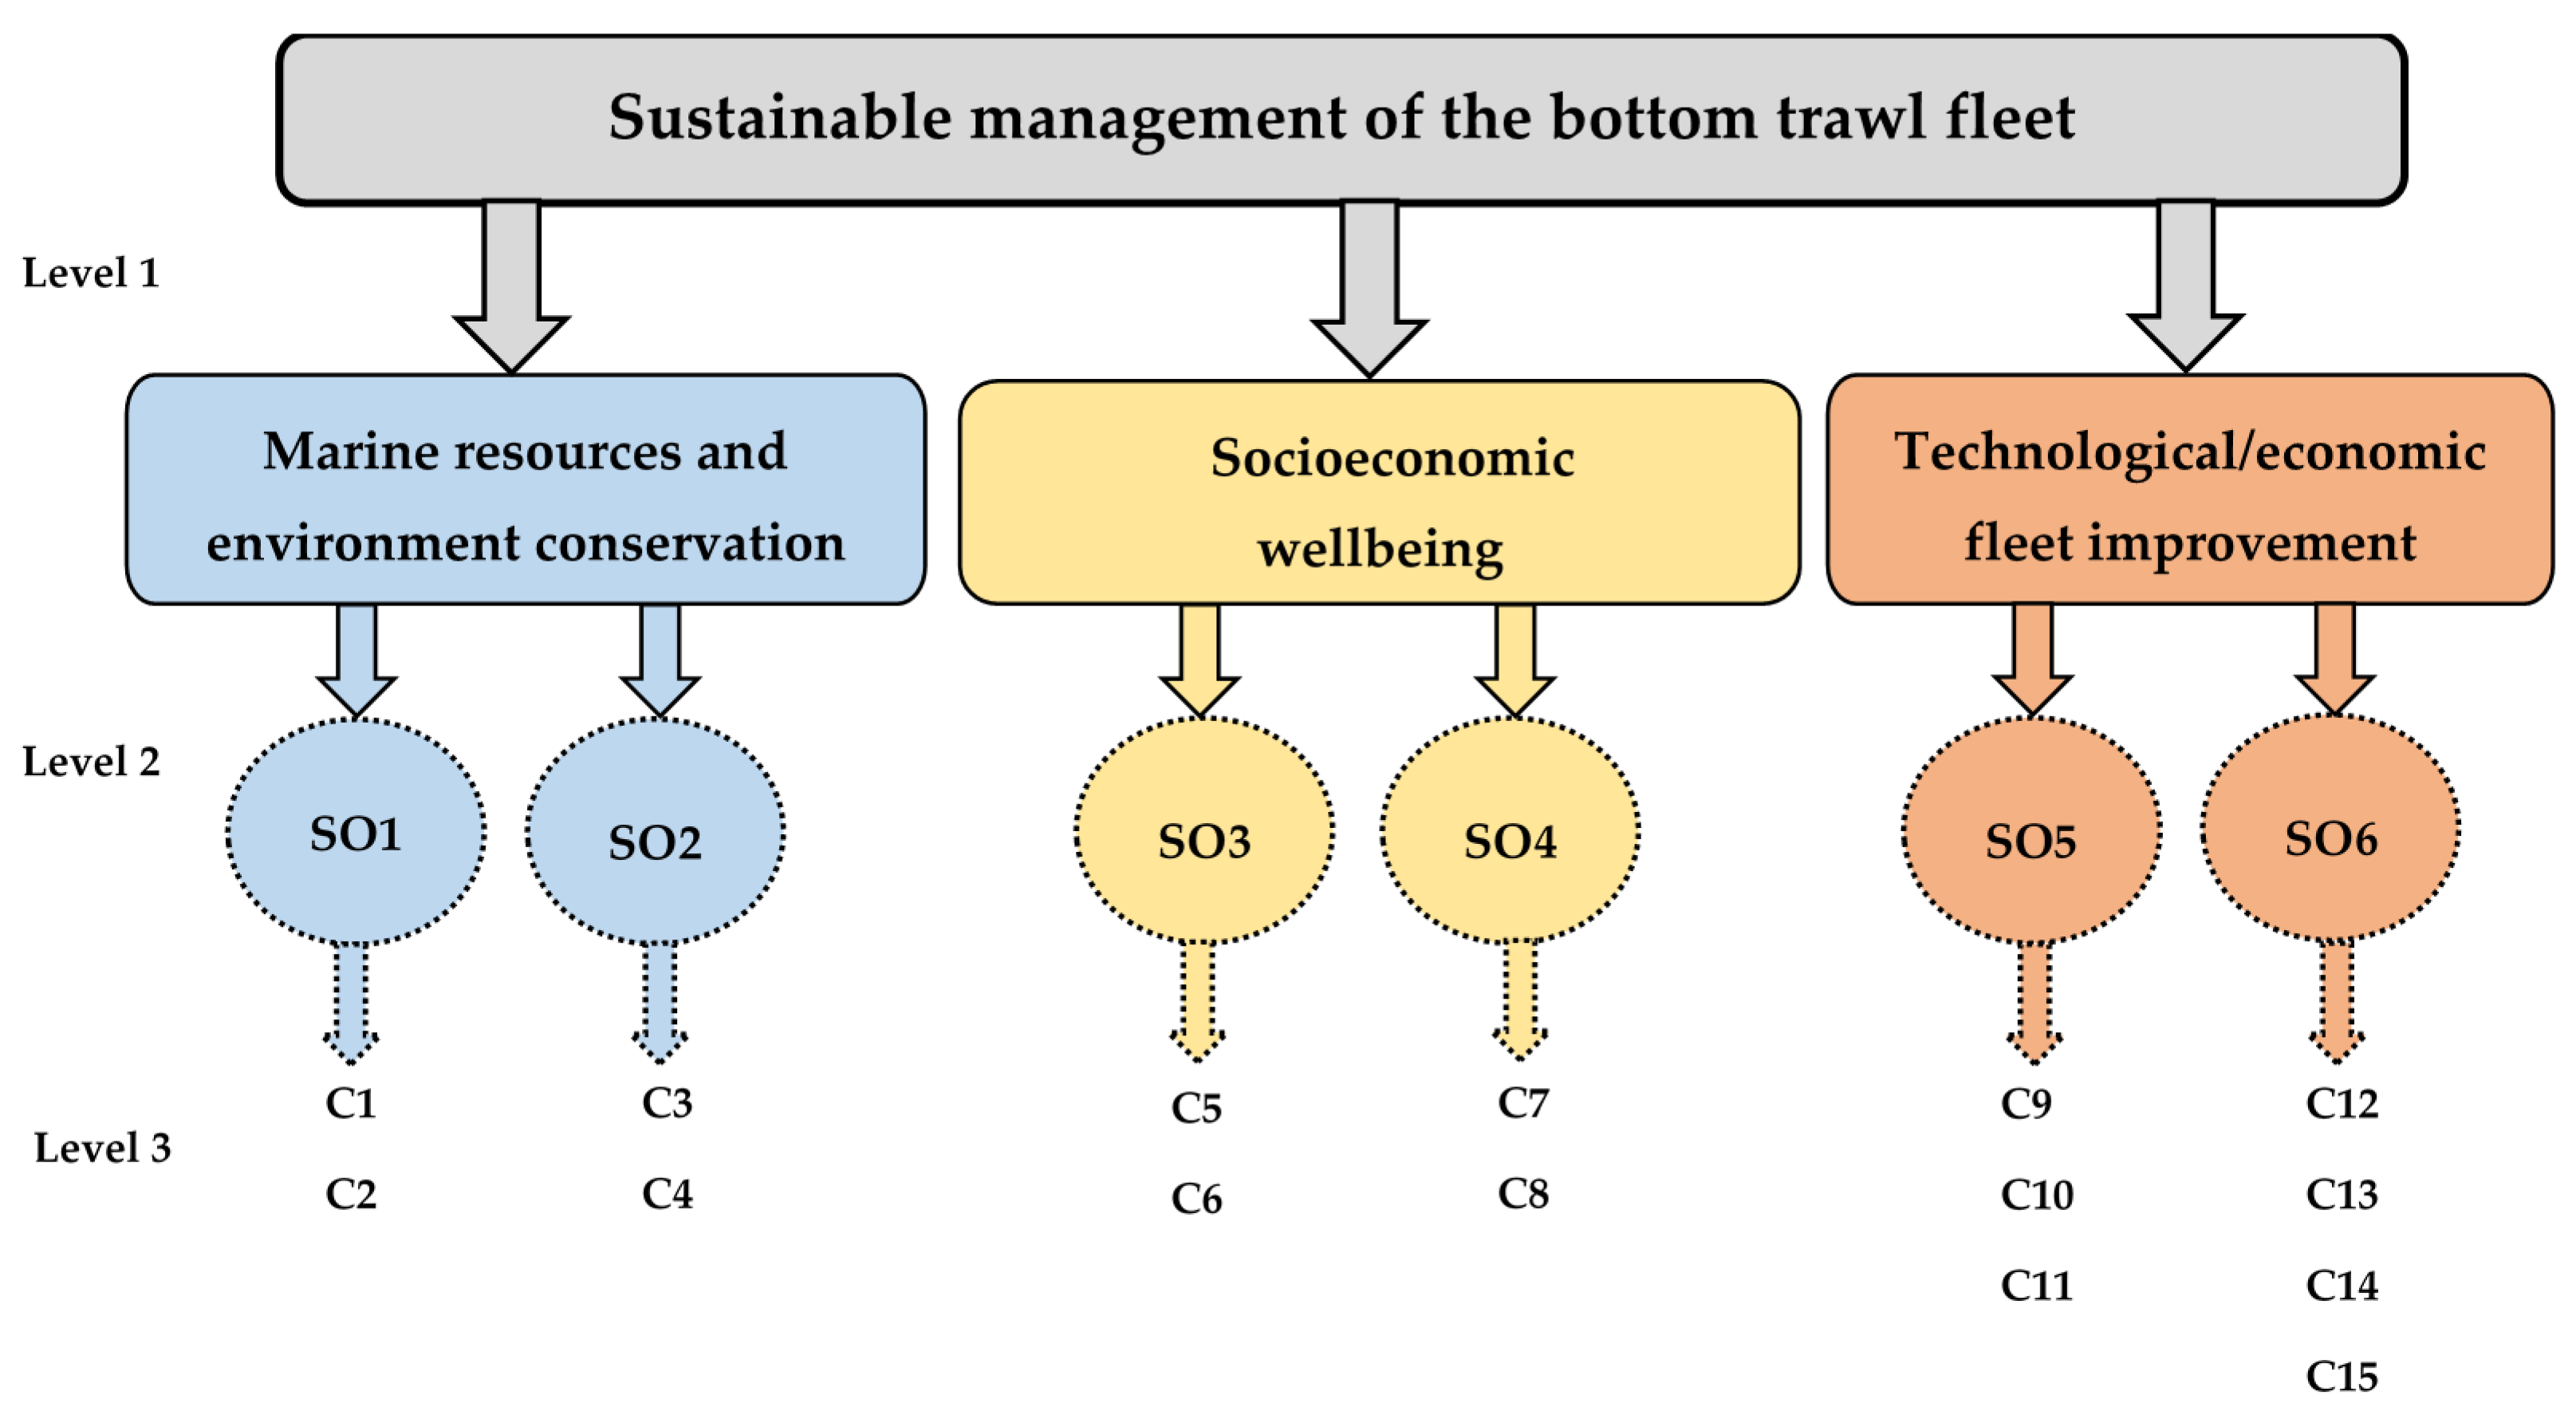
Setting up alternatives and defining the goal hierarchy structure (GHS) began with the presentation of the initial version of the SMBTF model by a DSC member who introduced each expert of the stakeholder group to the pre-determined overall goal and objectives of the first hierarchy level. Experts were asked to identify the sub-objectives of the lower hierarchy level and criteria of the last hierarchy level relevant for their field of expertise and in line with the requirements of their stakeholder group. It was necessary to arrange the proposed sub-objectives and criteria to eliminate the duplication of elements that are identical in content and meaning. Classification of the elements to the corresponding hierarchy level or combination of several elements into a single entity was required. These actions were carried out throughout several iterations until a conciliated opinion among experts was achieved. Feedback from the stakeholder representatives led to a new, improved version that was taken as the final version of the GHS (goal tree) with the overall goal of sustainable management of bottom trawl fleet (
Figure 3). The goal tree represents a hierarchical structure linking high-level objectives or goals to more detailed goals.
It should be emphasized that the proposed goal tree can be modified according to the specific characteristics of the surveyed area/fleet.
As presented in
Figure 3, the GHS contains one overall goal that is broken down into three objectives, each objective into two sub-objectives and each sub-objective into a number of criteria. A detailed overview of the proposed goal tree for the sustainable management of the bottom trawl fleet is presented in
Table 1. An original GHS, in the form of a goal tree and alternatives, was generated in parallel and complementary processes. All vessels in the bottom trawl fleet within the surveyed area were identified as alternatives following the mediation of the stakeholder representatives. All the alternatives together create a set of alternatives that must be comparable (“round robin”) and compliant with all the defined criteria.
By achieving the objectives from level 1 of the proposed goal tree, and their supporting sub-objectives through the defined criteria, the main goal, defined as “sustainable management of the bottom trawl fleet”, may be accomplished. First level objectives must be viewed as directly supporting goals for the main goal. The first hierarchy level consists of three objectives that encompass aspects of the ecosystem-based approach to fishery fleet management, including ecological and socioeconomic concerns of the bottom trawl fishery sector. For sustainable management of the bottom trawl fleet, management actions that cover vessel activities within the following objectives of level 1 were implemented as follows: (1)
Marine resources and environment conservation; (2)
Socioeconomic wellbeing of the trawl fishing sector; and (3)
Technological and economic performance of the trawl fishing fleet. The first objective of level 1 of the goal hierarchy model proposes the management of vessel activities that minimize impacts on resources and the marine environment. This is supported by two sub-objectives in level 2 and four criteria in level 3 of the proposed goal tree. The second objective from level 1 of the goal hierarchy model includes socioeconomic human needs which implies the management of vessel activities that enhance employment and incomes in the bottom trawl fishery sector. This objective is supported by two sub-objectives in level 2 and four criteria in the level 3. The third objective from level 1 of the goal hierarchy model envisages the management of vessel activities that improve the technological and economic viability of the trawl fishing fleet. It is supported by two sub-objectives in level 2 and seven criteria in level 3. The last hierarchy level, level 3, consists of fifteen criteria that are used to assess the proposed alternatives. The description of each criterion with the respective assessment technique is provided in
Table 2.
2.1.3. Determination of Criteria Weights
The next step in implementation of the DSC of SMBTF is the determination of the weight of each criterion in the proposed multicriteria model. All experts received the same introduction to the objectives and criteria, including the methodology to assign weights to each element of the proposed multicriteria model. The determination of criteria weights was provided through application of the multicriteria method called the Analytic Hierarchy Process (AHP) [
27]. Factors of the decision are arranged in a hierarchical structure and judgments on the dominant element for each pair are then made by the decision maker or by an expert. Experts representing each of the stakeholder groups were asked to assign weights to each element of the goal tree. In applying the AHP method, the elements of a given goal tree were subjected to pairwise comparisons, based on verbal judgments ranging from equal (1) to extreme importance (9), according to fundamental scale of absolute numbers [
28] as presented in
Table 3.
From judgments on two elements at a time with respect to a common property, priority vectors were obtained throughout the goal tree to give the best outcome for criteria weights. Both qualitative and quantitative criteria can be compared using informed judgments to derive weights and priorities using pairwise comparisons.
After carrying out pairwise comparisons, a decision matrix of the model was obtained. The selection is then calculated using linear algebra transformation of the decision matrix. Consistency of the selection and the judgments involved is derived from the estimation of the eigenvalue of the decision matrix. The first normalized eigenvector of the matrix gives the ratio scale (weighting) and the largest eigenvalue determines the consistency ratio [
28].
Assuming that there are three experts evaluating three criteria, the decision matrix would be as presented in
Table 4.
Criterion 1 would have the final weight (
):
—final weight value of criterion 1
—weight value of criterion 1 given by expert 1
—weight value of criterion 1 given by expert 2
—weight value of criterion 1 given by expert 3
3—number of experts.
Analogously, the criteria weight of all other criteria can be calculated as:
—final weight value of criterion j, where j is from 1 to k
k—total number of criteria
—weight value of criterion j given by expert i, where i is from 1 to n
n—total number of experts,
whereas the sum of final weight values of all criteria is:
Each stakeholder group, represented by its experts, provided its own set of criteria weights, and thus four sets were provided, representing four different scenarios. A final set of criteria weights was determined as a compromise set of criteria weights to be used for comparison and priority ranking of the defined alternatives. The compromised scenario stands as the simple geometric mean of all the votes assigned by the experts from the four stakeholder groups.
Occasionally, after judgments have been made and priorities computed for the hierarchy as a whole, less important elements can be eliminated from further consideration due to their relatively low impact on the overall objective [
27]. Should this occur, care needs to be taken, and the priorities can then be recomputed throughout.
2.1.4. Comparison and Priority Ranking of Alternatives
After weights have been assigned to each criterion, comparison and priority ranking of the previously defined alternatives was carried out using the Preference Ranking Organization Method for Enrichment Evaluations (PROMETHEE method). This is a multicriteria method used within the proposed concept for comparison and priority ranking of all vessels in the bottom trawl fleet within the surveyed area. The PROMETHEE family includes six outranking methods [
29,
30] from which PROMETHEE II has been selected as the more appropriate one.
Once alternatives were defined in the PROMETHEE methodology for each of the criterion, a preference function was used to compare alternatives. The decision maker’s preference favors one alternative a over another b, which increases with increasing difference between the performance of alternatives for each criterion j and corresponding values and . For each criterion j, and are the values of the performance of the alternatives a and b in criterion j.
To indicate the areas of indifference in the neighborhood of
, the following formula is used:
where
denotes the difference between the evaluations of
and
on each criterion
.
If the function
is defined with:
then the application of the preference function can be formulated as:
where
denotes the preference of alternative
with regards to alternative
on each criterion, as a function of
.
There are six different preference function types in line with the PROMETHEE method developed by Brans
et al. [
29,
30], which have values between 0 and 1 from the definition of the general functions. The smaller the function, the greater the indifference of the decision maker and the closer to 1, the greater the preference. If the decision maker has a strict preference, the preference function will be 1. For each criterion, the preference function translates to the difference between evaluations obtained by two alternatives into a preference degree, ranging from zero to one. From the six basic preference function types [
29,
30,
31], the following two have been selected:
After applying the relevant preference function for each criterion, the next step is to calculate the overall or global preference index
, as follows [
31]:
where
According to Equation (3) the formula from Equation (7) can be written as:
where
of
over
(from 0 to 1) is defined as the weighted sum
for each criterion,
is the weight associated with the
th criterion and A is a set of alternatives.
The alternatives are then ranked according to the
value. The descending order of
, where
is called the outflow, and represents the intensity of preference for
on all alternatives. The higher
, the better the alternative.
The ascending order of
, where
is called the inflow, and represents the intensity of preference for all other alternatives on
. The smaller the
, the better the alternative.
The PROMETHEE I method establishes an outranking relationship between the alternatives, taking incomparability into account and setting up an incomplete ranking among the alternatives. The PROMETHEE II method ranks the alternatives, organizing the order of
and sets up a complete ranking among alternatives, where
denotes the net outranking flow for each alternative.
Comparison and ranking of all 166 surveyed vessels was performed using the PROMETHEE II method since the ill-structured problem requires complete ranking among alternatives. All vessels were compared, and for each vessel, the net preference flow () was calculated as the sum of positive and negative preference flows. The positive preference flow () of a single vessel indicates the degree of dominance of one vessel over another according to all criteria with respect to the calculated criteria weights. Analogously, negative preference flow indicates the degree of inferiority of a vessel in comparison with other vessels.
A preference function was associated to each criterion in Visual PROMETHEE and is presented in
Table 5.
2.2. Application of the Decision Support Concept
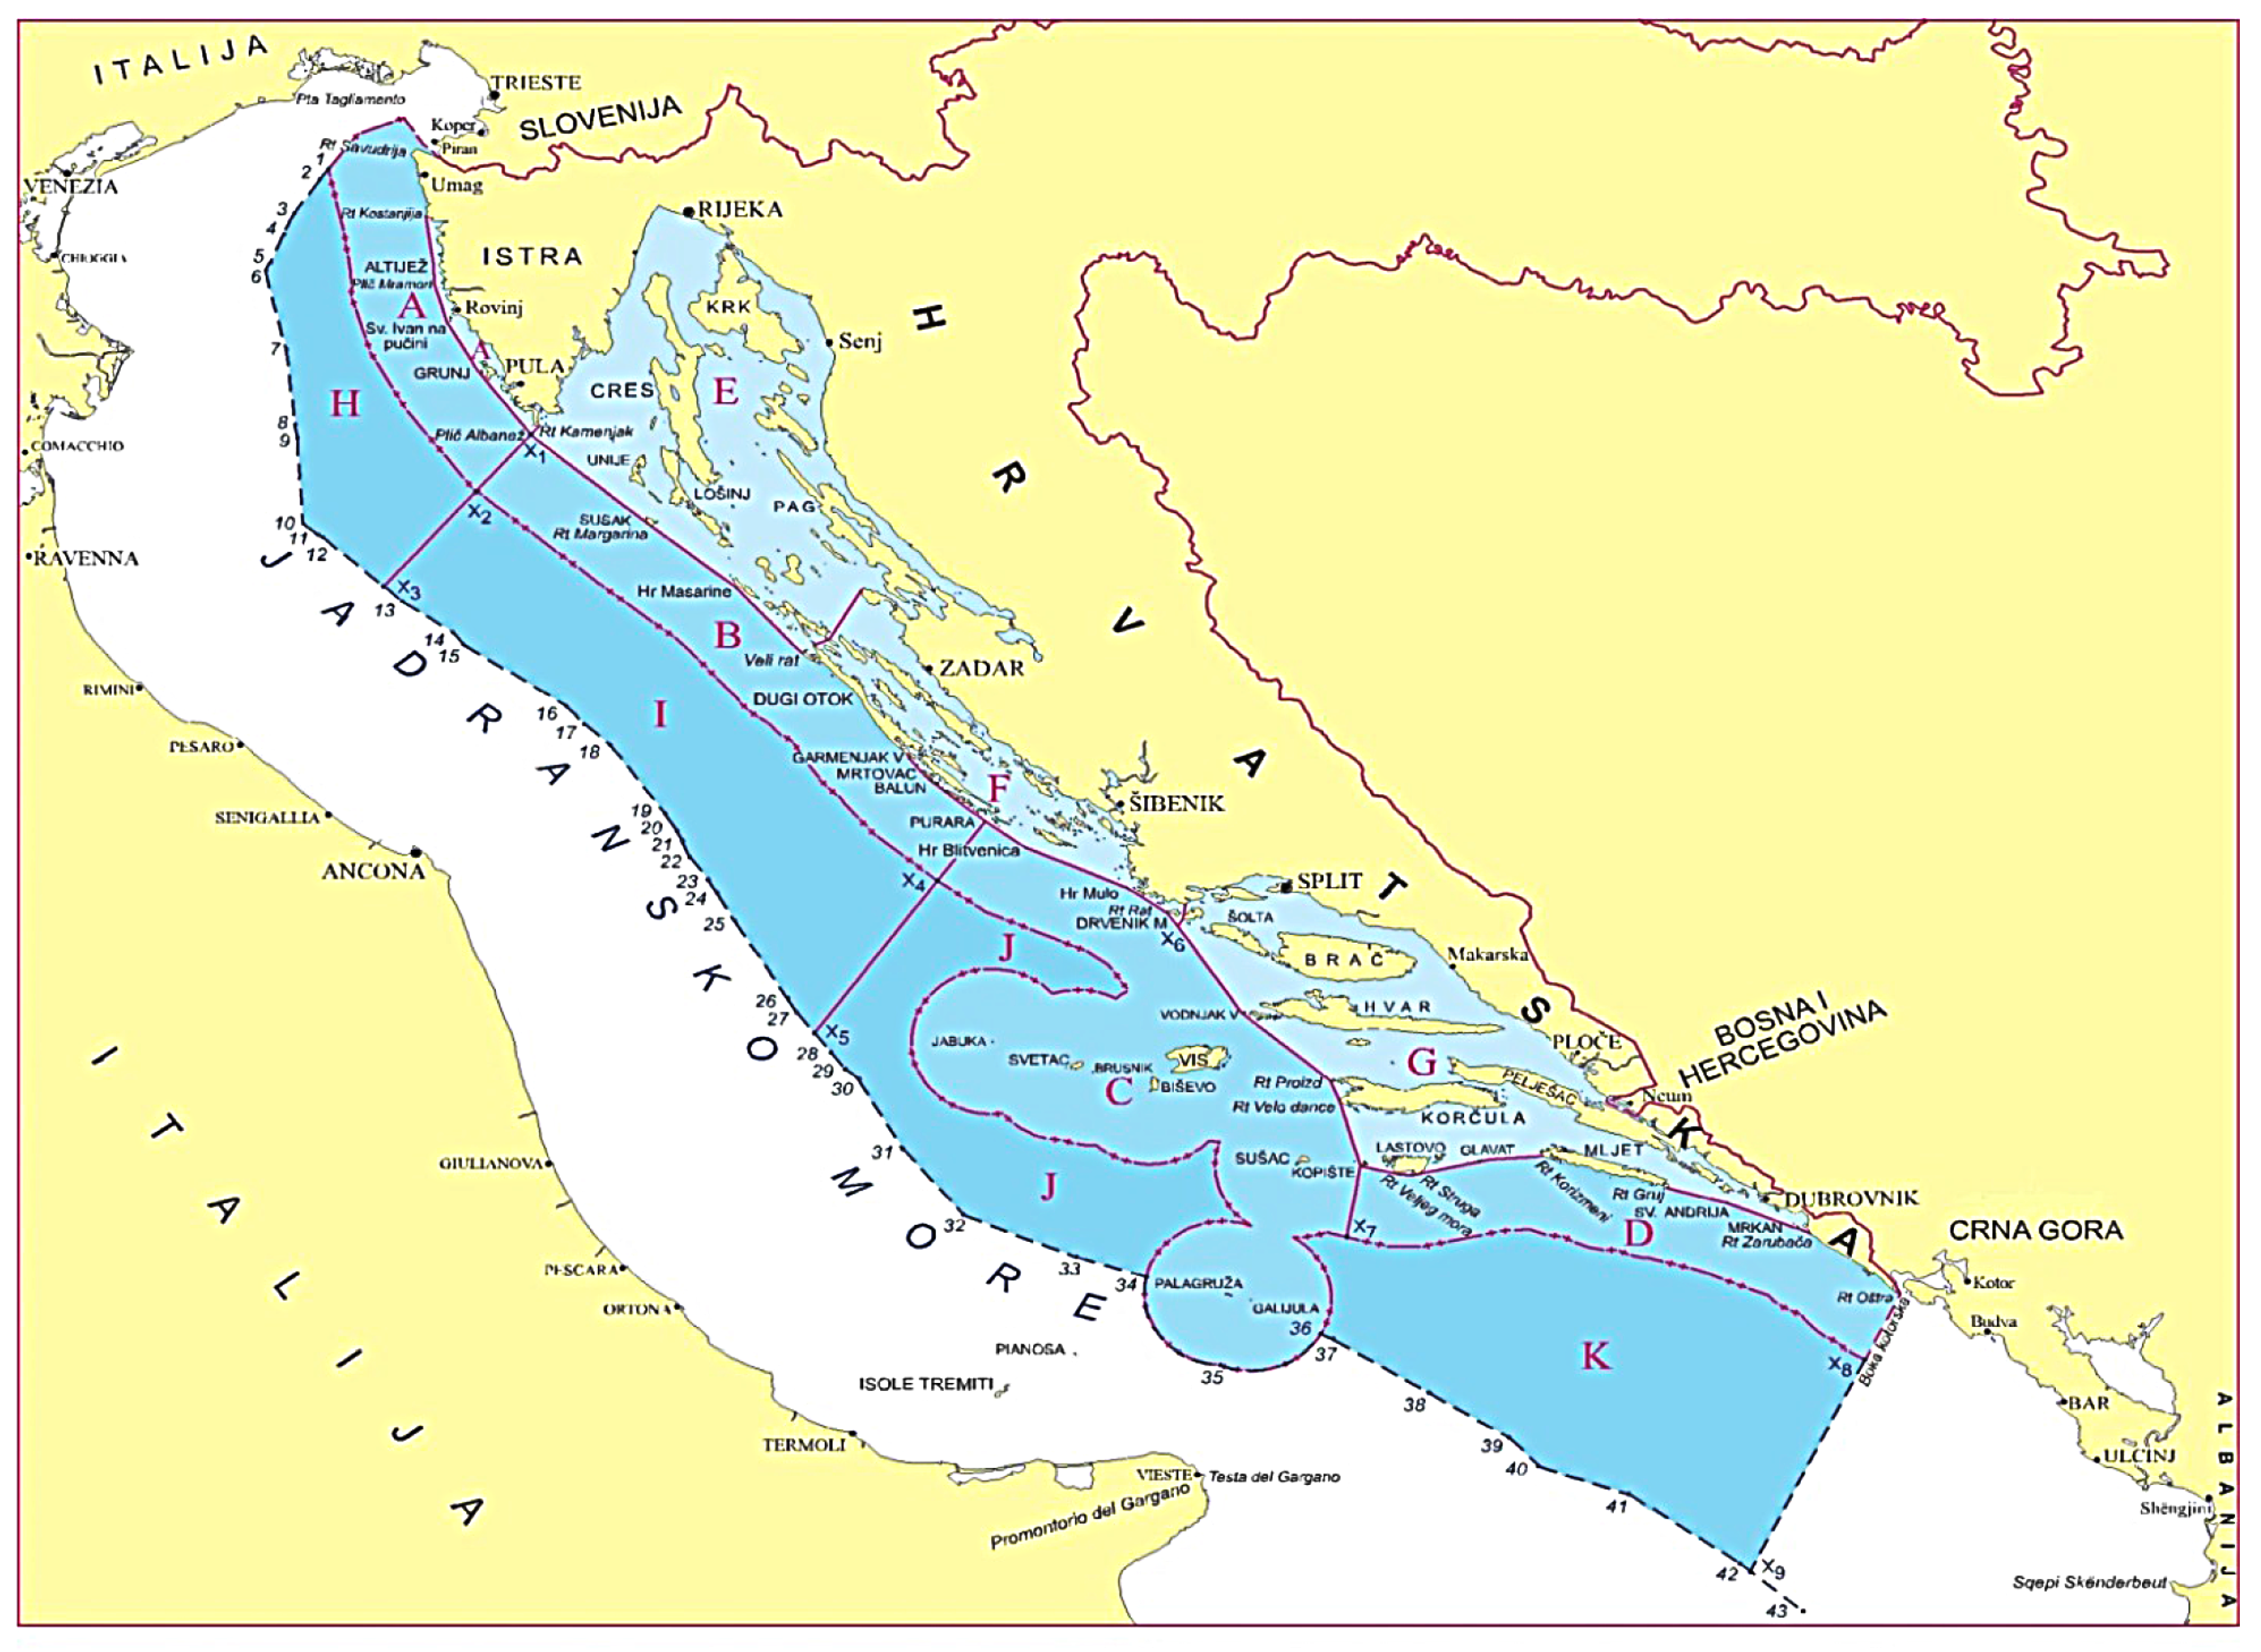
The geographic sub-area 17 (GSA 17) of the Adriatic Sea−North and Central Adriatic as defined by the General Fisheries Commission for the Mediterranean (GFCM) was used in this case study. Application of the decision support concept was performed according to data collected on the eastern (Croatian) side consisting of two parts: the inner fishing sea with an area of 12,461 km
2, encompassing the inner sea from coastland to dividing line, and the outer sea consisting of the territorial sea (19,267 km
2) and protected environment and fishing zone (about 25,000 km
2) (
Figure 4).
Several data sources were used to execute all the steps of the decision support concept. A set of input parameters was collected through the DemMon project entitled “Monitoring and management of fisheries resources in the eastern Adriatic–Croatian territorial waters,” which began in 2002 as a collaboration between the Directorate of Fisheries, Ministry of Agriculture and Forestry of Republic of Croatia and the Institute of Fisheries (NIFA) in Tromsø, Norway. During sampling, fisheries’ biological data were collected from a questionnaire containing items about the biomass index, fishing effort, landings, capacity, and general socioeconomic indicators of the trawl fishery [
32]. Other data were obtained from the Croatian Bureau of Statistics, insurance details from insurance organizations and data from relevant national and international sources engaged in the work of the bottom trawl fishery fleet. All data were pooled to assess the identified vessels within the surveyed area.
The proposed multicriteria model for sustainable management of the bottom trawl fleet based on a multicriteria method and goal analysis was created in collaboration with experts from four stakeholder groups. The identified stakeholder groups were: fishers from bottom trawl fishery sector and the fisheries chamber; representatives from non-governmental organizations: World Wide Fund for Nature (WWF) and Association Sunce for nature, environment and sustainable development; fisheries specialists from the Institute for Oceanography and Fisheries; and fisheries managers from the Fisheries Directorate, Ministry of Agriculture as government representatives. The criteria of the proposed goal hierarchy structure were generated in line with ecosystem-based principles encompassing biological, technological and socioeconomic aspects of the trawl fishing fleet. With the engagement of multicriteria methods on the goal hierarchy structure, experts assigned weights to each of the fifteen criteria using the AHP method, which resulted in four scenarios. Each expert was given the same vote strength of 5 on a scale from 0 to 10. Where conflicts existed between preliminary scenarios, criteria weights of a final, fifth scenario were calculated as the simple geometric mean of the weights from the four scenarios, to represent a compromise scenario used for further priority ranking of the defined alternatives. Decision support software TransparentChoice for academic users was used for entry of criteria weight values.
According to the criteria values from the compromise scenario, a PROMETHEE ranking was derived for 166 alternatives, each representing a bottom trawl vessel of the survey area. The comparison of alternatives and priority ranking was performed using the PROMETHEE method with Visual PROMETHEE Academia software (version 1.4). The result was ranked for each of the 166 vessels, according to the 15 criteria.
The decision matrix, consisting of 166 rows and 15 columns, is too large to be presented in this paper, therefore the first 20 alternatives from the software application are shown in
Table 5. Columns show criteria, and show alternatives (vessels). The preferences section (rows 2 to 4) contains information about the decision maker’s preferences. There are criteria for which a high score has a negative effect (C1, C9, C10, C12, C14), meaning that these criteria should be minimized. Other criteria (C2, C3, C4, C5, C6, C7, C8, C11, C13, C15) for which a high score implies high performance should be maximized (see
Table 6). The weight of a criterion measures its importance in comparison to other criteria. The
Type of Criteria row illustrates what type of preference function has been associated with each criterion and the
Parameters row shows the threshold value for each criteria. A total of 13 criteria were defined as V-shape (Type III), meaning the preference for one alternative over another is for progressively larger deviations between
and
. The intensity of the preference increases linearly until this deviation equals
; after this value, the preference becomes strict. For each alternative, the value
was defined (
Table 6–row 5). Two criteria (C3 and C4) were defined as usual (Type I), indicating that there is indifference between alternatives
and
only when
; when the values are different, there is a strict preference for the alternative with the greatest value. In this case, no particular parameter needs to be defined.
Given the evaluation of the alternatives for the established set of criteria, PROMETHEE II was applied and gave the rankings of bottom trawl vessels displayed in the results section. Vessels with a positive net preference flow (+ are vessels with overall better characteristics when analyzing all vessels from the managerial point of view, and in particular when establishing sustainability in management plans for bottom trawl fleet, which is the focus of this paper.
The proposed DSC SMBTF has the flexibility that allows users to apply their own preference functions or differently distribute the assigned preference function in order to meet the needs of a specific research area.
3. Results
3.1. Criteria Weights
Criteria weights required for the comparison of alternatives provided by experts representing four identified stakeholder groups are presented in
Table 6.
The highest criterion weight was assigned to C2 “Spatial dispersion” and the lowest to C10 “Vessel age”. Experts from the fishers’ stakeholder group recognized improving the spatial distribution of the fishing effort (C2) as the most preferable criterion, as they assigned the highest weight of 0.347 to C2, which was the highest weight of all criteria in all scenarios. The least preferred criterion of the first scenario was C10 with a weight of 0.001, which was also the lowest value given in all scenarios. The second scenario shows the results of mean votes from experts from environmentally focused non-governmental organizations in the field of marine biology. Among the eNGO experts, C4 “Coastal area conservation”, was recognized as the most preferred criteria, with a weight of 0.231, while the least preferred criteria were C12 “Vessel insurance”, C13 “Vessel value” and C14 “Fishing gear costs”, all with the same weight of 0.008. The third scenario illustrates the results of the mean of votes from scientists, experts in the field of fisheries management, who assigned the highest preference to C4 “Coastal area conservation” with a weight of 0.229 and the least preference to C14 “Fishing gear costs” with a weight of 0.010. The fourth scenario shows the results of the mean preferences assigned by experts working in the Fisheries Directorate, entrusted with the management and policy of the fishery sector. Their highest criterion weight was assigned to C8 “Salary of the employed crew members” with a criteria weight of 0.247 and the lowest to C10 “Vessel age” and C12 “Vessel insurance” with the same weight of 0.006. Criteria weights assigned by each of the four groups differed in the approach taken to the same issue, thus confirming that the fishery sector is a complex sector where stakeholders have different demands and priorities.
The final scenario is the geometric mean of assigned preferences given by the experts of all the identified stakeholder groups. The results of the compromise scenario show that C2 “Spatial dispersion” was found to be the most important criterion, with a weight of 0.264. The lowest weight of the compromise scenario was assigned to C12 “Vessel insurance” and C14 “Fishing gear costs” with the same value of 0.009.
Most of the highest ranked criteria contribute to achievement of the first objective of the goal hierarchy model,
i.e., the conservation of marine resources and the environment and the second objective,
i.e., improving the socioeconomic wellbeing of the trawl fishery sector. The lowest criteria weights were distributed among the criteria that support the achievement of the third objective,
i.e., improving the technological and economic performances of the bottom trawl fishing fleet. The study found that the need to conserve marine resources and the marine environment had the highest impact among three of four of the identified stakeholder groups. Except for government, all other groups assigned more than half the value of weights to marine resources and environment conservation: fishers 52.8%, eNGOs 54% and scientists 55%. Experts from the fisher and eNGO groups most clearly distinguished between the three objectives. Experts from the scientist group scored the first objective higher than the second and third, which received a similar score. The fourth group, experts representing the government, saw socioeconomic wellbeing and conservation of marine resources and the environment as important goals to be achieved, and assigned the same weights of 44.4% to these objectives (
Table 7).
3.2. Comparison and Ranking of Alternatives
Net preference flow () values of all 166 surveyed vessels were within the interval from −1 to 1. Vessels were ranked according to net preference flow () value.
The distribution of the total sum in terms of gross tonnage (GT), meters overall (m LOA) and power engine (kW) of all vessels with positive net preference flow (+
) compared to vessels with negative net preference flow (−
are presented in
Table 8.
The (+) vessel group count 71 vessels with total 2540 GT compared to the (−) vessel group that have 95 vessels and 1586 GT. The total m LOA and kW were similar among the vessel groups tested.
Table 9 shows the distribution of all 166 bottom trawl vessels within the surveyed area with respect to the three vessel size categories. Categories were identified according to the Croatian Management Plan and Fleet Report for bottom trawl fisheries [
20]. The first category included vessels up to 12 m LOA which account for 30% of all analyzed vessels; the second category were vessels from 12 to 18 m LOA (54% of all analyzed vessels); and the third category were large vessels over 18 m LOA (16% of all analyzed vessels).
The differentiation in terms of sum, average and count of total GT and kW of the two vessel groups was analyzed (
Table 10). The greatest differentiation was seen among vessels up to 12 m LOA (first category vessels). This category is significantly more present within the (−
) vessels, with 32 more vessels, thus representing the largest differentiation of (+
) vessels and (−
) vessels in terms of the number of vessels. The number of vessels within the second category (12 to 18 m LOA) are similarly distributed among (+
) vessels and (−
) vessels. In the third category of vessels (above 18 m LOA), the (+
) vessel group dominates.
In terms of GT and kW, the first category of vessels prevailed with more than 80% within the (−) ranked vessels. The second category of vessels showed a similar distribution of GT and kW among the two vessel groups ranked according to net preference flow ((+) vessels and (−) vessels). The third category of vessels showed a significant advantage of around 80% in GT and kW within the (+) ranked vessels.
Calculating the average of the 71 vessels with positive net preference flow, the result is a vessel with the following performance: 19.10 m; 35.77 GT; 204.37 kW.
On the other hand, the 95 vessels with negative net preference flow has an average performance of 13.45 m, 16.69 GT, and 151.90 kW.
3.3. Vessel Selection for Fleet Reduction
To meet the fleet reduction requirements, vessel selection was performed among vessels with negative net preference flow (−
). To reduce the trawl fleet by about 5% in terms of total kW, 11 vessels of the group with negative net preference flow were selected for elimination from the fleet. The selection was made among the last ranked vessels with net preference flow
from −0.0855 to −0.1257. Vessels ranked from position 156 to 166 were selected, thus reducing 5.8% of total kW as 3.6% of total GT (
Table 11). Reduction in terms of the number of vessels was within the first category (<12 m LOA), as five vessels were excluded (45% of eliminated vessels), and the second category (12–18 m LOA), as six vessels were excluded (55% of eliminated vessels).
Once fleet reduction was performed, the optimized fleet consisted of 155 trawl vessels. The distribution in terms of GT, m LOA and kW among the three size categories is shown in
Table 12. The representation according to all 166 vessels (see
Table 10) shows a 2% decrease within the first size category and a 1% increase within the third size category. The representation of vessels within the second size category showed no change. As seen in
Table 12, the largest sum of GT was present within the third size category and the largest sum of kW was present within the second size category.
4. Discussion
The present study aims to develop a decision support concept (DSC) to assist the government or other decision makers in planning fisheries fleet management strategies. The DSC results neither prescribe nor prohibit. However, if taken into account on time, the results could be useful to decision makers in adjusting fishing capacities and efforts to fishing possibilities. Preventive measures and a proactive approach are highly recommended in mitigating negative anthropogenic impacts on the marine ecosystem. On the other hand, reactive measures should be avoided, as they are often costly, time-consuming and cannot guarantee reversal of damage.
The use of multicriteria methods, such as Simple Additive Weighting (SAW), AHP and Multi-Attribute Utility Theory (MAUT), are widely accepted in fisheries, and the known approach in fisheries management is mainly based on the use of multicriteria methods for the selection and evaluation of management instruments, and for analyzing the performance of fisheries management policies (e.g., [
10,
33,
34]). Although DSS and multicriteria methods have been applied to support decision makers in fisheries research (e.g., [
1,
2,
11,
12,
35]), the techniques have been used separately. To the extent of our knowledge, there are no examples of a combined application of DSS and multicriteria methods such as AHP and PROMETHEE in fisheries fleet management. Combining AHP and PROMETHEE in the presented DSC is seen as very useful to facilitate decision support for fleet management. Through the application of AHP, the interests and priorities of all stakeholder groups are taken into account and the results are used as input parameters for further PROMETHEE calculations. The literature review revealed that the only possible way to achieve sustainability of the fishery sector is to include all affected parties [
9,
12,
36,
37,
38,
39]. This DSC highlights the relevance of stakeholders by including experts representing four main stakeholder groups in the decision-making process by identifying and engaging them in the further execution of the DSC immediately after definition of the main goal. The AHP method used in determining and assessing criteria is simple, and clearly understandable to all stakeholders. The study showed that stakeholders and experts have a strong awareness of the need to introduce new tools and approaches to managing biological resources, given the unsustainability of existing practices. The PROMETHEE method, on the other hand, gives the possibility of analyzing the observed problem from different perspectives and in greater detail.
The PROMETHEE II results of the distribution of the number of (+) vessels and (−) vessels show that more vessels were ranked as (−) vessels, i.e., 24 more (−) vessels. The number of vessels, total GT, m LOA and kW of (+) vessels compared to (−) vessels shows that (−) vessels are more numerous in number but less in total GT, m LOA and kW. These positively ranked vessels perform their activities in line with ecosystem-based principles and in accordance with the interest of all stakeholder groups and can be used in the implementation of further management measures. According to the results of PROMETHEE II ranking, management measures should be implemented to stimulate the use of vessels in the third size category (above 18 m LOA), as they are significantly more present within the (+) vessels. The calculated average parameters of (+) vessel group (~20 m, 35 GT, 200 kW) represent a vessel with suitable performances in light of an ecosystem-based management approach that meets the requirements of this particular fishing area, the Adriatic Sea. Considering the preference net flow, the vessel group with negative net preference flow should be seen as vessels that are a burden to the trawl fleet, and fleet reduction should be considered among this group of vessels. The part of the ranking list with negative net preference flow vessels can be taken as a foundation for other types of management measures, and the decision maker may analyze characteristics of vessels in relation to their rankings, the net preference flow () values, to determine the kind of management actions, e.g., guidelines to establish instruments and policies within sustainable management plan that are most appropriate for implementation. The presented analysis of bottom trawl fleet to the level of a single fishing vessel highlights the flexibility and diversity in creating policies and strategies for sustainable management of bottom trawl fleet, which can be used to achieve the advisable balance between fishing capacity and fishing opportunities.
The validity of the combination of these multicriteria methods is accomplished through the generated hierarchical multicriteria model in a form of a goal tree. The goal tree underlines the object-oriented approach and presents an essential foundation for development and design of the proposed DSC. Due to the necessity and importance of implementing an ecosystem-based approach to fisheries management [
4,
40,
41], the proposed goal tree for fleet management was created in line with ecosystem-based principles as a measure for conservation of marine resources and the environment: (e.g., spatial dispersion of fishing effort), socioeconomic wellbeing (e.g., employment and salary of fishers) and techno-economic performances of the fleet (e.g., remount costs, equipment
etc.) were taken into account. Although improving conventional management implementation with the specific requirements for the ecosystem-based approach was recognized [
41], the DSC proposed here is likely widely applicable in fisheries as a new approach for improving conventional fisheries management measures and achieving ecosystem-based goals when focusing on fishing fleet management.
Since there is still a lack of appropriate structures to develop and get recognition for applied research and expertise at the interface between science, management and policy [
37], this DSC presents an approach that overcomes this shortcoming. This DSC could provide a meaningful contribution for the means to better incorporate the human role and stakeholder role in achieving sustainability through economic viability and social fairness.
The DSC as demonstrated could be adjusted to each site-specific scenario based on respective vessel structure, commercial stocks and ecosystem targets. This approach does not take into consideration the specific fish species, though directions for future research could be to include this aspect to “penalize” vessels that catch rare or threatened species. As a management tool it could be implemented and adapted for each fishery individually, embracing its complexity, and knowing that different fisheries might require different solutions. Since the longitudinal structure of the fishing fleet in individual fishing zones along the eastern Adriatic varies, this DSC could be adjusted to each individual county with their respective vessel structure. There are many attempts to manage trawl fisheries that rely on a set of analyses (e.g., ecological risk assessment, bio-economic modelling etc.) and use a range of control variables including quotas, gear controls and spatial management. Although this decision support concept focuses on vessel selection as the main control variable, if combined with the aforementioned management measures, a better move toward sustainable, resilient fishery systems could be possible.


