
The Evaluation and Significance of Smart City Projects in Korea: Targeting Enterprises within the Smart City Association Convergence Alliance


Department of Real Estate Studies, Kongju National University, Yesan-gun 32439, Chungcheongnam-do, Republic of Korea
Sustainability 2024, 16(7), 2697; https://doi.org/10.3390/su16072697
Submission received: 15 February 2024
/
Revised: 21 March 2024
/
Accepted: 21 March 2024
/
Published: 25 March 2024
(This article belongs to the Section Sustainable Urban and Rural Development)
Abstract
:This study identified, analysed, and prioritised significant factors for standardising the Korean smart city project evaluation system. We analysed the efficiency and productivity of companies currently providing smart city services, considering both policy and practical aspects. The prioritisation of smart city planning reflects the latest trends in South Korea, where urban planning is moving towards smart city planning. Furthermore, public–private and private–private partnership capacity-building highlights the importance of business scalability. This shows that smart city services are only stabilised when the private sector is involved in and leads the project, rather than focusing on public development. The feasibility of building intelligent facilities indicates that smart city projects should be implemented after securing cost–benefit feasibility. The results were used as the basis for an evaluation system, showing that, in smart city convergence alliances, small- and medium-sized enterprises achieved the highest efficiency by reducing inputs to 81% and 86% under the assumptions of constant and variable returns to scales, respectively. As the operational aspect is more problematic than the technical aspect, policy alternatives are necessary for smooth business progress, including increased flexibility of laws and institutions and the activation of policies that temporarily relieve regulations for smart city projects.
1. Introduction
A smart city is based on intelligent infrastructure, in which technology is applied to solve existing urban problems and improve citizens’ quality of life [1]. Recently, smart cities have begun to be viewed as objects, and their non-physical elements are also being emphasised [2], building a foundation to address social problems in collaboration with experts and citizens [3]. The importance and necessity of smart cities is rising because, owing to the COVID-19 pandemic, activities that previously took place in physical spaces have shifted to virtual ones [4]. In recent years, smart cities have been ranked high on the agenda of urban discourse, owing to significant changes in daily life, including rapid urbanisation rates, a decline in old downtowns, and socio-economic and environmental factors [5]. According to McKinsey’s market research report [6], the smart city market is expected to grow up to USD 1.7 trillion by 2025, and will continue to expand, as most countries worldwide, including developing ones, are promoting smart city projects. Although smart city projects are highly important as a national policy, and demonstration projects are actively underway, they are in a relatively early stage, and the actual field application and status analyses are often insufficient. Therefore, many are demanding the reorganisation of the public project evaluation system [7]. Given the nature of these projects, which require large amounts of capital, it is necessary to improve their return on investment (ROI); however, no universal performance management systems or evaluation indicators are internationally accepted [8]. Despite their importance, deriving standardised evaluation indicators is difficult because of the vastness of the concept and comprehensiveness of a project. In addition, there is a lack of adequate performance management systems in companies that actually conduct the projects, based on which the evaluation factors should be derived [9]. Particularly in line with the global trend of smart cities, the Ministry of Land, Infrastructure and Transport of South Korea introduced the Smart City Challenge in 2019. The Smart City Challenge conducted by South Korea’s Ministry of Land, Infrastructure and Transport was benchmarked against the United States’ Smart City Challenge. It is a project where enterprises and local governments collaborate to discover and demonstrate solutions, supporting the establishment of master plans and the demonstration of solutions (each funded with KRW 1.5 billion for one year). Additionally, outstanding local governments are further supported in the following year with development funds (each funded with KRW 20 billion, 50% of national funding, over two years). A total of 87 projects were carried out from 2018 to 2021. This initiative represents a new policy approach that encourages private companies to use innovative ideas to solve pressing urban issues such as transportation, environment, and energy by reflecting the demands of local governments and citizens in a bottom–up manner (Ministry of Land, Infrastructure and Transport, 2019). In 2020, the Town Challenge and Solution Challenge were added to advance the Smart Challenge project (Ministry of Land, Infrastructure and Transport, 2020). This approach underscores that smart city projects must not be approached with a dichotomous logic centred solely on government or private entities. Instead, a cooperative system involving public, private, and citizen sectors, along with their diverse exchange mechanisms, is essential. Such collaboration is not only vital for enhancing Korea’s competitiveness in smart cities but also for setting global standards. A smart city is a fusion and convergence concept that goes beyond simple urban planning; it encompasses technology, economy, society, and politics, and requires cooperation between stakeholders and an organic relationship with the city government. We have been witnessing side effects, including the implementation of multiple simultaneous projects by several government departments and a business model that focuses on building infrastructure to achieve short-term results [10]. Consequently, evaluation indicators vary based on department, project, and the participating organisations, and they are not standardised. South Korea operates a smart city convergence alliance, comprising enterprises, universities, research institutes, and associations; however, their operational efficiency is not measured, and they fail to set the future direction and improve the sustainability of business [11]. In particular, small- and medium-sized enterprises (SMEs) are vulnerable to management risk, and the monitoring and consulting of performance is essential.
This study primarily focuses on revitalising the smart city industry by examining smart city evaluation indicators in the context of South Korea’s Smart City Challenge initiative. The main objective is to improve the smart city project evaluation system through surveys and DEA analysis. Furthermore, this study also analyses data from the business evaluation system to derive standardised evaluation indicators. Additionally, by assessing the efficiency and productivity of SMEs currently involved in the smart city project, it aims to understand the management status of these enterprises based on input and output, and to propose implications and measures for improvement.
1.1. Methodology
This study developed a hierarchical structure for key elements of smart city project evaluation and analysed their importance by deriving relative weights through an analysis of relative importance among experts. Additionally, the efficiency of enterprises within South Korea’s Smart City Convergence Alliance (mainly SMEs) was analysed using the data envelopment analysis (DEA) method, utilising data from these companies.
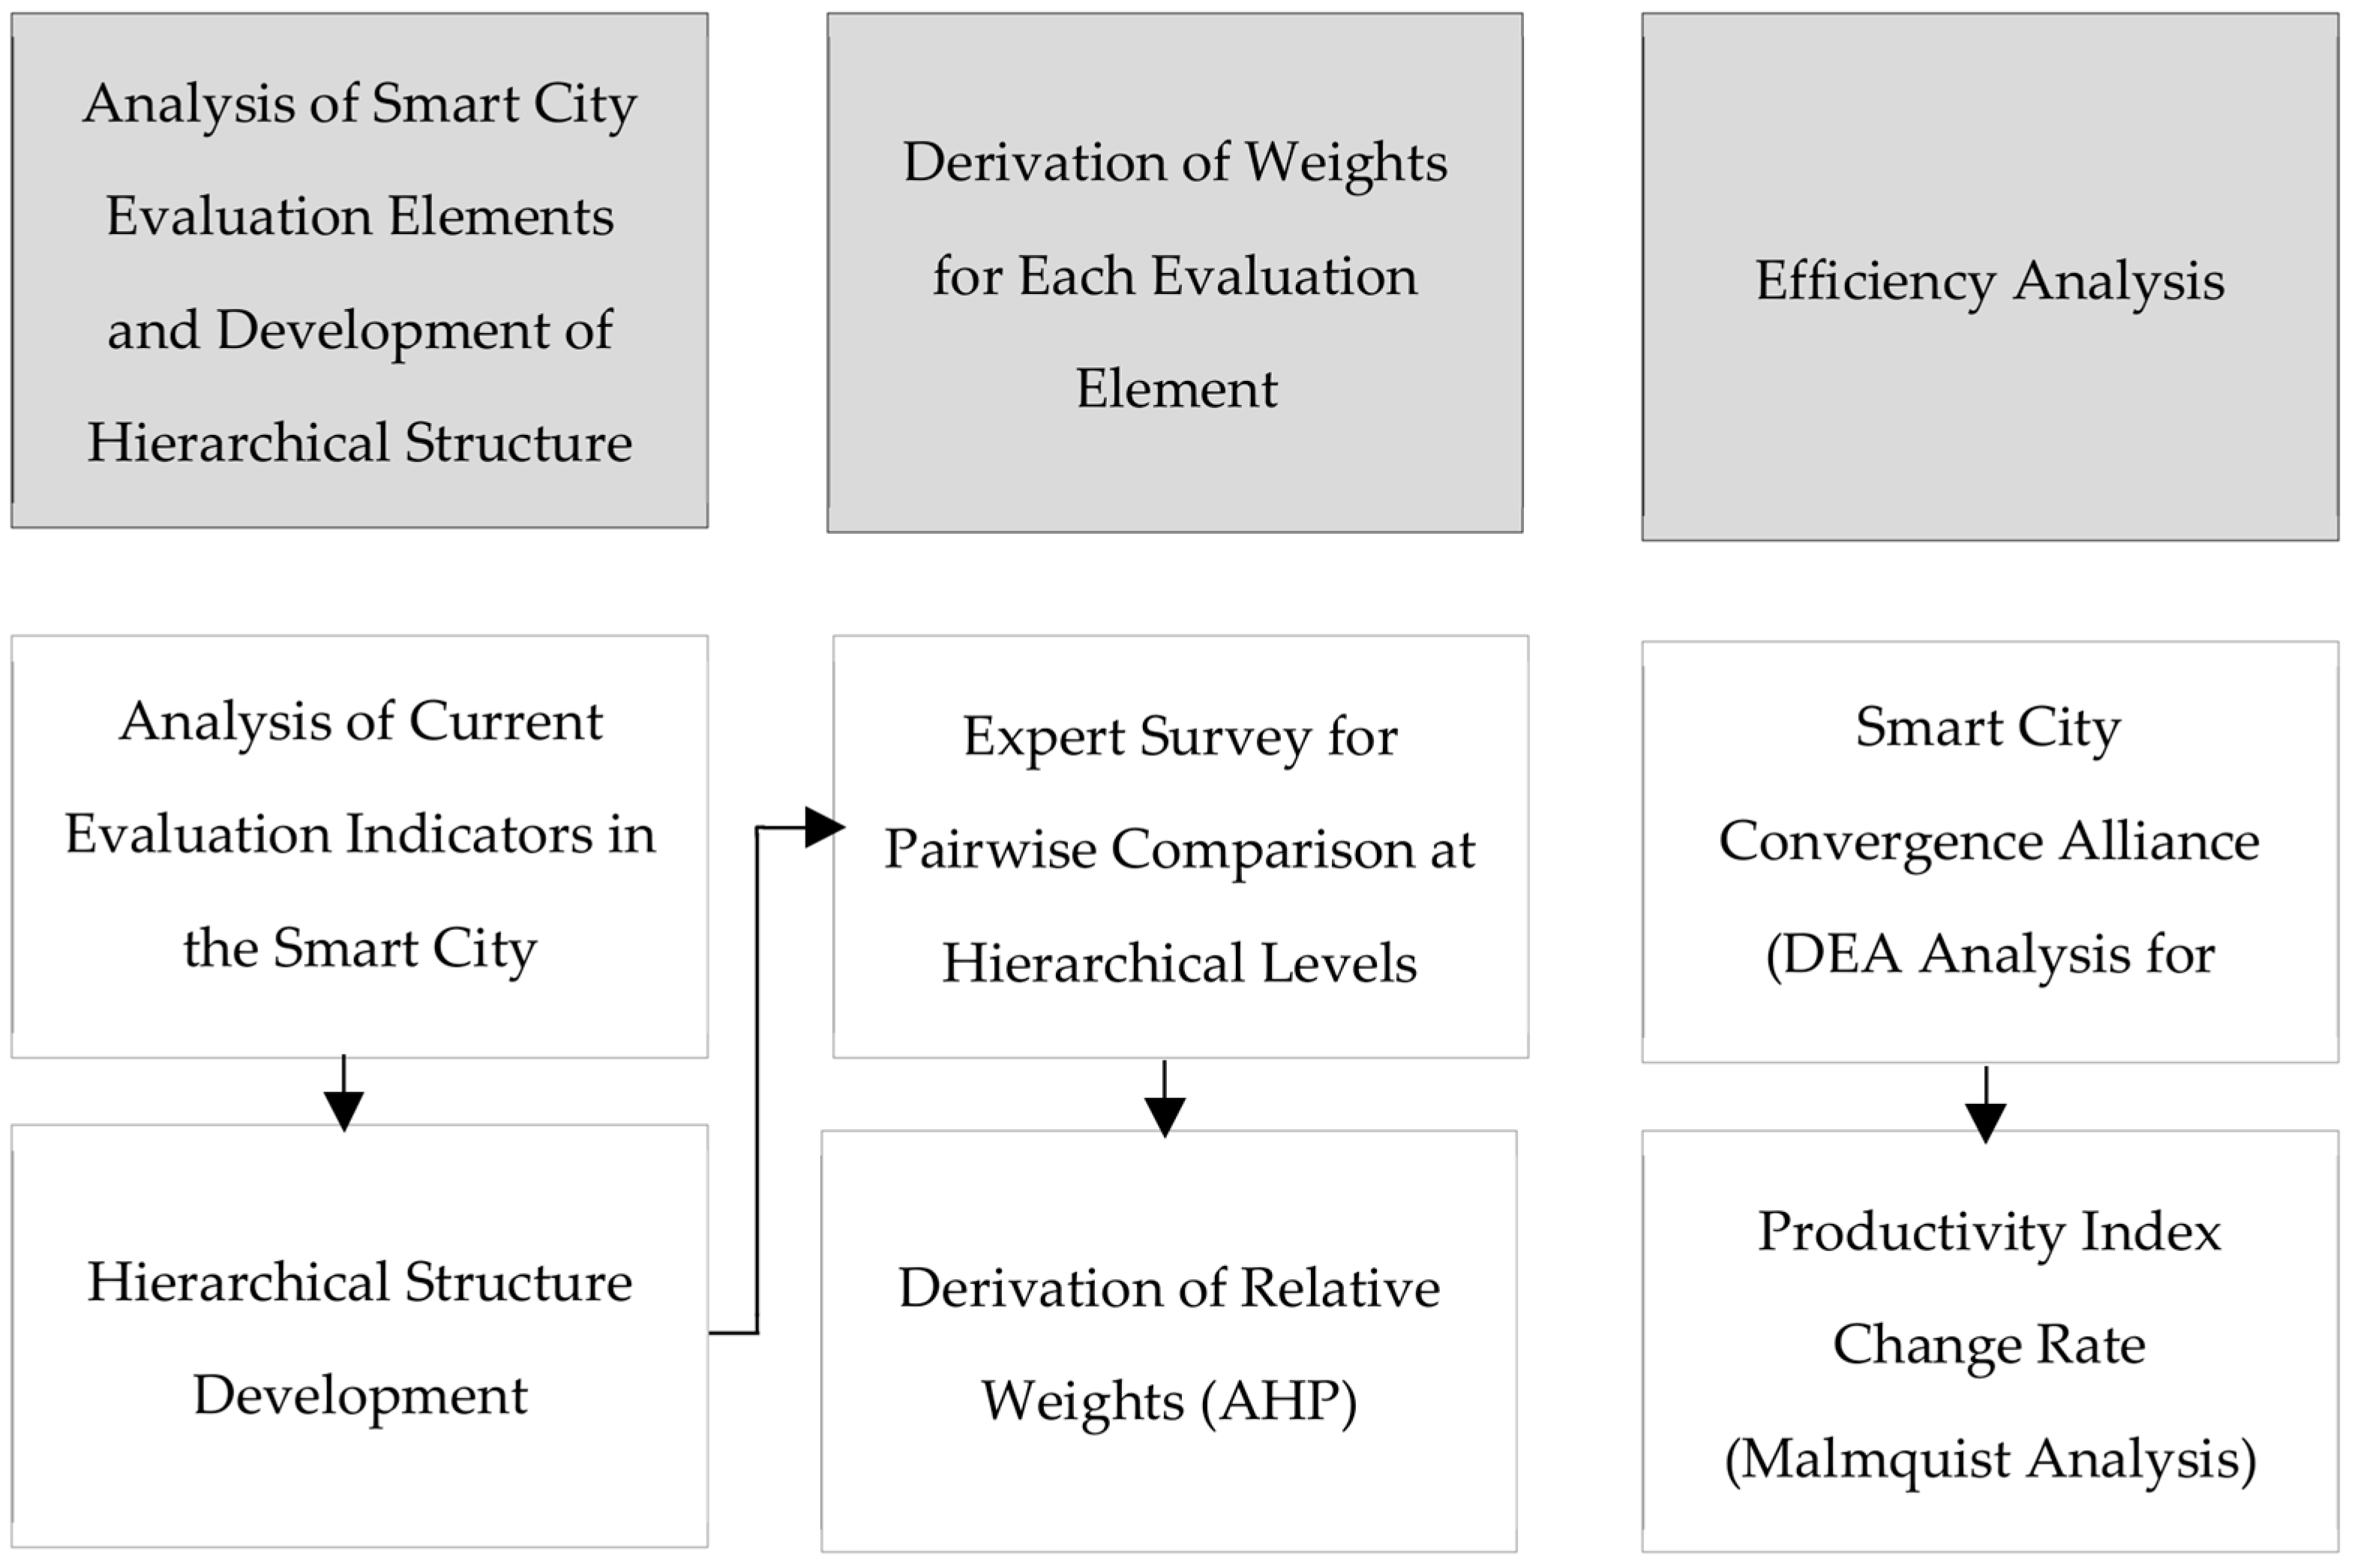
The model of this study is structured in three stages, as illustrated in the following figure. Stages 1 and 2 have a preceding and succeeding structure, while the efficiency analysis in Stage 3 is conducted separately. This process aims to compare and review the qualitative perceptions of experts on project evaluation criteria along with actual, quantitative data from enterprise analyses. The purpose is to identify practical and policy implications necessary for the smooth implementation of smart city projects. The specific process is depicted in Figure 1 below.
This study reviewed the literature on smart city project evaluation systems and reclassified items based on the criteria used in the evaluation. First, we organised the overlapping factors and established the first tier as technical expertise, plan specificity, sustainability, and scalability. Technical expertise was measured via technology acceptance and administrative accessibility, and plan specificity was divided into economic, urban, and educational infrastructures, with a focus on economic infrastructure. To derive the second tier, sustainability was divided into social, living, and environmental infrastructures, with a focus on social infrastructure, and scalability was divided into the cultivation of specialised human resources and the formation of an industrial ecosystem. The third tier was selected through five rounds of focus group interviews (FGIs) to compare the importance of the various types of factors. To standardise the evaluation indicators, they were established as generic indicators and had various implications. The details of the three tiers are discussed in the section on the derivation of the hierarchy diagram. Based on the final hierarchy diagram, we derived priorities based on the item, which were expected to serve as base materials for the establishment of an evaluation system. Next, we measured SMEs’ efficiency and productivity, which are most crucial aspects of business performance among the enterprises in the current smart city convergence alliance. Based on the results of the analysis, we provide suggestions and implications to improve a practical evaluation system that combines policy and company operability.
1.2. Scope of the Research
The scope of this study (Table 1) primarily focuses on the Smart City Challenge projects in South Korea, which have evolved through three phases since the inception of the U-City Law in 2008. Specifically, technological development and institutional improvements were pursued through the first and second Ubiquitous City Comprehensive Plans in 2009 and 2013, respectively, marking an era of expanded U-City services centred around new cities. From the third Smart City Comprehensive Plan in 2019, tailored smart city development and expansion strategies were introduced, setting technology and objectives that were aligned with the growth stages, characteristics, and stakeholder roles of existing cities. Accordingly, the temporal scope of this study is set from 2008 to 2023, encompassing the overall content range. Additionally, the efficiency analysis using smart city convergence alliance enterprise data is based on financial data of 40 SMEs, which were members of the Korea Smart City Association as of 30 April 2022, and the data range covers disclosed information from 2018 to 2020. In essence, this study encompasses the overall content scope from the formalisation of South Korea’s smart city projects in 2008 to 2023, while the analytical scope for the survey focuses on 2023, comparing corporate data and public disclosures to examine practical and policy discussions.
2. Theoretical Considerations
2.1. Smart City Overview
Previous studies on information and cyber cities have tended to introduce the smart city as a ‘Wired City’ [12] or ‘Digital City’ [13,14]. However, this characterisation has been criticised for being overly technology-driven, focusing on corporate needs, and failing to accommodate urban needs and incorporate social and environmental sustainability [15,16]. In response to this criticism, the Organisation for Economic Cooperation and Development (OECD) [17] defines smart cities as ‘initiatives or approaches that effectively leverage digitalisation to boost citizen well-being and deliver more efficient, sustainable, and inclusive urban services and environments as part of a collaborative, multi-stakeholder process’. The International Telecommunication Union (ITU) [18] defines a smart city as ‘an innovative city that uses information and communication technologies (ICTs) and other means to improve the quality of life, efficiency of urban operation and services, and competitiveness, while ensuring it meets the needs of present and future generations with respect to economic, social, and environmental aspects’. In the promotion of smart cities, solving urban problems based on digitalisation and ICT has been discussed alongside the importance of governance, owing to the convergence of ICTs and digitalisation. Consequently, smart cities are evolving to prioritise citizens rather than technology, and embrace inclusion, sustainability, and resilience. According to Cohen [19], smart cities will evolve into spaces that incorporate citizens when the use of various technologies and services is comprehensively demonstrated; although the introduction and operation of related facilities is essential for providing services using digital infrastructure, this is not sufficient for discovering and providing the services that citizens need. During this process, innovation emerges and spreads, promoting the growth of related industries.
Therefore, the public and private sectors must work together to demonstrate and spread smart cities. A digital infrastructure is needed, and services must be provided based on it. However, even with digital infrastructure, services will not be provided automatically. Smart city policies are being promoted, recognising that various factors such as digital infrastructure and technology, the construction of public–private governance systems, and institutional support are required to provide smart city services [20,21]. In this context, smart city policies in Europe have implications for the spread and distribution of smart cities in South Korea. As a leader in emerging urban issues such as green cities and eco-cities, Europe is also taking the initiative in smart city policies [22]. The European Union’s smart city policy is driven by the European Innovation Partnership on Smart Cities and Communities (EIP-SCC) programme [23], which comprehensively promotes the demonstration and spread of smart cities, performance evaluation and project verification, standardisation, and the establishment of a knowledge platform, providing significant implications for smart city promotion policies [24].
2.2. Smart City Policies by Country
Recently, the United Nations Framework Convention on Climate Change and the Paris Convention on Climate Change have been adopted to reduce greenhouse gas emissions, including carbon dioxide emissions, and countries worldwide are striving to implement eco-friendly, high-efficiency energy systems. Smart-city-related policies are continuously being promoted to address this issue, with central governments actively promoting technological development plans related to smart city construction [25].
The Smart City Challenge and Global City Team Challenge are representative smart city discovery demonstration projects in the United States. The Smart City Challenge begins with discussions on smart solutions to solve urban problems with 15 government departments centred around the US Department of Transportation and promotes support projects by way of competition among US cities. This programme aims to build an innovation ecosystem network in the United States and worldwide. To this end, the US fosters start-ups that aim to expand to global companies and is expanding into a private-centred smart city industry that supports venture capital [26].
Singapore, an entire landmass occupied by urban spaces, has been promoting various policies for systematic urban management. In this context, a Smart Nation Plan has been established to respond to urban problems using digital technology. Singapore has promoted strong smart city policies for the systematic management of the city, including restricting vehicle ownership and securing green spaces in parks, to solve various city problems, such as low birth rates and ageing populations, high population density, road congestion, and housing problems [27].
Japan’s population is expected to decrease by 20% from its current level. Despite the regional revitalisation that began in 2060 to maintain its population of 100 million, it is expected that it will be difficult to continue supplying essential city services in the future. Thus, a new smart city concept is needed to improve local quality of life using advanced technologies to realise a future society with resident consensus [28].
The Netherlands operates the Amsterdam Smart City (ASC), a public–private partnership (SPC) corporation, to solve urban problems by utilising the collective intelligence of various participants, including the government, businesses, academic institutions, and citizens of Amsterdam. The ASC platform operates projects in six fields, with 2000 employees, 90 partners, and over 100 projects in progress (as of 2020), including urban design, artificial intelligence (AI), and the Internet of things (IoT, establishing goals through smart convergence technologies), and has converted into a service model that provides Connectivity Digital Platform services using data.
China’s smart city policy began being promoted in earnest in 2012, and the ‘New Urbanisation Plan’ was announced in 2014. A central government-centred policy is being promoted. Under the 13th Five-Year Plan of 2015, nationwide smart city construction was promoted until 2020, and as of 2020, the number of pilot smart cities in China was estimated to be approximately 900. China’s smart city policy presented in the ‘New Urbanisation Plan’ includes the following key aspects: (1) informatisation of the information network, (2) informatisation of planning management, (3) intelligence of infrastructure, (4) convenience of public service, (5) modernisation of industrial development, and (6) refinement of social management. This plan is primarily related to information and communication technology [29].
Spain’s smart city national plan aims to support relevant industries, as well as local governments during the transition process, and promote reuse, standards, and interoperability. For the smart-city-isation of local governments, support for ICT efficiency verification projects and the development of the ICT sector, standardisation, governance, and industry models have been promoted. There has also been a focus on interoperability with the ITU, open data, tourist destination analysis, and rural environment citizen-centred services based on digital technologies commonly found in Spanish smart cities. This includes creating and applying standardisation models that focus on development and establishing a governance model involving all stakeholders, both public and private, through governance [30].
The projects of the various countries mentioned above are largely consistent with the purpose of the smart city development project currently underway in Korea, where renewable and eco-friendly energy is actively being recommended in relation to recent climate change issues. Korea is currently developing policies such as providing subsidies for the purchase of electric vehicles and the expansion of hydrogen vehicle charging stations. In addition, all public buildings are investing in new and renewable energy by allocating an additional 32% of the total construction cost. Based on the US’s Smart City Challenge project, the Ministry of Land, Infrastructure and Transport is pursuing a similar project with the same name and is currently seeking a transition to a private sector focus, which includes the establishment of the Korea Smart City Association. Additionally, as in Singapore, local governments are recommended to establish smart city plans to expand smart cities across the country. In particular, to improve tresidents’ experience, we collect their opinions, identify urban problems, and aim to solve them using advanced technology. For current state-led smart city projects, resident participation is essential, and creating a living lab and establishing governance have become crucial elements of this. Ultimately, this is judged to be an important factor in improving residents’ perception and securing future sustainability. Finally, like China, South Korea is also investing a significant amount of money in ICT. The main central ministries of smart cities are the Ministry of Science and ICT, the Ministry of Land, Infrastructure and Transport, and the Ministry of Public Administration and Security. These departments are working to create synergy effects through collaboration with each other.
2.3. Evaluation Indicators for Smart City Projects in South Korea
Smart city projects in Korea are categorised into the Smart Challenge, Smart Town, Core Technology Discovery, and Smart Campus Challenge projects. In this section, the evaluation indicators of each project are reviewed to establish a hierarchy diagram for the AHP analysis. The evaluation indicators for each project are listed in Table 2. First, the Smart Challenge Project (Table 2) aims to solve urban problems by utilising creative ideas (solutions) from the private sector, including companies and universities, and spreading the best solutions to other local governments and overseas. Unlike past local government support programmes, companies, universities (ideas and investments), and local governments (space provision and citizen engagement) were involved in the project from the beginning. Based on these characteristics, smart city project evaluation indicators comprised five written assessment items and two presentation items [31].
Second, the Smart Town Challenge Project was promoted to create region-specific smart towns within small- and medium-sized cities to lay the foundation for the spread of smart solutions to other local governments through demonstrations, while considering local needs and conditions. Based on these characteristics, the evaluation indicators for the Smart Town Project (Table 3) comprised four written assessment items and two presentation items [32].
Third, Core Technology Discovery projects are divided into ‘company-led’ and ‘citizen-led living lab’ types. First, unlike previous local government support programs, ‘company-led’ projects aim to discover and demonstrate differentiated solutions among companies and universities that own innovative technologies. Administrative and financial support is provided to facilitate the implementation of innovative solutions, along with special procurement incentives such as the designation of innovative products with superior technology. The evaluation indicators for the Core Technology Discovery projects (Table 4 and Table 5) comprised four written assessment items and three presentation evaluation items [33].
In contrast, ‘citizen-led living lab’ projects support companies and universities with innovative technologies or local governments that aim to demonstrate innovative technology by establishing and operating a citizen-led sustainable smart city living lab tailored to each region. Companies and universities should clarify their target sites and collaborate with local governments and public institutions to provide administrative and financial support. Based on these characteristics, the evaluation indicators for citizen-led living lab type projects were identified, as shown in Table 5.
Finally, the Smart Campus Challenge Project was conducted to cultivate innovation, creativity, and problem-solving capabilities across the academy by providing participation opportunities for university students in smart cities and creating a boom. An additional function of the project was to discover and demonstrate innovative solutions through students’ creative ideas and link them to preliminary start-up commercialisation projects. Accordingly, the Smart Campus Challenge Project (Table 6) differs in many evaluation items from the Smart Challenge and Smart Town projects, which aim to solve current problems in cities and regions [34].
2.4. Literature Review
In this section, we examine the metrics related to smart cities used to derive important variables by considering the characteristics of this study. Regarding the AHP and efficiency and productivity analyses, a detailed review of previous studies is necessary because the selection of variables closely affects the reliability of the analysis results, including solidity and validity [35]. One study derived 54 indicators to constantly monitor the degree of smart city construction in global cities worldwide based on the EU’s six core factors: environment, mobility, economy, people, government, and living [36]. We examined this in detail to measure efficiency and productivity, because we recognised the need for companies to monitor and measure them. Another analysis used 5 fields, 21 subfields, and 80 performance indicators to evaluate the governance, innovation, sustainability, connectivity, and cohesion of smart cities while ensuring diversity in the evaluation system [37]. Another study constructed non-technical categories of evaluation indicators, not only for construction purposes, but also to reduce operating costs and secure sustainability in the long run by building a model related to the maturity of smart cities. This implies that sustainability must be considered as well [38]. Some metrics are also organised according to the significance of performance outcomes. As this is linked to performance indicators, this study identifies the key success factors that make projects work while adhering to the original plan [39]. Some studies have derived indicators from urban perspectives. In one study, smart city indices were derived from environmental, economic, and social perspectives by various research institutes, which means that evaluation indicators can be used to select projects as well as to spread them across the city [40]. As smart cities reflect a convergence of digitalisation and technology, there is also an industry measurement scale comprising 10 areas and 40 indicators that measures support for the digital start-ups working on them [41]. Finally, another study ranked the top 20 global smart cities into four categories based on the performance of each city’s current operations and projects: mobility, health, safety, and productivity [42]. This indicates that smart cities are not only active in South Korea, but are also part of the global trend.
Furthermore, studies have been conducted on living labs and governance in which real residents participate to ensure sustainability. To solve urban problems using advanced technology, the problems experienced by residents in real life should be identified and solved. In this respect, to successfully promote smart city policies, it is necessary to establish a living lab and governance where citizen participation is essential [43]. Living labs support innovation by promoting existing policies, overcoming the limitations of government-led top-down promotion, and emphasising the reflection of local and citizen perspectives and public–private partnerships. As living labs are expanding as a commercialised technology and testbed for smart city experimentation and implementation, it is important to share living lab experiences and create a network that can act as a new innovative model for existing national space policies. A living lab is defined as a user-led innovation model that generally undergoes the stages of problem discovery, business planning, prototype design, product and service development, and demonstration. In this process, it develops into a win–win ecosystem in which various stakeholders exchange value at a reasonable level, premised on the continuity of service and securing a network of participants [44]. In particular, as citizens—the end users of the service—participate in the entire process of the project, continuous use and expansion of the service will be considered from the beginning of the project, which is consistent with the goal of creating a sustainable smart city. Overall, although the essential concepts of living labs and smart cities differ from the value chain viewpoint of means and ends, they complement each other in that they pursue the common goal of realising a sustainable city; thus, these two complex application cases are expected to increase further in value. As discussed, studies on smart cities are extensive and diverse in scope and fields. However, most of these studies focused on the measurement of one or two metrics. Smart cities should be approached from the perspectives of convergence, service operations, software, IT evaluation, operational types, and sustainability. For these projects to be sustainable, it is necessary to develop more innovative and active projects that include private participation, rather than building infrastructure in the public sector, based on an understanding of the operation and management status of companies. This study is different from previous studies as it derives priorities by weighting convergence and convergence aspects to standardise the evaluation system, and it presents results to secure sustainability by analysing the efficiency and productivity of Korean smart city convergence alliance companies.
In the context of this study, which aims to standardise the Korean smart city project evaluation system, the literature review serves as a vital source of inspiration and a practical guide. It meticulously analyses metrics related to smart cities, aligning closely with our objective to identify and prioritise crucial factors for an efficient evaluation system. The exploration of 54 indicators, rooted in the EU’s core factors, not only inspired our approach to the comprehensive monitoring of smart city development globally but also informed our methodology in analysing the efficiency and productivity of companies involved in smart city services. Reflecting the study’s focus, the literature review sheds light on the evolving trend of urban planning in South Korea towards smart city planning. This transition has been a key inspiration in examining the role of public–private and private–private partnerships in our study. The scalability of businesses, as highlighted in the literature, directly influenced our approach to understanding how private sector involvement is essential for the stability and success of smart city projects, echoing our findings in the abstract. The feasibility of building intelligent facilities, a recurring theme in the literature, resonated with our study’s aim to implement smart city projects based on thorough cost–benefit feasibility. This aspect of the literature review directly influenced the practical side of our research, ensuring that our evaluation system considers the financial viability of smart city initiatives. In analysing the efficiency of small- and medium-sized enterprises in smart city convergence alliances, the literature provided a rich background. It inspired our investigation into how these enterprises manage to achieve high efficiency by optimising their inputs under varying scales of operation. This insight was crucial in addressing the operational challenges, a central aspect of our study, which often outweigh the technical issues in smart city projects. Lastly, the literature review’s emphasis on the need for policy flexibility and legal reforms in smart city projects profoundly influenced our research. It steered our study towards advocating policy changes that facilitate smoother progress in smart city initiatives, as highlighted in our abstract. In essence, the literature review not only offered a foundational understanding of the current state and challenges of smart city planning in South Korea but also provided critical insights that shaped the methodology and focus of our study. It played a pivotal role in guiding our analysis and underpinning the conclusions we drew about the necessity of private sector involvement, feasibility analysis, and policy adaptation for the success of smart city projects.
3. Materials and Methods
3.1. Analytic Hierarchy Process
In this study, we used the AHP technique to determine the relative priority among elements constituting multiple hierarchies. AHP is a hierarchical decision-making technique that has been proven reliable. The AHP decision-making process is as follows [45]. First, the AHP technique hierarchically expresses the unstructured and scattered decision-making problem, wherein all of the elements that make up the decision-making field are listed and classified into different levels. Similar elements at the same level are collected and organised to attempt to structure and systematise the problem. This allows us to accurately identify issues related to decision-making. Second, the pairwise comparison matrix is obtained for each level through the pairwise comparison framework. Weighting through pairwise comparison refers to relative importance or weight. In the pairwise comparison evaluation process, the degree of decision-makers’ preference for the evaluation criteria is first expressed through semantic expressions, and then a corrective quantification process is conducted by assigning appropriate corresponding values. For this purpose, the 9-point scale proposed by Saaty is commonly used (Table 7).
The extent to which a measure fits its purpose is important because decision-making evaluates something intangible that needs to be traded off. An element for a given attribute that dominates another element is determined using a measure of absolute judgment. These judgments may be inconsistent, and AHP measures discrepancies to improve judgments where possible and obtain better consistency [46].
The basic problem of decision-making involves choosing the best alternative with contradictory standards and incomplete information. The AHP provides a comprehensive framework to address these issues, allowing us to simultaneously address rational, intuitive, and irrational decisions when making multi-criteria and multi-agent decisions [47]. AHP can overcome the limitations of existing statistical analysis methods and simultaneously determine the relative importance of several criteria using a systematic and scientific method [48].
Vargas [49] proposed that the theoretical basis for the application of AHP is revealed through four axioms. First, reciprocal refers to reciprocity; the decision-maker must be able to pair and compare two factors within the same hierarchy. Furthermore, the strength of the preference must be expressible and satisfy reciprocal conditions. Second, the elements of one layer must depend on those of the upper layer. However, it is not necessary to ensure independence between the elements in the lower hierarchy and all elements in the upper hierarchy. Third, there is an assumption that the hierarchy includes matters related to decision-making. Fourth, through homogeneity, importance is expressed using a set scale within a limited range. These four axioms are necessary conditions for inducing validity in situations where the AHP technique is maintained or theoretically used in practice.
3.2. Efficiency and Productivity Measures
The data envelopment analysis (DEA) technique is a non-profit decision-making model that performs the same or a similar function by utilising many inputs and outputs. It is an efficiency measurement method that uses a non-parametric approach to measure relative managerial efficiency in the management operations of decision-making units (DMUs) [50].
This model has consistently been used as the most appropriate method for evaluating inefficiency in the public sector, where market prices are not formed [51]. The DEA model fixes one of the inputs and outputs and is divided into input-oriented and output-oriented models according to whether inefficient parts are found for the remaining elements. Furthermore, depending on whether the effect of scale is considered when measuring efficiency, it can be divided into the Charnes, Cooper, and Rhodes (CCR), and Banker, Charnes, and Cooper (BCC) models. The CCR model assumes constant returns to scale (CRS) for the production set, and the BCC model assumes variable returns to scale (VRS).
The Malmquist productivity index allows us to conduct a longitudinal and cross-sectional analysis of productivity using DEA by comparing the degree of productivity between different time points. This study’s productivity analysis sought to utilise input-oriented municipal performative index (MPI). The MPI formula was summarised based on the following research [52]. The MPI formula that summarises the change in productivity between the production technology of periods t and t + 1 is (1) . Based on this formula, the change in productivity between periods t and t + 1 using the geometric mean is as follows: (2) . When (3) is greater than 1, productivity increases in period t + 1; when it is less than 1, productivity decreases. (4) suggests there is no change in productivity. This can be divided into the technological efficiency change index (TECI) and technological change index (TCI), as follows: (5) = TECI X TCI, X .
3.3. Premises and Process of AHP and DEA Analysis
In this study, the research design was conducted through the following process for qualitative and quantitative analysis. First, a survey was conducted to enable an analytic hierarchy process (AHP) analysis using the hierarchy diagram. A questionnaire was distributed to 100 experts working on smart cities, of which 100 were returned and 83 were deemed valid after excluding inconsistent responses (17). Survey participants were evenly distributed, with 23 university professors, 20 public officials, 17 general workers, 12 researchers, and 11 employees at public corporations. In particular, the hierarchical structure diagram used in the survey considered practical aspects by utilising the evaluation indicators used in an actual project hosted by Korea’s Ministry of Land, Infrastructure, and Transport. In addition, the academic aspects were integrated into the review of previous studies and FGIs.
Next, in addition to the qualitative results gathered in the AHP analysis, quantitative, efficiency, and productivity analyses were performed to overcome the limitations of the study. The operational status of smart city convergence alliance companies that are currently in operation was examined. The analysis timeframe was limited to three years (2019–2021), and an analysis model was established to identify changes in trends over this period. Six variables were used in the analysis, the details of which are presented in the results. Ultimately, these results complement the limitations of previous studies by employing both qualitative and quantitative perspectives, which present diverse implications, as the perspectives of each analysis method coincide.
In sum, by reviewing the evaluation systems of promoted smart city projects and collecting expert opinions using FGIs, we set standard indicators to measure the importance of each evaluation factor and priority. In addition, we analysed the efficiency and productivity of 38 SMEs, the results of which were used as the basis for an evaluation system alongside the factors and priorities mentioned above. Our results inform improvement recommendations and hold implications for future evaluation systems and management performance in the operational stage.
4. AHP Analysis Results
4.1. Organisation of the Hierarchy Diagram
The hierarchy diagram was structured based on the evaluation indicators mentioned in the theoretical consideration section, as well as the sub-items of the metrics used in previous studies. In particular, the metrics were reclassified to account for the scoring and items used to derive the tiers. Tier 1 is shown in Table 8.
Finally, the findings were consolidated as shown in Table 9, drawing upon the previously conducted investigations.
An expert group was formed based on the results of Tier 1. This group comprised 13 people in total: 6 university professors in related fields, 3 civil servants from central government ministries, and 4 researchers. We conducted five FGIs with them to confirm these results, assigned standardised weights to reflect Korea’s situation, and finalised a hierarchy that includes Tiers 2 and 3 (Table 9).
Business expertise was derived based on the expert opinion that it is important to evenly reflect business necessity and feasibility, and the excellence and innovation of innovative technology, business, and living lab operation plans. Plan specificity refers to the quality of the business, project execution, budget utilisation, and budget input plans. In addition, the degree of plan preparation prior to project implementation was determined to be an essential factor. Sustainability was found to be an important factor in terms of business and stakeholder cooperation, expected business effects, and judgment on the feasibility of future operations. Lastly, for project scalability, the local government’s will and feasibility and the private sector’s willingness to commercialise were included as important factors. Ultimately, four factors were included in the main category (Tier 2).
4.2. Analysis Results
The AHP results, which maintained the independence of each tier, are shown in Table 10. In the analysis, consistency verification was performed to exclude logical contradictions in the questionnaire, and importance was calculated based on samples less than 0.1. When calculating importance, the matrix was integrated into the geometric mean because the geometric mean is the only way to maintain the inverse of the matrix. The final weight was calculated by multiplying the weights derived from the main category (Tier 2) with those derived from the subcategory (Tier 4) for each factor. The resulting subcategories were prioritised according to the positive (+) value of the weight number.
From the AHP, smart city planning (0.0991) ranked first, followed by public–private and private–private partnership capacity building (0.0985), integrated operation centres (0.0798), feasibility of building intelligent facilities (0.0684), and EMS (0.0684). This analysis reflects the recent trends of all local governments in Korea regarding the establishment of smart city plans. Therefore, it is desirable to promote smart city projects with a long-term sustainability plan, rather than as a one-off event. Public–private and private–private partnership capabilities should be strengthened to ensure project scalability. Ultimately, securing profitability and stability seems impossible when the private sector participates in and leads projects. The feasibility of building intelligent facilities also seems to reflect the expert opinion that these facilities are required to address sustainability issues. Ultimately, a smart city project requires a substantial investment, and it is important to ensure cost-effectiveness. It appears that feasibility should be secured in advance, and there may be frequent failures and significant maintenance costs owing to the nature of electronics and devices. Finally, EMS is considered highly important because of the characteristics of a smart city project, which requires the integration and effective control of various subjects and departments, as well as smooth analysis and utilisation of the database.
5. Efficiency and Productivity Analysis Results
In addition to the results of the previous analysis, we conducted an efficiency and productivity analysis of 38 SMEs that are the most sensitive to the business performance of the currently operating smart city convergence alliance participants. The results of this analysis were then used as the basis for an evaluation system. The analysis period was limited to three years (2019–2021), and an analysis model was established to identify trend changes over this period. The variables used in the analysis were capital, number of employees, assets, sales, operating income, and net income. Regarding the variables, the items generally used to evaluate the management of companies were prioritised, as they can measure companies’ actual management status. Although additional variables can be used, an efficiency and productivity analysis can be unreliable when the number of variables is more than twice that of the DMUs. Therefore, these additional variables were not included to ensure the validity and reliability of the analytical model. The basic statistics are shown in Table 11 and Table 12.
Particular attention should be paid to operating costs and net income. The maximum annual value follows an upward trend. In particular, the figure is approximately three times higher in 2021 than in the previous year. This implies that smart city projects will enter a steady state with increasing income from 2021 onwards. However, they are still in the red despite the decrease in the minimum value; therefore, it is urgent to address this problem through technological innovation and policies that temporarily relieve regulations to demonstrate smart city projects, among others.
In general, efficiency is expressed as the degree to which the maximum output achievable by the input of production factors is achieved at a certain level of technology. The results of the CCR analysis, which assumes constant results to scale, show a slight increase in efficiency from an average of 0.7727 in 2019 to 0.7830 in 2021. For each unit, DMUs 2, 3, 4, 6, 7, 8, 16, 19, 31, and 37 had a value of 1 or close to 1, indicating that they were operationally efficient. In the future, it will be necessary to select and share best practices by monitoring and consulting with these companies to identify policy factors that can help them improve their operational efficiency.
Table 13 shows the results of the BCC analysis, which assumes variable returns to scale. The results are categorised into technical efficiency (TE), pure technical efficiency (PTE), and scale efficiency (SE). TE was 0.8102, while PTE and SE were 0.9073 and 0.8642, respectively; when the value is close to 1, it is considered efficient. Under the CRS and VRS assumptions, smart city convergence alliance SMEs were found to maximise their efficiency by reducing their inputs by 81% and 86%, respectively. As all values are on an upward curve from year to year, operational efficiency is expected to improve gradually.
Finally, the three-year time-series average productivity index is shown in Table 14.
Also, for productivity analysis, the degree of change between the two time points was measured. This is shown in Table 15. If the MPI value of the time series at T2 and T3 is greater than 1, this indicates a mutual increase in productivity at two separate points in time, t and t + 1 (2019 to 2020 and 2020 to 2021, respectively).
Table 16 is described as follows. In other words, when the value is greater than 1, productivity increases; when it is 1, there is no change between the time points; and when it is less than 1, productivity decreases. After analysis, T2 showed an increase in productivity, whereas T3 showed a decrease. Taken together, these efficiency results suggest that the problem is more operational than technical. Some companies have technology that cannot be demonstrated because of legal and institutional barriers, and recently, external factors such as inflation, high interest rates, and labour shortages also seem to be involved.
6. Discussion
6.1. Summary and Significance of the Study
This study embarked on an ambitious journey to redefine the evaluation parameters for Korean smart city projects, leading to pivotal revelations about the operational performance of companies engaged in these initiatives. By delving into the realms of efficiency and productivity, our analysis bridged the gap between policy-driven objectives and practical realities, illuminating the multifaceted nature of smart city projects. The significance of this research lies in its timeliness and direct impact on the quality of life at the local level, bringing a nuanced understanding to a field often oversimplified. Our methodical approach led to the identification of 27 key factors through extensive focus group interviews (FGIs) with experts, crafting a hierarchical model that reflects the complexity and dynamism of smart city ecosystems. This innovative model went beyond short-term assessments, showcasing a longitudinal analysis of individual and collective productivity over time. This approach is not merely an academic exercise but a practical blueprint for constructing a standardised, policy-responsive, and practical evaluation framework for smart city enterprises. Analytically, the analytic hierarchy process (AHP) revealed that smart city planning, public–private partnerships, and the integration of operation centres are paramount. These elements underscore the evolving paradigm where local governments are increasingly adopting smart city plans over traditional urban plans. The need for long-term sustainability, rather than ephemeral project execution, emerged as a central theme. This shift suggests a move away from public sector-led initiatives, plagued by inconsistencies and innovation challenges, towards a more stable, private-sector-driven approach. The criticality of building intelligent facilities, a marker of sustainable smart city projects, surfaced, emphasising the necessity of balancing ambitious technological advancements with practical feasibility and cost-effectiveness. This balance is crucial to avoiding potential failures and maintenance burdens characteristic of sophisticated electronic systems. Efficiency and productivity analyses of 38 SMEs in smart city convergence alliances painted a promising picture of operational improvements. Under constant and variable returns to scale assumptions, these enterprises demonstrated a potential to maximise efficiency by significantly reducing inputs. This upward trajectory in operational efficiency, observed over a three-year period, signals a positive shift in the smart city landscape. The study’s implications extend to policy reform and strategic recommendations. To rejuvenate the smart city sector, a recalibration of the evaluation index is vital, taking into account the diverse importance of indices for sustainable project evaluation. The Smart Challenge project’s aim to harness corporate solutions in addressing urban issues necessitates a rethinking of evaluation criteria, emphasising the role of corporate entities in project advancement. Local government strategies for smart city planning should be complemented by standard guidelines that foster business acumen, specificity, and scalability. This involves bolstering institutional support structures, including financial incentives, tax benefits, and the development of living labs that engage residents directly. Additionally, the study posits that operational enhancements, rather than solely technological upgrades, are key to bolstering productivity. This entails advancing technologies like digital twins, IoT, AI, and GIS/GPS systems, coupled with legal and institutional flexibility to ensure profitability and project viability.
In conclusion, this research not only charts a course for the effective evaluation of smart city projects but also lays the groundwork for future innovations in the field, paving the way for more resilient, efficient, and community-centric urban ecosystems.
6.2. Limitations and Future Research
This study, aiming to standardise the evaluation system for smart city projects, reveals several limitations while also delineating future research directions. It underscores the complexity inherent in smart city projects, which demand a multifaceted approach, acknowledging that the objectives and directions of these projects are not always clearly aligned. Despite setting up various research models and presenting individual analysis results, the study encountered challenges in effectively scoring or standardising these outcomes, highlighting the absence of direct indicators related to smart city evaluation that limited a comprehensive review.
Future research will focus on evaluating the monetary value of smart space ecosystems, centred around ICT infrastructures that facilitate convenient access to smart services for individuals. This involves estimating the benefits and costs of ecosystem development, considering the characteristics of spaces categorised as public and private goods. Moreover, assessing the interconnectedness of smart city projects, smart villages, smart housing, and proptech initiatives is pivotal in promoting integrated and efficient development of smart space policies. Additionally, the establishment of an evaluation system for smart space ecosystems and the development of guidelines for the activation of smart cities are essential components for the effective progression and management of these projects. This research presents a new perspective for the effective evaluation and management of smart city projects, exploring innovative approaches to developing smart space ecosystems. The identified limitations and proposed future research directions have the potential to significantly impact the field of smart city development, providing valuable insights for various stakeholders.
Funding
This work was supported by a research grant from the Kongju National University in 2022.
Institutional Review Board Statement
Not applicable.
Informed Consent Statement
Not applicable.
Data Availability Statement
Data are contained within the article.
Conflicts of Interest
The author declares no conflicts of interest.
References
- Myeong, S.; Jung, Y.; Lee, E. A study on determinant factors in smart city development: An analytic hierarchy process analysis. Sustainability 2018, 10, 2606. [Google Scholar] [CrossRef]
- Telecommunications Technology Association. Key Convergence Cases of the 4th Industrial Revolution Smart City Concept and Standardization Status, Standardization Issue 2018-1. 2018. Available online: https://committee.tta.or.kr/data/reportDown.jsp?news_num=6019 (accessed on 10 December 2023).
- Seoul City Council. A Study on Analyzing and Solving Social Problems in the Digital City of Seoul. 2018. Available online: https://www.seoulilbo.com/news/articleView.html?idxno=321344 (accessed on 7 November 2023).
- Peter Hansen, L. Repercussions of pandemics on markets and policy. Rev. Asset Pricing Stud. 2020, 10, 569–573. [Google Scholar] [CrossRef]
- Belanche, D.; Casaló, L.V.; Orús, C. City attachment and use of urban services: Benefits for smart cities. Cities 2016, 50, 75–81. [Google Scholar] [CrossRef]
- Hwang, J.; Jang, J. Prospects for smart city development and Korea’s competitiveness. In IT & Future Strategy; National Information Society: Daegu, Republic of Korea, 2016; No. 6. [Google Scholar]
- Kim, Y.; Koo, J. Study on the developing of evaluation indicators for smart city from the perspective of digital social innovation. J. Korea Contents Assoc. 2019, 19, 512–521. [Google Scholar]
- Han, S.; Shin, Y.; Yu, I.; Lee, J. A study on the Korea smart city certification index and demonstration authentication. J. Korea Acad.-Ind. Coop. Soc. 2018, 19, 688–698. [Google Scholar]
- Ahn, Y.; Lee, S.; Yu, M.; Jeong, G.; Yeom, I.; Ji, N.; Kim, A. Establishment of a Smart City Model Based on Citizen Participation; Daejeon Sejong Institute: Daejeon, Republic of Korea, 2018. [Google Scholar]
- Jin, S. Life satisfaction depending on digital utilization divide within people with disabilities. Informatiz. Policy 2019, 26, 69–89. [Google Scholar]
- Ministry of Land, Infrastructure and Transport. Smart City Industry Promotion Strategy Research Final Report. 2022. Available online: https://koreascience.kr/article/JAKO201928463077955.page (accessed on 3 November 2023).
- Dutton, W.; Blumler, J.; Kraemer, K. Wired Cities: Shaping the Future of Communications; G.K. Hall: New York, NY, USA, 1987. [Google Scholar]
- Ishida, T. Understanding digital cities. In Digital Cities: Experiences, Technologies and Future Perspectives Lecture Notes in Computer Science; Ishida, T., Isbister, K., Eds.; Springer: New York, NY, USA, 2000. [Google Scholar]
- Aurigi, A. Competing urban visions and the shaping of the digital city. Know. Techn. Pol. 2005, 18, 12–26. [Google Scholar] [CrossRef]
- Mora, L.; Bolici, R.; Deakin, M. The first two decades of Smart-city research: A bibliometric analysis. J. Urban Technol. 2017, 24, 3–27. [Google Scholar] [CrossRef]
- Yigitcanlar, T.; Kamruzzaman, M.; Foth, M.; Sabatini-Marques, J.; da Costa, E.; Ioppolo, G. Can cities become smart without being sustainable? A systematic review of the literature. Sustain. Cities Soc. 2019, 45, 348–365. [Google Scholar] [CrossRef]
- OECD. Smart Cities and Inclusive Growth; OECD: Paris, France, 2020; Available online: https://www.oecd.org/cfe/cities/OECD_Policy_Paper_Smart_Cities_and_Inclusive_Growth.pdf (accessed on 2 November 2023).
- ITU-T. Smart Sustainable Cities: An Analysis of Definitions [ITU-T Focus Group on Smart Sustainable Cities Technical Report]. 2014. Available online: https://www.itu.int/en/ITU-T/focusgroups/ssc/Documents/Approved_Deliverables/TR-Definitions.docx (accessed on 2 November 2023).
- Cohen, B. The 3 Generations of Smart Cities: Inside the Development of the Technology Driven City. 2015. Available online: https://www.fastcompany.com/3047795/the-3-generations-of-smart-cities (accessed on 1 November 2023).
- Nam, T.; Pardo, T.A. Conceptualizing smart city with dimensions of technology, people, and institutions. In Proceedings of the 12th Annual International Digital Government Research Conference: Digital Government Innovation in Challenging Times, College Park, MD, USA, 12–15 June 2011. [Google Scholar]
- Kang, D.; Choi, C.; Lee, J.; Lee, J.S.; Park, S. Employment Impact Assessment Study for the Global Smart City Demonstration Complex Project; Korea Labor Institute: Sejong, Republic of Korea, 2016. [Google Scholar]
- Karvonen, A.; Cugurullo, F.; Caprotti, F. Inside Smart Cities: Place, Politics and Urban Innovation; Routledge: London, UK, 2019. [Google Scholar]
- EIP-SCC. European Innovation Partnership on Smart Cities and Communities, General Assembly 2018 Summary Report, Sofia, Bulgaria. 2018. Available online: https://digital-strategy.ec.europa.eu/en/library/general-assembly-european-innovation-partnership-smart-cities-and-communities-27-28-june-2018 (accessed on 15 October 2023).
- Jung, S. Policy trends for smart city promotion in Europe. Technol. Trends Wkly 2019, 1921, 2–13. [Google Scholar]
- Kim, K.; Kim, G. Status and prospect of smart city in the fourth Industrial Revolution. J. Korean Converg. Soc. 2018, 9, 191–197. [Google Scholar]
- Lee, J.; Lee, M.; Lee, J.; Kim, I. Strategic Response Measures According to Smart City Types; Korea Research Institute for Human Settlement: Sejong, Republic of Korea, 2018. [Google Scholar]
- Cho, J.; Lee, N.; Seo, W. Smart City Overseas Case Study in Singapore, Smart City Policy and Governance Research; Seoul Digital Foundation: Seoul, Republic of Korea, 2021. [Google Scholar]
- Cho, M.; Lee, J. Contents and Implications of the Japanese Super City Initiative to Resolve Resident-Oriented Local Challenges, National Land Issue, Korea Research Institute for Human Settlements; Smart: Sejong, Republic of Korea, 2021; Volume 42, pp. 45–57. [Google Scholar]
- Lee, H.; Bang, S.; Kim; Oh, H.; Wang, F. China Smart City Promotion Status and Entry Strategies: Focusing on the Cases of Xiong’anjin-gu and Tianjin Eco-City; Korea Institute for International Economic Policy and Korea Research Institute for Human Settlements: Sejong, Republic of Korea, 2021. [Google Scholar]
- Korea Research Institute for Human Settlements. Smart City Policy Forum; Smart City Association: Seoul, Republic of Korea, 2022. [Google Scholar]
- Ministry of Land, Infrastructure and Transport 2021. Announcement of the 2021 Smart CITY Challenge Project Competition. Available online: https://smartcity.go.kr/en/2021/01/12/%E3%80%8C2021-%EC%8A%A4%EB%A7%88%ED%8A%B8-%EC%B1%8C%EB%A6%B0%EC%A7%80-%EC%82%AC%EC%97%85%E3%80%8D-%EA%B3%B5%EB%AA%A8-%EA%B3%B5%EA%B3%A0/ (accessed on 12 October 2023).
- Ministry of Land, Infrastructure and Transport 2021. Announcement of the 2021 Smart Town Challenge Project Contest. Available online: https://www.kriea.re.kr/eng_index.php/board/filedown.php?filepath (accessed on 12 October 2023).
- Ministry of Land, Infrastructure and Transport 2022. Announcement of Competition for Smart City Innovative Technology Discovery Project in 2022. Available online: https://smartcity.go.kr/en/2023/12/13/%EA%B5%AD%EA%B0%80%EC%8B%9C%EB%B2%94%EB%8F%84%EC%8B%9C%EC%97%90-%ED%95%84%EC%9A%94%ED%95%9C-%EC%8A%A4%EB%A7%88%ED%8A%B8%EB%8F%84%EC%8B%9C-%ED%98%81%EC%8B%A0%EA%B8%B0%EC%88%A0-%EC%B0%BE%EB%8A%94/ (accessed on 12 October 2023).
- Ministry of Land, Infrastructure and Transport 2022. Announcement of Competition for Regional Base and Small City Smart City Creation Project in 2022. Available online: https://smartcity.go.kr/en/2021/11/23/%E3%80%8C2022%EB%85%84-%EC%A7%80%EC%97%AD%EA%B1%B0%EC%A0%90%C2%B7%EC%A4%91%EC%86%8C%EB%8F%84%EC%8B%9C-%EC%8A%A4%EB%A7%88%ED%8A%B8%EC%8B%9C%ED%8B%B0-%EC%A1%B0%EC%84%B1%EC%82%AC%EC%97%85%E3%80%8D/ (accessed on 12 October 2023).
- Shim, H.; Kim, J. Measures for the improvement of feasibility studies and investment review: Identification and verification of major project sectors considering balanced regional development. Sustainability 2020, 12, 9531. [Google Scholar] [CrossRef]
- Smart Cities Council. Smart Cities Index; Smart Cities Council: Washington, DC, USA, 2011. [Google Scholar]
- INTELI. Towards a Smart Cities Index: The Case of Portugal. 2012. Available online: https://journals.openedition.org/netcom/1105 (accessed on 3 October 2023).
- Vermesan, O.; Friess, P. (Eds.) Internet of Things: Converging Technologies for Smart Environments and Integrated Ecosystems; River Publishers: Aalborg, Denmark, 2013. [Google Scholar]
- Song, J. IoT standards toward its next stage. IEEE Commun. Mag. 2016, 54, 14–16. [Google Scholar] [CrossRef]
- Aronson, M.F.; Lepczyk, C.A.; Evans, K.L.; Goddard, M.A.; Lerman, S.B.; MacIvor, J.S.; Nilon, C.H.; Vargo, T. Biodiversity in the city: Key challenges for urban green space management. Front. Ecol. Environ. 2017, 15, 189–196. [Google Scholar] [CrossRef]
- Strokes, M.; Baeck, P.; Baker, T. What Next for Digital Social Innovation; Nesta: London, UK, 2017. [Google Scholar]
- Cavada, M.; Hunt, D.; Rogers, C. Smart Cities; Lancaster University: Lancaster, UK, 2017. [Google Scholar]
- Chang, H. Study on issues and perception changes in smart cities: Focusing on news, blogs, and twitter data, cadastral and territorial. Information 2019, 49, 67–82. [Google Scholar]
- Seong, J.; Park, I. ICT Living Lab case analysis and implications as a user-led innovation model. Sci. Technol. Res. 2015, 15, 245–278. [Google Scholar]
- Saaty, T.L. Rank generation, preservation, and reversal in the analytic hierarchy process. Decis. Sci. 1987, 18, 157–177. [Google Scholar] [CrossRef]
- Saaty, T.L. Decision making with the analytic hierarchy process. Int. J. Serv. Sci. 2008, 1, 83–98. [Google Scholar] [CrossRef]
- Saaty, T.L. Axiomatic foundation of the analytic hierarchy process. Manage Sci 1986, 32, 841–855. [Google Scholar] [CrossRef]
- Woo, C.; Kim, G.; Kang, S. Comparative study of bankruptcy prediction models using LOGIT analysis and AHP analysis. Financ. Manag. Res. 1997, 14, 229–252. [Google Scholar]
- Vargas, L.G. An overview of the analytic hierarchy process and its applications. Eur. J. Oper. Res. 1990, 48, 2–8. [Google Scholar] [CrossRef]
- Charnes, A.; Cooper, W.W.; Rhodes, E. Measuring the efficiency of decision making units. Eur. J. Oper. Res. 1978, 2, 429–444. [Google Scholar] [CrossRef]
- Kim, S. Structure analysis of production efficiency of local public service supply, Korean. J. Local Auton. 2000, 12, 47–65. [Google Scholar]
- Yoon, H. An Analysis on Changing Factors of Production Efficiency in Myanmar Sewing Industry. Korean J. Econ. Res. 2018, 36, 129–148. [Google Scholar]
Figure 1.
Research process.


Table 1.
Scope of research.
| Temporal Scope | This study spans the period from 2008 to 2023, encompassing the evolution and progression of smart city initiatives in South Korea. |
| Spatial Scope | The research focuses on the developments within South Korea following the enactment of the U-City Law in 2008, extending through to 2023. However, for the members of the Smart City Association’s Smart City Convergence Alliance, the reference date is from 30 March 2022. |
| Content Scope | The study covers the post-implementation period of South Korea’s U-City law (since 2008), including the following:
|
Table 2.
Evaluation indicators of 2021 Smart Challenge Project.
| Div. | Item | Score | Sub-Items | ||
|---|---|---|---|---|---|
| Written assessment (60%) | Necessity and feasibility of project | 20 |
| ||
| Excellence and innovation of the preliminary project Demonstration plan of key solutions | 30 |
| |||
| Promotion system adequacy | Collaboration of citizens and stakeholders | 10 |
| ||
| Interagency collaboration | 20 |
| |||
| Specificity and excellence of the main plan | 20 |
| |||
| Presentation (40%) | Commitment to the project implementation | Local government commitment and feasibility | 35 |
| |
| Private actors’ willingness to commercialise | 35 |
| |||
| Expected effects and sustainability of the project | 30 |
| |||
Source: Ministry of Land, Infrastructure and Transport (2021) [31], “Announcement of the 2021 Smart City Challenge Project Competition,” summarised by the author.
Table 3.
Evaluation indicators of 2021 Smart Town Project.
| Div. | Item | Score | Sub-Items |
|---|---|---|---|
| Written assessment (60%) | Necessity and feasibility of the project | 20 |
|
| Excellence of the project plan | 30 |
| |
| Adequacy of the project plan | 30 |
| |
| Sustainability of the project | 20 |
| |
| Presentation (40%) | Commitment to the project | 50 |
|
| Expected effects and sustainability of the project | 50 |
|
Source: Ministry of Land, Infrastructure and Transport (2021) [32], “Announcement of the 2021 Smart Town Challenge Project Competition,”; content summarised by the author.
Table 4.
Evaluation indicators of 2022 Core Technology Discovery Project (company-led type).
| Div. | Item | Score | Sub-Items | |
|---|---|---|---|---|
| Written assessment (60%) | Necessity and feasibility of the project | 20 |
| |
| Excellence and innovation of the technology | 30 |
| ||
| Appropriateness of project direction | 30 |
| ||
| Appropriateness of the budget use plan | 20 |
| ||
| Presentation (40%) | Commitment to the project implementation | Private actors’ willingness to commercialise | 40 |
|
| Local government commitment and feasibility | 30 |
| ||
| Expected effects and sustainability | 30 |
| ||
Source: Ministry of Land, Infrastructure and Transport (2022) [33], “Announcement of the 2022 Smart City Innovative Technology Discovery Project”; content summarised by the author.
Table 5.
Evaluation indicators of 2022 Core Technology Discovery Project (citizen-led living lab type).
Table 5.
Evaluation indicators of 2022 Core Technology Discovery Project (citizen-led living lab type).
| Div. | Item | Score | Sub-Items |
|---|---|---|---|
| Written assessment (60%) | Necessity and feasibility of the project | 20 |
|
| Excellence and innovativeness of the project | 20 |
| |
| Living lab operation plan | 35 |
| |
| Budget investment and utilisation | 15 |
| |
| Sustainability | 10 |
| |
| Presentation (40%) | Commitment to the project implementation | 50 |
|
| Expected effects and sustainability of the project | 50 |
|
Source: Ministry of Land, Infrastructure and Transport (2022) [33], “Announcement of the 2022 Smart City Innovative Technology Exploration Project Competition”; content summarised by the author.
Table 6.
Evaluation indicators of 2021 Smart Campus Challenge.
| Div. | Item | Score | Sub-Items |
|---|---|---|---|
| Prejudging (100) | Completeness of ideas | 30 |
|
| Creativity and challenge | 25 |
| |
| Differentiation | 25 |
| |
| Motive of suggestion | 20 |
| |
| Additional points | +4 |
| |
| Total | 104 | ||
Source: Ministry of Land, Infrastructure and Transport (2021) [34], “Announcement of the 2021 Smart. Campus Challenge Project Competition”; content summarised by the author.
Table 7.
Basic pairwise comparison scale.
| Importance | Definition | Description |
|---|---|---|
| 1 | Equal importance | Both elements serve the purpose equally |
| 3 | Moderate importance | Moderate preference for one element over another |
| 5 | Essential or strong importance | One element is strongly preferred over another |
| 7 | Very strong importance | One element is strongly preferred over another and its dominance is strong |
| 9 | Extreme importance | One element is extremely preferred over another |
| 2, 4, 6, 8 | Intermediate values between the two adjacent judgments | Used when compromise is necessary |
Table 8.
Analysis model design.
| Identification of priority items |
|
| Efficiency and productivity analytics |
|
| Analysis results and conclusions |
|
Table 9.
Evaluation system (Tier 1).
| Smart Challenge Project | Evaluation Items | Score | Reclassification (Tier 1) | |||
|---|---|---|---|---|---|---|
| City | Town | Company-Led | Citizen-Led Living Lab | |||
| ● | ● | ● | ● |
| 20 | Technical expertise |
| ● |
| 30 | ||||
| ● |
| 20 | ||||
| ● |
| 35 | ||||
| ● |
| 30 | Specificity of planning | |||
| ● |
| 30 | ||||
| ● |
| 30 | ||||
| ● |
| 20 | ||||
| ● |
| 15 | ||||
| ● |
| 20 | Sustainability | |||
| ● |
| 10 | ||||
| ● |
| 20 | ||||
| ● |
| 20 | ||||
| ● | ● | ● | ● |
| 30–50 | |
| ● | ● | ● | ● |
| 35–50 | Scalability |
| ● | ● | ● | ● |
| 35–50 | |
Table 10.
Final hierarchy diagram.
| Goal | Comparison of Importance (Tier 1) | Comparison of Importance (Tier 2) | Comparison of Importance (Tier 3) |
|---|---|---|---|
| Smart city evaluation indicators | Technical expertise | Technology acceptability | Possession of specialised ICT technicians, establishment of a dedicated smart city department, existence of interconnected services between departments, and use of big data in policy proposals by field. |
| Administrative accessibility | Organise smart city living labs and governance, facilitate citizen policy input, and computerise administrative services | ||
| Plan specificity | Economic infrastructure | Build a virtuous employment ecosystem, open consumption behaviour, local productivity, and industry spillovers | |
| Urban infrastructure | Validity of building intelligent facilities, enterprise management system (EMS), and sustainability of transportation facilities | ||
| Educational infrastructure | Introduce specialised ICT training and E-learning, provide intelligent educational facilities | ||
| Sustainability | Social infrastructure | Operate integrated operational centre and sustainable social council | |
| Living infrastructure | Smart city planning, smart healthcare and safety management | ||
| Environmental infrastructure | Sustainability of environmental facilities, smart environmental management, energy management | ||
| Scalability | Fostering specialised human resources | Technology convergence workforce education, regional networked innovative workforce | |
| Creation of industrial ecosystem | Strengthen public–private and private–private partnership capabilities, support for overseas export of innovative products |
Table 11.
Final prioritisation results.
| Evaluation Goal (Tier 1) | Evaluation Criteria (Main) (Tier 2) | Evaluation Criteria (Sub1) (Tier 3) | Evaluation Criteria [Sub2] (Tier 4) | Final Weight | Tier Ranking | |
|---|---|---|---|---|---|---|
| Improvement of smart city project planning evaluation system | Technical expertise (W: 0.16) | Technical acceptability (W: 0.66) | Possession of ICT specialised technical personnel | (W: 0.24) | 0.0253 | 15 |
| Establishment of a dedicated smart city department | (W: 0.38) | 0.0401 | 8 | |||
| Existence of interconnected services between departments | (W: 0.22) | 0.0232 | 18 | |||
| Utilisation of big data for policy proposals by field | (W: 0.16) | 0.0169 | 25 | |||
| Administrative accessibility (W: 0.34) | Smart city living lab and governance organisation | (W: 0.48) | 0.0261 | 12 | ||
| Ease of reflecting citizen policy opinions | (W: 0.34) | 0.0185 | 24 | |||
| Computerisation of administrative services | (W: 0.18) | 0.0098 | 27 | |||
| Specificity of plan (W: 0.30) | Economic infrastructures (W: 0.29) | Building a virtuous employment ecosystem | (W: 0.30) | 0.0261 | 12 | |
| Open consumption behaviour | (W: 0.18) | 0.0157 | 26 | |||
| Local productivity | (W: 0.23) | 0.0200 | 23 | |||
| Industrial spillovers | (W: 0.29) | 0.0252 | 16 | |||
| Urban infrastructures (W: 0.57) | Feasibility of building intelligent facilities | (W: 0.40) | 0.0684 | 4 | ||
| Enterprise management system (EMS) | (W: 0.40) | 0.0684 | 4 | |||
| Sustainability of transportation facilities | (W: 0.20) | 0.0342 | 10 | |||
| Educational infrastructures (W: 0.14) | Introduce ICT professional training and E-learning | (W: 0.51) | 0.0214 | 21 | ||
| Provide intelligent educational facilities | (W: 0.49) | 0.0206 | 22 | |||
| Sustainability (W: 0.33) | Social infrastructures (W: 0.41) | Operate an integrated operations centre | (W: 0.59) | 0.0798 | 3 | |
| Operate sustainable social councils | (W: 0.41) | 0.0555 | 6 | |||
| Living infrastructures (W: 0.38) | Establish smart city plans | (W: 0.79) | 0.0991 | 1 | ||
| Smart medical and safety management | (W: 0.21) | 0.0263 | 11 | |||
| Environmental infrastructures (W: 0.21) | Sustainability of environmental facilities | (W: 0.36) | 0.0249 | 17 | ||
| Smart environmental management | (W: 0.33) | 0.0229 | 19 | |||
| Energy management | (W: 0.31) | 0.0215 | 20 | |||
| Scalability (W: 0.21) | Nurture professional workforce (W: 0.31) | Technology convergence workforce education | (W: 0.61) | 0.0397 | 9 | |
| Regional networked innovative workforce | (W: 0.39) | 0.0254 | 14 | |||
| Creation of industrial ecosystems (W: 0.69) | Strengthening public–private and private–private partnerships | (W: 0.68) | 0.0985 | 2 | ||
| Support for overseas export of innovative products | (W: 0.32) | 0.0464 | 7 | |||
Reference note: W: weight.
Table 12.
Basic statistics.
| Year | Category | Minimum | Maximum | Mean | SD |
|---|---|---|---|---|---|
| 2019 | Capital (KRW million) | 567 | 148,768 | 11,309.50 | 24,912.63 |
| Number of employees (people) | 1 | 268 | 54.95 | 71.50 | |
| Assets (KRW million) | 832 | 235,774 | 18,564.68 | 40,117.95 | |
| Sales (KRW million) | 122 | 94,172 | 12,770.98 | 18,872.19 | |
| Operating income (KRW million) | −6521 | 5985 | 78.50 | 1759.19 | |
| Net income (KRW million) | −29,524 | 5758 | −1000.20 | 5231.20 | |
| 2020 | Capital (KRW million) | 637 | 173,417 | 11,933.95 | 28,302.18 |
| Number of employees (people) | 1 | 285 | 62.60 | 75.56 | |
| Assets (KRW million) | 951 | 251,398 | 20,486.45 | 41,861.79 | |
| Sales (KRW million) | 77 | 91,237 | 15,187.32 | 21,907.16 | |
| Operating income (KRW million) | −6499 | 6576 | 446.50 | 2150.39 | |
| Net income (KRW million) | −17,139 | 7256 | 55.90 | 3405.35 | |
| 2021 | Capital (KRW million) | 699 | 200,921 | 15,099.75 | 33,297.94 |
| Number of employees (people) | 6 | 375 | 76.50 | 86.58 | |
| Assets (KRW million) | 1054 | 260,651 | 23,762.50 | 45,064.57 | |
| Sales (KRW million) | 63 | 82,219 | 14,994.60 | 20,483.75 | |
| Operating income (KRW million) | −7488 | 25,486 | 968.87 | 4582.89 | |
| Net income (KRW million) | −9418 | 19,066 | 810.40 | 4029.82 |
Table 13.
CCR analysis results.
| DMU | 2019 | 2020 | 2021 |
|---|---|---|---|
| 1 | 0.4782 | 0.6321 | 0.6951 |
| 2 | 1 | 1 | 1 |
| 3 | 1 | 1 | 1 |
| 4 | 1 | 1 | 1 |
| 5 | 0.6852 | 1 | 0.9785 |
| 6 | 1 | 1 | 0.9213 |
| 7 | 1 | 1 | 0.9921 |
| 8 | 1 | 1 | 1 |
| 9 | 0.8212 | 0.8631 | 0.8323 |
| 10 | 0.5733 | 0.5752 | 0.6845 |
| 11 | 0.632 | 0.4302 | 1 |
| 12 | 0.7732 | 0.9561 | 0.9429 |
| 13 | 1 | 0.9212 | 0.9124 |
| 14 | 0.8633 | 0.6752 | 0.3829 |
| 15 | 0.4469 | 0.4932 | 0.2764 |
| 16 | 0.8424 | 1 | 1 |
| 17 | 0.8358 | 0.6621 | 0.6348 |
| 18 | 0.8902 | 0.9631 | 1 |
| 19 | 0.6128 | 1 | 1 |
| 20 | 0.6332 | 0.4921 | 0.9212 |
| 21 | 0.9562 | 0.9102 | 0.9212 |
| 22 | 0.7632 | 0.7921 | 1 |
| 23 | 0.8236 | 0.6982 | 0.7823 |
| 24 | 0.9563 | 0.6933 | 0.6952 |
| 25 | 0.921 | 0.9215 | 1 |
| 26 | 0.3452 | 0.5231 | 0.6218 |
| 27 | 0.6213 | 0.5212 | 0.1625 |
| 28 | 0.5852 | 0.9612 | 0.5289 |
| 29 | 0.5775 | 0.6907 | 0.6619 |
| 30 | 1 | 0.584 | 0.7113 |
| 31 | 1 | 1 | 0.9932 |
| 32 | 0.5992 | 0.5551 | 0.6212 |
| 33 | 0.6132 | 0.4822 | 0.4232 |
| 34 | 0.6333 | 0.5212 | 0.3921 |
| 35 | 1 | 0.9212 | 0.8218 |
| 36 | 0.5236 | 0.4921 | 0.4922 |
| 37 | 0.792 | 1 | 1 |
| 38 | 0.5632 | 0.6341 | 0.7521 |
| Average | 0.7727 | 0.7780 | 0.7830 |
Table 14.
BCC analysis results.
| Category | 2019 | 2020 | 2021 | Average |
|---|---|---|---|---|
| TE | 0.7843 | 0.7932 | 0.853 | 0.8102 |
| PTE | 0.8671 | 0.8522 | 0.8732 | 0.8642 |
| SE | 0.8782 | 0.9135 | 0.9301 | 0.9073 |
| N | 38 | 38 | 38 | 38 |
TE: technical efficiency; PTE: pure technical efficiency; SE: scale efficiency; N: total number of DMUs
Table 15.
Analysis of return to scale.
| Category | 2019 | 2020 | 2021 | Sum |
|---|---|---|---|---|
| CRS | 9 | 11 | 11 | 31 (27.19%) |
| DRS | 11 | 10 | 12 | 33 (28.94%) |
| IRS | 18 | 17 | 15 | 50 (43.87%) |
| N | 38 | 38 | 38 | 114 (100%) |
CRS: constant returns to scale; DRS: decreasing return to scale; IRS: increasing return to scale; N: total number of DMUs.
Table 16.
Malmquist productivity index change rate.
| Time Series | TECI | TCI | PECI | SECI | MPI |
|---|---|---|---|---|---|
| T2 | 0.9893 | 1.0555 | 0.9526 | 1.0386 | 1.0442 |
| T3 | 0.9538 | 0.9482 | 0.9339 | 1.0213 | 0.9044 |
| Geometric mean | 0.9714 | 1.0004 | 0.9432 | 1.0299 | 0.9718 |
TECI: technical efficiency change index; TCI: technological change index; PECI: pure efficiency change index; SECI: scale efficiency change index; MPI: malmquist productivity index; T2: the period from 2018 to 2019; T3: The period from 2019 to 2020.
Disclaimer/Publisher’s Note: The statements, opinions and data contained in all publications are solely those of the individual author(s) and contributor(s) and not of MDPI and/or the editor(s). MDPI and/or the editor(s) disclaim responsibility for any injury to people or property resulting from any ideas, methods, instructions or products referred to in the content. |
© 2024 by the author. Licensee MDPI, Basel, Switzerland. This article is an open access article distributed under the terms and conditions of the Creative Commons Attribution (CC BY) license (https://creativecommons.org/licenses/by/4.0/).
Share and Cite
MDPI and ACS Style
Kim, J. The Evaluation and Significance of Smart City Projects in Korea: Targeting Enterprises within the Smart City Association Convergence Alliance. Sustainability 2024, 16, 2697. https://doi.org/10.3390/su16072697
AMA Style
Kim J. The Evaluation and Significance of Smart City Projects in Korea: Targeting Enterprises within the Smart City Association Convergence Alliance. Sustainability. 2024; 16(7):2697. https://doi.org/10.3390/su16072697
Chicago/Turabian StyleKim, Jaehwan. 2024. "The Evaluation and Significance of Smart City Projects in Korea: Targeting Enterprises within the Smart City Association Convergence Alliance" Sustainability 16, no. 7: 2697. https://doi.org/10.3390/su16072697
Note that from the first issue of 2016, this journal uses article numbers instead of page numbers. See further details here.